SUPPORTING INFORMATION APPENDIX Inventory …...SUPPORTING INFORMATION APPENDIX Inventory of...
35
SUPPORTING INFORMATION APPENDIX Inventory of Supporting Documents: Supporting Figures • Fig S1. Tmem119 expression in CNS myeloid cells, related to Fig 1. • Fig S2. Tmem119 immunoreactivity in CNS & peripheral tissues, related to Fig 2. • Fig S3. Tmem119 is a developmentally regulated but stable microglia marker, related to Fig 3. • Fig S4. Developmental microglia RNAseq purity, quality, and population characteristics, related to Fig 4. • Fig S5. Developmental differences in microglial gene expression, related to Fig 5. Supporting Figure Legends Supporting Tables • Table S1. Top 100 differential expressed genes during development, related to Fig 5. • Table S2. Top 100 enriched >16-fold between microglia and non-microglia CNS myeloid cells, related to Fig 5. • Table S3. Microglia-enriched gene cassette, related to Fig 5. • Table S4. Top LPS-regulated genes, related to Fig 5. • Table S5. Microglia-enriched receptors, ligands, and transporters, related to Fig 5. • Table S6. Disease-associated genes that are microglia enriched, related to Fig 5. • Table S7. Transcription factors and regulators enriched in microglia, related to Fig 5. • Table S8. Platelet- and microglia-enriched genes, related to Fig 5. Supporting Table Legends Supporting Experimental Procedures Supporting References Not included: Supporting Dataset.
Transcript of SUPPORTING INFORMATION APPENDIX Inventory …...SUPPORTING INFORMATION APPENDIX Inventory of...
SUPPORTING INFORMATION APPENDIX
Inventory of Supporting Documents:
Supporting Figures
• Fig S1. Tmem119 expression in CNS myeloid cells, related to Fig 1.
• Fig S2. Tmem119 immunoreactivity in CNS & peripheral tissues, related to Fig 2.
• Fig S3. Tmem119 is a developmentally regulated but stable microglia marker, related to Fig 3.
• Fig S4. Developmental microglia RNAseq purity, quality, and population characteristics, related to
Fig 4.
• Fig S5. Developmental differences in microglial gene expression, related to Fig 5.
Supporting Figure Legends
Supporting Tables
• Table S1. Top 100 differential expressed genes during development, related to Fig 5.
• Table S2. Top 100 enriched >16-fold between microglia and non-microglia CNS myeloid cells,
related to Fig 5.
• Table S3. Microglia-enriched gene cassette, related to Fig 5.
• Table S4. Top LPS-regulated genes, related to Fig 5.
• Table S5. Microglia-enriched receptors, ligands, and transporters, related to Fig 5.
• Table S6. Disease-associated genes that are microglia enriched, related to Fig 5.
• Table S7. Transcription factors and regulators enriched in microglia, related to Fig 5.
• Table S8. Platelet- and microglia-enriched genes, related to Fig 5.
Supporting Table Legends
Supporting Experimental Procedures
Supporting References
Not included: Supporting Dataset.
A BWholeGene D Gene Name CD45+ Cortex
Tmem119 transmembrane protein 119 14,268 1,060Fcrls Fc receptor-like S, scavenger
receptor, Msr215,457 1,130
P2ry12 purinergic receptor P2Y, G-protein coupled 12
13,384 3,975
P2ry13 purinergic receptor P2Y, G-protein coupled 13
12,905 1,286
Il1a interleukin 1 alpha 6,773 2,494Gpr34 G protein-coupled receptor 34 6,432 1,401Gpr84 G protein-coupled receptor 84 2,343 419
WholeGene D Gene Name CD45+ Cortex
Ptprc Protein tyrosine phosphatase, receptor type, C
931 69
Itgam integrin alpha M 1,401 330Cx3cr1 chemokine (C-X3-C) receptor 1 17,952 6,217Aif1 allograft inflammatory factor 1 2,633 1,838Emr1 EGF-like module containing, mucin-
like, hormone receptor sequence 17,864 588
C1qa complement component 1, q subcomponent, alpha polypeptide
17,111 9,314
Candidates
Common Microglia Markers
FIGURE S1.
Tmem119 C1q Tmem119 C1q DAPI
Hip
poca
mpu
s
Cx3cr1 DAPIDC Tmem119 Tmem119 Cx3cr1 DAPI
Stria
tum
Cho
roid
Ple
xus
Cor
tex
P2ry12 DAPIFcrls DAPI
Men
inge
s
Cor
tex
Fcrls DAPIE F
KO
Spi
nal C
ord
Tmem119 Iba1 DAPIIba1Tmem119
WT
Spi
nal C
ord
Hip
poca
mpu
s
Cho
roid
Ple
xus
Tmem119 DAPI Cx3cr1-GFP Tmem119 Cx3cr1-GFP
Iba1
Tmem
119
Tmem
119
Iba1
DA
PI
Meninges
Tmem119 Iba1 P0 Tmem119 Iba1 P0 Tmem119 Iba1 DAPI
Tmem119 Cx3cr1-GFP DAPITmem119 Cx3cr1-GFP
Dor
sal R
oot E
ntry
Zon
eS
ciat
ic N
erve
Cru
sh
Tmem119 Iba1 Tmem119 Iba1 DAPI
Dor
sal R
oot E
ntry
Zon
eFIGURE S2.
Extracellular
Intracellular
Immunogens
GST
Tmem119
MBP
C
N
A
D
E
H
B
C
F G
Tmem119 (FITC)104103-103 0
Tissue Tx Antibody
Spleen PBS IsotypeSpleen LPS Tmem119Spleen PBS Tmem119Thymus LPS IsotypeThymus PBS IsotypeThymus LPS Tmem119Thymus PBS Tmem119Liver LPS Tmem119Liver PBS Tmem119Brain LPS Tmem119Brain PBS Tmem119
Spleen LPS Isotype
Cou
nt (5
0k li
ve c
ells
)
I0.91 0.077
5.8293.2
1041030
103
104
102
102
101
101
0
CD11b-PE
Tmem
119-
FTIC
Whole RBC-lysed Blood
P3
corte
x
Tmem119 Iba1Tmem119 Iba1
DAPIA
P15
cor
tex
P19
cor
tex
B
FIGURE S3.
0
0.5
1
1.5
2
2.5
3
3.5
PBS LPS Iba1
+ su
rface
are
a(r
elat
ive
to P
BS
)
*
F Donor cellsIba1Tmem119Tmem119 Donor Cells
Iba1
Orthogonal view
YZ
XZ
Tmem119 Donor Cells G
xx
x x
x
xx
x
*x
xx x
x
xx
x
*x
xx x
x
xx
x
*x
xx x
x
xx
x
*x
xx x
x
xx
x
*
Tmem119 CCR2-RFP Iba1 T/I/DAPI T/C/DAPI T/C/I/DAPI
C
D
E
xx
x x
x
xx
x
*
DAPI
Tmem119 CCR2 T/C/DAPI
Cx3cr1
Per
cent
ile
100
60
20
1296 14
6
Chiu P65 MGBruttger MG
SZ MG/MPP60 MGP21 MGLPS MGP60 MY
Lavin MOLavin MGGosselin BMDMGosselin MG
Tmem119
1118
0.67
Per
cent
ile
100
60
20 2.3 5.
0
Tnf
0.5
548
Il1b
Nfkb2
Per
cent
ile
100
60
20 2.5 0.47
Ier2
79 108
Icam1
Per
cent
ile
100
60
20
37.9
4.6
Nos2
0 0.05
*
**
**
^ * ** * *^
*
** *
* *
* *^**
*
Gen
es
4
0
-4
2
-2Row
(Gen
e FP
KM
) Z-s
core
Whole Brain Microglia
P14
P60
P21
E17P
7
P14
TM
+P
60 T
M+
P21
TM
+
E17
TM
-P
7 TM
-
SZ
CD
45+
P7
TM+
LPS
TM
+
TM- Myeloid
P60
P21
E17
Brain Liver
E17P
7
1.0
0.00.20.40.60.8
Hei
ght
* ** *
AAldh1l1Aqp4GfapSlc1a3Cldn5Pecam1Tmem119Aif1C1qaCsf1rCx3cr1ItgamPtprcTrem2Eno2Npas4NpyCnpMbpMogGalc
E17
TM
-P
7 TM
+P
7 TM
-P
14 T
M+
P21
TM
+P
60 T
M+
LPS
TM
+E
17 T
M-
P21
TM
-P
60 T
M-
E17 P7
P14
P21
P60
Whole BrainMicroglia TM- Myeloid
Ast
roE
ndo
Mye
loid
Lin
eage
Neu
ron
Olig
o
Log2
(FP
KM
)
< -2
0
2
4
6
8
>10
C
B
D
P7
Live
r “M
yelo
id”
E17
Bra
in “M
yelo
id”
E17
Liv
er “M
yelo
id” N
eutro
phil
P60
Bra
in “M
yelo
id”
P21
Bra
in “M
yelo
id”
Pla
tele
tP
21 T
M+
Mic
rogl
iaM
icro
glia
Lg.In
test
ine
Sm
.Inte
stin
eS
plee
nK
upffe
rP
erito
neum
Mon
ocyt
eLu
ng
0.0
0.2
0.4
0.6
0.8
1.0
Cluster dendrogram with estimated p-values (%)
Hei
ght
10099 99
1009980
87
91 7343 58
95 99
97au = approximately unbiased p-value
Distance: correlationCluster method: complete
FIGURE S4.
4.0
E
B
Chemokine signalingcAMP-mediated signaling
TLR signalingp38 MAPK signaling
ERK5 signalingCholecyskinin/gastrin-
mediated signalingERK/MAPK signalingLXR/RXR activation
Acute phase responsesignaling
HGF signalingApoptosis signaling
VEGF signalingRole of PRRs in recognizing
bacteria, virusesGαi signaling
VDR/RXR activation
-log(pvalue)3.01.50.0
Ratio0.20.0 0.1
up with LPSdown with LPS
*bar darkened with z-score
ratio
Adult MG: Naїve v LPS
Adult-E17
32 63 10412
9034133
Adult-LPS
LPS-E17
DFigure S5.
5.0
0.4
-log(pvalue)2.50.0
Ratio0.0 0.20
LXR/RXR ActivationLeukocyte extravasation
signalingExtrinsic prothrombin
activation pathwayIntegrin signaling
Reg. of cellular mechanicsby calpain proteases
IL-8 signaling
Tec kinase signalingVDR/RXR activationCoagulation system
Trem1 signalingPPAR signalingCdc42 signaling
Ca2+ induced T cellapoptosis
Actin nucleation byARP-WASP complex
Glioma invasivenesssignaling
Microglia v CNS Myeloid
up in MGdown in MG
*bar darkened with z-score
ratio
C
Tmem119Adora3Cx3cr1FcrlsIl1a(Itgam)Ltc4sOlfml3P2ry12P2ry13SelplgAdrb2Bin1Dies1Enpp2Gp9Lpcat2MafbP3h2PdgfbPtafr1ThrspTxnipUpk1bFabp7Igf1S100a8S100a9Stfa3
P7
TM-
P60
TM
+
3
0
-3
2
1
-2
-1 Row
(Gen
e dC
T) Z
-Sco
re
P60
P10
LivE17
TM
-
P10
TM
-
P14
TM
+
P21
TM
+
P60
TM
+LP
S E
17
P21
P60
P7
TM+
P10
TM
+
P7
P10
E17
P10
E17 P7
P14
P21
MICROGLIA TM- MYELOIDCELLS
WHOLE ORGAN
Brain BrainLivM
icro
glia
-enr
iche
dU
p in
adu
ltU
p in
you
ng
* * * ** * **
** “
* “** *“* * ** * * ** * **
* ** * * ** * ** * * ““* * * * *** *** * * ** * “* * * ** * * ** ““
**
*
++ ++ + +- --+““ “not
detected
F
E17
TM
-
P7
TM-
P10
TM
-
P14
TM
+
P21
TM
+
P60
TM
+
P60
TM
+LP
S E
17
P21
P60
P7
TM+
P10
TM
+
P7
P10
E17
P10
E17 P7
P14
P21
P60
P10
MICROGLIA TM- MYELOIDCELLS
WHOLE ORGAN
Brain BrainLiv Liv
Arg1Ccl2Cd68Cd86H2-D1Icam1Il1bIl6MarcoMsr1Saa3Tnfa
*-- - - - - -
* ^^^ ^“ ““““ “““
“^-^“ “
“
“ ““““ “ “^
eNOS signalingPDGF signaling
Chemokine signaling
A-log(pvalue)
Igf-1 signalingRole of NFAT in reg.
immune responseRac signaling
Apoptosis signalingPPARα/RXRα activation
TLR signalingCell cycle: G1/S checkpoint
reg.Reg.of eiF4, p70S6K signaling
ATM signalingGranzyme B signaling
ERK5 signalingEstrogen-mediated S-phase
entryLymphotoxin β receptor
signalingHMGB1 signaling
Gα12/13 signalingTREM1 signaling
Wnt/β-catening signalingMouse embryonic stem cell
pluripotencyLPS-simulated MAPK signaling
Cyclins, cell cycle regulation
2.00.0
0.30.20.0 0.1
E17 to Adult Microglia
up with agedown with age
*bar darkened with z-score
ratio
Ratio
G Selplg DAPI
P60
Cor
tex
H Tmem119 DAPI
E17
Cor
tex
Supporting Figure Legends
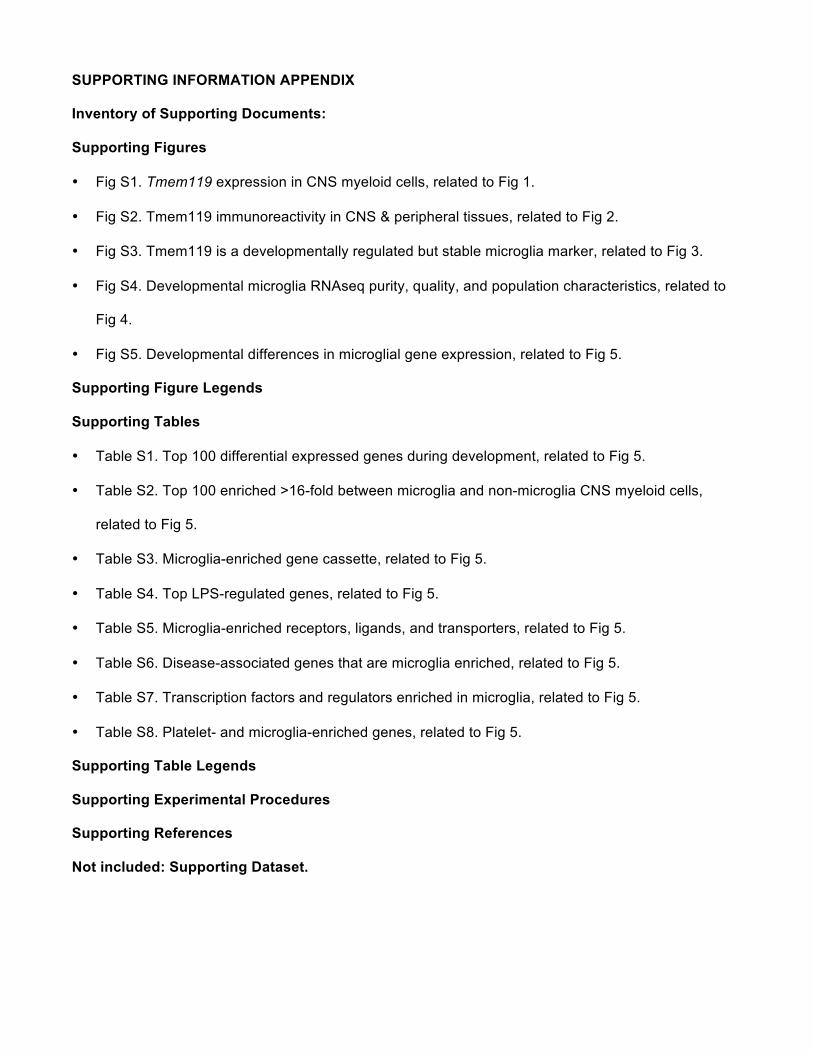
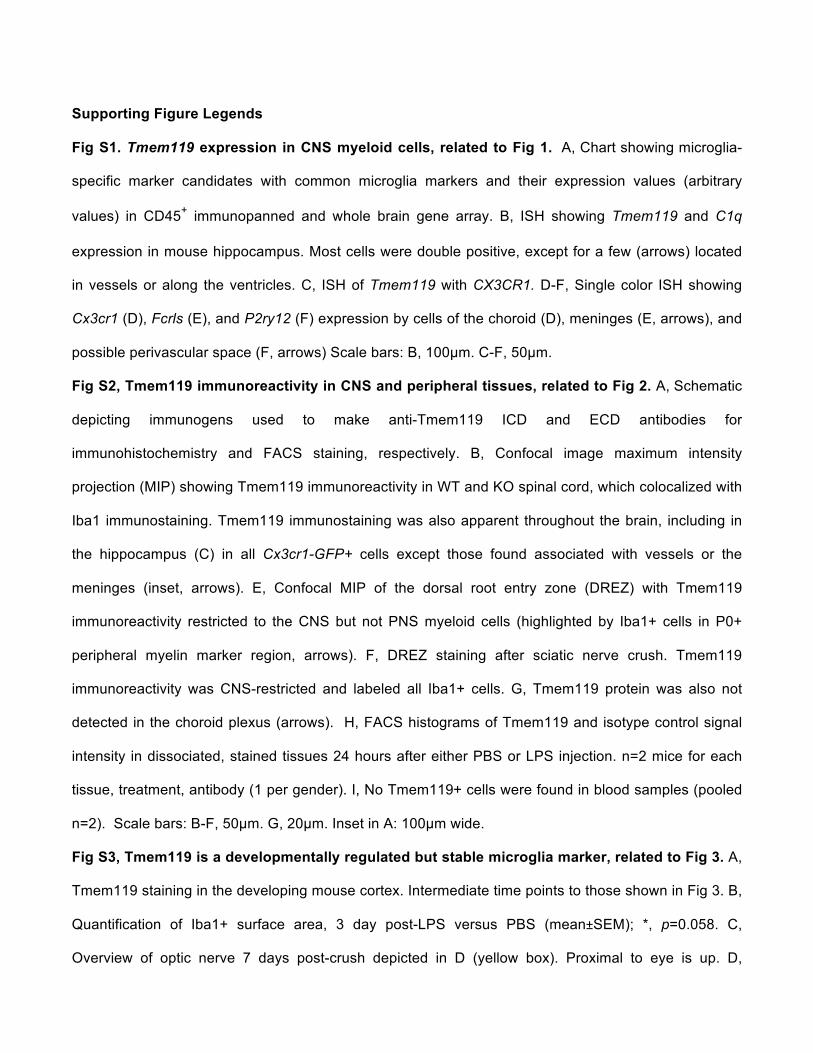
Fig S1. Tmem119 expression in CNS myeloid cells, related to Fig 1. A, Chart showing microglia-
specific marker candidates with common microglia markers and their expression values (arbitrary
values) in CD45+ immunopanned and whole brain gene array. B, ISH showing Tmem119 and C1q
expression in mouse hippocampus. Most cells were double positive, except for a few (arrows) located
in vessels or along the ventricles. C, ISH of Tmem119 with CX3CR1. D-F, Single color ISH showing
Cx3cr1 (D), Fcrls (E), and P2ry12 (F) expression by cells of the choroid (D), meninges (E, arrows), and
possible perivascular space (F, arrows) Scale bars: B, 100µm. C-F, 50µm.
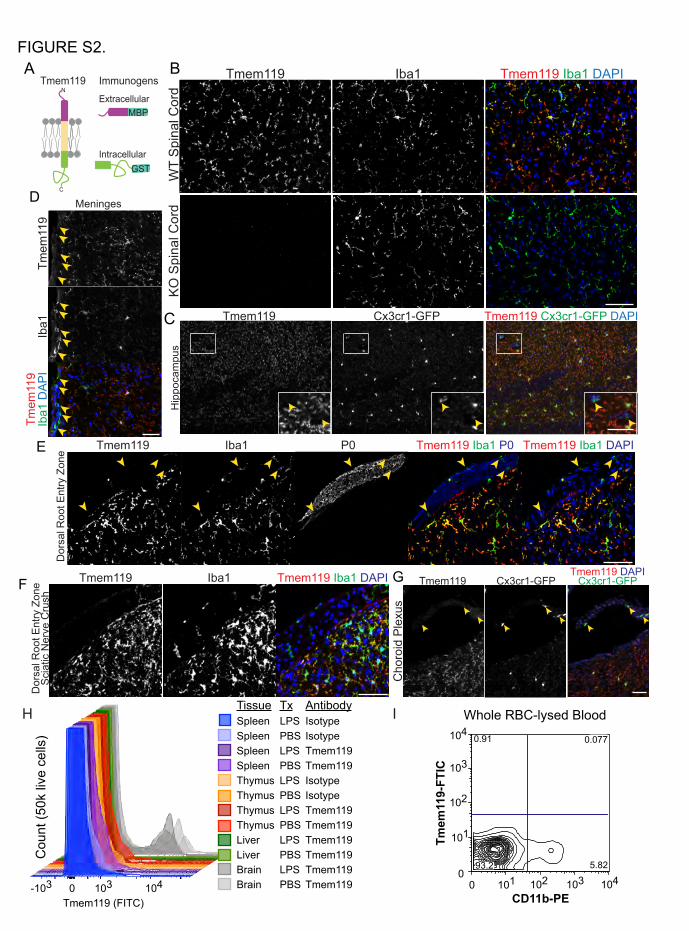
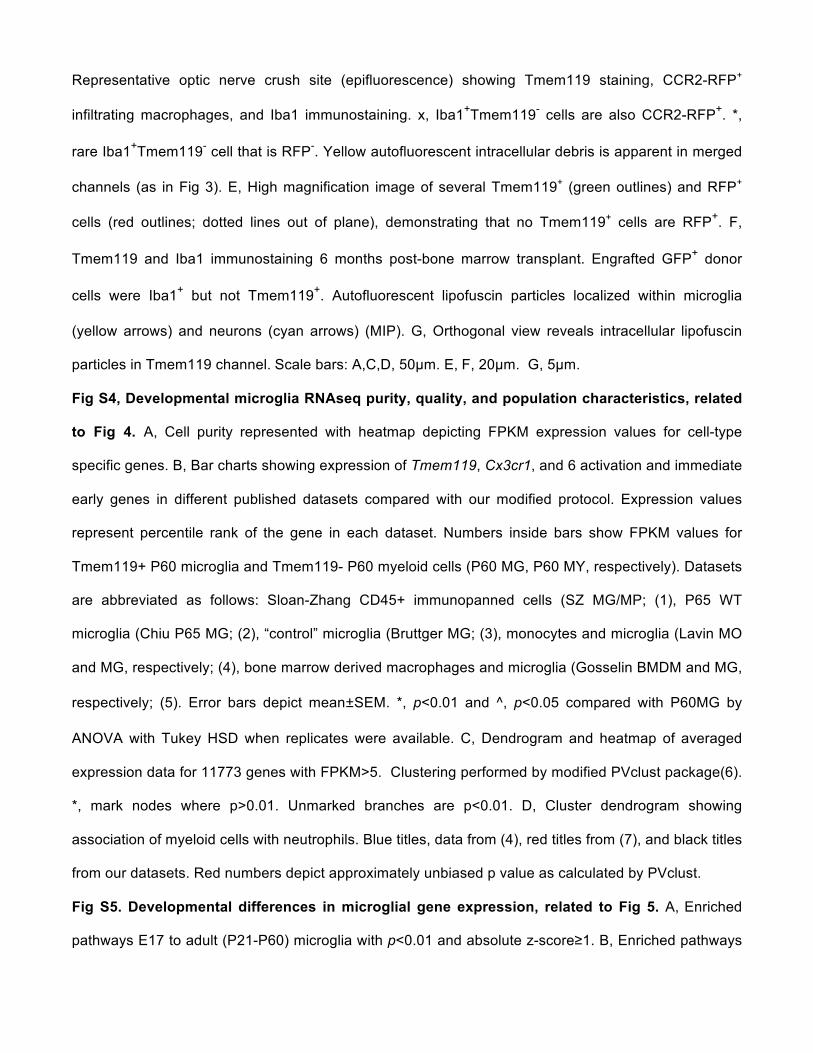
Fig S2, Tmem119 immunoreactivity in CNS and peripheral tissues, related to Fig 2. A, Schematic
depicting immunogens used to make anti-Tmem119 ICD and ECD antibodies for
immunohistochemistry and FACS staining, respectively. B, Confocal image maximum intensity
projection (MIP) showing Tmem119 immunoreactivity in WT and KO spinal cord, which colocalized with
Iba1 immunostaining. Tmem119 immunostaining was also apparent throughout the brain, including in
the hippocampus (C) in all Cx3cr1-GFP+ cells except those found associated with vessels or the
meninges (inset, arrows). E, Confocal MIP of the dorsal root entry zone (DREZ) with Tmem119
immunoreactivity restricted to the CNS but not PNS myeloid cells (highlighted by Iba1+ cells in P0+
peripheral myelin marker region, arrows). F, DREZ staining after sciatic nerve crush. Tmem119
immunoreactivity was CNS-restricted and labeled all Iba1+ cells. G, Tmem119 protein was also not
detected in the choroid plexus (arrows). H, FACS histograms of Tmem119 and isotype control signal
intensity in dissociated, stained tissues 24 hours after either PBS or LPS injection. n=2 mice for each
tissue, treatment, antibody (1 per gender). I, No Tmem119+ cells were found in blood samples (pooled
n=2). Scale bars: B-F, 50µm. G, 20µm. Inset in A: 100µm wide.
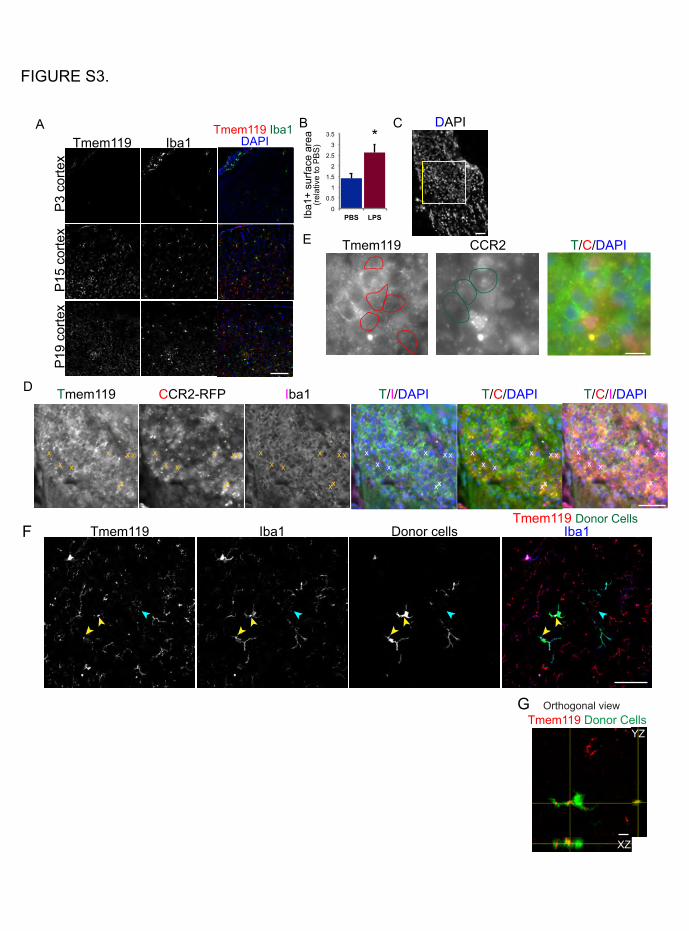
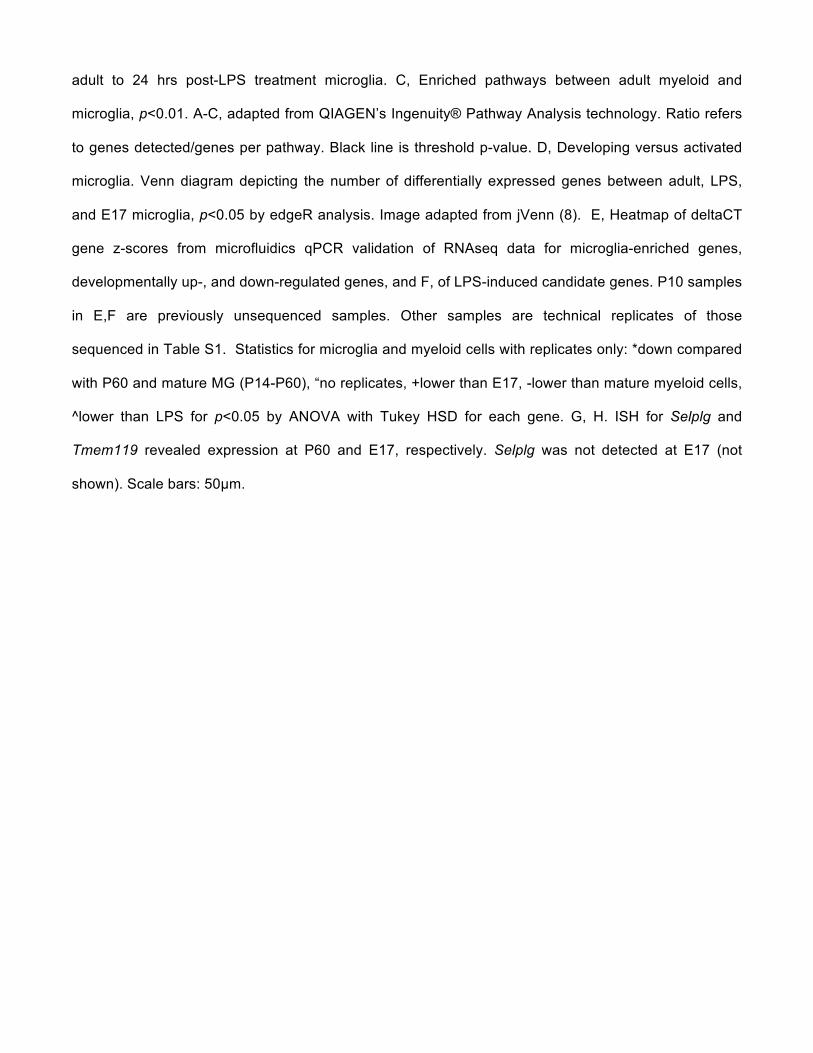
Fig S3, Tmem119 is a developmentally regulated but stable microglia marker, related to Fig 3. A,
Tmem119 staining in the developing mouse cortex. Intermediate time points to those shown in Fig 3. B,
Quantification of Iba1+ surface area, 3 day post-LPS versus PBS (mean±SEM); *, p=0.058. C,
Overview of optic nerve 7 days post-crush depicted in D (yellow box). Proximal to eye is up. D,
Representative optic nerve crush site (epifluorescence) showing Tmem119 staining, CCR2-RFP+
infiltrating macrophages, and Iba1 immunostaining. x, Iba1+Tmem119- cells are also CCR2-RFP+. *,
rare Iba1+Tmem119- cell that is RFP-. Yellow autofluorescent intracellular debris is apparent in merged
channels (as in Fig 3). E, High magnification image of several Tmem119+ (green outlines) and RFP+
cells (red outlines; dotted lines out of plane), demonstrating that no Tmem119+ cells are RFP+. F,
Tmem119 and Iba1 immunostaining 6 months post-bone marrow transplant. Engrafted GFP+ donor
cells were Iba1+ but not Tmem119+. Autofluorescent lipofuscin particles localized within microglia
(yellow arrows) and neurons (cyan arrows) (MIP). G, Orthogonal view reveals intracellular lipofuscin
particles in Tmem119 channel. Scale bars: A,C,D, 50µm. E, F, 20µm. G, 5µm.
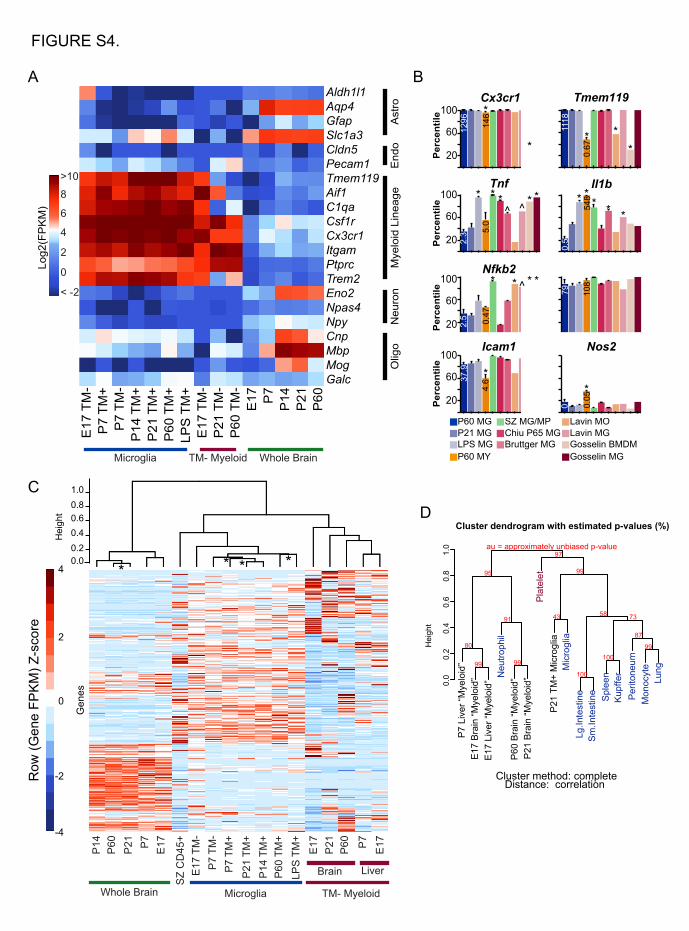
Fig S4, Developmental microglia RNAseq purity, quality, and population characteristics, related
to Fig 4. A, Cell purity represented with heatmap depicting FPKM expression values for cell-type
specific genes. B, Bar charts showing expression of Tmem119, Cx3cr1, and 6 activation and immediate
early genes in different published datasets compared with our modified protocol. Expression values
represent percentile rank of the gene in each dataset. Numbers inside bars show FPKM values for
Tmem119+ P60 microglia and Tmem119- P60 myeloid cells (P60 MG, P60 MY, respectively). Datasets
are abbreviated as follows: Sloan-Zhang CD45+ immunopanned cells (SZ MG/MP; (1), P65 WT
microglia (Chiu P65 MG; (2), “control” microglia (Bruttger MG; (3), monocytes and microglia (Lavin MO
and MG, respectively; (4), bone marrow derived macrophages and microglia (Gosselin BMDM and MG,
respectively; (5). Error bars depict mean±SEM. *, p<0.01 and ^, p<0.05 compared with P60MG by
ANOVA with Tukey HSD when replicates were available. C, Dendrogram and heatmap of averaged
expression data for 11773 genes with FPKM>5. Clustering performed by modified PVclust package(6).
*, mark nodes where p>0.01. Unmarked branches are p<0.01. D, Cluster dendrogram showing
association of myeloid cells with neutrophils. Blue titles, data from (4), red titles from (7), and black titles
from our datasets. Red numbers depict approximately unbiased p value as calculated by PVclust.
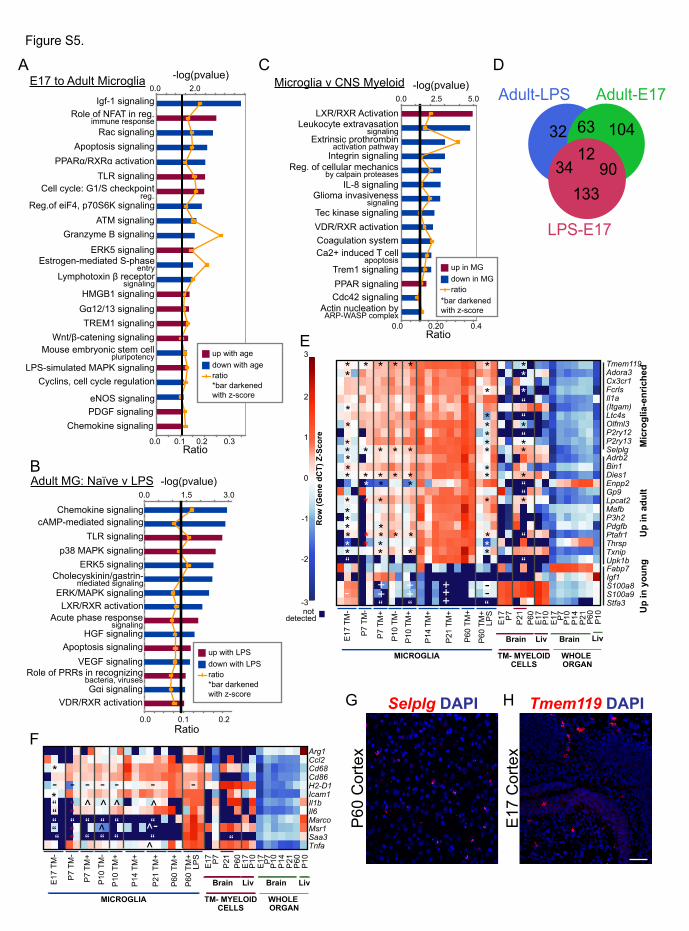
Fig S5. Developmental differences in microglial gene expression, related to Fig 5. A, Enriched
pathways E17 to adult (P21-P60) microglia with p<0.01 and absolute z-score≥1. B, Enriched pathways
adult to 24 hrs post-LPS treatment microglia. C, Enriched pathways between adult myeloid and
microglia, p<0.01. A-C, adapted from QIAGEN’s Ingenuity® Pathway Analysis technology. Ratio refers
to genes detected/genes per pathway. Black line is threshold p-value. D, Developing versus activated
microglia. Venn diagram depicting the number of differentially expressed genes between adult, LPS,
and E17 microglia, p<0.05 by edgeR analysis. Image adapted from jVenn (8). E, Heatmap of deltaCT
gene z-scores from microfluidics qPCR validation of RNAseq data for microglia-enriched genes,
developmentally up-, and down-regulated genes, and F, of LPS-induced candidate genes. P10 samples
in E,F are previously unsequenced samples. Other samples are technical replicates of those
sequenced in Table S1. Statistics for microglia and myeloid cells with replicates only: *down compared
with P60 and mature MG (P14-P60), “no replicates, +lower than E17, -lower than mature myeloid cells,
^lower than LPS for p<0.05 by ANOVA with Tukey HSD for each gene. G, H. ISH for Selplg and
Tmem119 revealed expression at P60 and E17, respectively. Selplg was not detected at E17 (not
shown). Scale bars: 50µm.
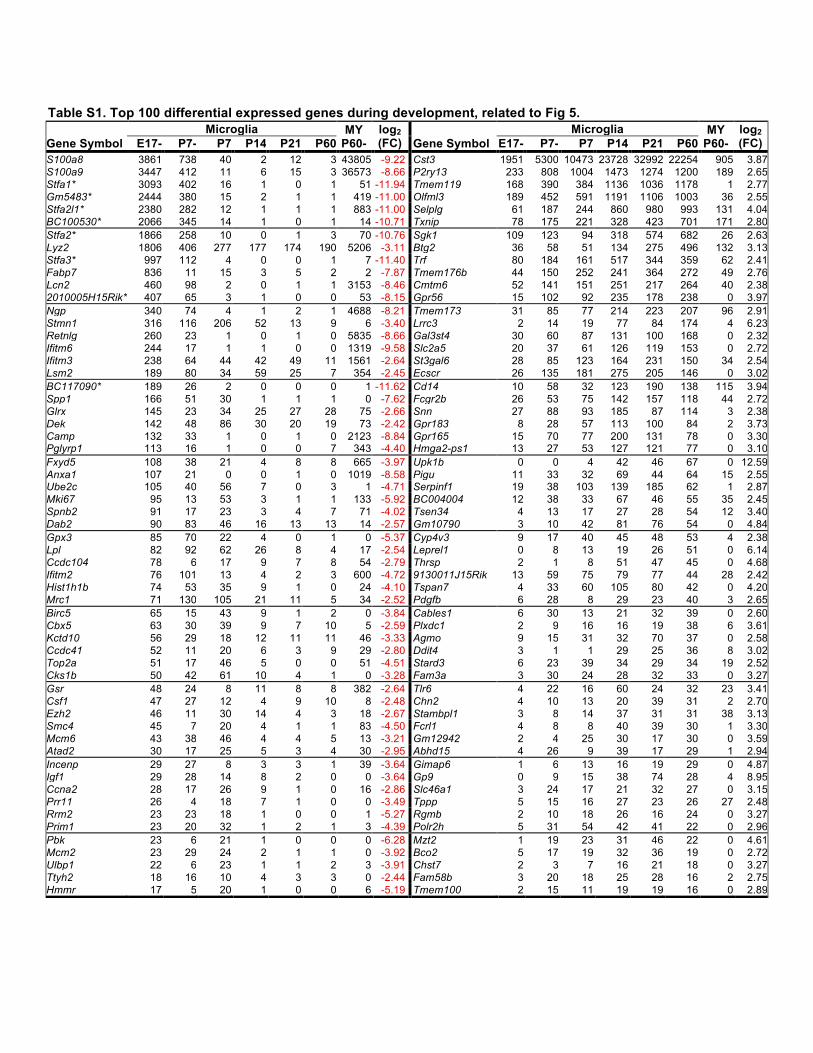
Table S1. Top 100 differential expressed genes during development, related to Fig 5.
Microglia MY P60-
log2 (FC)
Microglia MY P60-
log2 (FC) Gene Symbol E17- P7- P7 P14 P21 P60 Gene Symbol E17- P7- P7 P14 P21 P60
S100a8 3861 738 40 2 12 3 43805 -9.22 Cst3 1951 5300 10473 23728 32992 22254 905 3.87 S100a9 3447 412 11 6 15 3 36573 -8.66 P2ry13 233 808 1004 1473 1274 1200 189 2.65 Stfa1* 3093 402 16 1 0 1 51 -11.94 Tmem119 168 390 384 1136 1036 1178 1 2.77 Gm5483* 2444 380 15 2 1 1 419 -11.00 Olfml3 189 452 591 1191 1106 1003 36 2.55 Stfa2l1* 2380 282 12 1 1 1 883 -11.00 Selplg 61 187 244 860 980 993 131 4.04 BC100530* 2066 345 14 1 0 1 14 -10.71 Txnip 78 175 221 328 423 701 171 2.80 Stfa2* 1866 258 10 0 1 3 70 -10.76 Sgk1 109 123 94 318 574 682 26 2.63 Lyz2 1806 406 277 177 174 190 5206 -3.11 Btg2 36 58 51 134 275 496 132 3.13 Stfa3* 997 112 4 0 0 1 7 -11.40 Trf 80 184 161 517 344 359 62 2.41 Fabp7 836 11 15 3 5 2 2 -7.87 Tmem176b 44 150 252 241 364 272 49 2.76 Lcn2 460 98 2 0 1 1 3153 -8.46 Cmtm6 52 141 151 251 217 264 40 2.38 2010005H15Rik* 407 65 3 1 0 0 53 -8.15 Gpr56 15 102 92 235 178 238 0 3.97 Ngp 340 74 4 1 2 1 4688 -8.21 Tmem173 31 85 77 214 223 207 96 2.91 Stmn1 316 116 206 52 13 9 6 -3.40 Lrrc3 2 14 19 77 84 174 4 6.23 Retnlg 260 23 1 0 1 0 5835 -8.66 Gal3st4 30 60 87 131 100 168 0 2.32 Ifitm6 244 17 1 1 0 0 1319 -9.58 Slc2a5 20 37 61 126 119 153 0 2.72 Ifitm3 238 64 44 42 49 11 1561 -2.64 St3gal6 28 85 123 164 231 150 34 2.54 Lsm2 189 80 34 59 25 7 354 -2.45 Ecscr 26 135 181 275 205 146 0 3.02 BC117090* 189 26 2 0 0 0 1 -11.62 Cd14 10 58 32 123 190 138 115 3.94 Spp1 166 51 30 1 1 1 0 -7.62 Fcgr2b 26 53 75 142 157 118 44 2.72 Glrx 145 23 34 25 27 28 75 -2.66 Snn 27 88 93 185 87 114 3 2.38 Dek 142 48 86 30 20 19 73 -2.42 Gpr183 8 28 57 113 100 84 2 3.73 Camp 132 33 1 0 1 0 2123 -8.84 Gpr165 15 70 77 200 131 78 0 3.30 Pglyrp1 113 16 1 0 0 7 343 -4.40 Hmga2-ps1 13 27 53 127 121 77 0 3.10 Fxyd5 108 38 21 4 8 8 665 -3.97 Upk1b 0 0 4 42 46 67 0 12.59 Anxa1 107 21 0 0 1 0 1019 -8.58 Pigu 11 33 32 69 44 64 15 2.55 Ube2c 105 40 56 7 0 3 1 -4.71 Serpinf1 19 38 103 139 185 62 1 2.87 Mki67 95 13 53 3 1 1 133 -5.92 BC004004 12 38 33 67 46 55 35 2.45 Spnb2 91 17 23 3 4 7 71 -4.02 Tsen34 4 13 17 27 28 54 12 3.40 Dab2 90 83 46 16 13 13 14 -2.57 Gm10790 3 10 42 81 76 54 0 4.84 Gpx3 85 70 22 4 0 1 0 -5.37 Cyp4v3 9 17 40 45 48 53 4 2.38 Lpl 82 92 62 26 8 4 17 -2.54 Leprel1 0 8 13 19 26 51 0 6.14 Ccdc104 78 6 17 9 7 8 54 -2.79 Thrsp 2 1 8 51 47 45 0 4.68 Ifitm2 76 101 13 4 2 3 600 -4.72 9130011J15Rik 13 59 75 79 77 44 28 2.42 Hist1h1b 74 53 35 9 1 0 24 -4.10 Tspan7 4 33 60 105 80 42 0 4.20 Mrc1 71 130 105 21 11 5 34 -2.52 Pdgfb 6 28 8 29 23 40 3 2.65 Birc5 65 15 43 9 1 2 0 -3.84 Cables1 6 30 13 21 32 39 0 2.60 Cbx5 63 30 39 9 7 10 5 -2.59 Plxdc1 2 9 16 16 19 38 6 3.61 Kctd10 56 29 18 12 11 11 46 -3.33 Agmo 9 15 31 32 70 37 0 2.58 Ccdc41 52 11 20 6 3 9 29 -2.80 Ddit4 3 1 1 29 25 36 8 3.02 Top2a 51 17 46 5 0 0 51 -4.51 Stard3 6 23 39 34 29 34 19 2.52 Cks1b 50 42 61 10 4 1 0 -3.28 Fam3a 3 30 24 28 32 33 0 3.27 Gsr 48 24 8 11 8 8 382 -2.64 Tlr6 4 22 16 60 24 32 23 3.41 Csf1 47 27 12 4 9 10 8 -2.48 Chn2 4 10 13 20 39 31 2 2.70 Ezh2 46 11 30 14 4 3 18 -2.67 Stambpl1 3 8 14 37 31 31 38 3.13 Smc4 45 7 20 4 1 1 83 -4.50 Fcrl1 4 8 8 40 39 30 1 3.30 Mcm6 43 38 46 4 4 5 13 -3.21 Gm12942 2 4 25 30 17 30 0 3.59 Atad2 30 17 25 5 3 4 30 -2.95 Abhd15 4 26 9 39 17 29 1 2.94 Incenp 29 27 8 3 3 1 39 -3.64 Gimap6 1 6 13 16 19 29 0 4.87 Igf1 29 28 14 8 2 0 0 -3.64 Gp9 0 9 15 38 74 28 4 8.95 Ccna2 28 17 26 9 1 0 16 -2.86 Slc46a1 3 24 17 21 32 27 0 3.15 Prr11 26 4 18 7 1 0 0 -3.49 Tppp 5 15 16 27 23 26 27 2.48 Rrm2 23 23 18 1 0 0 1 -5.27 Rgmb 2 10 18 26 16 24 0 3.27 Prim1 23 20 32 1 2 1 3 -4.39 Polr2h 5 31 54 42 41 22 0 2.96 Pbk 23 6 21 1 0 0 0 -6.28 Mzt2 1 19 23 31 46 22 0 4.61 Mcm2 23 29 24 2 1 1 0 -3.92 Bco2 5 17 19 32 36 19 0 2.72 Ulbp1 22 6 23 1 1 2 3 -3.91 Chst7 2 3 7 16 21 18 0 3.27 Ttyh2 18 16 10 4 3 3 0 -2.44 Fam58b 3 20 18 25 28 16 2 2.75 Hmmr 17 5 20 1 0 0 6 -5.19 Tmem100 2 15 11 19 19 16 0 2.89
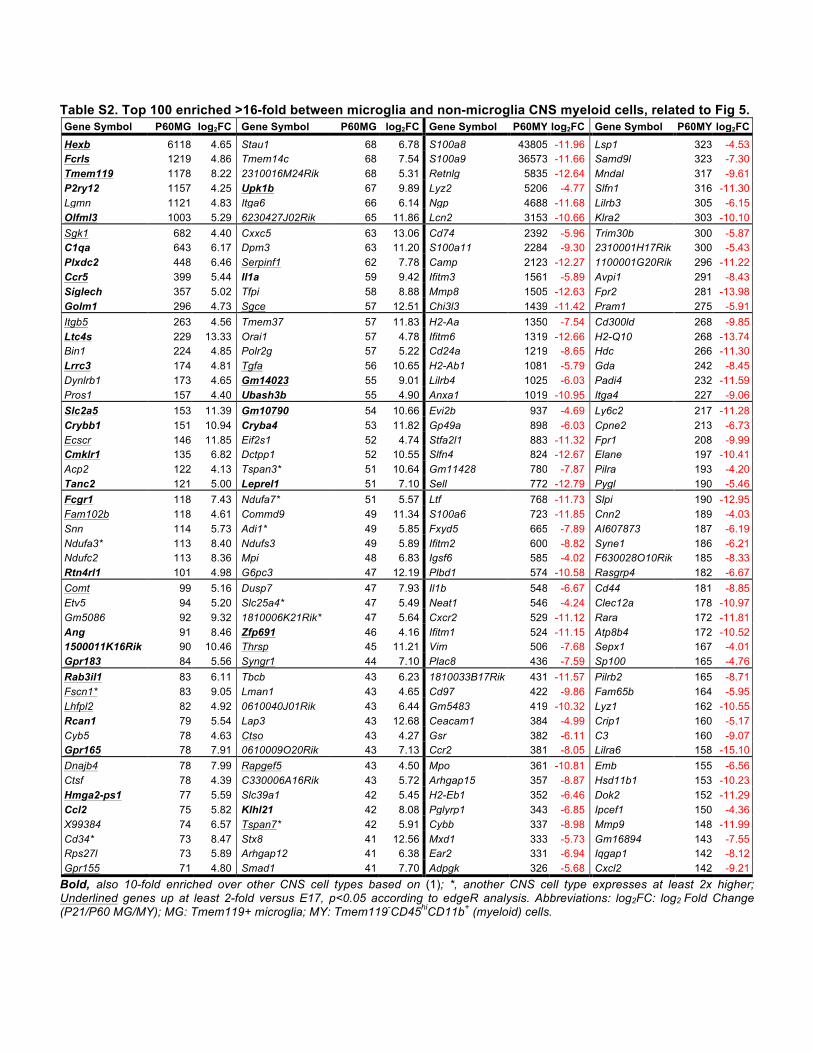
Table S2. Top 100 enriched >16-fold between microglia and non-microglia CNS myeloid cells, related to Fig 5. Gene Symbol P60MG log2FC Gene Symbol P60MG log2FC Gene Symbol P60MY log2FC Gene Symbol P60MY log2FC Hexb 6118 4.65 Stau1 68 6.78 S100a8 43805 -11.96 Lsp1 323 -4.53 Fcrls 1219 4.86 Tmem14c 68 7.54 S100a9 36573 -11.66 Samd9l 323 -7.30 Tmem119 1178 8.22 2310016M24Rik 68 5.31 Retnlg 5835 -12.64 Mndal 317 -9.61 P2ry12 1157 4.25 Upk1b 67 9.89 Lyz2 5206 -4.77 Slfn1 316 -11.30 Lgmn 1121 4.83 Itga6 66 6.14 Ngp 4688 -11.68 Lilrb3 305 -6.15 Olfml3 1003 5.29 6230427J02Rik 65 11.86 Lcn2 3153 -10.66 Klra2 303 -10.10 Sgk1 682 4.40 Cxxc5 63 13.06 Cd74 2392 -5.96 Trim30b 300 -5.87 C1qa 643 6.17 Dpm3 63 11.20 S100a11 2284 -9.30 2310001H17Rik 300 -5.43 Plxdc2 448 6.46 Serpinf1 62 7.78 Camp 2123 -12.27 1100001G20Rik 296 -11.22 Ccr5 399 5.44 Il1a 59 9.42 Ifitm3 1561 -5.89 Avpi1 291 -8.43 Siglech 357 5.02 Tfpi 58 8.88 Mmp8 1505 -12.63 Fpr2 281 -13.98 Golm1 296 4.73 Sgce 57 12.51 Chi3l3 1439 -11.42 Pram1 275 -5.91 Itgb5 263 4.56 Tmem37 57 11.83 H2-Aa 1350 -7.54 Cd300ld 268 -9.85 Ltc4s 229 13.33 Orai1 57 4.78 Ifitm6 1319 -12.66 H2-Q10 268 -13.74 Bin1 224 4.85 Polr2g 57 5.22 Cd24a 1219 -8.65 Hdc 266 -11.30 Lrrc3 174 4.81 Tgfa 56 10.65 H2-Ab1 1081 -5.79 Gda 242 -8.45 Dynlrb1 173 4.65 Gm14023 55 9.01 Lilrb4 1025 -6.03 Padi4 232 -11.59 Pros1 157 4.40 Ubash3b 55 4.90 Anxa1 1019 -10.95 Itga4 227 -9.06 Slc2a5 153 11.39 Gm10790 54 10.66 Evi2b 937 -4.69 Ly6c2 217 -11.28 Crybb1 151 10.94 Cryba4 53 11.82 Gp49a 898 -6.03 Cpne2 213 -6.73 Ecscr 146 11.85 Eif2s1 52 4.74 Stfa2l1 883 -11.32 Fpr1 208 -9.99 Cmklr1 135 6.82 Dctpp1 52 10.55 Slfn4 824 -12.67 Elane 197 -10.41 Acp2 122 4.13 Tspan3* 51 10.64 Gm11428 780 -7.87 Pilra 193 -4.20 Tanc2 121 5.00 Leprel1 51 7.10 Sell 772 -12.79 Pygl 190 -5.46 Fcgr1 118 7.43 Ndufa7* 51 5.57 Ltf 768 -11.73 Slpi 190 -12.95 Fam102b 118 4.61 Commd9 49 11.34 S100a6 723 -11.85 Cnn2 189 -4.03 Snn 114 5.73 Adi1* 49 5.85 Fxyd5 665 -7.89 AI607873 187 -6.19 Ndufa3* 113 8.40 Ndufs3 49 5.89 Ifitm2 600 -8.82 Syne1 186 -6.21 Ndufc2 113 8.36 Mpi 48 6.83 Igsf6 585 -4.02 F630028O10Rik 185 -8.33 Rtn4rl1 101 4.98 G6pc3 47 12.19 Plbd1 574 -10.58 Rasgrp4 182 -6.67 Comt 99 5.16 Dusp7 47 7.93 Il1b 548 -6.67 Cd44 181 -8.85 Etv5 94 5.20 Slc25a4* 47 5.49 Neat1 546 -4.24 Clec12a 178 -10.97 Gm5086 92 9.32 1810006K21Rik* 47 5.64 Cxcr2 529 -11.12 Rara 172 -11.81 Ang 91 8.46 Zfp691 46 4.16 Ifitm1 524 -11.15 Atp8b4 172 -10.52 1500011K16Rik 90 10.46 Thrsp 45 11.21 Vim 506 -7.68 Sepx1 167 -4.01 Gpr183 84 5.56 Syngr1 44 7.10 Plac8 436 -7.59 Sp100 165 -4.76 Rab3il1 83 6.11 Tbcb 43 6.23 1810033B17Rik 431 -11.57 Pilrb2 165 -8.71 Fscn1* 83 9.05 Lman1 43 4.65 Cd97 422 -9.86 Fam65b 164 -5.95 Lhfpl2 82 4.92 0610040J01Rik 43 6.44 Gm5483 419 -10.32 Lyz1 162 -10.55 Rcan1 79 5.54 Lap3 43 12.68 Ceacam1 384 -4.99 Crip1 160 -5.17 Cyb5 78 4.63 Ctso 43 4.27 Gsr 382 -6.11 C3 160 -9.07 Gpr165 78 7.91 0610009O20Rik 43 7.13 Ccr2 381 -8.05 Lilra6 158 -15.10 Dnajb4 78 7.99 Rapgef5 43 4.50 Mpo 361 -10.81 Emb 155 -6.56 Ctsf 78 4.39 C330006A16Rik 43 5.72 Arhgap15 357 -8.87 Hsd11b1 153 -10.23 Hmga2-ps1 77 5.59 Slc39a1 42 5.45 H2-Eb1 352 -6.46 Dok2 152 -11.29 Ccl2 75 5.82 Klhl21 42 8.08 Pglyrp1 343 -6.85 Ipcef1 150 -4.36 X99384 74 6.57 Tspan7* 42 5.91 Cybb 337 -8.98 Mmp9 148 -11.99 Cd34* 73 8.47 Stx8 41 12.56 Mxd1 333 -5.73 Gm16894 143 -7.55 Rps27l 73 5.89 Arhgap12 41 6.38 Ear2 331 -6.94 Iqgap1 142 -8.12 Gpr155 71 4.80 Smad1 41 7.70 Adpgk 326 -5.68 Cxcl2 142 -9.21
Bold, also 10-fold enriched over other CNS cell types based on (1); *, another CNS cell type expresses at least 2x higher; Underlined genes up at least 2-fold versus E17, p<0.05 according to edgeR analysis. Abbreviations: log2FC: log2 Fold Change (P21/P60 MG/MY); MG: Tmem119+ microglia; MY: Tmem119-CD45hiCD11b+ (myeloid) cells.
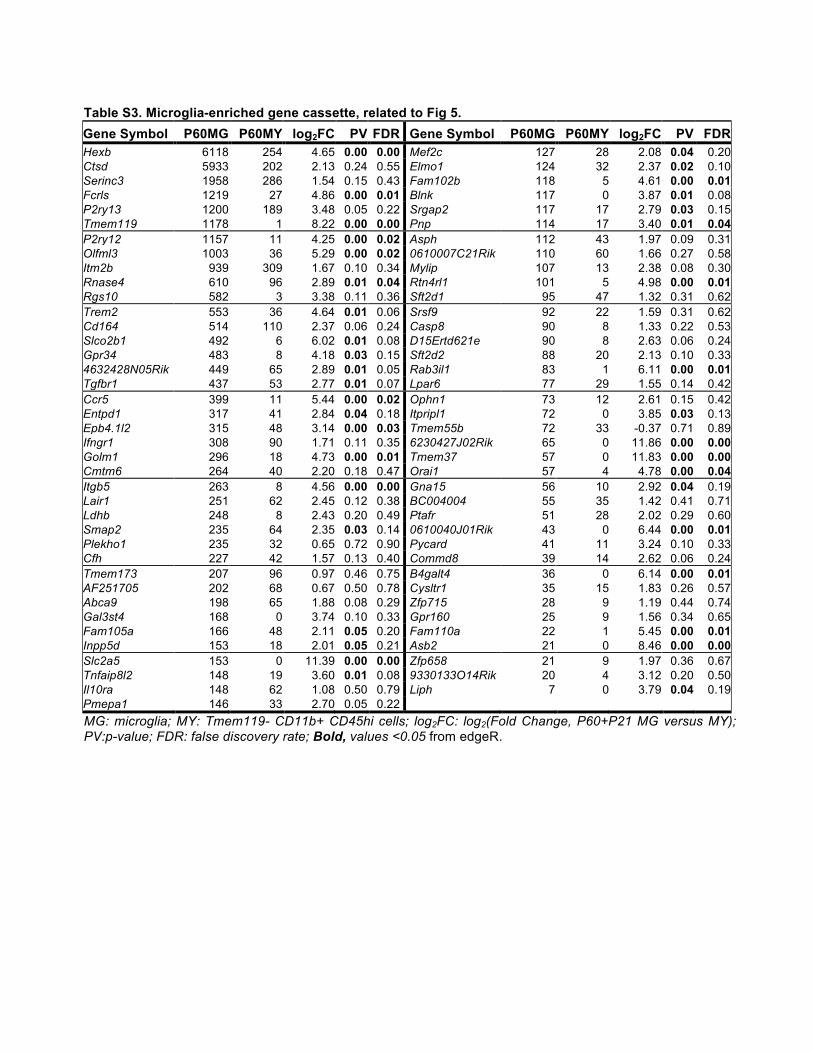
Table S3. Microglia-enriched gene cassette, related to Fig 5. Gene Symbol P60MG P60MY log2FC PV FDR Gene Symbol P60MG P60MY log2FC PV FDR Hexb 6118 254 4.65 0.00 0.00 Mef2c 127 28 2.08 0.04 0.20 Ctsd 5933 202 2.13 0.24 0.55 Elmo1 124 32 2.37 0.02 0.10 Serinc3 1958 286 1.54 0.15 0.43 Fam102b 118 5 4.61 0.00 0.01 Fcrls 1219 27 4.86 0.00 0.01 Blnk 117 0 3.87 0.01 0.08 P2ry13 1200 189 3.48 0.05 0.22 Srgap2 117 17 2.79 0.03 0.15 Tmem119 1178 1 8.22 0.00 0.00 Pnp 114 17 3.40 0.01 0.04 P2ry12 1157 11 4.25 0.00 0.02 Asph 112 43 1.97 0.09 0.31 Olfml3 1003 36 5.29 0.00 0.02 0610007C21Rik 110 60 1.66 0.27 0.58 Itm2b 939 309 1.67 0.10 0.34 Mylip 107 13 2.38 0.08 0.30 Rnase4 610 96 2.89 0.01 0.04 Rtn4rl1 101 5 4.98 0.00 0.01 Rgs10 582 3 3.38 0.11 0.36 Sft2d1 95 47 1.32 0.31 0.62 Trem2 553 36 4.64 0.01 0.06 Srsf9 92 22 1.59 0.31 0.62 Cd164 514 110 2.37 0.06 0.24 Casp8 90 8 1.33 0.22 0.53 Slco2b1 492 6 6.02 0.01 0.08 D15Ertd621e 90 8 2.63 0.06 0.24 Gpr34 483 8 4.18 0.03 0.15 Sft2d2 88 20 2.13 0.10 0.33 4632428N05Rik 449 65 2.89 0.01 0.05 Rab3il1 83 1 6.11 0.00 0.01 Tgfbr1 437 53 2.77 0.01 0.07 Lpar6 77 29 1.55 0.14 0.42 Ccr5 399 11 5.44 0.00 0.02 Ophn1 73 12 2.61 0.15 0.42 Entpd1 317 41 2.84 0.04 0.18 Itpripl1 72 0 3.85 0.03 0.13 Epb4.1l2 315 48 3.14 0.00 0.03 Tmem55b 72 33 -0.37 0.71 0.89 Ifngr1 308 90 1.71 0.11 0.35 6230427J02Rik 65 0 11.86 0.00 0.00 Golm1 296 18 4.73 0.00 0.01 Tmem37 57 0 11.83 0.00 0.00 Cmtm6 264 40 2.20 0.18 0.47 Orai1 57 4 4.78 0.00 0.04 Itgb5 263 8 4.56 0.00 0.00 Gna15 56 10 2.92 0.04 0.19 Lair1 251 62 2.45 0.12 0.38 BC004004 55 35 1.42 0.41 0.71 Ldhb 248 8 2.43 0.20 0.49 Ptafr 51 28 2.02 0.29 0.60 Smap2 235 64 2.35 0.03 0.14 0610040J01Rik 43 0 6.44 0.00 0.01 Plekho1 235 32 0.65 0.72 0.90 Pycard 41 11 3.24 0.10 0.33 Cfh 227 42 1.57 0.13 0.40 Commd8 39 14 2.62 0.06 0.24 Tmem173 207 96 0.97 0.46 0.75 B4galt4 36 0 6.14 0.00 0.01 AF251705 202 68 0.67 0.50 0.78 Cysltr1 35 15 1.83 0.26 0.57 Abca9 198 65 1.88 0.08 0.29 Zfp715 28 9 1.19 0.44 0.74 Gal3st4 168 0 3.74 0.10 0.33 Gpr160 25 9 1.56 0.34 0.65 Fam105a 166 48 2.11 0.05 0.20 Fam110a 22 1 5.45 0.00 0.01 Inpp5d 153 18 2.01 0.05 0.21 Asb2 21 0 8.46 0.00 0.00 Slc2a5 153 0 11.39 0.00 0.00 Zfp658 21 9 1.97 0.36 0.67 Tnfaip8l2 148 19 3.60 0.01 0.08 9330133O14Rik 20 4 3.12 0.20 0.50 Il10ra 148 62 1.08 0.50 0.79 Liph 7 0 3.79 0.04 0.19 Pmepa1 146 33 2.70 0.05 0.22
MG: microglia; MY: Tmem119- CD11b+ CD45hi cells; log2FC: log2(Fold Change, P60+P21 MG versus MY); PV:p-value; FDR: false discovery rate; Bold, values <0.05 from edgeR.
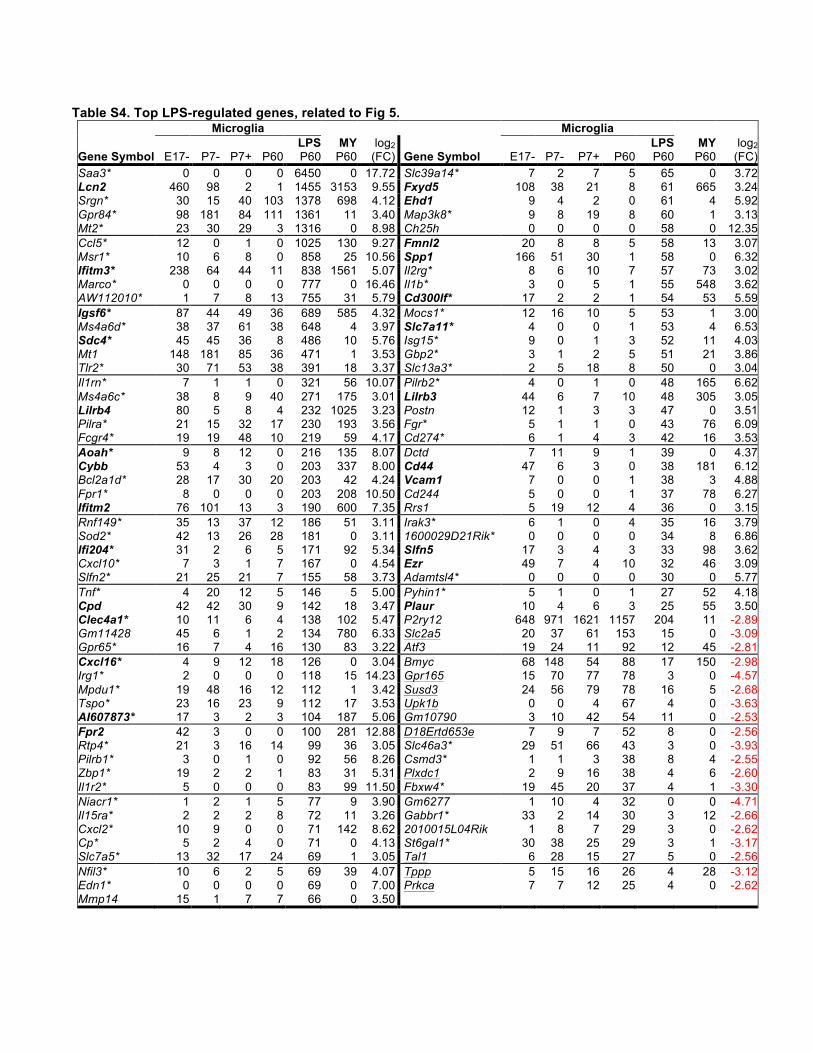
Table S4. Top LPS-regulated genes, related to Fig 5.
Microglia
Microglia
Gene Symbol E17- P7- P7+ P60
LPS P60
MY P60
log2 (FC) Gene Symbol E17- P7- P7+ P60
LPS P60
MY P60
log2 (FC)
Saa3* 0 0 0 0 6450 0 17.72 Slc39a14* 7 2 7 5 65 0 3.72 Lcn2 460 98 2 1 1455 3153 9.55 Fxyd5 108 38 21 8 61 665 3.24 Srgn* 30 15 40 103 1378 698 4.12 Ehd1 9 4 2 0 61 4 5.92 Gpr84* 98 181 84 111 1361 11 3.40 Map3k8* 9 8 19 8 60 1 3.13 Mt2* 23 30 29 3 1316 0 8.98 Ch25h 0 0 0 0 58 0 12.35 Ccl5* 12 0 1 0 1025 130 9.27 Fmnl2 20 8 8 5 58 13 3.07 Msr1* 10 6 8 0 858 25 10.56 Spp1 166 51 30 1 58 0 6.32 Ifitm3* 238 64 44 11 838 1561 5.07 Il2rg* 8 6 10 7 57 73 3.02 Marco* 0 0 0 0 777 0 16.46 Il1b* 3 0 5 1 55 548 3.62 AW112010* 1 7 8 13 755 31 5.79 Cd300lf* 17 2 2 1 54 53 5.59 Igsf6* 87 44 49 36 689 585 4.32 Mocs1* 12 16 10 5 53 1 3.00 Ms4a6d* 38 37 61 38 648 4 3.97 Slc7a11* 4 0 0 1 53 4 6.53 Sdc4* 45 45 36 8 486 10 5.76 Isg15* 9 0 1 3 52 11 4.03 Mt1 148 181 85 36 471 1 3.53 Gbp2* 3 1 2 5 51 21 3.86 Tlr2* 30 71 53 38 391 18 3.37 Slc13a3* 2 5 18 8 50 0 3.04 Il1rn* 7 1 1 0 321 56 10.07 Pilrb2* 4 0 1 0 48 165 6.62 Ms4a6c* 38 8 9 40 271 175 3.01 Lilrb3 44 6 7 10 48 305 3.05 Lilrb4 80 5 8 4 232 1025 3.23 Postn 12 1 3 3 47 0 3.51 Pilra* 21 15 32 17 230 193 3.56 Fgr* 5 1 1 0 43 76 6.09 Fcgr4* 19 19 48 10 219 59 4.17 Cd274* 6 1 4 3 42 16 3.53 Aoah* 9 8 12 0 216 135 8.07 Dctd 7 11 9 1 39 0 4.37 Cybb 53 4 3 0 203 337 8.00 Cd44 47 6 3 0 38 181 6.12 Bcl2a1d* 28 17 30 20 203 42 4.24 Vcam1 7 0 0 1 38 3 4.88 Fpr1* 8 0 0 0 203 208 10.50 Cd244 5 0 0 1 37 78 6.27 Ifitm2 76 101 13 3 190 600 7.35 Rrs1 5 19 12 4 36 0 3.15 Rnf149* 35 13 37 12 186 51 3.11 Irak3* 6 1 0 4 35 16 3.79 Sod2* 42 13 26 28 181 0 3.11 1600029D21Rik* 0 0 0 0 34 8 6.86 Ifi204* 31 2 6 5 171 92 5.34 Slfn5 17 3 4 3 33 98 3.62 Cxcl10* 7 3 1 7 167 0 4.54 Ezr 49 7 4 10 32 46 3.09 Slfn2* 21 25 21 7 155 58 3.73 Adamtsl4* 0 0 0 0 30 0 5.77 Tnf* 4 20 12 5 146 5 5.00 Pyhin1* 5 1 0 1 27 52 4.18 Cpd 42 42 30 9 142 18 3.47 Plaur 10 4 6 3 25 55 3.50 Clec4a1* 10 11 6 4 138 102 5.47 P2ry12 648 971 1621 1157 204 11 -2.89 Gm11428 45 6 1 2 134 780 6.33 Slc2a5 20 37 61 153 15 0 -3.09 Gpr65* 16 7 4 16 130 83 3.22 Atf3 19 24 11 92 12 45 -2.81 Cxcl16* 4 9 12 18 126 0 3.04 Bmyc 68 148 54 88 17 150 -2.98 Irg1* 2 0 0 0 118 15 14.23 Gpr165 15 70 77 78 3 0 -4.57 Mpdu1* 19 48 16 12 112 1 3.42 Susd3 24 56 79 78 16 5 -2.68 Tspo* 23 16 23 9 112 17 3.53 Upk1b 0 0 4 67 4 0 -3.63 AI607873* 17 3 2 3 104 187 5.06 Gm10790 3 10 42 54 11 0 -2.53 Fpr2 42 3 0 0 100 281 12.88 D18Ertd653e 7 9 7 52 8 0 -2.56 Rtp4* 21 3 16 14 99 36 3.05 Slc46a3* 29 51 66 43 3 0 -3.93 Pilrb1* 3 0 1 0 92 56 8.26 Csmd3* 1 1 3 38 8 4 -2.55 Zbp1* 19 2 2 1 83 31 5.31 Plxdc1 2 9 16 38 4 6 -2.60 Il1r2* 5 0 0 0 83 99 11.50 Fbxw4* 19 45 20 37 4 1 -3.30 Niacr1* 1 2 1 5 77 9 3.90 Gm6277 1 10 4 32 0 0 -4.71 Il15ra* 2 2 2 8 72 11 3.26 Gabbr1* 33 2 14 30 3 12 -2.66 Cxcl2* 10 9 0 0 71 142 8.62 2010015L04Rik 1 8 7 29 3 0 -2.62 Cp* 5 2 4 0 71 0 4.13 St6gal1* 30 38 25 29 3 1 -3.17 Slc7a5* 13 32 17 24 69 1 3.05 Tal1 6 28 15 27 5 0 -2.56 Nfil3* 10 6 2 5 69 39 4.07 Tppp 5 15 16 26 4 28 -3.12 Edn1* 0 0 0 0 69 0 7.00 Prkca 7 7 12 25 4 0 -2.62 Mmp14 15 1 7 7 66 0 3.50
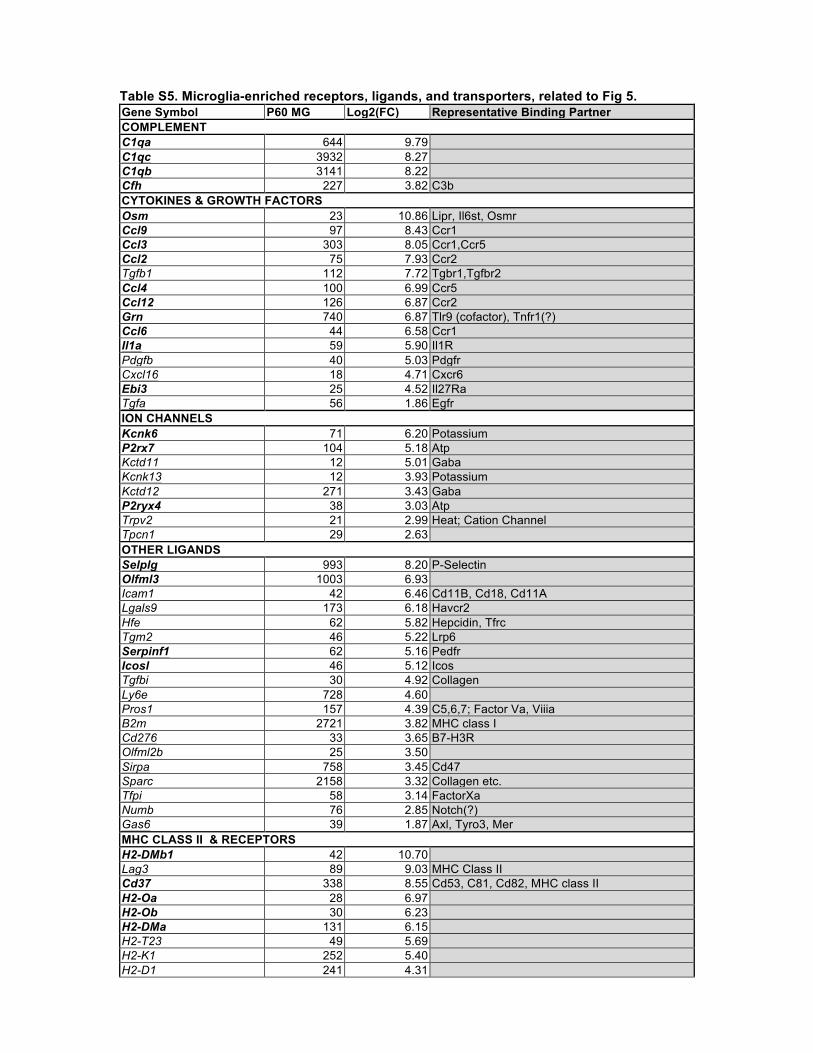
Table S5. Microglia-enriched receptors, ligands, and transporters, related to Fig 5. Gene Symbol P60 MG Log2(FC) Representative Binding Partner COMPLEMENT C1qa 644 9.79 C1qc 3932 8.27 C1qb 3141 8.22 Cfh 227 3.82 C3b CYTOKINES & GROWTH FACTORS Osm 23 10.86 Lipr, Il6st, Osmr Ccl9 97 8.43 Ccr1 Ccl3 303 8.05 Ccr1,Ccr5 Ccl2 75 7.93 Ccr2 Tgfb1 112 7.72 Tgbr1,Tgfbr2 Ccl4 100 6.99 Ccr5 Ccl12 126 6.87 Ccr2 Grn 740 6.87 Tlr9 (cofactor), Tnfr1(?) Ccl6 44 6.58 Ccr1 Il1a 59 5.90 Il1R Pdgfb 40 5.03 Pdgfr Cxcl16 18 4.71 Cxcr6 Ebi3 25 4.52 Il27Ra Tgfa 56 1.86 Egfr ION CHANNELS Kcnk6 71 6.20 Potassium P2rx7 104 5.18 Atp Kctd11 12 5.01 Gaba Kcnk13 12 3.93 Potassium Kctd12 271 3.43 Gaba P2ryx4 38 3.03 Atp Trpv2 21 2.99 Heat; Cation Channel Tpcn1 29 2.63 OTHER LIGANDS Selplg 993 8.20 P-Selectin Olfml3 1003 6.93 Icam1 42 6.46 Cd11B, Cd18, Cd11A Lgals9 173 6.18 Havcr2 Hfe 62 5.82 Hepcidin, Tfrc Tgm2 46 5.22 Lrp6 Serpinf1 62 5.16 Pedfr Icosl 46 5.12 Icos Tgfbi 30 4.92 Collagen Ly6e 728 4.60 Pros1 157 4.39 C5,6,7; Factor Va, Viiia B2m 2721 3.82 MHC class I Cd276 33 3.65 B7-H3R Olfml2b 25 3.50 Sirpa 758 3.45 Cd47 Sparc 2158 3.32 Collagen etc. Tfpi 58 3.14 FactorXa Numb 76 2.85 Notch(?) Gas6 39 1.87 Axl, Tyro3, Mer MHC CLASS II & RECEPTORS H2-DMb1 42 10.70 Lag3 89 9.03 MHC Class II Cd37 338 8.55 Cd53, C81, Cd82, MHC class II H2-Oa 28 6.97 H2-Ob 30 6.23 H2-DMa 131 6.15 H2-T23 49 5.69 H2-K1 252 5.40 H2-D1 241 4.31
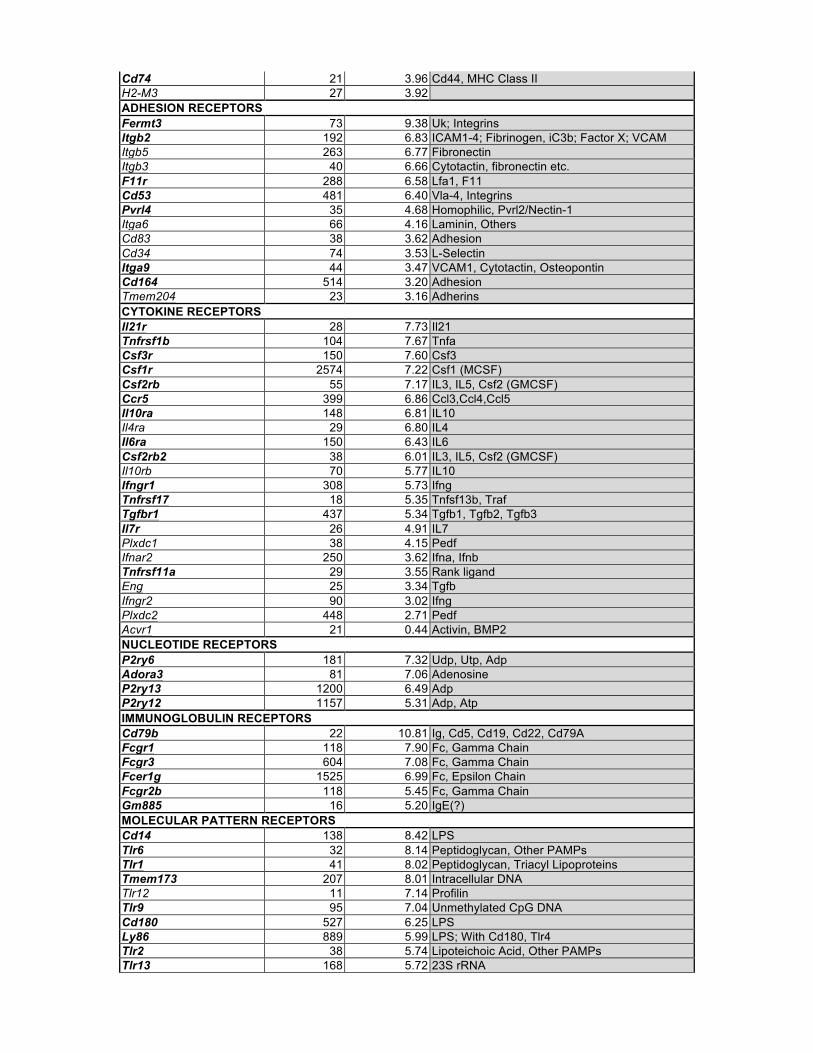
Cd74 21 3.96 Cd44, MHC Class II H2-M3 27 3.92 ADHESION RECEPTORS Fermt3 73 9.38 Uk; Integrins Itgb2 192 6.83 ICAM1-4; Fibrinogen, iC3b; Factor X; VCAM Itgb5 263 6.77 Fibronectin Itgb3 40 6.66 Cytotactin, fibronectin etc. F11r 288 6.58 Lfa1, F11 Cd53 481 6.40 Vla-4, Integrins Pvrl4 35 4.68 Homophilic, Pvrl2/Nectin-1 Itga6 66 4.16 Laminin, Others Cd83 38 3.62 Adhesion Cd34 74 3.53 L-Selectin Itga9 44 3.47 VCAM1, Cytotactin, Osteopontin Cd164 514 3.20 Adhesion Tmem204 23 3.16 Adherins CYTOKINE RECEPTORS Il21r 28 7.73 Il21 Tnfrsf1b 104 7.67 Tnfa Csf3r 150 7.60 Csf3 Csf1r 2574 7.22 Csf1 (MCSF) Csf2rb 55 7.17 IL3, IL5, Csf2 (GMCSF) Ccr5 399 6.86 Ccl3,Ccl4,Ccl5 Il10ra 148 6.81 IL10 Il4ra 29 6.80 IL4 Il6ra 150 6.43 IL6 Csf2rb2 38 6.01 IL3, IL5, Csf2 (GMCSF) Il10rb 70 5.77 IL10 Ifngr1 308 5.73 Ifng Tnfrsf17 18 5.35 Tnfsf13b, Traf Tgfbr1 437 5.34 Tgfb1, Tgfb2, Tgfb3 Il7r 26 4.91 IL7 Plxdc1 38 4.15 Pedf Ifnar2 250 3.62 Ifna, Ifnb Tnfrsf11a 29 3.55 Rank ligand Eng 25 3.34 Tgfb Ifngr2 90 3.02 Ifng Plxdc2 448 2.71 Pedf Acvr1 21 0.44 Activin, BMP2 NUCLEOTIDE RECEPTORS P2ry6 181 7.32 Udp, Utp, Adp Adora3 81 7.06 Adenosine P2ry13 1200 6.49 Adp P2ry12 1157 5.31 Adp, Atp IMMUNOGLOBULIN RECEPTORS Cd79b 22 10.81 Ig, Cd5, Cd19, Cd22, Cd79A Fcgr1 118 7.90 Fc, Gamma Chain Fcgr3 604 7.08 Fc, Gamma Chain Fcer1g 1525 6.99 Fc, Epsilon Chain Fcgr2b 118 5.45 Fc, Gamma Chain Gm885 16 5.20 IgE(?) MOLECULAR PATTERN RECEPTORS Cd14 138 8.42 LPS Tlr6 32 8.14 Peptidoglycan, Other PAMPs Tlr1 41 8.02 Peptidoglycan, Triacyl Lipoproteins Tmem173 207 8.01 Intracellular DNA Tlr12 11 7.14 Profilin Tlr9 95 7.04 Unmethylated CpG DNA Cd180 527 6.25 LPS Ly86 889 5.99 LPS; With Cd180, Tlr4 Tlr2 38 5.74 Lipoteichoic Acid, Other PAMPs Tlr13 168 5.72 23S rRNA
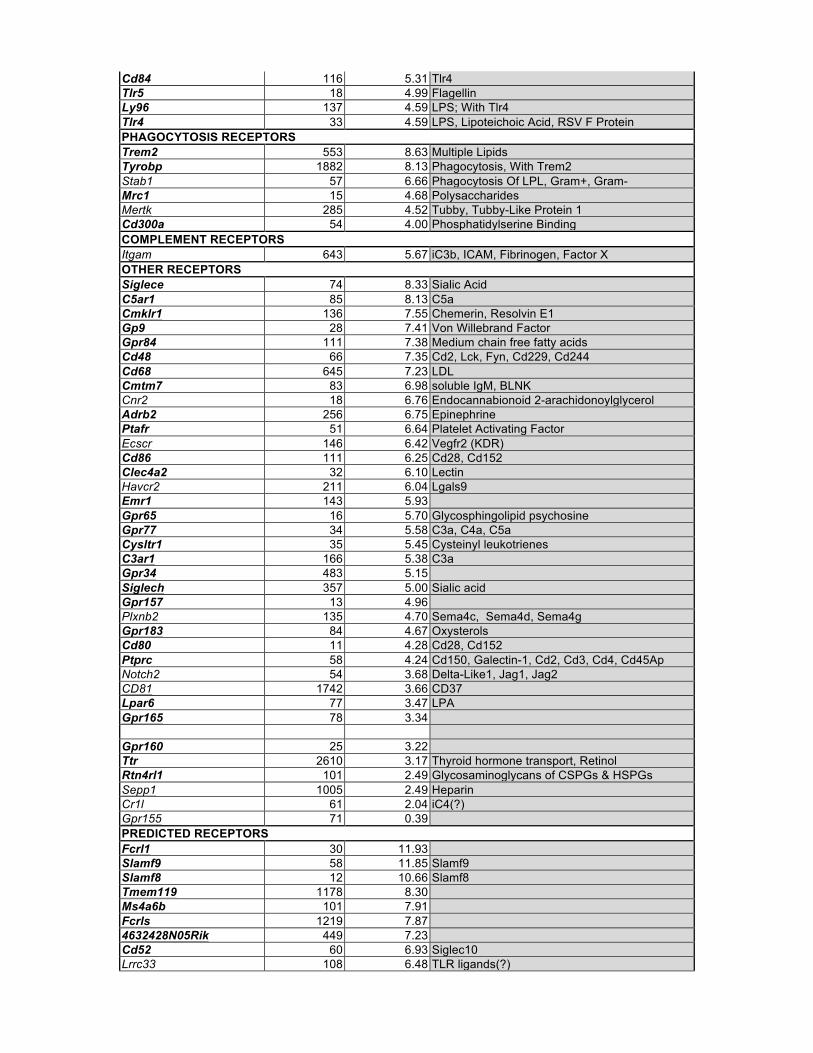
Cd84 116 5.31 Tlr4 Tlr5 18 4.99 Flagellin Ly96 137 4.59 LPS; With Tlr4 Tlr4 33 4.59 LPS, Lipoteichoic Acid, RSV F Protein PHAGOCYTOSIS RECEPTORS Trem2 553 8.63 Multiple Lipids Tyrobp 1882 8.13 Phagocytosis, With Trem2 Stab1 57 6.66 Phagocytosis Of LPL, Gram+, Gram- Mrc1 15 4.68 Polysaccharides Mertk 285 4.52 Tubby, Tubby-Like Protein 1 Cd300a 54 4.00 Phosphatidylserine Binding COMPLEMENT RECEPTORS Itgam 643 5.67 iC3b, ICAM, Fibrinogen, Factor X OTHER RECEPTORS Siglece 74 8.33 Sialic Acid C5ar1 85 8.13 C5a Cmklr1 136 7.55 Chemerin, Resolvin E1 Gp9 28 7.41 Von Willebrand Factor Gpr84 111 7.38 Medium chain free fatty acids Cd48 66 7.35 Cd2, Lck, Fyn, Cd229, Cd244 Cd68 645 7.23 LDL Cmtm7 83 6.98 soluble IgM, BLNK Cnr2 18 6.76 Endocannabionoid 2-arachidonoylglycerol Adrb2 256 6.75 Epinephrine Ptafr 51 6.64 Platelet Activating Factor Ecscr 146 6.42 Vegfr2 (KDR) Cd86 111 6.25 Cd28, Cd152 Clec4a2 32 6.10 Lectin Havcr2 211 6.04 Lgals9 Emr1 143 5.93 Gpr65 16 5.70 Glycosphingolipid psychosine Gpr77 34 5.58 C3a, C4a, C5a Cysltr1 35 5.45 Cysteinyl leukotrienes C3ar1 166 5.38 C3a Gpr34 483 5.15 Siglech 357 5.00 Sialic acid Gpr157 13 4.96 Plxnb2 135 4.70 Sema4c, Sema4d, Sema4g Gpr183 84 4.67 Oxysterols Cd80 11 4.28 Cd28, Cd152 Ptprc 58 4.24 Cd150, Galectin-1, Cd2, Cd3, Cd4, Cd45Ap Notch2 54 3.68 Delta-Like1, Jag1, Jag2 CD81 1742 3.66 CD37 Lpar6 77 3.47 LPA Gpr165 78 3.34 Gpr160 25 3.22 Ttr 2610 3.17 Thyroid hormone transport, Retinol Rtn4rl1 101 2.49 Glycosaminoglycans of CSPGs & HSPGs Sepp1 1005 2.49 Heparin Cr1l 61 2.04 iC4(?) Gpr155 71 0.39 PREDICTED RECEPTORS Fcrl1 30 11.93 Slamf9 58 11.85 Slamf9 Slamf8 12 10.66 Slamf8 Tmem119 1178 8.30 Ms4a6b 101 7.91 Fcrls 1219 7.87 4632428N05Rik 449 7.23 Cd52 60 6.93 Siglec10 Lrrc33 108 6.48 TLR ligands(?)

Ms4a6d 38 6.36 Upk1b 67 6.36 Type 1 fimbriated E. Coli Tmem106a 15 6.34 Nckap1l 246 6.26 Lrrc3 175 6.12 Ms4a6c 40 6.02 Tmem185b 20 2.74 TRANSPORTERS Slc17a9 12 10.11 Vesicular Nucleotides Slc15a3 57 8.91 Histidine, Di-, Tripeptides Slc2a5 153 7.77 Fructose Slc11a1 76 7.39 Fe, Mn Abcc3 90 7.20 Slco2b1 492 6.91 Taurocholate, Pgd2, Pge1, LTC4, Thromboxane Slc16a3 13 6.77 Monocarboxylate Slc7a7 98 6.26 Amino Acids Slc46a1 27 5.61 Folate Abca9 198 5.28 Abhd15 29 5.00 Slc37a2 34 4.64 Glucose-6-phosphate Slc29a3 271 3.93 Nucleoside Slco4a1 16 3.81 Organic Anion Slc7a8 165 3.58 Amino Acids Slc16a6 45 3.54 Monocarboxylate Slc40a1 53 3.44 Fe Slc10a3 12 2.79 Slc16a10 18 2.67 Amino Acids Abcg2 56 2.13 Xenobiotics, urate P60 MG, P60 microglia FPKM. Log2(FC), Log2(Fold Change AdultMG/Whole Brain). Bold, expressed at or more highly than all other non-myeloid CNS cells; underlined, enriched also in microglia over myeloid cells. Unlisted binding partners are due to orphan status. (?), predicted interaction.

Table S6. Disease-associated genes that are microglia enriched, related to Fig 5. Gene Symbol Disease P60 MG P60 MY Astros Neuron NF Oligo M Oligo Endos ATAXIA Nop56 SCA 62 58 14 23 17 7 8 Atxn10 SCA 55 99 39 103 64 41 36 Tbp SCA, PD 29 20 11 11 6 3 10 Atxn3 SCA 12 5 4 3 3 2 8 Atxn7 SCA 12 18 19 5 2 1 7 Atxn1* SCA 10 2 3 3 1 0 2 Itpr1* SCA 4 5 0 1 0 1 9 DEVELOPMENTAL Sall1* Townes-Brocks syndrome 177 13 13 4 2 4 0 Mlxipl* Williams 121 20 1 0 0 0 0 Sdha Leigh syndrome 93 63 46 46 48 35 35 Ophn1 MRD 73 12 12 8 6 1 11 Ndufa2 Leigh syndrome 68 171 38 55 69 91 117 Ndufs3 Leigh syndrome 49 0 8 10 8 6 11 Hprt Lesch-nyhan 48 54 8 44 9 5 130 Samhd1* Aicardi-Goutieres syndrome 45 566 4 3 2 1 10 Crebbp Rubinstein-Taybi 43 51 9 10 5 1 4 Nsd1 Beckwith-Wiedemann 34 31 16 8 7 3 7 Atrx ATRX 32 109 26 18 5 1 14 Dyrk1a MRD 29 24 22 18 12 4 10 Igf2 Beckwith-Wiedemann 23 0 2 6 0 1 17 Cox10 Leigh syndrome 15 0 12 4 4 3 4 Cox15 Leigh syndrome 15 11 4 5 5 2 2 Pigl Chime Syndrome 13 0 5 2 3 1 2 Alms1* Alstrom syndrome 6 2 5 2 1 0 1 Hdac4 BDMR 4 1 4 4 1 1 2 Kcnq1ot1* Beckwith-Wiedemann 3 1 0 0 0 0 0 EPILEPSY Scn1b Epilepsy 17 0 2 29 3 15 3 Pnp0 Epilepsy 8 15 0 8 2 1 4 METABOLIC/STORAGE DISEASE Ctsd NCL 5933 202 187 84 181 161 132 Hexa Tay-Sachs 308 68 23 13 32 22 26 Tpp1 NCL 169 28 40 9 38 17 36 Ppt1 NCL 159 243 45 21 64 34 37 Cln5* NCL 64 45 13 2 15 10 14 Naga* Schindler 43 44 19 4 8 6 12 Cln3 NCL 25 21 9 3 12 7 3 Idua Hurler 22 33 5 1 1 1 1 Phyh Refsum 22 50 12 14 11 9 5 Asl Arginosuccinate lyase deficiency 22 0 5 13 5 4 16 Pex10 Peroxisome biogenesis disorder 12 0 3 3 5 4 3 Pex12 Peroxisome biogenesis disorder 10 1 3 1 2 1 2 Pex26 Peroxisome biogenesis disorder 7 5 2 3 2 1 2 NEURODEGENERATIVE Grn* FTD 740 100 39 17 25 19 36 Trem2* AD, PLOSL 553 36 1 1 2 6 0 Pfn1 ALS 297 527 77 83 217 204 470 Apoe AD 139 369 3006 200 142 216 133 Npc1* Niemann-Pick 127 18 40 10 64 54 7 Npc2 Niemann-Pick 101 64 35 19 101 162 60 Ang* ALS 91 0 0 0 0 1 0 Gba LBD, PD, Gaucher 75 23 22 11 39 29 30 Sod1 ALS 72 122 23 33 29 30 90 Hfe* AD 62 189 2 0 1 1 12 App AD 58 84 58 307 468 376 320 Pink1 PD 51 0 26 71 60 189 46 Psen1* AD, FTD, Pick 48 59 17 15 21 18 19
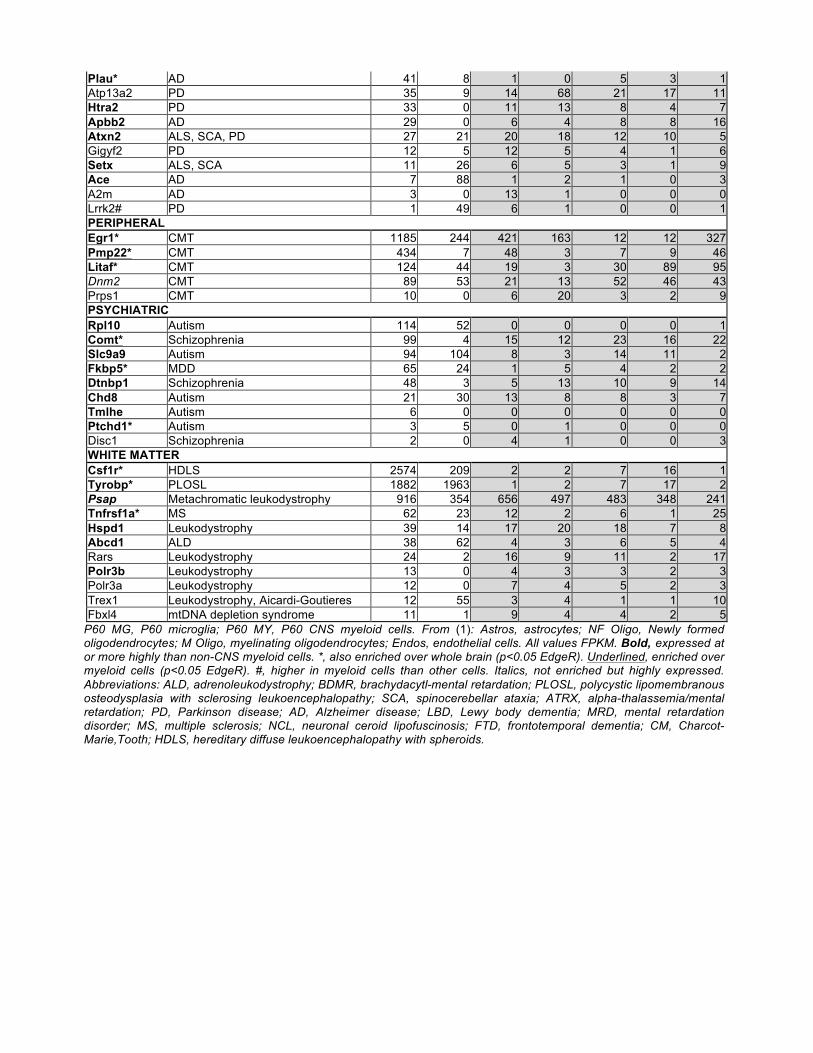
Plau* AD 41 8 1 0 5 3 1 Atp13a2 PD 35 9 14 68 21 17 11 Htra2 PD 33 0 11 13 8 4 7 Apbb2 AD 29 0 6 4 8 8 16 Atxn2 ALS, SCA, PD 27 21 20 18 12 10 5 Gigyf2 PD 12 5 12 5 4 1 6 Setx ALS, SCA 11 26 6 5 3 1 9 Ace AD 7 88 1 2 1 0 3 A2m AD 3 0 13 1 0 0 0 Lrrk2# PD 1 49 6 1 0 0 1 PERIPHERAL Egr1* CMT 1185 244 421 163 12 12 327 Pmp22* CMT 434 7 48 3 7 9 46 Litaf* CMT 124 44 19 3 30 89 95 Dnm2 CMT 89 53 21 13 52 46 43 Prps1 CMT 10 0 6 20 3 2 9 PSYCHIATRIC Rpl10 Autism 114 52 0 0 0 0 1 Comt* Schizophrenia 99 4 15 12 23 16 22 Slc9a9 Autism 94 104 8 3 14 11 2 Fkbp5* MDD 65 24 1 5 4 2 2 Dtnbp1 Schizophrenia 48 3 5 13 10 9 14 Chd8 Autism 21 30 13 8 8 3 7 Tmlhe Autism 6 0 0 0 0 0 0 Ptchd1* Autism 3 5 0 1 0 0 0 Disc1 Schizophrenia 2 0 4 1 0 0 3 WHITE MATTER Csf1r* HDLS 2574 209 2 2 7 16 1 Tyrobp* PLOSL 1882 1963 1 2 7 17 2 Psap Metachromatic leukodystrophy 916 354 656 497 483 348 241 Tnfrsf1a* MS 62 23 12 2 6 1 25 Hspd1 Leukodystrophy 39 14 17 20 18 7 8 Abcd1 ALD 38 62 4 3 6 5 4 Rars Leukodystrophy 24 2 16 9 11 2 17 Polr3b Leukodystrophy 13 0 4 3 3 2 3 Polr3a Leukodystrophy 12 0 7 4 5 2 3 Trex1 Leukodystrophy, Aicardi-Goutieres 12 55 3 4 1 1 10 Fbxl4 mtDNA depletion syndrome 11 1 9 4 4 2 5
P60 MG, P60 microglia; P60 MY, P60 CNS myeloid cells. From (1): Astros, astrocytes; NF Oligo, Newly formed oligodendrocytes; M Oligo, myelinating oligodendrocytes; Endos, endothelial cells. All values FPKM. Bold, expressed at or more highly than non-CNS myeloid cells. *, also enriched over whole brain (p<0.05 EdgeR). Underlined, enriched over myeloid cells (p<0.05 EdgeR). #, higher in myeloid cells than other cells. Italics, not enriched but highly expressed. Abbreviations: ALD, adrenoleukodystrophy; BDMR, brachydacytl-mental retardation; PLOSL, polycystic lipomembranous osteodysplasia with sclerosing leukoencephalopathy; SCA, spinocerebellar ataxia; ATRX, alpha-thalassemia/mental retardation; PD, Parkinson disease; AD, Alzheimer disease; LBD, Lewy body dementia; MRD, mental retardation disorder; MS, multiple sclerosis; NCL, neuronal ceroid lipofuscinosis; FTD, frontotemporal dementia; CM, Charcot-Marie,Tooth; HDLS, hereditary diffuse leukoencephalopathy with spheroids.
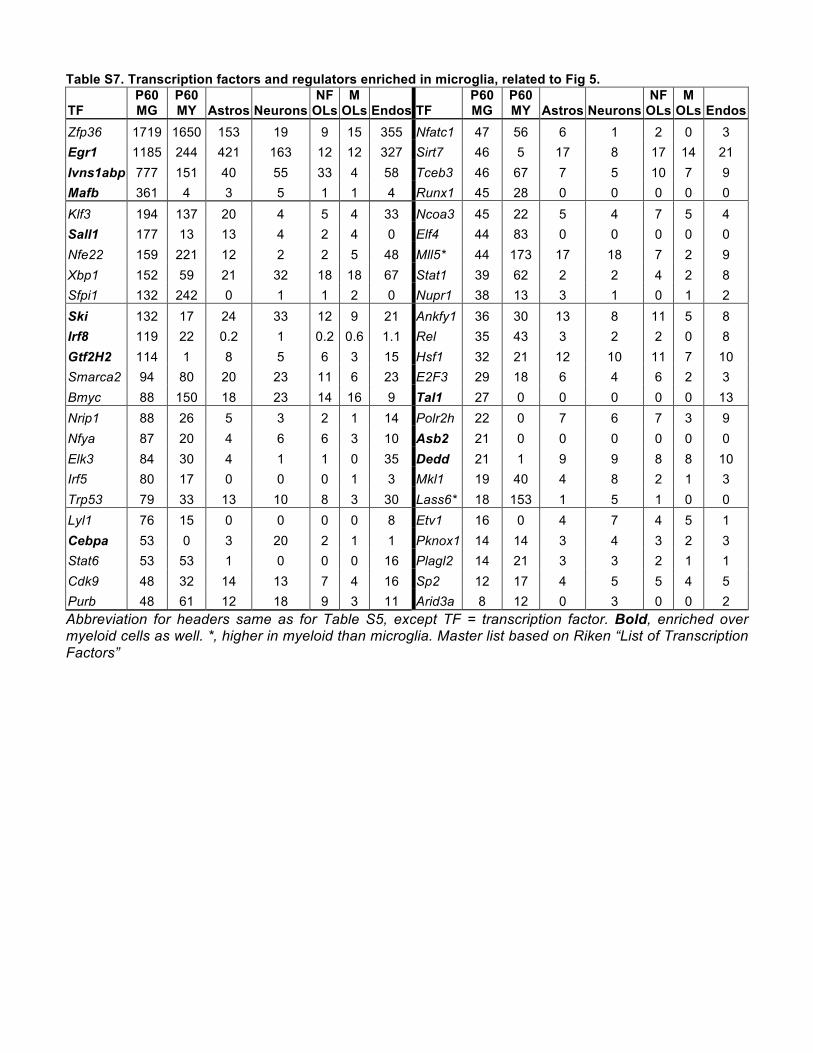
Table S7. Transcription factors and regulators enriched in microglia, related to Fig 5.
TF P60 MG
P60 MY Astros Neurons
NF OLs
M OLs Endos TF
P60 MG
P60 MY Astros Neurons
NF OLs
M OLs Endos
Zfp36 1719 1650 153 19 9 15 355 Nfatc1 47 56 6 1 2 0 3 Egr1 1185 244 421 163 12 12 327 Sirt7 46 5 17 8 17 14 21 Ivns1abp 777 151 40 55 33 4 58 Tceb3 46 67 7 5 10 7 9 Mafb 361 4 3 5 1 1 4 Runx1 45 28 0 0 0 0 0 Klf3 194 137 20 4 5 4 33 Ncoa3 45 22 5 4 7 5 4 Sall1 177 13 13 4 2 4 0 Elf4 44 83 0 0 0 0 0 Nfe22 159 221 12 2 2 5 48 Mll5* 44 173 17 18 7 2 9 Xbp1 152 59 21 32 18 18 67 Stat1 39 62 2 2 4 2 8 Sfpi1 132 242 0 1 1 2 0 Nupr1 38 13 3 1 0 1 2 Ski 132 17 24 33 12 9 21 Ankfy1 36 30 13 8 11 5 8 Irf8 119 22 0.2 1 0.2 0.6 1.1 Rel 35 43 3 2 2 0 8 Gtf2H2 114 1 8 5 6 3 15 Hsf1 32 21 12 10 11 7 10 Smarca2 94 80 20 23 11 6 23 E2F3 29 18 6 4 6 2 3 Bmyc 88 150 18 23 14 16 9 Tal1 27 0 0 0 0 0 13 Nrip1 88 26 5 3 2 1 14 Polr2h 22 0 7 6 7 3 9 Nfya 87 20 4 6 6 3 10 Asb2 21 0 0 0 0 0 0 Elk3 84 30 4 1 1 0 35 Dedd 21 1 9 9 8 8 10 Irf5 80 17 0 0 0 1 3 Mkl1 19 40 4 8 2 1 3 Trp53 79 33 13 10 8 3 30 Lass6* 18 153 1 5 1 0 0 Lyl1 76 15 0 0 0 0 8 Etv1 16 0 4 7 4 5 1 Cebpa 53 0 3 20 2 1 1 Pknox1 14 14 3 4 3 2 3 Stat6 53 53 1 0 0 0 16 Plagl2 14 21 3 3 2 1 1 Cdk9 48 32 14 13 7 4 16 Sp2 12 17 4 5 5 4 5 Purb 48 61 12 18 9 3 11 Arid3a 8 12 0 3 0 0 2 Abbreviation for headers same as for Table S5, except TF = transcription factor. Bold, enriched over myeloid cells as well. *, higher in myeloid than microglia. Master list based on Riken “List of Transcription Factors”
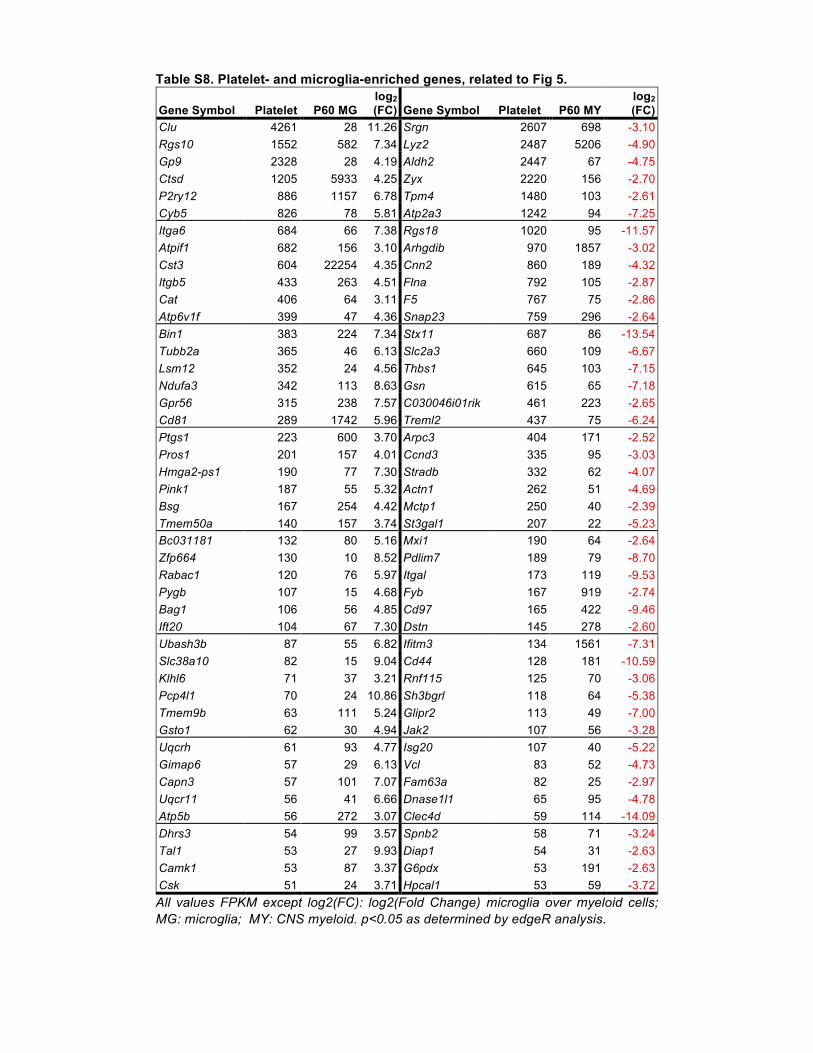
Table S8. Platelet- and microglia-enriched genes, related to Fig 5.
Gene Symbol Platelet P60 MG log2 (FC) Gene Symbol Platelet P60 MY
log2 (FC)
Clu 4261 28 11.26 Srgn 2607 698 -3.10 Rgs10 1552 582 7.34 Lyz2 2487 5206 -4.90 Gp9 2328 28 4.19 Aldh2 2447 67 -4.75 Ctsd 1205 5933 4.25 Zyx 2220 156 -2.70 P2ry12 886 1157 6.78 Tpm4 1480 103 -2.61 Cyb5 826 78 5.81 Atp2a3 1242 94 -7.25 Itga6 684 66 7.38 Rgs18 1020 95 -11.57 Atpif1 682 156 3.10 Arhgdib 970 1857 -3.02 Cst3 604 22254 4.35 Cnn2 860 189 -4.32 Itgb5 433 263 4.51 Flna 792 105 -2.87 Cat 406 64 3.11 F5 767 75 -2.86 Atp6v1f 399 47 4.36 Snap23 759 296 -2.64 Bin1 383 224 7.34 Stx11 687 86 -13.54 Tubb2a 365 46 6.13 Slc2a3 660 109 -6.67 Lsm12 352 24 4.56 Thbs1 645 103 -7.15 Ndufa3 342 113 8.63 Gsn 615 65 -7.18 Gpr56 315 238 7.57 C030046i01rik 461 223 -2.65 Cd81 289 1742 5.96 Treml2 437 75 -6.24 Ptgs1 223 600 3.70 Arpc3 404 171 -2.52 Pros1 201 157 4.01 Ccnd3 335 95 -3.03 Hmga2-ps1 190 77 7.30 Stradb 332 62 -4.07 Pink1 187 55 5.32 Actn1 262 51 -4.69 Bsg 167 254 4.42 Mctp1 250 40 -2.39 Tmem50a 140 157 3.74 St3gal1 207 22 -5.23 Bc031181 132 80 5.16 Mxi1 190 64 -2.64 Zfp664 130 10 8.52 Pdlim7 189 79 -8.70 Rabac1 120 76 5.97 Itgal 173 119 -9.53 Pygb 107 15 4.68 Fyb 167 919 -2.74 Bag1 106 56 4.85 Cd97 165 422 -9.46 Ift20 104 67 7.30 Dstn 145 278 -2.60 Ubash3b 87 55 6.82 Ifitm3 134 1561 -7.31 Slc38a10 82 15 9.04 Cd44 128 181 -10.59 Klhl6 71 37 3.21 Rnf115 125 70 -3.06 Pcp4l1 70 24 10.86 Sh3bgrl 118 64 -5.38 Tmem9b 63 111 5.24 Glipr2 113 49 -7.00 Gsto1 62 30 4.94 Jak2 107 56 -3.28 Uqcrh 61 93 4.77 Isg20 107 40 -5.22 Gimap6 57 29 6.13 Vcl 83 52 -4.73 Capn3 57 101 7.07 Fam63a 82 25 -2.97 Uqcr11 56 41 6.66 Dnase1l1 65 95 -4.78 Atp5b 56 272 3.07 Clec4d 59 114 -14.09 Dhrs3 54 99 3.57 Spnb2 58 71 -3.24 Tal1 53 27 9.93 Diap1 54 31 -2.63 Camk1 53 87 3.37 G6pdx 53 191 -2.63 Csk 51 24 3.71 Hpcal1 53 59 -3.72 All values FPKM except log2(FC): log2(Fold Change) microglia over myeloid cells; MG: microglia; MY: CNS myeloid. p<0.05 as determined by edgeR analysis.
Supporting Table Legends.
Table S1. Top differentially expressed genes during development, related to Fig 4. Top
differentially expressed genes (FDR<0.05) between E17 and P21/P60 microglia (maximally expressed
at FPKM ≥15). All values FPKM, except log2(FC). Abbreviations: -, Tmem119-; log2(FC), log2(Fold
Change between E17 and adult); MY, myeloid cells. *: genes in same genomic region on chromosome
16. See also Table S2.
Table S2. Top 100 enriched over 16-fold between microglia and non-microglia CNS myeloid
cells, related to Fig 4.. Comparison of P21/P60 microglia versus myeloid cells, FDR<0.05. FPKM
except for log2FC. Bold at least 10-fold enriched over other CNS cell types based on (1); *, another
CNS cell type expresses at least 2x higher; Underlined genes up at least 2-fold versus E17, p<0.05
according to edgeR analysis. Abbreviations: log2FC: log2 Fold Change (P21/P60 MG/MY); MG:
Tmem119+ microglia; MY: Tmem119-CD45hiCD11b+ cells.
Table S3. Microglia-enriched gene cassette revealed by unsupervised hierarchical clustering,
related to Fig 4. Tmem119-containing gene cluster obtained by clustering of all microglia and myeloid
expression data with other non-myeloid CNS cell types (1). Abbreviations: MG, microglia; MY,
Tmem119-CD11b+CD45hi cells; log2FC, log2(Fold Change, P60+P21 MG versus MY); PV, p-value;
FDR, false discovery rate; Bold values <0.05 from edgeR.
Table S4. LPS-induced gene expression changes in microglia, related to Fig 4. Top differentially
expressed genes (at least 8-fold difference) between naïve and LPS-treated adult microglia. Except
where noted, numbers are FPKM. -: Tmem119- samples; log2(FC): log2(Fold Change), LPS over P60;
MY: Tmem119-CD45hiCD11b+ myeloid cells; LPS P60: Tmem119+ microglia 24 hours after 5mg/kg IP
lipopolysaccharide injection; Bold, genes that are 2-fold or more reduced with age, E17 to adult; *,
genes that are 2-fold or more upregulated in LPS versus E17; underlined genes are developmentally
upregulated (2-fold or more) for p<0.05 based on edgeR analysis
Table S5. Microglia-enriched receptors, ligands, and transporters, related to Fig 4. All genes were
enriched in microglia over whole brain and/or myeloid cells (p<0.05 edgeR) and at least 2-fold over 3 or
more of the following: neurons, astrocytes, newly formed oligodendrocytes, myelinating
oligodendrocytes, and endothelial cells (from (1)). P60 MG, P60 microglia FPKM. Log2(FC), Log2(Fold
Change Adult MG/Whole Brain). Bold, expressed at or more highly than all other non-myeloid CNS
cells; underlined, enriched also in microglia over myeloid cells. Unlisted binding partners are due to
orphan status. (?), predicted interaction.
Table S6. Disease-associated genes that are microglia enriched, related to Fig 4. Disease-
associated genes (master list generated from MedGen and NINDS A-Z list of diseases) enriched at
least 2-fold compared with 3 or more of the following cells types: neurons, astrocytes, newly formed
oligodendrocytes, myelinating oligodendrocytes, and endothelial cells (from (1)) OR expressed above
FPKM 50. Bold, expressed at or more highly than non-CNS myeloid cells. *, also enriched over whole
brain (p<0.05 edgeR). Underlined, enriched over myeloid cells (p<0.05 edgeR). #, higher in myeloid
cells than other cells. Italics, not enriched but highly expressed. Abbreviations: ALD,
adrenoleukodystrophy; BDMR, brachydactyly-mental retardation; PLOSL, polycystic lipomembranous
osteodysplasia with sclerosing leukoencephalopathy; SCA, spinocerebellar ataxia; ATRX, alpha-
thalassemia/mental retardation; PD, Parkinson disease; AD, Alzheimer disease; LBD, Lewy body
dementia; MRD, mental retardation disorder; MS, multiple sclerosis; NCL, neuronal ceroid
lipofuscinosis; FTD, frontotemporal dementia; CM, Charcot-Marie-Tooth; HDLS, hereditary diffuse
leukoencephalopathy with spheroids.
Table S7. Transcription factors enriched in microglia, related to Fig 5. Microglia-enriched
transcription factors that are at least 2 fold enriched over all non-myeloid CNS cells (1) and over whole
brain (edgeR p<0.05). Bold values are also enriched over myeloid cells as well. Underlined values are
higher in myeloid than microglia.
Table S8. Platelet- and microglia-enriched genes, related to Fig 5. Highly expressed platelet genes
(7), also enriched in microglia (left side) or myeloid cells (right side). All values FPKM except log2(FC):
log2(Fold Change) over myeloid cells or microglia as described; MG: microglia; MY: CNS myeloid.
p<0.05 as determined by edgeR analysis.
Supporting Experimental Procedures
Human studies
All experiments described were performed with normal-appearing lateral temporal cortex
(middle and inferior) removed during anterior temporal lobectomy for hippocampal sclerosis (n=3; 8, 47,
and 51 year old patients) or peripheral tissue from glioblastoma resection (n=2; 45 and 71 year old
patient). Cortical tissue was deemed normal by electroencephalogram (EEG) and magnetic resonance
imaging (MRI). Human total RNA samples for whole brain and peripheral blood mononuclear cells were
purchased (636592; Clontech) and (R1245148; Biochain).
In situ hybridization for candidate and RNAseq validation
Full-length mouse cDNA expression plasmids for Tmem119, Fcrls, Il1a, Cx3cr1, Gpr34, Gpr84,
C1qa, Cd163, P2ry12, P2ry13, Selplg, and Olfml3 (GE Dharmacon) were linearized and transcribed
with T7, Sp6, or T3 RNA polymerases to generate digoxygenin (DIG)- or fluorescein (FITC)-labeled
single-stranded anti-sense riboprobes according to manufacturer’s instructions (11175025910; Roche)
and purified over G-50 columns (GE Healthcare). Fresh frozen 12µm thick PBS-perfused brain
cryosections from P60 (unless otherwise noted) mice were processed as described (1) for two-color
fluorescent in situ hybridization.
Tmem119 monoclonal antibody generation and use
To generate rabbit anti-Tmem119 monoclonal antibodies, we first cloned and produced
recombinant fusion proteins in BL21 DE3 E.Coli. For the intracellular domain (ICD), we PCR-amplified
cDNA corresponding to amino acids 116-280 of mouse Tmem119 from embryonic mouse brain RNA
and cloned it into pGEX-6p-2 expression construct (28-9546-50; GE Healthcare) for cytoplasmic GST-
ICD fusion protein expression. We cloned the extracellular domain (ECD) after the signal peptide
(corresponding residues: 20-89) into a custom pMAL vector for periplasmic MBP-ECD-8xHis fusion
expression (gift from A. Ring, Garcia lab, Stanford, CA). We purified recombinant fusion proteins by
glutathione-sepharose or Ni-NTA columns. Epitomics (Burlingame, CA) immunized 2 rabbits each with
the recombinant ICD or ECD proteins. We tested the sera of the rabbits for specificity by
immunostaining (ICD) mouse brain cryosections or isolated cells (ECD) from WT but not Tmem119 KO
mice. We then tested multiclones and finally monoclonals made from splenocytes in the same way, and
found that clone 28-3 (ICD) and a combination of clones 106-6 and 85-5 (ECD) produced the most
robust, specific staining of microglia. We grew the hybridomas as described (9) and purified antibodies
from the supernatant over Protein G (GE Healthcare). We buffer exchanged into PBS with 0.02% BSA
with 0.04% sodium azide (Sigma).
Immunohistochemistry
For immunostaining tissue sections, tissues were perfusion- (for mouse >E17) or immersion-
fixed (for human and mouse <E17), post-fixed overnight in 4% PFA at 4°C, sunk in 30% sucrose-PBS,
and embedded in OCT (Tissue-Tek). Intraoperative human tissue samples were not perfused, but
otherwise treated identically. Cryosections (8-14µm) were mounted on SuperFrost Plus slides (Fisher),
dried at 60°C for 10 min and rehydrated in PBS. Slides were blocked for 1 hour at room temperature
(RT) in 10% serum in PBSTx (PBS + 0.3-0.5% Triton X) and incubated with primary antibodies diluted
in 1% serum PBSTx overnight at 4°C. Slides were washed and Alexa-conjugated secondaries (Life
Technologies) applied at 1:500 for 2hrs at RT in the dark. Slides were washed and coverslips mounted
with Vectashield with DAPI (Vector Labs). Tmem119 antibodies used were rabbit anti-mouse 28-3
(1ug/mL) and rabbit anti-human Tmem119 (1:100, Abcam). For Ki67 (1ug/mL, eBiosciences)
immunostaining, we first incubated the rehydrated slides with boiling 10mM sodium citrate + 0.05%
Tween 20 pH 6.0 at RT for 30 min, washed the slides well, and proceed with staining as described. To
quench lipofuscin autofluorescence in human sections, slides were treated with 0.3% Sudan Black in
ethanol for 5 min at RT. See Supplemental Experimental Procedures for additional antibodies and
ordering information.
Purification of microglia from rodent brains by FACS
*DO EVERYTHING ON ICE WITH COLD BUFFERS*
Buffers needed:
1. Dounce Buffer: 15mM HEPES (15630-080, Gibco), 0.5% glucose in HBSS (no phenol red, 10x,
14185-052;Gibco).
2. MACS buffer: sterile-filtered 0.5% BSA (bovine serum albumin, A4161; Sigma) + 2mM EDTA
(0.5M EDTA,15575;Gibco) in PBS (diluted from 10x, 70011-044; Gibco)
3. FACS buffer: sterile-filtered 1% FCS (10437-028; Gibco), 2mM EDTA, 25mM HEPES in PBS
(diluted from 10x)
Dissociation:
Each “sample” refers to 1 whole brain for mice ≥P10, 3 whole brains for mice <P10, and 1 litter for E17
mice.
1. For each sample:
a. Add 200µL DNAse (stock is 0.4% DNAse, 12500 units/mL; LS002007; Worthington) and
10µL RNase inhibitor (“RNAsin”; N2615, Promega) to ice-cold dounce buffer.
b. Add 3.6µL RNAsin to 1800µL MACS buffer
2. Sacrifice mice: CO2 for mice >P10, decapitation for P10 and younger.
3. Quickly remove brains and collect each sample in 5mL dounce buffer + DNAse + RNAsin.
4. Homogenize tissue in glass homogenizer (7mL) on ice, 2-3 strokes before pipetting cells in
suspension onto a 70µm cell strainer (Falcon) over a 50mL conical on ice. If needed, dounce
remaining solid mass, stopping every 2-3 strokes to add cells in suspension to cell strainer.
5. Rinse filter with 2 x 1mL dounce buffer, straining cells using the plunger of a 1mL syringe.
6. Aliquot filtered cells into 2mL microcentrifuge tubes.
7. Pellet cells: Centrifuge 30s at 10K RPM (9.3 RFC) at 4°C.
8. Discard supernatant and resuspend cells in 1800µL MACS buffer + RNAsin.
Myelin Removal:
9. Add 200µL resuspended myelin removal beads (130-096-433;Miltenyi Biotec).
10. Mix well with gentle pipetting and split sample into 2 x 2mL microcentrifuge tubes.
11. Incubate 4°C for 10 min.
12. Meanwhile, place 2 LD columns per sample in MACS magnet (130-043-901 LD Columns; 130-
090-976 QuadroMACS Separator; Miltenyi Biotec) and rinse with 2 column volumes (CV) MACS
buffer.
13. Bring volume of tubes with samples to 2mL with MACS buffer.
14. Pellet cells: Centrifuge 30s at 10K RPM (9.3 RCF) at 4°C.
15. Repeat wash 1x (Steps 13+14)
16. Resuspend cells in 2mL MACS buffer per tube.
17. Apply cells from one tube into 1 LD column.
18. Rinse tube with 2mL more MACS buffer and also apply to column.
19. Collect flow through in 50mL conicals on ice.
20. Wash with 2 CV MACS buffer.
21. Aliquot cells into 2mL tubes, pellet, and resuspend in 1mL PBS.
Live/Dead and Cell Staining:
22. Remove 100µL cells for single color controls and increase volume to 1600µL with FACS buffer
and make 5 x 300µL aliquots (CD11b, CD45, Tmem119, secondary only, and unstained
controls).
23. To remaining 900µL sample, add 1µL Far Red Live/Dead (L-3494; Life Technologies) and
incubate in dark at 4°C for 5 min.
24. Rinse sample by bringing volume to 2mL in FACS buffer.
25. Pellet cells.
26. Resuspend Live/Dead treated cells in 310µL FACS buffer.
27. Remove 10µL for each Live/Dead only and FMO (Full Minus One) controls into 290µL FACS
buffer. Remaining sample receives “all” antibodies.
28. Add 5µL Fc receptor block to each tube.
29. To “all” and Tmem119 tubes, add 1ug/mL each 106-6 and 85-5 antibodies.
30. Incubate 10-15 minutes at RT on belly dancer shaker.
31. Meanwhile, add 1:300 each CD11b-BV21, CD45-PE-Cy7, and 1:600 goat anti-rabbit AlexaFluor
488 to FMO and as appropriate to single color tubes.
32. Incubate 10-15 minutes at RT on belly dancer shaker.
33. Wash “all” and Tmem119 tubes by raising volume to 2mL with FACS buffer and pelleting cells.
34. Resuspend in 300µL and add CD11b-BV21, CD45-PE-Cy7 to “all” and goat anti-rabbit
AlexaFluor 488 to both, as above.
35. Incubate 10-15 minutes at RT on belly dancer.
36. Wash all cells 2 x in FACS buffer.
37. Resuspend in 300µL FACS buffer + 1:100 DNAse (79254; QIAGEN) + 1:500 RNAsin.
FACS protocol
38. On BD Aria II sorter, prepare 100µm nozzle, and tube chillers (set to 4’C).
39. After compensation using single color controls, set gates for singlet live cells, using
FSC/SSC/Live-Dead stain properties.
40. Sort using 4-way purity into FACS buffer + RNAsin in low-adhesion microcentrifuge tubes:
(1)Tmem119+ (microglia), (2)Tmem119- CD45lo CD11b+ (“Tmem119- microglia”),
(3)Tmem119- CD45hi CD11b+(“myeloid cells”).
41. Resort cells, this time into TRIzol LS (10296-028, ThermoFisher). Whole organ samples were in
QIAzol Lysis Reagent, 79306;QIAGEN).
RNAseq library construction and sequencing
Total RNA was extracted using the RNeasy micro kit with on-column DNAse treatment, (74004;
QIAGEN) according to manufacturer’s protocol. Quality was assessed by Bioanalyzer (Agilent
Technologies) and samples with RNA integrity >8 were used for library construction. For first and
second-strand cDNA synthesis and SPIA amplification, we used Ovation® RNA-seq system V2 (7102;
Nugen) according to manufacturer’s instructions, and fragmented cDNA with a Covaris S2 sonicator
with: duty cycle 10%, intensity 5, cycles/burst 100, for 5 min. We then used Next Ultra RNAseq library
prep kit for Illumina® (E7530; New England Biolabs) and NEBNext® multiplex oligos for Illumina®
(E7335 & E7500; New England Biolabs) to perform end repair, adaptor ligation and 9 cycles of PCR
enrichment according to manufacturer’s instructions. Library quality was assessed by Bioanalyzer and
qPCR, and high-quality libraries were sequenced by the Illumina® NextSeq sequencer to obtain 75bp
paired-end reads.
RNAseq analysis
Read mapping, transcript assembly, and FPKM estimation:
We used http://usegalaxy.org to run the Tuxedo pipeline. We groomed the concatenated fastq files
using FASTQ groomer (v 1.0.4)(10), aligned reads with Bowtie2 and identify splice junctions with
TopHat, both using TopHat tool (v2.0.14, Galaxy v 0.9) with the following changes to default
parameters: paired end data, mm9 mouse reference genome(11). For expression level estimation, we
used TopHat accepted hits with Cufflinks (v 2.2.1, Galaxy v 2.2.1.0)(12), with the following changes to
default parameters: use reference genome mm9; “Yes” count hits compatible with reference RNAs
only; and “Standard Length Correction” only. We downloaded gene expression (FPKM data) for each
sample and merged these into Table S1.
Differential expression analysis
To calculate fold change differences between samples, we used edgeR as it accounts for biological and
technical variability, using an adapted exact test (akin to Fisher’s but adjusted for overdispersed data).
To generate raw read counts from TopHat accepted hits output, we used featureCounts (13), a
program bundled into the Rsubread package (14). We used the mm9 mouse reference genome and
selected the following options: GTF.featureType=”exon”, GTF.attrType=”gene_id”, isPairedEnd=TRUE.
We then shipped the output tables to edgeR for pairwise comparisons shown in the column titles of
Table S1 (15). For each comparison, we filtered out low sequence tags, which we considered to be
genes for which 2 or more samples had more than 25 counts per million. This corresponded with a
Cufflinks-generated FPKM of approximately 1 for the genes we checked. We merged the output of
these comparisons with the FPKM data as Table S1, with NA representing comparisons that did not
meet our abundance criterion (and thus not considered).
Unsupervised hierarchical clustering for gene “cluster ID”
We clustered genes based on their expression in our RNAseq datasets with our published RNAseq
profiles of other CNS cell types (1). We used the gplots package for R (16), performing gene (row)-
based Pearson clustering with “complete” linkage (maximum dissimilarity), cutting the trees at h/2.5,
where h=height of the final merge. These parameters most faithfully represented the developmental
and cell-type expression patterns of examined microglial genes; additional cuts resulted in smaller, but
less reliable data. The assigned clusters are available in Table S1.
Cluster dendrograms with estimated p-values
Using the PVclust package(6), we clustered data based on Spearman correlation (using the unofficial
version available at www.sigmath.es.osaka-u.ac.jp/shimo-lab/prog/pvclust/) and calculated the
associated p values to determine how individual samples from our datasets and others(4, 7). We
bootstrapped 10000x to arrive at the final p value.
Ingenuity® Pathway Analysis
For pairwise comparisons between E17 and adult microglia, adult microglia and myeloid cells, and
naïve and LPS-treated microglia, we provided FPKM, log2(Fold Change), p-Values and FDRs from
Cufflink and edgeR analyses. We plotted significantly (p<0.01) enriched pathways that were predicted
to be either up- or down-regulated by IPA.
Purification of mouse cells/tissues for qPCR
For qPCR experiments, mouse tissues were prepared by dounce homogenization and filtered
through 20µm Nitex mesh (Lab Pak 03-20/14; Sefar America), except for brain which was myelin
depleted as described and immediately dissociated in Qiazol (whole tissue) or subject to CD45
immunopanning, as described (1) before being scraped into Qiazol. RNA was extracted as described
below.
Purification of CD11b+ cells from human brains by MACS
For human CD11b+ cell enrichment, fresh surgical samples were dounce homogenized and myelin-
depleted as described for the mouse experiments, followed by positive selection using CD11b MACS
beads (130-093-634; Miltenyi). RNA was immediately extracted and analyzed for purity as described for
mouse experiments.
Injury models
Optic Nerve Crush
Retro-orbital optic nerve crushes were performed on 30d or 7 month old female mice anesthetized with
2.5% isofluorane in 2.0L O2 per min. Eyes were cleaned with sterile PBS and cotton swabs. The lateral
rectus muscle of the left eye was exposed by retracting the eyelids with curved fine forceps (11063-07;
Fine Scientific Tools) and partially severed with surgical microscissors (15000-00; Fine Scientific
Tools). Using forceps, the tissues behind the eye were carefully blunt dissected to expose the optic
nerve. The nerve was crushed approximately 2mm distal to the lamina cribrosa for 3-5 sec.
Sciatic nerve crushes
Performed as described (17) in P60 C57BL/6 male WT mice. Spinal cords harvested 3 days post crush.
LPS injections
A single dose of 5mg/kg of lipopolysaccharide (L2880; Sigma) dissolved in normal saline and diluted
into endotoxin-free PBS or endotoxin-free PBS control was administered by intraperitoneal injection to
a mixture of male and female P60 mice. For sequencing experiments, two mice received PBS while
one received no injections.
Bone marrow transplantation
Healthy, P60 mice received 25mg/kg/day injections of busulfan (C6H14632; Sigma) x 5 days, followed
by conditioning with a single 900 rad dose of whole body irradiation (18) and were housed in
autoclaved cages and treated with antibiotics (0.2mg/mL trimethoprim and 1mg/mL sulfamethoxazole in
drinking water given for 2 weeks post-induction). On day 6, isofluorane-anesthetized mice received
retro-orbital injections of 6x10⁶ RBC-lysed bone marrow cells from GFP donor mice, as described (19).
Mice were maintained for 3 or 6 months before tissue harvest.
qPCR and high throughput microfluidic qPCR
We designed and validated all qPCR primers (see Supplemental Experimental Procedures for
all sequences) as follows: using NCBI Primer-BLAST, we designed primers to be approximately 100bp
and span exon-exon junctions when possible. We assessed specificity by qPCR with mouse or human
brain cDNA made from purchased RNA stocks (636610 & 636592; Clontech, respectively) using
SuperScript® VILO™ cDNA Synthesis Kit according to manufacturer’s protocols (11754; Life
Technologies). Quantitative PCR was performed using Fast SYBR Master Mix (4385612; Applied
Biosystems) on a Mastercycler Realplex (Eppendorf) for 40 cycles, followed by melting curve analysis.
Efficient primers that yielded a single product by gel electrophoresis were used.
To assess Tmem119, Cx3cr1, Csf1r, and Cd11b expression levels in mouse and/or human
tissues, we made cDNA as above, and performed qPCR with Fast SYBR Master Mix.
To validate RNAseq results, we designed 38 primer pairs and performed high throughput
microfluidic qRT-PCR with the Fluidigm BioMark system as described (1) but with gene enrichment
calculated relative to Rplp0. We used technical replicates of RNAseq samples, in addition to several
P10 mouse samples we had not sequenced.
For both qPCR methods, relative gene expression values were delta-delta CT method, with
reference to Rplp0. To test statistical significance of observed gene expression differences, we used
ANOVA with post-hoc Tukey’s HSD with the deltaCT values.
Antibodies used
Rat anti-mouse CD16/CD32 (Mouse BD Fc Block™); 1:150 (553142;BD Biosciences)
Goat anti-rabbit AlexaFluor 488 (highly cross-absorbed); 1:600 (A11034; Life Technologies)
Rat anti-mouse and human CD11b Brilliant Violet 421; 1:300 (101251;Biolegend)
Rat anti-mouse CD45 PE-Cy7; 1:300; (25-0451-82; eBiosciences)
Rat anti-Ki67 antibody; 1ug/mL (14-5698-82, eBiosciences)
Rabbit anti-human Tmem119 antibody (AB185333; Abcam)
Goat anti-mouse/human Iba1; 1:500 (AB5076; Abcam)
Rabbit anti-mouse/human Iba1; 1:1500 (019-19741; Wako)
P0 antibody (PZO; Aves Labs)
Mouse strains used
C57BL/6; strain code #027; Charles River. For transplant experiments, maintained in Weissman lab
CX3CR1-GFP; stock #00582; B6.129P-Cx3cr1tm1Litt/J; Jackson Laboratory
CCR2-RFP; stock #017586; B6.129(Cg)-Ccr2tm2.1lfc/J; Jackson Laboratory
Tmem119-KO; strain #032634-UCD; B6; 129S5-Tmem119<tm1Lex>/Mmcd; reanimated from MMRRC
8/2011, since backcrossed fully to C57BL/6N (verified by Max-Bax, Charles River) and maintained in
the Barres lab colony. Available upon request.
C57BL/6-β-actin-EGFP
Imaging and image processing
Epifluorescence images were acquired with Zeiss Axio Imager M1 and Axiovision with 20x 0.8 NA Plan
Apo objective. Confocal images were acquired with a LSM510 or 710 scan head on an Axio Observer
Z1 with either a 40x 0.95 NA or a 63x 1.4 NA objective (all of the above, Carl Zeiss Microscopy).
Images were imported into Fiji Image J or ICY (http://icy.bioimageanalysis.org). Images were adjusted
for brightness and black values; all raw files and notes available upon request. For confocal, images
are presented as maximum intensity projection of a z-stack with 1µm steps. These images were
sometimes additionally “Despeckled” with Fiji to best represent the original. For 3D rendering, z-stacks
with 0.2µm steps were imported into Imaris software (Bitplane).
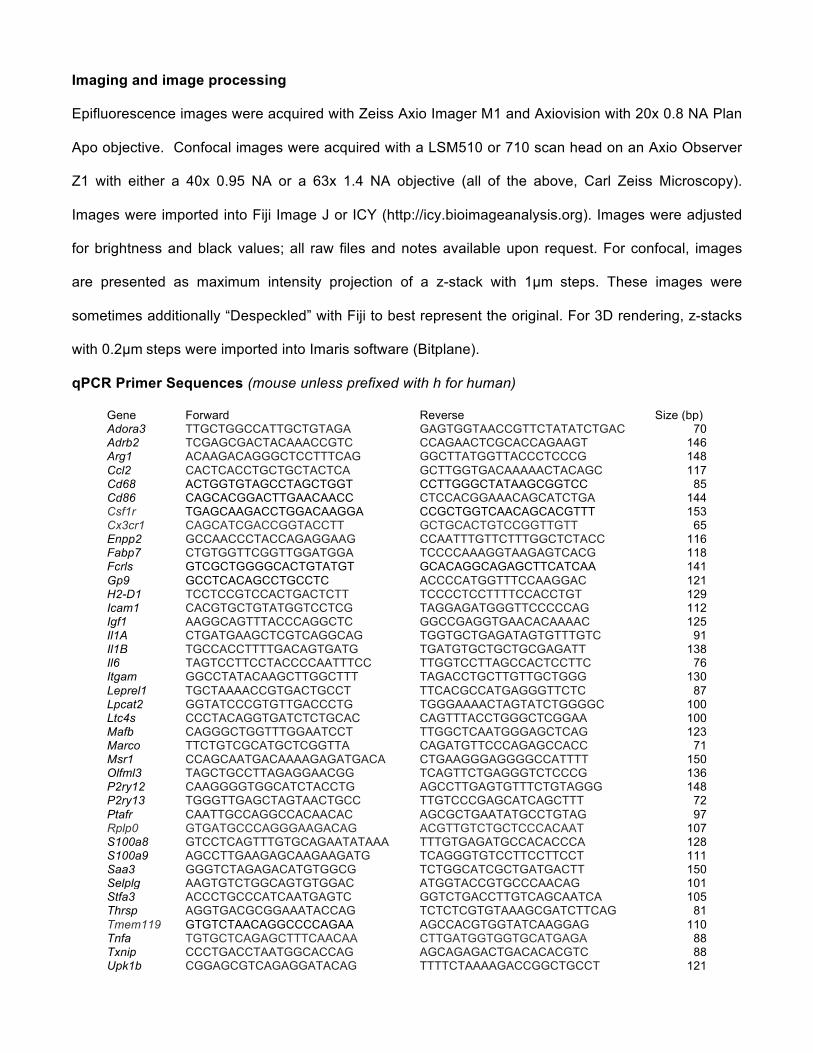
qPCR Primer Sequences (mouse unless prefixed with h for human)
Gene Forward Reverse Size (bp) Adora3 TTGCTGGCCATTGCTGTAGA GAGTGGTAACCGTTCTATATCTGAC 70 Adrb2 TCGAGCGACTACAAACCGTC CCAGAACTCGCACCAGAAGT 146 Arg1 ACAAGACAGGGCTCCTTTCAG GGCTTATGGTTACCCTCCCG 148 Ccl2 CACTCACCTGCTGCTACTCA GCTTGGTGACAAAAACTACAGC 117 Cd68 ACTGGTGTAGCCTAGCTGGT CCTTGGGCTATAAGCGGTCC 85 Cd86 CAGCACGGACTTGAACAACC CTCCACGGAAACAGCATCTGA 144 Csf1r TGAGCAAGACCTGGACAAGGA CCGCTGGTCAACAGCACGTTT 153 Cx3cr1 CAGCATCGACCGGTACCTT GCTGCACTGTCCGGTTGTT 65 Enpp2 GCCAACCCTACCAGAGGAAG CCAATTTGTTCTTTGGCTCTACC 116 Fabp7 CTGTGGTTCGGTTGGATGGA TCCCCAAAGGTAAGAGTCACG 118 Fcrls GTCGCTGGGGCACTGTATGT GCACAGGCAGAGCTTCATCAA 141 Gp9 GCCTCACAGCCTGCCTC ACCCCATGGTTTCCAAGGAC 121 H2-D1 TCCTCCGTCCACTGACTCTT TCCCCTCCTTTTCCACCTGT 129 Icam1 CACGTGCTGTATGGTCCTCG TAGGAGATGGGTTCCCCCAG 112 Igf1 AAGGCAGTTTACCCAGGCTC GGCCGAGGTGAACACAAAAC 125 Il1A CTGATGAAGCTCGTCAGGCAG TGGTGCTGAGATAGTGTTTGTC 91 Il1B TGCCACCTTTTGACAGTGATG TGATGTGCTGCTGCGAGATT 138 Il6 TAGTCCTTCCTACCCCAATTTCC TTGGTCCTTAGCCACTCCTTC 76 Itgam GGCCTATACAAGCTTGGCTTT TAGACCTGCTTGTTGCTGGG 130 Leprel1 TGCTAAAACCGTGACTGCCT TTCACGCCATGAGGGTTCTC 87 Lpcat2 GGTATCCCGTGTTGACCCTG TGGGAAAACTAGTATCTGGGGC 100 Ltc4s CCCTACAGGTGATCTCTGCAC CAGTTTACCTGGGCTCGGAA 100 Mafb CAGGGCTGGTTTGGAATCCT TTGGCTCAATGGGAGCTCAG 123 Marco TTCTGTCGCATGCTCGGTTA CAGATGTTCCCAGAGCCACC 71 Msr1 CCAGCAATGACAAAAGAGATGACA CTGAAGGGAGGGGCCATTTT 150 Olfml3 TAGCTGCCTTAGAGGAACGG TCAGTTCTGAGGGTCTCCCG 136 P2ry12 CAAGGGGTGGCATCTACCTG AGCCTTGAGTGTTTCTGTAGGG 148 P2ry13 TGGGTTGAGCTAGTAACTGCC TTGTCCCGAGCATCAGCTTT 72 Ptafr CAATTGCCAGGCCACAACAC AGCGCTGAATATGCCTGTAG 97 Rplp0 GTGATGCCCAGGGAAGACAG ACGTTGTCTGCTCCCACAAT 107 S100a8 GTCCTCAGTTTGTGCAGAATATAAA TTTGTGAGATGCCACACCCA 128 S100a9 AGCCTTGAAGAGCAAGAAGATG TCAGGGTGTCCTTCCTTCCT 111 Saa3 GGGTCTAGAGACATGTGGCG TCTGGCATCGCTGATGACTT 150 Selplg AAGTGTCTGGCAGTGTGGAC ATGGTACCGTGCCCAACAG 101 Stfa3 ACCCTGCCCATCAATGAGTC GGTCTGACCTTGTCAGCAATCA 105 Thrsp AGGTGACGCGGAAATACCAG TCTCTCGTGTAAAGCGATCTTCAG 81 Tmem119 GTGTCTAACAGGCCCCAGAA AGCCACGTGGTATCAAGGAG 110 Tnfa TGTGCTCAGAGCTTTCAACAA CTTGATGGTGGTGCATGAGA 88 Txnip CCCTGACCTAATGGCACCAG AGCAGAGACTGACACACGTC 88 Upk1b CGGAGCGTCAGAGGATACAG TTTTCTAAAAGACCGGCTGCCT 121
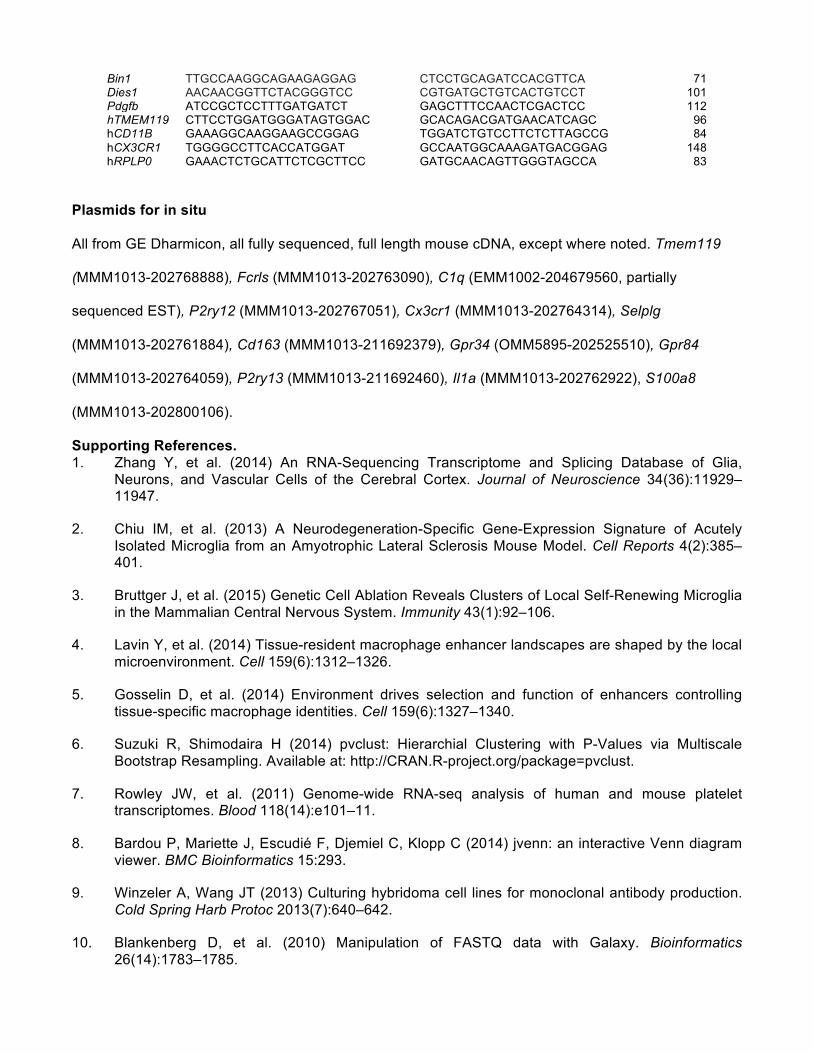
Bin1 TTGCCAAGGCAGAAGAGGAG CTCCTGCAGATCCACGTTCA 71 Dies1 AACAACGGTTCTACGGGTCC CGTGATGCTGTCACTGTCCT 101 Pdgfb ATCCGCTCCTTTGATGATCT GAGCTTTCCAACTCGACTCC 112 hTMEM119 CTTCCTGGATGGGATAGTGGAC GCACAGACGATGAACATCAGC 96 hCD11B GAAAGGCAAGGAAGCCGGAG TGGATCTGTCCTTCTCTTAGCCG 84 hCX3CR1 TGGGGCCTTCACCATGGAT GCCAATGGCAAAGATGACGGAG 148 hRPLP0 GAAACTCTGCATTCTCGCTTCC GATGCAACAGTTGGGTAGCCA 83
Plasmids for in situ
All from GE Dharmicon, all fully sequenced, full length mouse cDNA, except where noted. Tmem119
(MMM1013-202768888), Fcrls (MMM1013-202763090), C1q (EMM1002-204679560, partially
sequenced EST), P2ry12 (MMM1013-202767051), Cx3cr1 (MMM1013-202764314), Selplg
(MMM1013-202761884), Cd163 (MMM1013-211692379), Gpr34 (OMM5895-202525510), Gpr84
(MMM1013-202764059), P2ry13 (MMM1013-211692460), Il1a (MMM1013-202762922), S100a8
(MMM1013-202800106).
Supporting References. 1. Zhang Y, et al. (2014) An RNA-Sequencing Transcriptome and Splicing Database of Glia,
Neurons, and Vascular Cells of the Cerebral Cortex. Journal of Neuroscience 34(36):11929–11947.
2. Chiu IM, et al. (2013) A Neurodegeneration-Specific Gene-Expression Signature of Acutely Isolated Microglia from an Amyotrophic Lateral Sclerosis Mouse Model. Cell Reports 4(2):385–401.
3. Bruttger J, et al. (2015) Genetic Cell Ablation Reveals Clusters of Local Self-Renewing Microglia in the Mammalian Central Nervous System. Immunity 43(1):92–106.
4. Lavin Y, et al. (2014) Tissue-resident macrophage enhancer landscapes are shaped by the local microenvironment. Cell 159(6):1312–1326.
5. Gosselin D, et al. (2014) Environment drives selection and function of enhancers controlling tissue-specific macrophage identities. Cell 159(6):1327–1340.
6. Suzuki R, Shimodaira H (2014) pvclust: Hierarchial Clustering with P-Values via Multiscale Bootstrap Resampling. Available at: http://CRAN.R-project.org/package=pvclust.
7. Rowley JW, et al. (2011) Genome-wide RNA-seq analysis of human and mouse platelet transcriptomes. Blood 118(14):e101–11.
8. Bardou P, Mariette J, Escudié F, Djemiel C, Klopp C (2014) jvenn: an interactive Venn diagram viewer. BMC Bioinformatics 15:293.
9. Winzeler A, Wang JT (2013) Culturing hybridoma cell lines for monoclonal antibody production. Cold Spring Harb Protoc 2013(7):640–642.
10. Blankenberg D, et al. (2010) Manipulation of FASTQ data with Galaxy. Bioinformatics 26(14):1783–1785.
11. Kim D, et al. (2013) TopHat2: accurate alignment of transcriptomes in the presence of insertions, deletions and gene fusions. Genome Biol 14(4):R36.
12. Trapnell C, et al. (2012) Differential gene and transcript expression analysis of RNA-seq experiments with TopHat and Cufflinks. Nat Protoc 7(3):562–578.
13. Liao Y, Smyth GK, Shi W (2014) featureCounts: an efficient general purpose program for assigning sequence reads to genomic features. Bioinformatics 30(7):923–930.
14. Liao Y, Smyth GK, Shi W (2013) The Subread aligner: fast, accurate and scalable read mapping by seed-and-vote. Nucleic Acids Res 41(10):e108.
15. Robinson MD, McCarthy DJ, Smyth GK (2009) edgeR: a Bioconductor package for differential expression analysis of digital gene expression data. Bioinformatics 26(1):139–140.
16. Warnes GR, et al. (2015) gplots: Various R Programming Tools for Plotting Data. GPL–2.
17. Vargas ME, Watanabe J, Singh SJ, Robinson WH, Barres BA (2010) Endogenous antibodies promote rapid myelin clearance and effective axon regeneration after nerve injury. Proceedings of the National Academy of Sciences 107(26):11993–11998.
18. Wilkinson FL, et al. (2013) Busulfan Conditioning Enhances Engraftment of Hematopoietic Donor-derived Cells in the Brain Compared With Irradiation. Mol Ther 21(4):868–876.
19. Morrison SJ, Weissman IL (1994) The long-term repopulating subset of hematopoietic stem cells is deterministic and isolatable by phenotype. Immunity 1(8):661–673.