Supporting Information - Amazon S3 · Ding EL, Dorsey ER, Driscoll T, Edmond K, Ali SE, Engell RE,...
51
Transcript of Supporting Information - Amazon S3 · Ding EL, Dorsey ER, Driscoll T, Edmond K, Ali SE, Engell RE,...

GSINGH
Typewritten Text
Supporting Information
GSINGH
Typewritten Text
GSINGH
Typewritten Text
Appendix A
Statistical methods
Despite efforts to collect as complete and comprehensive data as possible on global consumption levels
of SSBs, fruit juices, milk, and calcium, data in some countries were not available. To account for these
missing data, we used an age-integrating Bayesian hierarchial model, DisMod3, developed as part of the
Global Burden of Disease 2010 project (1). This model pooled data from multiple sources and modeled
missing data using informative time-varying covariates, borrowing information across geographical
region and time period while also incorporating uncertainty due to measurement error and model
specification. The model was fit using a randomized Markov Chain Monte Carlo (MCMC) algorithm
based on the Adaptive Metropolis step function and estimated fixed effects for study-specific and
national-level covariates and random effects for GBD region and country. The MCMC was implemented
in the PyMC Python module(2) to generate 1000 draws of dietary intake for each country-age-sex strata
after discarding iterations from the burn-in convergence period. Goodness-of-fit was assessed using a
hold-out cross-validation approach, as described elsewhere (1, 3, 4). Across all 1000 simulations for a
given country, year, sex combination, we used the median value and 2.5 and 97.5 percentile of each set
of draws of dietary intake as the estimate and the upper and lower confidence intervals for this
outcome. The model outputs estimates of dietary intakes for both men and women in single year age
groups for 1990 and 2010 for 187 countries worldwide.
Both study-specific and national-level covariates were included in the model. The study-specific
covariates accounted for inconsistencies in the raw data; for example, data that are subnational (rather
than nationally representative), or data collected using less-optimal methods. These study-specific
covariates are indicator variables used in the model to adjust data collected using less-optimal methods
to the level consistent with those of the gold standard data. For sugar-sweetened beverages, three

study-specific indicator variables were used to indicate the quality of measurement method and the
national representativeness of the data. In collecting dietary data, diet records, recalls, and FFQs
provided estimates of individual-level consumption and are therefore the gold-standard methods, while
household availability/budget surveys estimate food intake/expenditure at the household level and are
therefore less-optimal. The first study-specific variable indicates whether the data were collected using
the optimal methods of diet records, recalls, or FFQs or the sub-optimal methods of household
availability/budget surveys. The second study-specific variable denotes whether the data were collected
based on the optimal definition of the exposure: total intake of any sugar-sweetened beverage with ≥50
kcal per 8 oz (226.8 grams) serving, including carbonated beverages, soft drinks, sodas, energy drinks,
fruit drinks etc.) or a suboptimal metric. The third is an indicator variable for whether the data are from
non-nationally-representative studies/surveys. In addition, we allowed the variance of sub-national-level
data to be different from nationally-representative data.
Country-level data on food availability was used in the model to inform the global and country-
level trends. We used data from the Food Balance Sheets of the Food and Agriculture Organization of
the United Nations (FAO) which captures a country’s annual food availability for human consumption
based on reported local production, imports, and exports, adjusted for other uses (livestock, seed) (5).
We used the FAO food balance sheets to construct a variable that measures the annual food availability
per capita for sugars, by combining: sugar and sweeteners, sugar (raw equivalent), sugar beet, sugar
cane, non-centrifugal sugar, and sugarcrops. Table S1 presents the effect size estimated for the study-
level and national covariates from the DisMod3 model. Figure S1 provides an example of DisMod3
region-level outputs.

Appendix A Table 1. Effect sizes and standard errors for study-level and national covariates
Covariate Effect size mean
Effect size SE
Study level covariates Suboptimal dietary assessment method 0.001 0.096 Suboptimal exposure definition 0.213 0.278 Non-nationally representative data 0.459 0.086 Sex 0.088 0.029
National covariates Log per capita sugar availability based on FAO data 0.789 0.123

Appendix A Figure. Graphical representation and explanation of region-level outputs of the Bayesian hierarchical model. Results for women in the high-income Asia Pacific region in 2010 are shown as an example.
References:
1. Lim SS, Vos T, Flaxman AD, Danaei G, Shibuya K, Adair-Rohani H, Amann M, Anderson HR,Andrews KG, Aryee M, Atkinson C, Bacchus LJ, Bahalim AN, Balakrishnan K, Balmes J, Barker-Collo S, Baxter A, Bell ML, Blore JD, Blyth F, Bonner C, Borges G, Bourne R, Boussinesq M, Brauer M, Brooks P, Bruce NG, Brunekreef B, Bryan-Hancock C, Bucello C, Buchbinder R, Bull F, Burnett RT, Byers TE, Calabria B, Carapetis J, Carnahan E, Chafe Z, Charlson F, Chen H, Chen JS, Cheng AT, Child JC, Cohen A, Colson KE, Cowie BC, Darby S, Darling S, Davis A, Degenhardt L, Dentener F, Des Jarlais DC, Devries K, Dherani M, Ding EL, Dorsey ER, Driscoll T, Edmond K, Ali SE, Engell RE, Erwin PJ, Fahimi S, Falder G, Farzadfar F, Ferrari A, Finucane MM, Flaxman S, Fowkes FG, Freedman G, Freeman MK, Gakidou E, Ghosh S, Giovannucci E, Gmel G, Graham K, Grainger R, Grant B, Gunnell D, Gutierrez HR, Hall W, Hoek HW, Hogan A, Hosgood HD, 3rd, Hoy D, Hu H, Hubbell BJ, Hutchings SJ, Ibeanusi SE, Jacklyn GL, Jasrasaria R, Jonas JB, Kan H, Kanis JA, Kassebaum N, Kawakami N, Khang YH, Khatibzadeh S, Khoo JP, Kok C, Laden F, Lalloo R, Lan Q, Lathlean T, Leasher JL, Leigh J, Li Y, Lin JK, Lipshultz SE, London S, Lozano R, Lu Y, Mak J, Malekzadeh R, Mallinger L, Marcenes W, March L, Marks R, Martin R, McGale P, McGrath J, Mehta S, Mensah GA, Merriman TR, Micha R, Michaud C, Mishra V, Mohd Hanafiah K, Mokdad AA, Morawska L, Mozaffarian D, Murphy T, Naghavi M, Neal B, Nelson PK, Nolla JM, Norman R, Olives C, Omer SB, Orchard J, Osborne R, Ostro B, Page A, Pandey KD, Parry CD, Passmore E, Patra J, Pearce N, Pelizzari PM, Petzold M, Phillips MR, Pope D, Pope CA, 3rd, Powles J, Rao M, Razavi H, Rehfuess EA, Rehm JT, Ritz B, Rivara FP, Roberts T, Robinson C, Rodriguez-Portales JA, Romieu I, Room R, Rosenfeld LC, Roy A, Rushton L, Salomon JA, Sampson U, Sanchez-Riera L, Sanman E, Sapkota A, Seedat S, Shi P, Shield K, Shivakoti R, Singh GM, Sleet DA, Smith E, Smith KR, Stapelberg NJ, Steenland K, Stockl H, Stovner LJ, Straif K, Straney L, Thurston GD, Tran JH, Van Dingenen R, van Donkelaar A, Veerman JL, Vijayakumar L, Weintraub R, Weissman MM, White RA, Whiteford H, Wiersma ST, Wilkinson JD, Williams HC, Williams W, Wilson N, Woolf AD, Yip P, Zielinski JM, Lopez AD, Murray CJ, Ezzati M, AlMazroa MA, Memish ZA. A comparative risk assessment of burden of disease and injury attributable to 67 risk factors and risk factor clusters in 21 regions, 1990-2010: a systematic analysis for the Global Burden of Disease Study 2010. Lancet. 2012;380(9859):2224-60. Epub 2012/12/19. doi: 10.1016/s0140-6736(12)61766-8. PubMed PMID: 23245609. 2. Patil A, Huard D, C F. PyMC: Markov Chain Monte Carlo for Python, version 2.0. Journal ofStatistical Software. 3. Micha R, Khatibzadeh S, Shi P, Fahimi S, Lim S, Andrews KG, Engell RE, Powles J, Ezzati M,Mozaffarian D. Global, regional, and national consumption levels of dietary fats and oils in 1990 and 2010: a systematic analysis including 266 country-specific nutrition surveys. BMJ (Clinical research ed). 2014;348:g2272. Epub 2014/04/17. doi: 10.1136/bmj.g2272. PubMed PMID: 24736206; PMCID: 3987052. 4. Powles J, Fahimi S, Micha R, Khatibzadeh S, Shi P, Ezzati M, Engell RE, Lim SS, Danaei G,Mozaffarian D. Global, regional and national sodium intakes in 1990 and 2010: a systematic analysis of 24 h urinary sodium excretion and dietary surveys worldwide. BMJ open. 2013;3(12):e003733. Epub 2013/12/25. doi: 10.1136/bmjopen-2013-003733. PubMed PMID: 24366578; PMCID: 3884590. 5. FAO. U.N. Food and Agriculture Organization Food Balance Sheets.http://faostatfaoorg/site/354/defaultaspx. 2013.
0.5
1.0
1.5
2.0
Asia−Pacific high−income
Asia, Central
Asia, East
Asia, South
Asia, Southeast
Australasia
Caribbean
Europe, Central
Europe, Eastern
Europe, Western
Latin America, Andean
Latin America, Central
Latin America, Southern
Latin America, Tropical
North Africa and Middle East
North America high−income
Oceania
Sub−Saharan Africa, Central
Sub−Saharan Africa, East
Sub−Saharan Africa, Southern
Sub−Saharan Africa, West
Women
SSB intake (servings/day)
●
●
●
●
●
●
●
●
●
●
●
●
●
●
●
●
●
●
●
●
●
●
●
●
●
●
●
●
●
●
●
●
●
●
●
●
●
●
●
●
●
●
●
●
19902010
0.5
1.0
1.5
2.0
Asia−Pacific high−income
Asia, Central
Asia, East
Asia, South
Asia, Southeast
Australasia
Caribbean
Europe, Central
Europe, Eastern
Europe, Western
Latin America, Andean
Latin America, Central
Latin America, Southern
Latin America, Tropical
North Africa and Middle East
North America high−income
Oceania
Sub−Saharan Africa, Central
Sub−Saharan Africa, East
Sub−Saharan Africa, Southern
Sub−Saharan Africa, West
Men
SSB intake (servings/day)
●
●
●
●
●
●
●
●
●
●
●
●
●
●
●
●
●
●
●
●
●
●
●
●
●
●
●
●
●
●
●
●
●
●
●
●
●
●
●
●
●
●
●
●
19902010
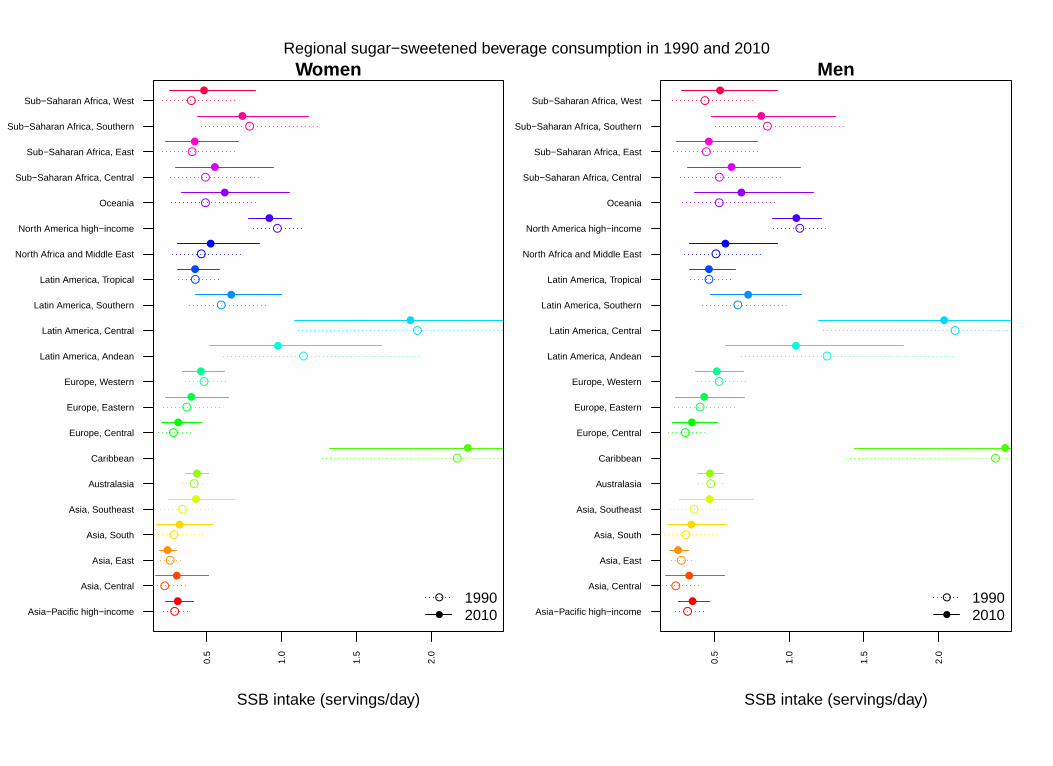
Regional sugar−sweetened beverage consumption in 1990 and 2010
GSINGH
Typewritten Text
Figure A

Figure B: Mean milk consumption and mean BMI by age group for adults over age 20 in 1990 and 2010.
1990
2010

1990
2010
Figure C: Mean fruit juice consumption and mean BMI by age group for adults over age 20 in 1990 and 2010.

●●
●
●
●●
●
●
●●
●
●
●●
●●
●●
●●
●●
●●
●●
●●
●●
●●
●●
●●
●●
●●
●●
●●
●●
●●
0.0
0.5
1.0
1.5
SS
B c
onsu
mpt
ion
(ser
ving
s/da
y) ●
●
●
●
●
High incomeUpper−middle incomeLower−middle incomeLow income
20−39 40−59 60−79 80 +
●
●●
●
●
●●
●●
●●
●
●
●●
●
●
●●
●●
●●
●
●
●●
●
●
●●
●●
●●
●
●
●●
●
●
●
●
●●
●●
●
0.0
0.5
1.0
1.5
Milk
con
sum
ptio
n (s
ervi
ngs/
day)
● ●
●
●
●
High incomeUpper−middle incomeLower−middle incomeLow income
20−39 40−59 60−79 80 +
●
●
●
●
●
●
●
●
●
●
●
●
●
●
●●
●
●
●●
●
●
●●
●
●
●●
●
●
●●
●
●
●●
●
●
●●
●
●
●●
●
●
●●
0.0
0.5
1.0
1.5
Fru
it ju
ice
cons
umpt
ion
(ser
ving
s/da
y)
●
● ● ●
●
High incomeUpper−middle incomeLower−middle incomeLow income
20−39 40−59 60−79 80 +
Consumption of sugar−sweetened beverages, milk, and fruit juice by country income categoryMen
Age range (years)
GSINGH
Typewritten Text
A
GSINGH
Typewritten Text
B
GSINGH
Typewritten Text
C
GSINGH
Rectangle
GSINGH
Typewritten Text
Figure D
GSINGH
Typewritten Text

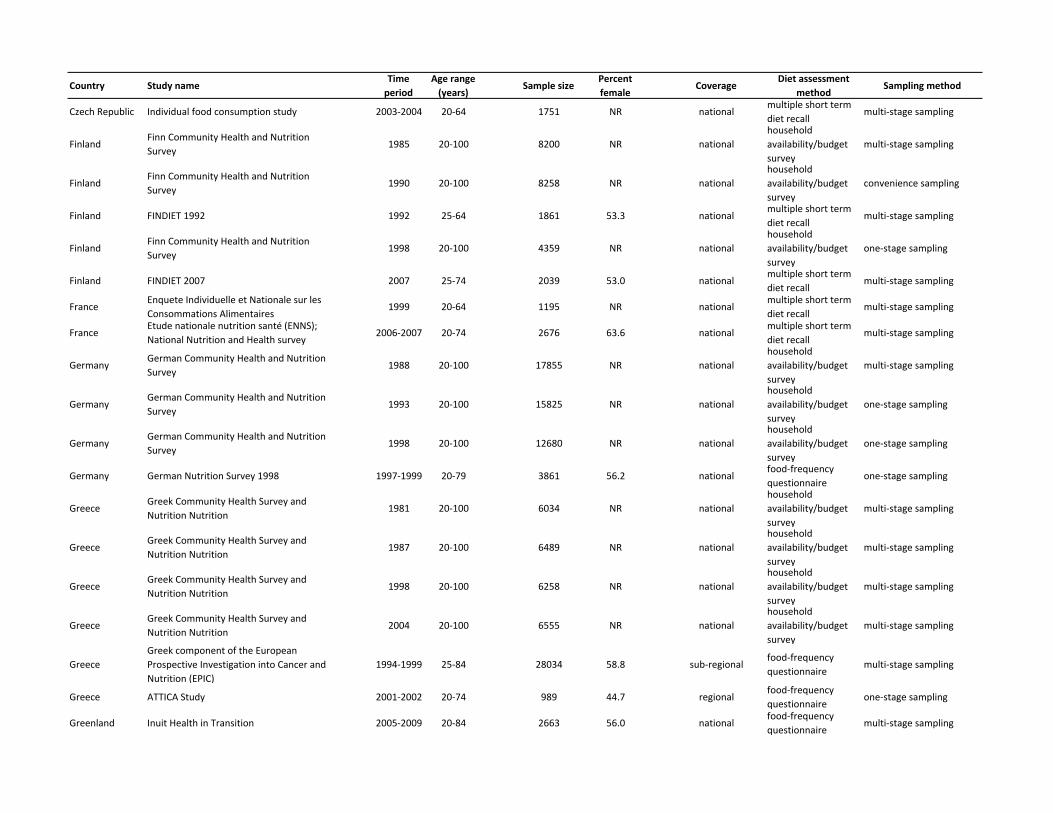
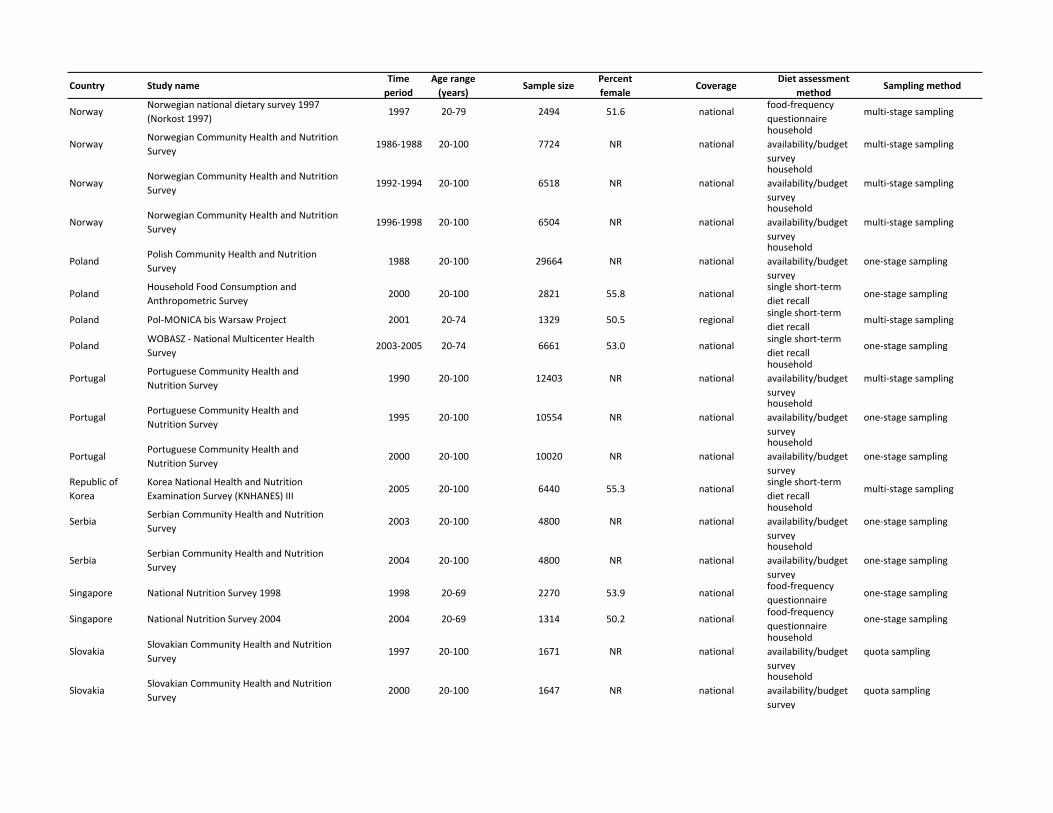
Table A: Characteristics of data sources on sugar‐sweetened beverage intake.
Country Study nameTime period
Age range (years)
Sample sizePercent female
CoverageDiet assessment
methodSampling method
ArgentinaEncuesta Nacional de Nutrición y Salud ‐ National Nutrition and Health Survey (ENNyS)
2004‐2005 20‐49 4429 100.0 nationalsingle short‐term diet recall
multi‐stage sampling
Australia National Nutrition Survey 1995‐1996 20‐100 10851 53.2 nationalsingle short‐term diet recall
multi‐stage sampling
AustriaAustrian Community Health and Nutrition Survey
1999 20‐100 7098 NR nationalhousehold availability/budget survey
multi‐stage sampling
Austria Austrian Study on Nutritional Status 2005‐2006 20‐64 2123 NR nationalsingle short‐term diet recall
multi‐stage sampling
BarbadosIdentifying new genetic and obesity‐related factors contributing to prostate and breast cancer risk in persons of African descent
2004‐2007 42‐88 279 45.5 nationalfood‐frequency questionnaire
one‐stage sampling
BelgiumBelgian Community Health and Nutrition Survey
1999 20‐100 3745 NR nationalhousehold availability/budget survey
multi‐stage sampling
Belgium Belgian National Food Consumption Survey 2004 20‐100 2240 49.4 nationalmultiple short term diet recall
multi‐stage sampling
BelgiumBelgian Community Health and Nutrition Survey
1987‐1988 20‐100 3235 NR nationalhousehold availability/budget survey
multi‐stage sampling
BelgiumBelgian Community Health and Nutrition Survey
1996‐1997 20‐100 2041 NR nationalhousehold availability/budget survey
multi‐stage sampling
Brazil Household Health Survey (ISA‐SP) 2003 20‐100 57 47.4 regionalsingle short‐term diet recall
multi‐stage sampling
Bulgaria National Nutrition Survey 2004 20‐75 853 51.9 nationalsingle short‐term diet recall
one‐stage sampling
CanadaCanadian Community Health and Nutrition Survey
2004 20‐101 19728 55.6 nationalmultiple short term diet recall
one‐stage sampling
China2002 China National Nutrition and Health Survey
2002 20‐101 49071 52.8 nationalfood‐frequency questionnaire
one‐stage sampling
ColombiaDatabase from National survey of nutritional situation in Colombia
2005 20‐64 11409 53.5 nationalmultiple short term diet recall
one‐stage sampling
CroatiaCroatian Community Health and Nutrition Survey
1999 20‐100 2937 NR nationalhousehold availability/budget survey
multi‐stage sampling
CroatiaCroatian Community Health and Nutrition Survey
2004 20‐100 2847 NR nationalhousehold availability/budget survey
multi‐stage sampling
CyprusCypriot Community Health and Nutrition Survey
2003 20‐100 2990 NR nationalhousehold availability/budget survey
convenience sampling
CyprusCypriot Community Health and Nutrition Survey
1996‐1997 20‐100 3308 NR nationalhousehold availability/budget survey
multi‐stage sampling
Country Study nameTime period
Age range (years)
Sample sizePercent female
CoverageDiet assessment
methodSampling method
Czech Republic Individual food consumption study 2003‐2004 20‐64 1751 NR nationalmultiple short term diet recall
multi‐stage sampling
FinlandFinn Community Health and Nutrition Survey
1985 20‐100 8200 NR nationalhousehold availability/budget survey
multi‐stage sampling
FinlandFinn Community Health and Nutrition Survey
1990 20‐100 8258 NR nationalhousehold availability/budget survey
convenience sampling
Finland FINDIET 1992 1992 25‐64 1861 53.3 nationalmultiple short term diet recall
multi‐stage sampling
FinlandFinn Community Health and Nutrition Survey
1998 20‐100 4359 NR nationalhousehold availability/budget survey
one‐stage sampling
Finland FINDIET 2007 2007 25‐74 2039 53.0 nationalmultiple short term diet recall
multi‐stage sampling
FranceEnquete Individuelle et Nationale sur les Consommations Alimentaires
1999 20‐64 1195 NR nationalmultiple short term diet recall
multi‐stage sampling
FranceEtude nationale nutrition santé (ENNS); National Nutrition and Health survey
2006‐2007 20‐74 2676 63.6 nationalmultiple short term diet recall
multi‐stage sampling
GermanyGerman Community Health and Nutrition Survey
1988 20‐100 17855 NR nationalhousehold availability/budget survey
multi‐stage sampling
GermanyGerman Community Health and Nutrition Survey
1993 20‐100 15825 NR nationalhousehold availability/budget survey
one‐stage sampling
GermanyGerman Community Health and Nutrition Survey
1998 20‐100 12680 NR nationalhousehold availability/budget survey
one‐stage sampling
Germany German Nutrition Survey 1998 1997‐1999 20‐79 3861 56.2 nationalfood‐frequency questionnaire
one‐stage sampling
GreeceGreek Community Health Survey and Nutrition Nutrition
1981 20‐100 6034 NR nationalhousehold availability/budget survey
multi‐stage sampling
GreeceGreek Community Health Survey and Nutrition Nutrition
1987 20‐100 6489 NR nationalhousehold availability/budget survey
multi‐stage sampling
GreeceGreek Community Health Survey and Nutrition Nutrition
1998 20‐100 6258 NR nationalhousehold availability/budget survey
multi‐stage sampling
GreeceGreek Community Health Survey and Nutrition Nutrition
2004 20‐100 6555 NR nationalhousehold availability/budget survey
multi‐stage sampling
GreeceGreek component of the European Prospective Investigation into Cancer and Nutrition (EPIC)
1994‐1999 25‐84 28034 58.8 sub‐regionalfood‐frequency questionnaire
multi‐stage sampling
Greece ATTICA Study 2001‐2002 20‐74 989 44.7 regionalfood‐frequency questionnaire
one‐stage sampling
Greenland Inuit Health in Transition 2005‐2009 20‐84 2663 56.0 nationalfood‐frequency questionnaire
multi‐stage sampling

Country Study nameTime period
Age range (years)
Sample sizePercent female
CoverageDiet assessment
methodSampling method
HungaryHungarian Community Health and Nutrition Survey
1991 20‐100 11813 NR nationalhousehold availability/budget survey
one‐stage sampling
Hungary The 3rd National Hungarian Survey 2003‐2004 20‐64 927 NR nationalmultiple short term diet recall
multi‐stage sampling
Iceland Dietary Survey of the Icelanders 1990 20‐80 1095 51.5 nationalsingle short‐term diet recall
one‐stage sampling
IcelandThe Diet of Icelanders, Dietary Survey of The Icelandic Nutrition Council 2002
2002 20‐80 1118 53.8 nationalfood‐frequency questionnaire
one‐stage sampling
IranNon‐communicable disease surveillance in Islamic Republic of Iran
2005 20‐64 72717 50.1 nationalsingle short‐term diet recall
multi‐stage sampling
IranComprehensive National Household Food Consumption Survey
1990‐1995 20‐100 69 NR nationalmultiple short term diet recall
multi‐stage sampling
IrelandIrish Community Health and Nutrition Survey
1987 20‐100 7705 NR nationalhousehold availability/budget survey
multi‐stage sampling
IrelandIrish Community Health and Nutrition Survey
1994 20‐100 7877 NR nationalhousehold availability/budget survey
multi‐stage sampling
IrelandIrish Community Health and Nutrition Survey
1999 20‐100 7644 NR nationalhousehold availability/budget survey
multi‐stage sampling
IrelandNorth South Ireland Food Consumption Survey (NSIFCS)
1997‐1999 20‐64 1373 NR nationalmultiple short term diet recall
multi‐stage sampling
IsraelMabat First Israeli National Health and Nutrition Survey
1999‐2001 25‐34 3240 52.5 nationalsingle short‐term diet recall
multi‐stage sampling
IsraelMabat National Health and Nutrition Survey of the Elderly ( Zahav)
2005‐2006 65‐74 1782 53.3 nationalsingle short‐term diet recall
multi‐stage sampling
ItalyItalian Community Health and Nutrition Survey
1990 20‐100 33172 NR nationalhousehold availability/budget survey
multi‐stage sampling
ItalyItalian Community Health and Nutrition Survey
1993 20‐100 34273 NR nationalhousehold availability/budget survey
multi‐stage sampling
ItalyItalian Community Health and Nutrition Survey
1996 20‐100 22740 NR nationalhousehold availability/budget survey
multi‐stage sampling
Italy INN‐CA 1994‐96 1994‐1996 20‐100 1617 55.5 nationalmultiple short term diet recall
multi‐stage sampling
Italy INRAN‐SCAI 2005‐06 2005‐2006 20‐100 2777 55.4 nationalmultiple short term diet recall
multi‐stage sampling
JamaicaSocial and dietary determinants of body max index of adult Jamaicans
1993‐1995 25‐74 922 60.7 nationalfood‐frequency questionnaire
multi‐stage sampling
Japan National Nutrition Survey (in Japan) 1995 20‐100 10766 53.8 nationalsingle short‐term diet recall
multi‐stage sampling
Japan National Nutrition Survey (in Japan) 1998 20‐100 10917 53.6 nationalsingle short‐term diet recall
multi‐stage sampling
JapanThe Japan Public Health Center‐based Prospective Study (JPHC Study)
1995‐1998 45‐74 97768 53.4 sub‐regionalfood‐frequency questionnaire
multi‐stage sampling

Country Study nameTime period
Age range (years)
Sample sizePercent female
CoverageDiet assessment
methodSampling method
JapanThe Japan Public Health Center‐based Prospective Study (JPHC Study)
2000‐2003 50‐79 92302 53.3 sub‐regionalfood‐frequency questionnaire
multi‐stage sampling
LatviaLatvian Community Health and Nutrition Survey
2002 20‐100 3949 NR nationalhousehold availability/budget survey
multi‐stage sampling
LatviaLatvian Community Health and Nutrition Survey
2003 20‐100 3631 NR nationalhousehold availability/budget survey
one‐stage sampling
LatviaLatvian Community Health and Nutrition Survey
2004 20‐100 3913 NR nationalhousehold availability/budget survey
one‐stage sampling
Lebanon
National survey: Behavioral risk factor survey, Lebanon: Comparison estimates based on cell phone interviews with face‐to face interviews. Nutrition Component: Socioeconomic and dietary determinants of obesity in Lebanon
2008‐2009 20‐100 2592 53.4 nationalfood‐frequency questionnaire
one‐stage sampling
LuxambourgLuxembourgian Community Health and Nutrition Survey
1993 20‐100 3008 NR nationalhousehold availability/budget survey
multi‐stage sampling
Malaysia Malaysian Adult Nutrition Survey 2003 2002‐2003 20‐59 6857 51.7 nationalfood‐frequency questionnaire
one‐stage sampling
MaltaMaltese Community Health and Nutrition Survey
1994 20‐100 2722 NR nationalhousehold availability/budget survey
quota sampling
MaltaMaltese Community Health and Nutrition Survey
1995 20‐100 2748 NR nationalhousehold availability/budget survey
multi‐stage sampling
MaltaMaltese Community Health and Nutrition Survey
2000 20‐100 2586 NR nationalhousehold availability/budget survey
multi‐stage sampling
MexicoNational Health and Nutrition Survey 2006 ( Mexico)
2005‐2006 20‐59 15186 62.5 nationalfood‐frequency questionnaire
multi‐stage sampling
MontenegroMontenegrin Community Health and Nutrition Survey
2003 20‐100 380 NR nationalhousehold availability/budget survey
multi‐stage sampling
MontenegroMontenegrin Community Health and Nutrition Survey
2004 20‐100 380 NR nationalhousehold availability/budget survey
one‐stage sampling
Netherlands Dutch National Food Consumption Survey 1992 20‐92 2426 NR nationalmultiple short term diet recall
multi‐stage sampling
Netherlands Dutch National Food Consumption Survey 2003 20‐31 591 44.8 nationalmultiple short term diet recall
multi‐stage sampling
Netherlands Dutch National Food Consumption Survey 1987‐1988 20‐82 4112 53.9 nationalmultiple short term diet recall
multi‐stage sampling
Netherlands Dutch National Food Consumption Survey 1997‐1998 20‐89 4612 55.1 nationalmultiple short term diet recall
multi‐stage sampling
New Zealand NZ National Nutrition Survey 1997 1997 20‐100 4289 58.7 nationalfood‐frequency questionnaire
one‐stage sampling
Country Study nameTime period
Age range (years)
Sample sizePercent female
CoverageDiet assessment
methodSampling method
NorwayNorwegian national dietary survey 1997 (Norkost 1997)
1997 20‐79 2494 51.6 nationalfood‐frequency questionnaire
multi‐stage sampling
NorwayNorwegian Community Health and Nutrition Survey
1986‐1988 20‐100 7724 NR nationalhousehold availability/budget survey
multi‐stage sampling
NorwayNorwegian Community Health and Nutrition Survey
1992‐1994 20‐100 6518 NR nationalhousehold availability/budget survey
multi‐stage sampling
NorwayNorwegian Community Health and Nutrition Survey
1996‐1998 20‐100 6504 NR nationalhousehold availability/budget survey
multi‐stage sampling
PolandPolish Community Health and Nutrition Survey
1988 20‐100 29664 NR nationalhousehold availability/budget survey
one‐stage sampling
PolandHousehold Food Consumption and Anthropometric Survey
2000 20‐100 2821 55.8 nationalsingle short‐term diet recall
one‐stage sampling
Poland Pol‐MONICA bis Warsaw Project 2001 20‐74 1329 50.5 regionalsingle short‐term diet recall
multi‐stage sampling
PolandWOBASZ ‐ National Multicenter Health Survey
2003‐2005 20‐74 6661 53.0 nationalsingle short‐term diet recall
one‐stage sampling
PortugalPortuguese Community Health and Nutrition Survey
1990 20‐100 12403 NR nationalhousehold availability/budget survey
multi‐stage sampling
PortugalPortuguese Community Health and Nutrition Survey
1995 20‐100 10554 NR nationalhousehold availability/budget survey
one‐stage sampling
PortugalPortuguese Community Health and Nutrition Survey
2000 20‐100 10020 NR nationalhousehold availability/budget survey
one‐stage sampling
Republic of Korea
Korea National Health and Nutrition Examination Survey (KNHANES) III
2005 20‐100 6440 55.3 nationalsingle short‐term diet recall
multi‐stage sampling
SerbiaSerbian Community Health and Nutrition Survey
2003 20‐100 4800 NR nationalhousehold availability/budget survey
one‐stage sampling
SerbiaSerbian Community Health and Nutrition Survey
2004 20‐100 4800 NR nationalhousehold availability/budget survey
one‐stage sampling
Singapore National Nutrition Survey 1998 1998 20‐69 2270 53.9 nationalfood‐frequency questionnaire
one‐stage sampling
Singapore National Nutrition Survey 2004 2004 20‐69 1314 50.2 nationalfood‐frequency questionnaire
one‐stage sampling
SlovakiaSlovakian Community Health and Nutrition Survey
1997 20‐100 1671 NR nationalhousehold availability/budget survey
quota sampling
SlovakiaSlovakian Community Health and Nutrition Survey
2000 20‐100 1647 NR nationalhousehold availability/budget survey
quota sampling

Country Study nameTime period
Age range (years)
Sample sizePercent female
CoverageDiet assessment
methodSampling method
SlovakiaSlovakian Community Health and Nutrition Survey
2003 20‐100 1645 NR nationalhousehold availability/budget survey
quota sampling
SlovakiaMonitoring of the nutritional status of particular groups of adult population
2006 20‐54 2208 NR nationalsingle short‐term diet recall
multi‐stage sampling
SloveniaSlovenian Community Health and Nutrition Survey
1998 20‐100 4979 NR nationalhousehold availability/budget survey
multi‐stage sampling
SloveniaSlovenian Community Health and Nutrition Survey
2000 20‐100 4904 NR nationalhousehold availability/budget survey
one‐stage sampling
SloveniaSlovenian Community Health and Nutrition Survey
2002 20‐100 3687 NR nationalhousehold availability/budget survey
one‐stage sampling
South AfricaFood and nutrient availability in South African Households
1995 20‐99 918 54.7 nationalfood‐frequency questionnaire
one‐stage sampling
SpainSpanish Community Health and Nutrition Survey
1980‐1981 20‐100 30331 NR nationalhousehold availability/budget survey
one‐stage sampling
SpainSpanish Community Health and Nutrition Survey
1990‐1991 20‐100 30331 NR nationalhousehold availability/budget survey
one‐stage sampling
SpainSpanish Community Health and Nutrition Survey
1998‐1999 20‐100 14644 NR nationalhousehold availability/budget survey
multi‐stage sampling
Sri Lanka
Abdominal obesity and its association with selected risk factors of coronary heart disease in an adult population in the district of Colombo; MD Thesis, University of Colombo, Sri Lanka
2004 20‐64 1400 48.6 regionalfood‐frequency questionnaire
multi‐stage sampling
SwedenDietary habits and nutrient intake in Sweden 1989
1989 20‐74 1513 50.9 nationalsingle short‐term diet recall
multi‐stage sampling
SwedenSwedish Community Health and Nutrition Survey
1989 20‐100 2970 NR nationalhousehold availability/budget survey
multi‐stage sampling
SwedenSwedish Community Health and Nutrition Survey
1996 20‐74 2026 NR nationalhousehold availability/budget survey
multi‐stage sampling
SwedenDietary habits and nutrient intake in Sweden 1997‐98
1997‐1998 20‐79 1173 51.8 nationalsingle short‐term diet recall
multi‐stage sampling
Switzerland Etude Bus Santé 2004‐2009 35‐74 3319 51.1 sub‐regionalfood‐frequency questionnaire
multi‐stage sampling
Taiwan2005‐2008 Nutrition and Health Survey in Taiwan
2005‐2008 20‐100 2908 50.3 nationalsingle short‐term diet recall
multi‐stage sampling
ThailandNational Food and Nutrition Survey, Thailand
2003 20‐59 1610 NR nationalsingle short‐term diet recall
multi‐stage sampling
TurkeyDietary intake of adult population living in Ankara
2005 20‐84 1484 76.5 sub‐regionalsingle short‐term diet recall
multi‐stage sampling

Country Study nameTime period
Age range (years)
Sample sizePercent female
CoverageDiet assessment
methodSampling method
United KingdomDietary and Nutritional Survey of British Adults
1986‐1987 20‐64 2197 50.5 nationalsingle short‐term diet recall
multi‐stage sampling
United KingdomNational Diet and Nutrition Survey: people aged 65 years and over
1994‐1995 65‐100 1275 50.4 nationalsingle short‐term diet recall
one‐stage sampling
United KingdomNational Diet and Nutrition Survey: adults aged 19‐64 years
2000‐2001 20‐64 1724 55.6 nationalsingle short‐term diet recall
multi‐stage sampling
United States of America
NHANES 2003‐2006 2003‐2006 20‐85 17150 52.4 nationalmultiple short term diet recall
multi‐stage sampling

Country SexMidpoint of age range
Mean juice intake
(servings/day)
Juice, lower uncertainty interval
Juice, upper uncertainty interval
Mean milk intake
(servings/day)
Milk, lower uncertainty interval
Milk, upper uncertainty interval
Mean SSB intake (servings/day)
SSB, lower uncertainty interval
SSB, upper uncertainty interval
Mean calcium intake
(servings/day)
Calcium, lower
uncertainty interval
Calcium, upper
uncertainty interval
Afghanistan F 25 0.039 0.018 0.072 0.34 0.19 0.56 0.63 0.35 1.05 572.8 444.2 729.6Afghanistan F 35 0.033 0.015 0.059 0.32 0.18 0.54 0.48 0.27 0.80 576.7 445.5 731.5Afghanistan F 45 0.027 0.012 0.048 0.31 0.17 0.51 0.35 0.19 0.59 581.8 447.1 735.6Afghanistan F 55 0.026 0.012 0.046 0.34 0.19 0.57 0.28 0.16 0.48 596.5 461.7 756.2Afghanistan F 65 0.026 0.012 0.048 0.38 0.20 0.64 0.23 0.13 0.40 613.1 475.1 785.3Afghanistan F 75 0.025 0.011 0.047 0.41 0.22 0.69 0.21 0.12 0.36 628.7 485.5 805.5Afghanistan F 90 0.025 0.011 0.047 0.44 0.24 0.74 0.19 0.11 0.33 646.0 497.1 826.6Afghanistan M 25 0.032 0.015 0.064 0.32 0.18 0.54 0.71 0.40 1.19 523.8 396.0 672.1Afghanistan M 35 0.027 0.012 0.052 0.30 0.17 0.49 0.54 0.30 0.89 527.0 399.1 673.5Afghanistan M 45 0.022 0.010 0.042 0.28 0.15 0.48 0.37 0.21 0.61 531.4 403.1 680.7Afghanistan M 55 0.021 0.010 0.041 0.31 0.17 0.50 0.30 0.17 0.50 544.5 413.4 697.0Afghanistan M 65 0.021 0.010 0.043 0.35 0.19 0.58 0.25 0.14 0.42 559.5 424.9 713.3Afghanistan M 75 0.021 0.010 0.041 0.38 0.21 0.63 0.23 0.13 0.38 573.6 437.5 728.3Afghanistan M 90 0.020 0.010 0.039 0.41 0.23 0.68 0.21 0.12 0.36 589.0 451.2 753.9Angola F 25 0.112 0.053 0.205 0.66 0.34 1.14 1.36 0.71 2.36 507.8 383.2 664.5Angola F 35 0.094 0.046 0.166 0.62 0.32 1.03 1.02 0.53 1.78 511.4 386.9 665.6Angola F 45 0.076 0.037 0.139 0.58 0.29 0.97 0.70 0.36 1.29 516.0 390.8 686.0Angola F 55 0.073 0.036 0.131 0.64 0.32 1.08 0.56 0.29 0.98 529.2 403.8 686.2Angola F 65 0.073 0.036 0.135 0.71 0.35 1.23 0.46 0.23 0.78 544.3 415.1 711.4Angola F 75 0.071 0.035 0.131 0.77 0.39 1.30 0.41 0.21 0.71 558.3 428.2 726.4Angola F 90 0.069 0.034 0.128 0.83 0.43 1.40 0.38 0.20 0.65 573.9 437.5 744.8Angola M 25 0.090 0.043 0.174 0.59 0.30 1.03 1.52 0.79 2.71 462.7 349.8 608.9Angola M 35 0.075 0.036 0.139 0.55 0.29 0.94 1.13 0.61 1.96 466.1 353.5 609.1Angola M 45 0.061 0.028 0.116 0.52 0.27 0.91 0.77 0.41 1.39 470.5 355.5 613.6Angola M 55 0.059 0.028 0.109 0.57 0.30 0.97 0.61 0.33 1.07 482.3 364.1 634.5Angola M 65 0.059 0.028 0.110 0.63 0.33 1.08 0.50 0.26 0.87 495.7 373.6 649.3Angola M 75 0.058 0.027 0.106 0.69 0.37 1.17 0.45 0.24 0.78 508.3 384.3 667.1Angola M 90 0.056 0.026 0.102 0.74 0.40 1.29 0.42 0.23 0.72 522.3 398.0 685.1Albania F 25 0.217 0.107 0.398 1.02 0.54 1.67 0.33 0.19 0.56 670.3 525.3 857.5Albania F 35 0.180 0.089 0.334 0.96 0.52 1.59 0.25 0.14 0.41 673.4 526.3 862.2Albania F 45 0.146 0.071 0.272 0.92 0.51 1.55 0.17 0.09 0.28 678.0 529.1 869.7Albania F 55 0.137 0.068 0.256 1.03 0.55 1.74 0.14 0.08 0.23 695.2 540.8 890.6Albania F 65 0.134 0.067 0.249 1.16 0.63 1.96 0.11 0.06 0.20 715.3 551.9 911.4Albania F 75 0.132 0.067 0.242 1.26 0.69 2.10 0.10 0.06 0.18 734.2 569.9 933.1Albania F 90 0.129 0.065 0.242 1.37 0.75 2.33 0.10 0.05 0.16 756.4 588.1 960.0Albania M 25 0.175 0.084 0.325 0.93 0.50 1.55 0.38 0.21 0.64 616.2 467.9 790.9Albania M 35 0.144 0.071 0.264 0.87 0.47 1.41 0.28 0.16 0.48 617.1 471.4 788.5Albania M 45 0.116 0.056 0.210 0.83 0.45 1.34 0.19 0.10 0.32 619.7 472.7 801.4Albania M 55 0.111 0.054 0.199 0.93 0.50 1.49 0.15 0.08 0.25 634.4 484.4 815.6Albania M 65 0.110 0.054 0.197 1.05 0.56 1.70 0.12 0.07 0.20 652.1 498.0 845.3Albania M 75 0.109 0.054 0.193 1.14 0.62 1.84 0.11 0.06 0.18 670.4 514.9 861.4Albania M 90 0.108 0.053 0.197 1.24 0.67 2.01 0.10 0.06 0.17 691.3 534.4 885.8Andorra F 25 0.439 0.239 0.777 0.77 0.44 1.26 0.84 0.48 1.40 898.8 696.6 1143.3Andorra F 35 0.352 0.189 0.625 0.73 0.41 1.19 0.60 0.34 0.99 905.5 705.4 1155.6Andorra F 45 0.274 0.145 0.480 0.69 0.39 1.14 0.38 0.21 0.62 913.7 705.6 1173.3Andorra F 55 0.266 0.143 0.463 0.74 0.42 1.22 0.30 0.17 0.49 933.7 727.0 1193.2Andorra F 65 0.272 0.144 0.477 0.80 0.46 1.33 0.26 0.15 0.42 956.6 744.1 1223.7Andorra F 75 0.271 0.144 0.475 0.88 0.51 1.46 0.24 0.14 0.39 980.9 765.9 1255.0Andorra F 90 0.269 0.143 0.466 0.99 0.56 1.63 0.22 0.12 0.36 1011.8 787.8 1296.5Andorra M 25 0.353 0.188 0.629 0.74 0.43 1.25 0.97 0.54 1.67 824.5 636.0 1040.2Andorra M 35 0.286 0.151 0.508 0.68 0.39 1.14 0.69 0.38 1.17 827.9 645.3 1045.0Andorra M 45 0.226 0.118 0.393 0.62 0.36 1.05 0.42 0.23 0.71 832.9 646.6 1057.9Andorra M 55 0.214 0.114 0.377 0.66 0.38 1.12 0.33 0.18 0.55 850.8 660.1 1075.0Andorra M 65 0.213 0.113 0.386 0.73 0.42 1.24 0.27 0.15 0.47 871.6 675.6 1109.2Andorra M 75 0.216 0.116 0.383 0.81 0.46 1.38 0.25 0.14 0.43 893.5 691.9 1132.6Andorra M 90 0.219 0.115 0.376 0.90 0.52 1.56 0.23 0.13 0.40 920.1 721.4 1157.3United Arab Emirates F 25 0.384 0.192 0.727 0.68 0.38 1.16 0.80 0.43 1.38 672.5 514.9 857.1United Arab Emirates F 35 0.321 0.157 0.601 0.65 0.37 1.10 0.62 0.33 1.05 677.2 519.3 859.5United Arab Emirates F 45 0.263 0.127 0.486 0.62 0.35 1.05 0.44 0.24 0.74 683.1 517.2 865.9United Arab Emirates F 55 0.253 0.123 0.464 0.68 0.38 1.14 0.36 0.20 0.60 700.0 534.5 886.7United Arab Emirates F 65 0.253 0.123 0.463 0.76 0.42 1.28 0.30 0.16 0.51 719.1 557.4 908.7United Arab Emirates F 75 0.248 0.122 0.456 0.82 0.46 1.35 0.27 0.15 0.45 738.2 568.6 925.2United Arab Emirates F 90 0.240 0.118 0.459 0.89 0.50 1.45 0.25 0.13 0.41 760.3 580.3 956.4United Arab Emirates M 25 0.315 0.154 0.578 0.63 0.33 1.10 0.90 0.51 1.49 618.7 476.4 789.8United Arab Emirates M 35 0.263 0.132 0.484 0.59 0.31 1.04 0.68 0.38 1.11 622.4 485.9 793.5United Arab Emirates M 45 0.215 0.109 0.403 0.56 0.30 0.97 0.47 0.26 0.78 627.5 492.2 805.9United Arab Emirates M 55 0.207 0.105 0.385 0.62 0.33 1.06 0.38 0.21 0.62 642.9 504.0 821.7United Arab Emirates M 65 0.208 0.103 0.393 0.69 0.36 1.21 0.32 0.18 0.53 660.4 516.6 846.4United Arab Emirates M 75 0.202 0.101 0.376 0.75 0.40 1.30 0.29 0.16 0.48 677.5 530.1 869.4United Arab Emirates M 90 0.194 0.097 0.357 0.82 0.43 1.41 0.27 0.15 0.43 696.5 544.4 890.5Argentina F 25 0.402 0.197 0.724 0.53 0.45 0.62 1.06 0.89 1.24 545.7 507.7 584.6Argentina F 35 0.333 0.167 0.591 0.49 0.44 0.55 0.80 0.70 0.90 548.9 523.0 576.0Argentina F 45 0.271 0.136 0.484 0.47 0.40 0.55 0.56 0.46 0.65 553.3 519.6 589.6Argentina F 55 0.260 0.132 0.461 0.52 0.46 0.58 0.44 0.38 0.50 567.0 541.2 595.5Argentina F 65 0.260 0.131 0.460 0.58 0.50 0.67 0.35 0.30 0.41 582.8 546.0 623.7Argentina F 75 0.255 0.128 0.450 0.63 0.56 0.70 0.32 0.28 0.37 598.1 568.4 631.0Argentina F 90 0.247 0.121 0.428 0.69 0.61 0.76 0.29 0.26 0.34 616.8 587.9 647.8Argentina M 25 0.327 0.166 0.588 0.49 0.42 0.57 1.17 0.98 1.39 502.8 470.8 539.1Argentina M 35 0.272 0.139 0.494 0.46 0.41 0.51 0.88 0.76 1.00 505.7 480.8 531.8Argentina M 45 0.221 0.113 0.412 0.44 0.37 0.51 0.60 0.50 0.71 509.7 475.4 546.2Argentina M 55 0.212 0.109 0.380 0.48 0.43 0.54 0.47 0.41 0.55 522.2 495.6 550.1Argentina M 65 0.212 0.109 0.371 0.54 0.46 0.61 0.39 0.33 0.45 536.6 501.7 571.1Argentina M 75 0.208 0.110 0.364 0.58 0.52 0.64 0.35 0.30 0.41 551.0 524.7 579.2Argentina M 90 0.202 0.106 0.361 0.63 0.56 0.70 0.33 0.29 0.37 568.0 541.6 596.0Armenia F 25 0.304 0.142 0.568 0.48 0.33 0.68 0.55 0.29 0.95 679.2 516.7 853.7Armenia F 35 0.252 0.121 0.461 0.45 0.31 0.62 0.41 0.22 0.68 683.4 523.7 855.1Armenia F 45 0.204 0.097 0.373 0.43 0.29 0.60 0.28 0.14 0.46 689.1 530.2 871.7Armenia F 55 0.197 0.096 0.360 0.47 0.32 0.65 0.22 0.11 0.36 705.4 545.3 886.9Armenia F 65 0.197 0.093 0.350 0.52 0.36 0.73 0.18 0.09 0.30 724.3 555.1 916.0Armenia F 75 0.193 0.092 0.342 0.57 0.39 0.78 0.17 0.09 0.27 743.6 569.4 937.0Armenia F 90 0.186 0.090 0.336 0.62 0.42 0.86 0.15 0.08 0.25 767.1 593.8 967.4Armenia M 25 0.250 0.123 0.454 0.44 0.30 0.63 0.60 0.33 1.05 616.1 470.6 784.3Armenia M 35 0.207 0.104 0.378 0.42 0.28 0.59 0.45 0.25 0.77 620.0 476.1 791.7Armenia M 45 0.168 0.081 0.308 0.39 0.26 0.56 0.30 0.17 0.52 625.4 481.2 806.3Armenia M 55 0.161 0.078 0.296 0.43 0.29 0.61 0.24 0.13 0.40 640.8 496.2 813.8Armenia M 65 0.161 0.076 0.302 0.48 0.32 0.69 0.20 0.11 0.34 658.7 502.2 846.0
Table B. Country‐level mean consumption of fruit juice, milk, and sugar‐sweetened beverages for men and women in 2010.

Country SexMidpoint of age range
Mean juice intake
(servings/day)
Juice, lower uncertainty interval
Juice, upper uncertainty interval
Mean milk intake
(servings/day)
Milk, lower uncertainty interval
Milk, upper uncertainty interval
Mean SSB intake (servings/day)
SSB, lower uncertainty interval
SSB, upper uncertainty interval
Mean calcium intake
(servings/day)
Calcium, lower
uncertainty interval
Calcium, upper
uncertainty interval
Armenia M 75 0.157 0.076 0.289 0.52 0.36 0.74 0.18 0.10 0.31 676.2 518.0 869.8Armenia M 90 0.153 0.077 0.276 0.57 0.39 0.81 0.17 0.09 0.28 696.3 538.0 902.4Antigua and Barbuda F 25 0.413 0.197 0.738 1.13 0.61 1.91 2.98 1.59 5.05 909.2 697.8 1157.0Antigua and Barbuda F 35 0.345 0.168 0.606 1.06 0.59 1.78 2.22 1.23 3.72 914.5 701.1 1164.2Antigua and Barbuda F 45 0.283 0.142 0.497 1.01 0.55 1.72 1.51 0.82 2.54 921.6 704.8 1177.6Antigua and Barbuda F 55 0.270 0.136 0.479 1.10 0.60 1.86 1.21 0.67 2.06 944.1 726.5 1206.1Antigua and Barbuda F 65 0.267 0.132 0.483 1.22 0.67 2.05 1.01 0.55 1.73 969.9 750.6 1233.6Antigua and Barbuda F 75 0.261 0.128 0.471 1.33 0.73 2.20 0.92 0.50 1.58 995.6 769.7 1256.5Antigua and Barbuda F 90 0.254 0.122 0.452 1.45 0.79 2.45 0.84 0.47 1.42 1026.8 791.2 1298.7Antigua and Barbuda M 25 0.336 0.162 0.605 1.04 0.55 1.74 3.22 1.75 5.37 833.8 637.5 1079.1Antigua and Barbuda M 35 0.279 0.139 0.495 0.97 0.52 1.61 2.38 1.32 3.98 838.4 648.9 1085.5Antigua and Barbuda M 45 0.229 0.112 0.419 0.92 0.49 1.52 1.61 0.90 2.71 844.8 651.1 1085.4Antigua and Barbuda M 55 0.220 0.110 0.410 1.00 0.54 1.66 1.28 0.72 2.16 865.2 668.3 1117.3Antigua and Barbuda M 65 0.219 0.107 0.404 1.12 0.60 1.88 1.07 0.60 1.84 888.8 689.1 1143.4Antigua and Barbuda M 75 0.213 0.105 0.392 1.21 0.65 2.01 0.98 0.54 1.64 912.6 709.1 1167.8Antigua and Barbuda M 90 0.205 0.100 0.377 1.31 0.71 2.19 0.90 0.49 1.49 941.1 733.1 1212.2Australia F 25 0.759 0.400 1.360 0.68 0.59 0.80 0.88 0.72 1.05 734.9 685.5 786.4Australia F 35 0.629 0.332 1.101 0.64 0.56 0.73 0.66 0.56 0.77 740.9 698.9 782.3Australia F 45 0.512 0.259 0.899 0.61 0.52 0.71 0.45 0.37 0.54 748.3 701.5 800.8Australia F 55 0.493 0.255 0.852 0.68 0.59 0.76 0.36 0.31 0.43 766.5 723.9 811.3Australia F 65 0.493 0.259 0.858 0.76 0.65 0.87 0.31 0.26 0.36 787.1 733.7 841.0Australia F 75 0.483 0.254 0.828 0.82 0.72 0.93 0.28 0.24 0.33 807.3 759.8 855.8Australia F 90 0.467 0.247 0.809 0.90 0.79 1.03 0.25 0.21 0.30 833.0 784.1 882.3Australia M 25 0.600 0.296 1.081 0.63 0.53 0.73 0.97 0.80 1.16 671.6 627.1 719.2Australia M 35 0.498 0.255 0.876 0.58 0.51 0.67 0.72 0.62 0.84 676.4 639.0 715.4Australia M 45 0.405 0.201 0.734 0.55 0.47 0.65 0.50 0.41 0.60 682.5 639.4 730.2Australia M 55 0.390 0.197 0.700 0.61 0.54 0.70 0.40 0.34 0.47 699.9 662.4 741.9Australia M 65 0.390 0.193 0.686 0.68 0.59 0.80 0.33 0.27 0.39 719.6 674.5 765.4Australia M 75 0.382 0.188 0.671 0.75 0.65 0.85 0.30 0.25 0.35 738.9 699.1 781.2Australia M 90 0.369 0.185 0.657 0.82 0.72 0.92 0.28 0.24 0.32 762.5 717.7 804.8Austria F 25 0.897 0.609 1.273 0.48 0.34 0.67 0.81 0.54 1.16 783.9 722.4 849.6Austria F 35 0.720 0.495 1.020 0.45 0.32 0.63 0.58 0.39 0.82 789.7 728.9 849.8Austria F 45 0.561 0.380 0.802 0.43 0.30 0.61 0.37 0.24 0.52 796.7 729.2 865.9Austria F 55 0.544 0.372 0.764 0.46 0.33 0.64 0.29 0.20 0.42 814.2 750.2 879.6Austria F 65 0.555 0.379 0.787 0.50 0.36 0.69 0.25 0.17 0.36 834.3 768.2 907.7Austria F 75 0.555 0.378 0.779 0.55 0.40 0.76 0.23 0.16 0.33 855.3 793.1 924.2Austria F 90 0.551 0.372 0.784 0.62 0.44 0.86 0.21 0.14 0.31 882.6 815.3 952.1Austria M 25 0.716 0.481 1.016 0.46 0.31 0.63 0.96 0.64 1.39 724.1 661.7 790.0Austria M 35 0.580 0.392 0.817 0.42 0.29 0.58 0.67 0.45 0.97 727.1 671.4 787.6Austria M 45 0.458 0.309 0.646 0.38 0.27 0.53 0.41 0.27 0.59 731.5 670.9 796.3Austria M 55 0.434 0.295 0.610 0.41 0.28 0.56 0.32 0.21 0.46 747.1 689.5 811.2Austria M 65 0.433 0.294 0.608 0.45 0.31 0.62 0.27 0.18 0.39 765.5 707.4 835.8Austria M 75 0.437 0.298 0.608 0.49 0.35 0.68 0.25 0.16 0.36 784.7 728.7 850.1Austria M 90 0.443 0.301 0.621 0.55 0.38 0.76 0.23 0.15 0.33 808.3 746.0 878.9Azerbaijan F 25 0.033 0.016 0.061 0.43 0.23 0.72 0.17 0.08 0.29 639.1 486.1 831.1Azerbaijan F 35 0.027 0.013 0.050 0.40 0.22 0.68 0.13 0.06 0.21 642.9 493.3 830.1Azerbaijan F 45 0.022 0.010 0.042 0.38 0.20 0.64 0.09 0.04 0.15 648.0 497.5 843.3Azerbaijan F 55 0.021 0.010 0.039 0.42 0.22 0.69 0.07 0.04 0.12 663.4 510.3 856.2Azerbaijan F 65 0.021 0.010 0.039 0.47 0.25 0.76 0.06 0.03 0.10 681.4 519.5 879.5Azerbaijan F 75 0.021 0.010 0.038 0.51 0.27 0.83 0.05 0.03 0.09 699.7 535.8 906.5Azerbaijan F 90 0.020 0.010 0.037 0.55 0.29 0.92 0.05 0.03 0.08 720.0 554.7 932.3Azerbaijan M 25 0.027 0.013 0.051 0.39 0.23 0.67 0.19 0.10 0.33 585.8 441.5 743.0Azerbaijan M 35 0.023 0.011 0.042 0.37 0.21 0.61 0.14 0.08 0.24 589.5 446.0 742.2Azerbaijan M 45 0.018 0.008 0.034 0.35 0.20 0.58 0.10 0.05 0.17 594.6 451.5 754.8Azerbaijan M 55 0.018 0.008 0.033 0.39 0.22 0.64 0.08 0.04 0.13 609.2 464.9 767.1Azerbaijan M 65 0.018 0.008 0.034 0.43 0.25 0.72 0.06 0.03 0.11 626.1 476.2 788.3Azerbaijan M 75 0.017 0.008 0.032 0.47 0.26 0.78 0.06 0.03 0.10 642.9 491.7 809.1Azerbaijan M 90 0.017 0.008 0.031 0.50 0.28 0.84 0.05 0.03 0.09 660.9 507.6 837.8Burundi F 25 0.088 0.036 0.176 0.10 0.05 0.17 0.30 0.15 0.52 340.5 256.3 438.4Burundi F 35 0.073 0.031 0.147 0.10 0.05 0.16 0.22 0.12 0.38 342.5 260.1 442.7Burundi F 45 0.059 0.025 0.118 0.09 0.05 0.15 0.15 0.08 0.25 345.4 260.9 448.6Burundi F 55 0.057 0.025 0.115 0.10 0.05 0.17 0.12 0.06 0.20 354.1 269.9 460.1Burundi F 65 0.057 0.024 0.117 0.11 0.06 0.19 0.10 0.05 0.17 364.1 277.4 475.1Burundi F 75 0.056 0.024 0.114 0.12 0.07 0.20 0.09 0.05 0.15 373.6 286.2 484.0Burundi F 90 0.054 0.023 0.111 0.13 0.07 0.22 0.08 0.04 0.14 384.3 294.7 496.9Burundi M 25 0.072 0.032 0.144 0.09 0.05 0.16 0.34 0.18 0.59 307.5 237.1 397.4Burundi M 35 0.059 0.026 0.117 0.09 0.05 0.15 0.25 0.14 0.43 309.5 239.8 394.9Burundi M 45 0.048 0.020 0.094 0.08 0.04 0.14 0.17 0.09 0.30 312.2 239.7 400.5Burundi M 55 0.046 0.020 0.091 0.09 0.05 0.16 0.14 0.07 0.24 319.9 246.2 407.9Burundi M 65 0.046 0.020 0.092 0.10 0.05 0.18 0.11 0.06 0.20 328.5 252.8 421.5Burundi M 75 0.045 0.020 0.089 0.11 0.06 0.19 0.10 0.06 0.18 337.1 260.2 430.3Burundi M 90 0.044 0.019 0.087 0.12 0.06 0.20 0.09 0.05 0.16 346.8 268.0 443.4Belgium F 25 0.457 0.346 0.591 0.35 0.29 0.42 1.31 1.05 1.63 772.7 718.8 830.1Belgium F 35 0.367 0.283 0.462 0.33 0.28 0.39 0.94 0.76 1.16 778.4 728.5 829.8Belgium F 45 0.286 0.222 0.363 0.31 0.26 0.38 0.59 0.47 0.74 785.4 727.9 846.9Belgium F 55 0.277 0.218 0.347 0.34 0.28 0.39 0.47 0.38 0.58 802.7 748.8 858.8Belgium F 65 0.283 0.220 0.355 0.36 0.31 0.43 0.41 0.32 0.51 822.3 760.7 880.2Belgium F 75 0.283 0.221 0.353 0.40 0.34 0.47 0.38 0.30 0.46 843.3 785.7 898.5Belgium F 90 0.281 0.217 0.353 0.45 0.37 0.53 0.35 0.28 0.43 869.6 811.1 929.0Belgium M 25 0.369 0.282 0.470 0.34 0.28 0.40 1.54 1.23 1.88 710.4 658.4 766.6Belgium M 35 0.299 0.230 0.373 0.31 0.26 0.36 1.08 0.87 1.32 713.3 667.4 761.9Belgium M 45 0.235 0.179 0.296 0.28 0.24 0.33 0.66 0.52 0.83 717.7 665.2 773.0Belgium M 55 0.223 0.173 0.278 0.30 0.25 0.35 0.52 0.41 0.63 733.1 686.4 781.8Belgium M 65 0.222 0.170 0.283 0.33 0.27 0.39 0.43 0.34 0.53 750.9 699.5 806.8Belgium M 75 0.225 0.175 0.284 0.36 0.31 0.43 0.39 0.31 0.48 769.9 720.9 821.8Belgium M 90 0.228 0.177 0.290 0.41 0.34 0.48 0.37 0.29 0.45 792.8 739.7 848.1Benin F 25 0.002 0.001 0.004 0.18 0.10 0.30 0.27 0.14 0.47 418.7 324.4 524.4Benin F 35 0.002 0.001 0.003 0.17 0.09 0.28 0.20 0.11 0.34 421.1 328.9 527.5Benin F 45 0.001 0.001 0.002 0.16 0.09 0.27 0.14 0.07 0.24 424.5 329.6 537.4Benin F 55 0.001 0.001 0.002 0.18 0.10 0.29 0.11 0.06 0.19 435.3 340.4 545.8Benin F 65 0.001 0.001 0.002 0.20 0.11 0.33 0.09 0.05 0.15 447.5 350.8 563.7Benin F 75 0.001 0.001 0.002 0.21 0.12 0.35 0.08 0.04 0.14 459.0 360.8 578.0Benin F 90 0.001 0.001 0.002 0.23 0.13 0.39 0.07 0.04 0.13 472.0 372.7 594.7Benin M 25 0.002 0.001 0.003 0.17 0.09 0.27 0.30 0.15 0.52 383.4 293.0 492.4Benin M 35 0.001 0.001 0.003 0.16 0.09 0.25 0.22 0.12 0.39 385.9 295.4 494.3Benin M 45 0.001 0.001 0.002 0.15 0.08 0.24 0.15 0.08 0.27 389.1 298.0 499.4Benin M 55 0.001 0.000 0.002 0.16 0.09 0.26 0.12 0.06 0.21 398.5 307.5 508.3Benin M 65 0.001 0.001 0.002 0.18 0.10 0.30 0.10 0.05 0.17 409.4 318.1 525.0Benin M 75 0.001 0.000 0.002 0.20 0.11 0.32 0.09 0.05 0.16 420.0 326.3 534.2

Country SexMidpoint of age range
Mean juice intake
(servings/day)
Juice, lower uncertainty interval
Juice, upper uncertainty interval
Mean milk intake
(servings/day)
Milk, lower uncertainty interval
Milk, upper uncertainty interval
Mean SSB intake (servings/day)
SSB, lower uncertainty interval
SSB, upper uncertainty interval
Mean calcium intake
(servings/day)
Calcium, lower
uncertainty interval
Calcium, upper
uncertainty interval
Benin M 90 0.001 0.000 0.002 0.22 0.12 0.35 0.08 0.04 0.15 432.1 334.0 544.8Burkina Faso F 25 0.000 0.000 0.000 0.26 0.16 0.40 0.29 0.15 0.50 487.7 413.4 561.9Burkina Faso F 35 0.000 0.000 0.000 0.24 0.15 0.37 0.22 0.11 0.37 490.5 420.6 565.1Burkina Faso F 45 0.000 0.000 0.000 0.23 0.14 0.36 0.15 0.08 0.25 494.4 420.4 571.5Burkina Faso F 55 0.000 0.000 0.000 0.26 0.16 0.40 0.12 0.06 0.20 506.9 435.7 581.9Burkina Faso F 65 0.000 0.000 0.000 0.29 0.18 0.44 0.10 0.05 0.17 521.3 444.5 600.2Burkina Faso F 75 0.000 0.000 0.000 0.31 0.20 0.47 0.09 0.05 0.15 534.6 459.1 611.0Burkina Faso F 90 0.000 0.000 0.000 0.34 0.21 0.50 0.08 0.04 0.14 549.1 471.7 626.2Burkina Faso M 25 0.000 0.000 0.000 0.24 0.15 0.37 0.33 0.17 0.55 448.8 382.1 521.6Burkina Faso M 35 0.000 0.000 0.000 0.23 0.15 0.34 0.24 0.13 0.41 451.7 387.2 519.6Burkina Faso M 45 0.000 0.000 0.000 0.22 0.13 0.32 0.17 0.09 0.28 455.5 387.3 526.2Burkina Faso M 55 0.000 0.000 0.000 0.24 0.15 0.36 0.13 0.07 0.22 466.5 400.3 538.2Burkina Faso M 65 0.000 0.000 0.000 0.27 0.17 0.40 0.11 0.06 0.18 479.3 410.8 560.6Burkina Faso M 75 0.000 0.000 0.000 0.29 0.18 0.43 0.10 0.05 0.16 491.7 423.1 569.3Burkina Faso M 90 0.000 0.000 0.000 0.31 0.20 0.46 0.09 0.05 0.15 505.4 433.2 581.9Bangladesh F 25 0.003 0.001 0.006 0.11 0.08 0.14 0.26 0.13 0.44 348.8 310.2 390.4Bangladesh F 35 0.003 0.001 0.005 0.10 0.08 0.13 0.19 0.10 0.32 351.3 313.2 390.0Bangladesh F 45 0.002 0.001 0.004 0.10 0.08 0.13 0.13 0.07 0.22 354.5 315.3 396.6Bangladesh F 55 0.002 0.001 0.004 0.11 0.09 0.14 0.11 0.06 0.17 362.9 323.5 404.9Bangladesh F 65 0.002 0.001 0.004 0.12 0.09 0.16 0.09 0.05 0.14 372.7 329.8 417.4Bangladesh F 75 0.002 0.001 0.003 0.14 0.10 0.17 0.08 0.04 0.13 382.6 341.1 425.8Bangladesh F 90 0.002 0.001 0.003 0.15 0.11 0.19 0.07 0.04 0.12 394.3 353.0 437.2Bangladesh M 25 0.003 0.001 0.005 0.10 0.08 0.13 0.28 0.15 0.50 319.7 283.4 360.4Bangladesh M 35 0.002 0.001 0.004 0.10 0.07 0.12 0.21 0.11 0.37 321.8 287.6 359.6Bangladesh M 45 0.002 0.001 0.003 0.09 0.07 0.12 0.15 0.08 0.26 324.6 288.6 366.5Bangladesh M 55 0.002 0.001 0.003 0.10 0.08 0.13 0.12 0.06 0.20 332.7 296.8 372.3Bangladesh M 65 0.002 0.001 0.003 0.12 0.09 0.15 0.10 0.05 0.17 342.1 304.4 382.4Bangladesh M 75 0.002 0.001 0.003 0.12 0.10 0.16 0.09 0.05 0.15 351.2 313.7 391.2Bangladesh M 90 0.002 0.001 0.003 0.13 0.10 0.17 0.08 0.04 0.14 361.8 323.6 404.3Bulgaria F 25 0.207 0.144 0.292 0.68 0.56 0.83 0.43 0.32 0.57 573.2 526.9 622.2Bulgaria F 35 0.172 0.122 0.240 0.64 0.54 0.76 0.32 0.24 0.41 575.9 538.2 616.1Bulgaria F 45 0.140 0.095 0.198 0.62 0.51 0.74 0.21 0.16 0.28 579.9 536.7 623.7Bulgaria F 55 0.132 0.092 0.182 0.69 0.57 0.82 0.17 0.13 0.22 594.8 555.2 634.9Bulgaria F 65 0.129 0.089 0.178 0.77 0.64 0.94 0.15 0.11 0.19 611.7 567.0 658.3Bulgaria F 75 0.126 0.089 0.174 0.84 0.70 1.00 0.13 0.10 0.17 628.1 586.5 671.9Bulgaria F 90 0.123 0.087 0.168 0.92 0.76 1.09 0.12 0.09 0.16 647.1 603.6 693.0Bulgaria M 25 0.163 0.114 0.226 0.63 0.51 0.76 0.50 0.38 0.65 527.8 484.0 572.7Bulgaria M 35 0.135 0.096 0.183 0.59 0.48 0.70 0.37 0.29 0.48 528.5 490.5 568.1Bulgaria M 45 0.109 0.076 0.151 0.56 0.45 0.69 0.25 0.19 0.32 530.6 486.5 577.1Bulgaria M 55 0.104 0.074 0.142 0.63 0.52 0.75 0.20 0.15 0.25 543.4 502.4 582.6Bulgaria M 65 0.103 0.073 0.142 0.71 0.58 0.86 0.16 0.12 0.21 558.4 513.8 601.6Bulgaria M 75 0.102 0.073 0.139 0.77 0.64 0.92 0.14 0.11 0.19 574.2 532.5 614.7Bulgaria M 90 0.101 0.073 0.137 0.84 0.69 1.01 0.14 0.10 0.17 592.7 550.2 636.0Bahrain F 25 0.354 0.182 0.680 0.74 0.40 1.25 0.93 0.50 1.56 671.9 603.4 750.4Bahrain F 35 0.296 0.153 0.550 0.71 0.39 1.21 0.71 0.39 1.17 676.5 612.5 747.1Bahrain F 45 0.242 0.124 0.439 0.68 0.38 1.18 0.51 0.28 0.84 682.6 614.1 761.8Bahrain F 55 0.233 0.120 0.417 0.74 0.41 1.26 0.41 0.23 0.69 699.5 634.2 775.2Bahrain F 65 0.232 0.119 0.413 0.82 0.45 1.39 0.35 0.19 0.58 718.9 644.2 802.1Bahrain F 75 0.227 0.119 0.404 0.89 0.49 1.49 0.31 0.17 0.52 737.4 664.6 818.8Bahrain F 90 0.221 0.118 0.388 0.97 0.53 1.64 0.28 0.16 0.48 758.8 684.1 839.6Bahrain M 25 0.288 0.141 0.522 0.66 0.36 1.10 1.03 0.55 1.75 614.7 548.2 685.7Bahrain M 35 0.241 0.118 0.435 0.62 0.33 1.00 0.78 0.43 1.31 618.4 558.7 684.4Bahrain M 45 0.198 0.093 0.366 0.59 0.32 0.95 0.54 0.29 0.90 623.5 559.4 698.6Bahrain M 55 0.191 0.092 0.351 0.65 0.35 1.03 0.44 0.24 0.73 638.8 574.3 707.9Bahrain M 65 0.191 0.093 0.352 0.72 0.38 1.16 0.37 0.20 0.63 656.4 586.3 726.7Bahrain M 75 0.185 0.090 0.340 0.79 0.41 1.25 0.33 0.18 0.57 673.1 605.6 740.9Bahrain M 90 0.178 0.085 0.319 0.86 0.46 1.36 0.31 0.17 0.52 692.3 624.5 762.8Bahamas F 25 0.285 0.140 0.503 0.75 0.41 1.25 3.26 1.83 5.34 828.5 642.9 1074.8Bahamas F 35 0.238 0.120 0.419 0.70 0.39 1.17 2.42 1.38 3.91 833.1 644.7 1077.9Bahamas F 45 0.196 0.100 0.354 0.66 0.36 1.11 1.65 0.91 2.71 839.5 650.1 1089.7Bahamas F 55 0.186 0.095 0.330 0.73 0.40 1.19 1.32 0.74 2.18 859.9 670.3 1108.2Bahamas F 65 0.184 0.092 0.323 0.81 0.44 1.32 1.10 0.62 1.79 883.6 689.4 1141.0Bahamas F 75 0.180 0.090 0.317 0.87 0.49 1.42 1.00 0.57 1.64 907.0 711.5 1169.3Bahamas F 90 0.175 0.088 0.306 0.95 0.53 1.53 0.92 0.52 1.49 934.5 728.9 1198.7Bahamas M 25 0.231 0.122 0.405 0.70 0.38 1.21 3.55 1.91 5.93 756.9 584.2 970.0Bahamas M 35 0.193 0.103 0.341 0.66 0.37 1.12 2.62 1.41 4.31 761.2 593.6 976.5Bahamas M 45 0.158 0.083 0.288 0.62 0.34 1.07 1.77 0.95 2.94 767.1 597.5 992.9Bahamas M 55 0.152 0.081 0.270 0.68 0.38 1.17 1.41 0.77 2.30 785.5 611.7 1008.7Bahamas M 65 0.151 0.080 0.274 0.76 0.42 1.31 1.18 0.64 1.94 806.9 628.1 1034.3Bahamas M 75 0.148 0.078 0.265 0.82 0.45 1.40 1.08 0.59 1.75 828.4 643.2 1061.1Bahamas M 90 0.142 0.074 0.248 0.88 0.48 1.50 0.99 0.53 1.60 853.3 662.5 1090.4Bosnia and Herzegovina F 25 0.112 0.057 0.203 1.39 1.08 1.73 0.30 0.16 0.51 619.0 474.7 782.6Bosnia and Herzegovina F 35 0.093 0.047 0.166 1.31 1.03 1.61 0.22 0.12 0.37 621.9 479.1 783.9Bosnia and Herzegovina F 45 0.075 0.037 0.134 1.26 0.99 1.56 0.15 0.08 0.26 626.4 478.4 789.3Bosnia and Herzegovina F 55 0.071 0.036 0.126 1.40 1.10 1.73 0.12 0.07 0.21 642.2 490.1 804.3Bosnia and Herzegovina F 65 0.069 0.036 0.127 1.57 1.23 1.98 0.10 0.05 0.17 660.6 503.1 832.3Bosnia and Herzegovina F 75 0.068 0.035 0.124 1.71 1.36 2.14 0.09 0.05 0.16 678.2 513.9 848.9Bosnia and Herzegovina F 90 0.066 0.034 0.123 1.87 1.47 2.33 0.09 0.05 0.14 698.6 535.2 874.9Bosnia and Herzegovina M 25 0.089 0.046 0.157 1.28 1.00 1.63 0.36 0.19 0.62 569.7 432.8 720.5Bosnia and Herzegovina M 35 0.074 0.038 0.131 1.20 0.96 1.49 0.27 0.15 0.45 570.7 430.7 722.1Bosnia and Herzegovina M 45 0.060 0.030 0.108 1.15 0.91 1.44 0.18 0.10 0.30 573.2 428.9 731.7Bosnia and Herzegovina M 55 0.057 0.029 0.102 1.28 1.02 1.57 0.14 0.08 0.24 586.8 440.4 742.3Bosnia and Herzegovina M 65 0.057 0.028 0.100 1.45 1.12 1.79 0.11 0.06 0.20 602.9 456.1 768.1Bosnia and Herzegovina M 75 0.056 0.028 0.099 1.58 1.24 1.93 0.10 0.06 0.18 620.0 469.4 787.1Bosnia and Herzegovina M 90 0.056 0.028 0.097 1.71 1.36 2.11 0.10 0.05 0.16 639.3 481.9 806.6Belarus F 25 0.091 0.044 0.162 0.60 0.42 0.85 0.53 0.30 0.92 732.8 560.6 933.1Belarus F 35 0.075 0.038 0.134 0.57 0.40 0.79 0.40 0.23 0.68 739.0 564.0 938.9Belarus F 45 0.060 0.030 0.109 0.55 0.38 0.78 0.27 0.16 0.47 746.4 572.3 949.1Belarus F 55 0.058 0.029 0.103 0.60 0.43 0.85 0.22 0.13 0.36 763.5 581.2 964.3Belarus F 65 0.058 0.030 0.101 0.67 0.47 0.96 0.18 0.10 0.31 782.9 595.0 995.5Belarus F 75 0.057 0.029 0.099 0.72 0.51 1.02 0.16 0.09 0.28 802.8 615.1 1012.7Belarus F 90 0.055 0.027 0.096 0.78 0.56 1.10 0.15 0.09 0.26 827.0 637.4 1045.6Belarus M 25 0.076 0.039 0.138 0.54 0.37 0.73 0.58 0.31 0.98 662.7 512.3 846.5Belarus M 35 0.063 0.033 0.112 0.51 0.35 0.69 0.43 0.23 0.72 665.8 515.0 845.7Belarus M 45 0.051 0.027 0.089 0.49 0.34 0.66 0.30 0.16 0.51 670.6 515.4 857.7Belarus M 55 0.049 0.026 0.087 0.55 0.39 0.74 0.23 0.13 0.41 688.4 530.2 876.2Belarus M 65 0.049 0.025 0.087 0.63 0.44 0.86 0.19 0.11 0.34 708.9 546.0 906.4Belarus M 75 0.048 0.025 0.085 0.67 0.47 0.91 0.18 0.10 0.30 728.1 559.6 930.1Belarus M 90 0.046 0.025 0.083 0.71 0.50 0.97 0.16 0.09 0.27 749.9 576.9 961.4

Country SexMidpoint of age range
Mean juice intake
(servings/day)
Juice, lower uncertainty interval
Juice, upper uncertainty interval
Mean milk intake
(servings/day)
Milk, lower uncertainty interval
Milk, upper uncertainty interval
Mean SSB intake (servings/day)
SSB, lower uncertainty interval
SSB, upper uncertainty interval
Mean calcium intake
(servings/day)
Calcium, lower
uncertainty interval
Calcium, upper
uncertainty interval
Belize F 25 0.531 0.259 0.972 0.69 0.38 1.13 3.55 1.89 5.88 817.1 621.8 1023.9Belize F 35 0.444 0.217 0.807 0.65 0.35 1.04 2.64 1.44 4.33 821.7 625.8 1029.4Belize F 45 0.364 0.175 0.655 0.61 0.34 1.00 1.79 0.96 3.03 828.1 628.4 1040.2Belize F 55 0.347 0.170 0.612 0.67 0.37 1.09 1.44 0.80 2.38 848.3 645.3 1063.2Belize F 65 0.342 0.166 0.606 0.75 0.42 1.24 1.20 0.65 1.99 871.7 667.6 1093.2Belize F 75 0.335 0.165 0.584 0.81 0.45 1.32 1.09 0.60 1.79 894.8 684.1 1123.7Belize F 90 0.326 0.161 0.565 0.88 0.49 1.43 1.00 0.54 1.63 922.4 704.4 1162.5Belize M 25 0.430 0.218 0.767 0.66 0.37 1.11 3.96 2.22 7.05 747.7 576.5 934.4Belize M 35 0.358 0.185 0.629 0.62 0.35 1.03 2.93 1.66 5.14 751.9 579.3 941.8Belize M 45 0.293 0.150 0.519 0.58 0.33 1.01 1.98 1.10 3.52 757.7 584.8 951.0Belize M 55 0.281 0.144 0.496 0.64 0.36 1.08 1.58 0.89 2.80 776.0 600.8 975.9Belize M 65 0.281 0.142 0.487 0.71 0.39 1.20 1.32 0.74 2.28 797.2 616.8 1005.2Belize M 75 0.273 0.139 0.472 0.77 0.43 1.29 1.20 0.67 2.06 818.6 635.6 1027.8Belize M 90 0.263 0.136 0.461 0.83 0.47 1.40 1.10 0.61 1.89 844.1 654.6 1060.5Bolivia F 25 0.586 0.289 1.020 0.32 0.18 0.54 2.00 1.10 3.44 577.8 437.7 752.0Bolivia F 35 0.486 0.244 0.826 0.30 0.17 0.50 1.49 0.82 2.55 581.6 444.2 752.7Bolivia F 45 0.397 0.194 0.698 0.28 0.15 0.48 1.02 0.54 1.75 586.7 445.6 760.1Bolivia F 55 0.381 0.192 0.657 0.31 0.17 0.52 0.81 0.43 1.41 601.8 459.7 776.5Bolivia F 65 0.380 0.191 0.669 0.35 0.20 0.58 0.67 0.36 1.16 618.9 470.3 804.5Bolivia F 75 0.373 0.188 0.653 0.38 0.21 0.62 0.60 0.33 1.03 634.5 485.7 820.7Bolivia F 90 0.362 0.182 0.626 0.41 0.23 0.65 0.56 0.31 0.93 652.2 495.8 839.3Bolivia M 25 0.483 0.225 0.879 0.29 0.16 0.49 2.11 1.19 3.49 528.5 401.5 681.1Bolivia M 35 0.400 0.192 0.720 0.28 0.15 0.47 1.57 0.91 2.61 531.6 407.9 676.7Bolivia M 45 0.325 0.150 0.606 0.26 0.14 0.45 1.07 0.59 1.88 535.8 408.6 683.0Bolivia M 55 0.314 0.152 0.566 0.29 0.16 0.49 0.85 0.48 1.49 549.0 421.4 694.4Bolivia M 65 0.316 0.155 0.570 0.32 0.17 0.54 0.70 0.40 1.22 564.0 429.7 717.0Bolivia M 75 0.308 0.149 0.552 0.35 0.19 0.58 0.64 0.37 1.11 578.6 442.2 731.0Bolivia M 90 0.297 0.145 0.526 0.38 0.20 0.63 0.59 0.34 1.03 595.1 456.8 747.9Brazil F 25 0.423 0.350 0.500 0.46 0.40 0.54 0.79 0.66 0.93 552.4 516.4 591.3Brazil F 35 0.352 0.309 0.397 0.43 0.39 0.48 0.60 0.53 0.68 555.6 530.0 582.1Brazil F 45 0.288 0.239 0.342 0.41 0.35 0.48 0.42 0.35 0.49 560.0 523.7 596.7Brazil F 55 0.277 0.241 0.315 0.45 0.41 0.50 0.34 0.29 0.38 574.4 546.9 603.3Brazil F 65 0.276 0.232 0.323 0.51 0.44 0.57 0.28 0.24 0.33 591.0 556.9 625.3Brazil F 75 0.270 0.234 0.306 0.55 0.49 0.60 0.25 0.22 0.29 606.6 578.3 634.1Brazil F 90 0.260 0.230 0.293 0.59 0.54 0.66 0.23 0.20 0.26 625.3 596.3 654.6Brazil M 25 0.351 0.289 0.420 0.43 0.37 0.49 0.88 0.74 1.03 504.1 472.1 536.2Brazil M 35 0.291 0.254 0.333 0.40 0.36 0.44 0.66 0.58 0.75 507.1 484.9 530.8Brazil M 45 0.237 0.195 0.282 0.38 0.32 0.43 0.46 0.39 0.54 511.3 479.5 542.9Brazil M 55 0.228 0.198 0.260 0.41 0.37 0.46 0.37 0.32 0.42 524.0 501.0 547.4Brazil M 65 0.228 0.193 0.268 0.46 0.40 0.53 0.30 0.26 0.35 538.5 507.1 571.0Brazil M 75 0.223 0.195 0.255 0.50 0.45 0.55 0.27 0.24 0.31 552.7 527.5 579.2Brazil M 90 0.215 0.189 0.245 0.54 0.49 0.60 0.25 0.22 0.28 569.8 544.5 596.3Barbados F 25 0.180 0.133 0.244 0.48 0.39 0.58 4.39 3.45 5.46 671.1 611.1 729.6Barbados F 35 0.151 0.112 0.200 0.45 0.38 0.54 3.26 2.67 3.95 674.9 623.5 728.4Barbados F 45 0.124 0.090 0.171 0.43 0.35 0.52 2.21 1.76 2.74 680.2 623.2 742.1Barbados F 55 0.118 0.088 0.157 0.47 0.39 0.56 1.78 1.46 2.17 696.7 644.3 752.5Barbados F 65 0.116 0.086 0.157 0.52 0.43 0.63 1.48 1.20 1.80 715.9 654.6 781.8Barbados F 75 0.114 0.086 0.151 0.57 0.47 0.67 1.35 1.12 1.62 734.9 677.3 794.2Barbados F 90 0.111 0.083 0.145 0.62 0.52 0.74 1.24 1.03 1.48 758.3 697.1 821.2Barbados M 25 0.148 0.109 0.203 0.45 0.36 0.54 4.79 3.77 5.97 613.5 560.9 670.3Barbados M 35 0.123 0.093 0.166 0.42 0.35 0.49 3.55 2.90 4.29 616.9 573.7 666.9Barbados M 45 0.101 0.072 0.138 0.40 0.32 0.48 2.39 1.90 2.93 621.8 574.4 674.6Barbados M 55 0.097 0.072 0.131 0.43 0.36 0.51 1.91 1.55 2.30 636.8 590.0 687.1Barbados M 65 0.097 0.071 0.131 0.48 0.40 0.58 1.60 1.28 1.95 654.0 603.0 710.5Barbados M 75 0.094 0.070 0.126 0.52 0.44 0.62 1.46 1.20 1.75 671.6 623.3 724.2Barbados M 90 0.091 0.068 0.120 0.56 0.48 0.66 1.34 1.12 1.61 692.5 641.1 746.7Brunei Darussalam F 25 0.435 0.214 0.770 0.66 0.37 1.10 0.56 0.29 0.98 634.8 578.0 694.2Brunei Darussalam F 35 0.363 0.178 0.641 0.63 0.35 1.04 0.42 0.22 0.73 640.2 587.9 693.2Brunei Darussalam F 45 0.297 0.144 0.535 0.61 0.33 1.03 0.29 0.15 0.49 646.8 589.9 703.5Brunei Darussalam F 55 0.286 0.139 0.509 0.67 0.37 1.12 0.22 0.11 0.39 662.4 611.5 715.9Brunei Darussalam F 65 0.287 0.138 0.510 0.75 0.40 1.26 0.18 0.09 0.31 679.9 622.7 734.8Brunei Darussalam F 75 0.280 0.137 0.499 0.80 0.43 1.32 0.17 0.09 0.30 697.3 643.3 751.1Brunei Darussalam F 90 0.270 0.132 0.482 0.84 0.46 1.36 0.16 0.08 0.29 717.3 659.8 777.4Brunei Darussalam M 25 0.354 0.177 0.626 0.61 0.34 1.02 0.65 0.35 1.12 579.9 529.0 633.7Brunei Darussalam M 35 0.295 0.153 0.514 0.57 0.32 0.94 0.50 0.27 0.83 584.7 537.7 634.8Brunei Darussalam M 45 0.242 0.123 0.420 0.54 0.30 0.89 0.35 0.19 0.59 590.5 540.0 643.7Brunei Darussalam M 55 0.232 0.118 0.403 0.59 0.33 0.97 0.27 0.15 0.46 604.6 558.7 656.0Brunei Darussalam M 65 0.231 0.116 0.404 0.67 0.37 1.09 0.22 0.12 0.37 620.6 565.6 679.4Brunei Darussalam M 75 0.227 0.114 0.392 0.73 0.40 1.20 0.19 0.11 0.34 638.1 585.8 694.6Brunei Darussalam M 90 0.220 0.112 0.384 0.80 0.45 1.31 0.18 0.10 0.30 659.0 608.1 715.8Bhutan F 25 0.012 0.006 0.022 0.24 0.14 0.40 0.43 0.22 0.78 432.7 342.3 543.9Bhutan F 35 0.010 0.005 0.017 0.24 0.13 0.39 0.32 0.17 0.56 435.8 342.3 542.4Bhutan F 45 0.008 0.004 0.014 0.23 0.13 0.38 0.22 0.12 0.39 439.6 344.3 551.4Bhutan F 55 0.008 0.004 0.014 0.25 0.14 0.41 0.17 0.09 0.30 450.1 354.7 560.5Bhutan F 65 0.008 0.004 0.014 0.28 0.16 0.46 0.14 0.08 0.25 462.1 363.9 576.8Bhutan F 75 0.008 0.004 0.014 0.30 0.17 0.49 0.13 0.07 0.23 474.6 375.1 595.0Bhutan F 90 0.007 0.004 0.013 0.33 0.19 0.54 0.12 0.06 0.21 489.0 383.4 612.3Bhutan M 25 0.010 0.005 0.017 0.23 0.13 0.38 0.45 0.24 0.78 393.8 304.7 502.4Bhutan M 35 0.008 0.004 0.014 0.22 0.12 0.36 0.34 0.18 0.58 396.3 309.7 506.0Bhutan M 45 0.007 0.003 0.012 0.21 0.12 0.36 0.23 0.12 0.40 399.8 313.7 511.5Bhutan M 55 0.006 0.003 0.011 0.23 0.13 0.39 0.19 0.10 0.31 409.8 319.8 522.6Bhutan M 65 0.006 0.003 0.011 0.26 0.15 0.44 0.15 0.08 0.26 421.3 327.4 537.9Bhutan M 75 0.006 0.003 0.011 0.28 0.16 0.47 0.14 0.07 0.23 432.6 337.6 555.1Bhutan M 90 0.006 0.003 0.011 0.30 0.17 0.51 0.13 0.07 0.21 445.3 347.7 569.8Botswana F 25 0.062 0.031 0.113 1.14 0.62 1.97 1.43 0.77 2.42 518.9 405.1 668.2Botswana F 35 0.051 0.026 0.090 1.07 0.58 1.87 1.07 0.60 1.79 522.6 407.5 669.6Botswana F 45 0.041 0.021 0.073 1.02 0.54 1.81 0.73 0.41 1.22 527.3 409.1 674.1Botswana F 55 0.040 0.020 0.070 1.12 0.60 1.97 0.58 0.33 0.95 539.4 419.3 690.4Botswana F 65 0.040 0.019 0.071 1.24 0.65 2.19 0.47 0.26 0.79 553.2 429.7 707.7Botswana F 75 0.039 0.019 0.070 1.35 0.72 2.35 0.43 0.24 0.71 567.8 440.6 726.4Botswana F 90 0.038 0.019 0.067 1.46 0.78 2.54 0.40 0.22 0.66 584.7 455.0 748.9Botswana M 25 0.051 0.025 0.090 1.00 0.56 1.68 1.58 0.84 2.71 474.7 364.9 604.6Botswana M 35 0.042 0.022 0.074 0.94 0.53 1.56 1.18 0.64 2.04 477.7 370.7 609.1Botswana M 45 0.034 0.017 0.063 0.89 0.50 1.49 0.81 0.42 1.40 481.7 374.8 617.0Botswana M 55 0.033 0.017 0.058 0.98 0.55 1.60 0.64 0.34 1.11 493.1 387.6 626.9Botswana M 65 0.033 0.017 0.060 1.09 0.61 1.81 0.52 0.28 0.92 506.1 393.6 641.1Botswana M 75 0.032 0.017 0.058 1.18 0.67 1.93 0.48 0.26 0.83 519.6 405.9 658.6Botswana M 90 0.031 0.016 0.054 1.28 0.73 2.10 0.44 0.24 0.75 535.0 416.1 681.3Central African Republic F 25 0.055 0.027 0.099 0.65 0.34 1.11 0.52 0.28 0.87 508.1 381.2 676.8

Country SexMidpoint of age range
Mean juice intake
(servings/day)
Juice, lower uncertainty interval
Juice, upper uncertainty interval
Mean milk intake
(servings/day)
Milk, lower uncertainty interval
Milk, upper uncertainty interval
Mean SSB intake (servings/day)
SSB, lower uncertainty interval
SSB, upper uncertainty interval
Mean calcium intake
(servings/day)
Calcium, lower
uncertainty interval
Calcium, upper
uncertainty interval
Central African Republic F 35 0.045 0.023 0.082 0.61 0.32 1.03 0.39 0.21 0.65 511.4 383.7 676.3Central African Republic F 45 0.037 0.018 0.068 0.58 0.30 1.01 0.27 0.14 0.45 516.0 386.0 690.4Central African Republic F 55 0.035 0.018 0.062 0.64 0.33 1.06 0.21 0.11 0.36 529.3 398.0 699.1Central African Republic F 65 0.035 0.018 0.062 0.71 0.37 1.20 0.17 0.09 0.28 544.4 407.1 719.1Central African Republic F 75 0.034 0.018 0.060 0.77 0.40 1.28 0.16 0.09 0.26 558.5 420.1 730.2Central African Republic F 90 0.033 0.017 0.057 0.83 0.44 1.36 0.14 0.08 0.24 574.4 432.3 752.5Central African Republic M 25 0.044 0.021 0.082 0.60 0.30 1.07 0.58 0.31 0.99 468.6 350.7 610.6Central African Republic M 35 0.036 0.018 0.065 0.56 0.28 0.95 0.43 0.24 0.74 472.1 357.6 609.9Central African Republic M 45 0.030 0.015 0.053 0.53 0.26 0.90 0.30 0.16 0.51 476.6 357.1 622.0Central African Republic M 55 0.029 0.014 0.052 0.58 0.29 0.98 0.23 0.13 0.40 488.6 369.9 633.9Central African Republic M 65 0.029 0.014 0.053 0.65 0.33 1.13 0.19 0.10 0.32 502.1 378.8 651.0Central African Republic M 75 0.028 0.014 0.051 0.70 0.36 1.22 0.17 0.09 0.29 514.9 389.6 667.7Central African Republic M 90 0.027 0.014 0.049 0.76 0.39 1.28 0.16 0.09 0.28 529.2 396.1 687.6Canada F 25 0.689 0.577 0.824 0.66 0.57 0.77 1.13 0.96 1.32 852.1 792.5 910.3Canada F 35 0.569 0.492 0.658 0.61 0.55 0.68 0.85 0.74 0.97 856.4 810.6 904.5Canada F 45 0.462 0.385 0.550 0.58 0.50 0.66 0.59 0.50 0.69 862.5 808.9 920.6Canada F 55 0.456 0.391 0.524 0.63 0.56 0.70 0.46 0.40 0.53 883.1 836.7 929.9Canada F 65 0.468 0.399 0.551 0.69 0.60 0.80 0.37 0.32 0.43 906.8 855.3 962.5Canada F 75 0.467 0.407 0.538 0.75 0.67 0.85 0.34 0.29 0.39 930.4 884.7 981.9Canada F 90 0.462 0.400 0.532 0.83 0.74 0.94 0.31 0.27 0.35 960.0 906.0 1014.1Canada M 25 0.585 0.492 0.690 0.62 0.54 0.72 1.29 1.09 1.51 780.9 728.5 833.7Canada M 35 0.488 0.426 0.560 0.58 0.52 0.65 0.98 0.86 1.12 784.4 740.4 829.3Canada M 45 0.402 0.334 0.473 0.54 0.47 0.62 0.69 0.59 0.81 789.7 739.0 843.5Canada M 55 0.394 0.343 0.450 0.59 0.52 0.66 0.54 0.47 0.63 808.4 764.4 854.9Canada M 65 0.400 0.340 0.468 0.65 0.57 0.74 0.43 0.37 0.50 830.1 779.8 889.2Canada M 75 0.395 0.343 0.456 0.71 0.63 0.79 0.38 0.33 0.44 852.6 806.3 904.9Canada M 90 0.384 0.330 0.442 0.78 0.69 0.88 0.34 0.30 0.39 879.9 832.6 927.9Switzerland F 25 0.846 0.645 1.103 0.88 0.49 1.52 0.48 0.33 0.66 912.4 705.9 1177.6Switzerland F 35 0.679 0.523 0.886 0.83 0.46 1.42 0.34 0.24 0.47 919.0 714.2 1175.1Switzerland F 45 0.530 0.402 0.695 0.79 0.43 1.35 0.21 0.15 0.30 927.2 722.2 1182.1Switzerland F 55 0.514 0.391 0.661 0.84 0.46 1.45 0.17 0.12 0.24 947.6 737.7 1208.4Switzerland F 65 0.524 0.394 0.676 0.91 0.51 1.61 0.15 0.10 0.20 970.9 752.2 1245.6Switzerland F 75 0.524 0.396 0.679 1.00 0.56 1.76 0.14 0.10 0.19 995.5 773.2 1275.6Switzerland F 90 0.520 0.395 0.688 1.12 0.62 1.94 0.13 0.09 0.17 1027.2 794.9 1316.9Switzerland M 25 0.671 0.504 0.871 0.82 0.46 1.40 0.56 0.39 0.79 843.8 647.3 1081.9Switzerland M 35 0.544 0.418 0.700 0.75 0.41 1.26 0.40 0.27 0.55 847.3 654.3 1079.3Switzerland M 45 0.429 0.327 0.561 0.69 0.38 1.16 0.24 0.17 0.35 852.4 651.8 1085.1Switzerland M 55 0.407 0.313 0.525 0.73 0.40 1.23 0.19 0.13 0.26 870.7 663.9 1108.3Switzerland M 65 0.405 0.305 0.530 0.80 0.44 1.37 0.16 0.11 0.22 892.1 682.3 1138.6Switzerland M 75 0.409 0.315 0.534 0.89 0.49 1.51 0.14 0.10 0.20 914.4 699.6 1157.9Switzerland M 90 0.416 0.319 0.553 1.00 0.55 1.67 0.13 0.09 0.19 941.9 724.0 1190.9Chile F 25 0.363 0.185 0.640 0.35 0.19 0.60 1.13 0.60 1.88 495.0 380.5 629.4Chile F 35 0.301 0.157 0.519 0.33 0.18 0.56 0.85 0.47 1.39 497.9 386.5 629.5Chile F 45 0.244 0.124 0.420 0.32 0.17 0.54 0.59 0.32 0.99 501.9 385.8 635.8Chile F 55 0.235 0.122 0.412 0.35 0.19 0.59 0.47 0.26 0.79 514.4 396.9 657.2Chile F 65 0.234 0.122 0.411 0.39 0.21 0.66 0.38 0.21 0.64 528.7 405.7 688.2Chile F 75 0.230 0.121 0.400 0.42 0.23 0.71 0.34 0.19 0.57 542.6 418.4 696.4Chile F 90 0.223 0.116 0.393 0.46 0.25 0.78 0.31 0.17 0.52 559.6 434.2 704.6Chile M 25 0.290 0.153 0.518 0.33 0.17 0.57 1.25 0.69 2.11 459.9 354.1 593.0Chile M 35 0.241 0.127 0.429 0.31 0.17 0.53 0.93 0.52 1.54 462.5 356.6 593.4Chile M 45 0.197 0.100 0.347 0.30 0.16 0.51 0.64 0.35 1.06 466.1 357.5 600.9Chile M 55 0.189 0.095 0.336 0.33 0.18 0.56 0.51 0.28 0.84 477.6 370.6 612.3Chile M 65 0.189 0.097 0.342 0.36 0.20 0.64 0.42 0.23 0.70 490.9 379.0 635.7Chile M 75 0.185 0.096 0.332 0.39 0.21 0.68 0.38 0.21 0.63 504.0 388.4 649.8Chile M 90 0.180 0.092 0.323 0.43 0.23 0.74 0.35 0.19 0.57 519.8 397.5 671.7China F 25 0.001 0.001 0.002 0.06 0.05 0.08 0.09 0.08 0.11 321.2 298.8 344.7China F 35 0.001 0.001 0.001 0.06 0.05 0.07 0.07 0.06 0.08 323.6 305.2 343.0China F 45 0.001 0.001 0.001 0.06 0.05 0.06 0.05 0.04 0.06 326.6 304.6 350.0China F 55 0.001 0.001 0.001 0.06 0.05 0.07 0.04 0.03 0.04 335.1 315.7 355.3China F 65 0.001 0.001 0.001 0.07 0.06 0.08 0.03 0.03 0.04 344.5 322.3 367.4China F 75 0.001 0.001 0.001 0.07 0.07 0.09 0.03 0.02 0.03 353.5 332.7 373.9China F 90 0.001 0.001 0.001 0.08 0.07 0.09 0.03 0.02 0.03 363.8 342.7 385.1China M 25 0.001 0.001 0.001 0.06 0.05 0.07 0.10 0.08 0.13 293.4 273.1 314.7China M 35 0.001 0.001 0.001 0.05 0.05 0.06 0.08 0.06 0.09 295.6 279.1 312.0China M 45 0.001 0.001 0.001 0.05 0.04 0.06 0.05 0.04 0.06 298.3 279.0 317.9China M 55 0.001 0.001 0.001 0.06 0.05 0.06 0.04 0.03 0.05 306.0 289.7 322.7China M 65 0.001 0.001 0.001 0.06 0.05 0.08 0.03 0.03 0.04 314.8 294.5 334.6China M 75 0.001 0.001 0.001 0.07 0.06 0.08 0.03 0.03 0.04 323.4 305.6 340.6China M 90 0.001 0.001 0.001 0.08 0.07 0.09 0.03 0.02 0.03 333.0 315.6 351.6Côte d'Ivoire F 25 0.055 0.025 0.101 0.15 0.08 0.24 0.55 0.30 0.94 396.8 307.7 500.6Côte d'Ivoire F 35 0.046 0.021 0.083 0.14 0.08 0.23 0.41 0.23 0.70 399.1 313.0 502.9Côte d'Ivoire F 45 0.037 0.017 0.068 0.13 0.07 0.22 0.28 0.15 0.49 402.2 313.9 508.4Côte d'Ivoire F 55 0.036 0.017 0.065 0.15 0.08 0.24 0.22 0.12 0.38 412.5 321.9 521.2Côte d'Ivoire F 65 0.035 0.017 0.066 0.16 0.09 0.27 0.18 0.10 0.31 424.2 328.2 539.7Côte d'Ivoire F 75 0.035 0.017 0.064 0.18 0.10 0.29 0.17 0.09 0.27 435.1 339.6 549.7Côte d'Ivoire F 90 0.034 0.016 0.062 0.19 0.10 0.32 0.15 0.09 0.25 447.3 350.0 563.0Côte d'Ivoire M 25 0.045 0.021 0.085 0.13 0.07 0.23 0.62 0.33 1.04 362.8 282.9 453.9Côte d'Ivoire M 35 0.037 0.018 0.070 0.13 0.07 0.21 0.46 0.25 0.77 365.2 282.4 457.9Côte d'Ivoire M 45 0.030 0.014 0.056 0.12 0.06 0.21 0.31 0.17 0.53 368.4 283.3 466.3Côte d'Ivoire M 55 0.029 0.014 0.054 0.13 0.07 0.22 0.25 0.13 0.41 377.3 292.3 475.3Côte d'Ivoire M 65 0.029 0.014 0.055 0.15 0.08 0.25 0.20 0.11 0.35 387.5 301.4 488.7Côte d'Ivoire M 75 0.029 0.014 0.053 0.16 0.09 0.27 0.19 0.10 0.31 397.5 311.7 500.2Côte d'Ivoire M 90 0.028 0.014 0.051 0.17 0.09 0.29 0.17 0.09 0.29 408.9 318.2 519.3Cameroon F 25 0.133 0.060 0.246 0.26 0.13 0.44 0.79 0.42 1.31 454.3 351.3 582.8Cameroon F 35 0.111 0.052 0.207 0.24 0.13 0.41 0.59 0.31 0.98 456.9 355.7 581.7Cameroon F 45 0.090 0.043 0.171 0.23 0.13 0.39 0.40 0.21 0.68 460.5 355.8 585.8Cameroon F 55 0.086 0.042 0.160 0.25 0.14 0.43 0.32 0.17 0.54 472.2 368.3 598.1Cameroon F 65 0.086 0.041 0.156 0.29 0.16 0.49 0.26 0.14 0.44 485.5 377.1 616.8Cameroon F 75 0.084 0.040 0.154 0.31 0.17 0.52 0.24 0.13 0.40 498.0 386.9 636.3Cameroon F 90 0.082 0.040 0.150 0.33 0.18 0.56 0.22 0.12 0.37 512.2 399.6 656.1Cameroon M 25 0.110 0.051 0.205 0.24 0.13 0.41 0.89 0.46 1.50 415.6 320.6 532.7Cameroon M 35 0.092 0.043 0.170 0.23 0.13 0.38 0.66 0.35 1.11 418.3 325.4 533.4Cameroon M 45 0.075 0.034 0.140 0.22 0.12 0.36 0.45 0.24 0.76 421.8 328.6 540.0Cameroon M 55 0.072 0.034 0.133 0.24 0.13 0.39 0.36 0.19 0.61 432.1 338.1 553.6Cameroon M 65 0.072 0.034 0.136 0.27 0.14 0.44 0.29 0.15 0.51 443.7 347.7 570.4Cameroon M 75 0.071 0.033 0.131 0.29 0.15 0.47 0.27 0.14 0.46 455.3 356.7 587.1Cameroon M 90 0.069 0.032 0.126 0.31 0.17 0.51 0.25 0.13 0.42 468.5 366.7 604.9Democratic Republic of the Congo F 25 0.029 0.013 0.052 0.12 0.07 0.21 0.40 0.21 0.66 347.2 263.5 443.4

Country SexMidpoint of age range
Mean juice intake
(servings/day)
Juice, lower uncertainty interval
Juice, upper uncertainty interval
Mean milk intake
(servings/day)
Milk, lower uncertainty interval
Milk, upper uncertainty interval
Mean SSB intake (servings/day)
SSB, lower uncertainty interval
SSB, upper uncertainty interval
Mean calcium intake
(servings/day)
Calcium, lower
uncertainty interval
Calcium, upper
uncertainty interval
Democratic Republic of the Congo F 35 0.024 0.012 0.042 0.12 0.07 0.20 0.30 0.16 0.48 349.6 264.0 445.4Democratic Republic of the Congo F 45 0.019 0.010 0.035 0.11 0.06 0.19 0.21 0.11 0.34 352.7 266.7 452.8Democratic Republic of the Congo F 55 0.019 0.009 0.033 0.12 0.07 0.20 0.16 0.09 0.26 361.9 276.4 459.3Democratic Republic of the Congo F 65 0.018 0.009 0.033 0.13 0.07 0.23 0.13 0.07 0.21 372.3 282.7 480.6Democratic Republic of the Congo F 75 0.018 0.009 0.032 0.14 0.08 0.24 0.12 0.07 0.19 381.9 290.7 489.7Democratic Republic of the Congo F 90 0.017 0.009 0.030 0.16 0.09 0.26 0.11 0.06 0.18 392.5 299.9 500.4Democratic Republic of the Congo M 25 0.023 0.011 0.043 0.11 0.06 0.19 0.45 0.24 0.77 317.3 244.7 401.6Democratic Republic of the Congo M 35 0.019 0.009 0.035 0.10 0.06 0.18 0.33 0.18 0.57 319.6 248.4 403.7Democratic Republic of the Congo M 45 0.016 0.007 0.029 0.10 0.05 0.17 0.23 0.12 0.39 322.6 250.0 409.9Democratic Republic of the Congo M 55 0.015 0.007 0.027 0.11 0.06 0.18 0.18 0.10 0.31 330.7 257.0 418.5Democratic Republic of the Congo M 65 0.015 0.007 0.028 0.12 0.07 0.21 0.15 0.08 0.25 340.0 258.9 434.2Democratic Republic of the Congo M 75 0.015 0.007 0.027 0.13 0.07 0.22 0.13 0.07 0.23 348.6 267.3 441.8Democratic Republic of the Congo M 90 0.014 0.007 0.026 0.14 0.08 0.24 0.12 0.07 0.21 358.1 277.1 447.8Congo F 25 0.265 0.130 0.491 0.54 0.28 0.94 1.14 0.58 1.99 491.0 371.0 647.9Congo F 35 0.221 0.110 0.396 0.51 0.27 0.84 0.86 0.44 1.46 494.3 378.2 648.2Congo F 45 0.180 0.085 0.329 0.48 0.25 0.81 0.59 0.30 1.04 498.8 376.9 654.4Congo F 55 0.173 0.084 0.308 0.53 0.28 0.88 0.47 0.24 0.80 511.6 388.8 660.9Congo F 65 0.172 0.084 0.310 0.59 0.31 1.01 0.38 0.20 0.65 526.2 400.6 681.3Congo F 75 0.168 0.084 0.299 0.64 0.33 1.07 0.35 0.18 0.60 539.8 413.2 700.3Congo F 90 0.162 0.082 0.289 0.69 0.36 1.13 0.32 0.17 0.55 555.3 424.7 720.5Congo M 25 0.214 0.105 0.401 0.49 0.26 0.86 1.29 0.68 2.25 448.1 336.5 586.9Congo M 35 0.177 0.090 0.322 0.46 0.25 0.77 0.96 0.51 1.67 451.1 344.1 585.9Congo M 45 0.145 0.071 0.263 0.44 0.23 0.76 0.65 0.34 1.16 455.2 345.3 595.4Congo M 55 0.139 0.069 0.250 0.48 0.26 0.81 0.52 0.28 0.90 466.7 355.3 605.4Congo M 65 0.139 0.067 0.259 0.54 0.29 0.93 0.42 0.22 0.75 479.9 359.9 626.9Congo M 75 0.136 0.066 0.250 0.58 0.32 1.02 0.38 0.20 0.67 492.1 373.0 638.6Congo M 90 0.132 0.066 0.235 0.63 0.34 1.10 0.36 0.19 0.62 505.8 381.1 659.5Colombia F 25 1.219 0.614 2.222 0.95 0.80 1.14 3.26 2.27 4.45 540.8 500.6 583.4Colombia F 35 1.009 0.514 1.827 0.90 0.77 1.05 2.54 1.84 3.40 544.8 508.8 579.4Colombia F 45 0.819 0.412 1.487 0.86 0.72 1.04 1.85 1.32 2.54 549.8 506.6 589.7Colombia F 55 0.787 0.401 1.422 0.94 0.80 1.08 1.48 1.07 1.98 563.5 525.5 598.8Colombia F 65 0.788 0.394 1.456 1.04 0.88 1.22 1.20 0.86 1.61 579.0 537.1 623.4Colombia F 75 0.771 0.388 1.416 1.13 0.97 1.30 1.07 0.77 1.44 593.5 554.4 634.4Colombia F 90 0.747 0.379 1.355 1.23 1.06 1.41 0.97 0.70 1.30 610.8 570.6 651.7Colombia M 25 1.011 0.490 1.892 0.87 0.72 1.01 3.55 2.55 4.76 495.0 457.0 535.5Colombia M 35 0.835 0.418 1.523 0.82 0.70 0.94 2.76 2.02 3.64 497.8 463.5 532.0Colombia M 45 0.677 0.321 1.253 0.78 0.66 0.92 2.02 1.44 2.73 501.8 461.9 541.6Colombia M 55 0.651 0.316 1.211 0.86 0.74 0.99 1.62 1.18 2.17 514.7 479.5 548.1Colombia M 65 0.653 0.316 1.220 0.95 0.81 1.12 1.32 0.93 1.79 529.5 490.6 569.7Colombia M 75 0.641 0.312 1.202 1.03 0.89 1.19 1.18 0.84 1.58 543.5 506.7 579.9Colombia M 90 0.624 0.300 1.195 1.12 0.96 1.32 1.07 0.79 1.45 559.7 523.4 597.0Comoros F 25 0.181 0.083 0.356 0.16 0.09 0.27 0.75 0.40 1.26 375.8 287.9 484.8Comoros F 35 0.150 0.069 0.291 0.15 0.08 0.26 0.56 0.31 0.93 378.0 290.5 483.1Comoros F 45 0.122 0.057 0.237 0.14 0.08 0.24 0.38 0.21 0.64 381.0 291.9 487.3Comoros F 55 0.117 0.055 0.226 0.16 0.08 0.26 0.30 0.17 0.49 390.7 302.0 501.7Comoros F 65 0.117 0.054 0.231 0.17 0.09 0.29 0.25 0.14 0.41 401.8 310.8 518.0Comoros F 75 0.115 0.053 0.228 0.19 0.10 0.32 0.22 0.13 0.37 412.2 317.4 529.8Comoros F 90 0.111 0.051 0.215 0.20 0.11 0.35 0.21 0.12 0.34 424.0 321.1 540.9Comoros M 25 0.146 0.067 0.275 0.15 0.08 0.23 0.82 0.45 1.37 341.8 264.6 438.0Comoros M 35 0.121 0.057 0.232 0.14 0.08 0.22 0.62 0.34 0.99 344.1 265.4 440.5Comoros M 45 0.098 0.045 0.190 0.13 0.07 0.21 0.42 0.23 0.69 347.1 267.2 445.4Comoros M 55 0.094 0.044 0.180 0.14 0.08 0.23 0.33 0.18 0.55 355.6 276.3 457.8Comoros M 65 0.094 0.044 0.179 0.16 0.09 0.26 0.27 0.15 0.45 365.3 285.2 471.1Comoros M 75 0.092 0.043 0.174 0.17 0.10 0.28 0.25 0.14 0.41 374.8 292.6 480.1Comoros M 90 0.089 0.042 0.163 0.18 0.11 0.30 0.23 0.12 0.38 385.4 299.5 492.3Cape Verde F 25 0.069 0.033 0.126 0.93 0.46 1.59 1.38 0.72 2.44 601.3 453.4 790.3Cape Verde F 35 0.057 0.028 0.104 0.87 0.43 1.48 1.03 0.55 1.78 604.7 456.4 788.2Cape Verde F 45 0.046 0.023 0.084 0.83 0.42 1.40 0.70 0.37 1.21 609.6 456.1 798.5Cape Verde F 55 0.045 0.022 0.081 0.91 0.48 1.53 0.56 0.30 0.95 624.9 470.8 816.2Cape Verde F 65 0.044 0.022 0.084 1.02 0.53 1.71 0.46 0.25 0.81 642.8 483.1 842.0Cape Verde F 75 0.044 0.022 0.082 1.11 0.57 1.84 0.42 0.22 0.73 659.4 500.4 858.3Cape Verde F 90 0.042 0.021 0.078 1.20 0.62 1.97 0.38 0.21 0.67 678.1 515.0 887.4Cape Verde M 25 0.055 0.027 0.105 0.86 0.44 1.52 1.58 0.80 2.82 550.9 416.8 731.5Cape Verde M 35 0.046 0.022 0.083 0.80 0.42 1.41 1.18 0.62 2.06 554.4 418.2 728.4Cape Verde M 45 0.037 0.018 0.067 0.76 0.39 1.34 0.80 0.41 1.43 559.1 418.0 730.8Cape Verde M 55 0.036 0.018 0.065 0.84 0.43 1.44 0.64 0.33 1.14 572.5 432.4 747.0Cape Verde M 65 0.036 0.017 0.068 0.93 0.48 1.64 0.52 0.26 0.95 588.3 449.9 774.0Cape Verde M 75 0.035 0.017 0.065 1.01 0.53 1.76 0.47 0.24 0.86 603.8 463.0 796.6Cape Verde M 90 0.034 0.017 0.062 1.09 0.56 1.89 0.44 0.22 0.78 620.8 475.9 818.2Costa Rica F 25 0.714 0.355 1.262 1.47 0.82 2.50 3.31 1.80 5.63 775.0 590.5 978.1Costa Rica F 35 0.591 0.293 1.018 1.39 0.78 2.27 2.58 1.41 4.40 780.7 595.0 982.7Costa Rica F 45 0.479 0.232 0.837 1.33 0.72 2.17 1.89 1.03 3.24 788.1 598.0 1004.1Costa Rica F 55 0.461 0.228 0.799 1.45 0.80 2.32 1.51 0.82 2.54 807.7 617.2 1032.4Costa Rica F 65 0.462 0.232 0.797 1.61 0.90 2.61 1.21 0.66 2.03 830.0 637.4 1060.1Costa Rica F 75 0.452 0.231 0.777 1.74 0.98 2.85 1.09 0.60 1.80 850.8 656.3 1089.7Costa Rica F 90 0.436 0.229 0.751 1.90 1.06 3.16 0.98 0.54 1.61 875.9 673.2 1113.3Costa Rica M 25 0.611 0.303 1.060 1.31 0.74 2.21 3.59 1.94 5.84 713.7 551.8 911.2Costa Rica M 35 0.505 0.250 0.872 1.24 0.70 2.06 2.79 1.55 4.45 717.8 556.7 925.0Costa Rica M 45 0.409 0.199 0.713 1.18 0.65 1.96 2.04 1.11 3.36 723.5 558.0 926.8Costa Rica M 55 0.394 0.194 0.685 1.30 0.72 2.16 1.64 0.90 2.67 742.1 573.0 947.3Costa Rica M 65 0.395 0.197 0.700 1.45 0.79 2.45 1.33 0.74 2.20 763.4 586.6 965.9Costa Rica M 75 0.388 0.196 0.682 1.57 0.88 2.68 1.19 0.67 1.96 783.5 606.1 995.5Costa Rica M 90 0.376 0.190 0.650 1.70 0.95 2.90 1.08 0.61 1.75 807.5 631.2 1031.0Cuba F 25 0.444 0.216 0.780 0.56 0.30 0.92 4.15 2.33 6.88 778.3 606.4 1004.5Cuba F 35 0.370 0.183 0.646 0.52 0.29 0.86 3.08 1.76 5.14 782.7 607.4 1003.6Cuba F 45 0.304 0.153 0.522 0.50 0.27 0.83 2.10 1.17 3.56 788.7 605.1 1014.6

Country SexMidpoint of age range
Mean juice intake
(servings/day)
Juice, lower uncertainty interval
Juice, upper uncertainty interval
Mean milk intake
(servings/day)
Milk, lower uncertainty interval
Milk, upper uncertainty interval
Mean SSB intake (servings/day)
SSB, lower uncertainty interval
SSB, upper uncertainty interval
Mean calcium intake
(servings/day)
Calcium, lower
uncertainty interval
Calcium, upper
uncertainty interval
Cuba F 55 0.290 0.146 0.496 0.55 0.30 0.91 1.68 0.94 2.85 808.0 627.4 1029.1Cuba F 65 0.286 0.142 0.503 0.61 0.33 1.02 1.40 0.78 2.38 830.2 644.7 1059.7Cuba F 75 0.280 0.140 0.491 0.66 0.36 1.10 1.28 0.70 2.14 852.1 662.9 1087.0Cuba F 90 0.272 0.140 0.479 0.72 0.40 1.18 1.17 0.63 1.96 879.0 681.9 1120.4Cuba M 25 0.371 0.183 0.658 0.52 0.30 0.87 4.45 2.39 7.76 716.3 556.7 914.7Cuba M 35 0.309 0.158 0.537 0.48 0.28 0.80 3.29 1.76 5.64 720.5 563.4 917.1Cuba M 45 0.253 0.130 0.439 0.46 0.26 0.77 2.22 1.19 3.91 726.1 567.3 929.7Cuba M 55 0.243 0.127 0.426 0.50 0.29 0.82 1.78 0.96 3.05 743.6 582.8 945.4Cuba M 65 0.243 0.123 0.439 0.56 0.32 0.90 1.48 0.78 2.50 763.8 599.1 980.7Cuba M 75 0.237 0.121 0.424 0.60 0.35 0.98 1.35 0.73 2.28 784.2 617.5 1005.9Cuba M 90 0.227 0.117 0.397 0.65 0.38 1.08 1.24 0.67 2.08 808.9 639.2 1044.4Cyprus F 25 0.433 0.263 0.663 0.77 0.54 1.06 0.80 0.51 1.22 906.2 706.6 1160.5Cyprus F 35 0.348 0.214 0.536 0.73 0.52 1.00 0.57 0.37 0.86 912.9 717.2 1170.9Cyprus F 45 0.271 0.165 0.418 0.69 0.49 0.95 0.36 0.23 0.54 921.2 720.6 1183.0Cyprus F 55 0.263 0.163 0.400 0.74 0.53 1.01 0.29 0.18 0.44 941.4 741.6 1208.3Cyprus F 65 0.268 0.165 0.411 0.80 0.56 1.11 0.25 0.16 0.38 964.3 753.5 1236.5Cyprus F 75 0.268 0.164 0.410 0.88 0.63 1.22 0.23 0.15 0.35 988.8 772.3 1268.6Cyprus F 90 0.266 0.161 0.408 0.98 0.70 1.37 0.21 0.13 0.32 1018.9 795.4 1300.2Cyprus M 25 0.352 0.220 0.529 0.74 0.52 1.04 0.93 0.60 1.37 838.3 639.4 1065.3Cyprus M 35 0.285 0.182 0.426 0.68 0.48 0.94 0.66 0.43 0.96 841.9 644.7 1073.5Cyprus M 45 0.225 0.142 0.338 0.62 0.44 0.86 0.40 0.26 0.59 847.3 648.7 1082.7Cyprus M 55 0.213 0.136 0.321 0.66 0.47 0.91 0.31 0.20 0.46 865.2 662.3 1107.0Cyprus M 65 0.212 0.131 0.317 0.72 0.51 1.01 0.26 0.17 0.39 886.2 677.3 1138.1Cyprus M 75 0.214 0.135 0.321 0.80 0.57 1.10 0.24 0.15 0.35 908.5 696.5 1164.3Cyprus M 90 0.218 0.139 0.323 0.90 0.65 1.22 0.22 0.14 0.32 935.8 713.4 1201.0Czech Republic F 25 0.135 0.083 0.207 0.38 0.25 0.56 0.47 0.30 0.70 597.0 471.3 755.3Czech Republic F 35 0.112 0.071 0.169 0.36 0.24 0.53 0.35 0.23 0.52 599.8 473.7 755.1Czech Republic F 45 0.091 0.057 0.139 0.35 0.23 0.51 0.24 0.15 0.36 604.0 474.5 763.9Czech Republic F 55 0.086 0.054 0.130 0.39 0.26 0.56 0.19 0.12 0.29 619.4 485.3 775.8Czech Republic F 65 0.084 0.052 0.126 0.44 0.28 0.63 0.16 0.10 0.24 637.0 500.0 800.5Czech Republic F 75 0.082 0.051 0.123 0.47 0.31 0.69 0.15 0.09 0.22 654.0 514.9 823.0Czech Republic F 90 0.081 0.049 0.120 0.52 0.34 0.76 0.14 0.09 0.20 674.6 535.9 844.7Czech Republic M 25 0.108 0.068 0.167 0.36 0.23 0.52 0.55 0.36 0.82 555.9 427.5 715.5Czech Republic M 35 0.089 0.058 0.134 0.33 0.22 0.49 0.41 0.27 0.60 556.7 430.9 714.8Czech Republic M 45 0.072 0.047 0.110 0.32 0.21 0.47 0.28 0.18 0.41 558.9 429.6 721.1Czech Republic M 55 0.069 0.045 0.103 0.36 0.23 0.52 0.22 0.14 0.32 572.4 438.9 737.7Czech Republic M 65 0.068 0.044 0.103 0.40 0.26 0.59 0.18 0.11 0.26 588.3 447.5 767.5Czech Republic M 75 0.068 0.045 0.102 0.44 0.29 0.64 0.16 0.10 0.24 604.8 461.2 784.7Czech Republic M 90 0.067 0.043 0.101 0.48 0.31 0.70 0.15 0.10 0.22 624.6 479.1 805.9Germany F 25 0.964 0.765 1.174 0.61 0.51 0.74 0.83 0.66 1.02 1001.8 938.3 1069.1Germany F 35 0.774 0.629 0.930 0.58 0.48 0.69 0.59 0.48 0.72 1009.2 952.9 1068.2Germany F 45 0.603 0.486 0.738 0.55 0.45 0.66 0.37 0.29 0.47 1018.3 950.2 1089.5Germany F 55 0.585 0.480 0.709 0.59 0.49 0.70 0.30 0.24 0.37 1040.6 980.8 1102.9Germany F 65 0.597 0.485 0.732 0.64 0.53 0.76 0.26 0.21 0.32 1066.3 1001.4 1135.5Germany F 75 0.597 0.487 0.722 0.70 0.58 0.83 0.24 0.19 0.29 1093.2 1030.3 1156.6Germany F 90 0.593 0.480 0.719 0.78 0.65 0.94 0.22 0.17 0.27 1127.5 1062.5 1192.5Germany M 25 0.778 0.630 0.951 0.58 0.48 0.70 0.97 0.78 1.21 924.0 859.9 992.9Germany M 35 0.630 0.521 0.758 0.53 0.44 0.62 0.68 0.55 0.85 927.8 873.5 983.3Germany M 45 0.497 0.403 0.607 0.49 0.40 0.58 0.42 0.33 0.53 933.5 874.3 996.3Germany M 55 0.472 0.387 0.574 0.52 0.43 0.62 0.33 0.26 0.40 953.4 901.9 1009.4Germany M 65 0.470 0.379 0.582 0.57 0.47 0.69 0.27 0.21 0.34 976.9 916.8 1045.6Germany M 75 0.474 0.389 0.581 0.63 0.53 0.75 0.25 0.20 0.31 1001.3 944.4 1063.3Germany M 90 0.481 0.396 0.582 0.70 0.59 0.84 0.23 0.19 0.28 1030.8 972.5 1091.6Djibouti F 25 0.029 0.013 0.054 0.46 0.25 0.81 1.47 0.75 2.62 478.1 366.4 610.0Djibouti F 35 0.024 0.011 0.045 0.43 0.24 0.76 1.10 0.56 1.92 480.9 372.4 609.8Djibouti F 45 0.020 0.009 0.037 0.41 0.22 0.72 0.75 0.37 1.34 484.8 377.2 618.7Djibouti F 55 0.019 0.009 0.035 0.45 0.25 0.78 0.60 0.30 1.06 497.1 387.3 628.9Djibouti F 65 0.019 0.009 0.035 0.51 0.28 0.88 0.49 0.25 0.86 511.2 392.8 645.0Djibouti F 75 0.018 0.009 0.035 0.55 0.30 0.93 0.44 0.23 0.78 524.4 403.4 662.0Djibouti F 90 0.018 0.009 0.034 0.59 0.32 1.00 0.41 0.21 0.73 539.3 415.3 679.1Djibouti M 25 0.024 0.010 0.045 0.43 0.23 0.75 1.58 0.81 2.75 434.6 333.9 562.8Djibouti M 35 0.020 0.009 0.037 0.40 0.21 0.68 1.18 0.61 2.07 437.5 339.6 563.0Djibouti M 45 0.016 0.007 0.031 0.38 0.20 0.64 0.81 0.41 1.45 441.3 338.0 568.2Djibouti M 55 0.015 0.007 0.030 0.42 0.22 0.71 0.64 0.33 1.14 452.2 350.4 578.6Djibouti M 65 0.015 0.007 0.030 0.47 0.25 0.80 0.53 0.26 0.94 464.6 357.9 596.1Djibouti M 75 0.015 0.007 0.029 0.50 0.27 0.86 0.48 0.24 0.86 476.6 368.1 612.7Djibouti M 90 0.014 0.007 0.027 0.54 0.29 0.93 0.44 0.23 0.77 489.8 379.3 629.4Dominica F 25 0.654 0.322 1.194 0.98 0.51 1.67 3.36 1.79 5.69 887.1 681.2 1128.4Dominica F 35 0.546 0.266 0.991 0.92 0.48 1.51 2.50 1.34 4.18 892.2 687.3 1137.4Dominica F 45 0.449 0.220 0.819 0.87 0.47 1.45 1.70 0.90 2.89 899.2 684.4 1142.8Dominica F 55 0.428 0.210 0.761 0.95 0.52 1.56 1.36 0.74 2.30 921.1 704.3 1165.5Dominica F 65 0.422 0.210 0.777 1.06 0.57 1.76 1.13 0.61 1.92 946.4 723.2 1199.8Dominica F 75 0.413 0.206 0.752 1.15 0.63 1.90 1.03 0.57 1.76 971.4 741.8 1228.1Dominica F 90 0.401 0.207 0.720 1.25 0.68 2.07 0.95 0.53 1.62 1001.6 767.7 1264.8Dominica M 25 0.534 0.273 0.940 0.92 0.50 1.58 3.66 2.00 6.19 814.6 633.6 1036.8Dominica M 35 0.444 0.223 0.791 0.86 0.47 1.47 2.71 1.51 4.56 819.3 641.8 1033.9Dominica M 45 0.363 0.182 0.641 0.81 0.45 1.41 1.82 1.01 3.07 825.7 644.2 1040.1Dominica M 55 0.349 0.180 0.622 0.89 0.50 1.51 1.46 0.81 2.46 845.6 662.4 1067.3Dominica M 65 0.348 0.178 0.616 0.99 0.55 1.68 1.22 0.67 2.13 868.7 677.8 1099.5Dominica M 75 0.339 0.173 0.603 1.07 0.60 1.79 1.11 0.62 1.91 891.8 691.2 1128.2Dominica M 90 0.326 0.163 0.575 1.16 0.65 1.94 1.02 0.57 1.71 919.7 719.2 1162.3Denmark F 25 0.569 0.288 0.990 0.75 0.42 1.28 0.99 0.55 1.61 959.6 885.4 1026.0Denmark F 35 0.457 0.232 0.791 0.71 0.40 1.21 0.71 0.39 1.15 966.7 900.5 1032.8Denmark F 45 0.357 0.180 0.615 0.68 0.39 1.16 0.45 0.25 0.73 975.3 902.4 1057.4Denmark F 55 0.346 0.176 0.593 0.72 0.41 1.22 0.36 0.19 0.58 996.8 930.1 1068.5Denmark F 65 0.352 0.181 0.602 0.78 0.44 1.32 0.31 0.17 0.50 1021.2 949.4 1100.1Denmark F 75 0.352 0.180 0.604 0.86 0.48 1.45 0.28 0.15 0.46 1047.0 978.2 1119.2Denmark F 90 0.350 0.177 0.616 0.96 0.53 1.63 0.26 0.14 0.42 1080.1 1008.2 1155.8Denmark M 25 0.455 0.234 0.784 0.72 0.39 1.19 1.15 0.64 1.87 881.4 814.1 954.2Denmark M 35 0.368 0.189 0.645 0.65 0.36 1.09 0.81 0.45 1.32 885.0 823.5 951.4Denmark M 45 0.291 0.145 0.523 0.60 0.33 1.03 0.50 0.27 0.83 890.4 820.3 962.4Denmark M 55 0.276 0.137 0.486 0.64 0.35 1.08 0.39 0.21 0.64 909.5 848.7 975.0Denmark M 65 0.274 0.137 0.486 0.70 0.39 1.19 0.32 0.18 0.52 931.7 860.4 1004.1Denmark M 75 0.277 0.139 0.486 0.78 0.42 1.31 0.29 0.17 0.48 955.0 889.1 1024.1Denmark M 90 0.281 0.144 0.494 0.87 0.47 1.49 0.27 0.15 0.45 983.8 917.1 1059.7Dominican Republic F 25 0.710 0.350 1.311 0.58 0.32 1.00 3.76 2.08 6.29 786.7 602.5 1008.1Dominican Republic F 35 0.594 0.299 1.095 0.55 0.31 0.92 2.80 1.57 4.66 791.2 608.4 1021.9Dominican Republic F 45 0.489 0.244 0.917 0.52 0.29 0.86 1.90 1.06 3.13 797.3 613.4 1029.3Dominican Republic F 55 0.466 0.235 0.874 0.57 0.32 0.95 1.52 0.86 2.47 816.8 627.6 1052.7

Country SexMidpoint of age range
Mean juice intake
(servings/day)
Juice, lower uncertainty interval
Juice, upper uncertainty interval
Mean milk intake
(servings/day)
Milk, lower uncertainty interval
Milk, upper uncertainty interval
Mean SSB intake (servings/day)
SSB, lower uncertainty interval
SSB, upper uncertainty interval
Mean calcium intake
(servings/day)
Calcium, lower
uncertainty interval
Calcium, upper
uncertainty interval
Dominican Republic F 65 0.460 0.229 0.847 0.63 0.35 1.07 1.27 0.74 2.07 839.2 640.7 1079.7Dominican Republic F 75 0.450 0.222 0.828 0.69 0.38 1.17 1.16 0.67 1.91 861.5 668.3 1102.3Dominican Republic F 90 0.437 0.218 0.807 0.75 0.42 1.27 1.06 0.60 1.78 888.2 689.2 1141.3Dominican Republic M 25 0.569 0.284 0.994 0.54 0.30 0.91 4.10 2.20 6.94 714.4 553.2 919.6Dominican Republic M 35 0.474 0.238 0.831 0.50 0.29 0.84 3.04 1.66 5.05 718.5 559.7 916.7Dominican Republic M 45 0.388 0.193 0.689 0.48 0.27 0.82 2.05 1.11 3.37 724.1 561.7 925.8Dominican Republic M 55 0.372 0.187 0.654 0.52 0.30 0.88 1.64 0.91 2.67 741.5 577.9 936.5Dominican Republic M 65 0.371 0.183 0.647 0.58 0.33 0.98 1.37 0.76 2.25 761.7 589.2 962.4Dominican Republic M 75 0.362 0.179 0.632 0.63 0.36 1.06 1.25 0.69 2.04 782.1 605.0 986.2Dominican Republic M 90 0.348 0.177 0.611 0.68 0.39 1.14 1.15 0.62 1.86 806.6 629.2 1017.1Algeria F 25 0.204 0.103 0.370 1.01 0.73 1.38 0.71 0.37 1.26 674.2 517.6 862.3Algeria F 35 0.171 0.087 0.307 0.96 0.69 1.29 0.55 0.29 0.96 678.7 529.1 866.5Algeria F 45 0.140 0.071 0.258 0.92 0.66 1.25 0.39 0.20 0.68 684.7 533.7 884.9Algeria F 55 0.134 0.070 0.240 1.01 0.73 1.35 0.32 0.17 0.55 701.9 545.5 906.2Algeria F 65 0.134 0.069 0.236 1.12 0.81 1.51 0.27 0.14 0.47 721.5 560.0 929.2Algeria F 75 0.131 0.068 0.232 1.21 0.88 1.62 0.24 0.13 0.42 740.0 575.7 948.6Algeria F 90 0.128 0.065 0.225 1.31 0.95 1.76 0.22 0.12 0.38 761.1 590.2 979.7Algeria M 25 0.167 0.084 0.304 0.92 0.67 1.24 0.81 0.44 1.37 613.6 461.6 784.1Algeria M 35 0.139 0.070 0.257 0.86 0.65 1.15 0.61 0.33 1.00 617.4 467.6 784.4Algeria M 45 0.114 0.056 0.211 0.82 0.60 1.11 0.42 0.23 0.70 622.5 470.5 804.6Algeria M 55 0.110 0.056 0.205 0.90 0.67 1.20 0.34 0.19 0.56 637.9 479.8 816.1Algeria M 65 0.110 0.054 0.207 1.01 0.73 1.36 0.28 0.15 0.47 655.6 487.9 838.5Algeria M 75 0.107 0.052 0.203 1.10 0.81 1.47 0.26 0.14 0.43 672.2 503.5 856.3Algeria M 90 0.103 0.050 0.194 1.20 0.90 1.61 0.24 0.13 0.40 690.4 524.1 880.3Ecuador F 25 0.633 0.309 1.154 0.74 0.38 1.26 1.34 0.69 2.34 696.2 525.6 910.2Ecuador F 35 0.526 0.258 0.953 0.69 0.36 1.17 1.00 0.52 1.71 700.8 535.5 907.1Ecuador F 45 0.429 0.208 0.791 0.65 0.33 1.13 0.68 0.35 1.17 706.9 537.7 910.3Ecuador F 55 0.412 0.204 0.739 0.71 0.37 1.22 0.54 0.28 0.92 725.0 557.6 930.2Ecuador F 65 0.411 0.201 0.765 0.80 0.40 1.37 0.44 0.24 0.77 745.6 570.8 962.6Ecuador F 75 0.403 0.202 0.740 0.86 0.45 1.48 0.40 0.22 0.69 764.6 591.4 977.2Ecuador F 90 0.391 0.196 0.697 0.94 0.49 1.63 0.37 0.20 0.63 786.9 610.5 1014.8Ecuador M 25 0.516 0.250 0.962 0.69 0.36 1.15 1.45 0.78 2.43 640.3 499.2 822.2Ecuador M 35 0.428 0.210 0.787 0.64 0.35 1.08 1.08 0.59 1.79 644.0 506.2 821.8Ecuador M 45 0.347 0.164 0.675 0.61 0.33 1.05 0.73 0.38 1.23 649.1 506.9 836.2Ecuador M 55 0.335 0.162 0.619 0.67 0.36 1.15 0.58 0.32 0.96 664.9 522.6 843.4Ecuador M 65 0.337 0.161 0.643 0.75 0.41 1.26 0.48 0.26 0.79 683.0 533.0 873.4Ecuador M 75 0.329 0.157 0.612 0.81 0.45 1.37 0.44 0.24 0.72 700.9 551.3 894.0Ecuador M 90 0.317 0.154 0.574 0.88 0.48 1.49 0.40 0.22 0.66 722.2 563.5 931.7Egypt F 25 0.197 0.098 0.344 0.57 0.39 0.78 0.60 0.33 1.04 586.5 455.6 752.1Egypt F 35 0.164 0.083 0.283 0.54 0.38 0.73 0.46 0.25 0.78 590.6 460.1 752.8Egypt F 45 0.135 0.067 0.238 0.52 0.36 0.71 0.33 0.17 0.56 596.0 462.4 764.2Egypt F 55 0.129 0.065 0.225 0.57 0.40 0.77 0.27 0.14 0.45 610.8 471.2 786.0Egypt F 65 0.129 0.065 0.222 0.63 0.44 0.87 0.22 0.12 0.38 627.6 481.6 811.7Egypt F 75 0.127 0.064 0.215 0.69 0.47 0.93 0.20 0.11 0.35 643.7 499.5 830.7Egypt F 90 0.123 0.061 0.209 0.74 0.51 1.02 0.18 0.10 0.31 661.9 517.3 848.7Egypt M 25 0.166 0.084 0.301 0.52 0.36 0.71 0.66 0.37 1.12 537.6 416.9 689.2Egypt M 35 0.139 0.070 0.247 0.49 0.35 0.67 0.49 0.28 0.83 540.9 421.3 682.8Egypt M 45 0.113 0.056 0.202 0.47 0.33 0.65 0.34 0.19 0.56 545.4 423.6 693.4Egypt M 55 0.109 0.055 0.190 0.51 0.36 0.71 0.28 0.15 0.46 558.8 434.2 706.9Egypt M 65 0.109 0.055 0.194 0.57 0.39 0.80 0.23 0.13 0.40 574.2 444.5 731.3Egypt M 75 0.106 0.054 0.188 0.62 0.43 0.87 0.21 0.12 0.36 588.7 457.2 742.5Egypt M 90 0.102 0.051 0.181 0.68 0.47 0.95 0.20 0.11 0.33 604.9 471.6 761.8Eritrea F 25 0.000 0.000 0.000 0.19 0.10 0.32 0.49 0.26 0.81 388.1 298.5 493.8Eritrea F 35 0.000 0.000 0.000 0.18 0.10 0.30 0.37 0.19 0.60 390.3 298.2 489.7Eritrea F 45 0.000 0.000 0.000 0.17 0.09 0.29 0.25 0.13 0.43 393.5 297.3 496.7Eritrea F 55 0.000 0.000 0.000 0.18 0.10 0.32 0.20 0.11 0.33 403.6 307.0 509.4Eritrea F 65 0.000 0.000 0.000 0.20 0.11 0.36 0.16 0.09 0.27 415.0 317.1 526.4Eritrea F 75 0.000 0.000 0.000 0.22 0.12 0.38 0.15 0.08 0.24 425.7 325.5 536.6Eritrea F 90 0.000 0.000 0.000 0.24 0.13 0.41 0.14 0.07 0.22 438.1 332.7 550.3Eritrea M 25 0.000 0.000 0.000 0.17 0.10 0.29 0.54 0.29 0.92 353.6 278.1 451.0Eritrea M 35 0.000 0.000 0.000 0.16 0.09 0.27 0.41 0.22 0.69 356.0 280.3 453.1Eritrea M 45 0.000 0.000 0.000 0.15 0.08 0.26 0.28 0.15 0.48 359.1 280.2 457.5Eritrea M 55 0.000 0.000 0.000 0.17 0.09 0.29 0.22 0.12 0.37 367.9 290.6 468.6Eritrea M 65 0.000 0.000 0.000 0.19 0.10 0.32 0.18 0.10 0.31 378.0 297.2 484.9Eritrea M 75 0.000 0.000 0.000 0.20 0.11 0.35 0.16 0.09 0.28 387.7 306.7 495.9Eritrea M 90 0.000 0.000 0.000 0.22 0.12 0.37 0.15 0.08 0.25 398.7 314.8 509.3Spain F 25 0.157 0.089 0.251 0.95 0.71 1.23 0.53 0.34 0.75 877.5 804.6 955.9Spain F 35 0.127 0.072 0.202 0.89 0.68 1.14 0.38 0.24 0.54 883.9 813.3 960.6Spain F 45 0.099 0.057 0.159 0.85 0.65 1.11 0.24 0.16 0.35 891.8 812.3 973.7Spain F 55 0.096 0.055 0.153 0.91 0.69 1.16 0.19 0.13 0.27 911.4 835.7 988.8Spain F 65 0.098 0.056 0.160 0.99 0.74 1.27 0.16 0.10 0.24 933.9 848.3 1021.7Spain F 75 0.098 0.056 0.158 1.08 0.82 1.40 0.15 0.10 0.22 957.6 880.8 1044.2Spain F 90 0.097 0.056 0.156 1.21 0.91 1.57 0.14 0.09 0.20 987.3 910.9 1069.4Spain M 25 0.125 0.074 0.200 0.90 0.67 1.16 0.63 0.40 0.94 808.1 737.1 878.7Spain M 35 0.101 0.059 0.160 0.82 0.63 1.04 0.45 0.29 0.67 811.4 747.2 877.9Spain M 45 0.080 0.046 0.128 0.75 0.57 0.95 0.27 0.18 0.42 816.3 750.5 890.4Spain M 55 0.076 0.045 0.120 0.80 0.61 1.02 0.21 0.14 0.32 833.8 773.3 901.1Spain M 65 0.075 0.045 0.119 0.88 0.66 1.14 0.18 0.11 0.26 854.2 785.9 927.8Spain M 75 0.076 0.045 0.122 0.97 0.74 1.24 0.16 0.10 0.24 875.8 807.6 948.1Spain M 90 0.077 0.045 0.124 1.09 0.83 1.39 0.15 0.10 0.23 901.9 829.8 979.1Estonia F 25 0.266 0.133 0.504 0.94 0.75 1.14 0.79 0.42 1.31 673.1 618.5 732.3Estonia F 35 0.220 0.110 0.419 0.89 0.73 1.07 0.59 0.32 0.96 678.7 630.5 729.7Estonia F 45 0.177 0.085 0.339 0.86 0.70 1.06 0.40 0.22 0.68 685.6 632.6 747.0Estonia F 55 0.171 0.083 0.323 0.95 0.78 1.14 0.32 0.18 0.53 701.3 653.3 756.1Estonia F 65 0.171 0.084 0.337 1.06 0.85 1.28 0.26 0.14 0.43 719.2 665.1 779.1Estonia F 75 0.167 0.084 0.324 1.14 0.93 1.37 0.24 0.13 0.39 737.5 687.9 792.3Estonia F 90 0.162 0.082 0.306 1.23 1.01 1.50 0.22 0.12 0.36 760.0 706.5 820.0Estonia M 25 0.213 0.107 0.374 0.86 0.69 1.05 0.87 0.47 1.43 615.0 571.6 666.5Estonia M 35 0.176 0.093 0.302 0.81 0.66 0.97 0.65 0.36 1.06 618.0 577.1 663.1Estonia M 45 0.142 0.074 0.248 0.78 0.63 0.96 0.44 0.24 0.73 622.5 575.1 672.3Estonia M 55 0.136 0.072 0.234 0.88 0.72 1.06 0.35 0.19 0.57 639.0 594.5 687.4Estonia M 65 0.136 0.071 0.239 1.00 0.81 1.22 0.29 0.16 0.48 658.1 608.4 711.4Estonia M 75 0.134 0.070 0.233 1.07 0.88 1.28 0.26 0.14 0.43 675.8 631.1 726.0Estonia M 90 0.129 0.069 0.227 1.13 0.92 1.35 0.24 0.14 0.39 696.0 652.6 747.4Ethiopia F 25 0.002 0.001 0.004 0.20 0.11 0.34 0.34 0.19 0.58 394.4 296.4 507.2Ethiopia F 35 0.002 0.001 0.003 0.19 0.11 0.32 0.26 0.14 0.43 396.8 297.1 508.8Ethiopia F 45 0.001 0.001 0.002 0.18 0.10 0.31 0.17 0.10 0.30 400.0 297.2 516.4Ethiopia F 55 0.001 0.001 0.002 0.20 0.11 0.34 0.14 0.08 0.24 410.2 306.8 525.6Ethiopia F 65 0.001 0.001 0.002 0.22 0.12 0.37 0.11 0.06 0.19 421.8 317.8 541.0

Country SexMidpoint of age range
Mean juice intake
(servings/day)
Juice, lower uncertainty interval
Juice, upper uncertainty interval
Mean milk intake
(servings/day)
Milk, lower uncertainty interval
Milk, upper uncertainty interval
Mean SSB intake (servings/day)
SSB, lower uncertainty interval
SSB, upper uncertainty interval
Mean calcium intake
(servings/day)
Calcium, lower
uncertainty interval
Calcium, upper
uncertainty interval
Ethiopia F 75 0.001 0.001 0.002 0.24 0.13 0.40 0.10 0.06 0.17 432.7 328.4 553.9Ethiopia F 90 0.001 0.001 0.002 0.26 0.15 0.43 0.10 0.05 0.16 445.0 336.0 569.8Ethiopia M 25 0.001 0.001 0.003 0.18 0.10 0.30 0.38 0.20 0.64 361.8 276.0 470.6Ethiopia M 35 0.001 0.001 0.002 0.17 0.09 0.28 0.28 0.15 0.47 364.2 277.7 468.8Ethiopia M 45 0.001 0.000 0.002 0.16 0.09 0.26 0.19 0.10 0.32 367.4 277.8 475.2Ethiopia M 55 0.001 0.000 0.002 0.18 0.10 0.29 0.15 0.08 0.25 376.5 284.7 482.5Ethiopia M 65 0.001 0.000 0.002 0.20 0.11 0.33 0.12 0.06 0.21 386.7 295.3 497.2Ethiopia M 75 0.001 0.000 0.002 0.22 0.12 0.35 0.11 0.06 0.19 396.7 300.5 508.8Ethiopia M 90 0.001 0.000 0.002 0.23 0.13 0.38 0.10 0.05 0.18 407.9 308.7 522.7Finland F 25 0.338 0.269 0.411 1.40 1.18 1.65 0.81 0.67 0.97 1129.8 1047.6 1217.2Finland F 35 0.272 0.222 0.328 1.32 1.13 1.54 0.58 0.48 0.69 1138.1 1067.3 1216.0Finland F 45 0.212 0.173 0.260 1.26 1.04 1.49 0.37 0.30 0.44 1148.4 1065.1 1233.8Finland F 55 0.205 0.169 0.249 1.34 1.14 1.57 0.29 0.24 0.35 1173.8 1098.4 1257.3Finland F 65 0.210 0.170 0.256 1.45 1.23 1.72 0.25 0.21 0.31 1202.4 1116.0 1297.5Finland F 75 0.210 0.172 0.251 1.60 1.37 1.87 0.23 0.19 0.28 1232.9 1151.2 1324.2Finland F 90 0.208 0.170 0.254 1.79 1.52 2.09 0.21 0.17 0.26 1271.8 1182.5 1359.8Finland M 25 0.272 0.221 0.330 1.34 1.13 1.59 0.95 0.77 1.14 1039.5 967.3 1111.4Finland M 35 0.221 0.181 0.262 1.22 1.04 1.42 0.67 0.55 0.80 1043.8 980.5 1108.7Finland M 45 0.174 0.140 0.210 1.12 0.94 1.32 0.41 0.34 0.50 1050.3 978.4 1125.8Finland M 55 0.165 0.135 0.197 1.20 1.02 1.38 0.32 0.26 0.39 1072.9 1005.8 1142.6Finland M 65 0.164 0.133 0.199 1.31 1.10 1.54 0.27 0.22 0.32 1098.9 1020.9 1176.5Finland M 75 0.166 0.136 0.199 1.45 1.24 1.68 0.24 0.20 0.29 1126.6 1050.3 1202.1Finland M 90 0.168 0.138 0.205 1.62 1.38 1.90 0.23 0.19 0.27 1160.1 1085.4 1240.0Fiji F 25 0.071 0.032 0.129 0.34 0.19 0.58 1.15 0.61 1.91 515.2 394.6 661.8Fiji F 35 0.059 0.028 0.107 0.32 0.18 0.53 0.86 0.47 1.43 518.1 399.3 662.4Fiji F 45 0.048 0.022 0.089 0.30 0.17 0.51 0.58 0.32 1.00 522.1 400.1 673.5Fiji F 55 0.046 0.022 0.084 0.33 0.19 0.56 0.46 0.26 0.79 535.4 411.1 687.5Fiji F 65 0.046 0.021 0.084 0.37 0.21 0.63 0.38 0.21 0.64 550.6 420.7 708.0Fiji F 75 0.045 0.021 0.082 0.40 0.23 0.67 0.35 0.19 0.58 565.0 433.1 724.3Fiji F 90 0.044 0.020 0.081 0.43 0.25 0.71 0.32 0.18 0.53 581.2 447.7 736.3Fiji M 25 0.060 0.028 0.111 0.32 0.17 0.55 1.27 0.67 2.14 467.4 354.5 607.4Fiji M 35 0.050 0.024 0.090 0.30 0.16 0.52 0.95 0.51 1.58 469.9 357.2 605.4Fiji M 45 0.040 0.019 0.074 0.28 0.15 0.50 0.65 0.33 1.10 473.5 357.9 614.5Fiji M 55 0.039 0.019 0.070 0.31 0.17 0.54 0.52 0.27 0.86 485.8 367.4 627.9Fiji M 65 0.039 0.019 0.069 0.34 0.18 0.60 0.43 0.22 0.71 499.9 377.9 646.1Fiji M 75 0.038 0.019 0.068 0.37 0.20 0.65 0.39 0.20 0.64 513.0 390.0 661.2Fiji M 90 0.037 0.018 0.066 0.40 0.22 0.70 0.36 0.19 0.58 527.3 403.7 676.2France F 25 0.326 0.258 0.408 0.52 0.43 0.62 0.53 0.42 0.65 903.9 841.9 969.4France F 35 0.262 0.209 0.323 0.49 0.42 0.57 0.38 0.30 0.46 910.6 854.4 966.9France F 45 0.204 0.162 0.257 0.47 0.39 0.56 0.24 0.19 0.30 918.8 856.4 982.9France F 55 0.198 0.159 0.244 0.50 0.42 0.58 0.19 0.15 0.23 939.0 881.0 996.0France F 65 0.202 0.160 0.249 0.54 0.46 0.64 0.16 0.13 0.20 961.9 896.1 1026.8France F 75 0.202 0.161 0.247 0.60 0.51 0.69 0.15 0.12 0.18 986.5 923.3 1047.1France F 90 0.200 0.158 0.251 0.67 0.56 0.78 0.14 0.11 0.17 1017.7 953.7 1079.4France M 25 0.263 0.206 0.332 0.50 0.42 0.59 0.62 0.50 0.76 830.2 771.4 890.9France M 35 0.213 0.170 0.264 0.45 0.39 0.53 0.44 0.36 0.53 833.6 780.9 887.0France M 45 0.168 0.133 0.211 0.42 0.35 0.49 0.27 0.21 0.33 838.7 780.9 900.9France M 55 0.159 0.127 0.198 0.44 0.38 0.52 0.21 0.17 0.26 856.7 807.7 910.0France M 65 0.159 0.123 0.198 0.49 0.41 0.58 0.17 0.14 0.22 877.5 819.2 934.8France M 75 0.160 0.128 0.200 0.54 0.46 0.63 0.16 0.13 0.20 899.7 846.5 955.0France M 90 0.163 0.131 0.208 0.61 0.51 0.71 0.15 0.12 0.18 926.9 870.6 986.0Micronesia (Federated States of) F 25 0.165 0.082 0.289 0.24 0.12 0.40 0.93 0.48 1.58 468.3 362.0 604.8Micronesia (Federated States of) F 35 0.137 0.070 0.237 0.22 0.12 0.37 0.69 0.37 1.15 471.0 364.4 613.5Micronesia (Federated States of) F 45 0.112 0.054 0.197 0.21 0.11 0.35 0.47 0.25 0.79 474.8 359.4 621.8Micronesia (Federated States of) F 55 0.107 0.054 0.190 0.23 0.12 0.39 0.37 0.20 0.62 486.8 378.5 628.9Micronesia (Federated States of) F 65 0.107 0.054 0.192 0.26 0.14 0.44 0.31 0.17 0.52 500.4 388.2 638.3Micronesia (Federated States of) F 75 0.105 0.053 0.186 0.28 0.15 0.47 0.28 0.15 0.47 513.7 398.3 651.1Micronesia (Federated States of) F 90 0.102 0.050 0.180 0.30 0.16 0.51 0.26 0.14 0.43 528.9 411.1 674.5Micronesia (Federated States of) M 25 0.140 0.070 0.263 0.21 0.12 0.37 1.01 0.55 1.66 432.7 328.0 552.1Micronesia (Federated States of) M 35 0.116 0.057 0.214 0.20 0.11 0.34 0.76 0.42 1.25 435.0 331.5 555.8Micronesia (Federated States of) M 45 0.093 0.045 0.173 0.19 0.10 0.33 0.52 0.29 0.87 438.4 333.1 560.5Micronesia (Federated States of) M 55 0.090 0.044 0.160 0.21 0.11 0.36 0.41 0.23 0.70 449.8 342.1 574.9Micronesia (Federated States of) M 65 0.090 0.044 0.161 0.23 0.13 0.40 0.34 0.19 0.56 462.8 350.6 592.8Micronesia (Federated States of) M 75 0.088 0.043 0.157 0.25 0.14 0.44 0.31 0.17 0.50 475.1 360.8 609.2Micronesia (Federated States of) M 90 0.086 0.043 0.156 0.27 0.15 0.47 0.28 0.16 0.47 488.5 372.4 623.3Gabon F 25 1.023 0.452 2.206 1.11 0.55 2.02 1.04 0.55 1.75 576.4 424.2 787.3Gabon F 35 0.849 0.386 1.742 1.04 0.53 1.86 0.78 0.43 1.33 580.3 428.9 785.6Gabon F 45 0.691 0.304 1.401 0.99 0.49 1.78 0.54 0.29 0.93 585.5 431.2 786.5Gabon F 55 0.663 0.301 1.344 1.08 0.54 1.94 0.43 0.23 0.73 600.8 445.5 805.7Gabon F 65 0.662 0.296 1.417 1.21 0.60 2.14 0.35 0.19 0.60 618.0 457.2 832.2Gabon F 75 0.647 0.286 1.369 1.31 0.65 2.28 0.32 0.17 0.54 634.1 472.4 853.0Gabon F 90 0.625 0.279 1.279 1.42 0.71 2.52 0.29 0.16 0.49 652.6 484.8 881.8Gabon M 25 0.801 0.347 1.567 1.03 0.52 1.78 1.17 0.62 2.04 526.3 393.6 704.7Gabon M 35 0.665 0.298 1.282 0.96 0.50 1.70 0.87 0.46 1.50 530.0 394.5 706.7Gabon M 45 0.542 0.237 1.047 0.91 0.46 1.60 0.59 0.31 1.05 534.9 394.8 713.9Gabon M 55 0.521 0.231 1.020 1.00 0.52 1.72 0.47 0.25 0.83 548.3 412.4 730.6Gabon M 65 0.522 0.221 1.016 1.11 0.58 1.92 0.38 0.20 0.66 563.6 422.1 750.3Gabon M 75 0.511 0.220 1.007 1.21 0.62 2.09 0.35 0.18 0.60 578.0 435.9 762.9Gabon M 90 0.496 0.219 0.953 1.31 0.66 2.29 0.32 0.17 0.55 594.9 445.5 781.0United Kingdom F 25 0.320 0.266 0.380 0.94 0.79 1.09 0.91 0.76 1.07 872.9 822.1 926.0United Kingdom F 35 0.257 0.217 0.299 0.89 0.77 1.02 0.65 0.56 0.75 879.3 836.5 923.4United Kingdom F 45 0.201 0.167 0.238 0.85 0.72 0.99 0.41 0.34 0.49 887.2 835.1 943.8United Kingdom F 55 0.195 0.166 0.228 0.90 0.79 1.04 0.33 0.28 0.39 906.7 862.7 953.6United Kingdom F 65 0.199 0.167 0.235 0.98 0.84 1.14 0.28 0.24 0.34 928.9 876.8 983.0United Kingdom F 75 0.198 0.168 0.231 1.08 0.93 1.24 0.26 0.22 0.30 952.4 906.3 999.8
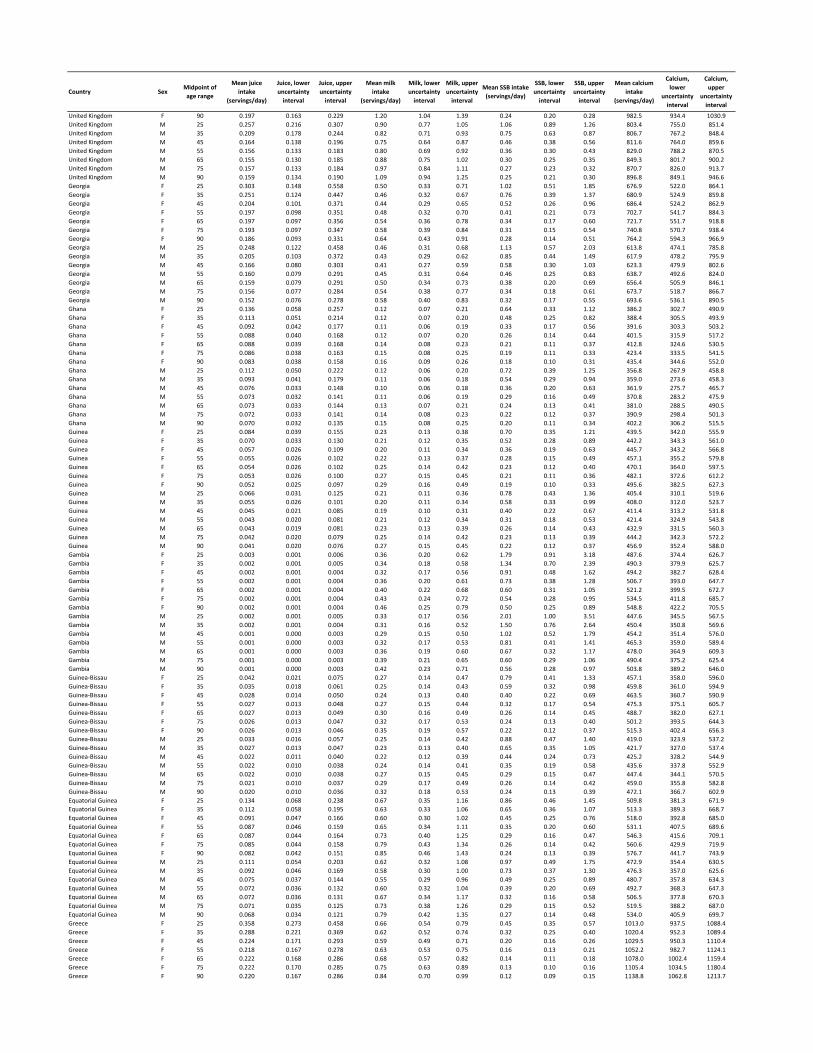
Country SexMidpoint of age range
Mean juice intake
(servings/day)
Juice, lower uncertainty interval
Juice, upper uncertainty interval
Mean milk intake
(servings/day)
Milk, lower uncertainty interval
Milk, upper uncertainty interval
Mean SSB intake (servings/day)
SSB, lower uncertainty interval
SSB, upper uncertainty interval
Mean calcium intake
(servings/day)
Calcium, lower
uncertainty interval
Calcium, upper
uncertainty interval
United Kingdom F 90 0.197 0.163 0.229 1.20 1.04 1.39 0.24 0.20 0.28 982.5 934.4 1030.9United Kingdom M 25 0.257 0.216 0.307 0.90 0.77 1.05 1.06 0.89 1.26 803.4 755.0 851.4United Kingdom M 35 0.209 0.178 0.244 0.82 0.71 0.93 0.75 0.63 0.87 806.7 767.2 848.4United Kingdom M 45 0.164 0.138 0.196 0.75 0.64 0.87 0.46 0.38 0.56 811.6 764.0 859.6United Kingdom M 55 0.156 0.133 0.183 0.80 0.69 0.92 0.36 0.30 0.43 829.0 788.2 870.5United Kingdom M 65 0.155 0.130 0.185 0.88 0.75 1.02 0.30 0.25 0.35 849.3 801.7 900.2United Kingdom M 75 0.157 0.133 0.184 0.97 0.84 1.11 0.27 0.23 0.32 870.7 826.0 913.7United Kingdom M 90 0.159 0.134 0.190 1.09 0.94 1.25 0.25 0.21 0.30 896.8 849.1 946.6Georgia F 25 0.303 0.148 0.558 0.50 0.33 0.71 1.02 0.51 1.85 676.9 522.0 864.1Georgia F 35 0.251 0.124 0.447 0.46 0.32 0.67 0.76 0.39 1.37 680.9 524.9 859.8Georgia F 45 0.204 0.101 0.371 0.44 0.29 0.65 0.52 0.26 0.96 686.4 524.2 862.9Georgia F 55 0.197 0.098 0.351 0.48 0.32 0.70 0.41 0.21 0.73 702.7 541.7 884.3Georgia F 65 0.197 0.097 0.356 0.54 0.36 0.78 0.34 0.17 0.60 721.7 551.7 918.8Georgia F 75 0.193 0.097 0.347 0.58 0.39 0.84 0.31 0.15 0.54 740.8 570.7 938.4Georgia F 90 0.186 0.093 0.331 0.64 0.43 0.91 0.28 0.14 0.51 764.2 594.3 966.9Georgia M 25 0.248 0.122 0.458 0.46 0.31 0.68 1.13 0.57 2.03 613.8 474.1 785.8Georgia M 35 0.205 0.103 0.372 0.43 0.29 0.62 0.85 0.44 1.49 617.9 478.2 795.9Georgia M 45 0.166 0.080 0.303 0.41 0.27 0.59 0.58 0.30 1.03 623.3 479.9 802.6Georgia M 55 0.160 0.079 0.291 0.45 0.31 0.64 0.46 0.25 0.83 638.7 492.6 824.0Georgia M 65 0.159 0.079 0.291 0.50 0.34 0.73 0.38 0.20 0.69 656.4 505.9 846.1Georgia M 75 0.156 0.077 0.284 0.54 0.38 0.77 0.34 0.18 0.61 673.7 518.7 866.7Georgia M 90 0.152 0.076 0.278 0.58 0.40 0.83 0.32 0.17 0.55 693.6 536.1 890.5Ghana F 25 0.136 0.058 0.257 0.12 0.07 0.21 0.64 0.33 1.12 386.2 302.7 490.9Ghana F 35 0.113 0.051 0.214 0.12 0.07 0.20 0.48 0.25 0.82 388.4 305.5 493.9Ghana F 45 0.092 0.042 0.177 0.11 0.06 0.19 0.33 0.17 0.56 391.6 303.3 503.2Ghana F 55 0.088 0.040 0.168 0.12 0.07 0.20 0.26 0.14 0.44 401.5 315.9 517.2Ghana F 65 0.088 0.039 0.168 0.14 0.08 0.23 0.21 0.11 0.37 412.8 324.6 530.5Ghana F 75 0.086 0.038 0.163 0.15 0.08 0.25 0.19 0.11 0.33 423.4 333.5 541.5Ghana F 90 0.083 0.038 0.158 0.16 0.09 0.26 0.18 0.10 0.31 435.4 344.6 552.0Ghana M 25 0.112 0.050 0.222 0.12 0.06 0.20 0.72 0.39 1.25 356.8 267.9 458.8Ghana M 35 0.093 0.041 0.179 0.11 0.06 0.18 0.54 0.29 0.94 359.0 273.6 458.3Ghana M 45 0.076 0.033 0.148 0.10 0.06 0.18 0.36 0.20 0.63 361.9 275.7 465.7Ghana M 55 0.073 0.032 0.141 0.11 0.06 0.19 0.29 0.16 0.49 370.8 283.2 475.9Ghana M 65 0.073 0.033 0.144 0.13 0.07 0.21 0.24 0.13 0.41 381.0 288.5 490.5Ghana M 75 0.072 0.033 0.141 0.14 0.08 0.23 0.22 0.12 0.37 390.9 298.4 501.3Ghana M 90 0.070 0.032 0.135 0.15 0.08 0.25 0.20 0.11 0.34 402.2 306.2 515.5Guinea F 25 0.084 0.039 0.155 0.23 0.13 0.38 0.70 0.35 1.21 439.5 342.0 555.9Guinea F 35 0.070 0.033 0.130 0.21 0.12 0.35 0.52 0.28 0.89 442.2 343.3 561.0Guinea F 45 0.057 0.026 0.109 0.20 0.11 0.34 0.36 0.19 0.63 445.7 343.2 566.8Guinea F 55 0.055 0.026 0.102 0.22 0.13 0.37 0.28 0.15 0.49 457.1 355.2 579.8Guinea F 65 0.054 0.026 0.102 0.25 0.14 0.42 0.23 0.12 0.40 470.1 364.0 597.5Guinea F 75 0.053 0.026 0.100 0.27 0.15 0.45 0.21 0.11 0.36 482.1 372.6 612.2Guinea F 90 0.052 0.025 0.097 0.29 0.16 0.49 0.19 0.10 0.33 495.6 382.5 627.3Guinea M 25 0.066 0.031 0.125 0.21 0.11 0.36 0.78 0.43 1.36 405.4 310.1 519.6Guinea M 35 0.055 0.026 0.101 0.20 0.11 0.34 0.58 0.33 0.99 408.0 312.0 523.7Guinea M 45 0.045 0.021 0.085 0.19 0.10 0.31 0.40 0.22 0.67 411.4 313.2 531.8Guinea M 55 0.043 0.020 0.081 0.21 0.12 0.34 0.31 0.18 0.53 421.4 324.9 543.8Guinea M 65 0.043 0.019 0.081 0.23 0.13 0.39 0.26 0.14 0.43 432.9 331.5 560.3Guinea M 75 0.042 0.020 0.079 0.25 0.14 0.42 0.23 0.13 0.39 444.2 342.3 572.2Guinea M 90 0.041 0.020 0.076 0.27 0.15 0.45 0.22 0.12 0.37 456.9 352.4 588.0Gambia F 25 0.003 0.001 0.006 0.36 0.20 0.62 1.79 0.91 3.18 487.6 374.4 626.7Gambia F 35 0.002 0.001 0.005 0.34 0.18 0.58 1.34 0.70 2.39 490.3 379.9 625.7Gambia F 45 0.002 0.001 0.004 0.32 0.17 0.56 0.91 0.48 1.62 494.2 382.7 628.4Gambia F 55 0.002 0.001 0.004 0.36 0.20 0.61 0.73 0.38 1.28 506.7 393.0 647.7Gambia F 65 0.002 0.001 0.004 0.40 0.22 0.68 0.60 0.31 1.05 521.2 399.5 672.7Gambia F 75 0.002 0.001 0.004 0.43 0.24 0.72 0.54 0.28 0.95 534.5 411.8 685.7Gambia F 90 0.002 0.001 0.004 0.46 0.25 0.79 0.50 0.25 0.89 548.8 422.2 705.5Gambia M 25 0.002 0.001 0.005 0.33 0.17 0.56 2.01 1.00 3.51 447.6 345.5 567.5Gambia M 35 0.002 0.001 0.004 0.31 0.16 0.52 1.50 0.76 2.64 450.4 350.8 569.6Gambia M 45 0.001 0.000 0.003 0.29 0.15 0.50 1.02 0.52 1.79 454.2 351.4 576.0Gambia M 55 0.001 0.000 0.003 0.32 0.17 0.53 0.81 0.41 1.41 465.3 359.0 589.4Gambia M 65 0.001 0.000 0.003 0.36 0.19 0.60 0.67 0.32 1.17 478.0 364.9 609.3Gambia M 75 0.001 0.000 0.003 0.39 0.21 0.65 0.60 0.29 1.06 490.4 375.2 625.4Gambia M 90 0.001 0.000 0.003 0.42 0.23 0.71 0.56 0.28 0.97 503.8 389.2 646.0Guinea‐Bissau F 25 0.042 0.021 0.075 0.27 0.14 0.47 0.79 0.41 1.33 457.1 358.0 596.0Guinea‐Bissau F 35 0.035 0.018 0.061 0.25 0.14 0.43 0.59 0.32 0.98 459.8 361.0 594.9Guinea‐Bissau F 45 0.028 0.014 0.050 0.24 0.13 0.40 0.40 0.22 0.69 463.5 360.7 590.9Guinea‐Bissau F 55 0.027 0.013 0.048 0.27 0.15 0.44 0.32 0.17 0.54 475.3 375.1 605.7Guinea‐Bissau F 65 0.027 0.013 0.049 0.30 0.16 0.49 0.26 0.14 0.45 488.7 382.0 627.1Guinea‐Bissau F 75 0.026 0.013 0.047 0.32 0.17 0.53 0.24 0.13 0.40 501.2 393.5 644.3Guinea‐Bissau F 90 0.026 0.013 0.046 0.35 0.19 0.57 0.22 0.12 0.37 515.3 402.4 656.3Guinea‐Bissau M 25 0.033 0.016 0.057 0.25 0.14 0.42 0.88 0.47 1.40 419.0 323.9 537.2Guinea‐Bissau M 35 0.027 0.013 0.047 0.23 0.13 0.40 0.65 0.35 1.05 421.7 327.0 537.4Guinea‐Bissau M 45 0.022 0.011 0.040 0.22 0.12 0.39 0.44 0.24 0.73 425.2 328.2 544.9Guinea‐Bissau M 55 0.022 0.010 0.038 0.24 0.14 0.41 0.35 0.19 0.58 435.6 337.8 552.9Guinea‐Bissau M 65 0.022 0.010 0.038 0.27 0.15 0.45 0.29 0.15 0.47 447.4 344.1 570.5Guinea‐Bissau M 75 0.021 0.010 0.037 0.29 0.17 0.49 0.26 0.14 0.42 459.0 355.8 582.8Guinea‐Bissau M 90 0.020 0.010 0.036 0.32 0.18 0.53 0.24 0.13 0.39 472.1 366.7 602.9Equatorial Guinea F 25 0.134 0.068 0.238 0.67 0.35 1.16 0.86 0.46 1.45 509.8 381.3 671.9Equatorial Guinea F 35 0.112 0.058 0.195 0.63 0.33 1.06 0.65 0.36 1.07 513.3 389.3 668.7Equatorial Guinea F 45 0.091 0.047 0.166 0.60 0.30 1.02 0.45 0.25 0.76 518.0 392.8 685.0Equatorial Guinea F 55 0.087 0.046 0.159 0.65 0.34 1.11 0.35 0.20 0.60 531.1 407.5 689.6Equatorial Guinea F 65 0.087 0.044 0.164 0.73 0.40 1.25 0.29 0.16 0.47 546.3 415.6 709.1Equatorial Guinea F 75 0.085 0.044 0.158 0.79 0.43 1.34 0.26 0.14 0.42 560.6 429.9 719.9Equatorial Guinea F 90 0.082 0.042 0.151 0.85 0.46 1.43 0.24 0.13 0.39 576.7 441.7 743.9Equatorial Guinea M 25 0.111 0.054 0.203 0.62 0.32 1.08 0.97 0.49 1.75 472.9 354.4 630.5Equatorial Guinea M 35 0.092 0.046 0.169 0.58 0.30 1.00 0.73 0.37 1.30 476.3 357.0 625.6Equatorial Guinea M 45 0.075 0.037 0.144 0.55 0.29 0.96 0.49 0.25 0.89 480.7 357.8 634.3Equatorial Guinea M 55 0.072 0.036 0.132 0.60 0.32 1.04 0.39 0.20 0.69 492.7 368.3 647.3Equatorial Guinea M 65 0.072 0.036 0.131 0.67 0.34 1.17 0.32 0.16 0.58 506.5 377.8 670.3Equatorial Guinea M 75 0.071 0.035 0.125 0.73 0.38 1.26 0.29 0.15 0.52 519.5 388.2 687.0Equatorial Guinea M 90 0.068 0.034 0.121 0.79 0.42 1.35 0.27 0.14 0.48 534.0 405.9 699.7Greece F 25 0.358 0.273 0.458 0.66 0.54 0.79 0.45 0.35 0.57 1013.0 937.5 1088.4Greece F 35 0.288 0.221 0.369 0.62 0.52 0.74 0.32 0.25 0.40 1020.4 952.3 1089.4Greece F 45 0.224 0.171 0.293 0.59 0.49 0.71 0.20 0.16 0.26 1029.5 950.3 1110.4Greece F 55 0.218 0.167 0.278 0.63 0.53 0.75 0.16 0.13 0.21 1052.2 982.7 1124.1Greece F 65 0.222 0.168 0.286 0.68 0.57 0.82 0.14 0.11 0.18 1078.0 1002.4 1159.4Greece F 75 0.222 0.170 0.285 0.75 0.63 0.89 0.13 0.10 0.16 1105.4 1034.5 1180.4Greece F 90 0.220 0.167 0.286 0.84 0.70 0.99 0.12 0.09 0.15 1138.8 1062.8 1213.7

Country SexMidpoint of age range
Mean juice intake
(servings/day)
Juice, lower uncertainty interval
Juice, upper uncertainty interval
Mean milk intake
(servings/day)
Milk, lower uncertainty interval
Milk, upper uncertainty interval
Mean SSB intake (servings/day)
SSB, lower uncertainty interval
SSB, upper uncertainty interval
Mean calcium intake
(servings/day)
Calcium, lower
uncertainty interval
Calcium, upper
uncertainty interval
Greece M 25 0.288 0.218 0.370 0.62 0.52 0.75 0.52 0.41 0.66 932.4 860.2 1006.5Greece M 35 0.234 0.180 0.301 0.57 0.48 0.67 0.37 0.29 0.47 936.2 871.9 1001.6Greece M 45 0.185 0.139 0.242 0.52 0.43 0.62 0.23 0.18 0.29 941.9 871.6 1015.9Greece M 55 0.175 0.132 0.225 0.56 0.47 0.66 0.18 0.14 0.23 962.1 900.3 1029.7Greece M 65 0.174 0.129 0.224 0.61 0.50 0.73 0.15 0.11 0.19 985.6 918.3 1060.2Greece M 75 0.176 0.134 0.226 0.68 0.57 0.80 0.13 0.10 0.17 1010.5 946.8 1079.8Greece M 90 0.179 0.137 0.231 0.76 0.64 0.89 0.12 0.10 0.16 1040.4 970.3 1111.1Grenada F 25 0.486 0.248 0.872 0.89 0.47 1.49 3.64 2.03 6.20 863.3 660.6 1115.1Grenada F 35 0.407 0.211 0.730 0.83 0.44 1.38 2.71 1.52 4.56 868.1 667.2 1114.1Grenada F 45 0.334 0.170 0.597 0.79 0.42 1.29 1.83 1.01 3.22 874.8 670.4 1113.6Grenada F 55 0.318 0.164 0.571 0.86 0.47 1.41 1.47 0.82 2.51 896.0 693.9 1139.7Grenada F 65 0.314 0.160 0.558 0.96 0.52 1.59 1.23 0.70 2.04 920.8 715.8 1172.0Grenada F 75 0.307 0.156 0.544 1.04 0.55 1.72 1.12 0.63 1.87 945.1 732.7 1209.7Grenada F 90 0.298 0.152 0.540 1.14 0.60 1.86 1.02 0.57 1.72 975.9 752.4 1258.1Grenada M 25 0.406 0.198 0.696 0.83 0.45 1.36 4.08 2.29 6.76 792.0 601.6 1005.7Grenada M 35 0.339 0.168 0.579 0.77 0.43 1.27 3.03 1.72 5.02 796.6 612.5 1022.2Grenada M 45 0.277 0.136 0.489 0.73 0.40 1.22 2.04 1.15 3.41 802.9 614.1 1039.2Grenada M 55 0.266 0.132 0.468 0.80 0.44 1.33 1.63 0.93 2.78 822.2 627.8 1059.5Grenada M 65 0.266 0.129 0.461 0.89 0.49 1.49 1.36 0.76 2.36 844.6 639.4 1094.7Grenada M 75 0.259 0.125 0.446 0.96 0.53 1.60 1.24 0.70 2.16 867.2 659.5 1122.3Grenada M 90 0.249 0.120 0.437 1.05 0.57 1.75 1.14 0.64 1.93 894.5 694.4 1158.6Guatemala F 25 0.298 0.150 0.525 0.66 0.36 1.09 2.69 1.53 4.61 650.9 492.9 827.5Guatemala F 35 0.246 0.125 0.428 0.62 0.34 1.02 2.10 1.21 3.51 655.8 499.1 837.6Guatemala F 45 0.200 0.099 0.352 0.59 0.32 1.01 1.53 0.89 2.59 662.0 500.8 845.0Guatemala F 55 0.192 0.097 0.333 0.65 0.35 1.07 1.22 0.71 2.07 678.5 514.9 862.8Guatemala F 65 0.192 0.097 0.336 0.72 0.39 1.19 0.99 0.56 1.68 697.1 536.6 886.1Guatemala F 75 0.188 0.097 0.326 0.78 0.42 1.28 0.88 0.51 1.50 714.6 548.1 911.2Guatemala F 90 0.182 0.091 0.316 0.84 0.46 1.40 0.80 0.46 1.35 734.9 559.4 939.0Guatemala M 25 0.248 0.129 0.435 0.60 0.33 1.02 2.90 1.64 4.85 597.8 468.1 758.9Guatemala M 35 0.206 0.107 0.358 0.57 0.31 0.95 2.26 1.30 3.70 601.2 471.4 754.9Guatemala M 45 0.167 0.084 0.300 0.54 0.30 0.91 1.65 0.95 2.82 606.0 470.5 767.9Guatemala M 55 0.160 0.082 0.288 0.60 0.33 0.99 1.32 0.77 2.24 621.8 484.2 785.9Guatemala M 65 0.161 0.081 0.288 0.66 0.36 1.11 1.07 0.59 1.82 639.8 496.3 808.6Guatemala M 75 0.157 0.080 0.279 0.72 0.39 1.20 0.97 0.53 1.62 656.6 509.0 827.6Guatemala M 90 0.153 0.079 0.262 0.78 0.43 1.29 0.88 0.48 1.47 675.7 525.3 854.5Guyana F 25 0.040 0.018 0.080 0.68 0.38 1.16 3.14 1.75 5.35 815.7 634.6 1054.7Guyana F 35 0.034 0.015 0.066 0.64 0.36 1.07 2.34 1.32 3.92 820.2 638.7 1052.0Guyana F 45 0.028 0.013 0.053 0.61 0.34 1.01 1.59 0.89 2.74 826.5 642.8 1062.6Guyana F 55 0.026 0.012 0.051 0.66 0.37 1.11 1.27 0.71 2.14 846.7 658.7 1083.8Guyana F 65 0.026 0.012 0.052 0.74 0.41 1.25 1.06 0.58 1.78 870.1 675.0 1114.0Guyana F 75 0.025 0.012 0.050 0.80 0.45 1.35 0.97 0.53 1.62 893.0 697.5 1140.3Guyana F 90 0.025 0.011 0.047 0.87 0.49 1.46 0.89 0.50 1.47 919.8 718.7 1172.4Guyana M 25 0.033 0.014 0.068 0.63 0.35 1.04 3.41 1.81 5.62 744.4 566.8 950.3Guyana M 35 0.027 0.012 0.056 0.59 0.33 0.98 2.52 1.38 4.15 748.5 576.1 955.2Guyana M 45 0.022 0.010 0.046 0.56 0.32 0.94 1.70 0.93 2.84 754.2 583.2 966.0Guyana M 55 0.021 0.009 0.044 0.61 0.34 1.01 1.36 0.73 2.26 772.4 592.8 984.9Guyana M 65 0.021 0.009 0.044 0.68 0.38 1.10 1.14 0.62 1.88 793.5 609.8 1013.3Guyana M 75 0.021 0.009 0.043 0.74 0.41 1.19 1.04 0.57 1.70 814.8 626.4 1039.9Guyana M 90 0.020 0.009 0.042 0.80 0.45 1.30 0.96 0.53 1.55 839.6 643.2 1063.5Honduras F 25 0.851 0.416 1.523 1.14 0.63 1.85 2.98 1.62 4.97 739.8 566.3 930.6Honduras F 35 0.704 0.363 1.218 1.07 0.60 1.71 2.32 1.30 3.86 745.2 572.9 940.0Honduras F 45 0.570 0.287 0.975 1.03 0.57 1.67 1.70 0.96 2.91 752.2 576.0 953.6Honduras F 55 0.549 0.285 0.934 1.12 0.62 1.83 1.36 0.76 2.29 770.9 589.4 977.6Honduras F 65 0.550 0.282 0.971 1.25 0.70 2.03 1.09 0.61 1.82 792.1 605.4 1003.7Honduras F 75 0.538 0.277 0.923 1.35 0.76 2.17 0.98 0.54 1.61 812.0 624.0 1024.7Honduras F 90 0.520 0.266 0.877 1.46 0.82 2.32 0.88 0.49 1.47 835.7 647.5 1051.8Honduras M 25 0.704 0.360 1.220 1.02 0.56 1.70 3.22 1.79 5.50 675.4 522.1 849.8Honduras M 35 0.582 0.303 0.996 0.96 0.53 1.60 2.51 1.40 4.16 679.2 529.3 863.2Honduras M 45 0.471 0.239 0.820 0.92 0.50 1.56 1.83 0.99 3.08 684.5 535.6 876.5Honduras M 55 0.453 0.237 0.793 1.01 0.55 1.71 1.47 0.81 2.47 702.3 550.1 899.0Honduras M 65 0.454 0.233 0.814 1.13 0.61 1.92 1.19 0.67 2.01 722.6 561.5 929.6Honduras M 75 0.445 0.230 0.785 1.22 0.67 2.07 1.07 0.61 1.80 741.6 578.7 946.5Honduras M 90 0.433 0.222 0.754 1.33 0.72 2.23 0.97 0.54 1.62 763.5 597.9 972.6Croatia F 25 0.330 0.195 0.521 0.78 0.56 1.07 0.65 0.42 0.97 629.7 487.8 800.1Croatia F 35 0.274 0.164 0.425 0.74 0.53 1.00 0.48 0.32 0.70 632.7 492.5 802.1Croatia F 45 0.223 0.130 0.348 0.71 0.51 0.97 0.33 0.21 0.48 637.2 496.5 808.5Croatia F 55 0.210 0.126 0.326 0.79 0.57 1.07 0.26 0.17 0.38 653.3 511.4 828.4Croatia F 65 0.205 0.122 0.319 0.89 0.64 1.21 0.22 0.14 0.33 671.9 525.0 854.4Croatia F 75 0.201 0.121 0.310 0.97 0.70 1.31 0.20 0.13 0.30 689.9 539.2 877.8Croatia F 90 0.196 0.119 0.300 1.06 0.75 1.45 0.19 0.12 0.28 711.0 552.3 903.9Croatia M 25 0.259 0.152 0.424 0.72 0.53 0.98 0.75 0.47 1.14 578.5 446.8 748.3Croatia M 35 0.214 0.126 0.349 0.67 0.50 0.91 0.55 0.36 0.83 579.3 453.0 739.7Croatia M 45 0.173 0.101 0.283 0.64 0.47 0.88 0.37 0.24 0.56 581.6 457.0 743.4Croatia M 55 0.165 0.097 0.264 0.72 0.53 0.97 0.29 0.19 0.44 595.6 466.8 761.3Croatia M 65 0.164 0.098 0.268 0.81 0.59 1.11 0.24 0.15 0.36 612.1 474.4 788.7Croatia M 75 0.163 0.098 0.266 0.89 0.65 1.20 0.22 0.14 0.32 629.5 492.1 809.3Croatia M 90 0.161 0.095 0.258 0.96 0.71 1.31 0.20 0.13 0.30 649.4 505.8 830.9Haiti F 25 0.223 0.112 0.398 0.34 0.18 0.58 2.64 1.43 4.42 692.1 538.2 869.8Haiti F 35 0.186 0.095 0.327 0.32 0.17 0.54 1.97 1.10 3.22 696.0 541.0 876.2Haiti F 45 0.153 0.078 0.269 0.30 0.16 0.51 1.34 0.73 2.19 701.4 543.8 891.1Haiti F 55 0.146 0.077 0.250 0.33 0.18 0.57 1.07 0.60 1.77 718.6 558.4 911.0Haiti F 65 0.144 0.075 0.253 0.37 0.20 0.63 0.89 0.49 1.47 738.5 573.0 935.5Haiti F 75 0.141 0.073 0.246 0.40 0.22 0.68 0.81 0.45 1.35 757.8 589.1 957.4Haiti F 90 0.137 0.070 0.240 0.43 0.23 0.73 0.75 0.41 1.27 779.7 609.0 989.0Haiti M 25 0.186 0.093 0.343 0.31 0.17 0.52 2.90 1.65 4.84 637.0 488.0 816.1Haiti M 35 0.155 0.080 0.280 0.29 0.16 0.48 2.15 1.21 3.48 640.6 493.1 818.6Haiti M 45 0.126 0.065 0.227 0.28 0.15 0.46 1.45 0.80 2.35 645.5 495.0 820.2Haiti M 55 0.121 0.062 0.217 0.30 0.16 0.50 1.16 0.65 1.87 661.2 505.7 844.1Haiti M 65 0.121 0.062 0.219 0.34 0.18 0.56 0.96 0.54 1.63 679.2 518.0 864.3Haiti M 75 0.118 0.061 0.213 0.36 0.20 0.61 0.88 0.49 1.49 697.2 534.0 889.0Haiti M 90 0.114 0.061 0.201 0.39 0.21 0.66 0.81 0.45 1.34 717.6 546.9 918.5Hungary F 25 0.100 0.070 0.138 0.25 0.20 0.31 0.48 0.31 0.71 552.7 511.3 596.6Hungary F 35 0.083 0.059 0.116 0.24 0.19 0.30 0.36 0.23 0.53 555.2 518.0 593.9Hungary F 45 0.068 0.047 0.097 0.23 0.18 0.29 0.24 0.16 0.36 559.2 517.1 604.7Hungary F 55 0.064 0.045 0.090 0.25 0.20 0.31 0.20 0.13 0.29 573.5 534.4 614.1Hungary F 65 0.062 0.043 0.087 0.29 0.23 0.35 0.16 0.11 0.24 589.8 545.9 634.0Hungary F 75 0.061 0.043 0.084 0.31 0.25 0.38 0.15 0.10 0.22 605.5 564.6 647.5Hungary F 90 0.060 0.042 0.083 0.34 0.27 0.42 0.14 0.09 0.20 624.5 581.3 670.7Hungary M 25 0.079 0.053 0.112 0.23 0.18 0.29 0.57 0.36 0.84 508.1 469.0 551.6

Country SexMidpoint of age range
Mean juice intake
(servings/day)
Juice, lower uncertainty interval
Juice, upper uncertainty interval
Mean milk intake
(servings/day)
Milk, lower uncertainty interval
Milk, upper uncertainty interval
Mean SSB intake (servings/day)
SSB, lower uncertainty interval
SSB, upper uncertainty interval
Mean calcium intake
(servings/day)
Calcium, lower
uncertainty interval
Calcium, upper
uncertainty interval
Hungary M 35 0.065 0.045 0.090 0.22 0.18 0.27 0.42 0.27 0.61 508.8 475.9 546.7Hungary M 45 0.053 0.036 0.074 0.21 0.17 0.26 0.29 0.19 0.42 510.9 472.0 552.4Hungary M 55 0.050 0.035 0.069 0.23 0.19 0.29 0.22 0.15 0.32 523.2 486.7 558.7Hungary M 65 0.050 0.034 0.070 0.26 0.21 0.33 0.18 0.12 0.26 537.6 497.0 577.3Hungary M 75 0.050 0.034 0.068 0.29 0.23 0.36 0.16 0.11 0.24 552.8 515.6 590.3Hungary M 90 0.049 0.034 0.066 0.31 0.25 0.39 0.15 0.10 0.22 571.0 533.9 610.6Indonesia F 25 0.037 0.019 0.067 0.04 0.03 0.06 0.45 0.25 0.76 444.7 401.0 491.3Indonesia F 35 0.031 0.016 0.055 0.04 0.03 0.05 0.35 0.19 0.57 448.5 409.0 491.1Indonesia F 45 0.026 0.013 0.046 0.04 0.03 0.05 0.24 0.14 0.41 453.0 409.9 499.3Indonesia F 55 0.025 0.013 0.045 0.05 0.04 0.06 0.19 0.11 0.32 463.2 423.3 508.1Indonesia F 65 0.025 0.013 0.046 0.05 0.04 0.07 0.16 0.09 0.27 475.0 430.9 521.6Indonesia F 75 0.025 0.013 0.044 0.06 0.04 0.07 0.15 0.08 0.24 488.2 445.7 532.3Indonesia F 90 0.024 0.012 0.041 0.06 0.05 0.08 0.13 0.07 0.22 503.7 459.5 549.6Indonesia M 25 0.029 0.015 0.054 0.04 0.03 0.05 0.50 0.27 0.85 407.0 368.3 447.2Indonesia M 35 0.025 0.013 0.045 0.04 0.03 0.05 0.37 0.21 0.64 410.5 375.0 446.7Indonesia M 45 0.021 0.011 0.039 0.04 0.03 0.05 0.26 0.14 0.45 414.6 377.5 456.5Indonesia M 55 0.021 0.011 0.039 0.04 0.03 0.05 0.21 0.11 0.36 424.4 388.7 465.0Indonesia M 65 0.021 0.011 0.039 0.05 0.04 0.06 0.17 0.10 0.29 435.5 396.2 479.8Indonesia M 75 0.021 0.011 0.038 0.05 0.04 0.06 0.16 0.09 0.26 446.8 407.7 490.5Indonesia M 90 0.019 0.010 0.035 0.06 0.04 0.07 0.14 0.08 0.24 459.8 421.0 504.4India F 25 0.035 0.018 0.061 0.29 0.24 0.34 0.57 0.29 0.97 482.8 443.9 524.6India F 35 0.029 0.015 0.051 0.28 0.24 0.32 0.42 0.22 0.72 486.2 452.2 523.3India F 45 0.024 0.012 0.042 0.27 0.23 0.32 0.29 0.15 0.50 490.6 452.0 533.7India F 55 0.023 0.012 0.040 0.30 0.25 0.35 0.23 0.12 0.40 502.4 467.0 540.3India F 65 0.023 0.012 0.041 0.33 0.27 0.39 0.19 0.10 0.33 515.8 475.2 558.4India F 75 0.022 0.012 0.040 0.36 0.30 0.42 0.17 0.09 0.29 529.6 491.4 569.5India F 90 0.022 0.012 0.037 0.39 0.33 0.46 0.16 0.09 0.27 545.6 507.5 587.2India M 25 0.029 0.014 0.054 0.27 0.22 0.32 0.62 0.34 1.05 444.4 405.8 482.4India M 35 0.024 0.012 0.045 0.26 0.22 0.30 0.47 0.26 0.77 447.4 415.7 480.2India M 45 0.020 0.010 0.038 0.25 0.21 0.30 0.32 0.17 0.54 451.2 417.1 490.3India M 55 0.019 0.010 0.035 0.28 0.24 0.32 0.25 0.14 0.42 462.5 429.4 498.4India M 65 0.019 0.010 0.034 0.31 0.26 0.36 0.21 0.12 0.34 475.4 435.6 514.6India M 75 0.019 0.009 0.034 0.33 0.29 0.38 0.19 0.11 0.31 488.2 451.6 524.2India M 90 0.018 0.009 0.033 0.36 0.31 0.41 0.17 0.10 0.29 502.8 466.9 539.6Ireland F 25 0.294 0.201 0.415 0.92 0.71 1.17 0.69 0.49 0.93 911.8 846.1 987.9Ireland F 35 0.236 0.163 0.333 0.87 0.68 1.08 0.49 0.36 0.67 918.4 860.2 982.8Ireland F 45 0.184 0.127 0.263 0.82 0.64 1.06 0.31 0.22 0.42 926.7 859.1 998.6Ireland F 55 0.178 0.124 0.249 0.88 0.69 1.11 0.25 0.18 0.34 947.1 880.3 1014.6Ireland F 65 0.182 0.124 0.259 0.95 0.74 1.20 0.21 0.15 0.29 970.4 895.7 1049.3Ireland F 75 0.182 0.126 0.256 1.05 0.82 1.32 0.20 0.14 0.27 994.9 922.4 1072.1Ireland F 90 0.181 0.124 0.256 1.17 0.91 1.49 0.18 0.13 0.24 1026.0 953.0 1105.1Ireland M 25 0.238 0.163 0.327 0.88 0.67 1.10 0.81 0.59 1.13 836.4 773.9 907.2Ireland M 35 0.193 0.134 0.266 0.80 0.62 1.00 0.57 0.42 0.79 839.8 784.1 902.1Ireland M 45 0.153 0.104 0.213 0.74 0.56 0.94 0.35 0.25 0.49 844.9 781.9 912.5Ireland M 55 0.145 0.099 0.202 0.78 0.61 0.98 0.27 0.20 0.38 863.1 805.6 925.1Ireland M 65 0.144 0.098 0.203 0.86 0.66 1.08 0.23 0.16 0.31 884.1 818.7 952.6Ireland M 75 0.145 0.099 0.203 0.95 0.73 1.19 0.21 0.15 0.28 906.4 842.9 972.2Ireland M 90 0.148 0.101 0.205 1.07 0.82 1.33 0.19 0.14 0.27 933.2 865.5 1001.0Iran (Islamic Republic of) F 25 0.459 0.328 0.636 0.58 0.47 0.71 0.29 0.22 0.37 524.8 448.7 607.2Iran (Islamic Republic of) F 35 0.384 0.274 0.523 0.55 0.46 0.67 0.22 0.18 0.28 528.5 455.3 609.8Iran (Islamic Republic of) F 45 0.315 0.215 0.439 0.53 0.43 0.65 0.16 0.12 0.20 533.4 453.5 621.8Iran (Islamic Republic of) F 55 0.302 0.213 0.413 0.58 0.48 0.70 0.13 0.10 0.16 546.6 467.8 634.9Iran (Islamic Republic of) F 65 0.302 0.214 0.422 0.65 0.52 0.79 0.11 0.08 0.13 561.7 482.7 652.6Iran (Islamic Republic of) F 75 0.296 0.214 0.409 0.70 0.58 0.84 0.10 0.08 0.12 576.2 496.8 667.5Iran (Islamic Republic of) F 90 0.287 0.207 0.391 0.76 0.62 0.91 0.09 0.07 0.11 592.9 508.1 686.2Iran (Islamic Republic of) M 25 0.379 0.259 0.533 0.53 0.42 0.66 0.32 0.26 0.40 482.4 412.1 558.2Iran (Islamic Republic of) M 35 0.317 0.220 0.436 0.50 0.41 0.61 0.24 0.20 0.30 485.4 417.9 558.3Iran (Islamic Republic of) M 45 0.259 0.177 0.367 0.47 0.38 0.58 0.17 0.13 0.21 489.4 419.6 566.2Iran (Islamic Republic of) M 55 0.250 0.175 0.346 0.52 0.43 0.63 0.14 0.11 0.17 501.5 428.5 575.0Iran (Islamic Republic of) M 65 0.250 0.170 0.346 0.58 0.47 0.72 0.11 0.09 0.14 515.4 436.5 595.3Iran (Islamic Republic of) M 75 0.243 0.168 0.337 0.63 0.52 0.78 0.10 0.08 0.13 528.6 451.2 609.7Iran (Islamic Republic of) M 90 0.233 0.161 0.326 0.69 0.57 0.84 0.10 0.08 0.12 543.4 466.5 626.1Iraq F 25 0.192 0.100 0.348 0.46 0.26 0.77 0.68 0.37 1.15 614.6 470.0 787.0Iraq F 35 0.160 0.084 0.290 0.44 0.25 0.74 0.52 0.29 0.86 618.9 474.7 782.6Iraq F 45 0.131 0.066 0.237 0.42 0.23 0.73 0.37 0.20 0.62 624.3 479.9 791.4Iraq F 55 0.126 0.065 0.231 0.46 0.26 0.79 0.30 0.17 0.51 640.0 496.0 811.5Iraq F 65 0.126 0.063 0.230 0.51 0.29 0.89 0.25 0.14 0.44 657.7 507.9 836.6Iraq F 75 0.124 0.063 0.227 0.55 0.32 0.96 0.23 0.12 0.39 674.6 518.2 853.4Iraq F 90 0.120 0.062 0.224 0.60 0.34 1.05 0.21 0.11 0.35 693.9 532.3 878.3Iraq M 25 0.154 0.081 0.272 0.42 0.23 0.68 0.77 0.43 1.29 560.4 432.1 716.4Iraq M 35 0.129 0.069 0.226 0.39 0.22 0.64 0.58 0.33 0.99 564.0 435.3 713.7Iraq M 45 0.105 0.055 0.186 0.38 0.21 0.62 0.40 0.23 0.68 568.6 437.2 718.4Iraq M 55 0.102 0.052 0.179 0.41 0.23 0.67 0.32 0.18 0.55 582.8 450.9 729.7Iraq M 65 0.102 0.053 0.180 0.46 0.25 0.76 0.27 0.15 0.46 598.8 460.8 751.4Iraq M 75 0.099 0.052 0.174 0.50 0.28 0.82 0.25 0.14 0.42 613.9 473.8 772.4Iraq M 90 0.095 0.050 0.166 0.55 0.30 0.90 0.23 0.13 0.39 630.4 489.5 796.4Iceland F 25 0.394 0.326 0.473 1.61 1.36 1.88 0.77 0.63 0.93 1069.5 990.3 1150.5Iceland F 35 0.316 0.265 0.375 1.52 1.29 1.74 0.55 0.46 0.66 1077.4 1008.1 1149.8Iceland F 45 0.247 0.201 0.297 1.44 1.22 1.68 0.35 0.28 0.42 1087.1 1005.7 1167.9Iceland F 55 0.239 0.199 0.286 1.54 1.32 1.77 0.28 0.23 0.33 1111.0 1038.6 1183.1Iceland F 65 0.244 0.201 0.296 1.67 1.43 1.94 0.24 0.20 0.29 1138.1 1054.9 1221.8Iceland F 75 0.244 0.203 0.290 1.83 1.59 2.13 0.22 0.18 0.27 1167.1 1091.1 1243.3Iceland F 90 0.242 0.200 0.289 2.05 1.75 2.40 0.20 0.17 0.25 1203.7 1122.2 1284.3Iceland M 25 0.316 0.261 0.378 1.54 1.31 1.80 0.90 0.73 1.10 984.9 912.5 1059.7Iceland M 35 0.256 0.216 0.303 1.40 1.21 1.62 0.64 0.52 0.77 989.0 928.1 1055.4Iceland M 45 0.202 0.168 0.244 1.28 1.08 1.53 0.39 0.32 0.48 995.0 924.3 1067.4Iceland M 55 0.192 0.163 0.228 1.37 1.17 1.60 0.30 0.25 0.37 1016.3 953.7 1078.9Iceland M 65 0.191 0.157 0.229 1.50 1.28 1.77 0.25 0.20 0.31 1041.0 970.7 1116.5Iceland M 75 0.193 0.161 0.227 1.66 1.42 1.92 0.23 0.19 0.28 1067.4 1001.3 1139.8Iceland M 90 0.196 0.165 0.232 1.86 1.60 2.18 0.21 0.17 0.26 1099.6 1031.2 1173.9Israel F 25 0.122 0.089 0.165 0.57 0.47 0.68 0.77 0.59 0.99 669.8 620.2 724.8Israel F 35 0.098 0.073 0.131 0.54 0.46 0.63 0.55 0.43 0.70 674.7 631.0 723.7Israel F 45 0.076 0.056 0.103 0.52 0.43 0.61 0.35 0.27 0.45 680.8 631.8 736.9Israel F 55 0.074 0.054 0.098 0.55 0.47 0.64 0.28 0.22 0.35 695.8 650.5 747.6Israel F 65 0.075 0.055 0.102 0.60 0.49 0.70 0.24 0.19 0.30 712.8 661.6 771.7Israel F 75 0.075 0.055 0.100 0.65 0.55 0.76 0.22 0.18 0.28 731.0 680.7 786.5Israel F 90 0.075 0.055 0.100 0.73 0.62 0.86 0.20 0.16 0.26 753.8 702.4 812.2Israel M 25 0.097 0.071 0.130 0.54 0.45 0.65 0.91 0.71 1.16 616.8 571.2 668.6Israel M 35 0.079 0.058 0.105 0.49 0.42 0.58 0.64 0.51 0.81 619.4 578.3 666.3

Country SexMidpoint of age range
Mean juice intake
(servings/day)
Juice, lower uncertainty interval
Juice, upper uncertainty interval
Mean milk intake
(servings/day)
Milk, lower uncertainty interval
Milk, upper uncertainty interval
Mean SSB intake (servings/day)
SSB, lower uncertainty interval
SSB, upper uncertainty interval
Mean calcium intake
(servings/day)
Calcium, lower
uncertainty interval
Calcium, upper
uncertainty interval
Israel M 45 0.062 0.045 0.084 0.45 0.38 0.54 0.39 0.30 0.50 623.1 577.6 673.3Israel M 55 0.059 0.043 0.079 0.48 0.41 0.57 0.30 0.24 0.38 636.5 595.4 681.5Israel M 65 0.059 0.043 0.078 0.53 0.44 0.63 0.25 0.20 0.32 652.0 603.3 702.1Israel M 75 0.059 0.044 0.078 0.59 0.49 0.69 0.23 0.18 0.29 668.5 623.7 715.5Israel M 90 0.060 0.044 0.080 0.66 0.55 0.78 0.21 0.17 0.27 688.8 643.4 739.0Italy F 25 0.146 0.114 0.185 0.53 0.45 0.63 0.21 0.16 0.25 810.1 754.2 870.4Italy F 35 0.117 0.093 0.145 0.50 0.44 0.57 0.15 0.12 0.18 816.0 768.4 869.8Italy F 45 0.091 0.072 0.116 0.48 0.41 0.55 0.09 0.07 0.12 823.3 767.1 885.6Italy F 55 0.089 0.071 0.110 0.51 0.45 0.58 0.07 0.06 0.09 841.4 790.2 895.5Italy F 65 0.090 0.071 0.113 0.55 0.48 0.64 0.06 0.05 0.08 862.1 803.1 923.6Italy F 75 0.090 0.071 0.113 0.61 0.54 0.69 0.06 0.05 0.07 884.0 830.5 939.4Italy F 90 0.090 0.070 0.113 0.68 0.59 0.79 0.05 0.04 0.07 911.7 854.9 969.0Italy M 25 0.117 0.090 0.148 0.51 0.43 0.60 0.24 0.19 0.29 745.4 691.4 803.2Italy M 35 0.095 0.075 0.120 0.46 0.40 0.53 0.17 0.14 0.21 748.5 702.3 794.7Italy M 45 0.075 0.058 0.096 0.43 0.36 0.49 0.10 0.08 0.13 753.0 701.8 804.1Italy M 55 0.071 0.056 0.089 0.45 0.39 0.52 0.08 0.06 0.10 769.2 723.5 814.9Italy M 65 0.071 0.055 0.090 0.50 0.43 0.58 0.07 0.05 0.08 788.0 735.2 843.3Italy M 75 0.072 0.056 0.090 0.55 0.48 0.63 0.06 0.05 0.08 807.8 759.8 857.5Italy M 90 0.073 0.056 0.092 0.62 0.54 0.71 0.06 0.05 0.07 832.0 781.9 881.9Jamaica F 25 0.463 0.349 0.604 1.14 0.92 1.36 3.29 2.62 4.15 1029.7 942.5 1121.4Jamaica F 35 0.387 0.298 0.491 1.07 0.89 1.25 2.45 2.01 2.97 1035.5 961.9 1117.5Jamaica F 45 0.318 0.236 0.414 1.01 0.83 1.23 1.66 1.33 2.06 1043.4 964.5 1135.8Jamaica F 55 0.303 0.234 0.381 1.11 0.93 1.30 1.33 1.10 1.62 1068.9 994.8 1151.0Jamaica F 65 0.299 0.228 0.381 1.23 1.01 1.48 1.11 0.91 1.35 1098.3 1013.1 1188.2Jamaica F 75 0.292 0.228 0.371 1.34 1.12 1.57 1.01 0.83 1.22 1127.5 1045.2 1211.8Jamaica F 90 0.284 0.224 0.363 1.46 1.23 1.73 0.93 0.77 1.11 1163.1 1076.5 1255.5Jamaica M 25 0.380 0.288 0.492 1.05 0.85 1.27 3.58 2.88 4.41 944.0 866.7 1031.7Jamaica M 35 0.316 0.248 0.394 0.98 0.83 1.17 2.64 2.20 3.14 949.4 880.2 1021.7Jamaica M 45 0.258 0.196 0.326 0.93 0.76 1.12 1.78 1.43 2.17 956.7 881.2 1037.8Jamaica M 55 0.248 0.196 0.307 1.02 0.86 1.21 1.43 1.18 1.69 979.9 911.2 1054.4Jamaica M 65 0.248 0.189 0.315 1.13 0.94 1.36 1.19 0.97 1.43 1006.6 931.6 1088.3Jamaica M 75 0.241 0.189 0.301 1.23 1.04 1.44 1.09 0.90 1.29 1033.5 961.1 1111.2Jamaica M 90 0.232 0.185 0.286 1.33 1.12 1.56 1.00 0.84 1.20 1065.9 987.1 1146.1Jordan F 25 0.209 0.105 0.369 0.67 0.36 1.10 1.12 0.62 1.89 663.7 512.4 853.3Jordan F 35 0.174 0.088 0.307 0.64 0.35 1.03 0.86 0.48 1.46 668.4 516.7 856.2Jordan F 45 0.143 0.073 0.257 0.62 0.33 1.00 0.61 0.34 1.05 674.4 518.6 870.9Jordan F 55 0.137 0.069 0.247 0.67 0.37 1.09 0.50 0.28 0.84 691.3 535.5 886.6Jordan F 65 0.137 0.068 0.246 0.75 0.41 1.22 0.42 0.23 0.69 710.5 550.1 907.0Jordan F 75 0.134 0.070 0.236 0.81 0.44 1.31 0.38 0.21 0.63 728.5 567.7 926.0Jordan F 90 0.131 0.068 0.231 0.88 0.48 1.43 0.34 0.19 0.57 749.1 576.1 951.9Jordan M 25 0.174 0.085 0.315 0.61 0.33 1.08 1.28 0.69 2.18 609.1 474.4 767.3Jordan M 35 0.145 0.071 0.261 0.57 0.33 0.98 0.96 0.52 1.59 612.9 475.8 774.2Jordan M 45 0.119 0.057 0.222 0.55 0.30 0.92 0.67 0.36 1.08 618.0 478.5 784.5Jordan M 55 0.114 0.056 0.213 0.60 0.33 1.02 0.54 0.29 0.88 633.4 492.3 797.2Jordan M 65 0.114 0.056 0.214 0.67 0.36 1.16 0.45 0.24 0.73 650.9 506.2 825.2Jordan M 75 0.111 0.054 0.205 0.73 0.40 1.25 0.41 0.23 0.68 667.2 524.3 845.6Jordan M 90 0.107 0.050 0.198 0.80 0.44 1.35 0.38 0.21 0.64 685.7 542.1 872.5Japan F 25 0.206 0.164 0.251 0.51 0.43 0.59 0.50 0.42 0.60 582.3 540.4 625.5Japan F 35 0.171 0.144 0.200 0.48 0.42 0.55 0.38 0.32 0.44 587.3 554.1 624.8Japan F 45 0.140 0.114 0.169 0.46 0.39 0.55 0.26 0.22 0.31 593.4 554.0 636.0Japan F 55 0.135 0.114 0.158 0.51 0.45 0.59 0.20 0.17 0.24 607.9 573.1 643.2Japan F 65 0.136 0.112 0.163 0.57 0.49 0.66 0.16 0.14 0.19 624.0 584.7 665.6Japan F 75 0.132 0.111 0.157 0.61 0.53 0.69 0.15 0.13 0.18 639.7 603.4 678.2Japan F 90 0.127 0.108 0.150 0.65 0.56 0.74 0.15 0.13 0.17 659.4 622.4 697.1Japan M 25 0.168 0.136 0.202 0.46 0.39 0.54 0.59 0.49 0.70 531.4 494.5 567.4Japan M 35 0.140 0.118 0.163 0.43 0.37 0.49 0.45 0.38 0.51 535.8 504.6 566.4Japan M 45 0.115 0.093 0.138 0.40 0.34 0.47 0.32 0.27 0.37 541.1 503.4 576.4Japan M 55 0.110 0.093 0.129 0.44 0.39 0.51 0.25 0.21 0.28 554.2 523.2 586.5Japan M 65 0.110 0.091 0.131 0.50 0.43 0.59 0.19 0.16 0.23 568.9 532.7 606.8Japan M 75 0.108 0.091 0.126 0.55 0.48 0.63 0.17 0.15 0.20 584.8 551.6 619.2Japan M 90 0.104 0.089 0.123 0.60 0.52 0.69 0.16 0.14 0.19 604.2 571.1 640.0Kazakhstan F 25 0.040 0.019 0.071 0.76 0.54 1.07 0.67 0.35 1.15 717.5 557.2 938.5Kazakhstan F 35 0.033 0.016 0.058 0.71 0.51 0.98 0.50 0.27 0.84 721.8 564.4 924.2Kazakhstan F 45 0.027 0.013 0.048 0.68 0.47 0.94 0.34 0.18 0.57 727.6 558.7 933.7Kazakhstan F 55 0.026 0.013 0.046 0.74 0.53 1.02 0.27 0.15 0.45 745.0 577.8 946.6Kazakhstan F 65 0.026 0.013 0.047 0.83 0.58 1.18 0.22 0.12 0.38 765.1 593.0 975.8Kazakhstan F 75 0.025 0.012 0.045 0.90 0.64 1.25 0.20 0.11 0.34 785.4 607.0 993.9Kazakhstan F 90 0.024 0.012 0.044 0.98 0.70 1.33 0.19 0.10 0.31 810.4 620.4 1030.6Kazakhstan M 25 0.033 0.015 0.066 0.69 0.46 0.97 0.74 0.38 1.31 650.9 508.0 823.3Kazakhstan M 35 0.027 0.013 0.054 0.65 0.44 0.91 0.55 0.30 0.96 655.1 515.2 817.0Kazakhstan M 45 0.022 0.010 0.043 0.62 0.41 0.88 0.38 0.20 0.65 660.6 519.6 825.5Kazakhstan M 55 0.021 0.010 0.041 0.68 0.46 0.96 0.30 0.16 0.51 677.0 535.2 844.0Kazakhstan M 65 0.021 0.010 0.041 0.76 0.50 1.06 0.25 0.13 0.42 695.9 540.0 875.8Kazakhstan M 75 0.021 0.010 0.040 0.82 0.55 1.15 0.22 0.12 0.38 714.2 558.0 898.4Kazakhstan M 90 0.020 0.010 0.038 0.89 0.61 1.24 0.21 0.11 0.35 735.2 575.0 922.3Kenya F 25 0.151 0.073 0.278 0.62 0.34 1.13 1.12 0.61 1.93 507.0 394.1 654.6Kenya F 35 0.125 0.063 0.229 0.58 0.32 1.02 0.84 0.46 1.41 510.0 394.4 659.5Kenya F 45 0.102 0.052 0.187 0.55 0.30 0.95 0.57 0.31 0.96 514.2 393.6 659.8Kenya F 55 0.098 0.051 0.177 0.61 0.33 1.03 0.45 0.25 0.76 527.3 407.4 681.8Kenya F 65 0.098 0.050 0.175 0.68 0.36 1.16 0.37 0.20 0.64 542.2 419.6 705.0Kenya F 75 0.096 0.049 0.170 0.74 0.39 1.25 0.34 0.18 0.58 556.4 431.1 719.4Kenya F 90 0.093 0.047 0.167 0.79 0.43 1.37 0.31 0.17 0.53 572.3 442.7 737.3Kenya M 25 0.125 0.061 0.227 0.55 0.31 0.95 1.23 0.68 2.19 464.7 356.6 604.9Kenya M 35 0.103 0.052 0.188 0.52 0.30 0.89 0.92 0.52 1.60 467.9 361.8 604.9Kenya M 45 0.084 0.040 0.156 0.49 0.28 0.86 0.63 0.35 1.11 472.0 359.0 612.3Kenya M 55 0.080 0.040 0.147 0.54 0.31 0.92 0.50 0.28 0.87 483.6 370.0 624.6Kenya M 65 0.080 0.039 0.146 0.60 0.34 1.04 0.41 0.23 0.73 496.8 383.1 636.3Kenya M 75 0.078 0.038 0.141 0.65 0.37 1.13 0.37 0.21 0.66 509.7 394.2 657.7Kenya M 90 0.076 0.038 0.135 0.70 0.40 1.21 0.34 0.19 0.60 524.3 405.0 679.6Kyrgyzstan F 25 0.085 0.042 0.141 0.64 0.43 0.91 0.62 0.33 1.09 706.3 533.2 911.4Kyrgyzstan F 35 0.070 0.036 0.116 0.60 0.41 0.83 0.46 0.24 0.80 710.7 535.4 906.8Kyrgyzstan F 45 0.057 0.028 0.096 0.57 0.38 0.80 0.31 0.16 0.55 716.4 537.2 916.9Kyrgyzstan F 55 0.055 0.028 0.091 0.62 0.43 0.87 0.25 0.13 0.43 733.3 558.0 940.5Kyrgyzstan F 65 0.055 0.028 0.092 0.70 0.48 0.98 0.21 0.11 0.35 753.0 570.8 968.4Kyrgyzstan F 75 0.054 0.028 0.090 0.75 0.52 1.06 0.19 0.10 0.32 773.1 590.5 984.9Kyrgyzstan F 90 0.052 0.027 0.087 0.82 0.56 1.14 0.17 0.09 0.30 797.5 616.1 1017.3Kyrgyzstan M 25 0.070 0.035 0.129 0.59 0.39 0.83 0.68 0.37 1.17 641.0 494.6 817.1Kyrgyzstan M 35 0.058 0.029 0.106 0.55 0.38 0.77 0.51 0.28 0.86 645.1 499.5 816.2Kyrgyzstan M 45 0.047 0.023 0.086 0.52 0.35 0.73 0.35 0.19 0.61 650.6 501.2 822.4

Country SexMidpoint of age range
Mean juice intake
(servings/day)
Juice, lower uncertainty interval
Juice, upper uncertainty interval
Mean milk intake
(servings/day)
Milk, lower uncertainty interval
Milk, upper uncertainty interval
Mean SSB intake (servings/day)
SSB, lower uncertainty interval
SSB, upper uncertainty interval
Mean calcium intake
(servings/day)
Calcium, lower
uncertainty interval
Calcium, upper
uncertainty interval
Kyrgyzstan M 55 0.045 0.023 0.081 0.57 0.39 0.79 0.27 0.15 0.48 666.7 512.8 848.7Kyrgyzstan M 65 0.045 0.023 0.083 0.64 0.43 0.90 0.22 0.12 0.38 685.5 524.0 880.6Kyrgyzstan M 75 0.044 0.022 0.080 0.69 0.48 0.95 0.20 0.11 0.35 703.6 539.0 906.0Kyrgyzstan M 90 0.043 0.022 0.079 0.75 0.52 1.04 0.19 0.11 0.32 725.0 558.2 932.0Cambodia F 25 0.009 0.004 0.016 0.13 0.07 0.22 0.32 0.17 0.56 473.5 361.1 599.2Cambodia F 35 0.007 0.003 0.013 0.13 0.07 0.21 0.25 0.13 0.42 477.5 366.7 602.6Cambodia F 45 0.006 0.003 0.011 0.12 0.07 0.21 0.17 0.09 0.29 482.3 370.5 607.2Cambodia F 55 0.006 0.003 0.011 0.14 0.07 0.23 0.14 0.07 0.23 493.2 378.8 619.6Cambodia F 65 0.006 0.003 0.011 0.15 0.08 0.26 0.11 0.06 0.19 505.7 388.1 639.2Cambodia F 75 0.006 0.003 0.011 0.17 0.09 0.28 0.10 0.05 0.17 519.8 398.9 658.1Cambodia F 90 0.005 0.003 0.010 0.18 0.09 0.31 0.09 0.05 0.16 536.1 412.1 678.6Cambodia M 25 0.007 0.003 0.013 0.12 0.07 0.21 0.36 0.19 0.61 431.9 331.7 545.0Cambodia M 35 0.006 0.003 0.011 0.12 0.06 0.19 0.27 0.14 0.45 435.7 335.8 549.0Cambodia M 45 0.005 0.002 0.009 0.11 0.06 0.19 0.19 0.10 0.32 440.1 337.9 562.3Cambodia M 55 0.005 0.002 0.009 0.12 0.07 0.20 0.15 0.08 0.25 450.5 347.3 569.4Cambodia M 65 0.005 0.002 0.009 0.14 0.08 0.23 0.12 0.07 0.21 462.1 354.0 586.4Cambodia M 75 0.005 0.002 0.009 0.15 0.08 0.25 0.11 0.06 0.19 474.1 363.5 600.5Cambodia M 90 0.004 0.002 0.008 0.17 0.09 0.27 0.10 0.06 0.17 487.9 373.5 621.7Kiribati F 25 0.726 0.342 1.343 0.11 0.06 0.18 1.94 0.97 3.40 396.9 307.5 510.3Kiribati F 35 0.603 0.289 1.114 0.10 0.06 0.17 1.45 0.74 2.51 399.1 312.1 509.4Kiribati F 45 0.492 0.237 0.925 0.10 0.05 0.16 0.98 0.50 1.73 402.1 313.3 515.4Kiribati F 55 0.473 0.234 0.865 0.11 0.06 0.18 0.78 0.41 1.36 412.4 320.4 528.2Kiribati F 65 0.473 0.235 0.896 0.12 0.06 0.20 0.65 0.34 1.12 424.2 325.3 542.3Kiribati F 75 0.463 0.229 0.873 0.13 0.07 0.21 0.59 0.31 1.01 435.3 335.9 556.2Kiribati F 90 0.450 0.218 0.860 0.14 0.08 0.23 0.54 0.29 0.91 447.9 350.4 573.0Kiribati M 25 0.584 0.276 1.062 0.10 0.06 0.17 2.11 1.08 3.74 362.8 281.8 463.7Kiribati M 35 0.482 0.232 0.869 0.10 0.05 0.16 1.58 0.82 2.74 364.8 284.1 470.5Kiribati M 45 0.390 0.183 0.700 0.09 0.05 0.15 1.08 0.54 1.90 367.7 285.4 478.2Kiribati M 55 0.375 0.179 0.656 0.10 0.06 0.16 0.86 0.43 1.48 377.1 295.0 486.0Kiribati M 65 0.375 0.176 0.679 0.11 0.06 0.19 0.71 0.36 1.24 388.0 304.1 492.7Kiribati M 75 0.367 0.178 0.658 0.12 0.07 0.20 0.64 0.33 1.11 398.1 311.3 506.5Kiribati M 90 0.357 0.175 0.631 0.13 0.07 0.22 0.59 0.31 1.01 409.6 320.3 520.4Republic of Korea F 25 0.140 0.113 0.170 0.29 0.23 0.35 0.22 0.19 0.27 565.3 508.9 629.5Republic of Korea F 35 0.117 0.098 0.136 0.27 0.23 0.32 0.17 0.14 0.20 570.2 517.1 629.7Republic of Korea F 45 0.095 0.077 0.117 0.26 0.21 0.32 0.11 0.09 0.14 576.1 517.7 638.9Republic of Korea F 55 0.092 0.078 0.109 0.29 0.24 0.35 0.09 0.08 0.11 590.0 532.3 651.8Republic of Korea F 65 0.092 0.076 0.112 0.32 0.26 0.39 0.07 0.06 0.09 605.8 541.6 673.3Republic of Korea F 75 0.090 0.075 0.107 0.34 0.29 0.41 0.07 0.06 0.08 621.1 558.9 686.2Republic of Korea F 90 0.087 0.073 0.103 0.37 0.30 0.43 0.07 0.05 0.08 639.1 578.5 705.7Republic of Korea M 25 0.115 0.093 0.139 0.26 0.21 0.31 0.26 0.22 0.32 515.8 464.3 575.0Republic of Korea M 35 0.096 0.080 0.112 0.24 0.20 0.29 0.20 0.17 0.24 520.1 472.7 578.1Republic of Korea M 45 0.078 0.064 0.095 0.23 0.19 0.27 0.14 0.12 0.17 525.2 474.4 587.3Republic of Korea M 55 0.075 0.063 0.088 0.25 0.21 0.30 0.11 0.09 0.13 537.8 488.6 595.6Republic of Korea M 65 0.075 0.062 0.090 0.28 0.23 0.34 0.09 0.07 0.10 552.2 495.9 616.6Republic of Korea M 75 0.073 0.062 0.086 0.31 0.26 0.37 0.08 0.07 0.09 567.6 513.5 631.0Republic of Korea M 90 0.071 0.061 0.084 0.34 0.28 0.41 0.07 0.06 0.09 585.4 533.3 650.3Kuwait F 25 0.155 0.079 0.277 0.65 0.36 1.05 0.78 0.42 1.33 666.7 604.3 734.8Kuwait F 35 0.129 0.066 0.229 0.61 0.34 0.98 0.60 0.33 1.03 671.3 613.8 733.7Kuwait F 45 0.106 0.052 0.191 0.59 0.33 0.94 0.43 0.23 0.75 677.3 616.4 746.3Kuwait F 55 0.102 0.050 0.183 0.65 0.37 1.03 0.35 0.19 0.60 694.1 636.8 757.7Kuwait F 65 0.102 0.050 0.185 0.72 0.41 1.17 0.29 0.16 0.50 713.3 651.5 781.5Kuwait F 75 0.100 0.050 0.180 0.78 0.44 1.26 0.26 0.14 0.44 731.8 672.8 798.1Kuwait F 90 0.097 0.050 0.174 0.84 0.48 1.35 0.24 0.13 0.41 750.2 687.0 817.4Kuwait M 25 0.126 0.064 0.229 0.60 0.32 1.01 0.87 0.48 1.45 610.0 552.8 670.0Kuwait M 35 0.106 0.053 0.187 0.56 0.31 0.94 0.66 0.37 1.11 613.8 563.6 669.6Kuwait M 45 0.087 0.043 0.157 0.54 0.29 0.89 0.45 0.25 0.78 618.7 564.7 681.1Kuwait M 55 0.084 0.042 0.150 0.59 0.32 0.96 0.37 0.20 0.63 634.0 579.1 690.8Kuwait M 65 0.084 0.042 0.151 0.66 0.35 1.08 0.31 0.17 0.54 651.6 590.7 714.0Kuwait M 75 0.081 0.041 0.147 0.72 0.39 1.18 0.28 0.16 0.48 668.4 609.3 729.4Kuwait M 90 0.078 0.040 0.141 0.78 0.42 1.29 0.26 0.15 0.45 685.3 625.2 743.8Lao People's Democratic Republic F 25 0.010 0.005 0.018 0.12 0.07 0.21 0.26 0.14 0.45 464.2 355.0 590.6Lao People's Democratic Republic F 35 0.008 0.004 0.015 0.12 0.07 0.20 0.20 0.11 0.34 468.3 354.5 596.2Lao People's Democratic Republic F 45 0.007 0.003 0.012 0.12 0.06 0.19 0.14 0.07 0.24 473.1 356.7 604.5Lao People's Democratic Republic F 55 0.006 0.003 0.012 0.13 0.07 0.21 0.11 0.06 0.19 483.8 366.9 615.7Lao People's Democratic Republic F 65 0.006 0.003 0.012 0.15 0.08 0.24 0.09 0.05 0.16 496.0 376.6 626.6Lao People's Democratic Republic F 75 0.006 0.003 0.012 0.16 0.09 0.26 0.08 0.04 0.14 509.8 391.2 643.8Lao People's Democratic Republic F 90 0.006 0.003 0.011 0.17 0.10 0.29 0.08 0.04 0.13 526.1 404.9 675.8Lao People's Democratic Republic M 25 0.007 0.004 0.014 0.12 0.06 0.19 0.29 0.16 0.50 430.1 330.2 555.2Lao People's Democratic Republic M 35 0.006 0.003 0.012 0.11 0.06 0.18 0.22 0.12 0.37 433.8 331.7 561.9Lao People's Democratic Republic M 45 0.005 0.003 0.011 0.10 0.06 0.17 0.15 0.08 0.26 438.3 331.8 569.7Lao People's Democratic Republic M 55 0.005 0.003 0.010 0.12 0.06 0.19 0.12 0.07 0.20 448.6 340.5 589.3Lao People's Democratic Republic M 65 0.005 0.003 0.010 0.13 0.07 0.22 0.10 0.05 0.17 460.2 351.5 597.6Lao People's Democratic Republic M 75 0.005 0.003 0.010 0.14 0.08 0.23 0.09 0.05 0.15 472.2 361.9 614.4Lao People's Democratic Republic M 90 0.005 0.002 0.010 0.16 0.08 0.25 0.08 0.04 0.14 485.9 371.6 629.8Lebanon F 25 0.275 0.190 0.378 0.30 0.24 0.38 1.27 0.99 1.60 737.7 676.2 804.3Lebanon F 35 0.230 0.161 0.310 0.29 0.23 0.35 0.97 0.78 1.20 742.9 682.4 806.2Lebanon F 45 0.188 0.134 0.258 0.28 0.22 0.34 0.70 0.55 0.88 749.5 684.2 821.5Lebanon F 55 0.181 0.130 0.247 0.31 0.25 0.37 0.57 0.46 0.71 768.2 708.5 833.2Lebanon F 65 0.181 0.129 0.252 0.34 0.27 0.42 0.47 0.37 0.60 789.5 725.9 860.9Lebanon F 75 0.177 0.127 0.244 0.37 0.29 0.45 0.43 0.34 0.53 809.7 746.6 879.1Lebanon F 90 0.172 0.124 0.235 0.40 0.32 0.48 0.39 0.32 0.48 832.9 770.4 907.2Lebanon M 25 0.227 0.161 0.316 0.28 0.22 0.34 1.42 1.10 1.81 674.6 617.8 736.9Lebanon M 35 0.189 0.137 0.255 0.26 0.21 0.31 1.07 0.85 1.33 678.8 624.2 731.6Lebanon M 45 0.155 0.111 0.211 0.25 0.19 0.31 0.74 0.58 0.95 684.5 624.3 745.0Lebanon M 55 0.149 0.111 0.201 0.27 0.22 0.33 0.59 0.48 0.75 701.4 645.8 756.6

Country SexMidpoint of age range
Mean juice intake
(servings/day)
Juice, lower uncertainty interval
Juice, upper uncertainty interval
Mean milk intake
(servings/day)
Milk, lower uncertainty interval
Milk, upper uncertainty interval
Mean SSB intake (servings/day)
SSB, lower uncertainty interval
SSB, upper uncertainty interval
Mean calcium intake
(servings/day)
Calcium, lower
uncertainty interval
Calcium, upper
uncertainty interval
Lebanon M 65 0.150 0.108 0.205 0.30 0.24 0.37 0.50 0.39 0.62 720.8 659.3 781.0Lebanon M 75 0.145 0.107 0.196 0.33 0.27 0.40 0.46 0.37 0.57 739.0 681.5 799.0Lebanon M 90 0.140 0.102 0.190 0.36 0.29 0.44 0.43 0.34 0.53 759.4 701.2 820.1Liberia F 25 0.018 0.009 0.033 0.11 0.06 0.18 0.45 0.25 0.76 373.0 286.9 478.1Liberia F 35 0.015 0.008 0.027 0.10 0.05 0.17 0.34 0.19 0.56 375.2 290.2 473.8Liberia F 45 0.012 0.006 0.023 0.10 0.05 0.16 0.23 0.12 0.39 378.2 291.3 476.6Liberia F 55 0.012 0.006 0.021 0.11 0.06 0.17 0.18 0.10 0.31 387.7 298.9 488.4Liberia F 65 0.012 0.006 0.021 0.12 0.06 0.20 0.15 0.08 0.25 398.7 303.6 509.3Liberia F 75 0.012 0.006 0.021 0.13 0.07 0.21 0.14 0.08 0.23 409.0 310.3 518.4Liberia F 90 0.011 0.006 0.020 0.14 0.07 0.23 0.13 0.07 0.21 420.4 322.6 534.4Liberia M 25 0.015 0.007 0.027 0.10 0.05 0.17 0.52 0.27 0.88 340.9 260.8 442.0Liberia M 35 0.013 0.006 0.023 0.09 0.05 0.16 0.39 0.20 0.65 343.1 263.4 443.9Liberia M 45 0.010 0.005 0.019 0.09 0.05 0.15 0.26 0.14 0.44 346.0 265.4 452.0Liberia M 55 0.010 0.005 0.018 0.10 0.05 0.16 0.21 0.11 0.35 354.4 273.2 459.6Liberia M 65 0.010 0.005 0.017 0.11 0.06 0.18 0.17 0.09 0.30 364.1 279.7 471.5Liberia M 75 0.010 0.005 0.017 0.12 0.06 0.19 0.16 0.08 0.27 373.5 286.8 480.0Liberia M 90 0.009 0.005 0.017 0.13 0.07 0.22 0.14 0.08 0.25 384.1 293.3 493.4Libyan Arab Jamahiriya F 25 0.224 0.112 0.393 0.59 0.32 1.00 0.74 0.40 1.28 648.0 495.7 826.3Libyan Arab Jamahiriya F 35 0.187 0.093 0.324 0.56 0.31 0.95 0.57 0.31 0.95 652.4 506.3 828.0Libyan Arab Jamahiriya F 45 0.153 0.077 0.267 0.54 0.29 0.92 0.40 0.22 0.69 658.2 511.6 836.3Libyan Arab Jamahiriya F 55 0.147 0.076 0.251 0.59 0.33 1.01 0.33 0.18 0.56 674.6 521.8 852.2Libyan Arab Jamahiriya F 65 0.147 0.075 0.254 0.66 0.36 1.13 0.27 0.15 0.46 693.3 530.6 877.4Libyan Arab Jamahiriya F 75 0.144 0.074 0.248 0.71 0.39 1.20 0.25 0.14 0.41 711.0 549.3 897.1Libyan Arab Jamahiriya F 90 0.140 0.071 0.238 0.77 0.43 1.29 0.23 0.12 0.37 731.6 568.7 918.9Libyan Arab Jamahiriya M 25 0.187 0.093 0.338 0.54 0.31 0.90 0.84 0.47 1.45 594.0 446.1 750.7Libyan Arab Jamahiriya M 35 0.156 0.078 0.276 0.51 0.29 0.84 0.63 0.35 1.10 597.7 453.3 756.0Libyan Arab Jamahiriya M 45 0.128 0.064 0.232 0.48 0.28 0.81 0.44 0.24 0.77 602.7 457.1 768.4Libyan Arab Jamahiriya M 55 0.123 0.063 0.224 0.53 0.31 0.89 0.35 0.20 0.61 617.6 467.5 784.4Libyan Arab Jamahiriya M 65 0.123 0.063 0.227 0.59 0.34 1.00 0.30 0.17 0.50 634.6 478.3 799.3Libyan Arab Jamahiriya M 75 0.120 0.061 0.219 0.64 0.38 1.09 0.27 0.15 0.46 650.5 491.7 820.4Libyan Arab Jamahiriya M 90 0.115 0.059 0.208 0.70 0.41 1.19 0.25 0.14 0.43 668.4 503.7 847.5Saint Lucia F 25 0.381 0.195 0.663 0.86 0.46 1.44 3.13 1.72 5.26 862.8 648.5 1106.6Saint Lucia F 35 0.319 0.167 0.545 0.80 0.43 1.35 2.33 1.29 3.92 867.6 653.4 1105.5Saint Lucia F 45 0.262 0.136 0.456 0.76 0.42 1.28 1.58 0.86 2.65 874.3 661.6 1127.2Saint Lucia F 55 0.249 0.130 0.433 0.83 0.45 1.41 1.27 0.70 2.08 895.6 676.2 1147.6Saint Lucia F 65 0.246 0.125 0.421 0.93 0.49 1.59 1.06 0.58 1.74 920.4 692.7 1175.2Saint Lucia F 75 0.241 0.125 0.413 1.01 0.54 1.70 0.96 0.53 1.58 944.8 711.7 1210.9Saint Lucia F 90 0.234 0.121 0.400 1.10 0.59 1.85 0.88 0.50 1.42 974.5 733.4 1248.2Saint Lucia M 25 0.312 0.154 0.561 0.81 0.45 1.38 3.45 1.92 5.64 787.0 609.4 994.4Saint Lucia M 35 0.260 0.131 0.474 0.76 0.42 1.28 2.55 1.45 4.15 791.6 615.8 990.7Saint Lucia M 45 0.213 0.107 0.396 0.72 0.40 1.23 1.72 0.95 2.82 797.8 619.7 1009.9Saint Lucia M 55 0.205 0.104 0.377 0.78 0.44 1.32 1.38 0.78 2.23 817.0 635.1 1033.6Saint Lucia M 65 0.204 0.101 0.386 0.87 0.49 1.45 1.15 0.63 1.88 839.3 645.5 1073.2Saint Lucia M 75 0.199 0.100 0.364 0.94 0.53 1.56 1.05 0.57 1.70 861.7 665.6 1094.5Saint Lucia M 90 0.191 0.097 0.342 1.02 0.57 1.69 0.96 0.54 1.56 888.7 692.9 1124.5Sri Lanka F 25 0.094 0.045 0.172 1.23 0.94 1.60 0.91 0.63 1.23 624.6 477.4 801.2Sri Lanka F 35 0.080 0.038 0.147 1.18 0.93 1.48 0.69 0.51 0.93 630.0 490.6 807.6Sri Lanka F 45 0.066 0.031 0.124 1.14 0.88 1.45 0.48 0.35 0.67 636.4 496.5 819.4Sri Lanka F 55 0.064 0.031 0.119 1.27 1.00 1.59 0.39 0.29 0.53 650.8 509.0 832.3Sri Lanka F 65 0.064 0.032 0.116 1.44 1.10 1.81 0.32 0.23 0.43 667.2 514.8 848.1Sri Lanka F 75 0.062 0.031 0.112 1.56 1.22 1.94 0.29 0.21 0.39 685.8 531.1 875.4Sri Lanka F 90 0.060 0.030 0.110 1.70 1.32 2.14 0.26 0.19 0.35 708.5 547.3 917.5Sri Lanka M 25 0.075 0.037 0.139 1.16 0.89 1.48 0.99 0.70 1.34 574.8 437.6 745.4Sri Lanka M 35 0.064 0.033 0.117 1.09 0.85 1.37 0.75 0.54 0.98 579.7 447.3 741.8Sri Lanka M 45 0.055 0.028 0.098 1.04 0.80 1.33 0.52 0.37 0.70 585.6 446.9 744.0Sri Lanka M 55 0.054 0.028 0.095 1.15 0.91 1.45 0.42 0.31 0.56 599.4 455.1 760.1Sri Lanka M 65 0.055 0.028 0.098 1.29 1.02 1.64 0.35 0.25 0.47 615.0 467.6 783.0Sri Lanka M 75 0.052 0.026 0.094 1.41 1.12 1.76 0.31 0.23 0.42 631.0 480.8 801.2Sri Lanka M 90 0.049 0.025 0.089 1.54 1.22 1.94 0.29 0.21 0.38 650.3 494.9 825.0Lesotho F 25 0.010 0.005 0.018 0.38 0.20 0.63 0.76 0.42 1.27 406.0 313.0 518.8Lesotho F 35 0.008 0.004 0.014 0.36 0.19 0.59 0.57 0.31 0.94 408.9 315.2 523.5Lesotho F 45 0.007 0.003 0.012 0.34 0.19 0.57 0.39 0.21 0.66 412.6 315.4 531.1Lesotho F 55 0.006 0.003 0.011 0.38 0.20 0.62 0.31 0.17 0.51 422.1 324.7 537.0Lesotho F 65 0.006 0.003 0.011 0.42 0.22 0.69 0.25 0.14 0.43 432.9 333.2 553.6Lesotho F 75 0.006 0.003 0.011 0.45 0.24 0.74 0.23 0.13 0.38 444.3 343.7 566.5Lesotho F 90 0.006 0.003 0.010 0.49 0.26 0.81 0.21 0.12 0.35 457.5 352.5 582.4Lesotho M 25 0.008 0.004 0.015 0.35 0.19 0.58 0.83 0.44 1.43 370.7 284.8 485.4Lesotho M 35 0.007 0.003 0.012 0.33 0.18 0.54 0.62 0.34 1.05 373.0 283.8 483.6Lesotho M 45 0.006 0.003 0.010 0.31 0.17 0.51 0.42 0.23 0.70 376.1 287.2 483.3Lesotho M 55 0.005 0.003 0.010 0.34 0.19 0.55 0.33 0.18 0.55 385.1 292.1 494.0Lesotho M 65 0.005 0.003 0.010 0.38 0.21 0.63 0.27 0.15 0.45 395.4 297.2 509.3Lesotho M 75 0.005 0.003 0.010 0.41 0.23 0.67 0.25 0.14 0.41 405.9 307.5 522.7Lesotho M 90 0.005 0.002 0.009 0.45 0.25 0.73 0.23 0.13 0.38 417.9 320.3 534.5Lithuania F 25 0.151 0.071 0.283 0.94 0.73 1.20 0.57 0.31 0.96 816.7 754.8 884.0Lithuania F 35 0.124 0.059 0.235 0.90 0.70 1.12 0.42 0.24 0.72 823.5 770.4 880.3Lithuania F 45 0.100 0.048 0.182 0.87 0.67 1.10 0.29 0.16 0.50 831.8 769.1 896.3Lithuania F 55 0.096 0.046 0.176 0.95 0.75 1.19 0.23 0.13 0.39 850.9 796.6 906.0Lithuania F 65 0.097 0.044 0.179 1.06 0.83 1.35 0.19 0.11 0.32 872.6 811.5 937.9Lithuania F 75 0.094 0.044 0.172 1.14 0.91 1.44 0.17 0.10 0.29 894.8 837.7 954.1Lithuania F 90 0.091 0.044 0.167 1.23 0.97 1.54 0.16 0.09 0.27 921.7 865.7 981.1Lithuania M 25 0.125 0.060 0.223 0.86 0.67 1.09 0.60 0.33 0.99 745.6 687.7 809.6Lithuania M 35 0.103 0.049 0.182 0.82 0.65 1.01 0.45 0.25 0.73 749.2 697.7 800.0Lithuania M 45 0.083 0.039 0.145 0.79 0.61 1.00 0.31 0.17 0.50 754.6 696.7 811.3Lithuania M 55 0.080 0.038 0.142 0.88 0.70 1.09 0.24 0.13 0.40 774.6 723.2 824.8Lithuania M 65 0.080 0.039 0.142 1.00 0.79 1.26 0.20 0.11 0.33 797.8 740.9 856.7Lithuania M 75 0.078 0.038 0.138 1.07 0.84 1.33 0.18 0.10 0.30 819.3 764.5 875.4Lithuania M 90 0.076 0.036 0.134 1.14 0.88 1.42 0.17 0.09 0.27 843.7 788.4 900.4Luxembourg F 25 0.215 0.126 0.335 0.71 0.43 1.10 0.61 0.39 0.95 937.7 725.2 1214.6Luxembourg F 35 0.173 0.102 0.270 0.67 0.41 1.05 0.43 0.27 0.68 944.6 727.9 1213.8Luxembourg F 45 0.135 0.079 0.213 0.64 0.39 1.00 0.28 0.17 0.43 953.0 732.1 1221.3Luxembourg F 55 0.131 0.076 0.206 0.68 0.42 1.07 0.22 0.14 0.35 974.1 751.0 1245.8Luxembourg F 65 0.133 0.076 0.210 0.74 0.46 1.17 0.19 0.12 0.30 998.2 763.3 1285.9Luxembourg F 75 0.133 0.078 0.208 0.82 0.50 1.26 0.17 0.11 0.27 1023.4 787.0 1318.2Luxembourg F 90 0.132 0.077 0.206 0.91 0.56 1.38 0.16 0.10 0.26 1055.0 816.6 1361.4Luxembourg M 25 0.171 0.101 0.268 0.68 0.42 1.05 0.71 0.45 1.11 859.4 665.0 1106.3Luxembourg M 35 0.139 0.083 0.217 0.61 0.38 0.93 0.50 0.32 0.77 863.0 668.2 1098.7Luxembourg M 45 0.110 0.066 0.170 0.56 0.35 0.85 0.31 0.19 0.47 868.2 667.3 1107.7Luxembourg M 55 0.104 0.063 0.160 0.60 0.37 0.93 0.24 0.15 0.37 886.8 685.4 1126.9Luxembourg M 65 0.104 0.062 0.159 0.66 0.40 1.03 0.20 0.13 0.31 908.5 704.6 1169.8

Country SexMidpoint of age range
Mean juice intake
(servings/day)
Juice, lower uncertainty interval
Juice, upper uncertainty interval
Mean milk intake
(servings/day)
Milk, lower uncertainty interval
Milk, upper uncertainty interval
Mean SSB intake (servings/day)
SSB, lower uncertainty interval
SSB, upper uncertainty interval
Mean calcium intake
(servings/day)
Calcium, lower
uncertainty interval
Calcium, upper
uncertainty interval
Luxembourg M 75 0.104 0.064 0.161 0.73 0.44 1.13 0.18 0.12 0.28 931.4 721.1 1193.3Luxembourg M 90 0.106 0.064 0.165 0.82 0.50 1.24 0.17 0.11 0.26 958.8 743.3 1218.4Latvia F 25 0.047 0.032 0.066 0.67 0.53 0.83 0.41 0.31 0.51 829.7 768.2 894.0Latvia F 35 0.038 0.027 0.054 0.64 0.52 0.78 0.30 0.24 0.36 836.7 782.4 892.2Latvia F 45 0.031 0.021 0.044 0.62 0.49 0.77 0.21 0.16 0.26 845.1 782.2 911.3Latvia F 55 0.030 0.021 0.041 0.68 0.55 0.84 0.17 0.13 0.20 864.5 809.9 922.2Latvia F 65 0.030 0.021 0.042 0.76 0.60 0.95 0.14 0.11 0.17 886.6 828.4 953.2Latvia F 75 0.029 0.021 0.040 0.81 0.65 1.01 0.12 0.10 0.15 909.0 852.8 969.1Latvia F 90 0.028 0.020 0.039 0.88 0.71 1.08 0.11 0.09 0.14 936.7 876.6 998.6Latvia M 25 0.039 0.027 0.056 0.61 0.49 0.76 0.45 0.35 0.56 756.9 698.5 817.3Latvia M 35 0.032 0.023 0.045 0.58 0.47 0.71 0.33 0.27 0.41 760.5 710.7 813.0Latvia M 45 0.026 0.018 0.037 0.56 0.44 0.69 0.23 0.18 0.28 766.0 711.4 826.3Latvia M 55 0.025 0.018 0.035 0.63 0.51 0.77 0.18 0.15 0.22 786.3 738.1 841.5Latvia M 65 0.025 0.017 0.035 0.71 0.57 0.89 0.15 0.12 0.18 809.8 751.6 870.5Latvia M 75 0.024 0.017 0.034 0.76 0.62 0.94 0.14 0.11 0.16 831.5 777.7 888.6Latvia M 90 0.024 0.017 0.033 0.81 0.67 0.99 0.13 0.10 0.15 856.4 804.9 915.3Morocco F 25 0.174 0.086 0.319 0.27 0.15 0.45 0.86 0.49 1.44 545.7 416.6 714.0Morocco F 35 0.145 0.074 0.270 0.26 0.14 0.42 0.66 0.37 1.11 549.6 415.0 716.8Morocco F 45 0.119 0.061 0.225 0.25 0.13 0.41 0.47 0.26 0.81 554.6 415.2 724.4Morocco F 55 0.114 0.059 0.211 0.27 0.15 0.45 0.38 0.21 0.65 568.3 432.1 740.7Morocco F 65 0.114 0.058 0.212 0.30 0.16 0.50 0.32 0.18 0.55 583.9 442.7 756.4Morocco F 75 0.112 0.057 0.208 0.33 0.18 0.54 0.29 0.16 0.50 598.9 454.6 777.6Morocco F 90 0.109 0.055 0.198 0.36 0.19 0.59 0.26 0.15 0.45 616.1 467.6 805.2Morocco M 25 0.142 0.071 0.256 0.25 0.14 0.43 0.95 0.51 1.58 496.6 380.3 634.8Morocco M 35 0.119 0.061 0.210 0.23 0.13 0.39 0.71 0.39 1.20 499.7 388.0 633.4Morocco M 45 0.097 0.049 0.175 0.22 0.12 0.37 0.49 0.27 0.82 503.9 389.8 640.4Morocco M 55 0.094 0.047 0.168 0.25 0.14 0.41 0.40 0.22 0.67 516.3 401.0 653.8Morocco M 65 0.094 0.048 0.168 0.27 0.15 0.46 0.33 0.18 0.57 530.5 406.7 670.3Morocco M 75 0.091 0.046 0.163 0.30 0.17 0.50 0.31 0.16 0.52 544.0 419.9 688.2Morocco M 90 0.087 0.044 0.156 0.33 0.18 0.55 0.28 0.15 0.48 559.0 433.1 708.4Moldova F 25 0.087 0.042 0.157 0.60 0.40 0.87 0.62 0.33 1.02 777.1 597.1 983.1Moldova F 35 0.072 0.035 0.129 0.57 0.39 0.83 0.47 0.26 0.75 783.7 604.4 990.7Moldova F 45 0.058 0.028 0.104 0.56 0.37 0.82 0.32 0.17 0.53 791.6 610.0 1003.3Moldova F 55 0.056 0.028 0.099 0.61 0.41 0.89 0.25 0.14 0.42 809.8 630.8 1021.6Moldova F 65 0.056 0.027 0.099 0.68 0.45 0.98 0.21 0.11 0.35 830.3 645.5 1044.4Moldova F 75 0.054 0.027 0.095 0.73 0.49 1.05 0.19 0.10 0.31 851.5 661.7 1066.3Moldova F 90 0.053 0.026 0.092 0.79 0.53 1.14 0.17 0.09 0.28 876.7 682.2 1093.8Moldova M 25 0.072 0.037 0.128 0.55 0.36 0.78 0.67 0.38 1.13 717.3 543.1 925.2Moldova M 35 0.059 0.031 0.105 0.52 0.35 0.73 0.50 0.29 0.85 720.6 548.1 923.9Moldova M 45 0.048 0.024 0.085 0.50 0.33 0.71 0.34 0.20 0.58 725.9 552.5 934.8Moldova M 55 0.046 0.024 0.080 0.56 0.38 0.79 0.27 0.16 0.47 745.0 573.2 956.0Moldova M 65 0.046 0.024 0.079 0.64 0.43 0.89 0.23 0.13 0.39 767.0 588.1 977.4Moldova M 75 0.045 0.023 0.077 0.68 0.46 0.95 0.20 0.11 0.35 787.7 605.1 1004.0Moldova M 90 0.044 0.023 0.076 0.72 0.48 1.02 0.19 0.11 0.31 811.2 626.1 1041.8Madagascar F 25 0.020 0.009 0.036 0.29 0.15 0.51 0.44 0.24 0.72 426.5 326.7 551.5Madagascar F 35 0.017 0.008 0.030 0.27 0.15 0.47 0.33 0.18 0.54 429.1 329.2 556.4Madagascar F 45 0.014 0.007 0.025 0.26 0.14 0.44 0.22 0.12 0.38 432.5 329.9 561.3Madagascar F 55 0.013 0.006 0.023 0.28 0.15 0.48 0.18 0.10 0.29 443.5 340.8 575.0Madagascar F 65 0.013 0.006 0.023 0.32 0.17 0.53 0.15 0.08 0.24 456.0 350.5 589.3Madagascar F 75 0.013 0.006 0.022 0.34 0.19 0.58 0.13 0.07 0.22 467.9 358.5 597.2Madagascar F 90 0.012 0.006 0.022 0.37 0.20 0.61 0.12 0.07 0.20 481.2 370.0 608.3Madagascar M 25 0.016 0.008 0.030 0.26 0.14 0.44 0.49 0.27 0.82 390.4 301.0 506.0Madagascar M 35 0.014 0.007 0.025 0.24 0.13 0.41 0.37 0.21 0.60 392.9 303.4 503.2Madagascar M 45 0.011 0.005 0.020 0.23 0.13 0.40 0.25 0.14 0.41 396.3 303.7 507.7Madagascar M 55 0.011 0.005 0.019 0.25 0.14 0.43 0.20 0.11 0.33 406.1 313.1 522.1Madagascar M 65 0.011 0.005 0.019 0.28 0.15 0.49 0.16 0.09 0.27 417.2 321.4 539.9Madagascar M 75 0.010 0.005 0.019 0.30 0.17 0.52 0.15 0.08 0.24 428.1 331.2 553.8Madagascar M 90 0.010 0.005 0.018 0.33 0.18 0.54 0.14 0.08 0.22 440.4 340.6 570.7Maldives F 25 0.364 0.183 0.670 0.68 0.37 1.20 1.12 0.57 1.95 688.5 511.5 887.5Maldives F 35 0.306 0.156 0.552 0.65 0.35 1.13 0.85 0.45 1.44 694.6 518.3 897.8Maldives F 45 0.254 0.126 0.456 0.63 0.34 1.08 0.59 0.31 0.99 701.8 522.4 917.6Maldives F 55 0.245 0.125 0.436 0.71 0.38 1.23 0.48 0.25 0.78 717.5 533.5 937.0Maldives F 65 0.246 0.127 0.436 0.80 0.43 1.38 0.39 0.20 0.67 735.9 547.7 960.3Maldives F 75 0.239 0.123 0.430 0.86 0.47 1.48 0.36 0.18 0.60 756.1 563.9 981.8Maldives F 90 0.231 0.120 0.423 0.93 0.51 1.62 0.33 0.17 0.55 779.4 583.1 1009.2Maldives M 25 0.282 0.146 0.526 0.64 0.34 1.13 1.21 0.63 2.15 626.1 476.1 815.5Maldives M 35 0.241 0.126 0.446 0.60 0.32 1.05 0.91 0.48 1.60 631.5 479.2 820.7Maldives M 45 0.205 0.104 0.379 0.57 0.31 0.99 0.63 0.34 1.11 638.0 485.0 835.5Maldives M 55 0.202 0.104 0.373 0.64 0.34 1.09 0.51 0.27 0.89 652.9 496.2 844.3Maldives M 65 0.204 0.102 0.374 0.72 0.39 1.25 0.42 0.23 0.75 670.0 504.8 862.6Maldives M 75 0.196 0.101 0.359 0.78 0.43 1.36 0.38 0.21 0.68 687.5 521.7 889.0Maldives M 90 0.185 0.097 0.330 0.85 0.46 1.48 0.35 0.19 0.63 707.1 541.8 921.2Mexico F 25 0.337 0.161 0.629 1.10 0.92 1.31 2.40 1.71 3.24 961.9 893.9 1038.0Mexico F 35 0.278 0.136 0.506 1.04 0.90 1.20 1.87 1.36 2.48 969.0 909.6 1033.6Mexico F 45 0.226 0.108 0.401 1.00 0.84 1.18 1.37 0.99 1.85 978.1 907.5 1057.0Mexico F 55 0.218 0.102 0.392 1.09 0.94 1.25 1.09 0.80 1.45 1002.4 936.5 1071.7Mexico F 65 0.218 0.101 0.403 1.21 1.01 1.42 0.88 0.62 1.19 1029.9 952.4 1108.1Mexico F 75 0.213 0.100 0.398 1.31 1.13 1.50 0.79 0.57 1.06 1055.8 985.4 1126.9Mexico F 90 0.206 0.097 0.381 1.42 1.22 1.64 0.71 0.52 0.94 1086.6 1016.9 1159.5Mexico M 25 0.275 0.130 0.468 0.99 0.83 1.17 2.61 1.83 3.56 880.9 813.8 952.5Mexico M 35 0.227 0.113 0.388 0.94 0.81 1.08 2.03 1.46 2.72 885.9 827.2 945.2Mexico M 45 0.184 0.091 0.313 0.90 0.76 1.05 1.48 1.06 2.01 892.9 825.3 959.6Mexico M 55 0.177 0.089 0.302 0.98 0.85 1.13 1.19 0.86 1.60 916.0 858.8 974.9Mexico M 65 0.177 0.087 0.307 1.10 0.92 1.29 0.97 0.69 1.32 942.5 873.3 1011.8Mexico M 75 0.174 0.087 0.299 1.19 1.02 1.37 0.87 0.63 1.18 967.3 906.2 1031.4Mexico M 90 0.169 0.084 0.286 1.29 1.11 1.48 0.79 0.57 1.07 996.2 933.6 1060.5Marshall Islands F 25 0.200 0.100 0.351 0.27 0.15 0.45 1.01 0.56 1.75 484.8 375.3 625.9Marshall Islands F 35 0.166 0.084 0.295 0.25 0.14 0.42 0.75 0.43 1.29 487.6 382.5 622.1Marshall Islands F 45 0.136 0.068 0.241 0.24 0.13 0.40 0.51 0.28 0.87 491.4 383.1 631.8Marshall Islands F 55 0.130 0.067 0.227 0.26 0.15 0.43 0.41 0.23 0.69 503.8 395.0 645.9Marshall Islands F 65 0.130 0.066 0.224 0.29 0.16 0.48 0.34 0.19 0.59 518.0 400.5 660.9Marshall Islands F 75 0.128 0.064 0.218 0.32 0.18 0.52 0.31 0.17 0.53 531.7 412.9 678.1Marshall Islands F 90 0.124 0.061 0.212 0.34 0.20 0.57 0.28 0.16 0.49 547.2 424.6 698.2Marshall Islands M 25 0.164 0.079 0.292 0.25 0.13 0.41 1.11 0.60 1.86 445.6 338.8 575.6Marshall Islands M 35 0.135 0.067 0.242 0.23 0.13 0.38 0.83 0.45 1.39 448.0 342.8 576.2Marshall Islands M 45 0.110 0.053 0.200 0.22 0.12 0.37 0.57 0.30 0.99 451.4 341.1 580.8Marshall Islands M 55 0.105 0.052 0.192 0.24 0.13 0.40 0.45 0.25 0.77 463.1 353.9 591.0Marshall Islands M 65 0.105 0.053 0.193 0.27 0.15 0.46 0.37 0.20 0.63 476.6 365.9 611.3Marshall Islands M 75 0.103 0.053 0.187 0.29 0.16 0.49 0.34 0.19 0.56 489.1 376.7 629.3

Country SexMidpoint of age range
Mean juice intake
(servings/day)
Juice, lower uncertainty interval
Juice, upper uncertainty interval
Mean milk intake
(servings/day)
Milk, lower uncertainty interval
Milk, upper uncertainty interval
Mean SSB intake (servings/day)
SSB, lower uncertainty interval
SSB, upper uncertainty interval
Mean calcium intake
(servings/day)
Calcium, lower
uncertainty interval
Calcium, upper
uncertainty interval
Marshall Islands M 90 0.100 0.050 0.179 0.31 0.17 0.53 0.31 0.17 0.53 503.2 387.7 647.7Macedonia (Former Yugoslav Republic of) F 25 0.508 0.252 0.901 0.53 0.28 0.88 0.55 0.31 0.96 578.6 448.0 742.6Macedonia (Former Yugoslav Republic of) F 35 0.421 0.209 0.748 0.50 0.26 0.82 0.41 0.23 0.70 581.2 453.6 747.8Macedonia (Former Yugoslav Republic of) F 45 0.342 0.164 0.602 0.48 0.25 0.82 0.28 0.16 0.47 585.3 453.1 754.3Macedonia (Former Yugoslav Republic of) F 55 0.322 0.157 0.565 0.53 0.29 0.91 0.22 0.13 0.38 600.1 465.7 768.2Macedonia (Former Yugoslav Republic of) F 65 0.315 0.154 0.564 0.60 0.33 1.03 0.19 0.11 0.31 617.3 481.1 786.9Macedonia (Former Yugoslav Republic of) F 75 0.309 0.151 0.551 0.65 0.36 1.12 0.17 0.10 0.29 633.7 494.9 808.5Macedonia (Former Yugoslav Republic of) F 90 0.302 0.145 0.543 0.71 0.38 1.20 0.16 0.09 0.26 652.8 510.8 835.2Macedonia (Former Yugoslav Republic of) M 25 0.411 0.197 0.787 0.48 0.26 0.82 0.66 0.37 1.08 528.7 406.7 678.4Macedonia (Former Yugoslav Republic of) M 35 0.340 0.162 0.645 0.45 0.25 0.77 0.49 0.28 0.79 529.5 409.2 677.6Macedonia (Former Yugoslav Republic of) M 45 0.275 0.124 0.522 0.43 0.23 0.74 0.33 0.19 0.54 531.7 405.5 678.7Macedonia (Former Yugoslav Republic of) M 55 0.262 0.120 0.499 0.48 0.26 0.81 0.26 0.15 0.43 544.5 419.7 694.0Macedonia (Former Yugoslav Republic of) M 65 0.260 0.121 0.494 0.54 0.29 0.89 0.21 0.12 0.35 559.6 427.5 715.2Macedonia (Former Yugoslav Republic of) M 75 0.258 0.121 0.487 0.59 0.32 0.98 0.19 0.11 0.32 575.4 440.8 737.6Macedonia (Former Yugoslav Republic of) M 90 0.255 0.123 0.475 0.64 0.35 1.09 0.18 0.10 0.30 593.4 457.7 762.7Mali F 25 0.013 0.006 0.024 0.58 0.35 0.88 0.79 0.42 1.31 515.9 422.7 618.3Mali F 35 0.011 0.005 0.020 0.55 0.33 0.82 0.59 0.32 0.98 518.8 429.6 617.1Mali F 45 0.009 0.004 0.016 0.52 0.31 0.81 0.40 0.22 0.68 522.9 431.0 620.1Mali F 55 0.008 0.004 0.015 0.58 0.35 0.89 0.32 0.18 0.54 536.2 443.9 634.1Mali F 65 0.008 0.004 0.015 0.65 0.40 1.01 0.26 0.14 0.44 551.4 457.3 651.6Mali F 75 0.008 0.004 0.015 0.70 0.43 1.07 0.24 0.13 0.40 565.5 471.0 670.1Mali F 90 0.008 0.004 0.014 0.75 0.47 1.15 0.22 0.13 0.36 580.9 483.7 691.5Mali M 25 0.010 0.005 0.018 0.55 0.33 0.85 0.90 0.47 1.50 477.1 392.6 570.3Mali M 35 0.008 0.004 0.015 0.51 0.32 0.77 0.67 0.36 1.11 480.1 398.9 571.4Mali M 45 0.007 0.003 0.012 0.49 0.30 0.74 0.45 0.24 0.77 484.1 400.2 574.9Mali M 55 0.007 0.003 0.012 0.53 0.33 0.82 0.36 0.19 0.61 495.9 412.7 586.2Mali M 65 0.007 0.003 0.012 0.60 0.36 0.92 0.30 0.16 0.49 509.4 421.6 605.4Mali M 75 0.007 0.003 0.011 0.65 0.40 0.99 0.27 0.14 0.45 522.6 435.1 621.7Mali M 90 0.006 0.003 0.011 0.70 0.43 1.06 0.25 0.13 0.41 537.2 447.9 638.8Malta F 25 0.611 0.494 0.756 1.05 0.78 1.39 1.36 0.93 1.91 894.3 676.5 1159.2Malta F 35 0.491 0.399 0.599 0.99 0.74 1.30 0.97 0.67 1.35 900.7 688.3 1150.4Malta F 45 0.382 0.305 0.470 0.94 0.69 1.25 0.61 0.42 0.87 908.8 696.3 1152.0Malta F 55 0.371 0.301 0.454 1.00 0.74 1.32 0.49 0.34 0.69 929.0 706.2 1179.5Malta F 65 0.378 0.304 0.465 1.09 0.81 1.44 0.42 0.29 0.59 951.8 716.7 1212.1Malta F 75 0.378 0.306 0.463 1.19 0.90 1.57 0.39 0.27 0.54 975.9 735.4 1244.3Malta F 90 0.375 0.302 0.468 1.33 0.99 1.77 0.36 0.25 0.50 1005.5 762.6 1278.2Malta M 25 0.490 0.394 0.600 1.00 0.74 1.34 1.61 1.12 2.24 823.2 635.3 1069.9Malta M 35 0.398 0.322 0.484 0.91 0.69 1.20 1.13 0.80 1.59 826.5 643.9 1065.9Malta M 45 0.313 0.246 0.390 0.84 0.62 1.11 0.69 0.48 0.97 831.6 646.0 1065.6Malta M 55 0.297 0.239 0.366 0.89 0.67 1.16 0.54 0.38 0.75 849.5 657.4 1086.4Malta M 65 0.296 0.236 0.370 0.97 0.73 1.28 0.45 0.31 0.64 870.2 668.8 1121.3Malta M 75 0.299 0.240 0.368 1.08 0.82 1.40 0.41 0.28 0.58 892.2 685.2 1149.9Malta M 90 0.304 0.243 0.376 1.21 0.91 1.60 0.38 0.26 0.54 918.7 704.7 1184.9Myanmar F 25 0.027 0.014 0.047 0.30 0.17 0.52 0.47 0.26 0.79 571.5 451.3 719.5Myanmar F 35 0.022 0.012 0.040 0.29 0.16 0.48 0.36 0.20 0.60 576.4 454.6 728.9Myanmar F 45 0.019 0.009 0.033 0.28 0.16 0.46 0.25 0.14 0.44 582.2 457.5 739.9Myanmar F 55 0.018 0.009 0.032 0.31 0.17 0.51 0.20 0.11 0.34 595.5 468.5 749.0Myanmar F 65 0.018 0.009 0.032 0.35 0.19 0.57 0.17 0.09 0.28 610.6 477.8 762.4Myanmar F 75 0.018 0.009 0.032 0.38 0.21 0.63 0.15 0.09 0.25 627.6 493.2 783.9Myanmar F 90 0.017 0.009 0.031 0.42 0.23 0.68 0.14 0.08 0.22 647.6 511.5 810.7Myanmar M 25 0.021 0.011 0.038 0.29 0.16 0.48 0.52 0.28 0.91 525.2 410.5 685.0Myanmar M 35 0.018 0.009 0.032 0.27 0.15 0.45 0.39 0.22 0.67 529.8 412.9 689.5Myanmar M 45 0.015 0.008 0.027 0.26 0.14 0.43 0.27 0.14 0.47 535.2 413.3 694.3Myanmar M 55 0.015 0.008 0.027 0.29 0.16 0.48 0.22 0.12 0.37 547.7 426.8 709.4Myanmar M 65 0.015 0.008 0.028 0.32 0.18 0.54 0.18 0.10 0.31 561.9 438.7 728.5Myanmar M 75 0.015 0.007 0.027 0.35 0.19 0.59 0.17 0.09 0.28 576.6 451.4 748.3Myanmar M 90 0.014 0.007 0.025 0.38 0.21 0.65 0.15 0.08 0.26 593.5 465.1 767.8Montenegro F 25 0.203 0.119 0.327 1.08 0.76 1.51 0.42 0.26 0.65 695.3 539.5 880.8Montenegro F 35 0.169 0.100 0.272 1.02 0.72 1.41 0.31 0.20 0.48 698.7 544.9 893.2Montenegro F 45 0.137 0.080 0.229 0.98 0.68 1.37 0.21 0.13 0.34 703.7 544.3 902.1Montenegro F 55 0.129 0.076 0.212 1.09 0.78 1.52 0.17 0.10 0.27 721.6 560.3 913.6Montenegro F 65 0.126 0.074 0.207 1.23 0.89 1.71 0.14 0.09 0.23 742.1 571.5 943.3Montenegro F 75 0.124 0.073 0.200 1.34 0.97 1.85 0.13 0.08 0.20 761.9 587.9 965.5Montenegro F 90 0.121 0.072 0.192 1.46 1.04 2.00 0.12 0.08 0.19 784.8 612.6 996.3Montenegro M 25 0.161 0.097 0.259 1.00 0.70 1.42 0.49 0.29 0.75 635.1 489.0 819.8Montenegro M 35 0.133 0.080 0.213 0.94 0.65 1.32 0.37 0.22 0.56 635.9 490.3 814.2Montenegro M 45 0.107 0.063 0.175 0.90 0.62 1.28 0.25 0.15 0.38 638.5 492.1 816.5Montenegro M 55 0.102 0.062 0.163 1.00 0.70 1.41 0.19 0.12 0.30 653.7 504.4 835.3Montenegro M 65 0.102 0.060 0.160 1.13 0.79 1.59 0.16 0.10 0.24 671.8 520.6 857.7Montenegro M 75 0.101 0.061 0.158 1.23 0.86 1.74 0.14 0.09 0.22 690.9 534.3 880.5Montenegro M 90 0.100 0.060 0.157 1.34 0.93 1.89 0.13 0.08 0.20 712.9 544.9 917.5Mongolia F 25 0.010 0.005 0.019 0.59 0.33 1.02 0.36 0.20 0.59 687.1 525.9 884.4Mongolia F 35 0.008 0.004 0.015 0.55 0.31 0.94 0.27 0.15 0.44 691.3 531.8 877.5Mongolia F 45 0.007 0.003 0.013 0.52 0.29 0.88 0.18 0.10 0.30 696.8 529.6 895.4Mongolia F 55 0.007 0.003 0.012 0.57 0.32 0.95 0.14 0.08 0.24 713.4 544.7 907.9Mongolia F 65 0.007 0.003 0.012 0.64 0.35 1.07 0.12 0.06 0.20 732.7 559.1 933.3Mongolia F 75 0.006 0.003 0.012 0.69 0.39 1.16 0.11 0.06 0.18 752.1 572.9 958.2Mongolia F 90 0.006 0.003 0.012 0.75 0.42 1.27 0.10 0.06 0.16 774.9 591.7 979.3Mongolia M 25 0.009 0.004 0.016 0.53 0.29 0.87 0.40 0.23 0.67 624.4 475.6 788.3Mongolia M 35 0.007 0.003 0.013 0.49 0.27 0.81 0.30 0.17 0.50 628.3 482.3 782.5Mongolia M 45 0.006 0.003 0.011 0.47 0.26 0.79 0.20 0.11 0.35 633.5 487.6 795.0Mongolia M 55 0.005 0.003 0.010 0.51 0.28 0.87 0.16 0.09 0.27 649.3 500.5 808.7Mongolia M 65 0.005 0.003 0.010 0.57 0.31 0.97 0.13 0.07 0.23 667.6 514.6 844.3Mongolia M 75 0.005 0.003 0.010 0.62 0.34 1.02 0.12 0.07 0.20 685.1 527.1 861.4Mongolia M 90 0.005 0.003 0.010 0.67 0.37 1.10 0.11 0.06 0.19 705.1 543.4 886.6

Country SexMidpoint of age range
Mean juice intake
(servings/day)
Juice, lower uncertainty interval
Juice, upper uncertainty interval
Mean milk intake
(servings/day)
Milk, lower uncertainty interval
Milk, upper uncertainty interval
Mean SSB intake (servings/day)
SSB, lower uncertainty interval
SSB, upper uncertainty interval
Mean calcium intake
(servings/day)
Calcium, lower
uncertainty interval
Calcium, upper
uncertainty interval
Mozambique F 25 0.004 0.002 0.008 0.08 0.06 0.10 0.48 0.26 0.80 319.7 280.2 360.8Mozambique F 35 0.004 0.002 0.007 0.07 0.06 0.09 0.36 0.19 0.60 321.5 285.9 360.1Mozambique F 45 0.003 0.001 0.005 0.07 0.06 0.09 0.25 0.13 0.42 324.1 286.6 363.3Mozambique F 55 0.003 0.001 0.005 0.08 0.06 0.09 0.19 0.10 0.32 332.3 297.6 369.0Mozambique F 65 0.003 0.001 0.005 0.09 0.07 0.11 0.16 0.08 0.27 341.8 302.3 386.2Mozambique F 75 0.003 0.001 0.005 0.09 0.08 0.11 0.14 0.08 0.25 350.6 313.4 393.2Mozambique F 90 0.003 0.001 0.005 0.10 0.08 0.12 0.13 0.07 0.23 360.6 322.5 402.2Mozambique M 25 0.004 0.002 0.007 0.07 0.06 0.09 0.54 0.30 0.91 293.1 259.3 331.1Mozambique M 35 0.003 0.001 0.006 0.07 0.05 0.08 0.40 0.23 0.67 295.0 263.5 328.5Mozambique M 45 0.002 0.001 0.004 0.06 0.05 0.08 0.27 0.15 0.47 297.6 262.9 335.4Mozambique M 55 0.002 0.001 0.004 0.07 0.06 0.08 0.22 0.12 0.37 304.9 273.9 340.9Mozambique M 65 0.002 0.001 0.004 0.08 0.06 0.10 0.18 0.10 0.31 313.3 279.1 353.1Mozambique M 75 0.002 0.001 0.004 0.08 0.07 0.10 0.16 0.09 0.28 321.4 288.6 358.9Mozambique M 90 0.002 0.001 0.004 0.09 0.07 0.11 0.15 0.08 0.25 330.5 295.5 367.6Mauritania F 25 0.033 0.016 0.063 1.07 0.55 1.90 1.63 0.82 2.86 623.7 447.5 821.6Mauritania F 35 0.028 0.013 0.051 1.01 0.52 1.79 1.22 0.62 2.12 627.2 450.1 822.4Mauritania F 45 0.023 0.011 0.044 0.96 0.49 1.71 0.83 0.40 1.45 632.2 456.5 829.4Mauritania F 55 0.022 0.010 0.041 1.06 0.54 1.87 0.66 0.33 1.15 648.1 468.9 844.5Mauritania F 65 0.022 0.011 0.041 1.19 0.60 2.10 0.54 0.28 0.98 666.4 477.3 869.2Mauritania F 75 0.021 0.010 0.040 1.28 0.65 2.24 0.49 0.25 0.89 683.5 491.7 893.9Mauritania F 90 0.020 0.010 0.038 1.38 0.71 2.39 0.46 0.23 0.80 702.0 508.8 915.2Mauritania M 25 0.027 0.012 0.052 1.02 0.52 1.78 1.77 0.93 3.18 576.6 426.6 774.4Mauritania M 35 0.022 0.010 0.043 0.95 0.49 1.65 1.32 0.71 2.37 580.2 428.7 770.5Mauritania M 45 0.018 0.008 0.035 0.90 0.46 1.55 0.90 0.47 1.61 585.0 430.2 776.1Mauritania M 55 0.018 0.008 0.033 0.99 0.52 1.70 0.71 0.37 1.27 599.2 443.3 790.0Mauritania M 65 0.018 0.008 0.033 1.11 0.59 1.93 0.59 0.31 1.03 615.5 456.3 812.0Mauritania M 75 0.017 0.008 0.033 1.20 0.63 2.09 0.53 0.28 0.94 631.5 468.0 835.0Mauritania M 90 0.017 0.008 0.032 1.29 0.68 2.22 0.49 0.26 0.89 648.8 487.8 853.5Mauritius F 25 0.056 0.028 0.098 0.80 0.41 1.41 0.97 0.51 1.64 717.0 526.3 954.7Mauritius F 35 0.047 0.023 0.083 0.76 0.41 1.34 0.73 0.39 1.26 723.2 528.6 957.0Mauritius F 45 0.039 0.019 0.070 0.74 0.39 1.31 0.52 0.27 0.90 730.6 533.7 961.2Mauritius F 55 0.038 0.019 0.066 0.83 0.44 1.46 0.41 0.22 0.71 747.0 547.3 982.1Mauritius F 65 0.038 0.019 0.065 0.93 0.49 1.65 0.34 0.18 0.59 765.8 562.6 1018.7Mauritius F 75 0.037 0.019 0.064 1.01 0.54 1.77 0.31 0.17 0.53 787.1 582.8 1040.5Mauritius F 90 0.035 0.018 0.063 1.10 0.58 1.93 0.28 0.15 0.48 813.7 601.6 1062.7Mauritius M 25 0.044 0.023 0.081 0.75 0.39 1.33 1.07 0.58 1.78 649.9 484.4 871.0Mauritius M 35 0.038 0.019 0.068 0.71 0.37 1.24 0.81 0.45 1.31 655.4 490.5 862.0Mauritius M 45 0.032 0.016 0.056 0.67 0.35 1.18 0.56 0.31 0.93 661.9 496.5 872.3Mauritius M 55 0.031 0.016 0.057 0.75 0.40 1.30 0.45 0.25 0.73 677.5 509.3 882.3Mauritius M 65 0.032 0.016 0.059 0.84 0.44 1.49 0.37 0.20 0.62 695.0 525.3 907.4Mauritius M 75 0.031 0.015 0.056 0.92 0.49 1.60 0.34 0.19 0.55 713.3 541.9 930.5Mauritius M 90 0.029 0.014 0.053 1.00 0.53 1.77 0.31 0.18 0.51 735.2 553.3 968.8Malawi F 25 0.081 0.039 0.147 0.07 0.04 0.12 0.68 0.37 1.17 315.9 237.7 408.6Malawi F 35 0.067 0.033 0.124 0.07 0.04 0.11 0.51 0.28 0.87 317.7 238.8 411.5Malawi F 45 0.055 0.027 0.101 0.06 0.03 0.11 0.35 0.19 0.60 320.3 240.2 415.0Malawi F 55 0.053 0.026 0.096 0.07 0.04 0.12 0.28 0.15 0.47 328.5 247.2 426.7Malawi F 65 0.053 0.026 0.096 0.08 0.04 0.13 0.23 0.12 0.38 337.9 254.5 440.3Malawi F 75 0.051 0.026 0.093 0.09 0.05 0.14 0.21 0.11 0.34 346.6 261.5 451.6Malawi F 90 0.050 0.025 0.090 0.09 0.05 0.15 0.19 0.11 0.32 356.4 270.1 464.2Malawi M 25 0.067 0.033 0.124 0.07 0.03 0.11 0.75 0.40 1.33 288.4 210.6 380.8Malawi M 35 0.055 0.028 0.100 0.06 0.03 0.10 0.56 0.31 0.97 290.3 213.0 381.3Malawi M 45 0.045 0.021 0.083 0.06 0.03 0.10 0.38 0.20 0.67 292.8 213.9 386.9Malawi M 55 0.043 0.021 0.078 0.06 0.03 0.11 0.30 0.16 0.53 300.1 220.5 396.5Malawi M 65 0.043 0.020 0.079 0.07 0.04 0.12 0.25 0.13 0.43 308.3 226.4 409.1Malawi M 75 0.042 0.020 0.077 0.08 0.04 0.13 0.23 0.12 0.39 316.2 233.7 416.7Malawi M 90 0.041 0.020 0.075 0.08 0.04 0.14 0.21 0.11 0.36 325.0 241.0 426.2Malaysia F 25 0.308 0.232 0.402 0.16 0.12 0.21 1.08 0.58 1.91 509.1 445.5 578.8Malaysia F 35 0.259 0.201 0.330 0.15 0.12 0.19 0.82 0.44 1.43 513.5 454.7 579.8Malaysia F 45 0.215 0.164 0.281 0.15 0.11 0.19 0.58 0.31 1.02 518.7 455.8 590.3Malaysia F 55 0.208 0.163 0.266 0.17 0.13 0.21 0.47 0.25 0.81 530.5 468.0 600.4Malaysia F 65 0.208 0.161 0.271 0.19 0.14 0.24 0.38 0.20 0.67 543.9 477.1 620.6Malaysia F 75 0.203 0.160 0.261 0.20 0.16 0.26 0.35 0.19 0.59 559.0 492.2 634.0Malaysia F 90 0.195 0.154 0.249 0.22 0.17 0.28 0.32 0.17 0.53 576.6 509.7 653.4Malaysia M 25 0.239 0.180 0.319 0.15 0.12 0.19 1.23 0.63 2.15 466.8 409.0 529.5Malaysia M 35 0.204 0.158 0.265 0.14 0.11 0.18 0.92 0.48 1.58 470.9 415.2 533.0Malaysia M 45 0.173 0.130 0.224 0.14 0.10 0.17 0.64 0.33 1.11 475.8 415.7 545.2Malaysia M 55 0.171 0.131 0.219 0.15 0.12 0.19 0.52 0.27 0.86 486.9 427.6 552.2Malaysia M 65 0.173 0.133 0.230 0.17 0.13 0.22 0.43 0.22 0.72 499.4 435.6 569.2Malaysia M 75 0.167 0.129 0.219 0.18 0.14 0.23 0.39 0.20 0.65 512.5 449.7 580.3Malaysia M 90 0.157 0.122 0.202 0.20 0.16 0.25 0.36 0.19 0.60 527.5 461.3 594.9Namibia F 25 0.026 0.013 0.047 0.94 0.50 1.69 1.15 0.65 1.99 498.4 386.9 632.7Namibia F 35 0.021 0.011 0.038 0.88 0.47 1.57 0.86 0.50 1.46 502.0 393.9 631.9Namibia F 45 0.017 0.008 0.031 0.84 0.45 1.49 0.59 0.33 1.00 506.5 397.1 644.5Namibia F 55 0.017 0.008 0.030 0.92 0.50 1.62 0.47 0.27 0.79 518.1 408.6 660.3Namibia F 65 0.017 0.008 0.031 1.02 0.56 1.81 0.38 0.22 0.65 531.4 416.7 678.0Namibia F 75 0.016 0.008 0.030 1.10 0.60 1.97 0.35 0.20 0.59 545.3 428.5 695.3Namibia F 90 0.016 0.008 0.029 1.20 0.64 2.12 0.32 0.18 0.55 561.8 442.1 714.6Namibia M 25 0.021 0.010 0.036 0.84 0.46 1.41 1.29 0.69 2.16 457.2 347.2 589.5Namibia M 35 0.017 0.009 0.030 0.79 0.43 1.30 0.96 0.53 1.60 460.0 351.4 590.4Namibia M 45 0.014 0.007 0.024 0.75 0.41 1.27 0.65 0.36 1.11 463.7 356.7 598.8Namibia M 55 0.013 0.007 0.023 0.82 0.45 1.36 0.52 0.29 0.86 474.7 365.4 608.3Namibia M 65 0.013 0.007 0.023 0.92 0.50 1.49 0.43 0.23 0.71 487.3 374.2 628.6Namibia M 75 0.013 0.007 0.023 0.99 0.55 1.64 0.39 0.21 0.63 500.3 385.1 644.0Namibia M 90 0.013 0.006 0.022 1.08 0.59 1.78 0.36 0.20 0.58 515.3 397.5 660.4Niger F 25 0.002 0.001 0.005 0.46 0.28 0.73 0.45 0.24 0.77 505.7 432.9 589.0Niger F 35 0.002 0.001 0.004 0.43 0.27 0.67 0.33 0.18 0.56 508.6 439.0 588.8Niger F 45 0.002 0.001 0.003 0.41 0.25 0.64 0.23 0.12 0.39 512.7 439.2 598.8Niger F 55 0.002 0.001 0.003 0.46 0.28 0.71 0.18 0.10 0.31 525.7 452.6 610.4Niger F 65 0.002 0.001 0.003 0.51 0.31 0.79 0.15 0.08 0.25 540.6 460.9 631.6Niger F 75 0.002 0.001 0.003 0.55 0.35 0.86 0.14 0.07 0.23 554.4 478.3 643.9Niger F 90 0.001 0.001 0.003 0.60 0.37 0.93 0.13 0.07 0.21 569.3 490.9 660.5Niger M 25 0.002 0.001 0.004 0.43 0.27 0.64 0.51 0.28 0.86 462.5 390.3 543.1Niger M 35 0.002 0.001 0.003 0.40 0.25 0.60 0.38 0.21 0.64 465.4 397.9 544.5Niger M 45 0.001 0.001 0.003 0.38 0.23 0.57 0.26 0.14 0.45 469.4 399.0 549.8Niger M 55 0.001 0.001 0.002 0.42 0.26 0.62 0.20 0.11 0.35 480.7 411.4 564.6Niger M 65 0.001 0.001 0.002 0.47 0.29 0.70 0.17 0.09 0.30 493.8 422.6 580.9Niger M 75 0.001 0.001 0.002 0.51 0.32 0.75 0.15 0.08 0.27 506.6 434.1 591.9Niger M 90 0.001 0.001 0.002 0.55 0.34 0.80 0.14 0.08 0.24 520.6 449.6 608.6Nigeria F 25 0.016 0.008 0.028 0.14 0.08 0.25 0.49 0.26 0.80 396.2 307.7 508.6

Country SexMidpoint of age range
Mean juice intake
(servings/day)
Juice, lower uncertainty interval
Juice, upper uncertainty interval
Mean milk intake
(servings/day)
Milk, lower uncertainty interval
Milk, upper uncertainty interval
Mean SSB intake (servings/day)
SSB, lower uncertainty interval
SSB, upper uncertainty interval
Mean calcium intake
(servings/day)
Calcium, lower
uncertainty interval
Calcium, upper
uncertainty interval
Nigeria F 35 0.013 0.007 0.023 0.13 0.07 0.23 0.37 0.20 0.61 398.5 309.8 508.9Nigeria F 45 0.011 0.006 0.020 0.13 0.07 0.22 0.25 0.14 0.43 401.6 311.8 508.6Nigeria F 55 0.011 0.006 0.018 0.14 0.08 0.24 0.20 0.11 0.33 411.8 323.3 524.9Nigeria F 65 0.010 0.005 0.019 0.16 0.09 0.27 0.16 0.09 0.27 423.4 330.8 540.2Nigeria F 75 0.010 0.005 0.018 0.17 0.09 0.29 0.15 0.08 0.24 434.3 343.2 554.5Nigeria F 90 0.010 0.005 0.017 0.18 0.10 0.31 0.14 0.08 0.23 446.5 351.7 570.7Nigeria M 25 0.013 0.007 0.024 0.13 0.07 0.22 0.55 0.30 0.90 363.9 281.9 469.7Nigeria M 35 0.011 0.005 0.019 0.12 0.07 0.21 0.41 0.23 0.66 366.2 283.3 469.0Nigeria M 45 0.009 0.004 0.016 0.12 0.07 0.20 0.28 0.15 0.46 369.2 283.6 474.8Nigeria M 55 0.008 0.004 0.015 0.13 0.07 0.22 0.22 0.12 0.36 378.2 292.6 482.8Nigeria M 65 0.008 0.004 0.015 0.15 0.08 0.24 0.18 0.10 0.30 388.5 301.2 498.6Nigeria M 75 0.008 0.004 0.015 0.16 0.09 0.26 0.16 0.09 0.26 398.6 309.2 509.9Nigeria M 90 0.008 0.004 0.015 0.17 0.10 0.28 0.15 0.08 0.24 410.0 316.7 523.4Nicaragua F 25 0.128 0.062 0.245 0.95 0.52 1.57 2.91 1.56 4.95 706.8 536.8 909.8Nicaragua F 35 0.106 0.052 0.197 0.89 0.50 1.47 2.27 1.22 3.85 712.1 542.3 911.4Nicaragua F 45 0.086 0.042 0.158 0.86 0.48 1.41 1.66 0.89 2.88 718.8 546.7 922.4Nicaragua F 55 0.083 0.041 0.149 0.93 0.53 1.50 1.33 0.72 2.26 736.5 562.1 948.1Nicaragua F 65 0.083 0.040 0.154 1.04 0.58 1.70 1.07 0.58 1.86 756.6 577.7 969.8Nicaragua F 75 0.081 0.039 0.150 1.12 0.63 1.82 0.96 0.52 1.65 775.6 593.4 992.9Nicaragua F 90 0.078 0.038 0.145 1.22 0.67 2.01 0.86 0.48 1.48 798.4 612.7 1020.6Nicaragua M 25 0.108 0.054 0.196 0.86 0.46 1.43 3.19 1.66 5.49 646.0 499.4 825.7Nicaragua M 35 0.089 0.045 0.161 0.81 0.42 1.35 2.49 1.32 4.28 649.6 511.3 830.6Nicaragua M 45 0.072 0.036 0.133 0.78 0.40 1.31 1.81 0.96 3.16 654.7 515.1 840.3Nicaragua M 55 0.070 0.035 0.126 0.85 0.44 1.42 1.46 0.77 2.52 671.7 525.3 867.3Nicaragua M 65 0.070 0.035 0.126 0.95 0.50 1.59 1.18 0.61 2.07 691.2 536.0 897.5Nicaragua M 75 0.068 0.034 0.124 1.03 0.55 1.73 1.06 0.55 1.83 709.3 551.4 916.3Nicaragua M 90 0.067 0.033 0.121 1.12 0.59 1.89 0.96 0.50 1.62 730.5 566.3 932.8Netherlands F 25 0.386 0.318 0.466 0.73 0.62 0.85 0.68 0.56 0.81 941.1 881.5 1008.0Netherlands F 35 0.310 0.260 0.367 0.69 0.60 0.78 0.48 0.41 0.57 948.0 896.4 1005.9Netherlands F 45 0.242 0.198 0.291 0.66 0.57 0.76 0.31 0.25 0.37 956.5 892.0 1026.1Netherlands F 55 0.235 0.196 0.277 0.70 0.61 0.80 0.24 0.20 0.29 977.6 924.9 1035.5Netherlands F 65 0.239 0.196 0.287 0.76 0.65 0.87 0.21 0.17 0.25 1001.5 940.3 1067.4Netherlands F 75 0.239 0.199 0.285 0.83 0.73 0.95 0.19 0.16 0.23 1026.9 970.3 1088.3Netherlands F 90 0.237 0.196 0.286 0.93 0.80 1.06 0.18 0.15 0.21 1059.1 998.5 1120.0Netherlands M 25 0.308 0.250 0.371 0.70 0.60 0.81 0.79 0.66 0.95 867.0 808.3 929.0Netherlands M 35 0.249 0.206 0.296 0.64 0.55 0.72 0.56 0.47 0.66 870.6 820.8 921.0Netherlands M 45 0.197 0.162 0.240 0.58 0.50 0.67 0.34 0.28 0.41 875.9 817.0 935.6Netherlands M 55 0.187 0.156 0.224 0.62 0.54 0.71 0.27 0.22 0.32 894.7 843.7 945.3Netherlands M 65 0.186 0.152 0.224 0.68 0.59 0.79 0.22 0.18 0.27 916.5 859.5 978.5Netherlands M 75 0.188 0.156 0.223 0.75 0.66 0.86 0.20 0.17 0.24 939.6 886.2 994.9Netherlands M 90 0.191 0.157 0.230 0.85 0.73 0.97 0.19 0.16 0.23 967.4 910.1 1026.4Norway F 25 0.461 0.370 0.566 1.01 0.84 1.21 0.98 0.78 1.21 847.2 786.5 912.8Norway F 35 0.370 0.300 0.451 0.95 0.80 1.12 0.70 0.57 0.85 853.5 803.9 907.3Norway F 45 0.288 0.228 0.357 0.91 0.75 1.09 0.44 0.35 0.54 861.1 803.1 925.9Norway F 55 0.280 0.225 0.342 0.97 0.81 1.14 0.35 0.29 0.43 880.1 828.7 937.3Norway F 65 0.285 0.227 0.351 1.05 0.88 1.23 0.30 0.24 0.38 901.6 838.1 963.4Norway F 75 0.285 0.231 0.349 1.15 0.97 1.34 0.28 0.22 0.34 924.5 865.0 983.4Norway F 90 0.283 0.228 0.347 1.29 1.08 1.53 0.26 0.20 0.31 954.3 894.7 1018.0Norway M 25 0.369 0.299 0.460 0.96 0.79 1.14 1.14 0.91 1.40 780.2 729.2 834.7Norway M 35 0.299 0.244 0.365 0.87 0.74 1.02 0.80 0.65 0.98 783.5 740.0 832.8Norway M 45 0.236 0.187 0.297 0.80 0.67 0.96 0.49 0.40 0.61 788.2 736.1 843.3Norway M 55 0.224 0.181 0.273 0.86 0.72 1.01 0.38 0.31 0.47 805.2 759.5 854.5Norway M 65 0.223 0.178 0.275 0.94 0.77 1.11 0.32 0.25 0.40 824.8 769.8 881.3Norway M 75 0.225 0.183 0.277 1.04 0.87 1.22 0.29 0.23 0.36 845.5 795.9 896.9Norway M 90 0.228 0.186 0.284 1.17 0.97 1.37 0.27 0.21 0.34 871.5 821.8 923.5Nepal F 25 0.006 0.003 0.011 0.27 0.20 0.36 0.23 0.12 0.41 412.2 372.3 453.4Nepal F 35 0.005 0.002 0.009 0.26 0.20 0.35 0.17 0.09 0.30 415.1 378.5 452.0Nepal F 45 0.004 0.002 0.007 0.26 0.19 0.35 0.12 0.06 0.21 418.8 379.9 459.4Nepal F 55 0.004 0.002 0.007 0.28 0.21 0.37 0.09 0.05 0.17 428.9 390.6 467.9Nepal F 65 0.004 0.002 0.007 0.31 0.24 0.42 0.08 0.04 0.14 440.4 398.6 485.8Nepal F 75 0.004 0.002 0.007 0.34 0.26 0.45 0.07 0.04 0.13 452.1 411.3 496.6Nepal F 90 0.004 0.002 0.007 0.37 0.27 0.49 0.07 0.03 0.12 465.6 425.7 510.7Nepal M 25 0.005 0.002 0.009 0.25 0.18 0.34 0.25 0.13 0.44 378.0 341.0 418.4Nepal M 35 0.004 0.002 0.007 0.24 0.18 0.31 0.19 0.10 0.33 380.5 348.0 418.3Nepal M 45 0.003 0.002 0.006 0.24 0.17 0.31 0.13 0.07 0.23 383.8 348.8 424.1Nepal M 55 0.003 0.002 0.005 0.26 0.19 0.34 0.10 0.05 0.18 393.4 360.6 431.2Nepal M 65 0.003 0.001 0.006 0.29 0.21 0.39 0.08 0.04 0.15 404.4 368.6 444.0Nepal M 75 0.003 0.001 0.006 0.31 0.23 0.41 0.08 0.04 0.13 415.2 380.6 452.1Nepal M 90 0.003 0.001 0.005 0.34 0.25 0.44 0.07 0.04 0.12 427.3 390.9 465.1New Zealand F 25 1.261 0.608 2.285 0.54 0.46 0.64 0.47 0.38 0.57 651.1 600.1 699.8New Zealand F 35 1.044 0.525 1.885 0.51 0.44 0.58 0.35 0.30 0.41 656.4 613.5 697.8New Zealand F 45 0.849 0.427 1.556 0.49 0.41 0.57 0.24 0.20 0.29 662.9 615.0 714.3New Zealand F 55 0.816 0.414 1.499 0.53 0.46 0.61 0.20 0.16 0.23 679.0 637.3 723.3New Zealand F 65 0.816 0.411 1.489 0.60 0.51 0.70 0.16 0.14 0.19 697.3 649.4 748.1New Zealand F 75 0.800 0.407 1.464 0.65 0.57 0.74 0.15 0.13 0.17 715.2 672.4 762.6New Zealand F 90 0.774 0.385 1.415 0.71 0.61 0.82 0.13 0.12 0.16 737.9 690.6 789.4New Zealand M 25 1.040 0.501 1.894 0.49 0.42 0.58 0.52 0.42 0.63 594.3 547.5 643.0New Zealand M 35 0.862 0.435 1.534 0.46 0.40 0.53 0.39 0.33 0.46 598.5 556.3 641.6New Zealand M 45 0.703 0.352 1.271 0.44 0.37 0.51 0.27 0.22 0.32 604.0 557.1 654.0New Zealand M 55 0.677 0.341 1.203 0.48 0.42 0.55 0.21 0.18 0.25 619.3 574.7 661.6New Zealand M 65 0.677 0.337 1.226 0.54 0.46 0.63 0.18 0.15 0.21 636.8 590.1 685.9New Zealand M 75 0.661 0.329 1.183 0.59 0.52 0.67 0.16 0.13 0.19 653.9 609.7 699.5New Zealand M 90 0.639 0.321 1.110 0.64 0.56 0.74 0.15 0.13 0.17 674.7 628.6 720.1Oman F 25 0.225 0.117 0.393 0.52 0.28 0.88 0.75 0.42 1.19 629.7 488.5 797.7Oman F 35 0.188 0.098 0.328 0.50 0.27 0.83 0.57 0.33 0.93 634.3 495.2 802.3Oman F 45 0.154 0.081 0.280 0.48 0.26 0.80 0.41 0.24 0.69 640.1 500.9 814.7Oman F 55 0.148 0.077 0.261 0.52 0.28 0.89 0.33 0.19 0.55 655.9 511.4 840.0Oman F 65 0.148 0.077 0.253 0.58 0.32 1.00 0.28 0.16 0.45 674.0 519.7 855.9Oman F 75 0.145 0.074 0.248 0.63 0.35 1.07 0.25 0.14 0.41 691.3 537.8 875.6Oman F 90 0.140 0.073 0.244 0.69 0.38 1.15 0.23 0.13 0.37 712.5 556.8 905.1Oman M 25 0.187 0.092 0.331 0.47 0.25 0.79 0.82 0.45 1.40 572.2 440.4 726.0Oman M 35 0.156 0.077 0.271 0.44 0.24 0.73 0.62 0.34 1.05 575.7 443.6 728.6Oman M 45 0.128 0.063 0.227 0.42 0.22 0.70 0.43 0.23 0.74 580.3 447.1 736.3Oman M 55 0.123 0.061 0.218 0.46 0.24 0.76 0.34 0.19 0.59 594.7 460.9 749.6Oman M 65 0.123 0.062 0.225 0.52 0.27 0.85 0.29 0.16 0.50 611.1 469.0 768.5Oman M 75 0.120 0.059 0.218 0.57 0.30 0.94 0.26 0.15 0.45 626.7 483.4 787.0Oman M 90 0.115 0.057 0.203 0.62 0.33 1.05 0.24 0.14 0.42 644.9 496.6 817.1Pakistan F 25 0.067 0.031 0.119 0.49 0.39 0.61 0.89 0.45 1.58 517.5 398.9 663.7Pakistan F 35 0.056 0.026 0.096 0.47 0.38 0.58 0.66 0.35 1.14 521.1 404.3 661.3
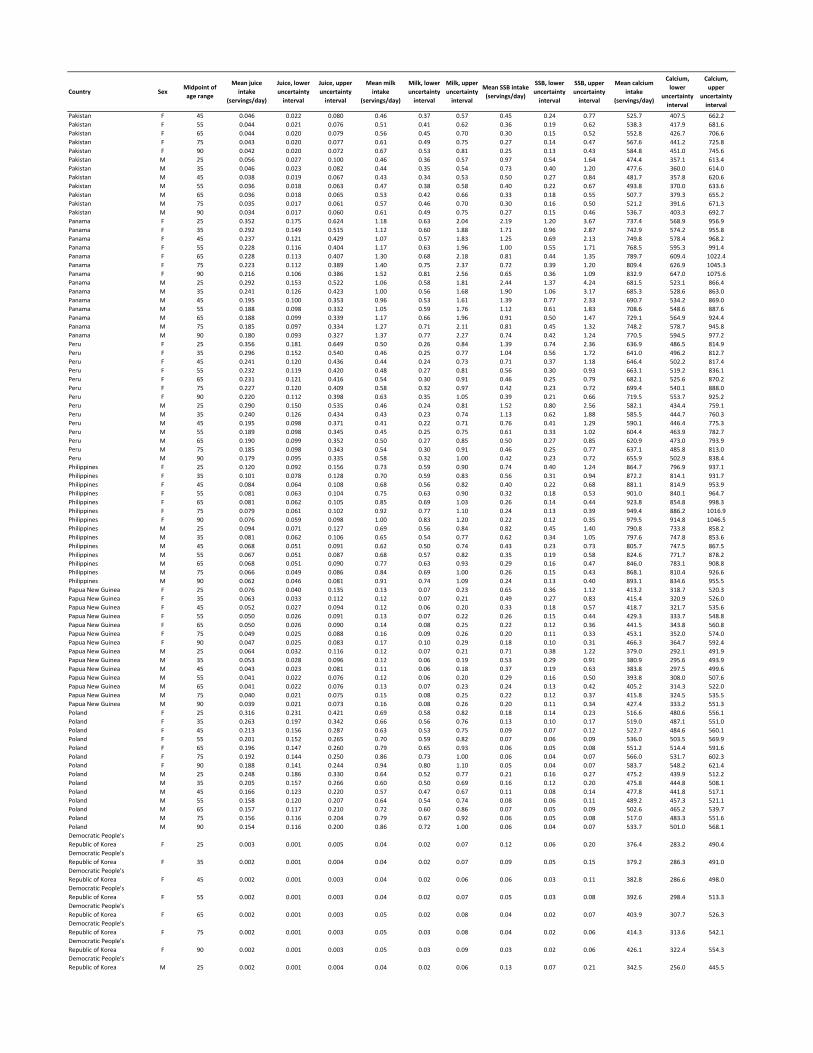
Country SexMidpoint of age range
Mean juice intake
(servings/day)
Juice, lower uncertainty interval
Juice, upper uncertainty interval
Mean milk intake
(servings/day)
Milk, lower uncertainty interval
Milk, upper uncertainty interval
Mean SSB intake (servings/day)
SSB, lower uncertainty interval
SSB, upper uncertainty interval
Mean calcium intake
(servings/day)
Calcium, lower
uncertainty interval
Calcium, upper
uncertainty interval
Pakistan F 45 0.046 0.022 0.080 0.46 0.37 0.57 0.45 0.24 0.77 525.7 407.5 662.2Pakistan F 55 0.044 0.021 0.076 0.51 0.41 0.62 0.36 0.19 0.62 538.3 417.9 681.6Pakistan F 65 0.044 0.020 0.079 0.56 0.45 0.70 0.30 0.15 0.52 552.8 426.7 706.6Pakistan F 75 0.043 0.020 0.077 0.61 0.49 0.75 0.27 0.14 0.47 567.6 441.2 725.8Pakistan F 90 0.042 0.020 0.072 0.67 0.53 0.81 0.25 0.13 0.43 584.8 451.0 745.6Pakistan M 25 0.056 0.027 0.100 0.46 0.36 0.57 0.97 0.54 1.64 474.4 357.1 613.4Pakistan M 35 0.046 0.023 0.082 0.44 0.35 0.54 0.73 0.40 1.20 477.6 360.0 614.0Pakistan M 45 0.038 0.019 0.067 0.43 0.34 0.53 0.50 0.27 0.84 481.7 357.8 620.6Pakistan M 55 0.036 0.018 0.063 0.47 0.38 0.58 0.40 0.22 0.67 493.8 370.0 633.6Pakistan M 65 0.036 0.018 0.065 0.53 0.42 0.66 0.33 0.18 0.55 507.7 379.3 655.2Pakistan M 75 0.035 0.017 0.061 0.57 0.46 0.70 0.30 0.16 0.50 521.2 391.6 671.3Pakistan M 90 0.034 0.017 0.060 0.61 0.49 0.75 0.27 0.15 0.46 536.7 403.3 692.7Panama F 25 0.352 0.175 0.624 1.18 0.63 2.04 2.19 1.20 3.67 737.4 568.9 956.9Panama F 35 0.292 0.149 0.515 1.12 0.60 1.88 1.71 0.96 2.87 742.9 574.2 955.8Panama F 45 0.237 0.121 0.429 1.07 0.57 1.83 1.25 0.69 2.13 749.8 578.4 968.2Panama F 55 0.228 0.116 0.404 1.17 0.63 1.96 1.00 0.55 1.71 768.5 595.3 991.4Panama F 65 0.228 0.113 0.407 1.30 0.68 2.18 0.81 0.44 1.35 789.7 609.4 1022.4Panama F 75 0.223 0.112 0.389 1.40 0.75 2.37 0.72 0.39 1.20 809.4 626.9 1045.3Panama F 90 0.216 0.106 0.386 1.52 0.81 2.56 0.65 0.36 1.09 832.9 647.0 1075.6Panama M 25 0.292 0.153 0.522 1.06 0.58 1.81 2.44 1.37 4.24 681.5 523.1 866.4Panama M 35 0.241 0.126 0.423 1.00 0.56 1.68 1.90 1.06 3.17 685.3 528.6 863.0Panama M 45 0.195 0.100 0.353 0.96 0.53 1.61 1.39 0.77 2.33 690.7 534.2 869.0Panama M 55 0.188 0.098 0.332 1.05 0.59 1.76 1.12 0.61 1.83 708.6 548.6 887.6Panama M 65 0.188 0.099 0.339 1.17 0.66 1.96 0.91 0.50 1.47 729.1 564.9 924.4Panama M 75 0.185 0.097 0.334 1.27 0.71 2.11 0.81 0.45 1.32 748.2 578.7 945.8Panama M 90 0.180 0.093 0.327 1.37 0.77 2.27 0.74 0.42 1.24 770.5 594.5 977.2Peru F 25 0.356 0.181 0.649 0.50 0.26 0.84 1.39 0.74 2.36 636.9 486.5 814.9Peru F 35 0.296 0.152 0.540 0.46 0.25 0.77 1.04 0.56 1.72 641.0 496.2 812.7Peru F 45 0.241 0.120 0.436 0.44 0.24 0.73 0.71 0.37 1.18 646.4 502.2 817.4Peru F 55 0.232 0.119 0.420 0.48 0.27 0.81 0.56 0.30 0.93 663.1 519.2 836.1Peru F 65 0.231 0.121 0.416 0.54 0.30 0.91 0.46 0.25 0.79 682.1 525.6 870.2Peru F 75 0.227 0.120 0.409 0.58 0.32 0.97 0.42 0.23 0.72 699.4 540.1 888.0Peru F 90 0.220 0.112 0.398 0.63 0.35 1.05 0.39 0.21 0.66 719.5 553.7 925.2Peru M 25 0.290 0.150 0.535 0.46 0.24 0.81 1.52 0.80 2.56 582.1 434.4 759.1Peru M 35 0.240 0.126 0.434 0.43 0.23 0.74 1.13 0.62 1.88 585.5 444.7 760.3Peru M 45 0.195 0.098 0.371 0.41 0.22 0.71 0.76 0.41 1.29 590.1 446.4 775.3Peru M 55 0.189 0.098 0.345 0.45 0.25 0.75 0.61 0.33 1.02 604.4 463.9 782.7Peru M 65 0.190 0.099 0.352 0.50 0.27 0.85 0.50 0.27 0.85 620.9 473.0 793.9Peru M 75 0.185 0.098 0.343 0.54 0.30 0.91 0.46 0.25 0.77 637.1 485.8 813.0Peru M 90 0.179 0.095 0.335 0.58 0.32 1.00 0.42 0.23 0.72 655.9 502.9 838.4Philippines F 25 0.120 0.092 0.156 0.73 0.59 0.90 0.74 0.40 1.24 864.7 796.9 937.1Philippines F 35 0.101 0.078 0.128 0.70 0.59 0.83 0.56 0.31 0.94 872.2 814.1 931.7Philippines F 45 0.084 0.064 0.108 0.68 0.56 0.82 0.40 0.22 0.68 881.1 814.9 953.9Philippines F 55 0.081 0.063 0.104 0.75 0.63 0.90 0.32 0.18 0.53 901.0 840.1 964.7Philippines F 65 0.081 0.062 0.105 0.85 0.69 1.03 0.26 0.14 0.44 923.8 854.8 998.3Philippines F 75 0.079 0.061 0.102 0.92 0.77 1.10 0.24 0.13 0.39 949.4 886.2 1016.9Philippines F 90 0.076 0.059 0.098 1.00 0.83 1.20 0.22 0.12 0.35 979.5 914.8 1046.5Philippines M 25 0.094 0.071 0.127 0.69 0.56 0.84 0.82 0.45 1.40 790.8 733.8 858.2Philippines M 35 0.081 0.062 0.106 0.65 0.54 0.77 0.62 0.34 1.05 797.6 747.8 853.6Philippines M 45 0.068 0.051 0.091 0.62 0.50 0.74 0.43 0.23 0.73 805.7 747.5 867.5Philippines M 55 0.067 0.051 0.087 0.68 0.57 0.82 0.35 0.19 0.58 824.6 771.7 878.2Philippines M 65 0.068 0.051 0.090 0.77 0.63 0.93 0.29 0.16 0.47 846.0 783.1 908.8Philippines M 75 0.066 0.049 0.086 0.84 0.69 1.00 0.26 0.15 0.43 868.1 810.4 926.6Philippines M 90 0.062 0.046 0.081 0.91 0.74 1.09 0.24 0.13 0.40 893.1 834.6 955.5Papua New Guinea F 25 0.076 0.040 0.135 0.13 0.07 0.23 0.65 0.36 1.12 413.2 318.7 520.3Papua New Guinea F 35 0.063 0.033 0.112 0.12 0.07 0.21 0.49 0.27 0.83 415.4 320.9 526.0Papua New Guinea F 45 0.052 0.027 0.094 0.12 0.06 0.20 0.33 0.18 0.57 418.7 321.7 535.6Papua New Guinea F 55 0.050 0.026 0.091 0.13 0.07 0.22 0.26 0.15 0.44 429.3 333.7 548.8Papua New Guinea F 65 0.050 0.026 0.090 0.14 0.08 0.25 0.22 0.12 0.36 441.5 343.8 560.8Papua New Guinea F 75 0.049 0.025 0.088 0.16 0.09 0.26 0.20 0.11 0.33 453.1 352.0 574.0Papua New Guinea F 90 0.047 0.025 0.083 0.17 0.10 0.29 0.18 0.10 0.31 466.3 364.7 592.4Papua New Guinea M 25 0.064 0.032 0.116 0.12 0.07 0.21 0.71 0.38 1.22 379.0 292.1 491.9Papua New Guinea M 35 0.053 0.028 0.096 0.12 0.06 0.19 0.53 0.29 0.91 380.9 295.6 493.9Papua New Guinea M 45 0.043 0.023 0.081 0.11 0.06 0.18 0.37 0.19 0.63 383.8 297.5 499.6Papua New Guinea M 55 0.041 0.022 0.076 0.12 0.06 0.20 0.29 0.16 0.50 393.8 308.0 507.6Papua New Guinea M 65 0.041 0.022 0.076 0.13 0.07 0.23 0.24 0.13 0.42 405.2 314.3 522.0Papua New Guinea M 75 0.040 0.021 0.075 0.15 0.08 0.25 0.22 0.12 0.37 415.8 324.5 535.5Papua New Guinea M 90 0.039 0.021 0.073 0.16 0.08 0.26 0.20 0.11 0.34 427.4 333.2 551.3Poland F 25 0.316 0.231 0.421 0.69 0.58 0.82 0.18 0.14 0.23 516.6 480.6 556.1Poland F 35 0.263 0.197 0.342 0.66 0.56 0.76 0.13 0.10 0.17 519.0 487.1 551.0Poland F 45 0.213 0.156 0.287 0.63 0.53 0.75 0.09 0.07 0.12 522.7 484.6 560.1Poland F 55 0.201 0.152 0.265 0.70 0.59 0.82 0.07 0.06 0.09 536.0 503.5 569.9Poland F 65 0.196 0.147 0.260 0.79 0.65 0.93 0.06 0.05 0.08 551.2 514.4 591.6Poland F 75 0.192 0.144 0.250 0.86 0.73 1.00 0.06 0.04 0.07 566.0 531.7 602.3Poland F 90 0.188 0.141 0.244 0.94 0.80 1.10 0.05 0.04 0.07 583.7 548.2 621.4Poland M 25 0.248 0.186 0.330 0.64 0.52 0.77 0.21 0.16 0.27 475.2 439.9 512.2Poland M 35 0.205 0.157 0.266 0.60 0.50 0.69 0.16 0.12 0.20 475.8 444.8 508.1Poland M 45 0.166 0.123 0.220 0.57 0.47 0.67 0.11 0.08 0.14 477.8 441.8 517.1Poland M 55 0.158 0.120 0.207 0.64 0.54 0.74 0.08 0.06 0.11 489.2 457.3 521.1Poland M 65 0.157 0.117 0.210 0.72 0.60 0.86 0.07 0.05 0.09 502.6 465.2 539.7Poland M 75 0.156 0.116 0.204 0.79 0.67 0.92 0.06 0.05 0.08 517.0 483.3 551.6Poland M 90 0.154 0.116 0.200 0.86 0.72 1.00 0.06 0.04 0.07 533.7 501.0 568.1Democratic People's Republic of Korea F 25 0.003 0.001 0.005 0.04 0.02 0.07 0.12 0.06 0.20 376.4 283.2 490.4Democratic People's Republic of Korea F 35 0.002 0.001 0.004 0.04 0.02 0.07 0.09 0.05 0.15 379.2 286.3 491.0Democratic People's Republic of Korea F 45 0.002 0.001 0.003 0.04 0.02 0.06 0.06 0.03 0.11 382.8 286.6 498.0Democratic People's Republic of Korea F 55 0.002 0.001 0.003 0.04 0.02 0.07 0.05 0.03 0.08 392.6 298.4 513.3Democratic People's Republic of Korea F 65 0.002 0.001 0.003 0.05 0.02 0.08 0.04 0.02 0.07 403.9 307.7 526.3Democratic People's Republic of Korea F 75 0.002 0.001 0.003 0.05 0.03 0.08 0.04 0.02 0.06 414.3 313.6 542.1Democratic People's Republic of Korea F 90 0.002 0.001 0.003 0.05 0.03 0.09 0.03 0.02 0.06 426.1 322.4 554.3Democratic People's Republic of Korea M 25 0.002 0.001 0.004 0.04 0.02 0.06 0.13 0.07 0.21 342.5 256.0 445.5

Country SexMidpoint of age range
Mean juice intake
(servings/day)
Juice, lower uncertainty interval
Juice, upper uncertainty interval
Mean milk intake
(servings/day)
Milk, lower uncertainty interval
Milk, upper uncertainty interval
Mean SSB intake (servings/day)
SSB, lower uncertainty interval
SSB, upper uncertainty interval
Mean calcium intake
(servings/day)
Calcium, lower
uncertainty interval
Calcium, upper
uncertainty interval
Democratic People's Republic of Korea M 35 0.002 0.001 0.003 0.03 0.02 0.06 0.09 0.05 0.16 345.0 258.8 446.5Democratic People's Republic of Korea M 45 0.001 0.001 0.003 0.03 0.02 0.05 0.06 0.03 0.11 348.2 262.0 449.2Democratic People's Republic of Korea M 55 0.001 0.001 0.002 0.04 0.02 0.06 0.05 0.03 0.09 357.2 268.9 459.1Democratic People's Republic of Korea M 65 0.001 0.001 0.002 0.04 0.02 0.07 0.04 0.02 0.07 367.6 273.0 469.0Democratic People's Republic of Korea M 75 0.001 0.001 0.002 0.04 0.02 0.07 0.04 0.02 0.06 377.3 282.6 480.9Democratic People's Republic of Korea M 90 0.001 0.001 0.002 0.05 0.03 0.08 0.04 0.02 0.06 388.0 289.4 496.2Portugal F 25 0.262 0.140 0.457 0.79 0.57 1.08 0.49 0.30 0.75 877.9 800.9 962.4Portugal F 35 0.211 0.113 0.368 0.75 0.53 1.02 0.35 0.22 0.53 884.3 812.6 961.1Portugal F 45 0.164 0.088 0.286 0.71 0.51 0.98 0.22 0.13 0.34 892.3 808.8 976.2Portugal F 55 0.159 0.086 0.281 0.76 0.54 1.05 0.18 0.11 0.27 911.9 836.8 992.0Portugal F 65 0.163 0.086 0.287 0.82 0.60 1.15 0.15 0.09 0.23 934.3 851.8 1023.2Portugal F 75 0.163 0.087 0.285 0.91 0.66 1.27 0.14 0.09 0.22 958.0 879.5 1043.4Portugal F 90 0.161 0.087 0.289 1.01 0.73 1.41 0.13 0.08 0.20 987.2 908.3 1073.3Portugal M 25 0.208 0.113 0.356 0.76 0.55 1.02 0.58 0.36 0.88 808.4 739.9 884.9Portugal M 35 0.169 0.093 0.282 0.69 0.51 0.93 0.41 0.26 0.62 811.7 745.9 878.8Portugal M 45 0.133 0.073 0.227 0.63 0.46 0.87 0.25 0.16 0.38 816.7 746.0 883.5Portugal M 55 0.126 0.070 0.214 0.67 0.49 0.92 0.19 0.12 0.29 834.2 767.4 904.5Portugal M 65 0.126 0.068 0.212 0.74 0.54 1.00 0.16 0.10 0.25 854.6 782.0 936.9Portugal M 75 0.127 0.069 0.216 0.82 0.60 1.09 0.15 0.09 0.23 876.1 806.4 955.2Portugal M 90 0.129 0.070 0.221 0.92 0.67 1.23 0.14 0.09 0.21 901.9 829.5 980.5Paraguay F 25 0.135 0.069 0.247 0.35 0.19 0.57 0.54 0.29 0.95 518.3 398.0 668.7Paraguay F 35 0.112 0.059 0.201 0.32 0.18 0.52 0.41 0.22 0.71 521.2 399.9 673.7Paraguay F 45 0.092 0.048 0.165 0.31 0.17 0.51 0.29 0.15 0.50 525.4 401.6 679.7Paraguay F 55 0.088 0.046 0.157 0.34 0.19 0.55 0.23 0.12 0.40 539.0 411.9 698.2Paraguay F 65 0.088 0.046 0.156 0.38 0.21 0.61 0.19 0.10 0.34 554.6 420.7 724.3Paraguay F 75 0.086 0.045 0.153 0.41 0.22 0.66 0.17 0.09 0.30 569.2 432.9 737.4Paraguay F 90 0.083 0.043 0.149 0.44 0.25 0.72 0.16 0.09 0.27 586.7 445.0 761.7Paraguay M 25 0.112 0.055 0.203 0.31 0.17 0.53 0.61 0.34 1.04 475.1 365.9 604.0Paraguay M 35 0.093 0.047 0.167 0.29 0.16 0.50 0.46 0.26 0.78 478.0 368.0 605.9Paraguay M 45 0.076 0.038 0.134 0.27 0.15 0.48 0.32 0.17 0.55 481.9 368.5 615.1Paraguay M 55 0.073 0.037 0.127 0.30 0.17 0.52 0.26 0.14 0.43 493.9 381.2 624.1Paraguay M 65 0.073 0.036 0.127 0.34 0.18 0.58 0.21 0.11 0.36 507.5 393.4 638.6Paraguay M 75 0.071 0.035 0.124 0.37 0.20 0.62 0.19 0.10 0.32 520.9 403.9 659.8Paraguay M 90 0.069 0.034 0.117 0.40 0.22 0.68 0.17 0.09 0.30 536.8 413.7 683.8Occupied Palestinian Territory F 25 0.223 0.112 0.390 0.58 0.32 0.97 0.79 0.42 1.36 647.1 497.7 831.7Occupied Palestinian Territory F 35 0.186 0.095 0.320 0.55 0.31 0.93 0.61 0.33 1.03 651.7 500.9 832.5Occupied Palestinian Territory F 45 0.152 0.077 0.261 0.53 0.29 0.93 0.43 0.23 0.73 657.5 504.3 832.5Occupied Palestinian Territory F 55 0.147 0.076 0.254 0.58 0.32 0.99 0.35 0.19 0.60 673.9 519.3 852.8Occupied Palestinian Territory F 65 0.146 0.077 0.259 0.65 0.35 1.07 0.29 0.16 0.51 692.6 534.0 880.0Occupied Palestinian Territory F 75 0.143 0.075 0.252 0.70 0.38 1.17 0.27 0.15 0.46 710.4 548.7 908.5Occupied Palestinian Territory F 90 0.139 0.073 0.243 0.76 0.42 1.26 0.24 0.13 0.42 730.5 563.1 936.8Occupied Palestinian Territory M 25 0.191 0.099 0.341 0.53 0.28 0.90 0.88 0.49 1.46 590.0 457.8 756.6Occupied Palestinian Territory M 35 0.159 0.082 0.288 0.50 0.27 0.84 0.66 0.37 1.07 593.5 459.8 758.1Occupied Palestinian Territory M 45 0.130 0.067 0.237 0.48 0.26 0.80 0.46 0.25 0.75 598.3 461.8 761.8Occupied Palestinian Territory M 55 0.126 0.064 0.223 0.52 0.28 0.87 0.37 0.21 0.60 613.3 474.7 778.3Occupied Palestinian Territory M 65 0.126 0.063 0.222 0.58 0.31 0.96 0.31 0.17 0.50 630.4 483.1 806.2Occupied Palestinian Territory M 75 0.122 0.063 0.214 0.64 0.34 1.04 0.28 0.16 0.46 646.2 499.0 829.3Occupied Palestinian Territory M 90 0.117 0.061 0.207 0.70 0.37 1.14 0.26 0.15 0.42 663.7 511.3 857.0Qatar F 25 0.321 0.152 0.586 0.68 0.37 1.14 0.89 0.46 1.57 668.6 516.9 846.9Qatar F 35 0.269 0.128 0.478 0.65 0.35 1.08 0.68 0.36 1.18 673.2 519.1 851.8Qatar F 45 0.220 0.107 0.403 0.62 0.33 1.04 0.49 0.26 0.85 679.1 520.4 864.2Qatar F 55 0.212 0.104 0.382 0.68 0.36 1.14 0.40 0.22 0.69 695.9 533.4 888.4Qatar F 65 0.212 0.101 0.375 0.76 0.41 1.28 0.33 0.18 0.59 715.1 544.2 908.9Qatar F 75 0.207 0.100 0.371 0.82 0.44 1.37 0.30 0.16 0.53 733.6 561.1 931.6Qatar F 90 0.201 0.097 0.359 0.89 0.49 1.48 0.27 0.15 0.47 755.4 578.7 968.9Qatar M 25 0.263 0.133 0.451 0.62 0.34 1.10 0.98 0.53 1.58 611.4 472.7 785.7Qatar M 35 0.220 0.115 0.376 0.58 0.32 1.03 0.74 0.41 1.20 615.2 471.4 784.9Qatar M 45 0.181 0.094 0.316 0.55 0.31 0.98 0.51 0.28 0.83 620.2 475.7 792.3Qatar M 55 0.174 0.089 0.304 0.60 0.34 1.06 0.41 0.23 0.67 635.4 485.9 809.5Qatar M 65 0.175 0.088 0.311 0.67 0.38 1.19 0.35 0.19 0.57 652.9 499.7 836.8Qatar M 75 0.170 0.086 0.302 0.74 0.41 1.29 0.32 0.17 0.52 669.5 513.5 859.6Qatar M 90 0.162 0.084 0.281 0.81 0.45 1.40 0.29 0.16 0.47 688.9 527.1 881.3Romania F 25 0.114 0.060 0.198 0.88 0.49 1.47 0.39 0.22 0.66 602.2 540.1 666.3Romania F 35 0.094 0.051 0.162 0.83 0.46 1.34 0.29 0.16 0.49 605.0 543.7 668.1Romania F 45 0.077 0.040 0.133 0.79 0.44 1.31 0.20 0.11 0.33 609.3 543.9 679.3Romania F 55 0.072 0.037 0.124 0.88 0.49 1.44 0.16 0.09 0.26 624.9 560.4 691.6Romania F 65 0.071 0.036 0.121 0.99 0.56 1.65 0.13 0.07 0.22 642.7 576.4 712.9Romania F 75 0.069 0.036 0.119 1.08 0.61 1.79 0.12 0.07 0.20 659.8 596.5 729.7Romania F 90 0.068 0.035 0.117 1.18 0.66 1.93 0.11 0.06 0.18 679.9 612.1 755.2Romania M 25 0.092 0.047 0.168 0.79 0.44 1.34 0.45 0.25 0.73 553.7 493.1 619.1Romania M 35 0.076 0.038 0.134 0.74 0.42 1.24 0.33 0.18 0.54 554.5 499.8 614.4Romania M 45 0.062 0.031 0.109 0.70 0.39 1.18 0.23 0.12 0.38 556.7 498.6 619.0Romania M 55 0.059 0.030 0.104 0.78 0.44 1.29 0.18 0.10 0.30 570.1 515.2 632.7Romania M 65 0.059 0.029 0.108 0.89 0.50 1.46 0.14 0.08 0.23 585.8 524.7 654.8Romania M 75 0.058 0.029 0.105 0.97 0.55 1.60 0.13 0.07 0.21 602.4 543.0 668.9Romania M 90 0.057 0.029 0.101 1.05 0.59 1.74 0.12 0.07 0.20 621.7 560.3 689.5Russian Federation F 25 0.259 0.185 0.354 0.78 0.62 0.96 0.75 0.41 1.22 755.3 575.4 970.9Russian Federation F 35 0.214 0.157 0.288 0.74 0.61 0.89 0.56 0.32 0.90 761.6 586.3 973.2Russian Federation F 45 0.172 0.123 0.238 0.72 0.58 0.88 0.38 0.22 0.65 769.3 594.6 981.1

Country SexMidpoint of age range
Mean juice intake
(servings/day)
Juice, lower uncertainty interval
Juice, upper uncertainty interval
Mean milk intake
(servings/day)
Milk, lower uncertainty interval
Milk, upper uncertainty interval
Mean SSB intake (servings/day)
SSB, lower uncertainty interval
SSB, upper uncertainty interval
Mean calcium intake
(servings/day)
Calcium, lower
uncertainty interval
Calcium, upper
uncertainty interval
Russian Federation F 55 0.166 0.121 0.225 0.79 0.65 0.95 0.30 0.17 0.50 786.9 606.9 999.4Russian Federation F 65 0.166 0.119 0.227 0.88 0.71 1.07 0.25 0.14 0.41 806.9 624.6 1019.9Russian Federation F 75 0.162 0.118 0.218 0.95 0.78 1.14 0.23 0.13 0.37 827.4 644.2 1047.2Russian Federation F 90 0.157 0.116 0.209 1.02 0.84 1.23 0.21 0.12 0.34 852.5 666.0 1090.7Russian Federation M 25 0.214 0.153 0.301 0.72 0.57 0.90 0.83 0.44 1.38 698.5 544.9 880.9Russian Federation M 35 0.176 0.130 0.243 0.68 0.56 0.83 0.62 0.34 1.01 701.8 549.4 886.8Russian Federation M 45 0.142 0.104 0.196 0.65 0.53 0.81 0.42 0.23 0.72 707.0 549.6 904.9Russian Federation M 55 0.137 0.101 0.187 0.73 0.61 0.90 0.34 0.19 0.56 725.7 564.6 912.8Russian Federation M 65 0.137 0.096 0.189 0.83 0.68 1.03 0.28 0.15 0.46 747.1 581.9 943.0Russian Federation M 75 0.134 0.097 0.183 0.89 0.73 1.08 0.25 0.14 0.41 767.4 601.0 966.5Russian Federation M 90 0.130 0.093 0.177 0.95 0.78 1.14 0.23 0.13 0.38 790.5 618.1 994.0Rwanda F 25 0.077 0.029 0.168 0.19 0.10 0.34 0.22 0.11 0.38 391.6 299.8 495.6Rwanda F 35 0.064 0.025 0.136 0.18 0.10 0.32 0.16 0.09 0.28 393.9 300.3 503.3Rwanda F 45 0.052 0.019 0.107 0.17 0.09 0.30 0.11 0.06 0.19 397.1 302.0 511.1Rwanda F 55 0.050 0.018 0.104 0.19 0.10 0.32 0.09 0.05 0.15 407.2 312.7 521.8Rwanda F 65 0.050 0.018 0.103 0.21 0.11 0.37 0.07 0.04 0.13 418.6 319.9 531.5Rwanda F 75 0.049 0.018 0.102 0.23 0.12 0.39 0.07 0.03 0.11 429.6 331.2 543.9Rwanda F 90 0.047 0.018 0.097 0.25 0.13 0.43 0.06 0.03 0.11 441.9 338.3 556.1Rwanda M 25 0.063 0.022 0.131 0.18 0.10 0.29 0.24 0.13 0.40 356.6 275.8 464.4Rwanda M 35 0.052 0.019 0.109 0.17 0.09 0.27 0.18 0.10 0.30 359.0 280.1 465.9Rwanda M 45 0.042 0.016 0.089 0.16 0.09 0.26 0.12 0.06 0.21 362.2 282.2 470.3Rwanda M 55 0.041 0.015 0.087 0.17 0.10 0.28 0.10 0.05 0.17 371.1 289.1 482.7Rwanda M 65 0.041 0.015 0.085 0.19 0.11 0.32 0.08 0.04 0.14 381.3 293.9 501.2Rwanda M 75 0.040 0.015 0.081 0.21 0.12 0.34 0.07 0.04 0.13 391.2 302.7 513.9Rwanda M 90 0.038 0.014 0.078 0.23 0.13 0.38 0.07 0.04 0.11 402.1 311.6 528.0Saudi Arabia F 25 0.507 0.242 0.919 0.63 0.35 1.05 0.71 0.39 1.19 651.0 504.6 826.1Saudi Arabia F 35 0.424 0.206 0.777 0.60 0.34 1.00 0.54 0.30 0.90 655.6 505.9 828.6Saudi Arabia F 45 0.348 0.166 0.646 0.58 0.32 0.99 0.39 0.22 0.64 661.4 507.2 840.2Saudi Arabia F 55 0.334 0.160 0.622 0.63 0.35 1.06 0.31 0.18 0.52 677.9 523.9 857.2Saudi Arabia F 65 0.333 0.160 0.617 0.70 0.39 1.19 0.26 0.15 0.43 696.7 540.0 882.8Saudi Arabia F 75 0.327 0.159 0.599 0.76 0.43 1.28 0.24 0.14 0.40 714.4 555.5 903.6Saudi Arabia F 90 0.316 0.153 0.571 0.83 0.46 1.39 0.22 0.12 0.36 736.1 570.9 929.4Saudi Arabia M 25 0.420 0.203 0.757 0.58 0.30 0.98 0.79 0.43 1.37 602.2 461.6 768.2Saudi Arabia M 35 0.350 0.170 0.626 0.54 0.29 0.92 0.60 0.33 1.01 606.1 469.5 775.1Saudi Arabia M 45 0.287 0.141 0.513 0.52 0.27 0.89 0.41 0.22 0.70 611.1 472.5 783.5Saudi Arabia M 55 0.276 0.138 0.495 0.57 0.30 0.96 0.33 0.18 0.57 626.3 488.1 807.1Saudi Arabia M 65 0.277 0.141 0.500 0.63 0.32 1.07 0.28 0.16 0.49 643.5 500.2 835.9Saudi Arabia M 75 0.269 0.138 0.478 0.69 0.37 1.16 0.26 0.14 0.45 659.9 512.1 851.5Saudi Arabia M 90 0.258 0.130 0.460 0.75 0.41 1.27 0.24 0.13 0.41 678.2 520.8 868.8Sudan F 25 0.073 0.036 0.141 0.98 0.49 1.72 1.16 0.59 2.03 566.3 422.6 751.7Sudan F 35 0.061 0.030 0.115 0.92 0.46 1.60 0.87 0.46 1.46 569.6 423.9 763.6Sudan F 45 0.049 0.023 0.093 0.88 0.44 1.54 0.59 0.31 0.99 574.1 423.2 774.8Sudan F 55 0.047 0.023 0.087 0.96 0.49 1.68 0.47 0.25 0.78 588.7 438.7 783.9Sudan F 65 0.047 0.023 0.087 1.07 0.53 1.89 0.38 0.20 0.65 605.3 453.5 799.9Sudan F 75 0.046 0.023 0.086 1.16 0.59 1.99 0.35 0.19 0.59 621.0 466.5 817.4Sudan F 90 0.045 0.022 0.084 1.25 0.65 2.14 0.32 0.18 0.54 638.4 476.5 850.3Sudan M 25 0.060 0.029 0.110 0.89 0.47 1.55 1.28 0.69 2.24 514.9 388.4 663.5Sudan M 35 0.050 0.025 0.088 0.83 0.44 1.42 0.96 0.51 1.67 518.5 393.8 663.1Sudan M 45 0.040 0.020 0.072 0.79 0.42 1.34 0.65 0.34 1.16 523.0 391.4 673.4Sudan M 55 0.039 0.020 0.068 0.87 0.47 1.47 0.52 0.27 0.91 535.8 407.8 685.7Sudan M 65 0.039 0.020 0.068 0.97 0.51 1.68 0.43 0.22 0.75 550.4 417.5 710.1Sudan M 75 0.038 0.019 0.066 1.05 0.56 1.81 0.39 0.21 0.67 564.7 430.3 727.7Sudan M 90 0.037 0.018 0.066 1.13 0.61 1.99 0.36 0.19 0.61 580.6 443.3 752.1Senegal F 25 0.007 0.003 0.014 0.37 0.20 0.63 0.92 0.48 1.54 488.5 376.1 624.2Senegal F 35 0.006 0.003 0.011 0.35 0.19 0.59 0.69 0.36 1.15 491.3 382.5 623.8Senegal F 45 0.005 0.002 0.009 0.33 0.18 0.56 0.47 0.24 0.81 495.1 387.5 635.2Senegal F 55 0.005 0.002 0.009 0.37 0.20 0.62 0.37 0.20 0.63 507.7 395.3 644.8Senegal F 65 0.005 0.002 0.009 0.41 0.23 0.69 0.31 0.16 0.52 522.2 404.0 664.5Senegal F 75 0.004 0.002 0.009 0.45 0.25 0.74 0.28 0.15 0.46 535.4 413.6 677.8Senegal F 90 0.004 0.002 0.009 0.48 0.27 0.81 0.26 0.14 0.42 549.5 424.6 702.7Senegal M 25 0.006 0.002 0.011 0.35 0.18 0.60 1.05 0.56 1.81 451.2 343.4 580.0Senegal M 35 0.005 0.002 0.009 0.32 0.17 0.56 0.78 0.42 1.32 454.1 344.6 571.9Senegal M 45 0.004 0.002 0.007 0.31 0.16 0.53 0.53 0.28 0.89 457.9 348.6 576.0Senegal M 55 0.004 0.002 0.007 0.34 0.18 0.59 0.42 0.23 0.71 469.0 360.5 585.7Senegal M 65 0.004 0.002 0.007 0.38 0.21 0.66 0.35 0.19 0.60 481.8 371.9 608.2Senegal M 75 0.004 0.002 0.007 0.41 0.22 0.71 0.32 0.17 0.54 494.3 380.6 619.1Senegal M 90 0.003 0.002 0.007 0.44 0.24 0.77 0.29 0.16 0.50 507.7 390.8 640.0Singapore F 25 0.333 0.168 0.618 0.31 0.26 0.37 0.64 0.52 0.77 535.9 497.3 579.0Singapore F 35 0.277 0.145 0.511 0.30 0.26 0.34 0.47 0.40 0.56 540.5 505.7 575.8Singapore F 45 0.226 0.113 0.417 0.29 0.24 0.33 0.32 0.26 0.39 546.1 507.7 585.7Singapore F 55 0.218 0.112 0.400 0.31 0.27 0.36 0.25 0.21 0.31 559.3 523.5 593.8Singapore F 65 0.219 0.112 0.403 0.35 0.30 0.41 0.20 0.17 0.24 574.2 535.3 617.2Singapore F 75 0.214 0.109 0.393 0.37 0.32 0.43 0.19 0.16 0.23 588.7 551.5 627.6Singapore F 90 0.206 0.105 0.369 0.40 0.34 0.46 0.19 0.15 0.22 605.0 567.0 644.8Singapore M 25 0.268 0.147 0.481 0.28 0.23 0.34 0.74 0.61 0.89 489.5 453.3 525.7Singapore M 35 0.224 0.122 0.400 0.26 0.22 0.30 0.56 0.48 0.66 493.5 462.7 525.5Singapore M 45 0.184 0.095 0.337 0.25 0.21 0.29 0.40 0.33 0.48 498.4 463.6 536.8Singapore M 55 0.177 0.092 0.322 0.27 0.23 0.31 0.31 0.26 0.37 510.3 478.9 544.0Singapore M 65 0.176 0.094 0.323 0.31 0.26 0.36 0.24 0.20 0.29 523.9 488.6 564.4Singapore M 75 0.172 0.093 0.318 0.34 0.29 0.39 0.22 0.18 0.26 538.6 504.9 575.4Singapore M 90 0.167 0.090 0.308 0.37 0.31 0.43 0.20 0.17 0.24 555.5 521.0 594.1Solomon Islands F 25 0.036 0.018 0.066 0.14 0.08 0.23 0.50 0.28 0.85 419.7 325.3 529.2Solomon Islands F 35 0.030 0.015 0.055 0.13 0.07 0.21 0.37 0.21 0.61 422.1 326.5 529.8Solomon Islands F 45 0.024 0.012 0.046 0.12 0.07 0.21 0.25 0.14 0.43 425.4 326.9 540.3Solomon Islands F 55 0.023 0.012 0.043 0.13 0.07 0.22 0.20 0.12 0.34 436.2 336.6 551.1Solomon Islands F 65 0.023 0.012 0.042 0.15 0.08 0.25 0.17 0.09 0.27 448.6 342.8 572.8Solomon Islands F 75 0.023 0.012 0.041 0.16 0.09 0.27 0.15 0.08 0.25 460.4 352.5 586.0Solomon Islands F 90 0.022 0.012 0.041 0.17 0.10 0.28 0.14 0.08 0.23 473.5 365.6 598.1Solomon Islands M 25 0.031 0.016 0.053 0.13 0.07 0.22 0.54 0.30 0.90 381.6 288.6 482.8Solomon Islands M 35 0.025 0.013 0.043 0.12 0.06 0.20 0.41 0.22 0.67 383.6 293.5 485.2Solomon Islands M 45 0.020 0.011 0.035 0.11 0.06 0.19 0.28 0.15 0.47 386.6 295.3 490.0Solomon Islands M 55 0.020 0.010 0.034 0.12 0.07 0.21 0.22 0.12 0.37 396.6 302.8 503.1Solomon Islands M 65 0.020 0.010 0.034 0.14 0.07 0.24 0.18 0.10 0.31 408.2 308.9 518.3Solomon Islands M 75 0.019 0.010 0.033 0.15 0.08 0.26 0.16 0.09 0.27 418.9 317.6 529.1Solomon Islands M 90 0.019 0.010 0.032 0.16 0.09 0.27 0.15 0.08 0.25 430.6 326.7 539.6Sierra Leone F 25 0.007 0.004 0.012 0.13 0.07 0.23 0.45 0.24 0.75 390.7 301.6 502.8Sierra Leone F 35 0.006 0.003 0.010 0.12 0.07 0.22 0.33 0.18 0.55 393.0 303.7 502.4Sierra Leone F 45 0.005 0.002 0.008 0.12 0.06 0.21 0.23 0.12 0.38 396.1 306.9 501.2Sierra Leone F 55 0.005 0.002 0.008 0.13 0.07 0.23 0.18 0.10 0.30 406.2 311.9 515.6

Country SexMidpoint of age range
Mean juice intake
(servings/day)
Juice, lower uncertainty interval
Juice, upper uncertainty interval
Mean milk intake
(servings/day)
Milk, lower uncertainty interval
Milk, upper uncertainty interval
Mean SSB intake (servings/day)
SSB, lower uncertainty interval
SSB, upper uncertainty interval
Mean calcium intake
(servings/day)
Calcium, lower
uncertainty interval
Calcium, upper
uncertainty interval
Sierra Leone F 65 0.005 0.002 0.008 0.15 0.08 0.26 0.15 0.08 0.25 417.6 319.0 532.4Sierra Leone F 75 0.004 0.002 0.008 0.16 0.08 0.28 0.14 0.07 0.22 428.2 329.8 543.5Sierra Leone F 90 0.004 0.002 0.007 0.17 0.09 0.30 0.13 0.07 0.20 439.3 339.6 556.4Sierra Leone M 25 0.006 0.003 0.011 0.12 0.06 0.21 0.50 0.27 0.88 358.3 274.4 456.2Sierra Leone M 35 0.005 0.002 0.009 0.12 0.06 0.19 0.37 0.21 0.63 360.6 276.7 454.8Sierra Leone M 45 0.004 0.002 0.007 0.11 0.06 0.18 0.25 0.14 0.43 363.6 277.2 459.2Sierra Leone M 55 0.004 0.002 0.007 0.12 0.07 0.20 0.20 0.11 0.34 372.4 286.3 469.2Sierra Leone M 65 0.004 0.002 0.007 0.13 0.07 0.23 0.17 0.09 0.28 382.5 295.6 487.4Sierra Leone M 75 0.004 0.002 0.007 0.15 0.08 0.24 0.15 0.08 0.25 392.4 302.4 500.0Sierra Leone M 90 0.004 0.002 0.006 0.16 0.08 0.27 0.14 0.08 0.22 403.1 311.1 515.1El Salvador F 25 0.458 0.245 0.820 1.12 0.62 1.91 2.79 1.50 4.77 730.2 566.8 922.5El Salvador F 35 0.379 0.205 0.671 1.06 0.58 1.77 2.17 1.17 3.68 735.6 564.6 917.0El Salvador F 45 0.307 0.163 0.549 1.01 0.55 1.70 1.59 0.83 2.67 742.4 564.6 928.9El Salvador F 55 0.295 0.160 0.521 1.11 0.62 1.87 1.27 0.68 2.15 760.9 581.0 954.7El Salvador F 65 0.295 0.159 0.524 1.23 0.68 2.11 1.02 0.55 1.71 781.9 596.7 983.9El Salvador F 75 0.289 0.158 0.512 1.33 0.74 2.28 0.92 0.50 1.55 801.4 613.3 1008.0El Salvador F 90 0.280 0.151 0.489 1.44 0.81 2.44 0.83 0.45 1.38 825.0 633.4 1029.7El Salvador M 25 0.379 0.193 0.666 1.01 0.56 1.72 3.03 1.77 5.20 673.0 519.3 860.2El Salvador M 35 0.314 0.161 0.557 0.96 0.54 1.60 2.36 1.40 3.96 676.9 525.2 858.6El Salvador M 45 0.254 0.128 0.466 0.91 0.51 1.53 1.72 1.00 2.83 682.3 530.1 864.7El Salvador M 55 0.244 0.123 0.443 1.00 0.55 1.67 1.38 0.81 2.23 700.0 548.9 881.4El Salvador M 65 0.245 0.120 0.449 1.12 0.60 1.87 1.12 0.65 1.84 720.2 560.1 911.7El Salvador M 75 0.240 0.118 0.436 1.21 0.67 2.04 1.01 0.58 1.68 739.1 576.4 932.5El Salvador M 90 0.233 0.117 0.412 1.32 0.74 2.23 0.91 0.53 1.53 761.9 593.3 967.9Somalia F 25 0.015 0.007 0.027 0.16 0.08 0.27 0.45 0.24 0.79 370.6 284.0 478.6Somalia F 35 0.013 0.006 0.022 0.15 0.08 0.25 0.34 0.18 0.57 372.9 285.8 477.5Somalia F 45 0.010 0.005 0.018 0.14 0.08 0.25 0.23 0.12 0.39 375.9 286.5 479.3Somalia F 55 0.010 0.005 0.018 0.16 0.08 0.27 0.18 0.10 0.31 385.5 293.3 492.2Somalia F 65 0.010 0.005 0.018 0.17 0.09 0.31 0.15 0.08 0.26 396.3 303.0 513.0Somalia F 75 0.010 0.005 0.017 0.19 0.10 0.33 0.14 0.08 0.23 406.6 311.6 519.6Somalia F 90 0.009 0.005 0.017 0.20 0.11 0.35 0.13 0.07 0.21 418.2 318.8 533.4Somalia M 25 0.012 0.006 0.022 0.14 0.08 0.24 0.51 0.27 0.87 340.0 262.3 440.6Somalia M 35 0.010 0.005 0.018 0.13 0.07 0.22 0.38 0.20 0.66 342.2 266.8 434.4Somalia M 45 0.008 0.004 0.015 0.13 0.07 0.22 0.26 0.14 0.46 345.1 267.3 441.6Somalia M 55 0.008 0.004 0.014 0.14 0.08 0.24 0.21 0.11 0.36 353.6 274.9 450.7Somalia M 65 0.008 0.004 0.014 0.15 0.08 0.27 0.17 0.09 0.30 363.3 281.8 464.0Somalia M 75 0.008 0.004 0.014 0.17 0.09 0.29 0.15 0.08 0.27 372.7 290.8 476.4Somalia M 90 0.008 0.004 0.013 0.18 0.10 0.31 0.14 0.07 0.25 383.2 298.4 487.8Serbia F 25 0.608 0.362 0.948 0.60 0.42 0.83 0.52 0.32 0.80 611.6 465.5 788.1Serbia F 35 0.505 0.300 0.782 0.57 0.40 0.78 0.39 0.24 0.60 614.5 469.1 788.1Serbia F 45 0.410 0.242 0.645 0.55 0.38 0.75 0.26 0.16 0.42 618.9 471.6 792.4Serbia F 55 0.386 0.231 0.600 0.61 0.43 0.83 0.21 0.13 0.33 634.6 487.6 810.1Serbia F 65 0.377 0.223 0.589 0.68 0.48 0.94 0.18 0.11 0.28 652.6 496.8 840.2Serbia F 75 0.370 0.221 0.573 0.74 0.53 1.02 0.16 0.10 0.25 670.2 513.7 860.0Serbia F 90 0.362 0.216 0.557 0.81 0.58 1.11 0.15 0.09 0.23 690.3 525.1 885.3Serbia M 25 0.482 0.283 0.745 0.55 0.38 0.76 0.61 0.37 0.95 562.1 434.2 711.9Serbia M 35 0.399 0.235 0.619 0.52 0.36 0.70 0.46 0.29 0.70 562.9 437.4 709.8Serbia M 45 0.322 0.189 0.518 0.49 0.34 0.67 0.31 0.19 0.49 565.2 436.3 715.4Serbia M 55 0.307 0.184 0.479 0.55 0.38 0.74 0.24 0.15 0.38 578.8 450.4 730.5Serbia M 65 0.305 0.184 0.475 0.62 0.43 0.86 0.19 0.12 0.30 594.8 464.7 752.5Serbia M 75 0.302 0.182 0.468 0.68 0.48 0.93 0.18 0.11 0.27 611.7 476.9 774.6Serbia M 90 0.299 0.178 0.461 0.74 0.51 1.01 0.17 0.10 0.25 631.3 493.8 804.0São Tomé and Príncipe F 25 0.369 0.164 0.710 0.35 0.18 0.61 1.17 0.60 2.09 487.1 375.1 620.9São Tomé and Príncipe F 35 0.307 0.137 0.576 0.33 0.18 0.57 0.88 0.46 1.52 490.0 377.9 620.2São Tomé and Príncipe F 45 0.249 0.109 0.471 0.32 0.17 0.56 0.60 0.31 1.04 494.0 378.7 630.1São Tomé and Príncipe F 55 0.239 0.106 0.459 0.35 0.19 0.61 0.47 0.25 0.83 506.4 392.9 641.8São Tomé and Príncipe F 65 0.239 0.105 0.462 0.39 0.22 0.68 0.39 0.20 0.68 520.7 403.7 663.9São Tomé and Príncipe F 75 0.234 0.104 0.457 0.42 0.23 0.73 0.35 0.19 0.61 534.1 416.5 677.7São Tomé and Príncipe F 90 0.227 0.103 0.450 0.46 0.25 0.79 0.33 0.17 0.56 549.3 424.8 695.1São Tomé and Príncipe M 25 0.302 0.140 0.611 0.33 0.19 0.57 1.32 0.69 2.30 448.3 341.8 563.9São Tomé and Príncipe M 35 0.251 0.118 0.513 0.31 0.18 0.52 0.99 0.52 1.67 451.2 345.8 569.4São Tomé and Príncipe M 45 0.204 0.095 0.416 0.30 0.16 0.50 0.67 0.35 1.13 455.1 346.1 579.3São Tomé and Príncipe M 55 0.197 0.092 0.398 0.33 0.18 0.53 0.53 0.29 0.88 466.2 355.5 587.4São Tomé and Príncipe M 65 0.197 0.092 0.388 0.36 0.20 0.59 0.44 0.23 0.74 478.9 364.2 608.2São Tomé and Príncipe M 75 0.193 0.091 0.388 0.40 0.22 0.65 0.40 0.21 0.68 491.4 376.1 623.9São Tomé and Príncipe M 90 0.187 0.087 0.374 0.43 0.24 0.71 0.37 0.19 0.63 505.5 385.5 644.1Suriname F 25 0.291 0.144 0.532 0.34 0.19 0.57 4.23 2.44 7.25 697.5 536.4 896.5Suriname F 35 0.243 0.123 0.443 0.32 0.18 0.53 3.15 1.83 5.24 701.5 541.3 895.3Suriname F 45 0.200 0.101 0.372 0.31 0.16 0.52 2.14 1.22 3.62 706.9 546.3 902.7Suriname F 55 0.191 0.097 0.351 0.34 0.18 0.56 1.72 0.99 2.87 724.1 561.6 925.2Suriname F 65 0.188 0.095 0.345 0.37 0.20 0.61 1.43 0.82 2.38 744.1 575.4 952.1Suriname F 75 0.184 0.093 0.339 0.40 0.22 0.66 1.30 0.76 2.17 763.7 591.0 973.9Suriname F 90 0.179 0.089 0.321 0.44 0.24 0.72 1.20 0.69 2.00 786.7 605.2 1004.1Suriname M 25 0.240 0.122 0.450 0.32 0.19 0.57 4.59 2.52 7.83 646.3 491.1 831.0Suriname M 35 0.200 0.103 0.371 0.30 0.17 0.53 3.40 1.94 5.70 650.1 498.2 833.4Suriname M 45 0.163 0.081 0.312 0.29 0.16 0.49 2.29 1.29 3.83 655.2 504.6 842.4Suriname M 55 0.157 0.080 0.298 0.31 0.18 0.54 1.84 1.04 3.03 670.9 518.7 863.2Suriname M 65 0.157 0.079 0.292 0.35 0.20 0.60 1.53 0.86 2.56 689.1 533.7 884.5Suriname M 75 0.153 0.077 0.287 0.38 0.21 0.66 1.40 0.80 2.33 707.5 545.8 910.9Suriname M 90 0.147 0.075 0.278 0.41 0.23 0.72 1.29 0.75 2.17 728.8 558.7 937.6Slovakia F 25 0.223 0.146 0.322 0.54 0.39 0.75 1.02 0.74 1.38 558.2 430.3 715.5Slovakia F 35 0.185 0.123 0.264 0.51 0.37 0.69 0.76 0.56 1.02 560.7 435.4 714.3Slovakia F 45 0.150 0.098 0.220 0.49 0.36 0.67 0.51 0.37 0.70 564.6 441.4 719.2Slovakia F 55 0.142 0.096 0.206 0.55 0.40 0.73 0.41 0.30 0.56 579.1 449.8 741.8Slovakia F 65 0.138 0.093 0.201 0.62 0.45 0.84 0.35 0.25 0.47 595.6 458.0 760.9Slovakia F 75 0.136 0.091 0.194 0.67 0.49 0.90 0.32 0.23 0.43 611.5 471.6 774.5Slovakia F 90 0.132 0.088 0.187 0.73 0.53 0.99 0.29 0.22 0.40 630.4 488.9 799.4Slovakia M 25 0.177 0.117 0.259 0.50 0.36 0.68 1.17 0.82 1.62 517.1 395.7 664.7Slovakia M 35 0.146 0.098 0.212 0.47 0.34 0.64 0.87 0.62 1.18 517.9 400.9 663.3Slovakia M 45 0.119 0.078 0.174 0.44 0.32 0.61 0.59 0.41 0.80 519.9 401.4 664.9Slovakia M 55 0.113 0.076 0.164 0.50 0.37 0.67 0.46 0.33 0.62 532.4 410.1 684.7Slovakia M 65 0.112 0.076 0.163 0.56 0.41 0.77 0.37 0.26 0.50 547.1 421.0 708.5Slovakia M 75 0.111 0.076 0.162 0.61 0.45 0.83 0.34 0.24 0.45 562.6 433.9 722.8Slovakia M 90 0.110 0.074 0.161 0.67 0.49 0.91 0.32 0.23 0.42 581.0 443.7 741.7Slovenia F 25 0.475 0.301 0.718 0.77 0.56 1.03 0.55 0.36 0.80 811.9 716.0 912.2Slovenia F 35 0.394 0.253 0.586 0.73 0.53 0.98 0.41 0.27 0.59 815.6 727.3 912.0Slovenia F 45 0.320 0.202 0.476 0.70 0.51 0.95 0.28 0.18 0.41 821.4 731.4 924.3Slovenia F 55 0.301 0.190 0.449 0.77 0.58 1.04 0.22 0.15 0.32 842.3 750.4 945.2Slovenia F 65 0.295 0.185 0.445 0.87 0.64 1.18 0.19 0.12 0.28 866.4 764.2 975.5

Country SexMidpoint of age range
Mean juice intake
(servings/day)
Juice, lower uncertainty interval
Juice, upper uncertainty interval
Mean milk intake
(servings/day)
Milk, lower uncertainty interval
Milk, upper uncertainty interval
Mean SSB intake (servings/day)
SSB, lower uncertainty interval
SSB, upper uncertainty interval
Mean calcium intake
(servings/day)
Calcium, lower
uncertainty interval
Calcium, upper
uncertainty interval
Slovenia F 75 0.289 0.183 0.439 0.95 0.71 1.27 0.17 0.11 0.25 889.6 788.5 991.8Slovenia F 90 0.282 0.179 0.427 1.04 0.77 1.39 0.16 0.10 0.23 917.5 819.3 1026.1Slovenia M 25 0.377 0.239 0.571 0.71 0.53 0.96 0.65 0.42 0.95 748.2 654.9 845.4Slovenia M 35 0.312 0.199 0.471 0.67 0.50 0.89 0.48 0.32 0.71 749.2 656.7 841.5Slovenia M 45 0.252 0.160 0.381 0.64 0.47 0.84 0.33 0.22 0.48 752.2 656.7 844.4Slovenia M 55 0.241 0.155 0.360 0.71 0.54 0.94 0.25 0.17 0.38 770.2 677.8 862.1Slovenia M 65 0.239 0.155 0.364 0.81 0.60 1.07 0.21 0.14 0.31 791.6 696.4 897.1Slovenia M 75 0.237 0.155 0.359 0.88 0.67 1.16 0.19 0.12 0.28 813.9 717.5 918.5Slovenia M 90 0.234 0.153 0.344 0.96 0.73 1.27 0.18 0.12 0.26 840.1 741.2 943.9Sweden F 25 0.557 0.460 0.670 1.62 1.38 1.88 0.99 0.81 1.19 937.6 859.2 1019.9Sweden F 35 0.447 0.376 0.530 1.53 1.33 1.74 0.71 0.59 0.84 944.5 874.1 1022.2Sweden F 45 0.349 0.286 0.419 1.45 1.26 1.67 0.45 0.37 0.54 953.0 875.9 1034.7Sweden F 55 0.338 0.281 0.400 1.55 1.35 1.75 0.36 0.30 0.43 974.0 900.9 1047.9Sweden F 65 0.345 0.284 0.411 1.68 1.44 1.94 0.31 0.25 0.37 997.8 918.3 1077.5Sweden F 75 0.345 0.288 0.408 1.85 1.61 2.11 0.28 0.23 0.34 1023.0 945.3 1095.6Sweden F 90 0.342 0.283 0.409 2.07 1.79 2.39 0.26 0.21 0.31 1056.0 975.8 1136.8Sweden M 25 0.446 0.372 0.537 1.54 1.32 1.77 1.16 0.95 1.39 864.1 789.7 941.5Sweden M 35 0.361 0.304 0.425 1.40 1.23 1.59 0.81 0.68 0.96 867.7 804.5 938.4Sweden M 45 0.285 0.236 0.339 1.29 1.11 1.49 0.50 0.41 0.60 872.9 806.1 952.7Sweden M 55 0.271 0.228 0.319 1.37 1.21 1.57 0.39 0.32 0.47 891.7 827.1 964.3Sweden M 65 0.269 0.223 0.325 1.50 1.30 1.74 0.32 0.26 0.39 913.5 845.1 991.3Sweden M 75 0.272 0.229 0.325 1.66 1.45 1.89 0.30 0.24 0.35 936.4 868.1 1013.0Sweden M 90 0.276 0.233 0.331 1.87 1.62 2.15 0.27 0.23 0.33 965.2 892.4 1041.3Swaziland F 25 0.095 0.046 0.171 0.83 0.47 1.39 1.34 0.70 2.23 483.6 375.5 620.7Swaziland F 35 0.079 0.039 0.143 0.78 0.44 1.29 1.00 0.53 1.64 487.1 380.3 620.9Swaziland F 45 0.064 0.031 0.115 0.74 0.41 1.24 0.68 0.36 1.12 491.5 382.9 630.8Swaziland F 55 0.061 0.031 0.111 0.81 0.47 1.35 0.54 0.29 0.88 502.7 389.8 641.0Swaziland F 65 0.061 0.030 0.113 0.90 0.52 1.51 0.45 0.24 0.75 515.6 397.6 657.4Swaziland F 75 0.060 0.029 0.109 0.98 0.56 1.63 0.41 0.22 0.67 529.2 410.4 670.5Swaziland F 90 0.058 0.028 0.105 1.06 0.61 1.74 0.37 0.20 0.62 545.0 418.6 689.8Swaziland M 25 0.078 0.037 0.140 0.76 0.41 1.34 1.47 0.84 2.51 442.9 338.9 566.3Swaziland M 35 0.065 0.032 0.116 0.72 0.39 1.23 1.10 0.64 1.84 445.6 344.5 571.2Swaziland M 45 0.052 0.026 0.093 0.68 0.36 1.16 0.75 0.43 1.22 449.3 347.4 577.3Swaziland M 55 0.050 0.025 0.089 0.75 0.40 1.27 0.59 0.35 0.97 460.0 355.9 588.8Swaziland M 65 0.050 0.025 0.091 0.83 0.45 1.40 0.49 0.29 0.80 472.2 364.1 603.8Swaziland M 75 0.049 0.025 0.087 0.90 0.49 1.51 0.44 0.26 0.73 484.7 374.9 622.1Swaziland M 90 0.048 0.024 0.083 0.97 0.54 1.65 0.41 0.24 0.68 499.0 387.6 638.2Seychelles F 25 0.127 0.062 0.214 0.71 0.36 1.28 0.80 0.43 1.35 700.7 526.5 912.8Seychelles F 35 0.107 0.054 0.181 0.68 0.34 1.18 0.61 0.33 1.02 706.7 533.1 923.5Seychelles F 45 0.089 0.045 0.153 0.66 0.33 1.14 0.43 0.23 0.72 713.8 536.1 930.7Seychelles F 55 0.086 0.044 0.148 0.73 0.38 1.28 0.34 0.19 0.57 730.0 553.2 951.0Seychelles F 65 0.086 0.045 0.147 0.83 0.44 1.45 0.28 0.15 0.47 748.3 567.7 967.2Seychelles F 75 0.084 0.044 0.143 0.90 0.48 1.59 0.26 0.14 0.42 769.1 582.4 993.6Seychelles F 90 0.081 0.043 0.139 0.98 0.51 1.74 0.23 0.13 0.38 793.7 599.9 1031.3Seychelles M 25 0.100 0.047 0.181 0.67 0.35 1.14 0.86 0.48 1.42 635.9 473.2 831.0Seychelles M 35 0.085 0.040 0.151 0.63 0.33 1.05 0.65 0.37 1.08 641.2 479.2 828.9Seychelles M 45 0.072 0.034 0.127 0.60 0.31 0.99 0.45 0.25 0.77 647.7 485.3 834.5Seychelles M 55 0.071 0.034 0.123 0.66 0.34 1.11 0.36 0.21 0.60 663.0 497.8 859.9Seychelles M 65 0.072 0.035 0.125 0.74 0.39 1.28 0.30 0.17 0.48 680.2 508.0 882.2Seychelles M 75 0.069 0.034 0.120 0.81 0.43 1.40 0.27 0.15 0.44 698.0 521.3 908.0Seychelles M 90 0.065 0.032 0.114 0.89 0.47 1.52 0.25 0.14 0.41 718.3 533.8 932.5Syrian Arab Republic F 25 0.274 0.139 0.491 0.76 0.41 1.32 0.93 0.52 1.60 680.1 525.1 866.7Syrian Arab Republic F 35 0.229 0.118 0.402 0.72 0.39 1.24 0.72 0.40 1.20 684.9 530.7 874.6Syrian Arab Republic F 45 0.187 0.096 0.333 0.69 0.37 1.23 0.51 0.28 0.87 691.1 531.9 886.1Syrian Arab Republic F 55 0.180 0.095 0.316 0.76 0.40 1.32 0.42 0.24 0.69 708.3 547.8 909.1Syrian Arab Republic F 65 0.180 0.093 0.317 0.84 0.45 1.50 0.35 0.20 0.59 727.7 562.7 935.7Syrian Arab Republic F 75 0.176 0.093 0.310 0.91 0.49 1.61 0.31 0.18 0.53 746.4 579.8 960.2Syrian Arab Republic F 90 0.171 0.088 0.299 0.99 0.52 1.73 0.29 0.16 0.48 767.7 599.8 982.5Syrian Arab Republic M 25 0.227 0.110 0.416 0.69 0.37 1.20 1.04 0.57 1.73 624.1 478.7 801.2Syrian Arab Republic M 35 0.189 0.091 0.338 0.65 0.35 1.13 0.78 0.43 1.26 628.0 486.6 798.4Syrian Arab Republic M 45 0.155 0.074 0.278 0.61 0.33 1.07 0.54 0.29 0.90 633.2 489.3 804.5Syrian Arab Republic M 55 0.149 0.072 0.264 0.67 0.36 1.14 0.43 0.24 0.72 649.0 499.7 826.5Syrian Arab Republic M 65 0.149 0.074 0.268 0.75 0.40 1.30 0.36 0.20 0.61 666.8 507.2 847.3Syrian Arab Republic M 75 0.145 0.071 0.260 0.82 0.45 1.41 0.33 0.18 0.55 683.7 522.8 868.5Syrian Arab Republic M 90 0.139 0.067 0.250 0.90 0.49 1.56 0.31 0.17 0.52 703.1 543.4 891.1Chad F 25 0.005 0.002 0.009 0.38 0.21 0.63 0.65 0.36 1.07 494.7 384.9 634.3Chad F 35 0.004 0.002 0.008 0.36 0.19 0.60 0.49 0.28 0.79 497.6 388.5 633.5Chad F 45 0.003 0.002 0.006 0.34 0.18 0.59 0.33 0.18 0.54 501.6 386.5 637.0Chad F 55 0.003 0.002 0.006 0.37 0.21 0.64 0.26 0.15 0.43 514.4 398.0 657.8Chad F 65 0.003 0.001 0.006 0.42 0.23 0.69 0.22 0.12 0.37 528.9 408.8 680.8Chad F 75 0.003 0.001 0.006 0.45 0.25 0.74 0.20 0.11 0.32 542.5 421.0 693.3Chad F 90 0.003 0.001 0.006 0.49 0.27 0.81 0.18 0.10 0.29 557.5 432.8 715.2Chad M 25 0.004 0.002 0.008 0.36 0.20 0.64 0.73 0.41 1.27 457.1 347.9 589.2Chad M 35 0.003 0.002 0.006 0.34 0.19 0.59 0.55 0.31 0.92 460.0 352.1 587.9Chad M 45 0.003 0.001 0.005 0.32 0.17 0.56 0.37 0.20 0.61 463.8 351.3 589.8Chad M 55 0.003 0.001 0.005 0.35 0.19 0.61 0.29 0.17 0.47 475.1 362.0 603.7Chad M 65 0.003 0.001 0.005 0.39 0.22 0.69 0.24 0.13 0.39 488.1 372.2 622.9Chad M 75 0.003 0.001 0.005 0.43 0.24 0.74 0.22 0.12 0.35 500.8 382.9 634.6Chad M 90 0.003 0.001 0.005 0.46 0.25 0.81 0.20 0.11 0.32 514.9 388.1 650.0Togo F 25 0.001 0.001 0.003 0.14 0.07 0.23 0.51 0.27 0.88 395.9 306.5 509.2Togo F 35 0.001 0.001 0.002 0.13 0.07 0.21 0.38 0.21 0.65 398.3 309.2 512.0Togo F 45 0.001 0.000 0.002 0.13 0.07 0.21 0.26 0.14 0.44 401.5 308.0 517.8Togo F 55 0.001 0.000 0.002 0.14 0.08 0.22 0.21 0.12 0.34 411.7 315.7 530.7Togo F 65 0.001 0.000 0.002 0.16 0.08 0.25 0.17 0.09 0.29 423.3 323.3 549.5Togo F 75 0.001 0.000 0.002 0.17 0.09 0.27 0.16 0.08 0.26 434.2 332.6 560.1Togo F 90 0.001 0.000 0.002 0.18 0.10 0.29 0.14 0.08 0.24 446.5 339.6 571.4Togo M 25 0.001 0.000 0.002 0.13 0.07 0.22 0.58 0.32 1.00 362.4 281.9 467.9Togo M 35 0.001 0.000 0.002 0.13 0.07 0.21 0.43 0.24 0.73 364.7 285.5 468.3Togo M 45 0.001 0.000 0.001 0.12 0.07 0.20 0.29 0.15 0.50 367.7 286.6 473.0Togo M 55 0.001 0.000 0.001 0.13 0.07 0.21 0.23 0.12 0.39 376.7 294.7 479.5Togo M 65 0.001 0.000 0.001 0.15 0.08 0.24 0.19 0.10 0.32 386.9 300.7 491.5Togo M 75 0.001 0.000 0.001 0.16 0.09 0.26 0.17 0.10 0.29 397.0 308.8 505.4Togo M 90 0.001 0.000 0.001 0.17 0.10 0.28 0.16 0.09 0.27 408.5 316.4 521.9Thailand F 25 0.338 0.173 0.605 0.27 0.18 0.41 1.10 0.76 1.52 459.4 420.0 499.4Thailand F 35 0.285 0.146 0.517 0.26 0.17 0.38 0.84 0.58 1.14 463.4 428.6 499.3Thailand F 45 0.237 0.119 0.447 0.25 0.17 0.37 0.59 0.40 0.81 468.1 429.8 510.2Thailand F 55 0.230 0.117 0.425 0.28 0.19 0.41 0.47 0.33 0.64 478.7 444.1 516.4Thailand F 65 0.230 0.115 0.425 0.32 0.21 0.46 0.39 0.27 0.53 490.8 453.1 533.4Thailand F 75 0.224 0.113 0.411 0.35 0.24 0.49 0.35 0.25 0.48 504.5 468.2 544.0

Country SexMidpoint of age range
Mean juice intake
(servings/day)
Juice, lower uncertainty interval
Juice, upper uncertainty interval
Mean milk intake
(servings/day)
Milk, lower uncertainty interval
Milk, upper uncertainty interval
Mean SSB intake (servings/day)
SSB, lower uncertainty interval
SSB, upper uncertainty interval
Mean calcium intake
(servings/day)
Calcium, lower
uncertainty interval
Calcium, upper
uncertainty interval
Thailand F 90 0.215 0.110 0.389 0.38 0.26 0.54 0.32 0.23 0.44 521.1 481.0 560.1Thailand M 25 0.271 0.133 0.487 0.26 0.17 0.38 1.21 0.83 1.70 420.8 386.8 455.6Thailand M 35 0.231 0.112 0.408 0.24 0.16 0.35 0.91 0.64 1.25 424.4 393.7 455.7Thailand M 45 0.197 0.095 0.349 0.23 0.15 0.34 0.63 0.43 0.88 428.8 393.2 464.7Thailand M 55 0.194 0.096 0.340 0.25 0.17 0.37 0.51 0.36 0.71 438.8 406.0 471.2Thailand M 65 0.197 0.098 0.351 0.29 0.19 0.42 0.42 0.29 0.59 450.2 414.1 485.6Thailand M 75 0.189 0.094 0.340 0.31 0.21 0.46 0.38 0.27 0.53 462.0 427.5 495.5Thailand M 90 0.177 0.089 0.319 0.34 0.24 0.50 0.35 0.25 0.48 475.9 439.2 511.2Tajikistan F 25 0.037 0.018 0.066 0.35 0.19 0.59 0.48 0.26 0.83 617.5 462.4 796.8Tajikistan F 35 0.030 0.015 0.053 0.33 0.18 0.56 0.36 0.20 0.61 621.1 466.7 790.5Tajikistan F 45 0.025 0.012 0.044 0.31 0.17 0.54 0.24 0.13 0.41 626.0 468.7 802.6Tajikistan F 55 0.024 0.012 0.042 0.34 0.19 0.59 0.19 0.11 0.32 640.8 482.5 818.8Tajikistan F 65 0.024 0.012 0.043 0.38 0.21 0.65 0.16 0.08 0.27 658.1 492.9 846.1Tajikistan F 75 0.023 0.012 0.041 0.42 0.23 0.71 0.14 0.08 0.24 675.6 509.5 866.3Tajikistan F 90 0.022 0.011 0.039 0.45 0.25 0.77 0.13 0.07 0.22 696.7 528.3 886.4Tajikistan M 25 0.031 0.014 0.055 0.32 0.18 0.54 0.54 0.29 0.91 560.3 435.4 724.1Tajikistan M 35 0.025 0.012 0.046 0.30 0.17 0.49 0.40 0.22 0.66 563.8 438.6 722.7Tajikistan M 45 0.020 0.010 0.038 0.28 0.15 0.47 0.27 0.15 0.45 568.6 442.2 723.2Tajikistan M 55 0.020 0.010 0.036 0.31 0.17 0.53 0.22 0.12 0.36 582.6 451.5 746.2Tajikistan M 65 0.020 0.009 0.036 0.34 0.19 0.59 0.18 0.09 0.30 599.0 463.4 776.4Tajikistan M 75 0.019 0.009 0.034 0.37 0.21 0.64 0.16 0.08 0.27 614.8 476.5 798.1Tajikistan M 90 0.019 0.009 0.033 0.40 0.23 0.69 0.15 0.08 0.25 632.9 490.6 813.7Turkmenistan F 25 0.022 0.011 0.039 0.51 0.27 0.87 0.23 0.12 0.39 666.6 516.1 854.7Turkmenistan F 35 0.018 0.009 0.032 0.48 0.25 0.80 0.17 0.09 0.28 670.6 521.3 849.4Turkmenistan F 45 0.015 0.007 0.026 0.45 0.24 0.76 0.12 0.06 0.20 676.0 523.4 860.5Turkmenistan F 55 0.014 0.007 0.025 0.50 0.27 0.84 0.09 0.05 0.16 692.1 537.2 880.2Turkmenistan F 65 0.014 0.007 0.026 0.55 0.30 0.94 0.08 0.04 0.13 710.7 545.5 905.2Turkmenistan F 75 0.014 0.007 0.025 0.60 0.33 1.01 0.07 0.04 0.11 729.7 565.2 922.2Turkmenistan F 90 0.013 0.007 0.024 0.65 0.35 1.10 0.06 0.03 0.11 752.2 581.3 951.5Turkmenistan M 25 0.018 0.009 0.032 0.46 0.26 0.78 0.26 0.14 0.45 609.7 460.0 779.1Turkmenistan M 35 0.015 0.007 0.027 0.43 0.25 0.72 0.19 0.11 0.33 613.6 469.9 768.6Turkmenistan M 45 0.012 0.006 0.022 0.41 0.23 0.68 0.13 0.07 0.23 618.7 470.4 777.6Turkmenistan M 55 0.011 0.006 0.021 0.45 0.25 0.73 0.10 0.06 0.18 634.0 485.6 803.5Turkmenistan M 65 0.011 0.006 0.020 0.50 0.28 0.81 0.08 0.05 0.14 651.7 495.7 831.8Turkmenistan M 75 0.011 0.006 0.019 0.55 0.31 0.87 0.08 0.04 0.13 668.9 512.7 848.1Turkmenistan M 90 0.011 0.005 0.020 0.59 0.33 0.95 0.07 0.04 0.12 688.2 530.1 867.1Timor‐Leste F 25 0.008 0.004 0.015 0.21 0.12 0.35 0.41 0.23 0.71 530.1 405.5 667.5Timor‐Leste F 35 0.007 0.003 0.012 0.20 0.12 0.33 0.31 0.17 0.53 534.7 408.7 665.9Timor‐Leste F 45 0.005 0.003 0.010 0.20 0.11 0.33 0.22 0.12 0.37 540.2 411.4 675.9Timor‐Leste F 55 0.005 0.002 0.010 0.22 0.13 0.36 0.18 0.10 0.30 552.4 419.8 692.4Timor‐Leste F 65 0.005 0.002 0.010 0.25 0.14 0.41 0.15 0.08 0.25 566.3 429.5 712.5Timor‐Leste F 75 0.005 0.002 0.009 0.27 0.15 0.44 0.13 0.07 0.23 582.0 441.5 728.8Timor‐Leste F 90 0.005 0.002 0.009 0.29 0.16 0.48 0.12 0.07 0.21 600.3 457.4 751.8Timor‐Leste M 25 0.006 0.003 0.011 0.20 0.11 0.34 0.47 0.25 0.84 484.4 375.6 615.6Timor‐Leste M 35 0.005 0.002 0.010 0.19 0.11 0.31 0.35 0.19 0.63 488.6 378.5 614.4Timor‐Leste M 45 0.004 0.002 0.008 0.18 0.10 0.30 0.25 0.13 0.43 493.6 382.5 624.7Timor‐Leste M 55 0.004 0.002 0.008 0.20 0.11 0.34 0.20 0.11 0.34 505.2 392.3 636.9Timor‐Leste M 65 0.004 0.002 0.008 0.23 0.12 0.38 0.16 0.09 0.28 518.3 402.1 651.9Timor‐Leste M 75 0.004 0.002 0.008 0.25 0.14 0.41 0.15 0.08 0.25 531.7 414.9 665.6Timor‐Leste M 90 0.004 0.002 0.007 0.27 0.15 0.45 0.14 0.08 0.23 546.9 424.5 686.9Tonga F 25 0.284 0.136 0.516 0.35 0.20 0.60 1.20 0.65 1.99 514.8 397.1 662.5Tonga F 35 0.236 0.116 0.422 0.33 0.19 0.56 0.89 0.49 1.48 517.7 396.9 657.8Tonga F 45 0.193 0.094 0.343 0.31 0.18 0.54 0.61 0.33 1.04 521.8 396.6 664.2Tonga F 55 0.185 0.093 0.335 0.34 0.19 0.58 0.48 0.26 0.81 535.0 411.3 686.9Tonga F 65 0.185 0.093 0.339 0.38 0.21 0.64 0.40 0.21 0.65 550.3 423.7 710.2Tonga F 75 0.181 0.093 0.328 0.42 0.23 0.68 0.36 0.20 0.59 564.9 435.2 727.9Tonga F 90 0.176 0.090 0.307 0.45 0.24 0.76 0.33 0.18 0.55 582.1 449.0 748.8Tonga M 25 0.235 0.111 0.417 0.33 0.18 0.56 1.31 0.70 2.29 476.1 366.3 619.5Tonga M 35 0.194 0.094 0.341 0.31 0.17 0.51 0.98 0.54 1.68 478.6 372.8 619.7Tonga M 45 0.157 0.076 0.279 0.30 0.16 0.49 0.67 0.36 1.17 482.2 376.5 623.8Tonga M 55 0.151 0.076 0.267 0.32 0.18 0.54 0.53 0.29 0.95 494.7 385.5 636.8Tonga M 65 0.151 0.074 0.273 0.36 0.19 0.61 0.44 0.23 0.79 509.2 394.7 659.4Tonga M 75 0.148 0.073 0.268 0.39 0.21 0.67 0.40 0.21 0.73 522.6 402.0 678.0Tonga M 90 0.144 0.072 0.248 0.42 0.23 0.69 0.37 0.20 0.65 538.0 416.9 700.7Trinidad and Tobago F 25 0.222 0.105 0.401 0.77 0.44 1.26 4.69 2.51 8.06 838.6 639.1 1077.8Trinidad and Tobago F 35 0.185 0.092 0.332 0.72 0.40 1.19 3.50 1.90 5.96 843.3 646.4 1080.2Trinidad and Tobago F 45 0.152 0.075 0.280 0.68 0.38 1.14 2.37 1.29 4.00 849.9 654.7 1089.9Trinidad and Tobago F 55 0.145 0.073 0.265 0.75 0.42 1.24 1.90 1.03 3.23 870.5 669.7 1105.5Trinidad and Tobago F 65 0.143 0.070 0.263 0.83 0.46 1.38 1.59 0.86 2.75 894.3 688.1 1136.8Trinidad and Tobago F 75 0.140 0.067 0.259 0.90 0.51 1.48 1.45 0.78 2.51 918.0 707.0 1166.2Trinidad and Tobago F 90 0.136 0.065 0.252 0.98 0.55 1.60 1.33 0.72 2.29 946.5 725.0 1208.7Trinidad and Tobago M 25 0.185 0.087 0.338 0.71 0.39 1.17 5.14 2.86 8.68 764.0 583.6 968.0Trinidad and Tobago M 35 0.154 0.072 0.285 0.66 0.37 1.08 3.81 2.14 6.38 768.5 587.6 973.2Trinidad and Tobago M 45 0.126 0.059 0.239 0.63 0.35 1.02 2.56 1.40 4.31 774.6 585.9 987.1Trinidad and Tobago M 55 0.121 0.057 0.224 0.69 0.38 1.11 2.05 1.16 3.39 793.1 605.7 1004.7Trinidad and Tobago M 65 0.121 0.057 0.222 0.77 0.41 1.25 1.71 0.97 2.84 814.6 626.9 1036.7Trinidad and Tobago M 75 0.118 0.056 0.217 0.83 0.45 1.35 1.56 0.89 2.56 836.3 645.0 1063.2Trinidad and Tobago M 90 0.113 0.054 0.209 0.90 0.49 1.47 1.44 0.82 2.34 861.9 661.4 1088.5Tunisia F 25 0.166 0.080 0.303 0.59 0.33 0.97 0.74 0.43 1.20 651.1 500.0 837.6Tunisia F 35 0.139 0.068 0.247 0.56 0.31 0.93 0.57 0.33 0.93 655.5 506.3 838.6Tunisia F 45 0.114 0.055 0.196 0.54 0.30 0.92 0.41 0.23 0.68 661.3 510.8 845.9Tunisia F 55 0.109 0.054 0.190 0.60 0.33 0.99 0.33 0.19 0.55 677.8 522.6 866.0Tunisia F 65 0.109 0.053 0.193 0.66 0.37 1.09 0.28 0.15 0.46 696.7 538.2 885.6Tunisia F 75 0.107 0.053 0.187 0.71 0.40 1.17 0.25 0.14 0.42 714.6 551.1 908.1Tunisia F 90 0.104 0.051 0.178 0.77 0.44 1.30 0.23 0.13 0.38 734.8 564.6 941.3Tunisia M 25 0.136 0.067 0.253 0.55 0.30 0.92 0.83 0.45 1.34 591.9 455.0 758.8Tunisia M 35 0.114 0.057 0.205 0.51 0.28 0.84 0.62 0.35 0.98 595.7 457.2 762.6Tunisia M 45 0.093 0.046 0.172 0.49 0.27 0.80 0.43 0.24 0.69 600.7 454.5 772.2Tunisia M 55 0.090 0.045 0.166 0.54 0.30 0.88 0.35 0.19 0.55 615.6 470.5 789.9Tunisia M 65 0.090 0.045 0.168 0.60 0.33 0.97 0.29 0.16 0.47 632.4 484.1 812.5Tunisia M 75 0.087 0.044 0.162 0.65 0.36 1.06 0.27 0.15 0.43 648.5 499.4 830.0Tunisia M 90 0.084 0.042 0.153 0.71 0.39 1.15 0.25 0.14 0.39 666.4 511.8 853.9Turkey F 25 0.130 0.065 0.232 0.42 0.33 0.53 0.68 0.52 0.88 669.4 606.8 740.0Turkey F 35 0.108 0.054 0.192 0.40 0.32 0.49 0.52 0.41 0.67 674.1 617.1 739.7Turkey F 45 0.089 0.042 0.161 0.39 0.30 0.49 0.37 0.28 0.49 680.1 617.4 748.1Turkey F 55 0.085 0.042 0.154 0.42 0.33 0.53 0.30 0.23 0.39 697.1 639.7 763.5Turkey F 65 0.085 0.041 0.155 0.47 0.37 0.58 0.25 0.19 0.32 716.3 655.9 785.7Turkey F 75 0.084 0.040 0.150 0.51 0.40 0.63 0.23 0.18 0.29 734.8 675.4 802.7Turkey F 90 0.081 0.040 0.145 0.55 0.43 0.68 0.21 0.16 0.27 755.1 693.9 822.4

Country SexMidpoint of age range
Mean juice intake
(servings/day)
Juice, lower uncertainty interval
Juice, upper uncertainty interval
Mean milk intake
(servings/day)
Milk, lower uncertainty interval
Milk, upper uncertainty interval
Mean SSB intake (servings/day)
SSB, lower uncertainty interval
SSB, upper uncertainty interval
Mean calcium intake
(servings/day)
Calcium, lower
uncertainty interval
Calcium, upper
uncertainty interval
Turkey M 25 0.108 0.052 0.184 0.39 0.31 0.49 0.76 0.58 0.97 611.9 553.0 674.3Turkey M 35 0.090 0.045 0.152 0.36 0.29 0.45 0.57 0.45 0.71 615.7 560.8 672.6Turkey M 45 0.074 0.037 0.130 0.35 0.27 0.43 0.39 0.30 0.50 620.8 561.8 681.9Turkey M 55 0.071 0.036 0.123 0.38 0.30 0.47 0.32 0.25 0.40 636.2 580.4 692.8Turkey M 65 0.071 0.035 0.124 0.42 0.34 0.52 0.27 0.21 0.34 653.7 594.3 714.9Turkey M 75 0.069 0.035 0.119 0.46 0.37 0.57 0.24 0.19 0.31 670.3 614.1 728.5Turkey M 90 0.066 0.034 0.111 0.50 0.40 0.63 0.23 0.18 0.28 688.4 631.1 749.3Taiwan F 25 0.059 0.047 0.075 0.13 0.11 0.15 0.94 0.74 1.15 631.8 587.7 676.1Taiwan F 35 0.049 0.041 0.060 0.12 0.10 0.14 0.70 0.57 0.84 636.4 601.8 671.0Taiwan F 45 0.040 0.032 0.051 0.11 0.10 0.13 0.47 0.38 0.59 642.5 600.3 684.3Taiwan F 55 0.038 0.031 0.046 0.13 0.11 0.14 0.38 0.31 0.46 659.0 622.5 696.8Taiwan F 65 0.038 0.030 0.046 0.14 0.12 0.17 0.31 0.25 0.38 677.7 632.3 722.8Taiwan F 75 0.037 0.030 0.045 0.15 0.13 0.17 0.29 0.23 0.35 695.4 654.7 736.4Taiwan F 90 0.037 0.030 0.045 0.16 0.14 0.18 0.26 0.22 0.32 716.2 674.6 758.2Taiwan M 25 0.049 0.039 0.061 0.11 0.10 0.13 1.02 0.82 1.27 577.3 537.6 622.3Taiwan M 35 0.041 0.033 0.049 0.11 0.09 0.12 0.76 0.62 0.92 581.5 550.6 616.5Taiwan M 45 0.033 0.026 0.042 0.10 0.09 0.12 0.51 0.40 0.63 586.9 548.0 625.5Taiwan M 55 0.032 0.026 0.039 0.11 0.10 0.13 0.41 0.33 0.50 602.1 568.6 636.6Taiwan M 65 0.032 0.025 0.040 0.13 0.11 0.15 0.34 0.27 0.43 619.4 579.5 660.8Taiwan M 75 0.031 0.026 0.039 0.14 0.12 0.16 0.31 0.25 0.38 636.3 601.7 672.6Taiwan M 90 0.031 0.026 0.038 0.15 0.13 0.17 0.28 0.23 0.34 656.6 620.0 696.0United Republic of Tanzania F 25 0.065 0.033 0.121 0.24 0.13 0.43 0.56 0.31 1.01 413.1 318.8 537.3United Republic of Tanzania F 35 0.054 0.028 0.097 0.23 0.13 0.39 0.42 0.23 0.74 415.5 321.3 533.4United Republic of Tanzania F 45 0.044 0.023 0.078 0.21 0.12 0.38 0.29 0.15 0.51 418.9 322.8 539.6United Republic of Tanzania F 55 0.042 0.022 0.075 0.24 0.13 0.41 0.23 0.12 0.39 429.5 333.4 547.1United Republic of Tanzania F 65 0.042 0.021 0.077 0.26 0.14 0.46 0.19 0.10 0.32 441.6 340.7 563.6United Republic of Tanzania F 75 0.041 0.021 0.075 0.28 0.15 0.49 0.17 0.09 0.29 453.1 350.6 574.3United Republic of Tanzania F 90 0.040 0.020 0.072 0.31 0.17 0.54 0.16 0.08 0.27 466.1 360.5 592.8United Republic of Tanzania M 25 0.054 0.027 0.097 0.22 0.12 0.37 0.62 0.34 1.07 379.0 287.9 486.0United Republic of Tanzania M 35 0.045 0.022 0.080 0.20 0.11 0.34 0.47 0.26 0.78 381.5 293.8 487.4United Republic of Tanzania M 45 0.036 0.018 0.067 0.19 0.10 0.32 0.32 0.17 0.54 384.8 298.1 495.3United Republic of Tanzania M 55 0.035 0.017 0.062 0.21 0.12 0.35 0.25 0.14 0.42 394.3 303.4 506.8United Republic of Tanzania M 65 0.035 0.017 0.063 0.24 0.13 0.40 0.21 0.12 0.36 405.2 307.7 523.4United Republic of Tanzania M 75 0.034 0.017 0.061 0.26 0.14 0.42 0.19 0.11 0.32 415.7 315.7 533.0United Republic of Tanzania M 90 0.033 0.017 0.059 0.28 0.15 0.45 0.17 0.10 0.28 427.4 325.3 544.4Uganda F 25 0.258 0.110 0.543 0.22 0.12 0.38 0.48 0.26 0.83 405.6 309.6 526.7Uganda F 35 0.215 0.092 0.455 0.21 0.11 0.36 0.36 0.20 0.60 408.0 309.4 525.7Uganda F 45 0.175 0.072 0.366 0.20 0.10 0.35 0.24 0.14 0.41 411.4 307.9 533.6Uganda F 55 0.167 0.072 0.353 0.22 0.12 0.39 0.19 0.11 0.33 421.8 319.0 544.0Uganda F 65 0.167 0.071 0.352 0.24 0.13 0.43 0.16 0.08 0.27 433.7 326.4 558.6Uganda F 75 0.164 0.070 0.342 0.26 0.14 0.46 0.14 0.08 0.24 444.9 338.4 571.0Uganda F 90 0.159 0.069 0.336 0.29 0.15 0.49 0.13 0.07 0.23 457.6 348.9 585.0Uganda M 25 0.217 0.090 0.440 0.20 0.11 0.34 0.54 0.28 0.93 369.4 287.7 477.8Uganda M 35 0.179 0.075 0.363 0.19 0.11 0.32 0.40 0.21 0.68 371.8 290.2 479.3Uganda M 45 0.145 0.059 0.295 0.18 0.10 0.31 0.27 0.15 0.47 375.1 290.8 484.3Uganda M 55 0.139 0.056 0.278 0.20 0.11 0.33 0.22 0.12 0.37 384.3 300.7 499.5Uganda M 65 0.139 0.057 0.282 0.22 0.12 0.38 0.18 0.10 0.31 394.9 309.0 511.6Uganda M 75 0.136 0.057 0.277 0.24 0.14 0.40 0.16 0.09 0.28 405.1 319.3 522.6Uganda M 90 0.132 0.056 0.265 0.26 0.15 0.43 0.15 0.08 0.26 416.5 327.5 537.0Ukraine F 25 0.105 0.050 0.194 0.54 0.37 0.79 0.79 0.42 1.35 754.6 582.7 955.8Ukraine F 35 0.086 0.042 0.157 0.52 0.36 0.74 0.59 0.32 1.02 760.9 592.7 958.3Ukraine F 45 0.069 0.033 0.128 0.50 0.34 0.72 0.40 0.22 0.71 768.5 601.5 970.7Ukraine F 55 0.067 0.033 0.123 0.55 0.38 0.77 0.32 0.18 0.55 786.2 613.4 994.5Ukraine F 65 0.067 0.033 0.125 0.61 0.42 0.87 0.26 0.15 0.45 806.3 623.4 1030.8Ukraine F 75 0.066 0.032 0.120 0.66 0.45 0.93 0.24 0.13 0.40 826.7 640.7 1047.4Ukraine F 90 0.063 0.032 0.115 0.71 0.48 1.01 0.22 0.12 0.37 852.2 659.4 1068.1Ukraine M 25 0.087 0.045 0.156 0.49 0.33 0.71 0.87 0.45 1.53 688.6 529.2 867.3Ukraine M 35 0.072 0.037 0.128 0.47 0.31 0.66 0.65 0.35 1.10 691.9 532.8 870.8Ukraine M 45 0.058 0.028 0.106 0.45 0.30 0.63 0.44 0.24 0.76 697.0 537.4 886.2Ukraine M 55 0.056 0.028 0.099 0.50 0.34 0.70 0.35 0.19 0.60 715.4 553.9 901.5Ukraine M 65 0.056 0.028 0.100 0.57 0.38 0.80 0.29 0.16 0.49 736.7 568.1 928.4Ukraine M 75 0.055 0.028 0.098 0.61 0.41 0.85 0.26 0.15 0.45 756.4 583.1 954.8Ukraine M 90 0.053 0.028 0.092 0.65 0.44 0.91 0.24 0.13 0.42 779.5 600.2 976.1Uruguay F 25 0.432 0.213 0.795 0.50 0.26 0.86 0.99 0.53 1.68 537.5 418.8 680.4Uruguay F 35 0.359 0.178 0.644 0.47 0.25 0.77 0.74 0.40 1.25 540.7 417.4 680.5Uruguay F 45 0.292 0.143 0.532 0.45 0.24 0.74 0.52 0.28 0.88 545.1 419.8 687.2Uruguay F 55 0.280 0.138 0.500 0.49 0.26 0.82 0.41 0.22 0.69 558.6 430.7 701.0Uruguay F 65 0.279 0.137 0.506 0.55 0.30 0.93 0.33 0.18 0.56 574.1 439.4 723.4Uruguay F 75 0.274 0.136 0.498 0.60 0.32 1.00 0.30 0.16 0.51 589.2 452.8 742.4Uruguay F 90 0.265 0.134 0.491 0.65 0.34 1.07 0.27 0.15 0.47 607.8 466.1 767.1Uruguay M 25 0.356 0.172 0.647 0.45 0.25 0.75 1.08 0.62 1.80 495.1 378.4 624.6Uruguay M 35 0.295 0.145 0.525 0.43 0.23 0.69 0.81 0.46 1.33 497.9 382.6 622.6Uruguay M 45 0.240 0.115 0.425 0.41 0.22 0.67 0.55 0.31 0.92 501.8 388.2 623.8Uruguay M 55 0.230 0.116 0.398 0.45 0.24 0.72 0.44 0.25 0.72 514.3 398.3 641.3Uruguay M 65 0.230 0.113 0.397 0.50 0.27 0.82 0.36 0.20 0.58 528.6 405.6 668.8Uruguay M 75 0.226 0.112 0.382 0.54 0.30 0.88 0.33 0.18 0.53 542.7 417.2 683.3Uruguay M 90 0.219 0.110 0.386 0.58 0.32 0.94 0.30 0.17 0.49 559.4 428.3 697.0United States of America F 25 0.519 0.438 0.617 0.69 0.60 0.79 1.89 1.60 2.21 883.6 827.5 938.5United States of America F 35 0.429 0.373 0.492 0.64 0.57 0.71 1.43 1.25 1.62 888.0 841.9 931.4United States of America F 45 0.348 0.291 0.411 0.60 0.52 0.69 0.99 0.83 1.15 894.4 837.4 951.9United States of America F 55 0.343 0.298 0.395 0.65 0.58 0.73 0.78 0.67 0.90 915.7 871.2 962.6United States of America F 65 0.353 0.300 0.413 0.72 0.62 0.83 0.63 0.54 0.73 940.3 887.0 995.3United States of America F 75 0.352 0.307 0.407 0.78 0.70 0.88 0.57 0.49 0.65 964.7 919.1 1012.9United States of America F 90 0.348 0.303 0.401 0.86 0.77 0.97 0.52 0.45 0.59 995.7 944.1 1045.0United States of America M 25 0.441 0.372 0.519 0.65 0.56 0.74 2.17 1.83 2.55 809.0 759.3 861.0United States of America M 35 0.368 0.319 0.421 0.60 0.53 0.67 1.65 1.44 1.88 812.7 773.8 855.4United States of America M 45 0.303 0.252 0.358 0.56 0.49 0.65 1.16 0.99 1.36 818.1 768.6 870.4United States of America M 55 0.297 0.257 0.341 0.61 0.54 0.68 0.91 0.79 1.05 837.5 797.4 878.9United States of America M 65 0.302 0.255 0.351 0.68 0.59 0.78 0.72 0.61 0.84 860.0 813.2 911.7United States of America M 75 0.297 0.258 0.341 0.74 0.66 0.82 0.64 0.55 0.74 883.2 839.4 929.0United States of America M 90 0.289 0.250 0.332 0.82 0.73 0.91 0.57 0.49 0.65 912.0 869.7 956.5Uzbekistan F 25 0.033 0.016 0.060 0.56 0.30 0.95 0.23 0.12 0.40 682.3 521.0 876.1Uzbekistan F 35 0.027 0.014 0.048 0.52 0.29 0.88 0.17 0.09 0.29 686.6 527.6 877.8Uzbekistan F 45 0.022 0.011 0.040 0.49 0.27 0.83 0.12 0.06 0.20 692.2 528.4 891.7Uzbekistan F 55 0.021 0.011 0.038 0.54 0.30 0.91 0.09 0.05 0.15 708.6 543.9 905.1Uzbekistan F 65 0.021 0.011 0.038 0.60 0.33 1.03 0.08 0.04 0.13 727.6 555.2 924.9Uzbekistan F 75 0.021 0.011 0.037 0.65 0.36 1.11 0.07 0.04 0.11 747.0 574.5 946.6Uzbekistan F 90 0.020 0.010 0.035 0.71 0.40 1.21 0.06 0.03 0.10 770.3 594.6 976.5Uzbekistan M 25 0.027 0.013 0.047 0.51 0.28 0.85 0.26 0.14 0.45 622.8 478.8 786.4

Country SexMidpoint of age range
Mean juice intake
(servings/day)
Juice, lower uncertainty interval
Juice, upper uncertainty interval
Mean milk intake
(servings/day)
Milk, lower uncertainty interval
Milk, upper uncertainty interval
Mean SSB intake (servings/day)
SSB, lower uncertainty interval
SSB, upper uncertainty interval
Mean calcium intake
(servings/day)
Calcium, lower
uncertainty interval
Calcium, upper
uncertainty interval
Uzbekistan M 35 0.022 0.011 0.039 0.48 0.27 0.77 0.20 0.10 0.33 626.6 487.1 783.4Uzbekistan M 45 0.018 0.009 0.033 0.45 0.26 0.75 0.13 0.07 0.23 631.8 491.3 796.5Uzbekistan M 55 0.017 0.009 0.031 0.50 0.28 0.81 0.11 0.06 0.18 647.5 506.1 809.9Uzbekistan M 65 0.017 0.009 0.031 0.55 0.31 0.91 0.09 0.04 0.15 665.7 515.5 835.9Uzbekistan M 75 0.017 0.009 0.030 0.60 0.33 0.98 0.08 0.04 0.13 683.3 534.2 852.8Uzbekistan M 90 0.016 0.008 0.029 0.65 0.36 1.07 0.07 0.04 0.12 703.5 554.8 888.9Saint Vincent and the Grenadines F 25 0.386 0.197 0.697 0.58 0.31 1.00 4.05 2.19 6.81 789.0 601.9 1008.0Saint Vincent and the Grenadines F 35 0.323 0.168 0.570 0.55 0.29 0.94 3.02 1.67 5.01 793.5 602.9 1008.0Saint Vincent and the Grenadines F 45 0.265 0.137 0.470 0.52 0.28 0.88 2.05 1.13 3.42 799.7 606.4 1017.3Saint Vincent and the Grenadines F 55 0.252 0.131 0.451 0.57 0.31 0.97 1.64 0.92 2.75 819.2 623.9 1043.7Saint Vincent and the Grenadines F 65 0.250 0.125 0.449 0.63 0.35 1.08 1.37 0.77 2.37 841.7 641.3 1071.2Saint Vincent and the Grenadines F 75 0.244 0.121 0.440 0.69 0.38 1.17 1.25 0.70 2.14 864.0 659.2 1100.3Saint Vincent and the Grenadines F 90 0.238 0.119 0.425 0.75 0.41 1.27 1.15 0.63 1.96 890.6 675.0 1128.1Saint Vincent and the Grenadines M 25 0.317 0.157 0.558 0.53 0.30 0.93 4.46 2.54 7.50 719.6 553.7 919.8Saint Vincent and the Grenadines M 35 0.264 0.135 0.470 0.50 0.28 0.86 3.31 1.87 5.57 723.8 555.5 925.5Saint Vincent and the Grenadines M 45 0.216 0.111 0.392 0.47 0.26 0.79 2.22 1.25 3.70 729.5 559.7 943.2Saint Vincent and the Grenadines M 55 0.208 0.106 0.372 0.52 0.29 0.88 1.78 1.00 3.00 747.0 571.0 955.5Saint Vincent and the Grenadines M 65 0.207 0.104 0.366 0.58 0.33 0.98 1.49 0.83 2.55 767.5 584.7 974.3Saint Vincent and the Grenadines M 75 0.202 0.101 0.351 0.62 0.35 1.04 1.36 0.77 2.29 788.0 601.7 1000.5Saint Vincent and the Grenadines M 90 0.194 0.097 0.334 0.67 0.38 1.13 1.25 0.72 2.10 812.0 625.0 1032.8Venezuela (Bolivarian Republic of) F 25 0.559 0.288 1.014 0.90 0.48 1.51 3.00 1.64 5.07 699.4 535.5 895.2Venezuela (Bolivarian Republic of) F 35 0.463 0.240 0.832 0.85 0.46 1.44 2.34 1.30 3.91 704.6 539.4 891.0Venezuela (Bolivarian Republic of) F 45 0.375 0.194 0.663 0.81 0.44 1.39 1.71 0.93 2.81 711.3 543.9 901.7Venezuela (Bolivarian Republic of) F 55 0.360 0.189 0.623 0.88 0.48 1.50 1.37 0.75 2.23 728.9 561.9 931.1Venezuela (Bolivarian Republic of) F 65 0.360 0.186 0.634 0.98 0.52 1.65 1.10 0.61 1.84 748.8 580.3 956.8Venezuela (Bolivarian Republic of) F 75 0.353 0.186 0.613 1.06 0.58 1.80 0.99 0.54 1.64 767.6 596.9 979.5Venezuela (Bolivarian Republic of) F 90 0.342 0.180 0.589 1.15 0.63 1.98 0.89 0.48 1.48 789.7 610.8 995.9Venezuela (Bolivarian Republic of) M 25 0.475 0.244 0.839 0.83 0.44 1.38 3.27 1.76 5.60 643.9 501.1 802.6Venezuela (Bolivarian Republic of) M 35 0.392 0.205 0.687 0.78 0.43 1.27 2.54 1.40 4.22 647.6 509.7 809.4Venezuela (Bolivarian Republic of) M 45 0.317 0.162 0.547 0.74 0.40 1.23 1.86 1.02 3.10 652.7 509.4 817.5Venezuela (Bolivarian Republic of) M 55 0.305 0.160 0.523 0.82 0.45 1.35 1.49 0.82 2.52 669.5 527.9 838.9Venezuela (Bolivarian Republic of) M 65 0.306 0.160 0.530 0.91 0.49 1.53 1.21 0.65 2.10 688.8 539.5 867.1Venezuela (Bolivarian Republic of) M 75 0.300 0.160 0.513 0.99 0.53 1.65 1.09 0.59 1.87 706.9 553.7 883.6Venezuela (Bolivarian Republic of) M 90 0.292 0.153 0.496 1.07 0.59 1.80 0.99 0.53 1.64 727.9 569.7 918.1Viet Nam F 25 0.033 0.016 0.058 0.16 0.08 0.28 0.42 0.23 0.72 488.8 378.4 613.9Viet Nam F 35 0.028 0.014 0.048 0.15 0.08 0.26 0.32 0.18 0.54 493.0 382.7 616.0Viet Nam F 45 0.023 0.012 0.040 0.15 0.08 0.24 0.22 0.12 0.37 498.0 386.6 624.4Viet Nam F 55 0.022 0.011 0.040 0.16 0.09 0.27 0.18 0.10 0.30 509.3 395.3 637.7Viet Nam F 65 0.022 0.011 0.040 0.18 0.10 0.31 0.15 0.08 0.24 522.2 403.0 654.0Viet Nam F 75 0.022 0.011 0.038 0.20 0.11 0.34 0.13 0.07 0.22 536.8 420.8 671.7Viet Nam F 90 0.021 0.010 0.036 0.22 0.11 0.36 0.12 0.07 0.21 554.3 439.5 698.7Viet Nam M 25 0.026 0.013 0.047 0.14 0.08 0.25 0.46 0.26 0.78 448.5 343.1 584.7Viet Nam M 35 0.022 0.011 0.040 0.13 0.07 0.23 0.35 0.20 0.57 452.4 346.6 593.6Viet Nam M 45 0.019 0.009 0.034 0.13 0.07 0.22 0.24 0.13 0.41 457.1 348.7 602.6Viet Nam M 55 0.018 0.009 0.034 0.14 0.08 0.25 0.20 0.11 0.33 467.7 356.2 609.7Viet Nam M 65 0.019 0.009 0.034 0.16 0.09 0.28 0.16 0.09 0.27 479.8 369.7 618.3Viet Nam M 75 0.018 0.009 0.033 0.17 0.10 0.30 0.15 0.08 0.24 492.4 377.1 637.2Viet Nam M 90 0.017 0.008 0.031 0.19 0.11 0.33 0.13 0.08 0.22 507.2 382.5 662.6Vanuatu F 25 0.257 0.123 0.465 0.27 0.15 0.46 0.74 0.42 1.26 483.5 376.1 603.6Vanuatu F 35 0.214 0.105 0.380 0.26 0.14 0.44 0.55 0.32 0.92 486.2 381.0 604.3Vanuatu F 45 0.174 0.085 0.313 0.24 0.13 0.43 0.38 0.21 0.64 490.1 379.3 613.0Vanuatu F 55 0.168 0.082 0.296 0.27 0.14 0.47 0.30 0.17 0.51 502.5 387.7 624.6Vanuatu F 65 0.168 0.082 0.298 0.30 0.16 0.53 0.25 0.13 0.42 516.8 397.1 645.8Vanuatu F 75 0.164 0.082 0.290 0.32 0.18 0.58 0.23 0.12 0.38 530.3 409.1 660.6Vanuatu F 90 0.159 0.079 0.282 0.35 0.19 0.62 0.21 0.12 0.34 545.8 420.8 686.1Vanuatu M 25 0.210 0.105 0.376 0.25 0.13 0.42 0.81 0.44 1.36 448.3 338.9 577.3Vanuatu M 35 0.174 0.088 0.311 0.24 0.12 0.39 0.61 0.34 1.01 450.5 346.1 582.4Vanuatu M 45 0.140 0.070 0.255 0.23 0.12 0.38 0.42 0.23 0.70 453.9 347.3 583.9Vanuatu M 55 0.135 0.069 0.246 0.25 0.14 0.41 0.33 0.18 0.55 465.7 360.3 600.1Vanuatu M 65 0.135 0.068 0.252 0.28 0.15 0.46 0.27 0.15 0.46 479.3 369.5 621.0Vanuatu M 75 0.132 0.068 0.242 0.30 0.16 0.50 0.25 0.14 0.41 491.9 378.2 634.6Vanuatu M 90 0.128 0.066 0.235 0.33 0.17 0.54 0.23 0.13 0.38 506.2 387.2 649.9Samoa F 25 0.608 0.274 1.180 0.25 0.13 0.43 0.87 0.46 1.48 472.6 436.5 510.9Samoa F 35 0.504 0.233 0.950 0.23 0.13 0.40 0.65 0.35 1.08 475.3 445.9 506.8Samoa F 45 0.411 0.190 0.771 0.22 0.12 0.38 0.44 0.24 0.72 479.0 442.3 518.7Samoa F 55 0.395 0.187 0.730 0.24 0.13 0.41 0.35 0.19 0.57 491.2 459.2 523.1Samoa F 65 0.396 0.184 0.738 0.27 0.15 0.45 0.29 0.16 0.48 505.1 467.4 543.2Samoa F 75 0.387 0.182 0.711 0.29 0.16 0.50 0.26 0.14 0.43 518.5 484.2 551.7Samoa F 90 0.375 0.175 0.699 0.32 0.18 0.54 0.24 0.13 0.40 534.3 502.4 568.9Samoa M 25 0.499 0.234 0.935 0.23 0.12 0.39 0.95 0.54 1.62 433.4 400.5 467.5Samoa M 35 0.411 0.196 0.779 0.21 0.12 0.35 0.71 0.41 1.19 435.7 408.9 463.7

Country SexMidpoint of age range
Mean juice intake
(servings/day)
Juice, lower uncertainty interval
Juice, upper uncertainty interval
Mean milk intake
(servings/day)
Milk, lower uncertainty interval
Milk, upper uncertainty interval
Mean SSB intake (servings/day)
SSB, lower uncertainty interval
SSB, upper uncertainty interval
Mean calcium intake
(servings/day)
Calcium, lower
uncertainty interval
Calcium, upper
uncertainty interval
Samoa M 45 0.333 0.154 0.653 0.20 0.11 0.34 0.49 0.27 0.83 439.0 406.0 471.8Samoa M 55 0.320 0.152 0.600 0.22 0.12 0.37 0.39 0.22 0.65 450.5 421.7 478.0Samoa M 65 0.320 0.151 0.581 0.25 0.14 0.41 0.32 0.18 0.54 463.6 431.3 497.7Samoa M 75 0.314 0.148 0.569 0.27 0.15 0.44 0.29 0.17 0.48 475.8 446.0 505.8Samoa M 90 0.305 0.145 0.562 0.29 0.16 0.48 0.26 0.16 0.44 489.7 458.0 521.0Yemen F 25 0.159 0.080 0.283 0.32 0.18 0.53 0.81 0.44 1.38 564.6 433.3 725.1Yemen F 35 0.133 0.066 0.234 0.30 0.17 0.50 0.62 0.35 1.05 568.6 439.5 725.4Yemen F 45 0.109 0.053 0.195 0.29 0.16 0.49 0.44 0.24 0.74 573.7 442.2 730.2Yemen F 55 0.105 0.051 0.190 0.32 0.18 0.53 0.36 0.20 0.61 588.0 454.7 752.8Yemen F 65 0.105 0.051 0.196 0.35 0.19 0.59 0.30 0.17 0.51 604.2 466.0 778.4Yemen F 75 0.103 0.050 0.189 0.38 0.21 0.64 0.27 0.15 0.46 619.7 477.5 790.2Yemen F 90 0.100 0.048 0.177 0.41 0.23 0.70 0.25 0.14 0.42 637.3 488.7 811.2Yemen M 25 0.126 0.065 0.225 0.29 0.16 0.48 0.93 0.50 1.57 513.7 390.2 661.0Yemen M 35 0.106 0.054 0.182 0.27 0.15 0.44 0.70 0.38 1.17 517.0 391.8 657.0Yemen M 45 0.086 0.042 0.150 0.25 0.14 0.42 0.48 0.25 0.81 521.3 395.5 662.3Yemen M 55 0.083 0.042 0.146 0.28 0.16 0.45 0.39 0.21 0.64 534.2 408.0 681.5Yemen M 65 0.083 0.043 0.150 0.31 0.17 0.51 0.33 0.17 0.55 549.0 418.5 706.8Yemen M 75 0.081 0.042 0.144 0.34 0.19 0.56 0.30 0.16 0.50 562.8 430.7 721.1Yemen M 90 0.078 0.040 0.138 0.37 0.21 0.62 0.28 0.15 0.47 578.3 445.2 738.2South Africa F 25 0.031 0.025 0.037 0.67 0.57 0.77 1.07 0.90 1.27 460.5 429.9 488.3South Africa F 35 0.025 0.022 0.029 0.63 0.56 0.70 0.80 0.70 0.92 463.8 443.6 483.6South Africa F 45 0.021 0.017 0.025 0.60 0.52 0.69 0.55 0.46 0.65 468.0 439.1 496.7South Africa F 55 0.020 0.017 0.023 0.65 0.59 0.73 0.44 0.38 0.50 478.7 458.0 499.3South Africa F 65 0.020 0.017 0.023 0.73 0.63 0.83 0.36 0.31 0.42 491.0 464.2 521.5South Africa F 75 0.019 0.017 0.022 0.79 0.71 0.87 0.33 0.28 0.37 503.9 481.6 527.1South Africa F 90 0.019 0.017 0.021 0.86 0.78 0.95 0.30 0.27 0.34 519.1 497.2 542.3South Africa M 25 0.025 0.021 0.030 0.61 0.52 0.70 1.19 0.99 1.40 421.6 395.6 451.0South Africa M 35 0.021 0.018 0.024 0.57 0.51 0.63 0.89 0.78 1.01 424.3 405.6 443.9South Africa M 45 0.017 0.014 0.020 0.54 0.47 0.62 0.61 0.51 0.72 427.8 402.6 455.5South Africa M 55 0.016 0.014 0.019 0.59 0.53 0.66 0.48 0.42 0.55 437.9 418.6 457.9South Africa M 65 0.016 0.014 0.019 0.66 0.58 0.75 0.40 0.33 0.46 449.5 425.1 475.4South Africa M 75 0.016 0.014 0.018 0.72 0.65 0.79 0.36 0.31 0.41 461.5 442.3 483.5South Africa M 90 0.016 0.014 0.018 0.78 0.71 0.85 0.33 0.29 0.37 475.1 454.8 496.4Zambia F 25 0.004 0.002 0.007 0.12 0.06 0.21 0.69 0.36 1.16 350.7 272.9 453.9Zambia F 35 0.003 0.001 0.006 0.11 0.06 0.19 0.51 0.28 0.86 352.7 273.7 451.0Zambia F 45 0.003 0.001 0.005 0.11 0.06 0.19 0.35 0.19 0.59 355.5 273.8 453.0Zambia F 55 0.002 0.001 0.005 0.12 0.06 0.20 0.28 0.15 0.46 364.6 281.2 465.7Zambia F 65 0.002 0.001 0.005 0.13 0.07 0.22 0.23 0.12 0.38 374.9 288.5 483.9Zambia F 75 0.002 0.001 0.005 0.14 0.08 0.24 0.21 0.11 0.34 384.6 297.6 491.4Zambia F 90 0.002 0.001 0.004 0.15 0.08 0.27 0.19 0.10 0.32 395.6 307.8 499.3Zambia M 25 0.003 0.001 0.006 0.11 0.06 0.18 0.77 0.43 1.35 320.3 242.1 411.9Zambia M 35 0.003 0.001 0.005 0.10 0.05 0.17 0.58 0.32 1.00 322.5 243.9 414.2Zambia M 45 0.002 0.001 0.004 0.09 0.05 0.16 0.39 0.21 0.67 325.2 246.2 414.7Zambia M 55 0.002 0.001 0.004 0.10 0.06 0.17 0.31 0.17 0.53 333.3 252.2 424.3Zambia M 65 0.002 0.001 0.004 0.12 0.06 0.20 0.26 0.14 0.45 342.5 258.5 439.0Zambia M 75 0.002 0.001 0.004 0.13 0.07 0.21 0.23 0.13 0.40 351.3 265.2 448.3Zambia M 90 0.002 0.001 0.004 0.14 0.07 0.23 0.22 0.12 0.37 361.2 273.6 461.3Zimbabwe F 25 0.020 0.010 0.035 0.56 0.31 0.93 1.37 0.74 2.33 439.3 339.3 550.9Zimbabwe F 35 0.016 0.008 0.029 0.53 0.29 0.89 1.03 0.56 1.73 442.4 344.2 551.7Zimbabwe F 45 0.013 0.006 0.024 0.51 0.28 0.85 0.70 0.38 1.20 446.5 348.6 557.8Zimbabwe F 55 0.013 0.006 0.022 0.55 0.31 0.93 0.55 0.30 0.94 456.8 354.5 569.9Zimbabwe F 65 0.013 0.006 0.022 0.61 0.34 1.04 0.45 0.24 0.75 468.5 363.3 585.4Zimbabwe F 75 0.012 0.006 0.022 0.66 0.37 1.12 0.41 0.22 0.69 480.8 372.9 599.0Zimbabwe F 90 0.012 0.006 0.021 0.72 0.39 1.20 0.38 0.21 0.63 495.4 382.3 614.4Zimbabwe M 25 0.017 0.008 0.032 0.51 0.27 0.83 1.52 0.86 2.62 403.2 315.4 511.1Zimbabwe M 35 0.014 0.007 0.026 0.47 0.26 0.79 1.14 0.64 1.94 405.7 318.7 510.7Zimbabwe M 45 0.011 0.006 0.021 0.45 0.25 0.76 0.77 0.42 1.33 409.0 320.4 516.2Zimbabwe M 55 0.011 0.005 0.020 0.49 0.28 0.83 0.61 0.33 1.04 418.8 327.7 527.0Zimbabwe M 65 0.011 0.005 0.020 0.55 0.30 0.91 0.50 0.28 0.85 429.9 337.8 545.6Zimbabwe M 75 0.011 0.005 0.019 0.60 0.33 0.99 0.46 0.25 0.77 441.4 346.4 559.6Zimbabwe M 90 0.010 0.005 0.018 0.65 0.36 1.07 0.42 0.24 0.71 454.7 355.1 580.2

Table C. Regional consumption of SSBs, fruit juice, milk,and calcium in 2010.
SSB
(servings/day)
Fruit Juice
(servings/day)
Milk
(servings/day)
Calcium
(mg/day)
Women
Ages 20 to 39 0.42 (0.22,0.73) 0.09 (0.04,0.16) 0.52 (0.32,0.80) 677 (518,866)Ages 40 to 59 0.22 (0.11,0.38) 0.06 (0.03,0.11) 0.50 (0.31,0.77) 692 (530,884)
Ages 60 and older 0.15 (0.08,0.25) 0.06 (0.03,0.11) 0.63 (0.39,0.98) 740 (567,942)Overall 0.25 (0.13,0.42) 0.07 (0.03,0.12) 0.56 (0.35,0.87) 708 (543,903)Men
Ages 20 to 39 0.47 (0.25,0.80) 0.07 (0.04,0.13) 0.47 (0.29,0.73) 616 (474,781)Ages 40 to 59 0.24 (0.13,0.42) 0.05 (0.03,0.10) 0.46 (0.28,0.70) 631 (487,798)
Ages 60 and older 0.16 (0.09,0.28) 0.05 (0.02,0.09) 0.58 (0.36,0.88) 674 (520,858)Overall 0.27 (0.15,0.47) 0.06 (0.03,0.10) 0.51 (0.32,0.79) 645 (498,819)
Both sexes overall 0.26 (0.15,0.42) 0.06 (0.03,0.11) 0.54 (0.35,0.80) 678 (535,845)
Women
Ages 20 to 39 0.33 (0.26,0.42) 0.02 (0.02,0.02) 0.08 (0.06,0.09) 445 (394,503)Ages 40 to 59 0.17 (0.14,0.22) 0.01 (0.01,0.02) 0.07 (0.06,0.09) 456 (405,516)
Ages 60 and older 0.12 (0.09,0.15) 0.01 (0.01,0.02) 0.09 (0.07,0.11) 488 (434,552)Overall 0.20 (0.15,0.25) 0.02 (0.01,0.02) 0.08 (0.07,0.10) 467 (414,528)Men
Ages 20 to 39 0.36 (0.28,0.46) 0.02 (0.01,0.02) 0.07 (0.05,0.08) 406 (359,460)Ages 40 to 59 0.19 (0.15,0.24) 0.01 (0.01,0.01) 0.07 (0.05,0.08) 416 (369,469)
Ages 60 and older 0.13 (0.10,0.16) 0.01 (0.01,0.01) 0.09 (0.07,0.11) 446 (396,500)Overall 0.21 (0.17,0.27) 0.01 (0.01,0.02) 0.07 (0.06,0.09) 426 (378,480)
Both sexes overall 0.20 (0.16,0.25) 0.01 (0.01,0.02) 0.08 (0.06,0.10) 447 (401,499)
Women
Ages 20 to 39 0.44 (0.23,0.76) 0.02 (0.01,0.04) 0.29 (0.20,0.40) 463 (387,551)Ages 40 to 59 0.23 (0.13,0.40) 0.02 (0.01,0.03) 0.29 (0.21,0.39) 474 (397,563)
Ages 60 and older 0.16 (0.08,0.27) 0.02 (0.01,0.03) 0.36 (0.26,0.50) 507 (424,604)Overall 0.26 (0.14,0.45) 0.02 (0.01,0.03) 0.32 (0.23,0.44) 485 (406,577)Men
Ages 20 to 39 0.48 (0.26,0.81) 0.02 (0.01,0.04) 0.26 (0.19,0.37) 424 (351,508)Ages 40 to 59 0.25 (0.14,0.43) 0.01 (0.01,0.03) 0.26 (0.19,0.36) 434 (360,521)
Ages 65 and older 0.17 (0.09,0.29) 0.01 (0.01,0.03) 0.33 (0.24,0.46) 464 (385,555)Overall 0.28 (0.15,0.48) 0.02 (0.01,0.03) 0.29 (0.21,0.41) 444 (368,532)
Both sexes overall 0.27 (0.16,0.44) 0.02 (0.01,0.03) 0.31 (0.23,0.41) 464 (394,545)
Women
Ages 20 to 39 0.58 (0.34,0.94) 0.11 (0.07,0.19) 0.36 (0.25,0.52) 559 (458,673)Ages 40 to 59 0.32 (0.19,0.51) 0.08 (0.05,0.14) 0.36 (0.25,0.52) 573 (471,692)
Ages 60 and older 0.21 (0.13,0.34) 0.08 (0.05,0.13) 0.47 (0.32,0.67) 612 (503,736)Overall 0.35 (0.20,0.56) 0.09 (0.05,0.15) 0.41 (0.28,0.58) 586 (481,705)
Mean (95%UI) of beverage intakes
Asia, Central
Asia, East
Asia, South
Asia, Southeast

Men
Ages 20 to 39 0.64 (0.37,1.05) 0.09 (0.05,0.15) 0.34 (0.23,0.49) 512 (421,623)Ages 40 to 59 0.35 (0.20,0.56) 0.07 (0.04,0.11) 0.33 (0.23,0.47) 525 (431,639)
Ages 60 and older 0.23 (0.14,0.37) 0.07 (0.04,0.11) 0.42 (0.29,0.61) 560 (460,679)Overall 0.38 (0.22,0.62) 0.07 (0.04,0.12) 0.37 (0.26,0.53) 536 (441,651)
Both sexes overall 0.37 (0.23,0.57) 0.08 (0.05,0.13) 0.39 (0.28,0.54) 562 (470,667)
Women
Ages 20 to 39 0.42 (0.31,0.57) 0.26 (0.15,0.41) 0.43 (0.32,0.58) 582 (536,631)Ages 40 to 59 0.22 (0.16,0.30) 0.19 (0.11,0.30) 0.43 (0.31,0.58) 598 (551,646)
Ages 60 and older 0.15 (0.11,0.20) 0.18 (0.11,0.29) 0.53 (0.39,0.71) 638 (589,688)Overall 0.25 (0.18,0.33) 0.20 (0.12,0.33) 0.47 (0.35,0.64) 610 (563,660)Men
Ages 20 to 39 0.49 (0.37,0.66) 0.21 (0.13,0.33) 0.39 (0.29,0.53) 531 (490,576)Ages 40 to 59 0.27 (0.20,0.36) 0.15 (0.09,0.24) 0.37 (0.27,0.50) 545 (504,591)
Ages 60 and older 0.17 (0.13,0.23) 0.14 (0.09,0.23) 0.48 (0.36,0.65) 583 (539,632)Overall 0.29 (0.22,0.39) 0.16 (0.10,0.26) 0.42 (0.31,0.57) 558 (515,604)
Both sexes overall 0.27 (0.21,0.35) 0.18 (0.12,0.28) 0.45 (0.34,0.59) 584 (544,628)
Women
Ages 20 to 39 0.59 (0.49,0.70) 0.92 (0.47,1.66) 0.59 (0.51,0.69) 696 (650,742)Ages 40 to 59 0.31 (0.26,0.37) 0.67 (0.34,1.20) 0.58 (0.50,0.67) 714 (669,762)
Ages 60 and older 0.21 (0.18,0.25) 0.64 (0.33,1.14) 0.74 (0.64,0.85) 763 (715,813)Overall 0.35 (0.29,0.41) 0.73 (0.37,1.31) 0.65 (0.56,0.75) 730 (683,778)Men
Ages 20 to 39 0.65 (0.54,0.77) 0.75 (0.37,1.35) 0.54 (0.46,0.63) 635 (592,680)Ages 40 to 59 0.34 (0.29,0.41) 0.54 (0.27,0.98) 0.52 (0.45,0.60) 651 (608,697)
Ages 60 and older 0.23 (0.19,0.27) 0.52 (0.26,0.92) 0.67 (0.58,0.77) 698 (653,743)Overall 0.38 (0.32,0.46) 0.59 (0.30,1.06) 0.59 (0.51,0.68) 667 (623,712)
Both sexes overall 0.37 (0.31,0.43) 0.66 (0.36,1.13) 0.62 (0.55,0.71) 699 (658,741)
Women
Ages 20 to 39 3.15 (1.86,5.09) 0.35 (0.18,0.61) 0.70 (0.41,1.11) 820 (647,1026)Ages 40 to 59 1.65 (0.97,2.66) 0.26 (0.14,0.44) 0.67 (0.39,1.07) 839 (663,1049)
Ages 60 and older 1.12 (0.66,1.80) 0.24 (0.13,0.42) 0.85 (0.50,1.35) 897 (710,1119)Overall 1.85 (1.09,2.99) 0.28 (0.15,0.48) 0.75 (0.44,1.20) 858 (679,1072)Men
Ages 20 to 39 3.44 (2.03,5.57) 0.29 (0.15,0.49) 0.65 (0.38,1.04) 751 (595,937)Ages 40 to 59 1.78 (1.05,2.86) 0.21 (0.11,0.36) 0.62 (0.37,1.00) 768 (610,959)
Ages 60 and older 1.21 (0.72,1.94) 0.20 (0.11,0.34) 0.78 (0.47,1.25) 821 (652,1024)Overall 2.01 (1.19,3.24) 0.23 (0.12,0.39) 0.70 (0.42,1.12) 786 (624,981)
Both sexes overall 1.93 (1.20,2.98) 0.25 (0.14,0.42) 0.73 (0.45,1.11) 823 (667,1008)
Women
Ages 20 to 39 0.42 (0.27,0.63) 0.25 (0.15,0.39) 0.72 (0.50,1.00) 618 (512,745)Ages 40 to 59 0.22 (0.14,0.33) 0.18 (0.11,0.28) 0.71 (0.50,0.99) 632 (523,761)
Asia‐Pacific high‐income
Australasia
Caribbean
Europe, Central

Ages 60 and older 0.15 (0.10,0.23) 0.17 (0.10,0.26) 0.91 (0.65,1.28) 677 (560,813)Overall 0.25 (0.16,0.37) 0.19 (0.12,0.30) 0.80 (0.56,1.12) 647 (536,779)Men
Ages 20 to 39 0.49 (0.31,0.74) 0.20 (0.12,0.32) 0.66 (0.46,0.92) 568 (467,687)Ages 40 to 59 0.25 (0.16,0.38) 0.14 (0.08,0.23) 0.64 (0.45,0.89) 577 (474,698)
Ages 60 and older 0.17 (0.11,0.25) 0.14 (0.08,0.22) 0.84 (0.59,1.16) 618 (509,748)Overall 0.28 (0.18,0.43) 0.16 (0.09,0.25) 0.73 (0.51,1.02) 592 (487,716)
Both sexes overall 0.27 (0.18,0.39) 0.17 (0.11,0.27) 0.77 (0.56,1.04) 620 (522,736)
Women
Ages 20 to 39 0.56 (0.32,0.91) 0.13 (0.07,0.22) 0.71 (0.54,0.92) 766 (642,908)Ages 40 to 59 0.29 (0.17,0.48) 0.09 (0.05,0.16) 0.70 (0.53,0.91) 786 (661,930)
Ages 60 and older 0.19 (0.11,0.32) 0.09 (0.05,0.15) 0.88 (0.68,1.14) 837 (706,988)Overall 0.33 (0.19,0.53) 0.10 (0.06,0.17) 0.78 (0.60,1.01) 802 (675,949)Men
Ages 20 to 39 0.61 (0.35,0.99) 0.11 (0.06,0.18) 0.64 (0.49,0.83) 699 (587,830)Ages 40 to 59 0.32 (0.18,0.52) 0.08 (0.04,0.13) 0.64 (0.49,0.82) 716 (601,850)
Ages 60 and older 0.21 (0.12,0.35) 0.07 (0.04,0.12) 0.82 (0.63,1.05) 768 (646,908)Overall 0.36 (0.20,0.58) 0.08 (0.05,0.14) 0.72 (0.55,0.92) 733 (616,869)
Both sexes overall 0.34 (0.21,0.53) 0.09 (0.06,0.15) 0.75 (0.59,0.95) 770 (658,898)
Women
Ages 20 to 39 0.66 (0.48,0.88) 0.39 (0.29,0.53) 0.82 (0.64,1.06) 909 (814,1019)Ages 40 to 59 0.31 (0.23,0.42) 0.27 (0.20,0.36) 0.79 (0.61,1.02) 931 (833,1043)
Ages 60 and older 0.22 (0.16,0.29) 0.27 (0.20,0.36) 0.98 (0.76,1.26) 991 (887,1109)Overall 0.37 (0.27,0.50) 0.30 (0.22,0.41) 0.88 (0.68,1.13) 950 (850,1064)Men
Ages 20 to 39 0.76 (0.56,1.03) 0.32 (0.23,0.42) 0.77 (0.60,0.99) 836 (747,936)Ages 40 to 59 0.34 (0.25,0.47) 0.22 (0.16,0.29) 0.70 (0.54,0.90) 851 (762,952)
Ages 60 and older 0.23 (0.17,0.31) 0.21 (0.16,0.29) 0.88 (0.68,1.13) 905 (811,1013)Overall 0.42 (0.30,0.56) 0.24 (0.18,0.33) 0.80 (0.62,1.03) 870 (779,974)
Both sexes overall 0.39 (0.30,0.51) 0.27 (0.21,0.36) 0.84 (0.67,1.06) 911 (824,1009)
Women
Ages 20 to 39 1.38 (0.74,2.35) 0.48 (0.24,0.86) 0.50 (0.27,0.85) 639 (488,825)Ages 40 to 59 0.72 (0.38,1.23) 0.35 (0.17,0.62) 0.48 (0.26,0.82) 655 (504,838)
Ages 60 and older 0.48 (0.26,0.82) 0.33 (0.17,0.60) 0.61 (0.33,1.03) 700 (538,900)Overall 0.80 (0.43,1.37) 0.38 (0.19,0.68) 0.54 (0.29,0.92) 670 (514,861)Men
Ages 20 to 39 1.48 (0.82,2.46) 0.39 (0.19,0.72) 0.47 (0.25,0.79) 585 (449,754)Ages 40 to 59 0.77 (0.42,1.31) 0.28 (0.14,0.53) 0.45 (0.24,0.77) 599 (462,769)
Ages 60 and older 0.51 (0.29,0.87) 0.27 (0.13,0.50) 0.57 (0.31,0.96) 640 (493,816)Overall 0.86 (0.48,1.45) 0.31 (0.15,0.57) 0.51 (0.27,0.86) 613 (472,785)
Both sexes overall 0.83 (0.49,1.34) 0.35 (0.18,0.60) 0.52 (0.30,0.85) 642 (506,805)
Women
Latin America, Andean
Latin America, Central
Europe, Eastern
Europe, Western

Ages 20 to 39 2.52 (1.48,4.07) 0.50 (0.25,0.89) 1.02 (0.63,1.60) 730 (587,894)Ages 40 to 59 1.45 (0.85,2.35) 0.36 (0.18,0.63) 0.99 (0.61,1.54) 748 (600,919)
Ages 60 and older 0.94 (0.55,1.51) 0.34 (0.18,0.61) 1.25 (0.77,1.94) 799 (645,980)Overall 1.54 (0.90,2.48) 0.39 (0.20,0.70) 1.11 (0.68,1.73) 765 (615,938)Men
Ages 20 to 39 2.75 (1.62,4.41) 0.42 (0.21,0.74) 0.92 (0.57,1.44) 669 (543,819)Ages 40 to 59 1.58 (0.93,2.54) 0.30 (0.15,0.53) 0.90 (0.55,1.40) 685 (558,839)
Ages 60 and older 1.03 (0.61,1.66) 0.29 (0.14,0.52) 1.14 (0.70,1.79) 734 (597,898)Overall 1.68 (0.99,2.70) 0.33 (0.16,0.58) 1.01 (0.62,1.58) 702 (570,859)
Both sexes overall 1.61 (1.00,2.48) 0.36 (0.20,0.61) 1.06 (0.69,1.59) 734 (606,883)
Women
Ages 20 to 39 0.93 (0.60,1.39) 0.36 (0.18,0.65) 0.45 (0.30,0.66) 528 (439,630)Ages 40 to 59 0.50 (0.32,0.75) 0.26 (0.13,0.47) 0.43 (0.29,0.64) 540 (449,644)
Ages 60 and older 0.32 (0.21,0.49) 0.25 (0.13,0.45) 0.55 (0.37,0.81) 578 (480,692)Overall 0.55 (0.35,0.82) 0.29 (0.14,0.51) 0.49 (0.33,0.72) 553 (459,661)Men
Ages 20 to 39 1.02 (0.67,1.53) 0.30 (0.15,0.53) 0.41 (0.28,0.60) 487 (404,584)Ages 40 to 59 0.53 (0.35,0.80) 0.22 (0.11,0.38) 0.40 (0.27,0.58) 499 (414,596)
Ages 60 and older 0.35 (0.23,0.52) 0.21 (0.11,0.36) 0.50 (0.34,0.74) 533 (443,639)Overall 0.60 (0.39,0.89) 0.23 (0.12,0.42) 0.45 (0.30,0.66) 510 (423,611)
Both sexes overall 0.57 (0.39,0.82) 0.26 (0.14,0.45) 0.47 (0.33,0.67) 532 (450,627)
Women
Ages 20 to 39 0.59 (0.43,0.82) 0.26 (0.20,0.34) 0.39 (0.29,0.53) 537 (461,629)Ages 40 to 59 0.32 (0.23,0.44) 0.19 (0.14,0.24) 0.38 (0.28,0.51) 550 (471,644)
Ages 60 and older 0.21 (0.16,0.30) 0.18 (0.14,0.23) 0.48 (0.36,0.64) 589 (505,690)Overall 0.35 (0.25,0.49) 0.20 (0.16,0.26) 0.43 (0.32,0.57) 563 (483,659)Men
Ages 20 to 39 0.65 (0.48,0.90) 0.21 (0.16,0.28) 0.36 (0.26,0.49) 491 (423,569)Ages 40 to 59 0.35 (0.25,0.49) 0.15 (0.12,0.20) 0.34 (0.25,0.47) 503 (433,582)
Ages 60 and older 0.23 (0.17,0.32) 0.15 (0.11,0.19) 0.43 (0.32,0.59) 538 (465,621)Overall 0.39 (0.28,0.53) 0.17 (0.13,0.22) 0.38 (0.29,0.53) 514 (444,595)
Both sexes overall 0.37 (0.28,0.49) 0.18 (0.15,0.24) 0.41 (0.31,0.54) 539 (470,618)
Women
Ages 20 to 39 0.70 (0.41,1.14) 0.23 (0.12,0.41) 0.57 (0.34,0.89) 643 (518,791)Ages 40 to 59 0.39 (0.23,0.64) 0.17 (0.09,0.30) 0.56 (0.34,0.88) 659 (531,812)
Ages 60 and older 0.27 (0.16,0.44) 0.16 (0.09,0.28) 0.70 (0.42,1.11) 704 (568,865)Overall 0.43 (0.25,0.70) 0.19 (0.10,0.32) 0.62 (0.38,0.98) 673 (543,829)Men
Ages 20 to 39 0.78 (0.45,1.25) 0.19 (0.10,0.33) 0.51 (0.31,0.82) 588 (473,722)Ages 40 to 59 0.42 (0.24,0.67) 0.14 (0.07,0.24) 0.50 (0.30,0.78) 602 (484,739)
Ages 60 and older 0.29 (0.17,0.46) 0.13 (0.07,0.23) 0.63 (0.38,1.00) 642 (517,788)Overall 0.47 (0.27,0.75) 0.15 (0.08,0.26) 0.56 (0.34,0.89) 615 (495,755)
Both sexes overall 0.45 (0.28,0.70) 0.17 (0.10,0.28) 0.59 (0.37,0.90) 644 (530,777)
Latin America, Southern
Latin America, Tropical
North Africa and Middle East

Women
Ages 20 to 39 1.32 (1.14,1.53) 0.55 (0.47,0.65) 0.65 (0.57,0.74) 870 (818,921)Ages 40 to 59 0.71 (0.60,0.82) 0.40 (0.34,0.47) 0.62 (0.54,0.70) 889 (839,941)
Ages 60 and older 0.46 (0.39,0.52) 0.41 (0.35,0.47) 0.77 (0.68,0.87) 950 (899,1002)Overall 0.78 (0.67,0.89) 0.45 (0.38,0.52) 0.69 (0.61,0.78) 910 (859,962)Men
Ages 20 to 39 1.52 (1.31,1.77) 0.47 (0.40,0.55) 0.61 (0.54,0.69) 797 (750,845)Ages 40 to 59 0.83 (0.71,0.96) 0.35 (0.30,0.41) 0.58 (0.51,0.65) 813 (767,862)
Ages 60 and older 0.51 (0.44,0.59) 0.34 (0.30,0.40) 0.73 (0.64,0.82) 870 (824,920)Overall 0.89 (0.77,1.03) 0.38 (0.33,0.44) 0.65 (0.57,0.74) 833 (787,882)
Both sexes overall 0.83 (0.73,0.95) 0.42 (0.36,0.48) 0.67 (0.60,0.75) 872 (828,918)
Women
Ages 20 to 39 0.87 (0.47,1.48) 0.25 (0.12,0.45) 0.23 (0.12,0.38) 465 (368,581)Ages 40 to 59 0.45 (0.25,0.77) 0.18 (0.09,0.33) 0.22 (0.12,0.37) 475 (375,597)
Ages 60 and older 0.30 (0.17,0.51) 0.17 (0.08,0.31) 0.28 (0.15,0.46) 509 (402,636)Overall 0.51 (0.28,0.86) 0.19 (0.09,0.36) 0.24 (0.14,0.41) 487 (385,609)Men
Ages 20 to 44 0.95 (0.51,1.62) 0.20 (0.10,0.37) 0.21 (0.11,0.35) 426 (335,538)Ages 40 to 59 0.50 (0.27,0.86) 0.14 (0.07,0.26) 0.20 (0.11,0.34) 436 (343,550)
Ages 60 and older 0.33 (0.18,0.57) 0.14 (0.07,0.25) 0.25 (0.14,0.43) 467 (368,588)Overall 0.56 (0.30,0.95) 0.16 (0.08,0.29) 0.23 (0.12,0.38) 447 (351,563)
Both sexes overall 0.53 (0.31,0.87) 0.18 (0.09,0.31) 0.24 (0.14,0.38) 467 (377,574)
Women
Ages 20 to 39 0.78 (0.41,1.32) 0.25 (0.11,0.49) 0.61 (0.31,1.05) 492 (370,648)Ages 40 to 59 0.41 (0.22,0.71) 0.18 (0.08,0.35) 0.58 (0.30,1.00) 504 (380,663)
Ages 60 and older 0.27 (0.14,0.46) 0.17 (0.08,0.34) 0.74 (0.38,1.26) 539 (409,705)Overall 0.46 (0.24,0.78) 0.19 (0.09,0.39) 0.66 (0.34,1.13) 516 (389,677)Men
Ages 20 to 39 0.87 (0.46,1.52) 0.20 (0.09,0.37) 0.55 (0.29,0.96) 451 (340,590)Ages 40 to 59 0.45 (0.24,0.80) 0.14 (0.07,0.27) 0.53 (0.28,0.92) 462 (349,605)
Ages 60 and older 0.30 (0.16,0.52) 0.14 (0.06,0.26) 0.67 (0.35,1.16) 494 (373,645)Overall 0.51 (0.27,0.89) 0.15 (0.07,0.29) 0.60 (0.31,1.04) 473 (357,618)
Both sexes overall 0.48 (0.27,0.80) 0.17 (0.09,0.32) 0.63 (0.35,1.04) 495 (384,632)
Women
Ages 20 to 39 0.59 (0.31,1.00) 0.07 (0.03,0.13) 0.32 (0.17,0.56) 440 (337,567)Ages 40 to 59 0.31 (0.17,0.53) 0.05 (0.02,0.09) 0.31 (0.17,0.54) 451 (344,580)
Ages 60 and older 0.21 (0.11,0.35) 0.05 (0.02,0.09) 0.40 (0.21,0.68) 482 (370,618)Overall 0.34 (0.18,0.59) 0.05 (0.02,0.10) 0.35 (0.19,0.61) 461 (353,592)Men
Ages 20 to 39 0.65 (0.35,1.10) 0.05 (0.02,0.10) 0.29 (0.16,0.50) 402 (309,517)Ages 40 to 59 0.34 (0.18,0.58) 0.04 (0.02,0.08) 0.28 (0.15,0.48) 411 (316,528)
Ages 60 and older 0.23 (0.12,0.39) 0.04 (0.02,0.07) 0.36 (0.20,0.61) 439 (339,564)Overall 0.38 (0.20,0.65) 0.04 (0.02,0.08) 0.32 (0.17,0.54) 421 (324,540)
Oceania
Sub‐Saharan Africa, Central
Sub‐Saharan Africa, East
North America high‐income

Both sexes overall 0.36 (0.21,0.59) 0.05 (0.02,0.09) 0.33 (0.19,0.55) 441 (348,554)
Women
Ages 20 to 39 1.04 (0.62,1.66) 0.04 (0.02,0.06) 0.73 (0.43,1.19) 469 (378,580)Ages 40 to 59 0.54 (0.32,0.87) 0.03 (0.01,0.05) 0.71 (0.42,1.16) 481 (387,594)
Ages 60 and older 0.36 (0.22,0.57) 0.03 (0.01,0.04) 0.89 (0.53,1.45) 513 (413,632)Overall 0.61 (0.36,0.97) 0.03 (0.02,0.05) 0.79 (0.47,1.29) 491 (396,607)Men
Ages 20 to 39 1.15 (0.69,1.86) 0.03 (0.02,0.05) 0.66 (0.39,1.05) 430 (343,535)Ages 45 to 64 0.60 (0.36,0.96) 0.02 (0.01,0.04) 0.63 (0.38,1.01) 440 (353,546)
Ages 60 and older 0.40 (0.24,0.64) 0.02 (0.01,0.04) 0.80 (0.49,1.26) 470 (377,583)Overall 0.67 (0.40,1.08) 0.02 (0.01,0.04) 0.71 (0.43,1.13) 450 (361,558)
Both sexes overall 0.64 (0.40,0.98) 0.03 (0.02,0.04) 0.75 (0.47,1.16) 471 (386,572)
Women
Ages 20 to 39 0.68 (0.36,1.16) 0.05 (0.02,0.09) 0.33 (0.18,0.56) 465 (364,586)Ages 40 to 59 0.35 (0.19,0.61) 0.03 (0.02,0.07) 0.32 (0.18,0.54) 476 (372,599)
Ages 60 and older 0.24 (0.13,0.40) 0.03 (0.02,0.06) 0.41 (0.23,0.68) 508 (398,641)Overall 0.40 (0.21,0.68) 0.04 (0.02,0.07) 0.36 (0.20,0.60) 486 (381,613)Men
Ages 20 to 39 0.76 (0.40,1.31) 0.04 (0.02,0.08) 0.31 (0.17,0.52) 427 (332,541)Ages 40 to 59 0.39 (0.21,0.68) 0.03 (0.01,0.05) 0.30 (0.16,0.50) 437 (341,552)
Ages 60 and older 0.26 (0.14,0.45) 0.03 (0.01,0.05) 0.38 (0.21,0.63) 467 (365,590)Overall 0.44 (0.23,0.76) 0.03 (0.01,0.06) 0.34 (0.19,0.56) 447 (349,565)
Both sexes overall 0.42 (0.24,0.69) 0.03 (0.02,0.06) 0.35 (0.20,0.56) 467 (374,577)
Sub‐Saharan Africa, Southern
Sub‐Saharan Africa, West