SUPPORTING INFORMATION A Chemical Space Odyssey of ... · Fernando D. Prieto-Martínez, Eli...
19
S1 SUPPORTING INFORMATION A Chemical Space Odyssey of Inhibitors of Histone Deacetylases and Bromodomains Fernando D. Prieto-Martínez, Eli Fernández-de Gortari, Oscar Méndez-Lucio, José L. Medina-Franco Facultad de Química, Departamento de Farmacia, Universidad Nacional Autónoma de México, Avenida Universidad 3000, Mexico City 04510, México Contents Page Table S1. Summary statistics of the distribution of the PCP for the data sets S2 Table S2. Distribution of ‘active’ compounds and comparison for BRDi compounds S4 Figure S1. Chemical space representation of BRDi, HDACi, DNMT 1, ‘Epi-focused’, and GRAS S6 Table S3. Nemenyi test values for the PCPs comparisons of eight data sets S7 Table S4. Loadings for the first three principal components of the property space S9 Table S5. Summary statistics of the intra-compound set similarity S10 Figure S2. Inter-library similarity S11 Table S6. Summary statistics of the inter-library comparison using MACCS keys S12 Table S7. Summary statistics of the inter-library comparison using TGD fingerprints S14 Table S8. Descriptive statistics and AUC for CSR curves S16 Figure S3. Chemotype enrichment plots for BRDi and HDACi data sets S17 Table S9. Descriptive statistics for F-chiral and F-sp 3 distributions S18 Table S10. Nemenyi pairing values for F-chiral and F-sp3 distributions S19 Electronic Supplementary Material (ESI) for RSC Advances. This journal is © The Royal Society of Chemistry 2016
Transcript of SUPPORTING INFORMATION A Chemical Space Odyssey of ... · Fernando D. Prieto-Martínez, Eli...

S1
SUPPORTING INFORMATION
A Chemical Space Odyssey of Inhibitors of Histone Deacetylases and Bromodomains
Fernando D. Prieto-Martínez, Eli Fernández-de Gortari, Oscar Méndez-Lucio, José L. Medina-Franco
Facultad de Química, Departamento de Farmacia, Universidad Nacional Autónoma de México, Avenida
Universidad 3000, Mexico City 04510, México
Contents Page
Table S1. Summary statistics of the distribution of the PCP for the data sets S2
Table S2. Distribution of ‘active’ compounds and comparison for BRDi compounds S4
Figure S1. Chemical space representation of BRDi, HDACi, DNMT 1, ‘Epi-focused’, and GRAS S6
Table S3. Nemenyi test values for the PCPs comparisons of eight data sets S7
Table S4. Loadings for the first three principal components of the property space S9
Table S5. Summary statistics of the intra-compound set similarity S10
Figure S2. Inter-library similarity S11
Table S6. Summary statistics of the inter-library comparison using MACCS keys S12
Table S7. Summary statistics of the inter-library comparison using TGD fingerprints S14
Table S8. Descriptive statistics and AUC for CSR curves S16
Figure S3. Chemotype enrichment plots for BRDi and HDACi data sets S17
Table S9. Descriptive statistics for F-chiral and F-sp3 distributions S18
Table S10. Nemenyi pairing values for F-chiral and F-sp3 distributions S19
Electronic Supplementary Material (ESI) for RSC Advances.This journal is © The Royal Society of Chemistry 2016

S2
Table S1. Summary statistics of the distribution of the PCP for the data sets studied in this work
HBABRDi HDACi DNMT 1 GRAS Drugs Clinic Inhibit Epi-focused
Min 1 1 0 0 0 0 0 01st Quart 3 3 4 1 1 2 3 2Median 4 4 5 1 2 3 4 4Mean 3.662 4.813 5.357 1 2.919 3.585 4.459 3.4163rd Quart 4 5 7 2 4 5 5 5Max 7 37 24 22 18 18 19 8SD 0.991 2.45 2.5 1.31 2.56 2.37 2.32 1.83
HBDBRDi HDACi DNMT 1 GRAS Drugs Clinic General Epi-focused
Min 0 0 0 0 0 0 0 01st Quart 1 2 2 0 0 0 1 1Median 1 3 3 0 1 1 2 2Mean 1.184 3.265 3.133 0.4666 1.35 1.525 2.298 2.2983rd Quart 2 4 4 1 2 2 3 3Max 4 24 12 14 13 13 16 16SD 0.867 1.511 2.011 1.077 1.559 1.552 1.817 1.294
RTBBRDi HDACi DNMT 1 GRAS Drugs Clinic General Epi-focused
Min 1 0 0 0 0 0 0 11st Quart 3 6 4 2 2 4 3 4Median 4 9 5 4 4 6 5 5Mean 4.734 9.32 5.568 4.291 5.008 6.303 5.433 5.5493rd Quart 6 11 7 6 7 8 7 7Max 16 53 27 21 35 35 30 16SD 2.05 4.03 2.931 3.345 3.779 4.186 3.342 2.84
SLogPBRDi HDACi DNMT 1 GRAS Drugs Clinic General Epi-focused
Min 0.183 -14.261 -3.3655 -5.422 -13.6094 -14.04 -8.113 -2.7961st Quart 3.303 2.559 0.9547 1.519 0.1402 1.089 2.248 1.619Median 4.161 3.613 2.9577 2.317 1.7112 2.499 3.545 2.588Mean 4.059 3.594 2.6556 2.317 1.4113 2.274 3.49 2.6273rd Quart 4.849 4.599 4.2702 3.051 3.0996 3.963 4.729 3.724Max 6.701 9.65 10.685 8.312 10.4033 11.059 11.059 9.189SD 1.172 1.69 2.394 1.331 2.91 2.772 1.92 1.715

S3
Table S1. (Continued)
TPSABRDi HDACi DNMT 1 GRAS Drugs Clinic General Epi-focused
Min 22 26.3 0 0 0 0 0 21.511st Quart 67.56 78.43 78.11 18.46 43.37 60.11 61.32 73.25Median 81.4 101.21 108.65 26.3 71.36 86.19 84.42 89.54Mean 78.54 110.4 111.7 31.29 82.29 93.97 88.29 91.283rd Quart 90.63 129.98 143.87 37.3 105.15 115.15 107.29 105.82Max 137.07 612.25 358.2 374.13 417.27 391.12 260.04 180.04SD 19.54 42.897 47.102 24.611 55.74 52.316 40.715 27.983
MWBRDi HDACi DNMT 1 GRAS Drugs Clinic General Epi-focused
Min 213.2 111.1 88.11 18.04 43.33 95.12 136.1 134.21st Quart 337.8 349.9 329.83 134.18 254.32 323.15 319.2 321.4Median 374.4 413.5 403.41 160.25 325.41 407.45 408.4 380.4Mean 378.7 441.6 402.8 169.9 348.4 418.47 411.6 392.53rd Quart 423.5 492.8 462.03 196.29 415.51 501.54 480.1 473.6Max 552.7 1598.8 1326.78 967.02 988.18 975.64 990.2 720.9SD 64.229 133.525 118.158 61.857 146.822 148.614 129.24 110.161

S4
Table S2. Distribution of ‘actives’ compounds and comparison for BRDi compounds
Median BRD2 BRD3 BRD4 IC50 (µM)4 4 4 14 4 4 10
HBA 4 4 3 ≥1001 1 1 11 1 1 10
HBD 1 1 1 ≥1004 4 4 14 4 4 10
RTB 4 4 4 ≥1004.71362 4.71792 4.54183 14.01176 4.07626 4.2211 10
SLogP 3.782135 3.92028 4.02703 ≥10081.4 81.4 81.4 181.4 81.4 81.4 10
TPSA 81.4 81.4 78.51 ≥100415.453 410.441 402.96 1376.864 378.493 376.391 10
MW 372.4445 376.864 364.96 ≥100
Mean BRD2 BRD3 BRD4 IC50 (µM)4 4 3.865854 1
3.671233 3.821918 3.663317 10HBA 3.684783 3.829268 3.463115 ≥100
1.1333 1.15625 1.268293 11.041096 1.09589 1.201005 10
HBD 1.065217 1.109756 1.17623 ≥1004.4 4.1875 4.304878 1
4.260274 4.39726 4.251256 10RTB 4.206522 4.353659 3.979508 ≥100
4.735897 4.529324 4.354318 13.986589 3.989324 4.101408 10
SLogP 3.767619 3.820534 3.847727 ≥10084.46933 83.95625 83.88902 178.75466 82.3137 78.82246 10
TPSA 79.08337 82.40805 75.63689 ≥100405.6323 398.6574 401.2273 1369.7882 383.3375 380.6428 10
MW 365.7007 379.908 361.3758 ≥100

S5
Table S2. (Continued)
SD BRD2 BRD3 BRD4 IC50 (µM)0.755929 0.718421 1.015463 10.834246 0.733001 0.990975 10
HBA 0.824479 0.699292 1.127049 ≥1000.743223 0.677251 0.943448 10.610973 0.581291 0.870272 10
HBD 0.625543 0.588073 0.878228 ≥1000.736788 0.737804 1.95435 11.302001 1.198839 1.704772 10
RTB 1.338673 1.260726 1.849143 ≥1000.938424 0.915115 0.988773 11.065457 1.118183 1.149915 10
SLogP 1.144782 1.198718 1.291483 ≥10012.3812 10.72139 19.0008 1
15.2 12.97325 19.49417 10TPSA 15.8889 12.55546 20.81594 ≥100
34.6769 39.93311 60.62833 162.87314 49.93638 63.05745 10
MW 63.4056 48.96492 78.06248 ≥100
*Note: Statistical comparison towards “active” compounds of HDACi data set was not made because of the following:
Of the 2000 unique compounds; 1135 show IC50 ≤ 1 µM.
The difference in size makes it difficult to make a good comparison on the same statistic grounds.
It is true that many types of structures have been proposed as HDACs inhibitors; however the most interesting and potent ones are inspired or derived from hydroxamic acid moiety.
That last fact has produced intensive research of those compounds; therefore a high chance of statistical similarities is plausible.
Finally the pharmacophoric features of such compounds are well understood as of today, making good reference for our probe search.

S6
BRDi DNMT 1
HDACi ‘Epi-focused’
GRAS
Figure S1. Chemical space representation of BRDi, HDACi, DNMT 1, ‘Epi-focused’, and GRAS. Data
sets are in the same reference coordinates. The chemical space was obtained by principal component
analysis of six physicochemical properties of pharmaceutical interest. The outliers in the HDACs and
GRAS sets are not shown for clarity). See main text for details.

S7
Table S3. Nemenyi test values for the PCPs comparisons of eight data sets (1 BRDi; 2 HDACi; 3 DNMT
1; 4 GRAS; 5 Drugs; 6 Clinic; 7 General; 8 Epi-focused).
SlogP
BRDi HDACi DNMT 1 GRAS Drugs Clinic General2 0.0005 - - - - - -3 9.80E-14 5.20E-14 - - - - -4 < 2E-16 < 2E-16 1.10E-07 - - - -5 < 2E-16 < 2E-16 7.40E-14 < 2E-16 - - -6 < 2E-16 < 2E-16 1.82E-01 < 2E-16 4.50E-05 - -7 1.00E-05 0.824 2.90E-13 < 2E-16 < 2E-16 < 2E-16 -8 2.60E-12 7.50E-07 0.991 0.483 3.00E-04 0.999 0.382
TPSA
BRDi HDACi DNMT 1 GRAS Drugs Clinic General2 1.10E-09 - - - - - -3 6.90E-09 0.028 - - - - -4 < 2E-16 < 2E-16 < 2E-16 - - - -5 0.0004 < 2E-16 6.50E-14 < 2E-16 - - -6 0.62 0.6 0.999 < 2E-16 7.80E-14 - -7 0.6 0.025 0.999 < 2E-16 < 2E-16 1 -8 0.999 0.303 0.999 < 2E-16 0.003 0.987 0.987
MW
BRDi HDACi DNMT 1 GRAS Drugs Clinic General2 0.006 - - - - - -3 0.879 0.028 - - - - -4 < 2E-16 < 2E-16 < 2E-16 - - - -5 0.0004 < 2E-16 6.50E-14 < 2E-16 - - -6 0.62 0.6 0.999 < 2E-16 7.80E-14 - -7 0.6 0.025 0.999 < 2E-16 < 2E-16 1 -8 0.999 0.303 0.999 < 2E-16 0.003 0.987 0.987
HBA
BRDi HDACi DNMT 1 GRAS Drugs Clinic General2 0.001 - - - - - -3 1.10E-06 0.125 - - - - -4 < 2E-16 < 2E-16 < 2E-16 - - - -5 2.50E-13 < 2E-16 < 2E-16 < 2E-16 - - -6 0.0806 < 2E-16 < 2E-16 < 2E-16 9.10E-14 - -7 0.342 0.0211 2.00E-06 < 2E-16 < 2E-16 7.70E-14 -8 0.598 3.40E-06 4.10E-09 6.40E-14 0.004 1 0.0028
S8
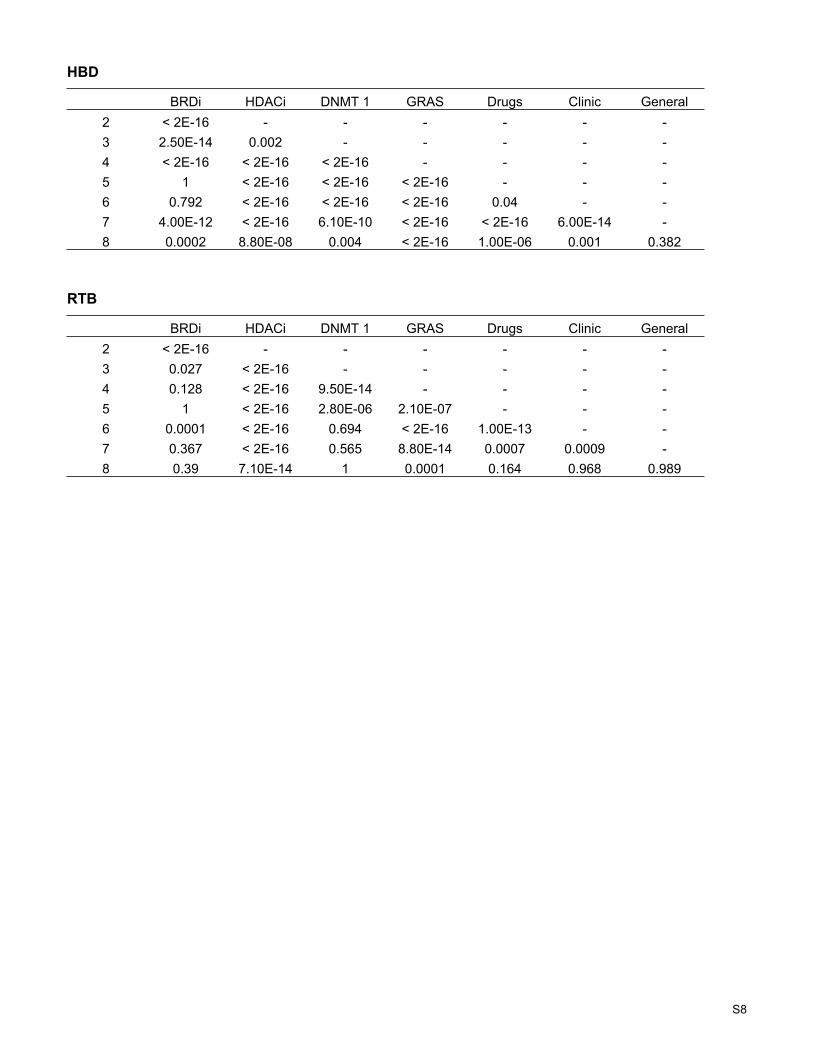
HBD
BRDi HDACi DNMT 1 GRAS Drugs Clinic General2 < 2E-16 - - - - - -3 2.50E-14 0.002 - - - - -4 < 2E-16 < 2E-16 < 2E-16 - - - -5 1 < 2E-16 < 2E-16 < 2E-16 - - -6 0.792 < 2E-16 < 2E-16 < 2E-16 0.04 - -7 4.00E-12 < 2E-16 6.10E-10 < 2E-16 < 2E-16 6.00E-14 -8 0.0002 8.80E-08 0.004 < 2E-16 1.00E-06 0.001 0.382
RTB
BRDi HDACi DNMT 1 GRAS Drugs Clinic General2 < 2E-16 - - - - - -3 0.027 < 2E-16 - - - - -4 0.128 < 2E-16 9.50E-14 - - - -5 1 < 2E-16 2.80E-06 2.10E-07 - - -6 0.0001 < 2E-16 0.694 < 2E-16 1.00E-13 - -7 0.367 < 2E-16 0.565 8.80E-14 0.0007 0.0009 -8 0.39 7.10E-14 1 0.0001 0.164 0.968 0.989

S9
Table S4. Loadings for the first three principal components of the property space of the eight compound
data sets.
Principal component PC1 PC2 PC3
Eigenvalue 1.9185 1.1174 0.7006
Cumulative eigenvalue (%) 61.344 82.157 90.338
SlogP -0.0125 0.3832 -0.1515
TPSA 0.00904 -0.00414 -0.000591
MW 0.00284 0.00181 -0.000909
HBA 0.1949 -0.0369 -0.1355
HBD 0.2462 -0.0908 -0.1135
RTB 0.0895 0.0743 0.201

S10
Table S5. Summary statistics of the intra-compound set similarity
MACCSDataset Q1 Mean Median Q3 SDBRDi 0.386 0.48441626 0.463 0.557 0.14001451HDACi 0.3445 0.4322109 0.4235 0.509 0.12798872DNMT 0.309 0.41415293 0.4 0.5 0.16258865GRAS 0.161 0.28927381 0.261 0.387 0.17045788Drugs 0.22 0.31403743 0.308 0.4 0.1336488Clinic 0.283 0.37388603 0.375 0.466 0.13127422General 0.28 0.36957258 0.365 0.453 0.12375299Epi-Focused 0.313 0.40095354 0.399 0.488 0.12786925
GpiDAPH3Dataset Q1 Mean Median Q3 SDBRDi 0.228 0.32056677 0.303 0.403 0.17481642HDACi 0.34475 0.43225473 0.42375 0.50975 0.12792421DNMT 0.161 0.24319609 0.243 0.324 0.18191181GRAS 0 0.15952901 0 0.342 0.22637638Drugs 0.2095 0.28546563 0.286 0.364 0.13806921Clinic 0 0.19669936 0.223 0.3 0.13990382General 0 0.18843588 0.218 0.303 0.14801609Epi-Focused 0.194 0.25483202 0.275 0.344 0.13709412
TGDDataset Q1 Mean Median Q3 SDBRDi 0.678 0.73223165 0.729 0.782 0.08345325HDACi 0.3965 0.4277573 0.4455 0.4765 0.06328818DNMT 1 0.526 0.59578227 0.595 0.663 0.1255546GRAS 0.471 0.60436491 0.607 0.739 0.18054764Drugs 0.408 0.50042214 0.513 0.603 0.14793078Clinic 0.485 0.56071604 0.577 0.652 0.13069903General 0.504 0.57793955 0.587 0.661 0.11752032Epi-Focused 0.51875 0.58460793 0.599 0.665 0.11791897

S11
Figure S2. Inter-library similarity: Cumulative distribution function (CDF) of the maximum structure
similarity calculated with MACCS keys, TDG and the Tanimoto coefficient comparing different reference
and test sets. The reference set is indicated at the top of each graph. Summary statistics of the CDFs are
presented in Tables S6 and S7.

S12
Table S6. Summary statistics of the inter-library comparison using MACCS keys; the reference set is
shown at the top of each table.
BRDiHDACi DNMT 1 GRAS Drugs Clinic
Min 0.5 0.521 0.431 0.535 0.536Q1 0.610 0.590 0.511 0.647 0.642
Median 0.661 0.652 0.537 0.684 0.688Q3 0.700 0.710 0.578 0.733 0.724
Max 1 0.867 0.712 0.846 0.846SD 0.079 0.073 0.056 0.066 0.068
HDACiBRDi DNMT 1 GRAS Drugs Clinic
Min 0.204 0.392 0.372 0.468 0.395Q1 0.544 0.586 0.518 0.618 0.636
Median 0.605 0.625 0.559 0.652 0.682Q3 0.651 0.671 0.611 0.697 0.729
Max 1 1 1 1 1SD 0.082 0.073 0.073 0.066 0.076
DNMT 1BRDi HDACi GRAS Drugs Clinic
Min 0.073 0.088 0.153 0.333 0.181Q1 0.538 0.639 0.531 0.651 0.646
Median 0.593 0.683 0.593 0.708 0.694Q3 0.625 0.742 0.655 0.803 0.790
Max 0.867 1 1 1 1SD 0.095 0.088 0.098 0.105 0.103
GRASBRDi HDACi DNMT 1 Drugs Clinic
Min 0.022 0.052 0.058 0.2 0.045Q1 0.351 0.445 0.423 0.411 0.507
Median 0.528 0.632 0.582 0.606 0.670Q3 0.590 0.683 0.642 0.665 0.733
Max 0.712 1 1 1 1SD 0.214 0.266 0.244 0.268 0.284
DrugsBRDi HDACi DNMT 1 GRAS Clinic
Min 0.073 0.088 0.108 0.105 0.115Q1 0.429 0.560 0.571 0.514 0.633
Median 0.518 0.625 0.638 0.571 0.714Q3 0.589 0.684 0.690 0.641 0.805
Max 0.846 1 1 1 1SD 0.114 0.099 0.098 0.092 0.128

S13
Table S6. (Continued)
ClinicBRDi HDACi DNMT 1 GRAS Drugs
Min 0 0.022 0 0 0.058Q1 0.513 0.604 0.600 0.522 0.675
Median 0.576 0.662 0.654 0.566 0.739Q3 0.630 0.714 0.700 0.616 0.833
Max 0.846 1 1 1 1SD 0.110 0.095 0.093 0.087 0.129
Q1: First quartile; Q3: Third quartile; SD: standard deviation

S14
Table S7. Summary statistics of the inter-library comparison using TGD fingerprints; the reference set is
shown at the top of each table.
BRDiHDACi DNMT 1 GRAS Drugs Clinic
Min 0.791 0.764 0.725 0.779 0.761Q1 0.846 0.826 0.809 0.842 0.849
Median 0.862 0.85 0.832 0.862 0.868Q3 0.885 0.868 0.873 0.885 0.887
Max 1 0.929 0.963 1 0.948SD 0.035 0.034 0.048 0.032 0.032
HDACiBRDi DNMT 1 GRAS Drugs Clinic
Min 0.506 0.577 0.68 0.693 0.67Q1 0.769 0.769 0.751 0.793 0.797
Median 0.800 0.800 0.775 0.828 0.830Q3 0.845 0.845 0.805 0.857 0.867
Max 1 1 1 1 1SD 0.048 0.048 0.049 0.044 0.045
DNMT 1BRDs HDACs GRAS Drugs Clinic
Min 0 0 0.426 0.703 0.447Q1 0.701 0.729 0.712 0.825 0.792
Median 0.752 0.783 0.752 0.857 0.842Q3 0.812 0.861 0.799 0.889 0.871
Max 0.929 1 1 1 1SD 0.090 0.086 0.079 0.054 0.059
GRASBRDi HDACi DNMT 1 Drugs Clinic
Min 0 0 0 0 0Q1 0.618 0.748 0.761 0.863 0.825
Median 0.771 0.855 0.863 0.907 0.873Q3 0.863 0.908 0.913 0.943 0.905
Max 0.963 1 1 1 1SD 0.153 0.121 0.117 0.075 0.085
DrugsBRDs HDACs DNMT GRAS Clinic
Min 0 0 0 0 0Q1 0.629 0.692 0.771 0.725 0.821
Median 0.734 0.767 0.808 0.778 0.866Q3 0.790 0.825 0.850 0.832 0.918
Max 1 1 1 1 1SD 0.134 0.122 0.081 0.098 0.092

S15
Table S7. (Continued)
ClinicBRDi HDACi DNMT 1 GRAS Drugs
Min 0 0 0 0 0Q1 0.701 0.736 0.778 0.717 0.828Median 0.757 0.789 0.816 0.769 0.865Q3 0.808 0.840 0.853 0.816 0.919Max 0.946 1 1 1 1SD 0.104 0.095 0.065 0.083 0.076
Q1: First quartile; Q3: Third quartile; SD: standard deviation

S16
Table S8. Descriptive statistics and AUC for CSR curves
Set Q1 FS50 Q3 AUC F50
BRDi 0.661 0.783 0.894 0.739 0.122
HDACi 0.669 0.802 0.901 0.762 0.098
DNMT 1 0.525 0.741 0.87 0.689 0.226
GRAS 0.909 0.948 0.974 0.926 0.004
Q1: First quartile; FS50 fraction of database recovered by 50% of scaffolds; Q3: Third quartile; AUC: area under the curve; F50:
fraction of scaffolds to recover 50% of the compound in the data set.
S17
1AWRP
49ZJ3
G7NQDJE0CFQH301
XLU33DHR2F DM3VV
75XQ3URXZR
0 0.02 0.04 0.06 0.08 0.1 0.12 0.14 0.16 0.18 0.20
2
4
6
8
10
12
14
16
BRDi Scaffolds
EF
Frec
uenc
y
BT7BR
36L57ESJ8D
4R50K
020T1
TGRT324N4H TGTTZ HDXHR
KQWXKQ3ETB
T96N1
TBHBZAKZRFFXKU9
0 0.01 0.02 0.03 0.04 0.05 0.0605
1015202530354045
HDACi Scaffolds
EF
Frec
uenc
y
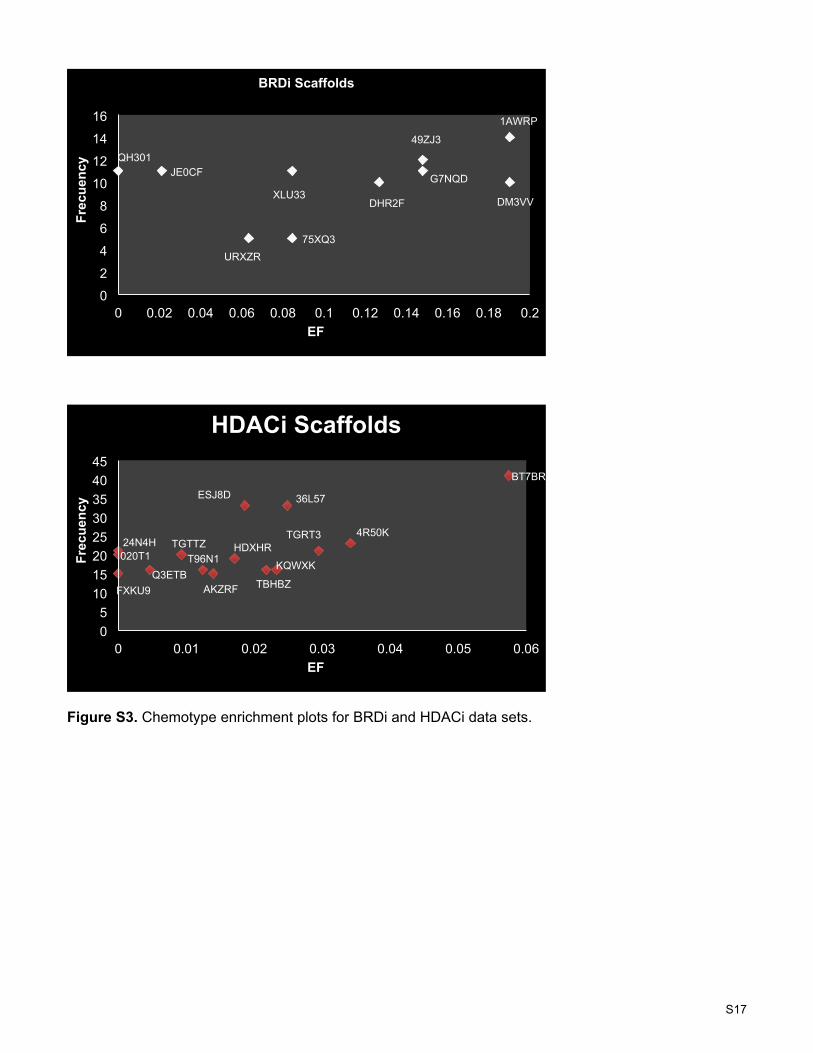
Figure S3. Chemotype enrichment plots for BRDi and HDACi data sets.

S18
Table S9. Descriptive statistics for F-chiral and F-sp3 distributions
F-chiralBRDi HDACi DNMT 1 GRAS Drugs Clinic General Epi-focused
Min 0 0 0 0 0 0 0 01st Quart 0 0 0 0 0 0 0 0Median 0 0 0 0 0.058 0.032 0 0Mean 0.024 0.034 0.091 0.057 0.107 0.076 0.048 0.0343rd Quart 0.045 0.043 0.142 0.1 0.173 0.105 0.058 0.038Max 0.166 0.7 0.667 0.833 0.833 0.833 0.55 0.5
F-sp3
BRDi HDACi DNMT 1 GRAS Drugs Clinic General Epi-focusedMin 1 1 0 0 0 0 0 01st Quart 3 3 0.08 0.4 0.29 0.24 0.19 0.13Median 4 4 0.2 0.67 0.43 0.38 0.3 0.28Mean 3.662 4.813 0.264 0.622 0.458 0.401 0.325 0.2713rd Quart 4 5 0.42 0.86 0.61 0.53 0.44 0.37Max 7 37 0.91 1 1 1 1 0.68

S19
Table S10. Nemenyi pairing values for F-chiral and F-sp3 distributions (1 BRDi; 2 HDACi; 3 DNMT 1; 4
GRAS; 5 Drugs; 6 Clinic; 7 General; 8 Epi-focused).
F-chiral
BRDi HDACi DNMT 1 GRAS Drugs Clinic General2 0.9991 - - - - - -3 0.04151 9.90E-08 - - - - -4 0.99064 0.0603 0.0013 - - - -5 2.60E-11 <2E-16 5.00E-07 < 2E-16 - - -6 0.0044 2.40E-13 0.996 4.10E-07 1.00E-06 - -7 0.971 0.08 0.017 0.999 < 2E-16 9.00E-05 -8 0.912 0.927 0.002 0.372 1.10E-10 0.0003 0.305
F-sp3
BRDi HDACi DNMT 1 GRAS Drugs Clinic General2 0.021 - - - - - -3 0.951 9.90E-08 - - - - -4 < 2E-16 < 2E-16 < 2E-16 - - - -5 < 2E-16 < 2E-16 < 2E-16 < 2E-16 - - -6 0.0044 2.40E-13 7.60E-14 < 2E-16 4.50E-05 - -7 0.971 0.08 1.40E-05 < 2E-16 < 2E-16 4.20E-09 -8 0.912 0.927 1 < 2E-16 6.80E-12 1.20E-05 0.382


![RetroRetrospective [Lucio Fontana, 1899-1968]spective [Lucio Fontana, 1899-1968] [1977]](https://static.fdocuments.us/doc/165x107/577cc0e41a28aba71191807d/retroretrospective-lucio-fontana-1899-1968spective-lucio-fontana-1899-1968.jpg)