Supporting Inclusive Learning Environments Through Technology

C. Rau, Int. J. Sus. Dev. Plann. Vol. 12, No. 3 (2017) 580–588
© 2017 WIT Press, www.witpress.comISSN: 1743-7601 (paper format), ISSN: 1743-761X (online), http://www.witpress.com/journalsDOI: 10.2495/SDP-V12-N3-580-588
This paper is part of the Proceedings of the 11th International Conference on Urban Regeneration and Sustainability (Sustainable City 2016) www.witconferences.com
SUPPORTING CARBON NEUTRALITY IN URBAN ENVIRONMENTS USING POSITIVE ENERGY BUILDINGS
CHARLES RAURochester Institute of Technology.
ABSTRACTRochester, New York, a city that thrived on manufacturing in the 1900s, has declined over the years. The fall of Kodak, caused by inadequate business decisions and thus left behind in the transition to a digital age, started a downward trend. The impacts of the economic downturn, suburbanization, and the highway system impeding pedestrian access to downtown Rochester, all took their toll on the city’s once vibrant urban fabric, which has now deteriorated into surface parking and buildings in disrepair. The city of Rochester has started a conscious effort to rebuild its downtown, which brings with it an increased population as the current downtown has been reduced to office buildings and parking lots with little residential options, thus placing a strain on the power grid and infrastructure as old buildings are restored and new buildings are constructed to meet the needs of the increased urban population. As the strain on the power grid increases, the carbon emissions produced increase as well. At the global level, Sweden has been leading the charge toward carbon neutrality and with a very supportive govern-ment-developed Roadmap 2050, a systematic approach toward achieving carbon neutrality in the entire country. With regard to the city of Rochester, since the increase in population is directly related to the increase in the city’s carbon emissions, I propose that the city of Rochester aligns with the goal of car-bon neutrality by 2050 with Sweden. To achieve this goal, my paper addresses the revitalization efforts of the city with an alternate and sustainable solution by (1) determining the current energy consumption of Rochester’s downtown, (2) developing a schematic positive energy building to determine energy offset, (3) determining the energy generation capabilities of the proposed building, and (4) discussing the implementation of positive energy buildings to support the goal of carbon neutrality in Rochester.Keywords: carbon neutrality, energy consumption, positive energy, urban environment.
1 INTRODUCTIONRochester, New York, a city that once thrived on commercial manufacturing and industries in the 1900s, has declined over the years. While the fall of Kodak, caused by inadequate busi-ness decisions and thus left behind in the transition to a digital age, started a downward trend, the impacts of the economic downturn, suburbanization, and the highway system impeding pedestrian access to downtown center of Rochester, all took their toll on Rochester’s once vibrant urban fabric, which has deteriorated to surface parking and buildings in disrepair.
The city of Rochester has started a conscious effort to rebuild its downtown similar to most American cities [1], which brings with it an increased population, thus placing a strain on the current power grid and infrastructure as old buildings are restored and new buildings are constructed to meet the needs of the increased urban population.
Electricity production accounted for 40% of carbon dioxide emissions in 2009 [2], and this figure has been steady since then. In 2015, Rochester’s energy usage was approximately 33.9 mmBtu per year with the buildings accounting for about 25.2 mmBtu according to the New York State Power Authority [3], meaning buildings account for 79% of Rochester’s total energy consumption. While Rochester plans to reduce this consumption by 20% by 2030, at

C. Rau, Int. J. Sus. Dev. Plann. Vol. 12, No. 3 (2017) 581
the global level, Sweden has been leading the change toward carbon neutrality and with a very supportive government developed Roadmap 2050, a systematic approach toward achieving carbon neutrality in the entire country [4]. With regard to the city of Rochester, since the increase in population is directly related to the increase in the city’s carbon emissions, I pro-pose that the city of Rochester aligns with the goal of carbon neutrality by 2050 with Sweden.
This study addresses the revitalization efforts of the city by proposing an alternate and sustainable solution to redeveloping urban areas. I propose that using alternative techniques, such as urban infill and positive energy buildings, will help the city of Rochester offset the annual energy consumed, therefore reducing carbon emissions from the building sector. These positive energy buildings not only sustain themselves, but also supply renewable energy back to the surrounding city, thus supplementing the existing infrastructure. This pro-posal allows for a greater reduction of total energy consumed supporting the possibility of a carbon neutral Rochester by 2050.
2 NOMENCLATUREASHRAE – American Society of Heating, Refrigerating, and Air Conditioning EngineersCO2 e – Carbon Dioxide EquivalentGHG – Green House GasKWh – Kilowatt HoursLEED – Leadership in Energy and Environmental DesignmmBtu – Million British Thermal UnitsmBtu – Thousand British Thermal UnitsMWh – Megawatt HoursNYSERDA – New York State Energy Research and Development AuthorityR-Value – Thermal ResistanceSIP – Structurally Insulated PanelHDD/Heating Degree Day – Amount of days that require heating annually based on a set
temperature; every 24-hour period is 5 daysCDD/Cooling Degree Day – Amount of days that require cooling annually based on a set
temperature; every 24-hour period is 5 days
3 ROCHESTER’S ENERGY CONSUMPTION AND CONTEXT
3.1 Annual energy consumption and CO2 equivalent
While Rochester’s electrical grid consists of renewable sources, only about 34.6% of electri-cal generation is from those sources. Therefore, Rochester’s region emits less CO2 than the national average according to the US Environmental Protection Agency [5], but the city of Rochester still consumes about 25.2 mmBtu, which produces approximately 1.4 million met-ric tons of Co2 e annually according to the New York State Power Authority [6]. That means Rochester is producing the equivalent CO2 of 127,388 SUVs driving 15,000 miles a year. As this paper only addresses the downtown district of Rochester, estimations on energy con-sumption and carbon emissions are made accordingly. To determine the amount of energy consumed by the downtown district, as seen in Fig. 1, Rochester’s urban fabric needs to be considered. Since Rochester has a small dense downtown consisting of mid to high-rise buildings, with a large surrounding area of suburban context, I have estimated approximately 20% of Rochester’s energy consumption as currently being consumed by the downtown dis-trict. This equates to 5.04 mmBtu.

582 C. Rau, Int. J. Sus. Dev. Plann. Vol. 12, No. 3 (2017)
3.2 Proposed building location and context
By dividing the city into quadrants (Fig. 2) and selecting an infill site in one of the quadrants (Fig. 3), my research quantifies the energy contributions and CO2 e mitigated in the urban context while repairing the deteriorating urban fabric. The surrounding context consists of midrise and high-rise office or residential structures as is typical of downtown Rochester.
3.3 Climate information
Rochester presents some challenges when considering a positive energy building. According to the National Weather Service [7], Rochester experiences a rather mild summer, spring, and
Figure 1: Downtown extents.
Figure 2: Existing downtown quadrant map.
C. Rau, Int. J. Sus. Dev. Plann. Vol. 12, No. 3 (2017) 583
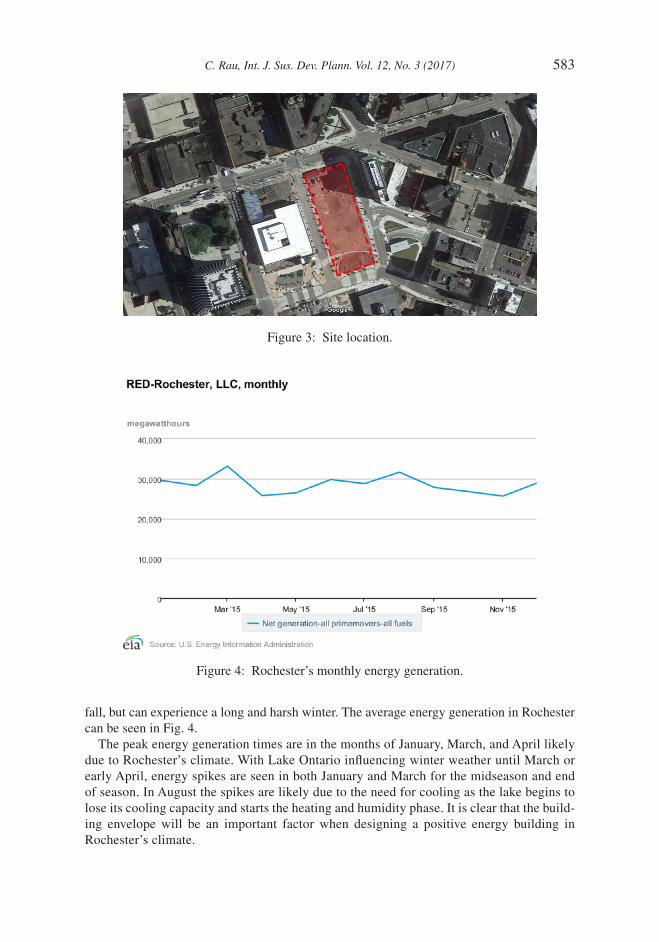
fall, but can experience a long and harsh winter. The average energy generation in Rochester can be seen in Fig. 4.
The peak energy generation times are in the months of January, March, and April likely due to Rochester’s climate. With Lake Ontario influencing winter weather until March or early April, energy spikes are seen in both January and March for the midseason and end of season. In August the spikes are likely due to the need for cooling as the lake begins to lose its cooling capacity and starts the heating and humidity phase. It is clear that the build-ing envelope will be an important factor when designing a positive energy building in Rochester’s climate.
Figure 3: Site location.
Figure 4: Rochester’s monthly energy generation.

584 C. Rau, Int. J. Sus. Dev. Plann. Vol. 12, No. 3 (2017)
4 POSITIVE ENERGY CONSTRUCTION AND CONSIDERATIONSPositive energy construction is very similar to that of Net Zero Energy construction as they are both energy efficient. But there is one difference that positive energy building generates enough energy to help sustain the surrounding built environment. The most important aspects are the building envelope, energy efficiency, and renewable energy sources. For the purpose of this study, a proposal for a mixed use, urban infill building in the city of Rochester will be designed and analyzed. The base assumptions and systems used for the analysis are below.
4.1 Building use and height
The proposed building will be a multi-use facility in downtown Rochester consisting of retail on the first floor, office space on the second floor, and residential units on the remaining floors. The building will have eight floors, with floor-to-floor height of 12 feet, totalling 96 feet. These design decisions were made in order for the building to respect the surrounding architectural context of downtown Rochester.
4.2 Building envelope
The building envelope, being the only thing separating the indoor and the outdoor environ-ment as discussed before, may be the most important aspect in terms of energy considerations. For this reason Structural Insulated Panels (SIPs) will be used. While there are many benefits to using SIPs, the biggest by far is the high r-value. R-value is an important factor as it is the thermal resistance of a material, which dictates how fast temperature differences move through a material. These panels typically range from an r-value of 14 all the way up to an r-value of 58 according to the Structural Insulated Panel Association. When comparing SIPs to a standard wall with an r-value of 19, SIPs can triple that value resulting in a better- performing wall. For the purpose of this study, an r-value of 58 will be used for the walls and roof of this project.
4.2.1 Fenestration systemsFenestration is one of the biggest contributors to heat losses in the building envelope so it is important that it is limited, and that an insulated window is used. For this reason a wall-to-window ratio of 40% will be used as it is a code maximum, and triple pane low E glazing with thermal breaks in the frame will be used in all fenestrations.
4.3 Heating Ventilation and Air Conditioning system
The building envelope and HVAC system work together to condition and maintain interior spaces, so it is important that a high efficiency system is selected. According NYSERDA in 2015 Rochester had 6,426 heating degree days and 681 cooling degree days [8]. This puts a significance on the efficiency of the heating system as it is used most of the time.
4.3.1 Heating systemWith the cooling season being intermittent and heating being a major part of the year as seen above, efficiency is the main concern. For this reason a tankless boiler and hot water heater will be used in this project. Since most manufacturers are able to produce efficiency rating of 95%, it becomes the best choice for its modularity and efficiency.

C. Rau, Int. J. Sus. Dev. Plann. Vol. 12, No. 3 (2017) 585
4.3.2 Cooling systemTo address the cooling needs during the summer, natural ventilation will be used as often as possible. For that reason, a chilled beam system will be incorporated to be as efficient as pos-sible when cooling rooms during these times. Being efficient is necessary because while there are a few times when this would be needed, cooling is an energy intensive process.
4.4 Lighting system
Lighting systems consume about 40% of typical energy in a building, so it is important to allow for reductions in watts per square foot by using ASHRAE reductions as well as using LED lighting.
4.4.1 Energy efficiency and light power densityTo reduce that 40% of energy consumption, two options will be deployed, the watts per square foot will be reduced as per Ashrae standards, while also reducing our Light Power Density (LPD). To do this, LED light fixtures can be used, by decreasing the LPD by 90% should allow for a possible reduction of about 20%. According to Jinsung Byun et al., by using LEDs, it is possible to reduce our consumption by about 20% [9].
4.4.2 Day lightingIncorporating day lighting controls into the model allows for an analysis of how much energy can be offset by supplementing artificial light with natural light. In this study the building is day lighted to LEED Version 4 requirements. Using this technique lighting energy consump-tion can be cut even further if used in tangent with daylighting controls.
4.5 Renewable energy systems
One of the main aspects of a positive energy building is that it generates more energy than it consumes. While this is traditionally done with a photovoltaic system, this study will also implement a fuel cell in order to supplement the photovoltaic system during times when more power is needed.
4.5.1 Photovoltaic systemFor this study a single crystalline photovoltaic panel will be used because it has one of the highest efficiencies on the commercial market at 13.8%. Roof coverage will be approxi-mately 95%. This can be accomplished because none of the surrounding buildings cast a shadow on the new building due to its height, location, and orientation, allowing for the maxi-mum amount of solar time to occur.
4.5.2 Fuel cell technologyFuel cell technology is beginning to become commercially available, and the option to burn hydrogen and create electricity is appealing. The positive about these systems is that while hydrogen is recommended, they can create hydrogen out of a standard natural gas input. A running fuel cell creates two by-products, water and heat. For this study, a 300-kWh fuel will be installed with an included heat capture device to help further offset heating cost in the winter.

586 C. Rau, Int. J. Sus. Dev. Plann. Vol. 12, No. 3 (2017)
5 ENERGY MODELUsing the building considerations listed above, a simulation of a building energy model will be created using Revit. In order to determine how much energy and CO2 e proposed building will generate and offset, three things need to be determined: the building system boundary, annual energy consumption, and annual energy offset. After that an energy balance can be determined.
5.1 Building systems boundary
To determine the amount of energy consumed and offset by the building, a system boundary needs be established. In this study, Green Building Studio was used to run the analysis, and a predefined system boundary was used. This predefined system boundary consists of the fol-lowing seven factors: building geometry, spaces and thermal comfort, surfaces and heat transfer, material properties, buildings systems, loads from occupancy and exterior condi-tions, and lastly, heat transfer modelled over time. This system boundary allows for an accurate estimation for energy consumption and energy offset.
5.2 Energy consumption
After running the simulation, the buildings schematic energy consumption has been esti-mated at 2,857,959 kWh per year. In order to understand this number in relation to GHG emissions and city energy usage it needs to be converted to mBtu and CO2 e. See the conver-sion factors listed below.
1 kWh = 3,413 Btu (1)1 kWh = 6.89551 × 10⁻⁴ MT CO2 (2)
With similar terms, the proposed building only emits about 1970.7 MT CO2 e and con-sumes 9,754,214 mBtu of energy per year, which seems like a significant amount, but this does not account for strategies such as natural ventilation.
5.3 Energy offset
Considering energy offsets, there are two main factors to consider: active systems such as renewable energy systems, and passive systems such as natural ventilation and day lighting.
5.3.1 Passive strategiesPassive systems, such as day lighting and natural ventilation, are the most obvious. Since day-lighting was deducted when initially running the energy analysis in green building studio, the only other strategy that needs to be accounted for is natural ventilation. While green building studio does not include this in its energy calculation, it does calculate natural ventilation poten-tial. With natural ventilation being able to reduce the carbon footprint by 949.3 MT CO2 e, using the conversion factors above that accounts for 1,376,402 kWh per year.
5.3.2 Active strategiesIn this study, there are only two active or renewable energy systems considered: photovoltaics and hydrogen fuel cell technology. The photovoltaic system on the roof could produce as

C. Rau, Int. J. Sus. Dev. Plann. Vol. 12, No. 3 (2017) 587
much as 743,324 kWh per year. This number has been calculated by green building studio using the National Renewable Energy Labs calculation method, which accounts for typical weather conditions throughout the year in a specific location. For the fuel cell installation, as stated above, a 300 kWh hydrogen fuel cell will be used in the project allowing for the crea-tion of 2,620,800 kWh annually if ran 24/7.
5.4 Energy balance
To determine the energy balance for the proposed building, a simple calculation of energy consumed minus energy offset will be completed. While the building consumes 2,857,959 kWh, and the building produces 4,740,526 kWh that leaves a positive energy contribution of 1,882,567 kWh or 6,425,201 mBtu. This calculation will allow for the direct comparison with the city’s energy usage.
6 DISCUSSION/CONCLUSIONThese results show that creating a positive energy building in an urban environment is not only possible, but can be very successful. Suppling about 1.9 million kWh to the grid allows this building to make a significant contribution to the surrounding urban context. In fact it could possibly accelerate that goal depending on the amount and size of the buildings that are constructed in the proposed time frame. Excluding the factor of time, it would take approxi-mately 784 buildings to produce the amount of electricity that the downtown district of Rochester currently consumes. While it may be unrealistic to assume that 784 buildings of equal size and energy offset can be created, if Rochester cuts its energy consumption by 20%, and the 34% of renewable energy that is already supplied to the grid is accounted for, that would mean that it would only take 393 buildings to accomplish the same. With this in mind, the strategic placement of positive energy buildings throughout the city, shown in Fig. 5, shows how the downtown center of Rochester could be supplemented by green energy and become carbon neutral. Understanding that each and every new or renovated building can not
Figure 5: Proposed downtown quadrant grid.

588 C. Rau, Int. J. Sus. Dev. Plann. Vol. 12, No. 3 (2017)
be the same size or create the same offset, it can be assumed that the energy offset has a rela-tionship to the amount of energy consumed. Therefore, using this paper as an example, a positive contribution of about 60% of building energy consumption could be used to supply the surrounding urban context. With this, I believe that aligning with and completing the goal of a carbon neutral downtown Rochester by 2050 is a definite possibility.
REFERENCES[1] Quick Facts Rochester New York, United States Census Bureau, Available at http://
www.census.gov/quickfacts/table/PST120215/3663000[2] U.S. Energy Information Administration, Emissions of Greenhouse Gases in the United
States 2009, p. 2, 2011.[3] New York Power Authority, Five Cities Energy Plan: City of Rochester, p. 17, 2015.[4] Sweden Tackles Climate Change, Available at https://sweden.se/nature/sweden- tackles-
climate-change/[5] NPCC Upstate NY Power Profiler, United States Environmental Protection Agency,
Available at https://oaspub.epa.gov/powpro/ept_pack.charts[6] New York Power Authority, Five Cities Energy Plan: City of Rochester, p. 24, 2015.[7] Rochester Climate Narrative, National Weather Service, Available at http://www.
weather.gov/buf/ROCclifo[8] Monthly Cooling and Heating Degree Day Data, New York State Energy Research and
Development Authority, Available at http://www.nyserda.ny.gov/About/Publications/EA-Reports-and-Studies/Weather-Data/Monthly-Cooling-and-Heating-Degree- Day-Data
[9] Jinsung, B., Insung, H., Byoungjoo, L. & Sehyun, P., Intelligent household LED light-ing system considering energy efficiency and user satisfaction. IEEE Transactions on Consumer Electronics, 59, pp. 70–76, 2013.http://dx.doi.org/10.1109/TCE.2013.6490243