Support to Fisheries: Levels and Impacts · OECD (2017), “Support to fisheries: Levels and...
48
Support to Fisheries: Levels and Impacts May 2017
Transcript of Support to Fisheries: Levels and Impacts · OECD (2017), “Support to fisheries: Levels and...

Support to Fisheries: Levels and ImpactsMay 2017

OECD FOOD, AGRICULTURE AND FISHERIES PAPERS
This paper is published under the responsibility of the Secretary-General of the OECD. The opinions
expressed and the arguments employed herein do not necessarily reflect the official views of OECD
countries.
The publication of this document has been authorised by Ken Ash, Director of the Trade and
Agriculture Directorate.
This paper and any map included herein are without prejudice to the status of or sovereignty over any
territory, to the delimitation of international frontiers and boundaries and to the name of any territory,
city or area.
The statistical data for Israel are supplied by and under the responsibility of the relevant Israeli
authorities. The use of such data by the OECD is without prejudice to the status of the Golan Heights,
East Jerusalem and Israeli settlements in the West Bank under the terms of international law.
Comments are welcome and may be sent to [email protected].
Please cite this paper as:
OECD (2017), “Support to fisheries: Levels and impacts”, OECD Food, Agriculture and Fisheries Papers, No. 103, OECD Publishing, Paris. http://dx.doi.org/10.1787/00287855-en
© OECD (2017)
You can copy, download or print OECD content for your own use, and you can include excerpts from OECD publications, databases and multimedia products in your own documents, presentations, blogs, websites and teaching materials, provided that suitable acknowledgment of OECD as source and copyright owner is given. All requests for commercial use and translation rights should be submitted to [email protected].

OECD FOOD, AGRICULTURE AND FISHERIES PAPERS N°103 © OECD 2017
SUPPORT TO FISHERIES: LEVELS AND IMPACTS
The OECD Fisheries Support Estimate (FSE) database collects and classifies information on budgetary
transfers to the fisheries sector in 31 countries that together account for 35% of global fisheries landings. In
2015, the most recent year, it inventories policies and programmes totalling USD 7 billion. Most of this
support is found to be directed towards general services to the fishing sector, mainly in the form of fisheries
management costs, but also for, inter alia, infrastructure, research and stock enhancement. Approximately
USD 500 million per year is used for programmes that deliver funds directly in the hands of fishers. The share
of this form of support has been decreasing over time. Payments based on the use of variable inputs are found
to be the most likely to provoke increased fishing effort, while payments based on fixed capital formation are
most likely to encourage increased capacity levels. Payments based on fishers income are less likely to
increase effort or capacity and may be more effective at improving the welfare of fishers. Payments to general
services for the sector are least likely to increase effort or fishing capacity.
Key words: Fisheries support, subsidies, overcapacity, overfishing
JEL codes: Q22, H23, H53, H54
Acknowledgements
This note was prepared by Roger Martini, James Innes and Fabiana Cerasa of the Trade and Agriculture
Directorate (TAD) at the OECD. The authors are grateful to Franck Jesus, Rachel Bae, and the whole
TAD/NRP Fisheries team for helpful discussions. The indispensable help of Stéphanie Lincourt and
Michèle Patterson in preparing this document for publication is gratefully acknowledged.

SUPPORT TO FISHERIES: LEVELS AND IMPACTS – 3
OECD FOOD, AGRICULTURE AND FISHERIES PAPERS N°103 © OECD 2017
Table of contents
Executive summary ............................................................................................................................................ 4
Fisheries subsidies are suspected of having important trade and environmental impacts .................................. 6
Measurement of support to fisheries .................................................................................................................. 8
The FSE database and indicators of policy support to fisheries ....................................................................... 13
Estimating impacts of support to fisheries ....................................................................................................... 24
References ........................................................................................................................................................ 33
Annex. Some supporting analysis .................................................................................................................... 36
Annex references .............................................................................................................................................. 45
Tables
Table 1. Past OECD work measuring support to fisheries ....................................................................... 8 Table 2. Classification of subsidies following Sumaila et al. ................................................................. 27 Table 3. Long-term effects of cost-reducing or revenue-enhancing subsidies ....................................... 28 Table 4. Summary of results on degree of impact of policies ................................................................ 31
Figures
Figure 1. Schematic representation of alternative definitions of fisheries support .................................. 10 Figure 2. FTC transfer value as % of reported FSE, 2008 ....................................................................... 11 Figure 3. Components of the FSE............................................................................................................ 14 Figure 4 Evolution of the Fishery Support Estimate, OECD countries, 2009-15 ................................... 17 Figure 5. GSSE is mainly directed to resource management and TIF is mainly based on income ......... 18 Figure 6. Evolution of total support to fisheries (total FSE) by country, 2009-11 to 2014-15 ................ 20 Figure 7. Total policy support to commercial fisheries as a share of value of landings, 2015-15 ........... 21 Figure 8. Patterns of change in the FSE, 2009-1 to 2014-15 ................................................................... 22 Figure 9. GSSE share and composition, 2009-11 to 2015 ....................................................................... 23 Figure 10. Decomposition of management of resoures ............................................................................. 24 Figure A1. Support to variable input use in an open access fishery ........................................................... 36 Figure A2. Support with a TAC and limited entry ..................................................................................... 37 Figure A3. Correspondence of total cost and output .................................................................................. 38 Figure A4. Producer surplus and rent under TAC ...................................................................................... 39 Figure A5. Incomplete TAC enforcement allows supply response to support ........................................... 40
Boxes
Box 1. Fisheries subsidies in WTO negotiations ................................................................................... 6
Box 2. Indicative list of transfers in the FSE by category ................................................................... 15
Box 3. Key Findings of Financial Support to the Fisheries Sector ..................................................... 25

4 – SUPPORT TO FISHERIES: LEVELS AND IMPACTS
OECD FOOD, AGRICULTURE AND FISHERIES PAPERS N°103 © OECD 2017
Executive summary
Various bodies, including the OECD, have been calling for more transparency and better understanding
of the effects of fisheries support since the 1980s. These calls have been motivated by concerns that some
forms of support may complicate sustainable fisheries resources management by promoting overcapacity and
overfishing. Currently, negotiations are taking place at the WTO and countries are working to implement the
UN Sustainable Development Goal 14.6, with the aim to eliminate all such harmful fisheries subsidies.
Over the entire period of discussions at the WTO, there has never been a complete inventory of the
subsidies under discussion or a common understanding of their impacts. This information vacuum has largely
been filled by broad assumptions and estimates that may be more misleading than helpful. OECD expertise in
policy measurement and evaluation can bridge this gap by providing a process through which authoritative
information can be developed and disseminated.
This report describes the latest OECD inventory of support policies in participating countries. These are
defined as policies that generate a transfer from taxpayers to fishers. It also provides a review of the past
literature on the nature and effects of support to the fisheries sector, including a preliminary analysis to
identify the factors that determine how support can affect overcapacity and overfishing, including illegal
fishing, along with their likely benefits.
The OECD Fisheries Support Estimate (FSE) database contains information on support policies
implemented in 31 countries, including four outside the OECD. These countries represent 35% of global
fisheries landings by volume. This database currently contains data from 2009 to 2015, and is updated
annually. This database will expand to cover 37 countries representing more than half of global landings by
the end of 2017.
The total value of support provided by these policies was USD 7 billion in 2015, an amount that has been
mostly stable over time, with some decline over the review period as share of the gross value of landings. The
majority of reported support is in the form of general services to the fishing sector, not payments directed to
fishers individually. Of this general support, the majority is to cover the costs of fisheries management,
monitoring and control, infrastructure and research. The amount of GSSE support is quite substantial,
amounting to around 20 percent of the landed value of fisheries in countries participating in the FSE. The
relative share of support to general services in the FSE has been increasing over time, with the relative
importance of transfers to individual fishers gradually decreasing.
Three categories—beneficial, harmful, and ambiguous—are often used to describe the effects of support
on capacity and fishing effort. A better conceptual model considers relative degrees of impact. The relative
degree of impact is estimated using an economic analysis of the case where fishers can flexibly increase their
use of purchased inputs like fuel or bait in response to price changes but have only limited opportunity to
adjust physical capital such as vessels in the short to medium term. Future OECD work will connect the FSE
data to an empirical model to better understand and quantify these impacts, but some observations on the
likely effects are already possible from the evidence in the literature and economic analysis.
SUPPORT TO FISHERIES: LEVELS AND IMPACTS – 5
OECD FOOD, AGRICULTURE AND FISHERIES PAPERS N°103 © OECD 2017
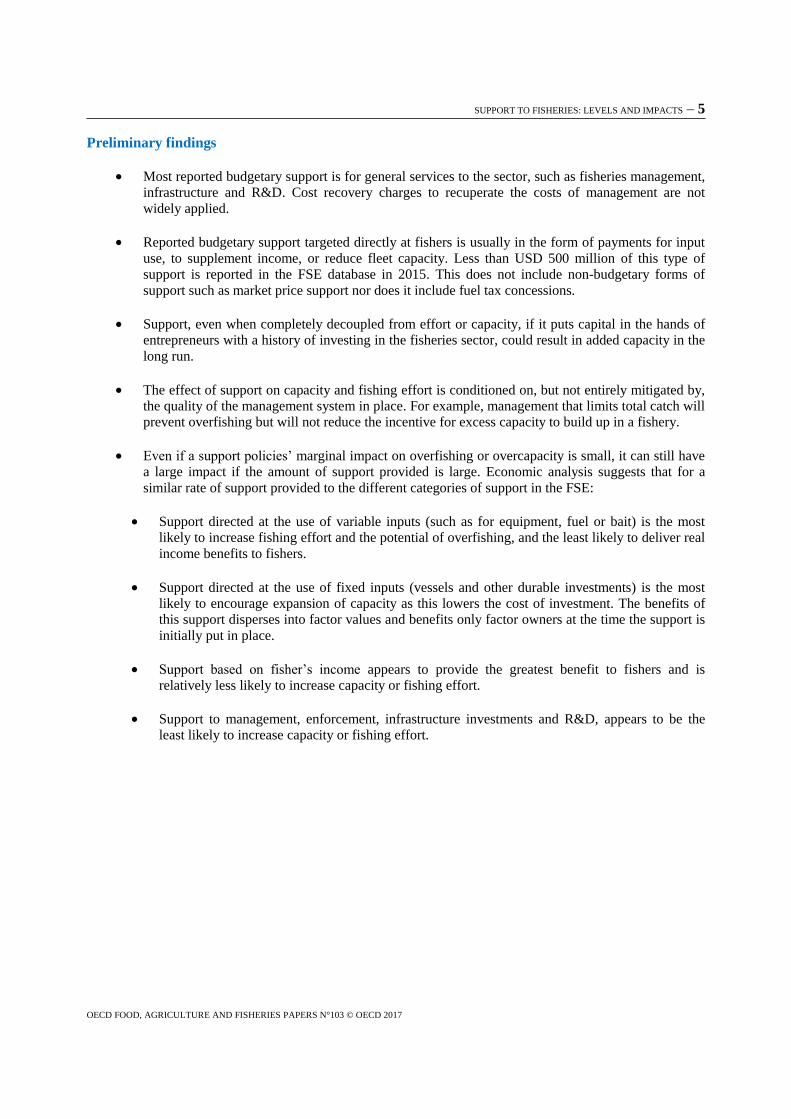
Preliminary findings
Most reported budgetary support is for general services to the sector, such as fisheries management,
infrastructure and R&D. Cost recovery charges to recuperate the costs of management are not
widely applied.
Reported budgetary support targeted directly at fishers is usually in the form of payments for input
use, to supplement income, or reduce fleet capacity. Less than USD 500 million of this type of
support is reported in the FSE database in 2015. This does not include non-budgetary forms of
support such as market price support nor does it include fuel tax concessions.
Support, even when completely decoupled from effort or capacity, if it puts capital in the hands of
entrepreneurs with a history of investing in the fisheries sector, could result in added capacity in the
long run.
The effect of support on capacity and fishing effort is conditioned on, but not entirely mitigated by,
the quality of the management system in place. For example, management that limits total catch will
prevent overfishing but will not reduce the incentive for excess capacity to build up in a fishery.
Even if a support policies’ marginal impact on overfishing or overcapacity is small, it can still have
a large impact if the amount of support provided is large. Economic analysis suggests that for a
similar rate of support provided to the different categories of support in the FSE:
Support directed at the use of variable inputs (such as for equipment, fuel or bait) is the most
likely to increase fishing effort and the potential of overfishing, and the least likely to deliver real
income benefits to fishers.
Support directed at the use of fixed inputs (vessels and other durable investments) is the most
likely to encourage expansion of capacity as this lowers the cost of investment. The benefits of
this support disperses into factor values and benefits only factor owners at the time the support is
initially put in place.
Support based on fisher’s income appears to provide the greatest benefit to fishers and is
relatively less likely to increase capacity or fishing effort.
Support to management, enforcement, infrastructure investments and R&D, appears to be the
least likely to increase capacity or fishing effort.

6 – SUPPORT TO FISHERIES: LEVELS AND IMPACTS
OECD FOOD, AGRICULTURE AND FISHERIES PAPERS N°103 © OECD 2017
Fisheries subsidies are suspected of having important trade and environmental impacts
Various bodies, including the OECD, have been calling for more transparency and understanding of the
impact of fisheries support since the 1980s. These calls have been motivated by concerns that some forms of
support may complicate sustainable fisheries resources management by promoting overcapacity and
overfishing.
WTO members began work to clarify the rules regarding subsidies to the fishing sector in 2002 (Box 1).
This was motived by the view that often commercial fisheries are exploited, potentially exploited by more
than one nation, either because fishermen from more than one country operate in the same area or because the
fish migrate from one jurisdiction to another. As a result, fisheries subsidies may not have just an impact on
trade, but an additional effect of hindering a trading partner’s ability to produce fish products if one country
subsidises its fisheries to the extent that the resource is diminished. Three implications are noted:
For shared or migratory stocks, countries that do not subsidise and that restrain total catch to
maintain resources at a biologically sustainable level lose the extra catch to countries that subsidise
and do not restrain total catch.
Competition from subsidised distant water fleets can make it economically unviable for developing
countries to develop their own fisheries and therefore to realize the benefits of their own 200-mile
zones of fishery jurisdiction.
Subsidies can contribute to stock depletion and ecosystem impoverishment, with negative
economic, trade and environmental effects for other countries that have an interest in the stock
(Shrank, 2003).
There has been some debate on whether subsidies to fishing or deficiencies in fisheries management
(which typically aims to ensure sustainable exploitation of the resource) are the more important contributor to
overfishing and overcapacity. Achieving effective fisheries management and sustainable fisheries will require
making progress in both areas. The management system can address the negative effects of certain subsidies
(e.g. setting a total allowable catch and allocating individual transferable quotas limits overfishing and
excessive capital investment), but only when it is effective, enforced and provides the right incentive to fishers
to operate at an optimal level of capital investment and effort. Subsidies in turn can put pressure on the
management system by giving incentives to increase desired effort above allowed levels, encouraging both
IUU fishing and lobbying to increase allowed effort.
Box 1. Fisheries subsidies in WTO negotiations
Fishery and aquaculture products are excluded from the WTO Agreement on Agriculture, instead being treated as an industrial sector or product. This classification, and the way they are subsequently handled within the definitions, concepts, and thresholds established in the 1994 Agreement on Subsidies and Countervailing Measures has meant that managing fisheries subsidies through multilateral trade regulations at the WTO has been difficult to date.
Early work on fisheries subsidies in the WTO was primarily undertaken in the Committee on Trade and Environment (CTE) where, from 1996, work was undertaken to investigate the environmental benefits of removing trade restrictions and distortions, and the case for examining fishing subsidies and their relation to WTO from both a trade and an environment perspective. Negotiations to clarify and improve disciplines on fisheries subsidies were then formally started at the Doha Ministerial Conference in 2001 and, following the Hong Kong Ministerial Conference of 2005, text proposing an entirely new set of sector-specific disciplines for fisheries subsidies within the Agreement on Subsidies and Countervailing Measures was proposed by the Chairman of the Negotiating Group on Rules in 2007. Disagreement within the group over many issues resulted in a systematic revision process being undertaken in 2009 but there has been no further progress.
Since the middle of 2016, there has been new activity on fisheries subsidies at the WTO. A number of proposals are currently being worked on by member countries; these include disciplines focusing on subsidies in respect of IUU fishing and overfished stocks, those that contribute to overcapacity, and to an approach similar to that used by the Trade Facilitation Agreement to phased adoption of disciplines

SUPPORT TO FISHERIES: LEVELS AND IMPACTS – 7
OECD FOOD, AGRICULTURE AND FISHERIES PAPERS N°103 © OECD 2017
Better evidence can help advance progress
Making progress towards more sustainable and productive fisheries worldwide, through negotiations at
the WTO, or at a regional level with negotiation of trade agreements that include fisheries disciplines such as
the TPP, or efforts decided in the framework of the UN Sustainable Development Goals, requires supporting
information and analysis. Without a better understanding of the prevalence, scale, and effect of different types
of fisheries policies and a common appreciation of which programmes would be implicated by proposed
disciplines, the costs and benefits to fishers, the effect on the environment and sustainability, and the net
benefit of an agreement to the parties to it cannot be known.
Over the entire period of discussions at the WTO, there has never been a complete inventory of the
subsidies under discussion or a common understanding of their impacts. WTO notifications, the process by
which WTO members officially list and describe their support policies, are incomplete and out of date in most
cases. As of October 2016, a total of 89 members have not yet notified their fisheries subsidies for 2015.
Sixty-three members still have not made their notification for 2013 and 57 members still have not submitted
their 2011 notifications, which were due five years ago. Many of these members “either have never notified or
have done so only in the distant past,” according to the chair of the WTO’s Committee on Subsidies and
Countervailing Measures (WTO, 2016a).
OECD expertise in policy measurement and evaluation can bridge this gap, as evidenced by the role it
played in the Uruguay Round Agreement on Agriculture (URAA). This expertise can be applied to the
fisheries sphere in a similar way and with similar benefits. OECD work to improve the transparency of
fisheries support policies catalogues the current situation, provides orientations for beneficial reform, and
establishes a means to take stock of progress. More specifically:
A good understanding of existing fisheries support policies is an essential start. An inventory of
the programmes currently in place along with details of their design and implementation criteria is
an opportunity for peer learning and establishes the initial conditions for discussions.
Better understanding on the impacts of support to fisheries provides a basis for progress. It is
easy to agree to eliminate subsidies that are “harmful”; it is another thing entirely to agree on
exactly which subsidies fall in this category. Progress towards a more precise understanding
requires a solid foundation of analysis.
Monitoring the evolution of support over time demonstrates progress against goals. The UN
Sustainable Development Goals (SDG) 14.6 commits governments, by 2020 to prohibit certain
forms of fisheries subsidies that contribute to overcapacity and overfishing. Goals such as these
benefit from effective means to measure progress and success.
This report takes stock of existing information on fisheries support and presents the OECD Fisheries
Support Estimate (FSE) database, which provides official statistics on support to the fisheries sector structured
around a standardised questionnaire. This database is built in a collaborative process with participating
countries and economies. The report also reviews the existing literature, including investigating the
mechanisms through which different fisheries support programmes operate.
Fisheries support policies are in place to help achieve government objectives for fishers and fishing
communities. This report also investigates how the benefits of different categories of fisheries support are
distributed to help inform about what kinds of support may be relatively more effective at delivering benefits
to fishers.
Future work will deepen understanding of how support affects the decision-making of fishers and
outcomes in the fisheries sector by modelling the impact of FSE data on trade flows of fish products and
income generation for fishers.

8 – SUPPORT TO FISHERIES: LEVELS AND IMPACTS
OECD FOOD, AGRICULTURE AND FISHERIES PAPERS N°103 © OECD 2017
Measurement of support to fisheries
Previous studies and their limitations
OECD work
The OECD has published data on support to fisheries intermittently since 1965 and the Fisheries
Committee has expressed explicit interest in fisheries subsidies at least since 1987, setting the goal of
establishing “transparency on economic assistance measures, direct as well as indirect, and to develop an
analytical framework to help understand how these measures affect the industry” (OECD 1987). The OECD
next published an inventory of government assistance programmes in 1992, part of a package of inventories
that included tariff and non-tariff barriers as well as an inventory of fisheries management systems (OECD,
1992a; OECD, 1992b).
The early OECD perspective on support to fisheries was strongly founded in economic theory. The
report of the expert group convened by the OECD Fisheries Committee (COFI) in 1993 concluded that “The
concept of assistance to the fishing industry in a country should be defined as government intervention or lack
of government intervention which distorts the allocation of resources in that country relative to an efficient
allocation. This implies, for example, that lack of efficient management of the fish resources, restrictions on
free trade in fish, fish products and fishing services, restrictions on migration of fishermen and on foreign
investment in the fishing industry, constitute assistance”. This early work encompassed support as well to the
processing sector and included border measures such as tariffs and non-tariff barriers.
Later OECD work moved the point of central concern away from efficient allocation of resources to
ensuring that government support was compatible with sustainable levels of harvest. A major study of
“Government Financial Transfers” to fisheries titled Transition to Responsible Fisheries was published in
2000. The most recent OECD study of support to fisheries was in 2006, entitled Financial Support to
Fisheries--Implications for Sustainable Development.
The main limitation of past OECD work has been its partial geographical coverage. The 1992 reports
covered 22 countries, 24 were covered in 2000 and 24 in the 2006 Financial Support to Fisheries report. The
latest version of the fisheries support estimate database covers more countries than ever before, with a goal of
eventually including the majority of global support to fisheries provided by governments (Table 1).
Table 1. Past OECD work measuring support to fisheries
Report Number of countries
Reporting year
Transfers to
individual fishers
Transfers to general services
Total transfers
Value of landings
Transfers as % value of landings
Transition to Responsible Fisheries (2000)
24 1996 1 629 5 171 6 799 37 646 18%
Financial Support to Fisheries (2006)
24 2003 1 721 4 771 6 472 31 725 20.4%
This report 27+4 2015 433 6 497 6 780 33 188 20%
Note: Definitions of transfers to individual fishers and transfers to general support vary slightly in the different reports. This report presents data on 27 OECD members but the FSE database covers four additional countries (Argentina, Indonesia, Chinese Taipei and Colombia). Coverage in some participating countries may be incomplete.

SUPPORT TO FISHERIES: LEVELS AND IMPACTS – 9
OECD FOOD, AGRICULTURE AND FISHERIES PAPERS N°103 © OECD 2017
Non-OECD work
To date, only a handful of estimates of the total value of global fisheries subsidies have been made. The
main ones are Millazo (1998), FAO (1993), APEC (APEC region only) (2000) and the work led by the UBCs
Institute for Oceans and Fisheries that is reported online as part of the Seas Around Us project at
www.seaaroundus.org/ (Sumaila U. et al., 2010; Sumaila, Lam, Manach, Swartz, & Pauly, 2016). Of these,
the Seas Around Us project is the most recently updated, reporting data for 2003 and 2009.
The Seas Around Us data have by default become the most cited source of information on subsidies, but
this work has only a limited empirical basis. Half of all the observations in the database are estimated based
on extrapolations from other countries—30% of all observations in developed countries and over 60% of all
developing country data are estimated using “subsidy intensity” factors derived from available observations in
other countries.
The report by Milazzo was ground-breaking and is still influential in terms of defining fisheries subsidies
and their impacts. However, the estimate produced (USD 14-20 billion in global subsidies) is flawed and
limited in many ways. It is made up of the following components:
Direct budgetary support. Six case studies (Japan, the European Union, Norway, the United
States, Russian Federation, and the People’s Republic of China) are extrapolated to find a global
total. Policies are included following the WTO definition of subsidy (specific, actionable). The
extrapolation to the global total is roughly estimated with no analytical basis.
Lending and tax policies — based on anecdotal information and the assumption that capital
subsidies are equivalent to 10% of the value of loans.
Untaxed resource rents—assumed to be between 5% and 10% of landed value (this range is
behind the USD 14-20 billion range in the overall estimate).
Budgeted and unbudgeted shipbuilding and infrastructure subsidies—rough estimates.
Asia-Pacific Economic Cooperation (APEC) produced a study in 2000 that inventoried and classified
support policies in the APEC region.1 The authors of the study obtained responses to questionnaires for ten
participating economies and used other sources and direct contacts to ultimately report on 19 participating
economies, finding the total value of support equal to USD 12.6 billion. The report's method of classification
drew heavily on the work of the OECD at that time, as well as from Milazzo (1998).
One of the objectives of the APEC study was to assess the risk of challenge under WTO rules for the
support policies identified. Applying the WTO definitions of prohibited and actionable subsidies and using a
subjective evaluation based on past experience in the dispute resolution mechanism, the authors found that of
the 162 distinct subsidies identified, 29 were likely non-actionable, 133 were conceivably actionable, and 10
were of medium to high risk of challenge.
What constitutes support to fisheries?
There has been considerable debate regarding what constitutes a fisheries subsidy, dating back at least to
2001 when the subject was first taken up by the WTO. The major studies mentioned above helped to clarify
some terms of the debate, but have not definitively answered the primary questions of what is a subsidy to
fisheries, what is the total amount of these subsidies globally and what are their impacts.
OECD work prefers and uses exclusively the term “support” rather than subsidies to refer to the contents
of the FSE database, at least in part to avoid becoming entangled in the debate over subsidy definitions. Not
1. The participating APEC economies are: Australia, Brunei Darussalam, Canada, Chile, the People’s Republic
of China, Hong Kong-China, Indonesia, Japan, Korea, Malaysia, Mexico, New Zealand, Papua New Guinea,
Peru, Philippines, Russian Federation, Singapore, Chinese Taipei, Thailand, United States, and Viet Nam.

10 – SUPPORT TO FISHERIES: LEVELS AND IMPACTS
OECD FOOD, AGRICULTURE AND FISHERIES PAPERS N°103 © OECD 2017
every support policy in the FSE would be considered a subsidy in the WTO sense. When the term subsidy is
used in this report, it is in reference to other research or the content of global discussions on that subject.
The 2006 OECD report Financial Support to the Fisheries Sector contains a useful schematic of the
different possible dimensions of a definition of fisheries support (Figure 1). This starts with the WTO
definition as a basis and shows how this can be expanded. Some of these elements and the reasons for their
inclusion or exclusion are discussed in the following subsections.
Budgetary transfers
Budgetary transfers are the most visible form of policy support. They are most easily measured as they
are observed and do not need to be estimated as is the case with the tax exemptions and price support.
Budgetary information mainly comes from the government institution responsible for fisheries. The most
common exception for this is enforcement expenditures made as part of coast guard activities.
The main emphasis of the FSE is on budgetary transfers, though some countries do report non-budgetary
policies such as fuel tax exemptions or market price support. The concept is based on the transfer of funds
from taxpayers or consumers to fishers, with a support policy being a programme that generates such a
transfer. This includes general services which provide a benefit to fishers, something which is discussed in
more detail below, but not the administrative costs of government itself.
Figure 1. Schematic representation of alternative definitions of fisheries support
Note: GFT=Government Financial Transfers are now reported in the FSE, Fisheries Support Estimate, database and the term GFT is no longer used. 1. MRE refers to management, research and enforcement. 2. Infrastructure is a grey area and is included in both the WTO and OECD definitions for reasons of inclusiveness.
Source: OECD (2006).
WTO
Agreement on
Subsidies and
Countervailing
Measures
OECD definition
of GFT used in
this study
MRE1 expenditure, access agreements,
infrastructure2 As above plus:
As above plus: Market price
support
OECD definition
including market
price support
As above plus:
Uninternalised
externalities,
untaxed rents,
negative subsidies
Broad definition of
subsidies (e.g. FAO)
A subsidy under Article 1 is a
financial contribution that
confers a benefit. This includes:
Direct transfers Potential direct transfers
Foregone government
revenue (tax exemption) Government provision of
goods & services other
than general
infrastructure
Grey areas in
WTO definition:
MRE1 expenditure, access agreements,
infrastructure2
Data from government budgets
Border
protection can be used as
approxim-
ation
Estimates can be obtained from
detailed
modelling

SUPPORT TO FISHERIES: LEVELS AND IMPACTS – 11
OECD FOOD, AGRICULTURE AND FISHERIES PAPERS N°103 © OECD 2017
Tax expenditures related to fuel use
The impact of policies related to the price paid for fuel (mainly diesel) by fishers is often highlighted by
those involved in the global subsidies debate, and they feature prominently in the work by Sumaila—USD 20
billion of the USD 35 billion global subsidies total estimated in his work are fuel supports (Sumaila, Lam,
Manach, Swartz, & Pauly, 2016). The high share of fuel costs in total costs of fishing makes government
policies influencing these costs potentially highly relevant to their objectives for preserving and promoting the
fishing sector.
For example, the World Bank report The Sunken Billions (2006) in its discussion of the impact of
subsidies also pays particular attention to fuel subsidies, using Sumaila's data as a basis. The report states that
"By reducing the cost of harvesting, for example through fuel subsidies or grants for new fishing vessels,
subsidies enable fishing to continue at previously uneconomic levels" (World Bank and FAO 2009, section
2.4).
Previous OECD work estimated the amount of fuel-tax concessions (FTCs) present in OECD fisheries as
USD 2 billion in 2008 (Martini, 2012). This work showed that FTCs affect the price of fuel for fishers in
almost every OECD country and that the level of support provided was comparable in many cases to the level
of budgetary support directed at the fisheries sector (Figure 2). The total FSE in the OECD region (excluding
support to fuel) was USD 6.7 billion in 2015.
The EU reports fuel consumption and fuel efficiency of the fleet as part of its Annual Economic Report
on the EU Fishing Fleet (the most recent edition is STECF 2016). This reports a decline in fuel consumption
of 16% between 2008 and 2014. A study on the value of fuel support to the fisheries sector (Borrello, Motova
and Dentes De Carvalho, 2013) estimates the value of the transfer generated by fuel tax exemptions in EU
member states to be EUR 1.05 billion over the period 2002-2011.
The OECD FSE database does not systematically collect data on fuel tax concessions, as one criterion
for inclusion is that a policy be primarily directed at the fisheries sector, an evaluation that is left to
participating countries. Most EU countries report FTCs in their data submissions to the OECD FSE, though
few other countries outside the European Union do so.
Figure 2. FTC transfer value as % of reported FSE, 2008
Note: Data for 2008 except as noted: 2007 for Australia and Japan; New Zealand fuel consumption estimate 2005; GFT estimate for Mexico and Poland from 2007.
Source: Martini, R. (2011).
0
10
20
30
40
50
60
70
80
90
AUS BEL CAN CHL DNK EST FIN FRA DEU GRC ISL IRL ITA JPN KOR LVA MEX NLD NZL NOR POL PRT SVN ESP SWE TUR GBR USA
%

12 – SUPPORT TO FISHERIES: LEVELS AND IMPACTS
OECD FOOD, AGRICULTURE AND FISHERIES PAPERS N°103 © OECD 2017
Meanwhile, discussions regarding support to fuel use across sectors have been taken up in a broader
context. Elimination of fossil fuel subsides is an objective of the G20; the Leader's Statement from the 2009
Pittsburgh Summit (G20, 2009) sets an objective:
To phase out and rationalize over the medium term inefficient fossil fuel subsidies while providing
targeted support for the poorest. Inefficient fossil fuel subsidies encourage wasteful consumption,
reduce our energy security, impede investment in clean energy sources and undermine efforts to
deal with the threat of climate change.
The G7 Ise-Shima Leaders’ Declaration (2016) revisits this pledge, noting “We remain committed to the
elimination of inefficient fossil fuel subsidies and encourage all countries to do so by 2025.”
Market price support and other trade barriers
Market price support occurs when, as a result of government policy, the domestic price of a product is
greater than the world market price. This support is normally created by trade restrictions and import or export
duties. An attempt to assess whether market price support, as a broad concept, could be meaningfully
estimated in the OECD GFT was undertaken in the early 1990s using cod as a case study. The conclusion was
that the inherent technical problems in estimating a producer support estimate proved too great an obstacle.
The primary problem concerned the heterogeneous nature of the fisheries commodity market and the
consequent difficulty in establishing a world reference price from which price gaps can be measured2. The
current FSE does not systematically collect market price support data, but maintains it as part of the
classification. A small number of countries provide this data, but it is not used in overall reporting or
indicators.
One of the complicating factors when evaluating the trade distortions introduced by support is that the
fisheries management system already represents a de facto output control system. This confounds estimation
of price and trade effects of other policies and leaves an unclear counter-factual for the condition that would
prevail absent support. Munk and Motzfeldt (1993) enumerate in detail the difficulties in measuring trade
distortions related to fisheries policies. They summarise the situation as follows:
The measurement of trade distortion is particularly difficult in the case of the fishing industry for
the following three reasons: Firstly, the occurrence of market failure in the fishing industry implies
that an efficient allocation cannot be obtained without government intervention. The benchmark
against which to measure trade distortion does, therefore, in the case of the fishing industry, unlike
in other industries, require government intervention in the form of a management scheme. Secondly,
restrictions on the free flow of services in the form of restrictions on the access of foreign vessels to
national fishing grounds and to ports and port facilities constitute an important distortion to trade
which needs to be taken into account. Thirdly, it is particularly difficult to establish a model of the
fishing industry due to the complexity of the production function (Munk & Motzfeldt, 1993).
Resource rents
Resource rents are the profits above normal economic profits earned by fishers. These are usually
generated as a consequence of certain management systems and more generally defined as the shadow price of
access to the resource. Whether untaxed resource rents are considered support remains controversial. The
view of the OECD COFI in Economic Assistance to the Fishing Industry: Observations and Findings was: “If
the management regime does not require fishermen to take into account the full social costs of the fish they
harvest, then fishermen can be considered to be receiving an implicit subsidy on the use of the fish resources.
This also applies when fishermen are provided access to foreign waters when the access fees are paid by the
Government” (OECD, 1991). In Financial Support to the Fisheries Sector (OECD 2006), a more classical
economic view of resource rents was taken, considering only economic rents generated by the management
2 . See OECD (2006) for more of a discussion on this.

SUPPORT TO FISHERIES: LEVELS AND IMPACTS – 13
OECD FOOD, AGRICULTURE AND FISHERIES PAPERS N°103 © OECD 2017
system: “If the management instruments do not create conditions for the generation of resource rent to begin
with, … it is hard to justify counting that foregone revenue as support to the industry.”
Current OECD estimates of support in the FSE make no attempt to calculate untaxed resource rents. On
the other hand, taxed resource rents are considered to be “cost recovery” and enter the FSE with a negative
value. This leads for example to the case where Iceland reports a negative FSE in 2014, as resource rents are
excluded but their recovery through taxation is included as a negative. Milazzo (1998) included resource rents
(assumed to be between 5 and 10% of landed value), pointing out that in other natural resource industries
artificially low resource access charges have been successfully subject to challenge at the WTO (See the
Canada-US softwood lumber dispute for a long-running example).
Summary of the state of measurement of global support to fisheries
Except in the case of EU reporting of support under the European Fisheries Fund (EFF) and the
European Marine Fisheries Fund (EMFF), and the OECD FSE database, there is little in the way of recent
comparable international data on fisheries support. OECD work on measuring fisheries support is the only
sustained effort based mainly on direct data collection, but remains limited in its global coverage and
completeness with respect to different types of support.
The FSE database and indicators of policy support to fisheries
The FSE is a global database of support to fishers. It conveys two kinds of information necessary to
understand support. First, the FSE indicates the level of, and changes over time in the level, monetary
transfers from taxpayers to fishers resulting from fisheries support policies. Second, support estimates are
classified according to criteria regarding the implementation of the associated policy measure, thereby
highlighting the ‘initial incidence’ of the support measure for analytical purposes. The format for reporting
fisheries support has been revised since Financial Support to Fisheries (OECD 2006) was released. This
revision clarifies definitions and provides a more useful organisation of the data.
The FSE is a collaborative effort among governments to improve the transparency and accountability of
fisheries support policies. This is based on an agreed set of definitions and criteria for the reporting and
classification of support (OECD 2016) (Figure 3 and Box 3).
The objectives and priorities of fisheries policies in OECD countries cover a wide range of issues,
including managing fish stocks, preserving traditional communities and ways of life and securing production
of food. Policy instruments are equally varied, reflecting changes in domestic political priorities and economic
settings and developments in the international economic arena. Despite this diversity, policy measures applied
in a country within a certain period of time can be brought together and expressed in one or several simple
numbers – called support indicators – which are comparable across time and between countries. The utility of
doing this is three-fold:
Measuring and classifying support can be used to monitor and quantify developments in fisheries
policy.
Closely related to this, the data establish a common basis for policy dialogue by using a consistent
and comparable method to evaluate the nature and incidence of policies. The international
comparability of the data and wide country coverage makes it a useful tool for policy makers as
well as research institutions and other interested organisations.
Finally, the database is used in further research on policy impacts. The data can potentially serve as
inputs into modelling to assess the effectiveness and efficiency of policies in delivering the
outcomes for which they were designed and to understand their effects on production, trade,
income, the environment, etc. While the data cannot by themselves quantify these impacts, the
economic information upon which they are based is an important building block for further analysis.

14 – SUPPORT TO FISHERIES: LEVELS AND IMPACTS
OECD FOOD, AGRICULTURE AND FISHERIES PAPERS N°103 © OECD 2017
Figure 3. Components of the FSE
FSE
NON-BUDGETARY TRANSFERS
0. Non-Budgetary
transfers to individual
fishers
0.A. Market price support
0.B. Fuel tax concessions
BUDGETARY TRANSFERS
I. Budgetary transfers to individual fishers
I.A. Transfers based on input use
I.A.1. Transfers based on variable input use
I.A.2. Transfers based on fixed capital formation
I.A.2.1. Support for vessel construction or purchase
I.A.2.2. Support for modernisation
I.A.2.3. Support for other fixed costs
I.B. Transfers based on fisher's income
I.B.1. Income support
I.B.2. Special insurance system for fishers
I.C. Transfers based on the reduction of productive capacity
I.D. Miscellaneous transfers to fishers
II. General service support estimate
II.A. Access to other countries’ waters
II.B. Provision of infrastructure
II.B.1. Capital expenditures
II.B.2. Subsidised access to infrastructure
II.C. Marketing and promotion
II.D. Support to fishing communities
II.E. Education and training
II.F. Research and development
II.G. Management of resources
II.G.1. Management expenditures
II.G.2. Stock enhancement programs
II.G.3. Enforcement expenditures
II.H. Miscellaneous transfers to general services
III. Cost recovery charges
III.A. For resource access rights
III.B. For infrastructure access
III.C. For management, research and enforcement
III.D. Resource rent taxes and charges
III.E. Other

SUPPORT TO FISHERIES: LEVELS AND IMPACTS – 15
OECD FOOD, AGRICULTURE AND FISHERIES PAPERS N°103 © OECD 2017
Box 2. Indicative list of transfers in the FSE by category
Management, research and enforcement expenditure
Management expenditure Research expenditure
Enforcement expenditure Funding of information dissemination
Expenditure for information collection and analysis Expenditure on the protection of marine areas
Payments to support community based management Payments to producer organisations
Expenditure to promote international fisheries cooperation Support to improve the management of cooperatives
Fisheries infrastructure expenditure
Support to build port facilities for commercial fishers Reduced charges for use of government provided infrastructure
Fisheries enhancement expenditure Support to improve fishing villages
Support to enhance the fisheries community environment Regional development grants
Expenditure on exploratory fishing Support for artificial reefs
Aid for restocking of fish resources
Payments for reductions in productive capacity
Vessel decommissioning schemes Buyouts of licences and permits
Buyouts of quota and catch history
Income support and unemployment insurance
Income support Unemployment insurance
Price support payments to fishers Grants to small fisheries
Direct aid to participants in particular fisheries Grants for the temporary withdrawal of fishing vessels
Temporary grants to fishers and vessel owners Compensation for closed or reduced seasons
Compensation for damage from predators on fish stocks Disaster relief payments
Retirement grants for fishers Income guarantee compensation
Grants for retraining of fishers into other activities Vacation support payments
Grants to set up temporary or permanent joint ventures Income tax deductions for fishers in other countries
Payments based on variable input use
Support for crew insurance
Reduced charges for government services Provision of bait services
Underwriting of insurance costs Low cost insurance
Payments to reduce accounting costs Support for development of deep-sea fisheries
Interest subsidies for the purchase of machinery and equipment for fishing vessels
Payments based on fixed capital formation
Low cost loans to young fishers Low cost loans to specific fisheries
Interest rebates Loan guarantees
Contributions to match private sector investments
Tax exemptions for deep-sea vessels
Grants for new vessels Grants for modernisation
Subsidised loans for vessel construction Subsidised loans for vessel modernization
Loan guarantees for vessel construction Loan guarantees for vessel modernisation
Grants for purchase of second-hand vessels Interest subsidies for the purchase of second hand vessels
16 – SUPPORT TO FISHERIES: LEVELS AND IMPACTS
OECD FOOD, AGRICULTURE AND FISHERIES PAPERS N°103 © OECD 2017
Fisheries support policies may provide direct payments to fishers, or they may support the sector in
general through management, harbours and other infrastructure. The common element to all these policies is
that they generate a transfer. The concept of “transfer” presumes both a source of the transfer and the
existence of a recipient. In the present method, fishers are the recipient of policy transfers and taxpayers are
the source, i.e. the group bearing the cost of fisheries support. The term “fisheries” designates fishers as an
economic group. Fishers are viewed from two perspectives – as individual entrepreneurs, and collectively
(i.e. as a sector). These distinctions underlie the key dimensions in which fisheries support is measured and
the basic structure of the indicators.
Scope and content of the FSE database
The fishing sectors of OECD members accounted for 27% of world capture fisheries landings by volume
(24.8 million tonnes) in 2015 (FAO 2017), and the FSE database contains data on most OECD member
economies with significant marine fisheries. The current version of the FSE contains data for 2009 to 2015,
with some earlier data available for certain programmes.
Budgetary policy support to the capture fisheries sector in OECD countries resulted in net transfers
totalling a reported USD 6.74 billion in 2015. The total support reported in the FSE database including the
four non-OECD countries currently participating is almost USD 7 billion. The vast majority of this was
provided in the form of support to general services (GSSE) which, after accounting for cost recovery charges
of USD 0.16 billion, are estimated to have totalled USD 6.30 billion. The remaining USD 0.43 billion of
support was provided in the form of transfers to individual fishers (TIF). Support considered as falling within
the category of general services includes: access to other EEZs, infrastructure, marketing and promotion,
community support, education and training, research and development, management of resources. Transfers
that support fishers individually include support that: reduces variable or fixed costs, maintains income, and
payments to reduce capacity (Figure 4).
Instances of non-reporting have left some gaps, particularly for categories relating to support in the form
of management and enforcement expenditures. Under the assumption that all fisheries systems face costs
associated with management and enforcement, and to ensure that non-reporting did not result in aggregate
levels of support being incomplete, these gaps are currently filled with estimates. The missing values for
management and enforcement support were estimated by deriving the average ratio of support to value of
landings observed in reporting countries and applying this to the value of landings in non-reporting countries.
Again, the secretariat is working with reporting countries to fill these gaps and eliminate the need for
estimates3.
Support as a proportion of the value of landings has decreased at the OECD level
Care needs to be taken when assessing how absolute levels of support to fisheries have changed over
time at the OECD level as the number of countries for which data is available in the FSE database is not
constant and has recently increased, and reporting from participating countries is not comprehensive in all
years; under-reporting may skew trends in the data.
Moreover, and in particular at the country level, the delivery of support can vary considerably from year-
to-year in the context of a multi-year programme. Wherever possible the base period when considering
3. Data on the value of landings is currently only available up to the year 2014, whilst the FSE database contains
data on support up to and including 2015. Estimated management and enforcement expenditures in 2015 were
therefore calculated using the value of landings for that country in 2014 and indicators where the value of
landings is used to contextualise the level of support also use value of landings from 2014 under the
assumption that this will have not changed significantly from one year to the next. In all cases, if the data used
in an indicator or associated figure is not for 2015 this is stated in the text or in a note appended to the figure.
Following this approach the indicators presented here provide the most up-to-date and complete picture
currently possible of support to fisheries over the period 2009-15.

SUPPORT TO FISHERIES: LEVELS AND IMPACTS – 17
OECD FOOD, AGRICULTURE AND FISHERIES PAPERS N°103 © OECD 2017
individual country data has been set as the annual average of 2009-11 and the reference period the annual
average of 2014-15. This means that changes in support are currently being assessed over a period of time that
may be too short to accurately discern trends. This situation will improve as additional data is collected and a
longer time series develops.
When the component parts of the FSE are considered it can be seen that the majority of budgetary policy
support has always been provided to the fishing industry in the form of GSSE, TIF only ever making up a
relatively small proportion of budgetary support (Figure 4). Missing from this picture though are non-
budgetary transfers to individual fishers, forms of support that include fuel tax concessions and market price
support, which are not currently reported by many countries. Because of this inconsistent reporting, and
because of disagreements regarding the status of fuel tax concessions as a form of support, these components
of the FSE are not included in indicators or figures, though they are available in the database.
Figure 4. Evolution of the Fishery Support Estimate, OECD countries, 2009-15
Percentage of gross value of landings
Note: When not reported value of landings data for EU countries have been obtained from the STECF 2016 Annual Economic Report on the EU Fishing Fleet (STECF 2016) (Belgium, France, Ireland, Latvia, Netherlands, Slovenia, United Kingdom), in other cases value was estimated by carrying over the value of the previous year. Where necessary the GSSE numbers reported here include estimates of management and enforcement expenditures based on rates of intensity observed in reporting countries.
Considered as a proportion of the gross value of landings, net reported support to fisheries (FSE) fell
consistently over the period 2009-14 before increasing slightly in 2015 (Figure 4). All references to total FSE
in this report are net of costs recovered, unless otherwise stated. The average rate of change in FSE to value of
landings at the OECD level was -3.8% per year, over the period 2009-11 to 2014-15. The ratios for transfers
to individual fishers (TIF) fell by -16.0% per year and support to general services (GSSE) by -2.1% per year
over the same period.
By 2014 transfers of public money accounted for USD 0.19 in every dollar of gross revenue generated
by the fisheries sector, a substantial (25%) decrease from the USD 0.25 observed in 2009. The subsequent
increase in 2015 (to USD 0.20) may represent a change in the trend but it is currently too soon to tell. An
increase in the absolute level of GSSE appears to have contributed to the observed change in this year but as
the 2015 indicator uses estimated landings values this may have also influenced the indicator for this year;
these values will be revised once value of landings data for 2015 becomes available.
-5
0
5
10
15
20
25
30
2009 2010 2011 2012 2013 2014 2015
Fisheries Supposet Estimate (FSE) General Services Support Estimate (GSSE)
Transfers to Individual Fishers (TIF) Cost Recovery Charges (CRC)%

18 – SUPPORT TO FISHERIES: LEVELS AND IMPACTS
OECD FOOD, AGRICULTURE AND FISHERIES PAPERS N°103 © OECD 2017
The importance of policies that support fishers collectively (in the form of general services or GSSE)
have increased
How support is provided has changed over time. The relative importance of transfers to individual
fishers has gradually decreased, partly as a consequence of total spending in this area tending to fall but also
because of overall increases in the amount spent on support to general services. The proportion of total FSE
coming from policies supporting GSSE has been increasing since 2009. After taking cost recovery charges
into account, GSSE support made up 94% of total FSE transfers at the OECD level in 2015, up from 85% in
2009.4
Figure 5. GSSE is mainly directed to resource management and TIF is mainly based on income
Note: Where necessary the GSSE numbers reported here include estimates of management and enforcement expenditures based on rates of intensity observed in reporting countries.
Forms of support categorised as falling within general services include: access to other EEZs,
infrastructure, marketing and promotion, community support, education and training, research and
development, management of resources. Fisheries management, which includes expenditure on management
programmes, surveillance and enforcement, and stock enhancement, accounts for the greatest part of general
services support and accounted for 74% of the value of OECD level GSSE in 2015 (Figure 5, left panel).
Provision of infrastructure (14%) and research and development (7%) accounted for most of the remaining
reported GSSE. The last 5%, assigned to the ‘Other’ category, includes support for: Miscellaneous transfers to
general services, Support to fishing communities, Access to other countries’ waters, Education and training
and Marketing and promotion. Of these, miscellaneous transfers to general services was the largest (2.2%).
4. Improved policy coverage in both the TIF and GSSE components of the FSE could change this picture.

SUPPORT TO FISHERIES: LEVELS AND IMPACTS – 19
OECD FOOD, AGRICULTURE AND FISHERIES PAPERS N°103 © OECD 2017
Support to individual fishers (TIF) is mainly directed at income
As the relative contribution of support to general services has increased in the FSE the relative
contribution of transfers to individual fishers has consequently declined (from 15% in 2009 to 6% in 2015)
(Figure 4). The TIFs reported in the FSE database are classified according to their implementation criteria,
and cover forms of support that depend on input use (reducing variable or fixed costs), those that maintain
incomes, and payments to reduce productive capacity. Transfers based on fisher income, e.g. income support
or insurance, accounted for the majority (54%) of direct support to individual fishers in 2015, followed by
capacity reduction (28%) and then transfers based on input use (17%) (Figure 5, right panel).
Cost recovery charges are small and not widely applied
Cost recovery charges (CRC) are typically levied in the context of offsetting the costs of providing
GSSE support. As a proportion of the annual value of landings, these have fluctuated at an average of 2-3% in
the countries that utilise CRC over the period 2009-15, in absolute terms they have fallen by 14% per year. Of
the 27 OECD economies represented in the FSE database at some point between 2009 and 2015 only nine
reported the use of cost recovery charges.
Annual average rates of change in total FSE are mixed and uneven at the country level
Country level-annual average rates of FSE change over the period 2009-11 to 2014-15 are mixed and
uneven (Figure 6). The majority have reduced reported support and in all but two countries the absolute
change is less than 10% per year. The smallest changes have generally occurred in the largest fisheries. The
largest proportional increase took place in New Zealand (+21% per year) and the largest decrease in Slovenia
(-23% per year). The numbers for New Zealand and Slovenia are affected by their relatively small bases and
have some of the smallest measured rates of support as a share of landed value. Large capital expenditures by
Slovenia on the provision of infrastructure in 2010-11 inflated the base period (2009-11) values above what
appears to be their normal level, most likely due to European Fisheries Funding (EFF) which ran 2007-13, and
resulted in the large subsequent fall in annual growth rate once this stopped (also visible in Figure 6). Support
to research and development in New Zealand is not currently included in their support data prior to 2012 and
has contributed to the sharp increase in their reported annual rate of change over the period considered; this
data is in the process of being revised.
It should be noted that a lack of reported FSE data for the period 2009-11 resulted in several countries,
some with major fisheries, having to be excluded from Figure 6 (Australia, Czech Republic, Germany,
Ireland, Japan and Latvia).
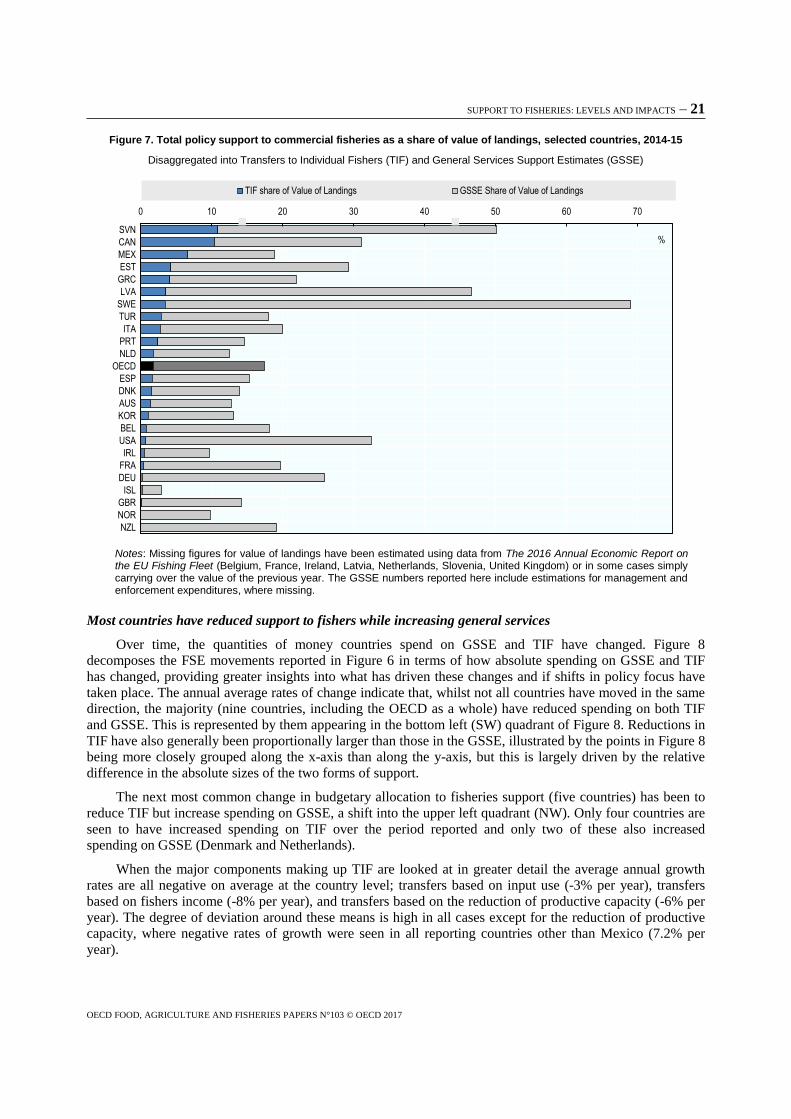
When the absolute level of policy support is considered as a proportion of the value of landings, all with
respect to their 2014-15 averages, the extent of country level support is contextualised (Figure 7). Again, a
high degree of variability is seen between countries when the extent of fishery support is assessed in these
terms, with FSEs ranging from as low as 3% of the total value of landings (Iceland) to as high as 66%
(Sweden). The proportionally high level of support seen in Sweden is the result of it having one of the smaller
fishery sectors in terms of absolute value of production (a small denominator) while at the same time
maintaining a well-developed set of GSSE polices to manage the sector.
Assessing support in the context of landings value overcomes some of the scale problems associated
with using absolute values, where members with large fisheries will be more likely to make larger transfers in
absolute terms, but interpreting the results still requires caution. Countries with relatively low-value fisheries
may be required to assign proportionally larger levels of support to their fisheries, particularly in terms of
GSSE, if there is a minimum fixed cost associated with management or management is highly developed. This
appears to be the case for Sweden, Latvia and Slovenia, whose values of landings were amongst the five
lowest of the group in 2014 whilst their FSE to landings ratios were the three highest. These three countries
also had the highest ratios of GSSE to landings.

20 – SUPPORT TO FISHERIES: LEVELS AND IMPACTS
OECD FOOD, AGRICULTURE AND FISHERIES PAPERS N°103 © OECD 2017
The ratio of FSE to value of landings also puts the outcome of the high growth rate observed for
New Zealand (Figure 6) into context. Despite the recent growth in its FSE, it continues to have one of the
lower FSE to value of landings ratios of all OECD economies in the most recent period reported (11th out of
25).
Figure 6. Evolution of total support to fisheries (total FSE) by country, 2009-11 to 2014-15
Average annual growth rate
Note: for Turkey 2009-11 is replaced by 2012. For Italy 2014-15 is replaced by 2013-14. Australia, Czech Republic, Germany, Ireland, Japan and Latvia are omitted as FSE data is only available for 2014 and 2015. Data includes estimated values for enforcement expenditures for some countries. Percentage changes as shown can vary strongly if the initial level of support is small, as is the case for New Zealand and Slovenia.
Transfers to individual fishers represented a relatively small proportion of total budgetary support in
2014-15
Policy support at the country level is predominantly supplied in the form of GSSE by all countries.
Transfers to individual fishers accounted for between 0% and 11% of a country’s value of landings in 2014-15
but were below 5% in most cases (Figure 7).5 TIF to value of landings ratios of less than 1% are seen in nine
countries (36%), this includes New Zealand who reported not having any budgetary transfers that accrued
directly to individual fishers.
5 . EU Member States support is heavily influenced in scope and volume by EU structural support (EFF, EMFF).
-25
-20
-15
-10
-5
0
5
10
15
20
25
SVN BEL ITA GRC PRT CAN KOR SWE NOR MEX ESP FRA USA EST GBR NLD DNK NZL
%
SUPPORT TO FISHERIES: LEVELS AND IMPACTS – 21
OECD FOOD, AGRICULTURE AND FISHERIES PAPERS N°103 © OECD 2017
Figure 7. Total policy support to commercial fisheries as a share of value of landings, selected countries, 2014-15
Disaggregated into Transfers to Individual Fishers (TIF) and General Services Support Estimates (GSSE)
Notes: Missing figures for value of landings have been estimated using data from The 2016 Annual Economic Report on the EU Fishing Fleet (Belgium, France, Ireland, Latvia, Netherlands, Slovenia, United Kingdom) or in some cases simply carrying over the value of the previous year. The GSSE numbers reported here include estimations for management and enforcement expenditures, where missing.
Most countries have reduced support to fishers while increasing general services
Over time, the quantities of money countries spend on GSSE and TIF have changed. Figure 8
decomposes the FSE movements reported in Figure 6 in terms of how absolute spending on GSSE and TIF
has changed, providing greater insights into what has driven these changes and if shifts in policy focus have
taken place. The annual average rates of change indicate that, whilst not all countries have moved in the same
direction, the majority (nine countries, including the OECD as a whole) have reduced spending on both TIF
and GSSE. This is represented by them appearing in the bottom left (SW) quadrant of Figure 8. Reductions in
TIF have also generally been proportionally larger than those in the GSSE, illustrated by the points in Figure 8
being more closely grouped along the x-axis than along the y-axis, but this is largely driven by the relative
difference in the absolute sizes of the two forms of support.
The next most common change in budgetary allocation to fisheries support (five countries) has been to
reduce TIF but increase spending on GSSE, a shift into the upper left quadrant (NW). Only four countries are
seen to have increased spending on TIF over the period reported and only two of these also increased
spending on GSSE (Denmark and Netherlands).
When the major components making up TIF are looked at in greater detail the average annual growth
rates are all negative on average at the country level; transfers based on input use (-3% per year), transfers
based on fishers income (-8% per year), and transfers based on the reduction of productive capacity (-6% per
year). The degree of deviation around these means is high in all cases except for the reduction of productive
capacity, where negative rates of growth were seen in all reporting countries other than Mexico (7.2% per
year).
0 10 20 30 40 50 60 70
SVN
CAN
MEX
EST
GRC
LVA
SWE
TUR
ITA
PRT
NLD
OECD
ESP
DNK
AUS
KOR
BEL
USA
IRL
FRA
DEU
ISL
GBR
NOR
NZL
TIF share of Value of Landings GSSE Share of Value of Landings
%
22 – SUPPORT TO FISHERIES: LEVELS AND IMPACTS
OECD FOOD, AGRICULTURE AND FISHERIES PAPERS N°103 © OECD 2017
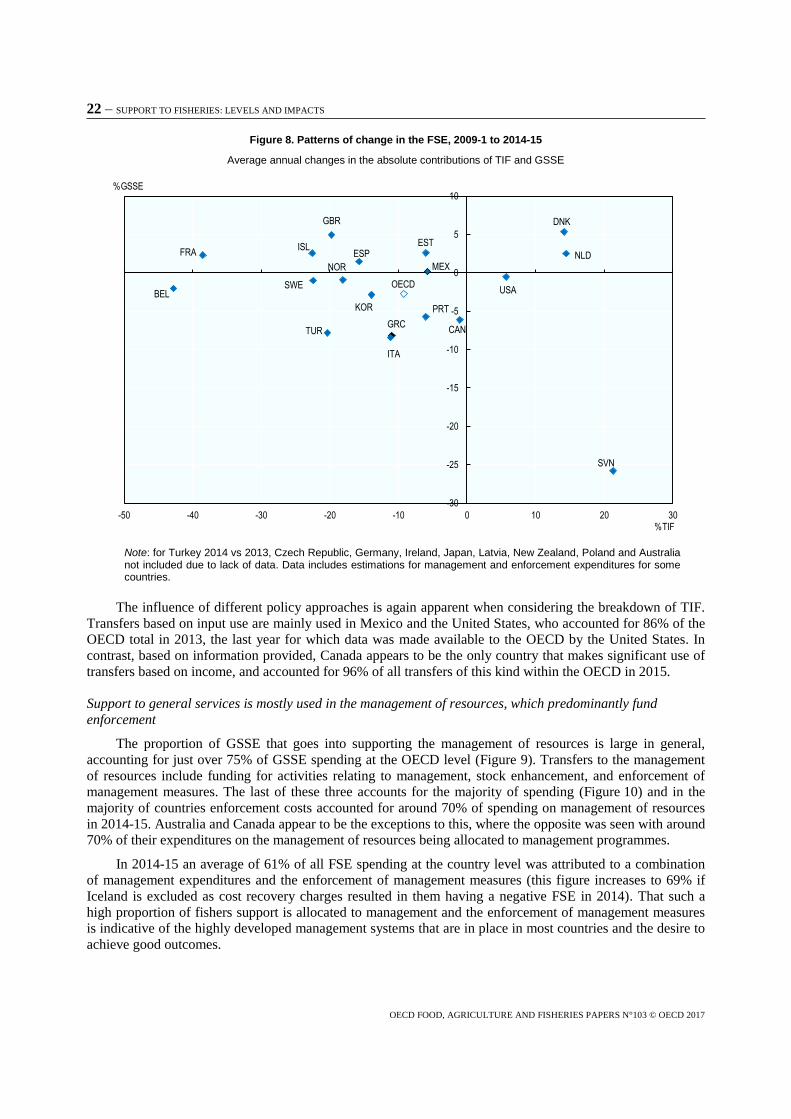
Figure 8. Patterns of change in the FSE, 2009-1 to 2014-15
Average annual changes in the absolute contributions of TIF and GSSE
Note: for Turkey 2014 vs 2013, Czech Republic, Germany, Ireland, Japan, Latvia, New Zealand, Poland and Australia not included due to lack of data. Data includes estimations for management and enforcement expenditures for some countries.
The influence of different policy approaches is again apparent when considering the breakdown of TIF.
Transfers based on input use are mainly used in Mexico and the United States, who accounted for 86% of the
OECD total in 2013, the last year for which data was made available to the OECD by the United States. In
contrast, based on information provided, Canada appears to be the only country that makes significant use of
transfers based on income, and accounted for 96% of all transfers of this kind within the OECD in 2015.
Support to general services is mostly used in the management of resources, which predominantly fund
enforcement
The proportion of GSSE that goes into supporting the management of resources is large in general,
accounting for just over 75% of GSSE spending at the OECD level (Figure 9). Transfers to the management
of resources include funding for activities relating to management, stock enhancement, and enforcement of
management measures. The last of these three accounts for the majority of spending (Figure 10) and in the
majority of countries enforcement costs accounted for around 70% of spending on management of resources
in 2014-15. Australia and Canada appear to be the exceptions to this, where the opposite was seen with around
70% of their expenditures on the management of resources being allocated to management programmes.
In 2014-15 an average of 61% of all FSE spending at the country level was attributed to a combination
of management expenditures and the enforcement of management measures (this figure increases to 69% if
Iceland is excluded as cost recovery charges resulted in them having a negative FSE in 2014). That such a
high proportion of fishers support is allocated to management and the enforcement of management measures
is indicative of the highly developed management systems that are in place in most countries and the desire to
achieve good outcomes.
SVN
GRC
FRA
BEL
ISL
ITA
SWE
ESP
GBR
KOR
MEX
OECD
TUR
NOR
CAN
USA
EST
PRT
NLD
DNK
-30
-25
-20
-15
-10
-5
0
5
10
-50 -40 -30 -20 -10 0 10 20 30
%GSSE
%TIF

SUPPORT TO FISHERIES: LEVELS AND IMPACTS – 23
OECD FOOD, AGRICULTURE AND FISHERIES PAPERS N°103 © OECD 2017
Figure 9. GSSE share and composition, 2009-11 to 2015
Note: Turkey: Change in GSSE is 2014-15 vs 2012.
Data for management and enforcement expenditures have been estimated for some countries.
Low or zero values for specific GSSE categories may reflect under-reporting rather than an absence of support. It is likely that, for OECD countries at least, some policy spending takes place under most GSSE categories.

24 – SUPPORT TO FISHERIES: LEVELS AND IMPACTS
OECD FOOD, AGRICULTURE AND FISHERIES PAPERS N°103 © OECD 2017
Figure 10. Decomposition of management of resources, 2014-15
Note: Countries with estimations of management or enforcement expenditures have been highlighted with an asterisk.
Estimating impacts of support to fisheries
Past conceptual work
It would appear that subsidies generally have the effect of aggravating an existing natural
resource management problem. Simply stated, with subsidies, participation is encouraged and
exit is discouraged. Even more disconcerting is the possibility that environmentally harmful
subsidies in fisheries act independently as self−standing causal factors. (Milazzo 1998).
The FAO's work to estimate fishing costs and profitability in 1992 and 1993 and its conclusions
regarding the impact of subsidies to fisheries, summed up in the above quote from Milazzo, had a powerful
impact. The conclusion that fishers were generally operating at a loss was believed and subsidies were seen as
the means by which fishers remained in business (Milazzo 1998).
FAO's work on costs and revenues in fisheries helped move subsidies discussions away from trade harm
in the form of price effects and towards the negative consequences on fishing opportunities in third countries,
conservation and sustainability. As a result, fisheries subsidies discussions no longer deal exclusively or even
largely with trade injury, but with their impact on overcapacity of fishing fleets, encouragement of IUU
fishing and overfishing itself.
The existing body of work generally agrees that many fisheries subsidies may be at odds with the
sustainability and profitability objectives of governments. The consensus is that some forms of support can
contribute to overfishing and overcapacity of fishing fleets, with the result of worsening profitability,
maintaining a state of crisis, and adding risk to the long-term prospects of the resource and sector.
Some studies take the view that effective management can moderate or eliminate the negative impacts of
subsidies (Hannesson, 1991; Porter, 2004). The argument in this case is that binding Total Allowable Catch
(TAC) controls prevent an increase in effort in response to subsidies, eliminating any overfishing effects.
0%
10%
20%
30%
40%
50%
60%
70%
80%
90%
100%
Management Stock enhancement Enforcement

SUPPORT TO FISHERIES: LEVELS AND IMPACTS – 25
OECD FOOD, AGRICULTURE AND FISHERIES PAPERS N°103 © OECD 2017
Porter (2004) takes the perspective that, even if management is not fully effective, subsidies are still not
harmful if there is less than full capacity in the fishery--though Porter (2001) warns that "it would be
unwise … to base the international policy toward the fisheries subsides regime on the theoretical proposition
that well-managed fisheries can neutralize the negative impacts of subsidies.”
Munro and Sumaila (2002) reject this perspective, finding that under the right circumstances, applying a
subsidy to a "well-run" fishery could lead to the collapse of the resource if, for example, the intrinsic growth
rate of the stock is low. They further argue more specifically that if fisheries capital cannot easily enter and
exit the sector, many of the conclusions of the standard management model do not hold. Using a model where
capital investment depreciates but may not be sold, they find that subsidies can lead to overcapacity. This is
true in particular for decommissioning schemes that are anticipated by fishers, who increase investment prior
to the policy to better take advantage of them.
Discussions regarding fisheries subsidies are motivated by their potential negative consequences on
overcapacity and overfishing (and thereby on resource sustainability). These negative effects interact with but
are not entirely overcome by regulatory actions related to fisheries management. The OECD last made a broad
investigation of this in 2006, finding that support to fisheries in OECD countries are significant in scale and
could benefit from well-designed reform (Box 3).
Box 3. Key Findings of Financial Support to the Fisheries Sector
The OECD produced a major report on financial support to the fisheries sector in 2006. This was based on in-depth case studies as well as an assessment of government financial transfers to the sector. It found that OECD countries transferred at least USD 6 billion per year in support of the fishing sector, divided approximately evenly between management, infrastructure, and direct payments to fishers. The key findings of that report were:
Transfers have an important, but limited, role to play in fisheries management policy. They are an important part of the government’s policy toolbox for managing fisheries as they are used to provide fisheries services (research, management and enforcement) that otherwise may not necessarily be supplied by the market. However, this is best limited to a subset of fisheries services, the benefits of which flow to the community in general.
There are shortcomings in the transparency of fisheries support programmes in many OECD countries. Much of the data and information on the programmes are difficult to access and analyse, and there remain significant gaps in the data. Particular areas of concern that have been raised cover the extent of sub-national transfers (at regional and local levels) and the cost of off-budget items such as tax concessions, loan guarantees and interest subsidies.
An integrated approach to assessing support programmes is required. Financial support to the fisheries sector has a wide range of impacts, often reaching beyond the intended target(s) of the programmes and it is necessary to ensure that the full range of effects of particular programmes on the environmental, economic and social dimensions is taken into account when the programmes are designed and implemented.
The effectiveness of the management regime and its enforcement is critical in determining the effects of transfer programs. Importantly, it is the effectiveness of the management regime in enforcing rules and securing rights that is a key factor, just as much as the type of management regime itself. Anything less than perfect enforcement will generally result in adverse impacts on all dimensions and under all management regimes.
Financial support for the sector should be de-coupled from fishing activity in order to ensure that fisheries management policy tools are not used as the primary means to achieve social and regional development objectives.
Reduction of financial support does not necessarily spell doom and gloom for the industry and have generally resulted in increased profitability and reduced dependence on government assistance over the medium to longer term from reducing financial support.
Imposing time limits on support programmes will improve their effectiveness and increase community and individual resilience. One of the major concerns over the provision of financial support to the fisheries sector is that expectations of government assistance tend to become embedded in the decision making processes of fishers.
Source: OECD (2006), Financial Support to the Fisheries Sector, OECD, Paris.

26 – SUPPORT TO FISHERIES: LEVELS AND IMPACTS
OECD FOOD, AGRICULTURE AND FISHERIES PAPERS N°103 © OECD 2017
Empirical studies of the effects of support
While the large global studies discussed earlier contain some conclusions regarding the impact of
different types of studies, these are based largely on a first-principles rather than empirical analysis. There
have been a relatively small number of empirical studies investigating the impact of supports to fisheries, and
these are usually done on a more regional or local basis. The general consensus is that support can have
negative consequences for sustainability, and it is often hard to effectively target chosen beneficiaries and
achieve intended outcomes.
Ramírez-Rodríguez, and Almendárez-Hernández (2013), use an expert-driven model to investigate the
impacts of fuel tax concessions and VAT exemptions in a Mexican squid fishery. They find that these
supports differentially benefit larger vessels and act to keep vessels in the fishery who would otherwise exit.
Larger vessels primarily target shrimp and use the squid fishery as an off-season activity. Diesel accounts for
more than half of their costs and so tax exemptions for fuel are strongly influential on profitability. Smaller
boats have a higher share of costs in crew wages and so fuel policies have a smaller impact on profits for
operations.
Carvalho et al. (2011) use a CGE model to estimate the impact of elimination of all fisheries subsidies on
the fishing sector in the Azores. They find that subsidies have a net negative welfare effect at the
macroeconomic level, though they will benefit the fisheries sector as a whole. Their model does not allow for
considering the fisheries sector as other than a single unit, so they do not investigate changes in sector
composition or activity due to subsidies.
Tuong et al. (2009) use a combination of structured stakeholder interviews and expert consultations to
investigate the impact of the set of subsidies in place in Viet Nam on resources and trade. They found that a
credit program to encourage offshore fishing increased overall effort without the intended reduction of
pressure on inshore fisheries. Fuel subsidies were found to maintain vessels in operation that would otherwise
be scrapped, and to increase the number of total vessels in operation, small vessels in particular. Eliminating a
resource tax reduced fishers' concern for resource conservation. Infrastructure investments had a marginal
impact on entry into the sector, and also helped raise food safety and hygiene standards. Programs to promote
exports led to overcapacity in the processing sector and increase demands on the resource. The overall
conclusion calls for reduced and better-targeted subsidies, while acknowledging that open-access management
is the main cause of overcapacity and overfishing.
Islam et al. (2016), using a sample of 246 Malaysian fishers interviewed via questionnaire, found that
fuel subsidies disproportionately benefitted larger commercial vessels and had unequal benefits in favour of
larger operations. Smaller vessel owners were able to benefit from an income support programme providing a
monthly stipend. The authors conclude that while existing subsidies have a negative impact on sustainability,
their elimination will not solve problems of overfishing.
A Spanish study investigating factors influencing exit of fishing operations from the sector found that
decommissioning schemes hastened exit of purse seine vessels, but not by a great deal (Cordón Lagares &
García Ordaz, 2015). Another study of decommissioning schemes in Scotland found two different effects:
Owners expecting profitable operation considered how to use government grants to enable fresh investment in
the fishery. For vessels with poor expected performance, owners’ principal concern was whether the payment
would be sufficient to clear outstanding debt (Curtis & Jones, 2016). Their responses indicate that
decommissioning schemes have a more complicated impact than simply an effect on the entry-exit decision at
the margin.
Accounting-based models of the effect of subsidies can show tremendous impacts on profitability
resulting from subsides, especially for fuel (see for example Ziegler and Hornburg 2013), which often imply a
strong and sudden drop in capacity (and loss of jobs) if subsides are reduced or eliminated. These ignore the
dynamic effects of fishers’ capacity to adjust input mix and technology in response to price changes as well as
the overall effects of entry and exit (especially in situations of existing overcapacity) (see for a counter-
example Stouten et al., 2007).

SUPPORT TO FISHERIES: LEVELS AND IMPACTS – 27
OECD FOOD, AGRICULTURE AND FISHERIES PAPERS N°103 © OECD 2017
Economic analysis of impacts of fisheries supports
Work by Sumaila and his collaborators or based on it typically classify the impacts of subsidies as either
harmful, beneficial or ambiguous – sometimes termed “good, bad and ugly”. (Sumaila, Lam, Manach, Swartz,
& Pauly, 2016; Sumaila U. , et al., 2010; Carvalho, Rege, Fortuna, & Isidro, 2011; Cullis-Suzuki & Pauly,
2010; Sharp & Sumaila, 2009; Sumaila U. , Khan, Watson, Munro, & Zeller, 2007) (Table 2). While part of
the reason for the popularity of this approach is its practicality for discussing subsidies, the "ambiguous"
category is not entirely helpful and would benefit from more refinement. This simple classification is
sometimes contradicted by more specific research (Munro & Sumaila, 2002; Arnason, 2000).
Table 2. Classification of subsidies following Sumaila et al.
Beneficial Ambiguous Harmful
Fisheries management
R&D
Marine protected areas
Fisher assistance programmes
Vessel buyback programmes
Community development programmes
Fuel Subsidies
Vessel construction, renewal and modernisation
Port construction and renovation
Price and marketing support
Fishery development projects
Foreign access agreements
Source: Sumaila et al. (2010)
There have been other attempts to provide a coherent perspective on the likely impact of support, taking
into account the management system in place (Hannesson, 1991; Hannesson, 2001; Porter, 2004, OECD
2006) (see Table 3 for an example). These are useful summaries of structured thinking about the problem, but
again may be contradicted by specific studies with more flexible assumptions (Munro & Sumaila, 2002;
Clark, Munro, & Sumaila, 2005). The authors of these reports recognise that actual effects are likely to be less
clear cut than their stylised analyses suggest and more work is needed to arrive at more detailed and
comprehensive conclusions.
The role and effectiveness of the management system is a main factor in the results shown by
Hannesson, Porter and the OECD cited in the previous paragraph. These studies generally assume that the
management system is either absent (open access) or entirely effective at enforcing effort or catch limits.
The existence of IUU fishing bears witness to the fact that management systems, while ubiquitous today,
are not universally effective. These systems imperfectly control fishing catches and effort and may not always
provide the proper incentives to maintain optimal capacity levels.
To account for this in the investigation of the potential impact of support policies, it can be considered
that there may be a difference between the amount of fishing effort allowed by the management system and
the desired level of effort of fishers. The desired level of effort is a function of several factors, the most
important of which may be marginal profitability of fishing effort, defined as the difference between marginal
benefit and marginal cost of additional effort. A similar situation may be defined for desired fleet capacity
levels.

28 – IDENTIFYING EFFECTIVE FISHERIES SUPPORT POLICIES
OECD FOOD, AGRICULTURE AND FISHERIES PAPERS N°103 © OECD 2017
Table 3. Long-term effects of cost-reducing or revenue-enhancing subsidies
Management
regime
Status of fish stock
Property rights No property rights No property rights
No controls Catch controls Effort controls Catch controls Effort controls
Overfished No effect on catch or stock
No effect on effort
Higher value of fish quotas
Same effects as with no property rights except that the value of effort rights will increase.
No effect on catch or stock
Greater effort and more boats
Same revenue or lower
Higher costs and lower industry profits
Negative resource rent
No effect on effort, if it is effectively controlled.
Higher revenues
Higher profits
Incentive to expand uncontrolled components of effort.
If effort expands
smaller stocks
lower catches
less increase in revenue
higher costs
less increase in profits
lower resource rent
Greater effort and more boats
Smaller fish stocks
Lower fish catch
Lower revenue
Higher costs
Higher intra-marginal rents
Negative resource rent
Underfished Same as for overfished stocks
Same effects as with no property rights except that the value of effort rights will increase.
Same as for overfished stocks No effect on effort, if it is effectively controlled.
Higher revenues
Higher profits
Incentive to expand uncontrolled components of effort.
If effort expands
smaller stocks
larger catches
higher revenue
higher cost
less increase in profits
lower resource rent
Greater effort and more boats
Smaller fish stocks
Greater fish catch
Higher revenue
Higher costs
Higher intra-marginal rents
Negative resource rent
Source: OECD (2006).

SUPPORT TO FISHERIES: LEVELS AND IMPACTS – 29
OECD FOOD, AGRICULTURE AND FISHERIES PAPERS N°103 © OECD 2017
Support policies, inasmuch as they may alter the marginal benefits or costs of fishing, could therefore
alter the desired level of fishing effort. If the management system effectively constrains this to the allowed
effort level, there will be no effect on effort. If the management system is imperfect, the difference between
desired and allowed effort defines the incentive to fish outside management limits, i.e. IUU fishing.
Relative effect of support on desired fishing effort—degree of impact
In this section the consequences of the initial incidence of support are considered. This analysis is an
adaptation of work by Floyd (1965) as further elaborated by Gardner (1979) and used in OECD (2001) and
Martini (2011). The initial incidence refers to which market activity is directly affected by the support. For
example, a payment to replace fishing gear effectively reduces the supply price of gear and so has its initial
incidence in the supply function for fishing gear, a variable input. The importance of the initial incidence of
support motivates the FSE classification system, which is organised to identify the economically-relevant
aspects of the implementation of support policies.
Support will be expansive of fishers’ desired effort and fleet capacity when it either increases revenue or
reduce costs of operations, whether fixed or variable. Conditionality of support designed to minimise this,
such as restrictions related to decommissioning schemes, are unlikely to be perfectly effective in the long term
(OECD, 2009; Clark, Munro, & Sumaila, 2005).
In terms of induced effort (the desired change in output resulting from a support policy), the policies
with the largest impact are, in descending order:
Payments based on variable inputs
Payments based on output
Payments based on fixed input use
Payments based on fishers’ income
Payments based on general services
This rank ordering is derived from the work of Dewbre, Antón and Thompson (2001), Hertel (1989) and
has been confirmed in OECD (2001) and Martini (2011). The logic behind this ordering is based on the
observation that the supply elasticity for the fishing firm can be thought of as a weighted average of the
supply elasticities of the factors of production, with the weights being a function of the factor shares and the
elasticity of substitution between factors. An annex to this document provides more detail regarding the
relevant derivations.
Providing support to variable inputs where supply is more elastic causes a price change focussed on the
part of production most able to respond to it. While demand for all factors will increase, the supported input
will increase more, and the substitution effect means that relatively more of it will be used in production.
Support based on output, on the other hand, effectively spreads the effect across more factors, and
reduces the substitution effect significantly. The fact that some of the support effectively accrues to inelastic
factors mutes the total supply (effort) response such that the induced increase in effort is smaller for the same
amount of support provided when compared to support to variable inputs.
This logic extends as well to supports directed at fixed inputs; the inelastic supply response means that
more of the support goes to an increased factor price than it does to the factor quantity response. Factor
returns are higher, and the change in desired effort lower than is the case for output support.
Income-based payments are less distorting of effort still. Like any transfer, the value becomes capitalised
in the most-fixed asset that is most closely associated with the entitlement. If the entitlement is closely
connected to fishing activity (such as when recipients must be active fishers in the year the income payment is
made) the effect is similar to a payment based on fixed inputs. However, income payments are usually
imperfectly connected to fishing activity, and the value of the support may accrue in part to assets outside the

30 – SUPPORT TO FISHERIES: LEVELS AND IMPACTS
OECD FOOD, AGRICULTURE AND FISHERIES PAPERS N°103 © OECD 2017
fishing sector, such as when the payments are based entirely on historical characteristics of the recipient and
not their current activity.
Support to general services, fisheries management in particular, is often categorised as a beneficial
subsidy that has the effect of reducing effort and improving sustainability (Sumaila, Lam, Manach, Swartz, &
Pauly, 2016). However, the clear and necessary regulatory benefits of management may be considered
separately from the effects of policy support made to enable them.
Evidence from the FSE database suggests that expenditures on management and enforcement can
amount to more than 25% of sector revenue in many cases, and more than half of all revenue for some
(Figure 7). This is certainly enough to affect the profitability of the sector. Even if one considers that private
costs of management would be fixed (as opposed to variable costs like fuel), the impact of public management
and enforcement support would be larger investment in the sector, with implications for potential
overcapacity.
Porter (2004) argues that even if private financing of management is possible, the quality of government-
provided management is likely to be higher. By this reasoning, government provision of management services
can be beneficial.
On the other hand, if government allocation of resources to fisheries management is limited by the
opportunity cost of public funds spending will be below the optimal amount that a private system could
achieve. The New Zealand experience with private funding of stock assessments hints that if investment in
management is made to the point where its marginal benefit equals its marginal cost, actual spending would
be higher in private systems than in public (Harte, 2000; Sinclair, Valdimarsson, & Food and Agriculture
Organization of the United Nations., 2003).
Whether government funding of fisheries management constitutes a beneficial subsidy has to do with the
definition of the counterfactual. Under the assumption that the alternative is no management control at all,
government provision of management is almost certainly beneficial. On the other hand, if it amounts to
government funding of a service that would exist in any case, then it could increase capacity and optimal
effort, as it eliminates a substantial cost that fishers would otherwise bear (Arnason, 2000).
Two polar cases for the counterfactual are (1) without government provision of these services, they
would be wholly absent, and (2) without government payments, the identical services would be provided, paid
for by sector participants themselves. The truth likely lies somewhere in between, with the probability of
private provision of management positively linked to the quality of property rights in the fishery.
In case (1), the impact of general services support is not separable from the benefits of the associated
regulatory activity and public goods. These aren’t properly the effects of support per se, but are commonly
viewed as such. In case (2), support to general services is essentially a payment based on sector revenue, with
effects similar to payments based on income. In Table 4 general services is shown as having the least impact
on overcapacity and overfishing because it is likely that some of the policies in this category—which includes
not only management but research and education—are closer to public goods or that their incidence is at some
distance from production activity and therefore would have a lesser impact than would management.
A final note on output impacts: Thinking of different fish stocks as a portfolio of activities among which
a fisher may choose based on relative returns, the scope of a subsidy will bear upon its (desired) output
impact. Broad-based subsidies covering all fish stocks affect only the supply response — reducing input costs
does not change the relative attractiveness of any particular fish stock.6 Subsidies targeting a specific stock or
gear type will have an additional substitution effect as fishers re-allocate effort towards the subsidised fishery
or gear. The more specific a subsidy is to a particular stock, the greater the potential impact on that stock. In
6 . This is true only when differential gears are not relevant. It has frequently been noted that support to fuel
makes more distant stocks more attractive, or the use of active gears. The general supply impact is separate
from any induced technological change.

SUPPORT TO FISHERIES: LEVELS AND IMPACTS – 31
OECD FOOD, AGRICULTURE AND FISHERIES PAPERS N°103 © OECD 2017
some cases however, specific targeting of support to particular stocks is done in order to divert effort away
from fisheries that cannot tolerate it. Such support would have effects strongly conditioned by the
management system and hard to determine in a general manner and may reduce pressure on specific stocks.
The degree of impact on capacity is closely related to the effect of support on the use of fixed inputs,
which in this analysis represents capacity investments in the production system. In this case, payments to
fixed inputs have the strongest effect, followed by payments on output, income, variable inputs and general
services (Table 4).
The degree of impact on income is usually inverse to the degree of impact on desired effort. More
induced effort means greater deadweight losses from market distortions, which equates to lost value. If a
distinction is maintained between benefits that accrue to active fishers versus payments that accrue to
incumbents (those active in the sector at the time the support policy is introduced), then payments based on
fixed input use can be less effective, depending on other conditions associated with the policy transfer.
Payments based on income are, not surprisingly, the most effective at supporting income and, whist they
can result in effort remaining in a fishery when it otherwise may not, are less likely than other more common
policies to promote overcapacity and overfishing. If government objectives are to support fishers in order to
make their incomes more comparable with those in other sectors, this may be the best sectoral-based
approach. One problem with explicit income payments is that in the context of existing social programmes, it
can be hard to justify a separate system for a specific sector. As well, these programmes may not be well-
received by fishers if they are seen as “hand-outs”; fishers prefer to believe that they are earning their way
fairly and that assistance policies are only there to help overcome factors out of their control.
The prevailing concept of the impact of support uses three categories—beneficial, harmful, and
ambiguous. This is an imprecise view of the effects of support. A better conceptual model has to do with
degree of impact, which recognises that different categories of support will have different effects on
overcapacity or overfishing, as well as different benefits for fishers and other sector participants.
The degree of impact on any particular outcome depends on implementation details, many of which are
captured in the FSE database which is designed for that purpose. It is also strongly conditioned on the set of
management regulations and rules in place that set the rules of the game for fishers. Many forms of support
are likely to reduce costs, raise revenue or income, or put capital in the hands of sector participants.
Associated constraints are unlikely to be perfectly effective at offsetting these effects.
The scale of support can be just as important as the decree of impact. A large amount of support that is
minimally distorting can still add up to an important impact. Even support that has no effect on marginal cost
but that amounts to a large percentage of the value of landings will influence the long-term entry-exit choices
of fishers, and thereby tend to promote overcapacity.
Table 4. Summary of results on degree of impact of policies
Support type payment based on…
Effect on desired effort, rank
Effect on capacity, rank
Effect on income, rank
Main beneficiaries
Variable inputs 1 4 5 Input suppliers, fishers
Output 2 2 4 Fishers, input suppliers
Fixed inputs 3 1 2 Incumbents, fishers
Income 4 3 1 Fishers
General Services 5 5 3 Fishers, incumbents
Source: Adapted from Dewbre, et al. (2001); OECD, 2001 and Martini (2011).

32 – SUPPORT TO FISHERIES: LEVELS AND IMPACTS
OECD FOOD, AGRICULTURE AND FISHERIES PAPERS N°103 © OECD 2017
Expenditures on general services to the sector (the majority of which are for management) often amount
to a substantial proportion of the total value of landings for a fishery. For this reason, cost-recovery of
management expenditures serves as a useful check on the economics of fishing in a region, helping ensure that
the fishery is a net economic contributor to the economy as a whole.
There is concern that some fisheries would be abandoned without support. Many fisheries operations
have fuel costs that approach or exceed half of all costs, and in some cases fuel can account for 80% of all
costs (Martini, 2012; Borrello, Motova and Dentes De Carvalho, 2013). It is often assumed that these are
dependent on support for survival. The objective of maintaining effort in specific fleets and metiers may
conflict with other objectives having to do with preventing overcapacity and overfishing (in addition to
broader environmental objectives such as reducing CO2 emissions, bycatch or habitat damage). It is a very
difficult task for a support policy to have a knife's-edge goal of promoting effort without causing overfishing.
It is probably not the case that a valuable fishery will go unexploited absent support, but it is likely that
reforming support can change the way these stocks are pursued and by whom; there is relatively little risk of
leaving too many fish in the sea. If it is part of the objectives of a government to maintain traditional fishing
activities in certain regions, then it is important to consider the impacts of support on the overall quality of life
of fishers and in the fishing community as a whole. Policies targeting gears, vessels or activities are usually
inferior mechanisms for improving this, and the associated environmental externalities can make them
counterproductive in the long-run.
It has been demonstrated here that many forms of support can be expected to do a poor job of increasing
the income of fishers, because a large share of the value of the transfer generated goes to non-fishers--such as
input suppliers, shipyards or “armchair fishers”—non-fishing license holders or vessel owners. For this
reason, when choosing policies to meet their objectives, governments should consider not only whether they
are susceptible to provoking overcapacity and overfishing, but also their transfer efficiency and the scale of
support required to achieve their objectives.

SUPPORT TO FISHERIES: LEVELS AND IMPACTS – 33
OECD FOOD, AGRICULTURE AND FISHERIES PAPERS N°103 © OECD 2017
References
Arnason, R. (2000), Costs of Fisheries Management: Theoretical and Practical Implications, IIFET Proceedings.
APEC (2000), “Study Into the Nature and Extent of Subsidies in the Fisheries Sector of APEC Members
Economies”, APEC Committee on Trade and Investment, Singapore.
Borrello, A., A. Motova and N. Dentes de Carvalho (2013), “Fuel Subsidies in the EU Fisheries Sector”, Note for
the European Parliament, IP/B/PECH/IC/2013-114.
Carvalho, N., Rege, S., Fortuna, M., & Isidro, E. (2011). Estimating the impacts of eliminating fisheries subsidies
on the small island economy of the Azores. Ecological Economics, Vol. 70, pp. 1822-1830.
Cisneros-Montemayor, A., Sanjurjo, E., Munro, G., Hernandez-Trejo, V., & Rashid Sumaila, U. (2016). Strategies
and rationale for fishery subsidy reform. Marine Policy, Vol. 69, pp. 229-236.
Clark, C., Munro, G., & Sumaila, U. (2005), "Subsidies, buybacks, and sustainable fisheries", Journal of
Environmental Economics and Management, Vol. 50, pp. 47-58.
Cordón Lagares, E., & García Ordaz, F. (2015), "Factors influencing the decision to leave a fishery and the effects
of fishery subsidies: The case of the Spanish purse seine fishery", Ocean & Coastal Management, Vol. 116,
pp. 248-256.
Cullis-Suzuki, S., & Pauly, D. (2010), "Marine protected area costs as 'beneficial' fisheries subsidies: A global
evaluation", Coastal Management, Vol. 38 pp. 113-121.
Curtis, H., & Jones, E. (2016). “Will I clear my feet? Perspectives on a fishing vessel scrapping scheme”, Scotland.
Marine Policy, Vol. 71, pp. 94-105.
Dewbre, J., Antón, J., & Thompson, W. (2001), The Transfer Efficiency and Trade Effects of Direct Payments.
Amer. J. Agr. Econ, Vol. 83/5, pp. 1204-1214.
FAO (2017). Fishery and Aquaculture Statistics. Global capture production 1950-2015 (FishstatJ). In: FAO
Fisheries and Aquaculture Department [online]. Rome. Updated 2017.
www.fao.org/fishery/statistics/software/fishstatj/en.
FAO (2002), Guide for Identifying, Assessing and Reporting on Subsidies in the Fisheries Sector, FAO Fisheries
Technical Paper 438, Food and Agriculture Organisation, Rome.
FAO (1993), “Marine fisheries and the law of the sea: a decade of change”, Special chapter (revised) of The State of
Food and Agriculture 1992. FAO Fisheries Circular, No. 853. Food and Agriculture Organisation, Rome.
G7 (2016), G7 Ise-Shima Leaders' Declaration, G7 Ise-Shima Summit, 26-27 May 2016.
G20 (2009), G20 Leaders' Statement: The Pittsburgh Summit, 24-25 September, Pittsburgh.
Hannesson, R. (2001). Effects of liberalizing trade in fish, fishing vessels and investment in fishing vessels. OECD
Papers Offprint No. 8, Paris.
Hannesson, R. (1991), “Economic Support of the Fishing Industry: Effects on Efficiency and Trade”, OECD
consultant report.
Harper, S. et al. (2012), “Fuelling the fisheries subsidy debate: Agreements, loopholes and implications”, Fisheries
Research.
Harte, M. (2000). Collaborative Research: Innovations and Challenges for Fisheries Management in New Zealand.
IIFET Proceedings., Oregon State University, Corvallis.
Hertel, T.W. (1989), “Negotiating Reductions in Agricultural Support: Implications of Technology and Factor
Mobility, American Agricultural Economics Association Journal, Vol. 71/3, pp. 559 573.

34 – SUPPORT TO FISHERIES: LEVELS AND IMPACTS
OECD FOOD, AGRICULTURE AND FISHERIES PAPERS N°103 © OECD 2017
Islam, M. G., Ali, J., Zamhuri, S., Kuperan Viswanathan, K., & Abdullah, H. (2016). Impact of Subsidies on the
Economic and Environmental Conditions of Small Scale Fisheries in Malaysia. The European Proceedings
of Social and Behavioural Sciences, Vol. 113/1, pp. 143-146.
Martini, R. (2012), "Fuel Tax Concessions in the Fisheries Sector", OECD Food, Agriculture and Fisheries Papers,
No. 56, OECD Publishing, Paris. http://dx.doi.org/10.1787/5k9bdccqft30-en.
Martini, R. (2011), "Long Term Trends in Agricultural Policy Impacts", OECD Food, Agriculture and Fisheries
Papers, No. 45, OECD Publishing, Paris. http://dx.doi.org/10.1787/5kgdp5zw179q-en
Milazzo, M. (1998), Subsidies in World Fisheries: A Reexamination, World Bank Technical Paper No. 406
Fisheries Series. World Bank, Washington, DC.
Munk, K. J., & Motzfeldt, M. (1993), Definition and Measurement of Trade Distortion for the Fishing Industry.
Brussels: European Commission.
Munro, G., & Sumaila, U. (2002), “The impact of subsidies upon fisheries management and sustainability: the case
of the North Atlantic”. Fish and Fisheries, Vol. 3/4, pp. 233-250.
OECD (2009), Reducing Fishing Capacity: Best Practices for Decommissioning Schemes, OECD Publishing, Paris.
http://dx.doi.org/10.1787/9789264044418-en.
OECD (2006), Financial Support to Fisheries: Implications for Sustainable Development, OECD Publishing, Paris.
http://dx.doi.org/10.1787/9789264036642-en.
OECD (2005), “The Six-Commodity PEM Model: Preliminary Results” [TAD/CA/APM(2005)30]
OECD (2001), Market Effects of Crop Support Measures, OECD Publishing, Paris.
http://dx.doi.org/10.1787/9789264195011-en.
OECD (2000), Transition to Responsible Fisheries: Economic and Policy Implications, OECD Publishing, Paris.
http://dx.doi.org/10.1787/9789264188020-en.
OECD (1993), “Economic Assistance to the Fishing Industry: Observations and Findings”, AGR/FI(93)11/REV1.
OECD. (1992a). Inventory of Assistance Instruments in the Fishing Industry and Management Actions. OECD,
Paris.
OECD. (1992b). “Inventory of Restrictions to Trade in the Fishing Industry”, OECD, Paris.
Porter, G. (2004). Analysing the Resource Impact of Fisheries Subsidies: A Matrix Approach. UNEP, Washington,
DC.
Porter, G. (2001), Fisheries subsidies and overfishing: Toward a structured discussion. United Nations
Environment Programme.
Ramírez-Rodríguez, M. and L. Almendárez-Hernández (2013), "Subsidies in the jumbo squid fishery in the Gulf of
California, Mexico", Marine Policy, Vol. 40, pp. 117-123.
Scientific, Technical and Economic Committee for Fisheries (STECF) (2016), The 2016 Annual Economic Report
on the EU Fishing Fleet (STECF-16-11), Publications Office of the European Union, Luxembourg.
Sharp, R., & Sumaila, U. (2009), "Quantification of US marine fisheries subsidies". North American Journal of
Fisheries, Vol. 29, pp. 18-32. http://dx.doi.org/10.1577/M07-170.1.
Shrank, W.E. (2003), “Introducing Fisheries Subsidies”, FAO Fisheries Technical Paper No. 437, FAO, Rome.
Sinclair, M., Valdimarsson, G., & FAO (2003), Responsible fisheries in the marine ecosystem. Food and
Agriculture Organization of the United Nations, Rome.
Stouten, Hendrik et al. (2007), The effect of fuel price scenarios on Belgian fishing fleet dynamics, International
Council for the Exploration of the Seas, ICES CM 2007/M:04.
Sumaila, U., Cheung, W., Dyck, A., Gueye, K., & Huang, L. (2012), "Benefits of rebuilding global marine fisheries
outweigh costs", PloS One, Vol. 7 e40542. https://doi.org/10.1371/journal.pone.0040542
SUPPORT TO FISHERIES: LEVELS AND IMPACTS – 35
OECD FOOD, AGRICULTURE AND FISHERIES PAPERS N°103 © OECD 2017
Sumaila, U., A. Dyck, & A. Baske (2014), "Subsidies to tuna fisheries in the Western Central Pacific Ocean",
Marine Policy, Vol. 43, pp. 288-294.
Sumaila, U., A. Khan, A. Dyck, R. Watson, G. Munro, P. Tydemers et al. (2010), "A bottom-up re-estimation of
global fisheries subsidies", Journal of Bioeconomics, Vol. 12, pp. 201-225.
Sumaila, U., A. Khan, L. Teh, R. Watson, and P. Tyedmers (2010), "Subsidies to high seas bottom trawl fleets and
the sustainability of deep-sea demersal fish stocks", Marine Policy, Vol. 34, pp. 495-497.
Sumaila, U., A. Khan, R. Watson, G. Munro, and D. Zeller (2007), "The World Trade Organization and global
fisheries sustainability", Fisheries Research, Vol. 113, pp. 143-146.
Sumaila, U., Lam, V., Manach, F., Swartz, W., & Pauly, D. (2016). Global fisheries subsidies: An updated
estimate. Marine Policy, Vol. 69, pp. 189-193.
Sumaila, U., L.Teh, and R. Watson (2006), "Fuel subsidies to global fisheries: Magnitude and impacts on resource
sustainability" in Sumail, U and D. Pauly (eds.), Catching More Bait: A bottom-up re-estimation of global
fisheries subsidies, Fisheries Centre Research Reports Vol. 14/6.
Tipping, A. (2016), "Building on progress in fisheries subsidies disciplines" Marine Policy, Vol. 69, pp. 202-208.
Tuong, Phi Lai et al. (2009), Fisheries Subsidies, Supply Chain and Certification in Vietnam, United Nations
Environmental Programme, Ha Noi.
Uchida, H., E. Uchida, J.S. Lee, J.G. Ryu, and D.Y. Kim (2010). "Does Self Management in Fisheries Enhance
Profitability? Examination of Korea' s Coastal Fisheries" Marine Resource Economics, Vol. 25/1, pp. 37-59.
World Bank and Food and Agriculture Organization (2009). The Sunken Billions: The Economic Justification for
Fisheries Reform. Agriculture and Rural Development, World Bank.
WTO (2005), “Hong Kong Ministerial Declaration”, WT/MIN(05)/DEC.
WTO (2016a), WTO members engage on new fisheries subsidies proposals, www.wto.
org/english/news_e/news16_e/fish_09dec16_e.htm.
WTO (2016b), “Briefing note: Negotiations on rules — anti-dumping and subsidy disciplines (including fisheries
subsidies) and regional trade agreements”,
www.wto.org/english/thewto_e/minist_e/mc10_e/briefing_notes_e/brief_antidumping_e.htm.
Ziegler F, and S. Hornborg (2013) “Stock size matters more than vessel size: The fuel efficiency of Swedish
demersal trawl fisheries 2002–2010”, Marine Policy, Vol. 44, pp. 72-81.
http://dx.doi.org/10.1016/j.marpol.2013.06.015i.

36 – SUPPORT TO FISHERIES: LEVELS AND IMPACTS
OECD FOOD, AGRICULTURE AND FISHERIES PAPERS N°103 © OECD 2017
Annex
Some supporting analysis
Analysis using bionomic equilibrium
The effect of reduced unit costs as a result of support can be complex. Open access leads to profits being
exhausted through expansion of effort lowering catch per unit effort (CPUE) through lower stocks. When a
TAC is enforced, profits will still be exhausted through capital stuffing which reduces capital efficiency or
racing to fish which lowers operational efficiency. This means that support does not have a long-term impact
on profits in most cases. It can, however, change desired and actual effort and fleet size, and factor returns for
fishers and input suppliers.
The classic analysis of the impact of support uses the concave yield function representing the long-term
equilibrium between effort and output (Figure A1). This is combined with a total cost of effort function (TC),
the intersection of which with the yield curve identifies the open-access equilibrium of the fishery.
In this analysis, support lowers the cost of effort, leading to more effort and a smaller fish stock in
equilibrium. The figure shows a shift in the slope of the total cost (TC) function from TC1 to TC2, indicating a
reduction in marginal cost. Depending on the initial situation, total harvest can be lower than before the
support if catch-per-unit-effort declines sufficiently.
Figure A1. Support to variable input use in an open access fishery
Source: OECD (2010)

SUPPORT TO FISHERIES: LEVELS AND IMPACTS – 37
OECD FOOD, AGRICULTURE AND FISHERIES PAPERS N°103 © OECD 2017
When it is assumed that fisheries management constrains effort at the level required to take a TAC set at
maximum sustainable yield (MSY) (EQ), fishers earn positive profits of R1-C1 in the initial situation
(Figure A2). If support that lowers cost is then introduced, and effort is still assumed to be effectively
controlled by the TAC so does not change, the support leads to higher profits as costs are lower with no
changes to stock or effort level. This implies that support under a binding TAC is more transfer efficient - the
value of the support tends to be reflected in increased profits instead of lost to deadweight losses. This is a
consequence of the management regime; effective control means that support cannot impact effort or stocks
and limited access means that positive profits are possible.
Figure A2. Support with a TAC and limited entry
Figure A2 is something of a best-case scenario. It will hold under rights-based regimes (such as ITQs),
where there is no incentive to compete-away rents, as would be the case with an enforced TAC that allowed
free entry. In the situation of a binding TAC but unlimited entry, the TC curve always touches the yield curve
at the TAC level (Munro & Sumaila, 2002). This is because fishers compete away profits not by increasing
effort as in the open access case, but by capital stuffing and bidding up the cost of inputs such as fishing
vessels or licenses such that profits are capitalised into the value of these inputs. Even when support is
directed at variable costs this would ultimately become capitalised in the value of fixed inputs. The result is no
change in stock, effort or profits as a result of support, but higher values of total investment for fixed inputs
such as fishing vessels. This capitalisation effect may make it difficult to remove support once it is in place;
fishers will have already invested the value of the support in capital and would suffer a real loss if it were
removed.
The conclusion is that fishers’ profits are a poor indication of the benefits that accrue from support.
Either competitive forces or capitalisation of economic profits into fixed inputs means that long run
accounting profits are zero. This does not mean that subsidies (or different management systems) do not
confer benefits. As will be discussed below, producers’ surplus is a better measure of the effective transfer
resulting from a support policy, and the benefits of capitalised support accrue to some stakeholders—just not
always those that are the target of support.
This analysis can also be misleading as all points on the yield curve represent separate long-term
bionomic equilibria based on a stock-harvest pair; it is not a fixed relationship between revenue and effort in
any given year. This means that the impact of subsidies in a medium-term time frame, which may be several
years, cannot be illustrated at all. A subsidy may result in a level of effort and revenue north-east of the MSY

38 – SUPPORT TO FISHERIES: LEVELS AND IMPACTS
OECD FOOD, AGRICULTURE AND FISHERIES PAPERS N°103 © OECD 2017
point (the peak of the yield function), and this situation may persist for many years before the impact of
overfishing becomes felt. The stochastic nature of stock recruitment can further obscure the results.
Analysis of bio-economic equilibrium is also of limited use in identifying other relevant economic
factors. For example, support can distort the choice of production inputs compared with a cost-minimising
choice at market prices. The degree to which this occurs will depend on the extent to which production inputs,
or factors of production, are substitutable and whether it is economically efficient to do so. For example, while
fishers may not have an incentive to fish more under fixed individual quotas, they may elect to fish for longer
periods of time and with different gear or crew size. Support affecting crew or fuel prices will affect this kind
of decision-making.
The yield function shown in Figures A1 and A2 has been used to derive what has been called a
“backward-bending supply function” (Copes, 1970) (Figure A3). However, this is not a true supply function,
but rather a correspondence of all the equilibrium points of the yield function's intersection with the total cost
function. This is explicitly a long-run correspondence, something that is clear from the definition of the yield
function. What is less obvious is that this is not in fact a supply function – either short run or long run, as it
relates total cost to output and not marginal cost.
Figure A3. Correspondence of total cost and output
Source: Copes (1970).

SUPPORT TO FISHERIES: LEVELS AND IMPACTS – 39
OECD FOOD, AGRICULTURE AND FISHERIES PAPERS N°103 © OECD 2017
Preliminary analysis using marginal cost
Most authors considering the impact of subsidies on fishing start from the standard bio-economic model
as in the prior section, using a concave yield function and linear total cost (see for example Tipping 2017,
OECD 2010). In this analysis, support lowers the cost of effort, leading to more effort and a smaller fish stock
in equilibrium. One limitation of this analysis is its implicitly long-run nature. Support may increase effort and
harvest for some time before declining stock size reduces harvest, such that the intersection of the cost and
yield curves is a poor indication of near-term impacts of support.
The following analysis was originally developed in OECD (2001) and OECD (2005) and has been
adapted to the fisheries context. It forms the preliminary basis for an eventual model of support to the fisheries
sector to be developed. It therefore represents an early view of the potential effects of support.
In the short run, a standard upward-sloping supply curve based on the industry marginal cost function is
a more appropriate choice for analysis. This supply function may be interrupted by a TAC that effectively sets
an upper limit on supply (Figure A4). From this representation, an alternative view of the generation of rents
from the existence of a TAC can be observed.
Figure A4. Producer surplus and rent under TAC
For the TAC to be binding, the price of fish must be above the marginal cost at the TAC quantity.
Otherwise, harvesting the full TAC would be unprofitable and the harvest level would be determined by the
price. The price is drawn here as Pw, reflecting a world price that is not sensitive to domestic production.
Demand in excess of domestic availability is imported. The marginal cost at the TAC quantity reflects the
underlying supply function and the producer surplus is the area above the supply function and below marginal
cost. Still assuming that effort is free to enter the fishery, desired effort is Qe, and the TAC results in an effort
gap between what the amount fishers wish to harvest versus what is allowed.
Marginal rents are the difference between price received and marginal cost, and the total rent is the
marginal rent times quantity produced (TAC). They arise because the TAC constrains output at a point where
marginal cost is below price. This is a consequence of the management system and this rent is the “untaxed
resource rents” discussed in the context of the scope of support to fishers.
In the case of a new or increased support policy that reduces the marginal cost of production, the supply
curve shifts down, increasing the rents generated in the fishery and increasing desired effort to Qe’

40 – SUPPORT TO FISHERIES: LEVELS AND IMPACTS
OECD FOOD, AGRICULTURE AND FISHERIES PAPERS N°103 © OECD 2017
(Figure A4, Panel b). The TAC continues to restrain effort, but the gap between allowed and desired effort
increases. This can be interpreted as increased pressure on the management system to increase TAC and
increased potential return to IUU fishing. Increased support in a situation of a binding TAC can therefore
increase total effort when IUU activity is taken into account, and generally puts more strain on the
management and control system.
Management systems are rarely 100% effective in controlling effort, and fishers have a number of ways
by which they can avoid controls. Consider the possibility that some fishing may exceed the TAC; this may be
a subset of fishers that make up the industry supply curve who do IUU fishing, or a propensity of all firms to
carry out IUU activity. If the probability of IUU fishing is proportional to the effort gap, then the amount will
increase with added support. So long as the TAC is at least partially enforced, the sector will still generate
rents, just a smaller amount than the case under perfect enforcement (Figure A5).
Figure A5. Incomplete TAC enforcement allows supply response to support
In the case of a simple cost structure as shown in Figure A4 (linearly increasing marginal cost), the
amount of producer surplus from the increase in support does not change and the entire value of the support
accrues to holders of assets that accumulate rents — typically quotas or licenses with durable property rights
or relatively fixed capital such as vessels. The value of quota or vessels in the fleet consequently increases by
an amount equal to the quantity of support provided.
Even though the producer surplus is unchanged by the introduction of support in panel b of Figure A4,
the distribution of the surplus between fishers and other factor suppliers (such as crew, fuel or gear) will
change depending on the incidence of the support. This cannot be easily shown in a graphical representation
and some derivations are provided in a later section. The initial distribution of producer surplus between
factors (including fishers) is according to the factor share in value of production, but changes resulting from
changes in support will depend on the nature of the supply function.

SUPPORT TO FISHERIES: LEVELS AND IMPACTS – 41
OECD FOOD, AGRICULTURE AND FISHERIES PAPERS N°103 © OECD 2017
It may seem of little interest whether the benefits of support accrue to fishers through the producer
surplus they earn through their owned factors of production or via generation of rents, but there can be some
important implications for the distribution of benefits. Rents become capitalised in the value of the related
policy instrument (quota or licenses) or the most fixed factor of production (usually vessels). The benefits
accrue to those incumbents who own these assets at the time the support is introduced. New entrants or others
acquiring vessels or quota must pay the capitalised value of support through a higher asset price. The support
benefit for them is balanced by an increased capital cost, and the incumbents are the only ones who benefit—
and the benefit is only realised upon sale of the asset. Fishers who pay the higher price for assets do not
benefit from support, but stand to lose if the support is later withdrawn and the value of their assets fall.
Fishers who lease quota must also pay a higher price to account for the support value. Support becomes
entrenched even though current fishers do not benefit.7
Beneficiaries of support
The investigation of the beneficiaries of support depends on certain assumptions about the relevant
incentives and scope of possible reactions by those implicated by a policy. A useful assumption is constant
factor shares in production. These are a defining characteristic of the Cobb-Douglas production function, a
common choice for analysis (Helmberger 1991, and Helmberger and Chavas, 1999). It is assumed that
constant factor shares give a good approximation of changes in factor payments caused by changes in support
measures, even if the underlying aggregate production function is not exactly of the Cobb-Douglas form.
In the case of two factors (capital and labour), the two equations for measuring the gross increase in
factor earnings caused by an increase in support payments are:
GFEk = sk * nk * TR,
GFEl = sl * lf * TR.
GFEk and GFEl are, respectively, the change in gross factor earnings of capital and labour caused by a
change in support. The symbol sk stands for the share of total costs of production attributable to capital —
vessels and the value of licenses and quota. The symbol sl corresponds to the share of total costs of production
attributable to labour, either by the vessel owner or crew. Finally, nr is the proportion of the capital that is
owned by fishers and lf is the proportion of total labour supplied by fishers. It is shown below that the four
parameters sk, nk sl and lf are key determinants of the transfer efficiency of support.
The ease with which fishers can adjust the quantities of capital and labour they use will be reflected in
the elasticity of factor supply for those two factors. The higher the elasticity of factor supply, the greater is the
adjustment in factor use in response to a policy-induced change in factor returns, and the less the net gain in
income for a given change in support. Helmberger proposes a simple formula for using the elasticity of factor
supply in calculating the net gain in factor returns due to a policy-induced increase in factor payments. The
general version of the formula is
NFE = 1/(1+e) * GFE
NFE is the net gain in factor earnings due to a policy-induced increase in gross factor earnings and e is
the elasticity of supply of a factor.
A zero elasticity of supply for a factor corresponds to that situation where the factor is completely fixed
in production. This is the only situation in which all the gains in factor payments induced by an increase in
support can be counted as net gain in factor earnings. In all other circumstances, the elasticity of factor supply
(which is always positive) serves to regulate what fraction of the gross gain in factor earnings gets counted as
net gain.
42 – SUPPORT TO FISHERIES: LEVELS AND IMPACTS
OECD FOOD, AGRICULTURE AND FISHERIES PAPERS N°103 © OECD 2017
The net gain in income due to a change in support is equal to the sum of the induced net gains in factor
earnings on the capital and labour supplied by fishers. Accordingly, the relationship shown in the above
equation can be used to calculate the net gain in income due to an increase in support:
FI = GFEk / (1+ ek) + GFEl / (1+el).
FI is the change in fishers' income due to the change in support payments. The symbol ek refers to the
elasticity of supply of capital (whether owned by fishers or by others) and el is the elasticity of the supply of
fishers' labour.
This leads to the following formula for estimating the gain in income associated with a given increase in
total revenues.
FI = [sk * nk / (1+ek) + sl * lf / (1+el)] * TR
This shows that, all other things being equal, the increase in income due to an increase in total revenues
will be smaller: a) the smaller the cost shares of fishers' capital and labour and b) the larger is the elasticity of
supply of those factors.
More generally, the supply function can be expressed as a function of the elasticities of supply of the
factors of production used, the elasticity of substitution between them, and the factor value shares in output
(Dewbre, Antón, & Thompson, 2001). The elasticity of supply for a two-factor case can be expressed as:
𝑒𝑘𝑠𝑘𝜎 + 𝑒𝑙𝑠𝑙𝜎 + 𝑒𝑘𝑒𝑙
𝜎 + 𝑒𝑘𝑠𝑘 + 𝑒𝑙𝑠𝑙,
where s is the factor share with respect to capital and labour (k and l subscripts) and is the elasticity of
substitution between them.
Relative effect of different types of support on effort
The question of the incidence of support has been long studied in the context of agriculture (Gardner,
1979; Houck, 1989; Griliches, Holdreth, & Grilicihs, 1959). In an early study, Floyd (1965) derives the supply
function of output as a function of input supply, and Gardner (1987) expanded on and generalised this
analysis. It has been used investigate the relative impacts of different support types (see for example Dewbre,
Antón and Thompson, 2001; Hertel 1989). The mathematical development that follows below is based largely
on the exposition by Gardner.
Consider the production of an output, x, that depends on two inputs, a and b. Notionally for fisheries, x is
fishing effort, and landings will depend on both effort and stock size, as reflected in the catch per unit effort.
This analysis excludes stock effects and focusses on desired fishing effort. It is therefore most representative
of the case of highly schooling fish stocks. The six following equations define the economic system:
Production function: 𝑥 = 𝑓(𝑎, 𝑏)
Equality of value of marginal product (VMP) to factor price: 𝑓𝑎𝑃𝑥 = 𝑃𝑎
𝑓𝑏𝑃𝑥 = 𝑃𝑏
Factor supplies: 𝑎 = 𝑔(𝑃𝑎)
𝑏 = ℎ(𝑃𝑏)
Product demand: 𝑥 = 𝐷(𝑃𝑥)

SUPPORT TO FISHERIES: LEVELS AND IMPACTS – 43
OECD FOOD, AGRICULTURE AND FISHERIES PAPERS N°103 © OECD 2017
The goal is to solve this as a system of equations via substitution. The first step however is to take total
differentials of all equations, convert these differentials to percentage changes by dividing by the relevant
variable. For the production function, this results in:
𝑑𝑥 = 𝑓𝑎𝑑𝑎 + 𝑓𝑏𝑑𝑏
𝑑𝑥
𝑥𝑎𝑏=
𝑃𝑎
𝑃𝑥𝑥𝑏
𝑑𝑎
𝑎+
𝑃𝑏
𝑃𝑥𝑥𝑎
𝑑𝑏
𝑏 (dividing by xab and using 𝑓𝑖=
𝑃𝑖
𝑃𝑥)
𝑑𝑥
𝑥=
𝑃𝑎𝑎
𝑃𝑥𝑥
𝑑𝑎
𝑎+
𝑃𝑏𝑏
𝑃𝑥𝑥
𝑑𝑏
𝑏 (multiply by ab)
𝐸𝑋 = 𝐾𝑎𝐸𝑎 + 𝐾𝑏𝐸𝑏 (1)
Where E is the percentage change operator and Ki is the value share of factor i. Equation 1 indicates that
the percentage change in effort is equal to the percentage change in inputs multiplied by their factor shares.
Similar operations can be used to find:
𝐸𝑃𝑎 = −𝐾𝑏
𝜎𝐸𝑎 +
𝐾𝑏
𝜎𝐸𝑏 + 𝐸𝑃𝑥
(2)
𝐸𝑃𝑏 = −𝐾𝑎
𝜎𝐸𝑏 +
𝐾𝑎
𝜎𝐸𝑎 + 𝐸𝑃𝑥
(3)
Where is the Allen partial elasticity of substitution 𝜎 =𝑓𝑎𝑓𝑏
𝑥𝑓𝑎𝑏.
The supply function is found by applying a change in output price. Divide (1) by EPx and substitute in
(2) and (3). This yields:
𝐸𝑥
𝐸𝑃𝑥=
𝑒𝑎𝑒𝑏 + 𝜎(𝐾𝑎𝑒𝑎 + 𝐾𝑏𝑒𝑏)
𝜎 + 𝐾𝑎𝑒𝑏 + 𝐾𝑏𝑒𝑎
(4)
Where ei is the supply elasticity of factor i (𝑒𝑖 =𝐸𝑖
𝐸𝑃𝑖).
A support to factor a that increases Pa expressed as an ad valorem rate of support (multiplying price) has
the following impact:
𝐸𝑃𝑎 =𝐸𝑎
𝑒𝑎+ 𝐸𝑆𝑎
That is, the percentage change in factor price equals the percentage change in subsidy plus an adjustment
for movement along the factor supply function. Substituting the above into equations (2) and (3) and resolving
the system results, after some manipulation, in
𝐸𝑥
𝐸𝑆𝑥=
−𝜂[𝑒𝑎𝑒𝑏 + 𝜎(𝐾𝑎𝑒𝑎 + 𝐾𝑏𝑒𝑏)]
𝑒𝑎𝑒𝑏 − 𝜂(𝜎 + 𝐾𝑎𝑒𝑏 + 𝐾𝑏𝑒𝑎) + 𝜎(𝐾𝑎𝑒𝑎 + 𝐾𝑏𝑒𝑏)
(5)
𝐸𝑥
𝐸𝑆𝑎=
−𝐾𝑎𝜂𝑒𝑎(𝑒𝑏 + 𝜎)
𝑒𝑎𝑒𝑏 − 𝜂(𝜎 + 𝐾𝑎𝑒𝑏 + 𝐾𝑏𝑒𝑎) + 𝜎(𝐾𝑎𝑒𝑎 + 𝐾𝑏𝑒𝑏)
(6)
𝐸𝑥
𝐸𝑆𝑏=
−𝐾𝑏𝜂𝑒𝑏(𝑒𝑎 + 𝜎)
𝑒𝑎𝑒𝑏 − 𝜂(𝜎 + 𝐾𝑎𝑒𝑏 + 𝐾𝑏𝑒𝑎) + 𝜎(𝐾𝑎𝑒𝑎 + 𝐾𝑏𝑒𝑏)
(7)

44 – SUPPORT TO FISHERIES: LEVELS AND IMPACTS
OECD FOOD, AGRICULTURE AND FISHERIES PAPERS N°103 © OECD 2017
Where the denominator of these equations is the determinant of the matrix of parameters for the
simultaneous system.8 is the elasticity of demand.
Taking the difference of (5), (6) and (7) shows that a subsidy inducing a percentage change in effort is
equivalent to subsidies that induce the same percentage change in all inputs:
𝐸𝑥
𝐸𝑆𝑥= −
𝐸𝑥
𝐸𝑆𝑎−
𝐸𝑥
𝐸𝑆𝑏
The above is expressed in percentage change and is relatively intuitive given that the production function
is homogenous of degree 1. This provides a basis for understanding how unequal changes in input support can
effect output. Dewbre, Antón and Thompson (2001) apply this framework to equivalent levels of support and
find that for a subsidy of equal monetary value applied to an input or to output, the ratio of effect is equal to:
𝑒𝑎(𝜎 + 𝑒𝑎)
𝑒𝑎𝑒𝑏 + 𝜎(𝐾𝑎𝑒𝑎 + 𝐾𝑏𝑒𝑏)
This equation holds only in the special case of no initial support and no effect of domestic production on
price (Pw fixed; small country assumption). They find in general that the range of difference in impact under
less restrictive conditions is always positive—input support is always more distortive for a given quantity—
but cannot be further defined. This is because the initial level of support matters in calculating the
proportional impact of additional support on price.
The division of rents and producer surplus
In the case of a TAC allocated as quota, the rents do not go either factor of production but to quota
owners. As shown in Figure 14, the rental rate is the difference between Px and the (marginal) cost on the
supply curve, 𝑅 = 𝑃𝑥 − 𝐶𝑥. If the quota assigned to a fisher changes, the percentage change in Cx is a move
along the supply function found as the reciprocal of (4). So change in rents for a change in quota (change in
allowed x) is
𝑑𝑅
𝑑𝑥=
𝑑𝑃𝑥
𝑑𝑥−
𝑑𝐶𝑥
𝑑𝑥
Expressing R as a percentage of price:
𝑑𝑅
𝑑𝑥
𝑥
𝑃𝑥=
𝑑𝑃𝑥
𝑑𝑥
𝑥
𝑃𝑥−
𝑑𝐶𝑥
𝑑𝑥
𝑥
𝐶𝑥
𝐶𝑥
𝑃𝑥
or
𝐸𝑅
𝐸𝑥=
1
𝜂−
𝐶𝑥𝑃𝑥
⁄
𝜀
Where .
Support to input or output use raises factor supply prices (and therefore producer surplus), but quota
reduces factor prices (reducing benefits to fishers and input suppliers) while increasing rents (increasing
benefits to incumbent quota holders). The factor price change for a change in quota is:
𝐸𝑃𝑎
𝐸𝑥=
𝜎 + 𝑒𝑏
𝑒𝑎𝑒𝑏 + 𝜎(𝐾𝑎𝑒𝑎 + 𝐾𝑏𝑒𝑏)
And the change in quantity of the factor is just the above multiplied by the elasticity of supply of the factor.
8. The equations for Sb and Sx are not shown here, but are derived in a similar way.

SUPPORT TO FISHERIES: LEVELS AND IMPACTS – 45
OECD FOOD, AGRICULTURE AND FISHERIES PAPERS N°103 © OECD 2017
Annex references
Arrow, K., Chenery, H., Minhas, B., & Solow, R. (1961). Capital-Labor Substitution and Economic Efficiency. The
Review of Economics and Statistics, Vol. 43/3, pp. 225-250.
Auerbach, R. (1970). The Effects of Price Supports on Output and Factor Prices in Agriculture. Journal of Political
Economy, Vol. 78/6, pp. 1355-1361.
Copes, P. (1970). The Backward-Bending Supply Curve of the Fishing Industry. Scottish Journal of Political
Economy, Vol 17/1, pp. 69-77.
Dewbre, J., Antón, J., & Thompson, W. (2001). The Transfer Efficiency and Trade Effects of Direct Payments.
Amer. J. Agr. Econ, Vol. 83/5, pp. 1204-1214.
Douglas, P. (1976). The Cobb-Douglas Production Function Once Again: Its History, Its Testing, and Some New
Empirical Values. Journal of Political Economy,Vol. 84/5, pp. 903-915.
Floyd, J.E. (1965), “The Effects of Farm Price Supports on the Return to Land Labour in Agriculture” in Journal of
Political Economy, N°73, pp. 148-58.
Gardner, B. (1979). Determinants of Supply Elasticity in Interdependent Markets. American Journal of Agricultural
Economics, Vol. 61/3, pp. 463-475.
Griliches, Z., Holdreth, C., & Grilicihs, Z. (1959). The Demand for Inputs in Agriculture and a Derived Supply
Elasticity. Source Journal of Farm Economics, 41(2), 309-322.
Hertel, T.W. (1989), “Negotiating Reductions in Agricultural Support: Implications of Technology and Factor
Mobility, American Agricultural Economics Association Journal, Vol. 71/3, pp. 559-573.
Houck, J. (1985). The Link between Supply Response and Production Elasticities. North Central Journal of
Agricultural Economics, Vol 7/1, pp. 11-17.
Houck, J. (1989). An All-Elasticity Approach to Factor Demand and Output Supply. North Central Journal of
Agricultural Economics, Vol. 11/1, pp. 75-81.
Kumar, P., Shinoj, P., Raju, S., Kumar, A., Rich, K., & Msangi, S. (n.d.). Factor Demand, Output Supply
Elasticities and Supply Projections for Major Crops of India. Agricultural Economics Research Review,
Vol. 23, pp. 1-14.
McFadden, D. (1963). Constant Elasticity of Substitution Production Functions. The Review of Economic Studies,
Vol. 30/2, pp. 73-83.
OECD (2005), The Six-Commodity PEM Model: Preliminary Results [TAD/CA/APM(2005)30].
Plourde, C. (1970). A Simple Model of Replenishable Natural Resource Exploitation. Source: The American
Economic Review, 60(3), 518-522.


Support to Fisheries: Levels and ImpactsMay 2017