Support RAND For More Information and Foreign Aid Allocation Kamiljon T. Akramov This document was...
180
This document and trademark(s) contained herein are protected by law as indicated in a notice appearing later in this work. This electronic representation of RAND intellectual property is provided for non- commercial use only. Permission is required from RAND to reproduce, or reuse in another form, any of our research documents for commercial use. Limited Electronic Distribution Rights This PDF document was made available from www.rand.org as a public service of the RAND Corporation. 6 Jump down to document THE ARTS CHILD POLICY CIVIL JUSTICE EDUCATION ENERGY AND ENVIRONMENT HEALTH AND HEALTH CARE INTERNATIONAL AFFAIRS NATIONAL SECURITY POPULATION AND AGING PUBLIC SAFETY SCIENCE AND TECHNOLOGY SUBSTANCE ABUSE TERRORISM AND HOMELAND SECURITY TRANSPORTATION AND INFRASTRUCTURE WORKFORCE AND WORKPLACE The RAND Corporation is a nonprofit research organization providing objective analysis and effective solutions that address the challenges facing the public and private sectors around the world. Visit RAND at www.rand.org Explore Pardee RAND Graduate School View document details For More Information Browse Books & Publications Make a charitable contribution Support RAND
Transcript of Support RAND For More Information and Foreign Aid Allocation Kamiljon T. Akramov This document was...

This document and trademark(s) contained herein are protected by law as indicated in a notice appearing later in this work. This electronic representation of RAND intellectual property is provided for non-commercial use only. Permission is required from RAND to reproduce, or reuse in another form, any of our research documents for commercial use.
Limited Electronic Distribution Rights
This PDF document was made available from www.rand.org as a public
service of the RAND Corporation.
6Jump down to document
THE ARTS
CHILD POLICY
CIVIL JUSTICE
EDUCATION
ENERGY AND ENVIRONMENT
HEALTH AND HEALTH CARE
INTERNATIONAL AFFAIRS
NATIONAL SECURITY
POPULATION AND AGING
PUBLIC SAFETY
SCIENCE AND TECHNOLOGY
SUBSTANCE ABUSE
TERRORISM AND HOMELAND SECURITY
TRANSPORTATION ANDINFRASTRUCTURE
WORKFORCE AND WORKPLACE
The RAND Corporation is a nonprofit research organization providing objective analysis and effective solutions that address the challenges facing the public and private sectors around the world.
Visit RAND at www.rand.org
Explore Pardee RAND Graduate School
View document details
For More Information
Browse Books & Publications
Make a charitable contribution
Support RAND
This product is part of the Pardee RAND Graduate School (PRGS) dissertation series.
PRGS dissertations are produced by graduate fellows of the Pardee RAND Graduate
School, the world’s leading producer of Ph.D.’s in policy analysis. The dissertation has
been supervised, reviewed, and approved by the graduate fellow’s faculty committee.
Governance and Foreign Aid Allocation
Kamiljon T. Akramov
This document was submitted as a dissertation in July, 2006 in partial fulfillment of the requirements of the doctoral degree in public policy analysis at the Pardee RAND Graduate School. The faculty committee that supervised and approved the dissertation consisted of Charles Wolf, Jr. (Chair), Robert Klitgaard, and Jacob Klerman. Yi Feng of Claremont Graduate University was the external reader for the dissertation.
The RAND Corporation is a nonprofit research organization providing objective analysis and effective solutions that address the challenges facing the public and private sectors around the world. RAND’s publications do not necessarily reflect the opinions of its research clients and sponsors.
R® is a registered trademark.
All rights reserved. No part of this book may be reproduced in any form by any electronic or mechanical means (including photocopying, recording, or information storage and retrieval) without permission in writing from RAND.
Published 2006 by the RAND Corporation1776 Main Street, P.O. Box 2138, Santa Monica, CA 90407-2138
1200 South Hayes Street, Arlington, VA 22202-50504570 Fifth Avenue, Suite 600, Pittsburgh, PA 15213
RAND URL: http://www.rand.org/To order RAND documents or to obtain additional information, contact
Distribution Services: Telephone: (310) 451-7002; Fax: (310) 451-6915; Email: [email protected]
The Pardee RAND Graduate School dissertation series reproduces dissertations that have been approved by the student’s dissertation committee.
iii
PREFACE
This study is submitted as a doctoral dissertation to the Pardee RAND Graduate
School in partial fulfillment of the requirements for the degree of Doctor of Philosophy in
Policy Analysis. The Pardee RAND Graduate School provided funding for this research
through the Palevsky Dissertation Award.
The study examines the relationship between governance, foreign aid allocation and
effectiveness. In particular, the study explores how different categories of aid impact
economic growth, whether the interaction of different levels of governance with different
categories of aid is significant in promoting growth. The study also explores whether the
quality of governance in recipient countries affects the donors’ aid allocation decisions. The
findings of the study should be of interest to policy makers, policy analysts, scholars and
officials of donor agencies and international financial institutions.


v
CONTENTS
Preface…………………………………………….…………………..………..………….ii
Figures……………………..…………………………………………………………….....v
Tables………..…………………………………….…………………………………..…..vi
Acknowledgments....….....………………………………………………………….……viii
Abbreviations.………...………………..………………………………………………….ix
Chapter 1. Introduction…………………..………………………………………………..1
1.1. Policy Problem and Research Objectives.…………………………...…………1 1.2. Outline of the Dissertation……………..…………………………...…………4
Chapter 2. Foreign Aid in Perspective…………………………………………...…………7
2.1. Defining and Measuring Foreign Aid………………………………...………..8 2.2. Evolution of Foreign Aid……………………………………………......……11 2.3. Patterns of Foreign Aid Flows: Some Stylized Facts……………………..……25 Chapter 3. Overview of Existing Studies……………………………………..………..….32
3.1. Aid effectiveness: What does past research tell us?………………………....…32 3.2. What Are the Determinants of Donors’ Aid Allocation Policies………….…..44 3.3. Governance and Its Relation to Foreign Aid and Development……………....50 3.4. Summing Up………………………………………………...………..……..53
Chapter 4. Methodological Approach…………………………………………….………55
4.1. Conceptual Framework…………………………………………….…….…..55 4.2. Aid effectiveness Model……………………………………………..……..…62
4.2.1. Growth Equation………………………………………………..…65 4.2.2 Investment equation……………………………………………..…67 4.2.3. Human Capital Equation……………………………………..……69
4.3. Aid Allocation Model……………………………………………………..….70
Chapter 5. Data and Identification Strategy……………………………………………....80
5.1. Data sources and computations………………………………………..……..80 5.2. Descriptive Statistics of the Data………………………………………..……84 5.3. Using Measures of Governance in the Context of Panel Analysis………..……91
5.4. Identification Issues and Estimation Techniques…………………………..…98 Chapter 6. Analysis and Discussion of the Results…………………………………….....106

vi
6.1. Aid Effectiveness………………………………...………………………….106 6.1.1 The Core Results………………………..………………………...109
6.1.2 Checking the robustness of results………..……………………….123 6.2. Aid Allocation………………………………………..……………………..125 6.2.1 Aggregate aid flows…………………………..……………………125
Aid Eligibility Stage………………………..……………………125 Aid Levels Stage……………………………..…………………..126 Sectoral Allocation Stage……………………..………………….128
6.2.2 Donor by Donor Results……………………………..……………134 6.3. Discussion of the results……………………….……………….…………...138
Chapter 7. Conclusions and Implications…………………………………..……………144
Major Findings………………………………………………………..…..…….145 Policy Implications……………………………………………………..….……147
Reference………………………………………………………………………..……....149
Appendix 1….………………………………………………………...…………..…….158
Appendix 2….………………………………………………………...…………..…….160
Appendix 3….………………………………………………………...…………..…….163
Appendix 4….………………………………………………………...…………..…….163
Appendix 5….………………………………………………………...…………..…….164
vii
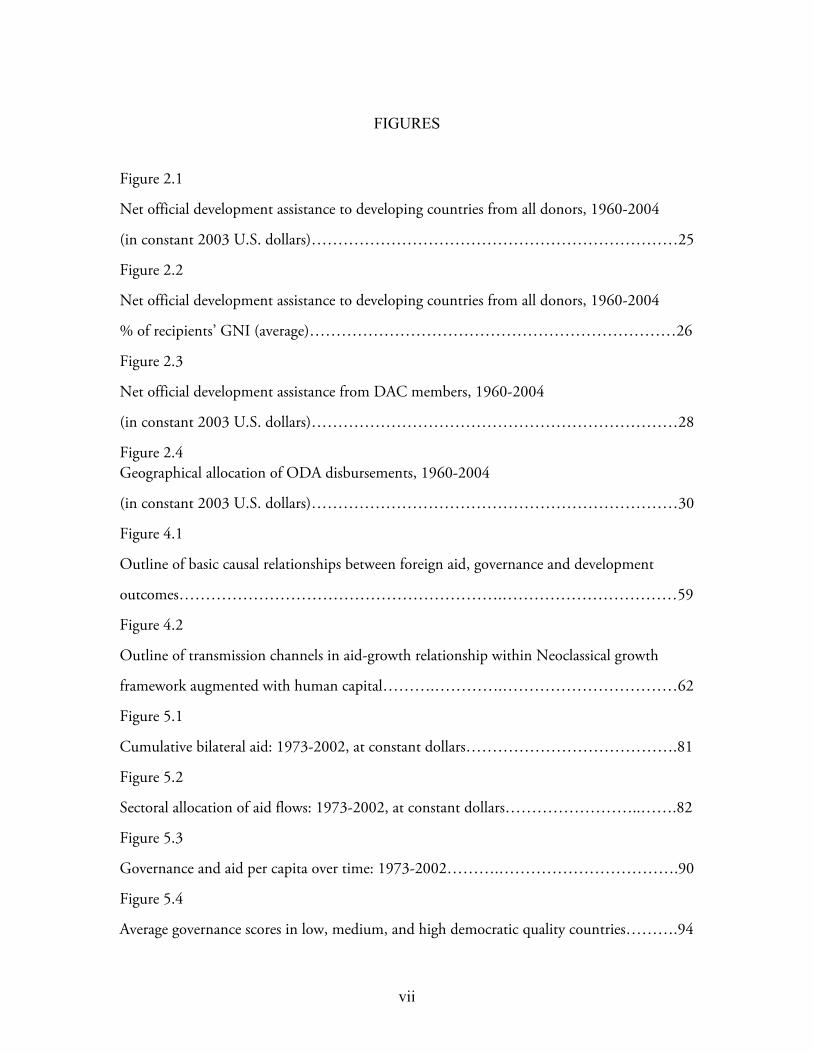
FIGURES
Figure 2.1
Net official development assistance to developing countries from all donors, 1960-2004
(in constant 2003 U.S. dollars)……………………………………………………………25
Figure 2.2
Net official development assistance to developing countries from all donors, 1960-2004
% of recipients’ GNI (average)……………………………………………………………26
Figure 2.3
Net official development assistance from DAC members, 1960-2004
(in constant 2003 U.S. dollars)……………………………………………………………28
Figure 2.4 Geographical allocation of ODA disbursements, 1960-2004
(in constant 2003 U.S. dollars)……………………………………………………………30
Figure 4.1
Outline of basic causal relationships between foreign aid, governance and development
outcomes…………………………………………………….……………………………59
Figure 4.2
Outline of transmission channels in aid-growth relationship within Neoclassical growth
framework augmented with human capital……….………….……………………………62
Figure 5.1
Cumulative bilateral aid: 1973-2002, at constant dollars………………………………….81
Figure 5.2
Sectoral allocation of aid flows: 1973-2002, at constant dollars……………………..…….82
Figure 5.3
Governance and aid per capita over time: 1973-2002……….…………………………….90
Figure 5.4
Average governance scores in low, medium, and high democratic quality countries……….94

ix
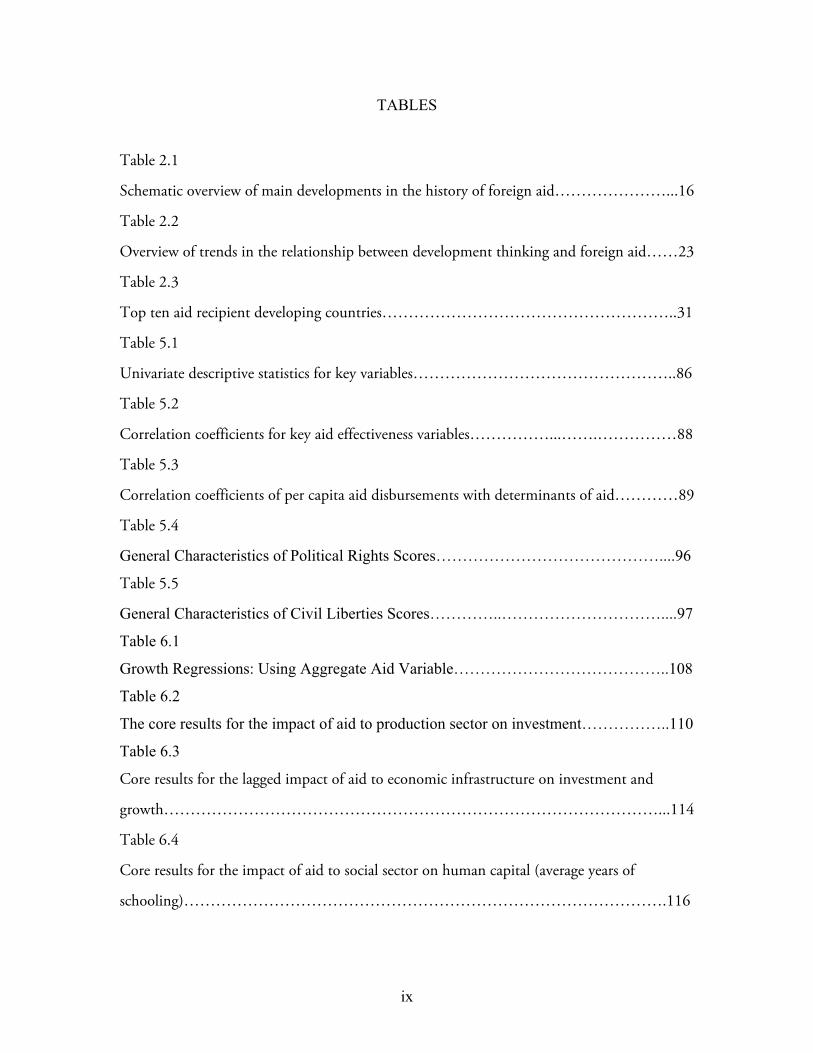
TABLES
Table 2.1
Schematic overview of main developments in the history of foreign aid…………………...16
Table 2.2
Overview of trends in the relationship between development thinking and foreign aid……23
Table 2.3
Top ten aid recipient developing countries………………………………………………..31
Table 5.1
Univariate descriptive statistics for key variables…………………………………………..86
Table 5.2
Correlation coefficients for key aid effectiveness variables……………...…….……………88
Table 5.3
Correlation coefficients of per capita aid disbursements with determinants of aid…………89
Table 5.4
General Characteristics of Political Rights Scores……………………………………....96
Table 5.5
General Characteristics of Civil Liberties Scores…………..…………………………....97
Table 6.1
Growth Regressions: Using Aggregate Aid Variable…………………………………..108
Table 6.2
The core results for the impact of aid to production sector on investment……………..110
Table 6.3
Core results for the lagged impact of aid to economic infrastructure on investment and
growth…………………………………………………………………………………...114
Table 6.4
Core results for the impact of aid to social sector on human capital (average years of
schooling)……………………………………………………………………………….116

x
Table 6.5
Growth equation………………………………………………………………….……..119
Table 6.6
Investment equation…………………………………………………….…………...…..120
Table 6.7
Human capital equation (excluding institutional quality variable).……..………………..121
Table 6.8
Human capital equation (including institutional quality variable).……..………………..122
Table 6.9
Aid equation: Eligibility stage (all bilateral donors)…………………….…………….…..129
Table 6.10
Aid equation: Level stage (all bilateral donors)………...……………….…………….…..130
Table 6.11
Aid equation: Sectoral allocation stage (SC, all bilateral donors)……….…..………...…..131
Table 6.12
Aid equation: Sectoral allocation stage (PC, all bilateral donors)……….…..………...….132
Table 6.13
Aid equation: Sectoral allocation stage (EI, all bilateral donors)……….…..………....…..133
Table 6.14
Aid equation-Eligibility stage: Individual donors……………..……….…..….……...…..136
Table 6.15
Aid equation-Level stage: Individual donors…………...……..……….…..….……...…..137
xi
ACKNOWLEDGMENTS
I am grateful for the support and kindness provided by many people throughout my
doctoral program. I want to extend special thanks to Ms. Ellen Palevsky who provided
generous financial support for this research. I also want to thank Mr. Don Conlan and Mrs.
Marilyn Conlan whose support and encouragement have been invaluable during my time at
RAND.
I want to extend special appreciation to Professor Charles Wolf, Jr., the chair of my
dissertation committee and the founding dean of the RAND Graduate School, whose
support and guidance have been important during the course of my study at RAND. I wish
to thank the President and University Professor of Claremont Graduate University, my
dissertation advisor and former dean of the PRGS, whose support, encouragement and
intellectual guidance have been enormous during the course of my study at RAND. I also
would like to thank my other dissertation committee member, Professor Jacob Klerman, for
his support, encouragement, and valuable comments.
Many individuals at RAND have also supported me during my course of study and
deserve special acknowledgement: Tom Epley, Johan Fedderke, Bart Bennett, Olga Oliker,
Rachel Swanger, and Sergej Mahnovski.
I would like to also extend my appreciation to Professor Yi Feng at Claremont
Graduate University for his valuable suggestions and comments.
Finally, I would like to thank members of my family, especially my parents, my wife
and my children, whose love and support have always been the source of my strength in
times of difficulties during my doctoral program.
This dissertation is dedicated to the memory of my late father Tagay Akramov.

xiii
Abbreviations
ADB – Asian Development Bank
AfDB – African Development Bank
CIS – Commonwealth of Independent States
CRS – Credit Reporting System
DAC – Development Assistance Committee
DOTS – Directions of Trade Statistics
EBRD – European Bank for Reconstruction and Development
EDA – Effective Development Assistance
IADB – Inter-American Development Bank
ICOR – Incremental capital-output ratio
IFC – International Finance Corporation
IFS – International Financial Statistics
ILO – International Labor Organization
IMF – International Monetary Fund
MCA – Millennium Challenge Account
MDGs – Millennium Development Goals
OA – Official Aid
ODA – Official Development Assistance
OECD – Organization for Economic Cooperation and Development
TA – Technical Assistance
UN – United Nations
UNDP – United Nations Development Program
USAID – United States Agency for International Development
WDI – World Development Indicators

1
Chapter I. Introduction
This dissertation addresses foreign aid allocation and development effectiveness. This
is an important issue as each year donors transfer tens of billions of dollars in foreign aid to
developing countries. The introductory chapter describes the policy problem and research
objectives and provides the outline of the dissertation.
1.1. Policy Problem and Research Objectives
In the post-September 11 world, the perspectives of donor nations on foreign aid or
official development assistance (ODA) have changed significantly. In the past, especially in
the Cold War environment, foreign aid was at times used to “buy” elites and thus influence
affairs in third world countries. Effects on development were viewed as secondary. This
approach is no longer acceptable because developing nations’ importance to global security
has risen significantly in recent years. For instance, several developing countries in Asia and
Africa have served as staging points for worldwide terrorist attacks. Industrialized countries
have realized the need for a close cooperation with governments of developing countries to
ensure global security. They have also begun to understand that persistent poverty makes
developing countries vulnerable to security and other threats1. Therefore, rhetoric of foreign
aid has been increasingly shifted towards the challenges of development2. The contemporary
view links two groups of rationales for foreign aid - donors’ self-interest (strategic, political,
and economic) and recipient-needs (poverty reduction, improving primary school
enrollment, reducing maternal and infant mortality) - to a form of enlightened donors’ self-
interest that recognizes that a world with less poverty and diseases, and more educated people
1 While some evidence suggests little direct connection between poverty or education and participation in terrorism, other evidence suggests that “poverty at the national level may indirectly affect terrorism through the apparent connection between economic conditions and the proclivity for countries to undergo civil wars” (Krueger and Malečkovà 2003). 2 For example, “The National Security Strategy of the United States of America” (September 2002) considers promoting development through foreign aid, along with defense and diplomacy, is an important part of security policy (http://www.state.gov/documents/organization/15538.pdf).
2
is likely to provide a more secure and stable environment with more opportunities for all of
the world’s population.
Consequently, donor countries have begun to mobilize additional resources for the
needs of developing countries. Several donors have pledged to reach the United Nation’s
target level (0.7 percent of donor’s gross national income) for ODA over the next decade or
so, and others have begun to significantly increase their commitments for development
assistance (Heller 2005). For instance, the United States has started new Millennium
Challenge Account, with potential budget of $5 billion per year by 2006 (Radelet 2003).
Based on new pledges and greater commitments to development assistance from donor
nations, there is a possibility of significant scaling up of foreign aid resources far beyond the
current and past levels (Heller 2005).
Although scaling up of official development assistance seems to open hope and
prospect for a better future for many developing countries, it will also raise many challenges
for policymakers in donor and recipient countries and international financial organizations.
Gupta et al (2005) and Heller (2005) have provided a checklist of policy issues that need to
be considered by development partners. As they have stressed, the success of scaling up aid
transfers depends on how these policy challenges are addressed. This is essential as past
experiences with aid flows have not always brought the desired result and it is therefore
important to learn lessons from past experiences and look toward the potential challenges of
the future. The purpose of this dissertation research is to address one policy issue associated
with scaling up of aid flows: how to use aid flows to promote higher growth, given the
contradictory evidence that aid has promoted growth in the past.
From the donors’ perspective, the commitment to increase aid flows to developing
countries is only the starting point. Donors have to ascertain that aid flows are allocated
among recipients and various sectors efficiently to ensure that resources will promote
economic growth in recipient countries. Tying the allocation of foreign aid to improved
governance might be one approach to increase the effectiveness of ODA. In recent years, calls
for improving the effectiveness of foreign aid have increased, and demands for performance
3
driven aid allocation policies are expressed in a number of occasions (World Bank 1998,
Svensson 2000, Radelet 2003, USAID 2004). This in turn raises questions regarding the
economic role of the donors’ aid allocation policies in ensuring the effectiveness of foreign
aid transfers in promoting development outcomes. Indeed the allocation of foreign aid
without proper goals and incentives may waste large amount of financial resources.
This dissertation aims to inform the policy debate and add to the literature on the
subject in three ways:
• From an analytical perspective, the aim is to develop a framework drawing from
the neoclassical growth model augmented with human capital and principal-
agent framework, which uses the quality of governance in recipient countries as
an informative signal to improve donors’ aid allocation decisions. This
framework allows the illustration of how aid can potentially impact development
outcomes (economic growth) in recipient countries through diverse set of
transmission channels.
• From an empirical perspective, aid flows are disaggregated into four mutually
exclusive and collectively exhaustive categories: 1) aid to production sectors, 2)
aid to economic infrastructure, 3) aid to social sector, and 4) other aid. Then
focusing on the first three categories of aid, which account for about two thirds
of all aid flows, aid effectiveness and allocation models are developed. Moreover,
I attempt to control for four sources of unobserved heterogeneity: different aid
categories, different levels of governance, country fixed affects and period fixed
effects.
• From a policy perspective, policy recommendations are developed to improve
donors’ aid allocation policies based on the empirical results.

4
1.2. Outline of the Dissertation
This dissertation examines whether aid allocation patterns affect the outcomes of
foreign aid in promoting economic growth. Specifically, the study explores how different
categories of aid affect economic growth, whether the quality of governance is significant in
explaining differences in economic growth, and whether the interaction of different levels of
governance with different categories of aid flows is significant in promoting growth. This
study also explores whether the quality of governance in recipient countries affects the
donors’ decisions at the aggregate and individual country levels.
In order to achieve the research objectives, the dissertation is organized as follows.
Chapter 2 provides the background for the dissertation research by discussing the evolution
of foreign aid and describing the trends and patterns of foreign aid considering aggregate
volumes, sources and destinations. It also discusses some methodological issues related to the
definition of foreign aid, differences between commercial and capital flows, official
development assistance, and strategies of aid giving. The definition of foreign aid is less
straightforward than one might think as the literature uses various definitions of aid. In this
study, aid is defined as what the OECD calls official development assistance (ODA) as well
as official assistance (OA). ODA is defined as the flows to developing countries that mainly
aim to promote economic development and welfare of developing countries; and these flows
are concessional in character and convey a grant element of at least 25 percent. OA
comprises flows, which meet the definition of ODA, but are directed to countries in
transition.
Chapter 3 provides an overview of existing studies. There is broad and contradictory
literature relating to foreign aid allocation and effectiveness. The analysis suggests that there
is a definite gap in existing voluminous literature on aid allocation and effectiveness. This
chapter also reviews issues related to governance and its relation to foreign aid.
5
Chapter 4 defines the research methodology for the empirical analysis. It starts by
describing the theoretical framework that outlines the basic causal relationship between
foreign aid, governance and development outcomes (economic growth). Then, this chapter
derives the econometric equations used to test the effectiveness of aid in promoting
development outcomes. In doing so, I use augmented neoclassical growth framework
following Mankiw et al (1992). In addition, this chapter develops a microeconomic model to
explore donors’ aid allocation decisions and their potential impact on aid effectiveness based
on theory of incentives, viewing donors as principals and recipients as their agents.
Chapter 5 describes the data and the econometric methodology. This research
analyzes the aid allocation and aid effectiveness by using panel data. The panel data that will
be used consists of repeated measurements on the same unit, the recipient, that are “pooled”
with those of other units to provide a combination of longitudinal and cross-sectional
information. This raises some important methodological issues concerning aggregation,
unobserved heterogeneity, and endogeneity. Therefore, I focus on these important aspects of
the model specification that are relevant to both aid effectiveness and allocation equations.
First, I propose to use feasible generalized least squares (FGLS) estimator to address the
problem of autocorrelation within panels and cross-sectional correlation across panels.
Second, I propose to use difference-in-difference and difference-in-difference-in-difference
estimations to address unobserved heterogeneity problem since it provides consistent
estimates in this context. Third, in reality, the impact of aid on development outcome is not
instantaneous. It takes time for the aid effect to be fully transmitted into development
outcomes. Therefore, it makes sense to relate lagged aid flows to development outcomes.
Such a specification, to some extent, may allow us to avoid the problem of two-way causality
if it indeed exists. I specify the models assuming the causation running from aid allocation
patterns to development outcomes3.
The analyses of empirical results, including the robustness test and their relation to
existing research is provided in chapter 6. In contrast to overwhelming majority of existing
3 We fully understand that this assumption will only address some issues related to two-way causality, but it will not provide a full solution for the problem. Indeed, a full satisfactory solution may not exist.
6
studies, I examine the impact of disaggregated aid on growth assuming that different types of
aid will impact the growth through different transmission channels. In addition, I propose
that the effectiveness of these channels depend on the recipients’ quality of governance.
Further, the findings of the empirical analysis are supported by anecdotal evidences. This
chapter also relates the results to existing literature and development practice. One of the
most significant findings of this research is that foreign aid that goes to different sectors of
the recipient country’s economy will impact the development outcomes differently
depending on their interaction with the quality of governance. The final chapter of the
dissertation draws conclusions and makes policy recommendations developed from the key
findings of the study.

7
Chapter 2. Foreign Aid in Perspective
The community of donor countries has now accumulated more than five decades of
experience in providing development assistance to developing countries and countries with
economies in transition. The objectives, strategies and policies, size and composition of
foreign aid to developing countries has changed substantially over time. Although, in early
years, it was expected that the need for foreign assistance would decline as private capital
became available to developing countries, official foreign assistance has remained the most
important source of external financing for many developing countries. While international
flows of private capital to developing countries have increased significantly in recent years,
the bulk of these flows is concentrated in a few countries that have particular attractions from
investors’ point of view4. Therefore, the majority of developing countries, especially those
with low incomes, limited export earnings and without access to international private capital
markets, continue to receive concessional flows to supplement their domestic capital
accumulation and for sustaining their development efforts.
This chapter provides the background for the dissertation research by presenting a
discussion of issues related to defining and measuring of foreign aid as well as an overview of
its evolution and trends in aid considering aggregate volumes, sources and destinations. First,
I discuss issues related to defining and measuring of foreign aid. Then I briefly explore the
evolution of foreign aid since the 1950s. Third, I provide an overview of patterns of foreign
aid flows.
4 According to World Bank (2005), net private flows increased by $51 billion in 2004, reaching $300 billion, including equity ($192 billion) and debt ($109 billion) inflows. The largest component of these flows consists of FDI, which stood at $166 billion in 2004. However, the bulk of these flows are concentrated in few highly attractive developing countries. For example, almost 90 percent of the estimated increase in net FDI flows to developing countries in 2004 went to five countries – Brazil, China, India, Mexico, and the Russian Federation.

8
2.1. Defining and Measuring Foreign Aid
The literature contains a certain amount of ambiguity in the terminology of foreign
aid. Some authors include to foreign aid all financial flows from donor nations to developing
and transition countries, including official grants and loans, trade financing and military
assistance, while others include only grants and concessional loans. However, foreign
assistance given for different purposes will probably have different consequences on
development. Aid intended to promote economic reforms or build infrastructure is likely to
have a greater impact on development than military assistance, which aims to build security
forces in the recipient country. This by no means ignores indirect positive effect that military
aid might have on development5. For example, military assistance may enable a recipient
country to allocate a greater share of its resources to development programs than in the
absence of such aid. It is more likely, however, military aid simply enables a recipient country
to build stronger armed forces than would have been possible if it did not receive military
assistance and impacts to development will be minimal.
This dissertation uses a conventional definition of foreign aid, which is official
development assistance (ODA), widely accepted in the development community. This
concept was introduced in the early 1970s by the Development Assistance Committee
(DAC) of the Organization for Economic Cooperation and Development (OECD).
According to this definition, the ODA consists of official grants and highly concessional
loans from bilateral or multilateral donors to developing countries aiming to promote
economic development and welfare6. There are three criteria that ODA should satisfy: (i) aid
is given by the official sector of the donor country; (ii) with the objective of promoting
economic development and welfare in recipient countries; (iii) loans are given with grant
element, i.e., the implicit subsidy included in the loan, relative to loans’ face value, of at least
25 percent, as calculated as the ratio of the grant equivalent part of the loan to the face value
of a concessional loan and discount rate of 10 percent. The ODA also includes grants for
5 For analysis of interrelationship between military expenditures and economic growth, see Castillo et al “Military Expenditures and Economic Growth”, Santa Monica, RAND, 2001 6 OECD, “Is it ODA?” Note by the DAC Secretariat, Paris, 22 May 2001
9
technical cooperation, such as capacity development, providing policy advice and training,
however, it excludes military assistance, political development programs, trade credits, and
debt forgiveness for military loans. The OECD also formally makes a distinction between
ODA and official aid (OA). The OA consists of aid flows that meet conditions of eligibility
for inclusion in ODA, but the recipients are countries in transition, mainly from Eastern
Europe and Former Soviet Union. In this study foreign aid is defined as a sum of ODA and
OA flows from both multilateral and bilateral donors to developing countries and both flows
are simply called foreign aid or ODA.
The next question addressed is how to measure foreign aid flows: whether to look at
ODA commitments or disbursements. Commitments are defined by the OECD’s DAC as “a
firm obligation expressed in writing”, whereas disbursements “record the actual international
transfer of financial resources” (OCED 2005). Some of the existing studies analyze
disbursements while others look at commitments. In this study I use both measures of aid for
different analyses. Following Dudley and Montmarquette (1976), White and McGillivray
(1995) and others, I use commitments to analyze the determinants of aid allocation by
donors, as commitments are donors’ decision variables over which they exercise full control,
whereas disbursements might be affected by other factors over which donors’ have no
control. However, since disbursements record the actual aid flows received by recipient
countries, it is appropriate to use them to analyze the aid effectiveness. Another related
question is whether to look at gross or net ODA disbursements, commonly used measures of
aid flows from donors to recipient countries. This study uses both measures, where
appropriate, to evaluate the aid effectiveness. They both have advantages and disadvantages
in the analyses of the impact of foreign aid on development. If gross ODA captures all the
disbursements from donors to recipients, net ODA represents the same transfers less
amortizations, i.e., loan repayments. One might argue that excluding amortizations distorts
the real picture of the actual resource transfers in a given year. However, if the objective is to
understand and to evaluate the effectiveness of aid flows in promoting development

10
outcomes, then net disbursements are more appropriate. If the objective is to show the
overall picture, then gross disbursements are more suitable.
Aid flows to developing countries are in one of three major currencies – the US
dollar, the euro, and the Japanese yen. OECD converts transactions in other currencies into
US dollars to facilitate comparison. The exchange rates used in the conversion and relative
inflation between donors and recipients can have major influence on cross-country and over-
time comparisons. For example, the significant depreciation of the US dollar against most
major currencies in recent years has contributed to the increase in net financial flows over
that period. Moreover, these comparisons will be affected by the sizes of recipients’
economies and their economic growth rates. These problems are effectively addressed by
transforming aid disbursements to a percentage of recipients’ GDP.
There are some apparent shortcomings of the OECD approach to defining and
measuring foreign aid. Chang et al (1999) argues that ODA does not accurately measure the
true value of foreign aid flows, and “as a result the evolution of net ODA over time, as well
as across donors and recipients, likely provides a distorted picture of aid trends”. According
to Chang et al (1999), the sources of this distortion are: under estimation of aid content due
to netting out, over-representation of loans with high concessionality and under-
representation of loans with low concessionality, the inclusion of official technical assistance
(TA) grants with their full value, using constant discount and interest rates instead of actual
market rates and not accounting for credit risk. They suggest a new approach to
measurement of foreign aid that they call Effective Development Assistance. EDA comprises
exclusively grants and the grant shares of official loans, which are calculated on a basis of
actual interest rates. In a comprehensive empirical reassessment of foreign aid flows to 133
developing countries between 1975 and 1995, Chang et al (1999) claim that conventional
net ODA has overstated the real aid flows by 25 to 30 percent over the last few years. While
some of their points are legitimate, it is difficult to overcome these problems in practice.
Moreover, some of their points are problematic and lead to underestimation of the actual
value of aid flows. For example, the exclusion of official technical assistance grants from aid
11
flows goes against some of initial rationales7 for foreign aid and underestimates the actual
value of aid flows received.
Dalgaard and Hansen (2000) also claim that despite the valuable effort by Chang et
al (1998) discussions of consistency and spurious changes in aid flows are irrelevant. They
find that while ODA is somewhat higher than EDA, the difference between the two is a
simple transformation. This was confirmed by an almost perfect correlation coefficient
between nominal ODA and EDA. They find that the correlation coefficient between the two
was 0.98 using either Pearson’s standard or Spearman’s rank correlations. Even Chang and
his co-authors themselves noted that ODA and EDA data were very highly correlated with
each other in spite of differences in their calculation.
Raffer (1999) claims that donor countries have brought a variety of public
expenditures under the rubric of ODA over the past two decades, enabling them to
considerably weaken the traditional OECD definition. He shows that donor governments
have included the cost of development administration, education costs for students from
developing countries, emergency and disaster aid (which grew rapidly during last 10-15
years), and debt relief. However, OECD’s Credit Reporting System8 (CRS) provides the
sectoral breakdown of aid flows, so most of these expenditures mentioned by Raffer (1999)
can be easily excluded from ODA flows, as I do in this study.
2.2. Evolution of Foreign Aid
As the large and ever growing body of literature on foreign aid documents, two
important developments – political factors and the progress of development thinking – have
made crucial impact in the evolution of modern era foreign aid policy (Hjertholm and
White, 2000 and Kanbur, 2006). Each of these will be discussed in turn. If the evolution of
development thinking has been more complicated and non-linear in nature, the central
7 See next section. 8 The CRS was established in 1967, jointly by the OECD and the World Bank, to supply data on indebtedness and capital flows. Over the years the CRS was developed and its aid activity database has become internationally recognized source of data on geographic and sectoral breakdown of aid and widely used by interested parties, including researchers, in the field of development.

12
geopolitical factors behind international aid were the Cold War until 1990s, the collapse of
Soviet Union, and the events of September 11, 2001.
The origins of modern foreign aid was launched in the aftermath of the Second
World War. Table 2.1, modified and amended from Hjertholm and White (2000), provides
a helpful overview of the main developments in the history of modern foreign aid. Three
major events in the wake of the Second World War – the Marshall Plan, which represented
US bilateral assistance to Europe, the establishment of the United Nations and the Bretton
Woods conference that created the International Bank for Reconstruction and Development
(now usually called as the World Bank) and International Monetary Fund (IMF), which
represented the multilateral foreign assistance – played important roles in early stages of
modern era international or foreign aid. Certainly, the objective of these major developments
was reconstruction of war- ravaged Europe. The success of the Marshall Plan provided the
impetus for turning the focus to developing countries, beginning with the World Bank’s first
loan to Colombia in 1950 and the United States Act for International Development of 1950.
This act established USA’s foreign aid policy to support the efforts of the peoples of
developing countries to develop their resources and improve their welfare (Ohlin, 1966 and
Wolf, 1960). Further, the inaugural address9 of President Truman in 1949 enunciated a
stance on aid for economic development to poor countries by rich nations that foreshadowed
much of what followed in the next half century. Finally, the first wave of independence in
mid 1950s created a constituency for the aid industry and aid became as a tool of foreign
policy for western countries.
Formally, the need for foreign aid was justified as a moral responsibility of the rich
countries to the poor at the time and during the Cold War period donor ideology and focus
changed frequently from one objective to another (see table 2.1), such as supporting
productive sectors, reducing poverty and population growth, increasing access to health care
and basic education, macroeconomic reforms and opening markets, the main objective of
western foreign aid was to stop newly independent developing countries going in the other
9 Inaugural Addresses of the Presidents of the United States, Washington, D.C.: U.S. G.P.O., 1989; Bartleby.com, 2001. www.bartleby.com/124/
13
(communist) direction (Kanbur 2006). Some economists saw important analytical
disconnect between this objective and the means of foreign aid and claimed that while the
objectives of foreign economic aid are worthy, the means are inappropriate to the objectives.
For example, authors like Bauer (1971) and Friedman (1958) argued that foreign aid would
create dependence and displace processes of institutional maturation that were essential to
economic development. The long-run result of high aid levels would be relative economic
regress. Similarly, Frank (1966) claimed that foreign assistance represented a side payment to
elites in recipient countries, designed to buy their compliance in maintaining the economic
and political dominance of the industrialized countries.
There are also periods, when foreign assistance lost some of its political overtones.
For example, in the 1970s, foreign aid focused on poverty and “basic human needs”, such as
health and education. This was consistent with global development trends, particularly shifts
in the priorities of bilateral and multilateral donors. For example, the United States
established the International Development and Food Assistance Act10, which instructed that
75 percent of food aid should go to countries with a per capita income less than $300. This
period also marks an important shift in U.S. foreign aid delivery. USAID shifted the
structure of its aid from large transfers of money to foreign governments and financing of
infrastructure to sharing technical expertise, providing commodities and developing
community-based distribution systems that bring family planning information door to door.
For example, USAID’s Office of Population began reproductive health training and
international surveys, such as Demographic and Health Surveys, in 1972.11
Later, the advent of balance-of-payment problems and the emergence of the external
debt crisis in the early 1980s shifted the focus of international aid to macroeconomic reforms
and market liberalization. Both multilateral and bilateral donors focused on broad-based
economic growth, trade, financial systems, and the promotion of market-based principles to
restructure macroeconomic policies in developing countries. The greater focus on
10 Hjertholm, Peter and Howard White, “Foreign Aid in Historical Perspective: Background and Trends”, in Tarp, Finn (ed) “Foreign Aid and Development: Lessons Learnt and Directions for the Future”, 2000. 11 http://www.usaid.gov/our_work/global_health/pop/timelineb.html
14
macroeconomic policy gave the IMF and the World Bank (hence the so-called “Washington
Consensus”) a preeminence they had not enjoyed before. Another important event in this
period was the rise of non-governmental organizations (NGO) as agents in foreign aid
delivery. At this time, bilateral donors agencies, such as USAID and DFID became further
removed from the implementation of foreign assistance projects and began to channel their
resources through NGOs. This trend became consistent and the number of NGOs involved
in aid delivery has been increasing ever since. For example, USAID currently works with
more than 3,500 companies and 300 private voluntary organizations.
The end of the Cold War in the 1990s also caused three important changes in the
foreign aid industry. First, the countries of Eastern Europe and the former Soviet Union re-
emerged as aid recipients. Second, poverty reappeared on the agenda of donor agencies, in
part due to rising criticism of the macroeconomic and structural adjustment policies of the
1980s and early 1990s and the deterioration of socio-economic conditions in transition
countries of Eastern Europe and the former Soviet Union (Milanovic 1998). The critics of
the policies of the 1980s found their most effective voice in reports funded by UNICEF such
as “The State of the World’s Children” (Grant 1990) and “Adjustment with a Human Face”
(Cornia et al, 1987). The turning point for poverty reappearing on the agenda of donor
agencies was the 1990 World Development Report (World Bank 1990), which designed the
“New Poverty Agenda”. Third, although still inconsistently applied, donors started to show
serious concerns about governance in recipient countries. In this new environment, some of
previously important recipients countries became no longer so, and donors began awarding
or withdrawing aid on the basis of perceived quality of governance. This was quite different
from the Cold War period, when donors happily supported any “friendly regime” without
giving much consideration to the quality of governance.
It is too early to get a clear view of the evolution of foreign aid in the 2000s but there
are some clear differences before and after 2000. First, the new millennium started with the
Millennium Assembly, which took place at the United Nations in September 2000. This
largest gathering of world leaders in mankind history adopted the Millennium Development
15
Goals (MDGs, see appendix 1), which includes eight goals and eighteen targets. These are
bold commitments to achieve sustainable development for the world’s poorest people. These
goals include: eradication of extreme poverty, achieving universal primary education,
promoting gender equality and empowering women, reducing child mortality, improving
maternal health, combating HIV/AIDS, malaria and other communicable diseases, ensuring
environmental sustainability, and developing a global partnership for development.
A second important change was triggered by the events of September 11, 2001.
These events have not only significantly changed the world geopolitics but they have also
significantly influenced aid architecture. In the post September 11 world, the perspectives of
donor nations on foreign aid has changed significantly. This perspective effectively realizes
and includes developing nations’ importance for global security as several developing
countries in Asia and Africa have served as a staging point for worldwide terrorist attacks.
The developed countries, especially the United States, have realized the need for a close
cooperation with governments of developing countries to assure global security. They also
comprehend that persistent poverty makes developing countries vulnerable to security and
other threats. As a result of these realizations, the rhetoric of foreign aid has increasingly
shifted towards the challenges of development. For example, the current view links two
groups of rationales for foreign aid - donors’ self-interest (strategic, political, and economic)
and recipient-needs (poverty reduction, improving primary school enrollment, reducing
maternal and infant mortality) - to a form of enlightened donors’ self-interest that recognizes
that a world with less poverty and diseases, and educated people is likely to provide a more
secure and stable environment with greater opportunities for all of the world’s population.
A third important event followed in March 2002, in Monterrey, Mexico at the
International Conference on Financing for Development, which addressed the challenges of
providing the financial means for economic progress. This conference highlighted both the
role of private investment and official development assistance by acknowledging the fact that
the poorest countries cannot really be expected to attract large inflows of private capital

16
because they lack the basic conditions (infrastructure and human capital) for private
investment. The major donor nations, including the United States, agreed to “urge all
Table 2.1. Schematic overview of main developments in the history of foreign aid
Decade Dominant or rising
institutions
Donor
ideology
Donor focus Types of aid
1940s Marshal Plan and UN
system (including World
Bank)
Planning Reconstruction Marshall Plan
was largely
programme aid
1950s USA, with Soviet Union
gaining importance
from mid 1950s
Anti-
communist, but
with role for the
state
Community
Development
Movement
Food aid and
projects
1960s Establishment of
bilateral programmes
and regional
development banks
(including ADB, AfDB
and IDB)
As for the
1950s, with
support for state
in productive
sectors
Productive sectors
(e.g. support to the
green revolution)
and infrastructure
Bilateral donors
gave TA and
budget support;
multilateral
donors gave
project aid
1970s Expansion of
multilateral donors
(especially World Bank,
IMF and Arab-funded
agencies)
Continued
support for state
activities in
productive
sectors and
meeting basic
needs
Poverty, taken as
agriculture and basic
needs (such as
health and
education)
Fall in food aid
and start of
import support
1980s “Washington
Consensus” and rise of
NGOs from mid-1980s
Market-based
adjustment
(rolling back the
state)
Macroeconomic
reform and
liberalization
Financial and
structural
adjustment aid
and debt relief
1990s Eastern Europe and FSU
become recipients rather
than donors; emergence
of corresponding
institutions (EBRD)
Move back to
the state toward
end of the
decade
Support to political
and economic
transition, poverty
and governance
Move toward
sector support at
the end of the
decade
2000s Bilateral aid agencies
expanded aid flows
(especially USA,
establishment of MCC)
and surge in private aid
(remittances)
Move toward
performance
based aid
allocation
MDGs, global
health (HIV/AIDs),
security and
governance
Continued sector
support with
special focus on
social sector
Note: Entries are main features or main changes; there are of course exceptions
Source: Reproduced from Hjertholm and White (2000), p.81, Table 3.1., with revisions and additions.

17
developed countries that have not done so to make concrete efforts towards the goal of
0.7 percent of gross domestic product as official development assistance.”
There are four apparent stages in the progress of development thinking and their
crucial impact in the evolution of foreign aid. First, in the early years of the independence,
economic growth became the main policy objective for the newly sovereign countries. In this
period development strategies and the role of foreign aid were greatly influenced by
development theories developed by Rosenstein-Rodan (1943), Rostow (1956), Lewis (1954)
and others, such as “big push”, “take-off”, “stages of growth” and “economic dualism”. The
central argument in these theories was that the main constraint to economic development in
poor nations is the lack of capital and domestic savings and this constraint can be removed
by providing external assistance. As Ruttan (1996) stated, most developing countries lacked
capital (both physical and human) to attract private investment so that there was no
alternative to foreign aid as a source of capital. Another important feature of early
development theories and models was that they seem to indicate that as countries develop
they progress through certain stages of development, and this will influence the composition
of their external financing. They assumed that: the first stage, for developing countries at
very low income levels, is concessional financing from official donors; in the next stage, non-
concessional flows from official donors becomes important source of external financing for
countries at slightly more advanced levels of development; and eventually, as countries
develop they gain access to international capital markets and pure market-based solutions
arise.
Chenery and Strout (1966), McKinnon (1961) and others further developed these
theories and models. They assumed that growth in low-income developing countries moves
through three consecutive phases of development – skill limited, savings limited and trade
limited – and two binding constraints may limit the economic growth. If skills and savings
gap were the binding ones then the investment-limited growth would follow and,
alternatively, when the balance-of-payments constraint was the binding one then foreign
exchange-limited growth would follow. The model considers that the role of foreign aid is to
18
remove either a savings or a balance-of-payments gap by an increased inflow of foreign
savings or providing the necessary foreign exchange. While the savings gap emerges when the
need for investment exceeds domestic savings the foreign exchange gap (trade gap) emerges
when foreign exchange inflows from exports are insufficient to keep pace with the growing
demand for imports of capital goods. Thus, foreign assistance is needed to make it possible
for developing countries to fill the savings gap and invest more than what their domestic
savings could allow. It also justifies the need for technical assistance since lack of skills
restricts the capacity to invest. This model assumes that foreign assistance would also help to
fill the foreign exchange gap by supplementing the countries’ foreign exchange resources,
which are generally severely limited.
Eventually, this model became popular as a “dual-gap” model and served until
recently as the basis for the World Bank-led donor projections. Policymakers and analysts in
donor agencies and recipient countries relied on this model to determine foreign financing
requirements that were directly linked to targeted economic growth rates. The basic
approach of this model includes projections of required domestic investment, derived by
multiplying the incremental capital-output ratio (ICOR) by a targeted growth rate, and of
potential domestic savings, on the one hand and on the other hand, projections of likely
export earnings and foreign exchange necessity for imports.
Second, where in the 1950s and 1960s the dominant development objective was
simply economic growth, in the 1970s, as result of contributions to development thinking,
the development objectives appeared to be multidimensional, simultaneously including
poverty alleviation, employment and income distribution in addition to the economic
growth. The major contributions to development theory, in this period, include an
explanation of dynamics of the transformation process of traditional agriculture and the role
of informal sector in employment generation (ILO 1973), and the interdependence between
economic and demographic developments (Little and Mirrlees 1974) and the determinants
of the rural-urban migration (Harris-Todaro 1970). These advances in development
thinking also led to a reconsideration of the role of foreign aid in promoting development.
19
Foreign assistance was no longer considered exclusively as an instrument to promote the
economic growth by removing either the savings or the foreign exchange gap and a greater
focus was placed on poverty alleviation, employment generation and income distribution.
Major donor agencies, including the World Bank and USAID, started to focus on financing
projects in agriculture and rural development, education and health and providing direct
assistance to benefit the poor and technical assistance (Brown 1990). As a result, the
percentage of poverty-focused concessional financing increased from 5 percent of the total in
late 1960s to 30 percent in early 1980s (Thorbecke 2000).
Third, in the 1980s and the 1990s, the developing world witnessed a combination of
three important events: (i) the debt crisis and increasing current account and budget deficits
in most of the developing world (ii) collapse of income and employment in transition
countries of Eastern Europe and the Former Soviet Union, and (iii) the Asian financial crisis.
These events started with the Mexican financial crisis of 1982, which quickly extended to
most of the developing world. The magnitude of the debt crisis was such that suddenly, the
achievement of macroeconomic equilibrium (both internal and external) became an
important policy objective and necessary condition to the restoration of the economic
growth and poverty alleviation.
Moreover, an important advance in economic theory that occurred in the late 1970s
and early 1980s, a so-called “neo-liberal counter-revolution” praised the virtues of free
markets and private enterprise and the shortcomings of state intervention. The diagnostic
was clear in the new paradigm: government intervention in the economy was the primary
cause of macroeconomic disequilibrium and the best way to control the level of economic
activity was through restrictive macroeconomic policy. Inflation was considered essentially a
monetary phenomenon, and could be brought under control through a restrictive
macroeconomic (monetary) policy. The new political economy emphasized, on the one
hand, that market failures were less damaging than state failures; and, on the other, that any
interference by the “predatory State” with the “magic of the marketplace” was bound to
make matters worse. In addition, in the area of international trade analysis, this period was
20
marked by the rejection of past import-substitution strategies and the state interventionism
associated with it. The research and literature on the cost of rent seeking, which became one
of the new leading topics of research, evolved the key idea that an export-oriented
development policy could have favorable effects on growth performance and welfare.
These ideas resulted in a decisive turning point in development policies advocated by
major donor agencies and pursued hitherto by most developing countries. The implications
of the “new” thinking for development were that state withdrawal from the economic sphere
and the promotion of market mechanisms as the main engine of growth and development.
The solution to the crisis was to allow the market to determine how economic resources can
more productively be allocated, and to rely on market forces as the principal determinant of
economic decision. Additionally, a large number of empirical studies using cross-sectional
and panel data analyses of economic growth over time found a robust positive relationship
between trade and growth (Frankel and Romer, 1996 and 1999). These studies found that
countries that liberalized and encouraged trade grew faster than those that followed a more
protectionist policies.
In the context of the afore-mentioned contributions to development thinking and
events, the central objective of international development policy became promotion of a
market-oriented economic system, the control of inflation through restrictive monetary
policy, the attainment of budget deficit, trade and financial liberalization. These policies
were not only advocated by major donor agencies. The Bretton Woods institutions (the IMF
and the World Bank) actively promoted them through conditionality mechanism resulting
in a serious erosion of the power of developing countries in shaping their domestic economic
policies. Thus, the main functions devoted to foreign aid became to support developing
countries to service their external debt, encourage implementation of appropriate
macroeconomic and structural adjustment policies through conditionality attached to
program lending.
Fourth, some important conceptual developments in economic theory that surfaced
in the late 1980s and the early 1990s challenged the contemporaneous development policies

21
and further extended the evolution of development policy and foreign aid. First, arguably,
the most important contribution was made during this period is the explanation of the role
of institutions in economic development and endogeneity of policies (North 1990,
Williamson 1991, World Bank 1993, etc.). These advances highlighted the importance of
the strategic behaviors of governments, businesses and individuals in the context of
incomplete markets, imperfect and asymmetric information. As Thorbecke (2000) noted,
these important contributions “in addition to reminding the development community that
appropriate institutions and rules of the game are essential to provide pro-development and
anti-corruption incentives, also suggested broad guidelines in building institutions that
reduced the scope for opportunistic behavior”. Thus, “an inherently related issue is to
identify the set of institutions most conducive to the acceleration of the process of economic
growth and socio-economic development.” World Bank (1993) argued that the mix of
institutions and public policy adopted by the East Asian countries provides a general model,
transferable to other developing countries.
Further, in this stage development doctrine also benefited greatly from contributions
to the economic theory that explained the role of human capital in promoting development
and technology transfer. The endogenous growth theory (Lucas 1988 and Romer 1990)
identifies human capital endowment as the primary factor in achieving the potential scale
economies that might come about through industrialization. This new approach magnifies
raw labor and capital in a production function by a term representing human capital and
knowledge that leads to increasing returns and converts technical progress to an
endogenously determined factor of growth. Similarly, incorporating human capital into the
neoclassical growth (Solow) model, Mankiw et al (1992) provides excellent explanation of
international differences in income per capita. They find that differences in human capital
(education) together with savings and population growth explain most of the international
variations in income per capita. Certainly, there are very important methodological and
practical differences between the findings of the endogenous growth theory and the human
capital augmented neoclassical growth model but both of them highlight the importance of

22
human capital for growth12. If indeed human capital is important in explaining international
variations in per-capita income and the market is likely to under-produce human capital, due
to the fact that marginal social productivity of investment in human capital being greater
than that of the marginal private productivity, these provide a powerful rationale for the role
of the state and foreign aid in human capital development.
The current state of the aid dialogue reflects its evolution over the last five decades,
the combination of political events in the early years of new millennium and the current state
of the development thinking. As Kanbur (2006) noted, currently, the role of government
and the importance of its accountability in promoting development are more clearly
recognized. Donors understand that overall macroeconomic policy is important, but the role
of institutions in determining policy outcomes is thought to be essential. Therefore donors’
focus started to move toward performance-based aid allocation. When donors stress
accountability in aid allocation, they hope that rewarding some recipients for good
performance will create better incentives for other countries (Klitgaard et al 2005). The
prime example of performance based aid allocation is the Millennium Challenge Account
(MCA). In March 2002, at the Inter-American Development Bank (IADB) meeting,
President Bush called for “a new compact for global development, defined by new
accountability for both rich and poor nations alike. Greater contributions from developed
nations must be linked to greater responsibility from developing nations.”13 In February
2003, President Bush sent Congress a bill that aimed to increase foreign aid by 50 percent
by fiscal year 2006 by creating the Millennium Challenge Account for a select group of
poor countries. Because good governance and sound policies are important condition of
development, U.S. government announced that the MCA will be “devoted to projects in
nations that govern justly, invest in people and encourage economic freedom.”14
12 For example, Mankiw et al (1992) in contrast to Romer (1990) suggests that capital approximately receives its social return. 13 Remarks by the President on Global Development at the Inter-American Development Bank, March 14, 2002, Washington, DC: Office of the Press Secretary (available at http://usinfo.org/wf-archive/2002/020314/epf409.htm). 14 Ibid.
23
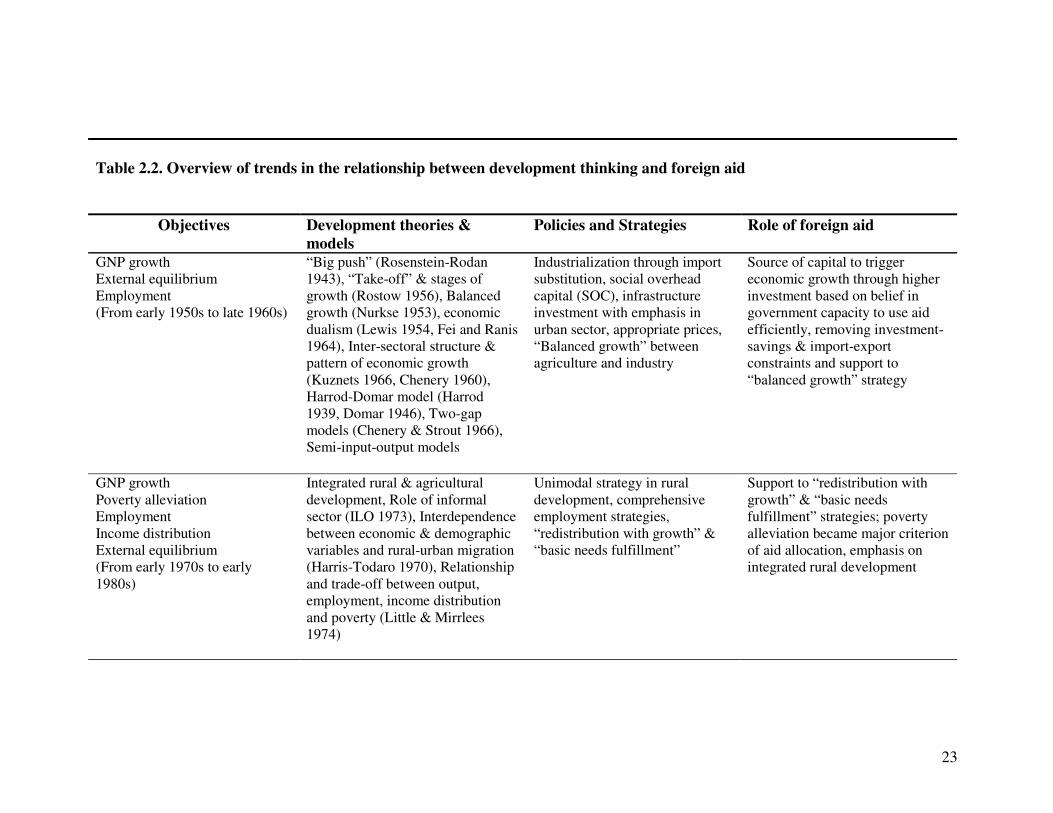
Table 2.2. Overview of trends in the relationship between development thinking and foreign aid
Objectives Development theories & models
Policies and Strategies Role of foreign aid
GNP growth External equilibrium Employment (From early 1950s to late 1960s)
“Big push” (Rosenstein-Rodan 1943), “Take-off” & stages of growth (Rostow 1956), Balanced growth (Nurkse 1953), economic dualism (Lewis 1954, Fei and Ranis 1964), Inter-sectoral structure & pattern of economic growth (Kuznets 1966, Chenery 1960), Harrod-Domar model (Harrod 1939, Domar 1946), Two-gap models (Chenery & Strout 1966), Semi-input-output models
Industrialization through import substitution, social overhead capital (SOC), infrastructure investment with emphasis in urban sector, appropriate prices, “Balanced growth” between agriculture and industry
Source of capital to trigger economic growth through higher investment based on belief in government capacity to use aid efficiently, removing investment-savings & import-export constraints and support to “balanced growth” strategy
GNP growth Poverty alleviation Employment Income distribution External equilibrium (From early 1970s to early 1980s)
Integrated rural & agricultural development, Role of informal sector (ILO 1973), Interdependence between economic & demographic variables and rural-urban migration (Harris-Todaro 1970), Relationship and trade-off between output, employment, income distribution and poverty (Little & Mirrlees 1974)
Unimodal strategy in rural development, comprehensive employment strategies, “redistribution with growth” & “basic needs fulfillment”
Support to “redistribution with growth” & “basic needs fulfillment” strategies; poverty alleviation became major criterion of aid allocation, emphasis on integrated rural development
24
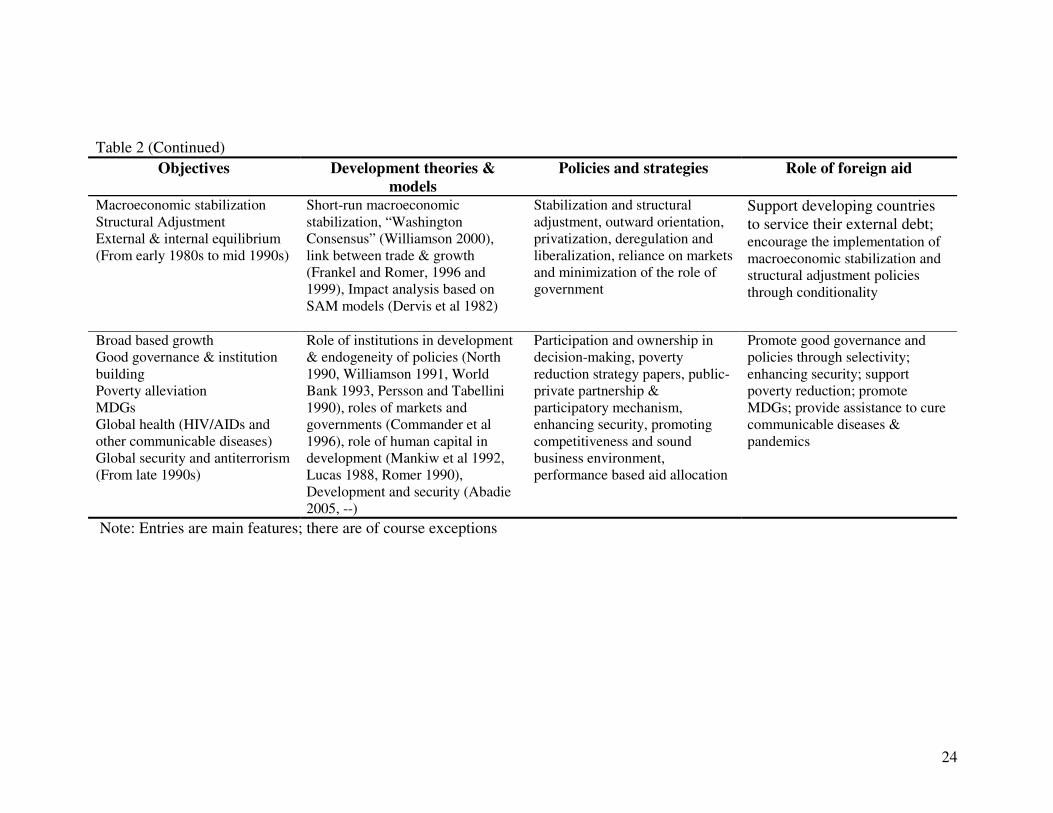
Table 2 (Continued) Objectives Development theories &
models Policies and strategies Role of foreign aid
Macroeconomic stabilization Structural Adjustment External & internal equilibrium (From early 1980s to mid 1990s)
Short-run macroeconomic stabilization, “Washington Consensus” (Williamson 2000), link between trade & growth (Frankel and Romer, 1996 and 1999), Impact analysis based on SAM models (Dervis et al 1982)
Stabilization and structural adjustment, outward orientation, privatization, deregulation and liberalization, reliance on markets and minimization of the role of government
Support developing countries to service their external debt; encourage the implementation of macroeconomic stabilization and structural adjustment policies through conditionality
Broad based growth Good governance & institution building Poverty alleviation MDGs Global health (HIV/AIDs and other communicable diseases) Global security and antiterrorism (From late 1990s)
Role of institutions in development & endogeneity of policies (North 1990, Williamson 1991, World Bank 1993, Persson and Tabellini 1990), roles of markets and governments (Commander et al 1996), role of human capital in development (Mankiw et al 1992, Lucas 1988, Romer 1990), Development and security (Abadie 2005, --)
Participation and ownership in decision-making, poverty reduction strategy papers, public-private partnership & participatory mechanism, enhancing security, promoting competitiveness and sound business environment, performance based aid allocation
Promote good governance and policies through selectivity; enhancing security; support poverty reduction; promote MDGs; provide assistance to cure communicable diseases & pandemics
Note: Entries are main features; there are of course exceptions

25
2.3. Patterns of Foreign Aid Flows: Some Stylized Facts
This section reviews trends in aid, focusing on aggregate volumes, sources and
destinations. Aggregate trends in net ODA to developing countries are presented in Figure
2.1. From only $25.6 billion in 1960, in constant 2003 prices and exchange rates, total net
ODA flows from all donors reached $73 billion in 2004. While there is a clear upward trend
in total aid flows, per capita aid flows were unstable during the 1960-2004 period. Average
per capita aid flows peaked in 1980 when its value, in constant 2003 prices, reached 19.41
dollars. Since early 1980s to late 1990s general trend in per capita aid flows were descending,
with some exceptions. Average per capita aid flows rounded at 11 dollars in 1997. Another
relative measure of foreign aid, the average ratio of net aid inflows to recipients’ gross
national income (GNI), shows a generally downward trend during the entire period (see
figure 2.2). This ratio declined from 2.4 percent in early 1960s to 1.2 percent in 2004, with
lowest value of 0.9 percent in 1997.
Figure 2.1. Net Official Development Assiatance to Developing Countriesfrom All Donors, 1960-2004 (In constant 2003 U.S. Dollars)
0
10
20
30
40
50
60
70
80
1960
1962
1964
1966
1968
1970
1972
1974
1976
1978
1980
1982
1984
1986
1988
1990
1992
1994
1996
1998
2000
2002
2004
Years
Bill
ion
U.S
. Do
llars
10
13
15
18
20
U.S
. Do
llars
Total Per Capita
Source: OECD DAC

26
Despite the overall upward trend, total net ODA flows have experienced downward
trends or were flat during some periods. For example, during the 1980s net ODA flows
similarly to other capital flows to developing countries remained stagnant as a result of
widespread debt crisis in developing countries. The declining trend was more pronounced
during 1991-1997 with an absolute decline in net ODA flows from $71.3 billion in 1991 to
$52.8 billion in 1997 (in constant 2003 prices and exchange rates) and the decline in the net
ODA disbursements expressed as ratio of donor GNP from 0.33 percent in early 1990s to
0.22 percent in 1997. This turnaround in aid flows followed the end of the Cold War. The
end of Cold War changed the geopolitical picture of the world and most donors experienced
a decline in their aid budgets. This can partly be explained by an increasing pressure on the
national budgets of donors: donors (Sweden, Italy, Finland, etc.) that have been running
large fiscal deficits decreased their aid budgets significantly while donors (Norway, Japan and
Ireland) with smaller budget deficits increased their aid budget in real terms (OECD 1997).
Figure 2.2. Net Oifficial Development Assistance To Developing Countries from All Donors, 1960-2004, % of Recipients' GNI (Average)
0
0.5
1
1.5
2
2.5
3
1960
1962
1964
1966
1968
1970
1972
1974
1976
1978
1980
1982
1984
1986
1988
1990
1992
1994
1996
1998
2000
2002
2004
Year
Per
cen
t
Source: OECD DAC

27
While sometimes a decline in foreign aid flows has been compensated by an
expansion in private financial flows to developing countries, there were times when both aid
flows and private capital flows expanded or declined simultaneously. For example, official aid
flows expanded rapidly in the 1970s but there was also a rapid expansion of private financial
flows, primarily in the form of bank credits. However, during 1980s both official aid and
private capital flows to developing countries remained virtually stagnant. As mentioned
earlier, from 1991 to 1997 there was a sharp decline in official aid inflows but it was
compensated with a strong expansion in private capital inflows to developing countries,
including both equity and non-equity flows (Akyuz and Cornford 1999). On average, during
this period aggregate net private capital inflows to developing countries accounted for almost
4 percent of their GNI.
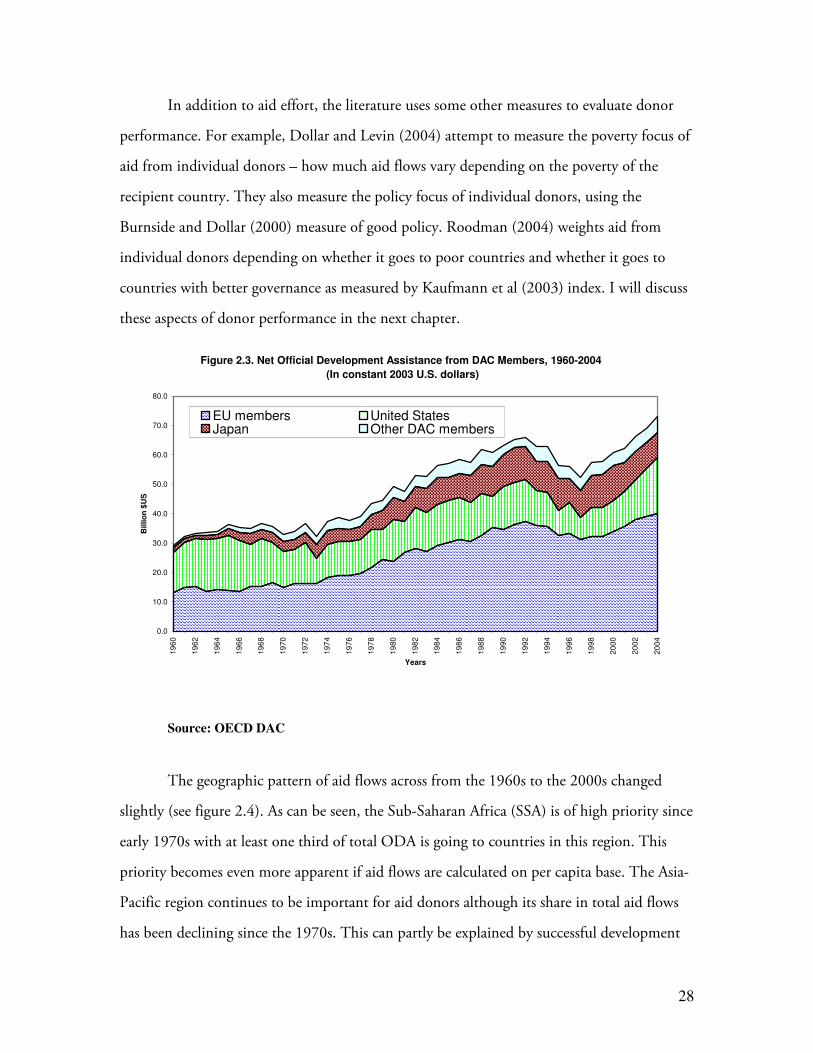
In the supply side, overall, the United States remains the world’s largest aid donor in
terms of volume ($15.8 billion in 2004), followed by Japan ($8.9 billion), France ($7.3
billion), Germany ($6.7 billion), the United Kingdom ($6.2 billion), and the Netherlands
(4.1 billion). However, net ODA flows from the United States are declining over time
relative to the total aid flows from DAC members while combined aid flows from EU
member countries has been steadily increasing (see Figure 2.3). Also, from early 1990s to
early 2000s, Japan had been the largest donor of aid to developing countries, in volume
terms. That was until 2001, when the United States reclaimed that position, as Japan’s aid
dropped by nearly $4 billion, partly due to sharp depreciation of Japanese yen. Although
aggregate trends in net ODA flows to developing countries present an upward trend, these
flows are smaller than they used to be, relative to gross national incomes of the donor
countries. Since the 1970s net ODA flows have shrunk by more than a quarter relative to the
GNI of donor nations15 (Klein and Harford 2005). Historically, average (weighted) aid effort
of DAC members has been around 0.2 to 0.4%. This measure was equal to 0.26% in 2004
with highest value of 0.87% for Norway and lowest values of 0.15 and 0.17% for Italy and
the USA, respectively.
15 This is a measure that the development community calls aid effort.
28
In addition to aid effort, the literature uses some other measures to evaluate donor
performance. For example, Dollar and Levin (2004) attempt to measure the poverty focus of
aid from individual donors – how much aid flows vary depending on the poverty of the
recipient country. They also measure the policy focus of individual donors, using the
Burnside and Dollar (2000) measure of good policy. Roodman (2004) weights aid from
individual donors depending on whether it goes to poor countries and whether it goes to
countries with better governance as measured by Kaufmann et al (2003) index. I will discuss
these aspects of donor performance in the next chapter.
Figure 2.3. Net Official Development Assistance from DAC Members, 1960-2004 (In constant 2003 U.S. dollars)
0.0
10.0
20.0
30.0
40.0
50.0
60.0
70.0
80.0
1960
1962
1964
1966
1968
1970
1972
1974
1976
1978
1980
1982
1984
1986
1988
1990
1992
1994
1996
1998
2000
2002
2004
Years
Bill
ion
$U
S
EU members United StatesJapan Other DAC members
Source: OECD DAC
The geographic pattern of aid flows across from the 1960s to the 2000s changed
slightly (see figure 2.4). As can be seen, the Sub-Saharan Africa (SSA) is of high priority since
early 1970s with at least one third of total ODA is going to countries in this region. This
priority becomes even more apparent if aid flows are calculated on per capita base. The Asia-
Pacific region continues to be important for aid donors although its share in total aid flows
has been declining since the 1970s. This can partly be explained by successful development
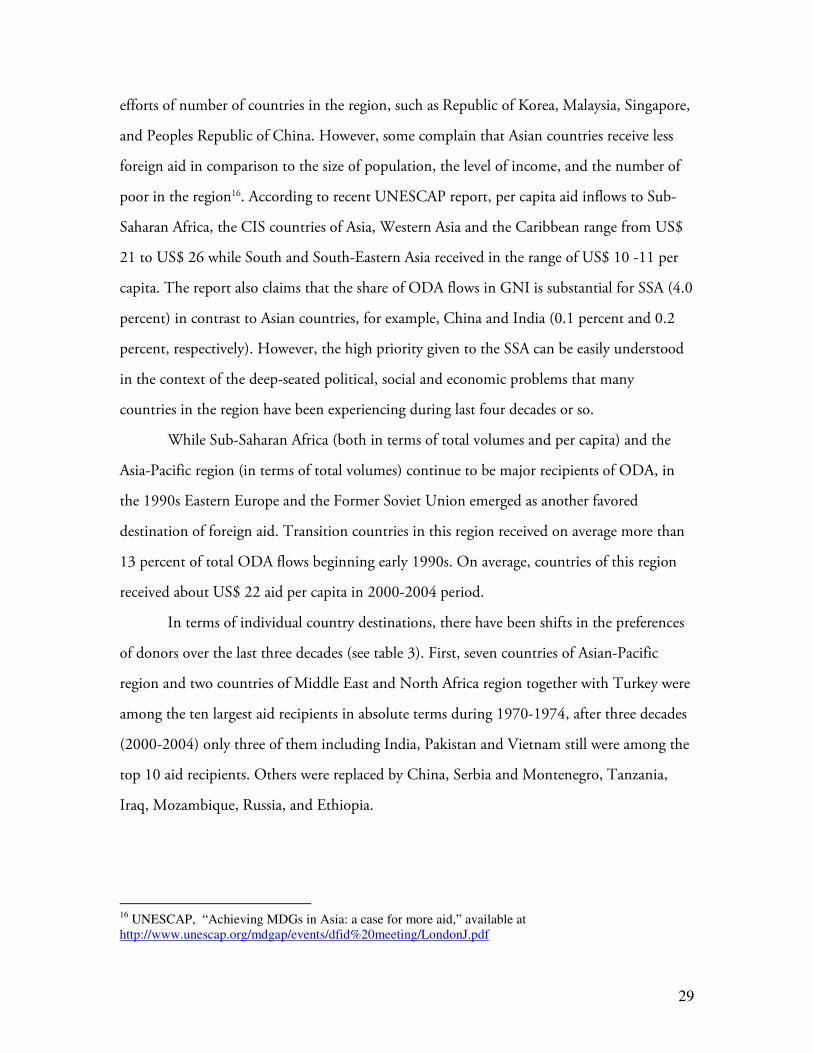
29
efforts of number of countries in the region, such as Republic of Korea, Malaysia, Singapore,
and Peoples Republic of China. However, some complain that Asian countries receive less
foreign aid in comparison to the size of population, the level of income, and the number of
poor in the region16. According to recent UNESCAP report, per capita aid inflows to Sub-
Saharan Africa, the CIS countries of Asia, Western Asia and the Caribbean range from US$
21 to US$ 26 while South and South-Eastern Asia received in the range of US$ 10 -11 per
capita. The report also claims that the share of ODA flows in GNI is substantial for SSA (4.0
percent) in contrast to Asian countries, for example, China and India (0.1 percent and 0.2
percent, respectively). However, the high priority given to the SSA can be easily understood
in the context of the deep-seated political, social and economic problems that many
countries in the region have been experiencing during last four decades or so.
While Sub-Saharan Africa (both in terms of total volumes and per capita) and the
Asia-Pacific region (in terms of total volumes) continue to be major recipients of ODA, in
the 1990s Eastern Europe and the Former Soviet Union emerged as another favored
destination of foreign aid. Transition countries in this region received on average more than
13 percent of total ODA flows beginning early 1990s. On average, countries of this region
received about US$ 22 aid per capita in 2000-2004 period.
In terms of individual country destinations, there have been shifts in the preferences
of donors over the last three decades (see table 3). First, seven countries of Asian-Pacific
region and two countries of Middle East and North Africa region together with Turkey were
among the ten largest aid recipients in absolute terms during 1970-1974, after three decades
(2000-2004) only three of them including India, Pakistan and Vietnam still were among the
top 10 aid recipients. Others were replaced by China, Serbia and Montenegro, Tanzania,
Iraq, Mozambique, Russia, and Ethiopia.
16 UNESCAP, “Achieving MDGs in Asia: a case for more aid,” available at http://www.unescap.org/mdgap/events/dfid%20meeting/LondonJ.pdf
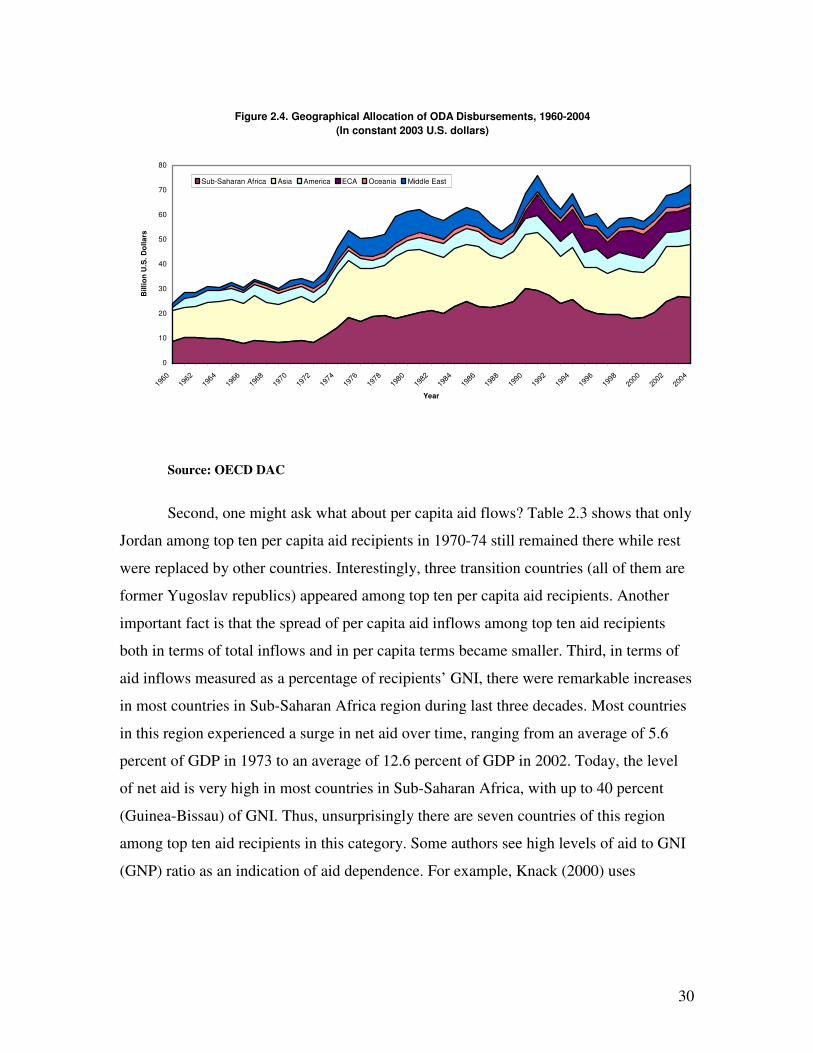
30
Figure 2.4. Geographical Allocation of ODA Disbursements, 1960-2004(In constant 2003 U.S. dollars)
0
10
20
30
40
50
60
70
80
1960
1962
1964
1966
1968
1970
1972
1974
1976
1978
1980
1982
1984
1986
1988
1990
1992
1994
1996
1998
2000
2002
2004
Year
Bill
ion
U.S
. Do
llars
Sub-Saharan Africa Asia America ECA Oceania Middle East
Source: OECD DAC
Second, one might ask what about per capita aid flows? Table 2.3 shows that only
Jordan among top ten per capita aid recipients in 1970-74 still remained there while rest
were replaced by other countries. Interestingly, three transition countries (all of them are
former Yugoslav republics) appeared among top ten per capita aid recipients. Another
important fact is that the spread of per capita aid inflows among top ten aid recipients
both in terms of total inflows and in per capita terms became smaller. Third, in terms of
aid inflows measured as a percentage of recipients’ GNI, there were remarkable increases
in most countries in Sub-Saharan Africa region during last three decades. Most countries
in this region experienced a surge in net aid over time, ranging from an average of 5.6
percent of GDP in 1973 to an average of 12.6 percent of GDP in 2002. Today, the level
of net aid is very high in most countries in Sub-Saharan Africa, with up to 40 percent
(Guinea-Bissau) of GNI. Thus, unsurprisingly there are seven countries of this region
among top ten aid recipients in this category. Some authors see high levels of aid to GNI
(GNP) ratio as an indication of aid dependence. For example, Knack (2000) uses
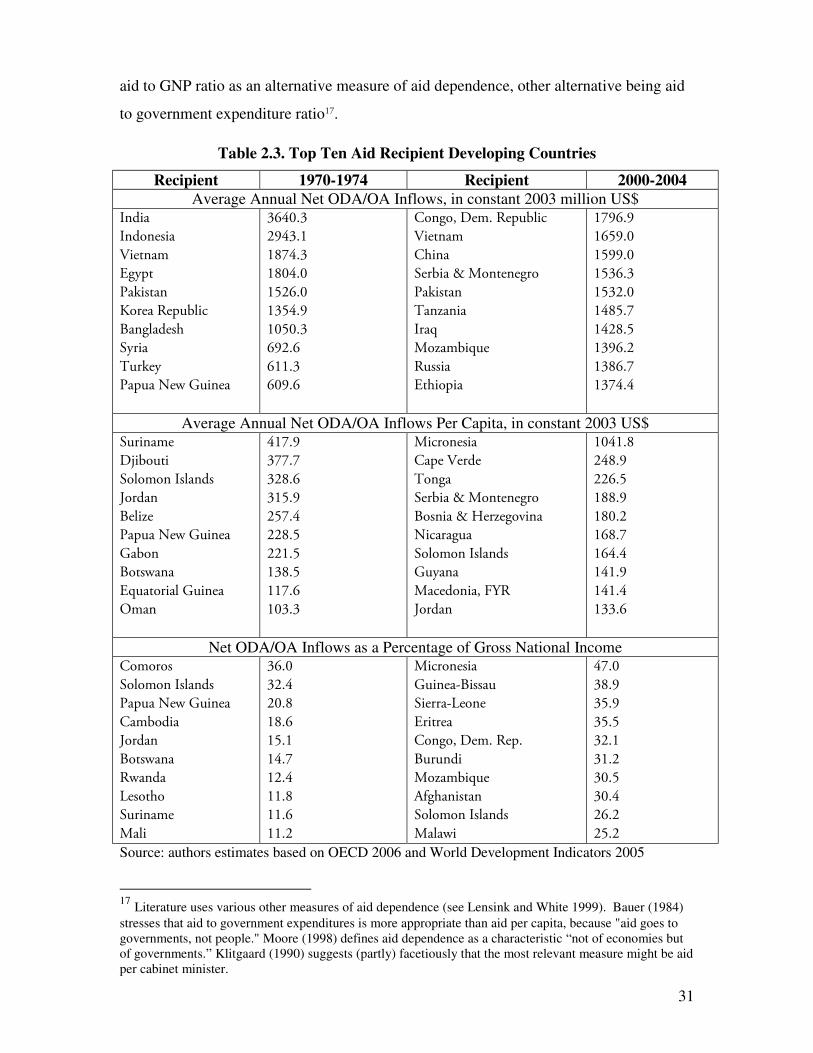
31
aid to GNP ratio as an alternative measure of aid dependence, other alternative being aid
to government expenditure ratio17.
Table 2.3. Top Ten Aid Recipient Developing Countries
Recipient 1970-1974 Recipient 2000-2004 Average Annual Net ODA/OA Inflows, in constant 2003 million US$
India
Indonesia
Vietnam
Egypt
Pakistan
Korea Republic
Bangladesh
Syria
Turkey
Papua New Guinea
3640.3
2943.1
1874.3
1804.0
1526.0
1354.9
1050.3
692.6
611.3
609.6
Congo, Dem. Republic
Vietnam
China
Serbia & Montenegro
Pakistan
Tanzania
Iraq
Mozambique
Russia
Ethiopia
1796.9
1659.0
1599.0
1536.3
1532.0
1485.7
1428.5
1396.2
1386.7
1374.4
Average Annual Net ODA/OA Inflows Per Capita, in constant 2003 US$ Suriname
Djibouti
Solomon Islands
Jordan
Belize
Papua New Guinea
Gabon
Botswana
Equatorial Guinea
Oman
417.9
377.7
328.6
315.9
257.4
228.5
221.5
138.5
117.6
103.3
Micronesia
Cape Verde
Tonga
Serbia & Montenegro
Bosnia & Herzegovina
Nicaragua
Solomon Islands
Guyana
Macedonia, FYR
Jordan
1041.8
248.9
226.5
188.9
180.2
168.7
164.4
141.9
141.4
133.6
Net ODA/OA Inflows as a Percentage of Gross National Income Comoros
Solomon Islands
Papua New Guinea
Cambodia
Jordan
Botswana
Rwanda
Lesotho
Suriname
Mali
36.0
32.4
20.8
18.6
15.1
14.7
12.4
11.8
11.6
11.2
Micronesia
Guinea-Bissau
Sierra-Leone
Eritrea
Congo, Dem. Rep.
Burundi
Mozambique
Afghanistan
Solomon Islands
Malawi
47.0
38.9
35.9
35.5
32.1
31.2
30.5
30.4
26.2
25.2
Source: authors estimates based on OECD 2006 and World Development Indicators 2005
17 Literature uses various other measures of aid dependence (see Lensink and White 1999). Bauer (1984) stresses that aid to government expenditures is more appropriate than aid per capita, because "aid goes to governments, not people." Moore (1998) defines aid dependence as a characteristic “not of economies but of governments.” Klitgaard (1990) suggests (partly) facetiously that the most relevant measure might be aid per cabinet minister.
32
Chapter 3. Overview of Existing Studies
Since donors started providing foreign assistance to developing countries, a broad
empirical literature has emerged to investigate the impact of foreign aid on development
outcomes and determinants of aid allocation. This substantial and growing body of research
has dramatically increased our knowledge of how aid affects developing economies and what
factors determine donors’ aid allocation decisions. In addition, this literature has introduced
a variety of innovative techniques for dealing with the estimation inherent in evaluating
development effectiveness. It would be vastly beyond the scope of this dissertation to provide
a detailed review and critique of hundreds of studies that have analyzed donors’ aid
allocation policies and aid effectiveness. In this chapter instead, I summarize major results
and weaknesses of past literature on aid effectiveness and allocation. This is done in three
steps. First, in subsection 1, I review evidence on the impact of aid on development
outcomes, focusing in particular on whether foreign aid promotes economic growth in
recipient countries. Then, in subsection 2, I summarize studies on determinants of aid
allocation. In subsection 3, I present evidence on the effect of governance on development
effectiveness.
3.1. Aid effectiveness: What does past research tell us?
How do I define and evaluate aid effectiveness? As seen in Chapter 2, the role and
function of foreign aid has been influenced by, and thus has to be evaluated in the light of,
development thinking. In fact, economic theory and development thinking have been
influential in identifying criteria for and evaluating aid effectiveness. As I highlighted earlier
in this dissertation, most important in this respect has been the two-gap model (Chenery and
Strout 1966 and others), which identifies inadequate domestic savings and foreign exchange
earnings as a binding constraints on economic development (growth) in developing poor
countries. Thus, the objective of promoting economic development and welfare in

33
recipient countries became an important part of the OECD’s definition of ODA in the
1970s18.
During this time the criterion for aid effectiveness was whether aid is effective in
promoting economic development and welfare in recipient countries. This criterion has been
explored from different methodological and ideological perspectives. Studies have evaluated
aid effectiveness at both the micro- and macroeconomic level, relying on both cross-country
comparisons and single country case studies, and by using broad surveys of a qualitative and
multi-disciplinary analysis as well as empirical analytical studies. A complete survey of aid
effectiveness studies is neither feasible nor essential task for this dissertation. Instead I focus
on summarizing the main results and weaknesses of this literature. Before moving to the
analysis of empirical studies on aid effectiveness, I will briefly discuss some conceptually
different approaches to potential impact of foreign aid in recipient countries.
There are two conceptually different broad views in this context. On the one hand,
proponents of foreign assistance to developing countries argue that most poor developing
countries lack domestic savings to finance existing profitable investment opportunities and
have limited or no access to international private capital markets; thus, official foreign
assistance could play an important role (the only source in many developing countries) in
filling the financing gap in order to attain a needed investment level and targeted growth
rate. Contemporary proponents of foreign aid, such as Sachs (2005), Stiglitz (2002), Stern
(2002) and others argue that although aid has sometimes failed, it has prevented worse
performance in many countries and even supported poverty reduction and successful
development efforts in several others. They provide a number of successful examples of
programs that have been supported by western donors, such as the green revolution in Asia,
eradication of various infectious diseases as a result of the Global Alliance for Vaccines and
Immunization, the spread of family planning, the success of export processing zones in East
Asia and so forth.
18 OECD, “Is it ODA?” Note by the DAC Secretariat, Paris, 22 May 2001

34
The contemporary advocates of foreign assistance mainly use some modified versions
of initial rationale for foreign aid. For example, Sachs (2005) argues that the basic mechanics
of capital accumulation in poor countries fall into a poverty trap. Since all household income
goes to consumption, there are no taxes and no personal savings. However, rising population
and depreciation leads to a fall in capital per person and a negative growth rate of per capita
income. This further impoverishes the poor households in the future and leads to a vicious
circle of falling incomes, zero savings and taxes, private and public investment, and falling
capital per capita. Sachs (2005) argues that the solution is foreign assistance, in the form of
ODA, which “helps to jump-start the process of capital accumulation, economic growth, and
raising household incomes”19. He identifies three channels into which foreign aid goes:
households for emergency situations, government to finance public investment, and private
businesses (for example, farmers) through microfinance programs and other schemes to
finance private investment. Finally, Sachs (2005) claims, “If the foreign assistance is
substantial enough, and lasts long enough, the capital stock rises sufficiently to lift
households above subsistence”20.
On the other hand, Freidman (1958), Little and Clifford (1965), Bauer (1972), and
other earlier critiques of foreign aid argued that the objectives of foreign aid are worthwhile
but its premises are wrong and it would just be a waste of money. As Milton Freidman
argued “The proponents of foreign aid have … accepted the view that centralized and
comprehensive economic planning and control by government is an essential prerequisite for
economic development”21. They also argued that aid flows have largely contributed or will
contribute to the failure of development efforts in many developing countries by enlarging
government bureaucracies, perpetuating rent seeking and corruption, and enriching the elites
in poor countries. According to Easterly (2003 and 2006), one of the strong contemporary
critics of foreign aid, there is too much corruption in recipient countries and
unaccountability in aid delivery mechanism. He claims, therefore, that foreign aid has done
19 Sachs, Jeffrey (2005). “The End of poverty: Economic Possibilities of Our Time”, p. 246. 20 Sachs, Jeffrey, Ibid. 21 Freidman, Milton, “Foreign Economic Aid: Means and Objectives”, p. 77-78.

35
much bad and little good to recipient countries, and argues against upscaling of foreign aid
flows.
However, while influential, these high level studies seldom provide empirical
evidence to support their arguments (Easterly, 2003; 2006 and Sachs, 2005 are exceptions).
Having briefly discussed the higher-level conceptually different views regarding the role of
foreign aid in promoting development, the main thrust of this section is to provide a review
of empirical literature on the effectiveness of aid. Although, my main focus is on most recent
developments, I will start with a short background debate by discussing some earlier studies.
Early studies on aid effectiveness mainly used the framework of the Harrod-Domar
growth model and two-gap models, in which incremental capital-output ratio is a key
determinant of the economic growth. Assuming that there is a savings gap that constrains
investment and growth, these studies emphasized the role of aid in financing investment and
proposed a causal link running from aid to savings to investment to growth. First, I briefly
focus on and discuss studies that attempt to estimate the direct impact of aid on domestic
savings, and then I concisely examine studies that make an attempt to estimate a causal link
between aid and domestic investment.
The studies available overwhelmingly suggest that there is a negative relationship
between foreign aid and domestic savings (Hansen and Tarp 2000). For example, Snyder
(1990), using data for 50 aid recipient countries, demonstrates that after controlling for per
capita income, aid has no statistically significant effect on domestic savings. However, he
does not rule out the possibility of some negative association between aid and domestic
savings in some recipient countries because the relationship between aid and domestic
savings were consistently negative, though statistically insignificant, in various specifications.
The findings of Reichel (1995) support this conclusion. He found a strong and statistically
significant negative relationship between domestic savings and aid, and concludes that there
is considerable evidence of foreign aid substituting for domestic savings.

36
However, Hadjimichael et al (1995) demonstrate that there is a strong evidence of
heterogeneity among aid recipient countries. This last study also initially finds a negative
relationship between foreign aid and domestic savings in a sample of 39 Sub-Saharan African
countries. However, when they controlled for differences in growth performance and the
degree to which macroeconomic and structural adjustment efforts were sustained, they find
that the negative impact of foreign aid on domestic savings is concentrated in those countries
with prolonged imbalances and negative per capita growth. In countries with sustained
adjustment efforts and positive growth rates, foreign aid appears to have stimulated domestic
savings.
Papanek (1992) also doubts the negative relationship between savings and net aid
inflows, and argues that exogenous factors, such as political factors, are likely to cause both
high aid inflows and low savings rates. Griffin (1970) attempts to explain the estimated
negative effect of foreign aid on savings as follows. He argues that aid inflows will increase
income but would not increase savings (investment) one-for-one. The reason for this is that
marginal propensity to savings is always less than one, and marginal propensity to
consumption is always above zero. Therefore, when income rises as a result of foreign
assistance, part of the additional income goes to current consumption, thus, savings increases
by less than the value of aid flows. Further foreign aid displaces domestic savings and in this
sense, aid has a negative influence on savings.
There are two problems with this argument (White 1992). First, the above reasoning
is static in nature and it ignores potential feedback from higher income into future higher
savings and higher growth. Second, the bulk of foreign assistance goes to health and
education sectors that are considered as consumer goods but helps to build human capital
that plays an important role for future savings, investment and the economic growth.
Therefore, the results of static analyses that show a negative or insignificant effect of foreign
aid on savings are flawed on methodological grounds.

37
The aid-investment relationship has also received noteworthy attention of researchers
from academia and international financial institutions. Overall, the available studies seem to
indicate a positive relationship between foreign aid and domestic investment in recipient
countries (Hansen and Tarp 2000, Mavrotas 2003). Hansen and Tarp (2000) summarizes
the results of 29 earlier studies that attempt to test the proposition that asserts that foreign
aid stimulates domestic investment. Their meta-analysis provides overwhelming support for
the proposition that aid helps to increase the level of investment ratio in recipient countries,
with fifteen out of sixteen estimates providing a positive and statistically significant result.
Levy (1987) shows that much of aid transfers to developing countries go to finance
investment. His results, based on a cross-sectional analysis of data from 39 LDCs, show that
the estimated coefficient of aid with respect to domestic investment is approximately 0.86,
thus suggesting that one point increase in aid to income ratio will lead to a 0.86 point
increase in investment ratio22. Thus he concludes that the evidence overwhelmingly supports
the proposition that most development assistance intended for fixed capital formation is
indeed invested and a sustained increase in the aid ratio caused an almost equal increase in
the investment ration. In another study, Levy (1988) also reports positive and statistically
significant impact of aid on investment based on a cross-section of 22 Sub-Saharan African
countries. Results of regression that controlled for fixed country effects suggested that
“countries that experienced an increase in the flow of foreign aid found that their investment
increased on average by an equal amount”23. Lensink and Morrisey (2000), in a cross-
sectional study of 75 aid recipient countries, also find a positive and statistically significant
impact of aid on investment. Furthermore, Hansen and Tarp (2001), in a panel data analysis
of 56 developing countries, obtained similar results.
However, there are some studies that report a negative relationship between aid and
domestic investment in recipient countries. For example, Snyder (1996) finds, using a
22 When aid net of technical assistance is used the coefficient rises to 0.96. This highlights the notion about heterogeneity of different aid flows and the importance of aid disaggregation in evaluating the impact of aid on development outcomes. 23 Levy, V. “Aid and Growth in Sub-Saharan Africa: The Recent Experience”, European Economic Review, 1988, Vol. 32, No. 9, pp. 1777-1795.

38
pooled data for a sample of 35 aid recipients, a negative and significant impact of aid on
private investment. Easterly (1999) investigates the relationship between foreign aid and
domestic investment country by country for the period 1965-95. He finds that out of 88 aid
recipient countries for which he performed the investigation the relationship between aid
and investment was negative and significant, in 36 countries a negative but insignificant in17
countries, positive and significant in 23 countries positive and significant, and positive but
insignificant 12 countries. This study investigated the relationship between ODA/GDP ratio
and Investment/GDP ratio using a simple ordinary least squares (OLS) model and did not
control for potential sources of bias, and thus should be taken with precaution, but it still
suggests that there is heterogeneity in the relationship between aid and investment across aid
recipient countries.
Later the focus shifted away from simplistic Harrod-Domar and two-gap models
towards more sophisticated models based on the neoclassical and other growth models and
most of the academic and policy debate on aid effectiveness focused on the relationship
between aid and growth despite the fact that a substantial part of foreign assistance is not
primarily intended to support growth. Some of the studies based on these models estimate
the impact of aid on the presumption that only temporary aid can increase investment and
permanent aid merely increases consumption and does not increase investment, hence
growth. Others assume that aid can help a recipient country to reduce poverty or even to
escape from a “poverty trap” onto a higher steady-state growth path. A more sophisticated
theoretical framework also led some researchers to give prominence to human capital,
policies and institutional factors that may support or constrain growth.
This new approach produced a broad but contradictory literature on the aid-growth
relationship24. There is no agreement on the effects of aid. Some authors argue that aid
helped to promote growth and structural adjustment in many less developed countries while
24 Hansen and Tarp estimates that from the 1970s to 2000 no less than 72 cross-country studies have tested the link between aid and growth in reduced form equations.
39
others oppose it. As stressed by many authors, the review of the results of these studies
suggests three competing observations on the aid-growth relationship (Radelet et al 2004).
The first group of studies found that foreign aid has no effect on growth, and
sometimes may even harm the economic growth in recipient countries. The most widely
cited studies about aid-effectiveness that found a negative relationship between aid and
growth are those by Mosley et al (1987 and 1992). They performed two empirical tests: one
using cross-section data and the other, using time series data. The cross-section evidence
consists of comparing the rate of change of income due to the change of aid among countries
exhibiting high-aid and high-growth patterns with those exhibiting high-aid and low-growth
patterns. The time series evidence is based on several growth regressions for 1960-1970,
1970-1980 and 1980-1983 for all developing countries in the sample, and also by region.
Based on both cross-sectional and time series analyses, they concluded that it is more likely
that foreign aid does not stimulate the economic growth. They explained this with the
possible leakage into non-productive expenditure in the public sector and the transmission of
negative price effect into the private sector.
Another widely cited study by Boone (1994) concluded that there is no significant
relationship between aid and growth. This and other studies with similar findings have
suggested crowding out of private investment and savings, the Dutch disease effect of aid,
corruption, embezzlement, and rent seeking behavior among a variety of reasons why aid
might not promote the economic growth. However, Ovaska (2003) argues that there is no
considerable evidence that development aid is effective in promoting economic growth in
developing countries even with better governance.
The results of Mosley et al (1987 and 1992), Boone (1994) and other similar studies
have been fairly criticized on the grounds of their underlying structural model and
econometric methodology. Their results were mainly based on simple OLS regression
analysis (with some exceptions) and assumed only a simple linear relationship between aid

40
and growth25. Besides above, another important criticism of Boone (1994) is the use of a
static model over a 20-year period of time, which does not allow dynamics of adjustment.
Furthermore, a recent study by Rajan and Subramanian (2005a), using cross-
sectional and panel data and more sophisticated econometric methodology found no robust
evidence of a positive (or negative) relationship between aid flows into a country and its
economic growth, with their conclusion holding across time periods and types of aid. They
also find no evidence that aid is more effective in better policy or geographical environments.
Another work by Rajan and Subramanian (2005b) suggests that this may be due to aid flows
causing the real exchange rate overvaluation in recipient countries, thereby weakening their
competitiveness, as reflected in a decline in the share of labor intensive and tradable
industries.
The second group of studies suggests that foreign aid in all likelihood positively
influences economic growth, but with diminishing returns26, and its effect is unconditional
to policy environment (Durbarry et al 1998, Hansen and Trap 2000 and 2001, Dalgaard
and Hansen 2000, Lensink and White 2001, Dalgaard et al 2004 and others). Most of these
studies conclude that while aid has not always worked, on average higher aid flows have been
associated with more rapid growth. For instance, Hansen and Tarp (2000 and 2001)
formulate an empirical framework to allow for nonlinearities in the aid-growth relationship
such as quadratic aid and policy along with aid policy interactions. They also control for
some economic, political and institutional variables. They found that the coefficient for aid
variable is positive and statistically significant, but the coefficient for aid squared is
statistically significant and negative. In other words, that the causal relationship between aid
and growth is positive but this positive impact diminishes as the volume of aid increases.
25 Apparently most of the studies on aid-growth relationship tested a linear relationship using simple OLS methodology. 26 Some suggest that the diminishing return reflects absorptive capacity constraint, an idea that dates back to 1950s and 1960s and stems from limits in the quality and quantity of human capital and physical infrastructure (Quibria 2004).
41
Lensink and White (2001) claimed that aid might not merely have diminishing
returns but that, after a certain level, returns become negative. They found the threshold for
negative marginal returns to be 50 percent of the ratio of aid to GNP. However, this can be
downplayed because 50 percent of GNP threshold for aid ratio exceeds the average aid ratio
for most aid recipient countries. Some other authors found that the threshold for negative
marginal return to aid is about 25 percent of GDP (Hansen and Tarp 2000, Hadjimicheal et
al (1995).
The third group of studies suggests that aid has a provisional positive impact on
growth, only helping recipients in certain circumstances. This conditional strand indicates
that aid supported growth only in certain circumstances but not in other situations. For
example, Guillaumont and Chauvet (2001) find that aid works positively in countries with
difficult economic environments, as characterized by unstable terms of trade and natural
disasters. The findings of Collier and Dehn (2001) also support the result obtained by
Guillaumont and Chauvet (2001). They measure vulnerability by the change in export prices
and show that the interaction term involving the change in aid and the change in export
prices is significant.
Another well-publicized and influential study that belongs to the conditional strand
is the study by Burnside and Dollar (2000). They applied the empirical strategy of making
the impact of aid dependent on a summary measure reflecting the quality of policies instead
of vulnerabilities. They define a “good policy environment” as a weighted combination of
low inflation, low budget deficits, and trade openness. Then they introduced aid (as share of
GNP) as well as the interaction of aid and the composite policy variable in a standard growth
regression. Their results show that the coefficient for aid by itself is not significantly different
from zero, but the coefficient for interaction term is positive and statistically significant,
implying that aid works in “a good policy environment” but has little impact in “a poor
policy environment” (Burnside and Dollar 2000, and World Bank 1998).
42
The findings of Burnside and Dollar have been extremely influential, and decisively
changed the debate on aid effectiveness and donors’ aid allocation policies. If foreign aid
stimulates economic growth in countries with good policies, then foreign aid should be given
selectively to countries that have adopted sound policies. Multilateral and bilateral donors
have already recognized the importance of this finding and started moving towards new
policies (World Bank 1998 and 2002, USAID 2004, U.K. Department for International
Development (DFID) 2000). The findings of Burnside and Dollar (2000) suggested also
specific criteria for targeting aid. This criterion is called a “poverty efficient allocation of aid”
which focuses on those countries with a combination of high rates of poverty and a good
policy environment (Collier and Dollar, 2001 and 2002). The basic message of this criterion
is that poor countries with good policy environment, as measured by the World Bank
Country Policy and Institutional Assessment (CPIA) index, should be eligible for aid, while
countries with low CPIA score should not be eligible for aid, or alternatively receive less aid.
This idea has been adopted by the International Development Association (IDA) and DFID
(Dalgaard et al 2004). The Millennium Challenge Corporation (MCC) of the United States
also uses similar methodology to determine the eligible countries for its aid.
However, some researchers have questioned the robustness of the Burnside and
Dollar (2000) findings and concluded that there is need for more research on the subject.
First, Hansen and Tarp (2000) found that “the basic Burnside-Dollar results turn out to be
sensitive to data and model specification”. They argue that by changing the number of
observations and the model specification one can make the crucial aid-policy interaction
term significant and also turn off this result. More recently Easterly et al (2004) reassessed
the links between foreign aid, policy, and growth using extended data. While the Burnside
and Dollar (2000) results were based on a panel of 56 countries and six four-year time
periods from 1970-73 to 1990-93, Easterly et al (2004) extended the number of observations
by adding additional countries and one more time period (1994-1997). Thus, using the
same methodology, this study reexamines whether foreign aid has a positive effect on
economic growth in the presence of sound policies. They no longer find that foreign aid
43
promotes economic growth in good policy environments. These new findings cast doubt in
the previous conclusion that aid will promote growth in countries with good policies.
All of these studies have one common feature: they examine the impact of aggregate
aid on growth over four or five years27. In the late 1990s and early 2000s, some researchers
started to focus on disaggregating aid flows by using different criteria and then estimating the
impact of disaggregated aid on development outcomes. Owens and Hoddinott (1999) find
that aid to infrastructure and agricultural extension in Zimbabwe increased the household
welfare far more than by humanitarian (food aid and emergency aid) aid. Mavrotas (2003)
disaggregates aid to Uganda into program, project, technical assistance, and food aid. He
then uses a time-series error-correction model to test the growth impact of aid and finds a
significantly positive impact of program aid much larger than of project aid. He also finds
significantly negative impacts of technical cooperation and food aid. Cordella and
dell’Ariccia (2003) disaggregate development assistance into program and project aid, then
find the evidence that shows that program aid is preferable than to project aid when donors
and recipients’ preferences are aligned.
A recent study by Clemens, Radelet, and Bhavnani (2004) divides aggregate aid into
three mutually exclusive, collectively exhaustive categories: “short-impact” aid, “long-impact”
aid, and “humanitarian” aid. Then they focus on “short-impact” aid (about 53% of all aid
flows) and find a positive causal relationship between the “short-impact” aid and the
economic growth. They find at the mean a $1 increase in short-impact aid raises output (and
income) by $1.64 in present value in the typical country. This impact is two to three times
larger than in studies using aggregate aid. The study also finds diminishing returns to aid: the
maximum growth rate takes place when the “short-impact” aid reaches 8 percent of
recipient’s GDP.
27 Rajan and Subramanian (2005a) try to distinguish the impact of different types of aid following Clemens et al (2004)
44
3.2. What Are the Determinants of Donors’ Aid Allocation Policies
While studies of aid effectiveness have focused on economic development, do donors
allocate foreign aid aiming to promote economic development and welfare in recipient
countries? In other words, do donors allocate aid according to the needs of the recipient
countries or according to their own interests? The review of the aid allocation literature
suggests that donors seem to be neither entirely altruistic nor completely self-serving, i.e.,
donors’ aid allocation aims to promote their own interests as well as oriented towards the
needs of recipient countries. Four broad factors seem key in determining donors’ aid
allocation decisions:
• Recipient needs. It appears that promoting economic development and welfare
appear crucial for most of the donors’ in making aid allocation decisions.
• Donors’ strategic and political interests. Most of the variation in aid flows can be
explained in accordance with donors’ strategic assessments of changing international
situations.
• Donors’ economic interests also explain a significant part of the variation in foreign
aid flows, i.e., donors allocate some aid with the aim of expanding their own
markets, creating sources of cheap imports from developing countries, and
protecting foreign investments of their private companies.
• Recently some donors started focusing on good governance and allocating more aid
to countries with good performance on the various aspects of good governance.
A review of the aid allocation literature leads to the following observations. First,
while most empirical studies do not explicitly present the theoretical model embodied in
their regressions, it is possible to incorporate them into the theoretical framework proposed
by Dudley and Montmarquette (1976) and later extended by Trumbull and Wall (1994).
Therefore, I present here their framework in some detail. The model is based on the standard
microeconomic theory of constrained utility maximization and tries to explain bilateral
45
donors’ two decisions: first, whether or not to give aid to a given developing country
(eligibility stage), and second, how much aid to grant given a positive decision had been
made in first part (level stage). The model assumes that there are only two goods in donors’
utility function: impact of foreign aid and the other good. The donor maximizes the relative
impact of its aid on the recipient country, as measured by the ratio of the per capita aid to
the per capita income, weighed by the size of recipient’s population.
The main assumptions of the model are as follows: donor country may expect that (i)
the recipient country will behave more favorably toward donor country by supporting
donor’s national political interests, (ii) the recipient country will confer economic benefits
towards the donor by buying more of the products from the donor country, and (iii) the lives
of people in the recipient country will be better because of donor’s assistance (altruistic
vision). While the first two assumptions refer to donor interests, the third assumption refers
to recipient needs. By solving the utility maximization problem subject to budget constraint,
Dudley and Montmarquette (1976) derive two econometric specifications to test the relative
importance of various factors in donors’ aid allocation decisions.
The model developed by Dudley and Montmarquette (1976) aimed to explain
individual donor’s aid allocation decision assuming that different donors have different
subjective measures of the impact of aid to a recipient country. Later Trumbull and Wall
(1994) extended the model to allow optimization by multiple donors assuming that all
donors have the same subjective measure of the impact of aid to a recipient country. In this
model, similarly to Dudley and Montmarquette (1976), a donor maximizes the weighted
sum of the total impacts of its official development assistance on all recipients subject to its
aid budget.
Second, an empirical analysis of the determinants of donors’ aid allocation policies
indicated some identification issues. Evidence shows that individual donors provide a
positive amount of aid to some recipients and nothing to others. Also, larger donors (USA,
Japan, UK, France) tend to give some amount of aid to most of the recipients, while smaller
donors (Denmark, Finland, Ireland, etc) tend to focus on fewer recipients (Dudley and
46
Montmarquette (1976), Alesina and Dollar 2000, Neumayer 2003). As Neumayer (2003)
and others pointed out, the exclusion of some countries from the recipient list by some
donors makes the dependent variable, aid, only partly continuous with positive probability
mass at the value of zero. Since OLS depends on the assumption that the expected value of
the dependent variable is linear relative to the independent variables, this creates a problem
for standard OLS estimation. The existing literature suggests using more sophisticated
estimation techniques, such as the two-part model (Dudley and Montmarquette 1976,
Apodaca and Stohl 1999, Svensson 1999, Neumayer 2003, etc.) and the Tobit model
(Alesina and Dollar 2000, Alesina and Weder 2000) to overcome this problem.
Third, nearly all reviewed studies control in one way or another for donor interests
and recipient needs in their empirical analysis of donors’ aid allocation decisions. For
example, Trumbull and Wall (1994) explores the variations in the per capita aggregate ODA
across recipients by using fixed effects estimator and find that ODA allocations are
determined by the needs of the recipient, such as infant mortality, and political and civil
rights. However, the empirical results of this study should not be taken seriously because
they failed to control for other aid determinants, in particular for donor interests. Alesina
and Dollar (2000) control for both donor interests (mostly for strategic and political
interests) using such variables as colonial experience, UN voting similarity, the share of
Muslims and Roman Catholics in the recipients’ population and recipient needs through per
capita income. They find considerable evidence that the allocation of bilateral foreign aid is
mostly determined by political and strategic considerations, while at the margin, developing
countries that support political rights and civil liberties receive more aid, ceteris paribus.
Another study by Apodaca and Stohl (1999), exploring U.S. foreign aid allocation,
find the support for recipient needs at the eligibility stage and for donor interests and human
rights at the eligibility and level stages. The findings of this study suggest that, while the
impact of recipient needs, as measured by GNP per capita, on the aid allocation decisions
made by U.S. government is positive and statistically significant, U.S. national security
interests play a more prominent role in aid allocation. Noticeably, countries perceived to be
47
of vital importance to U.S. national security along with Latin America receive aid regardless
of other factors.
The studies often use the following variables to control for donor interests among
others: political similarity, arm transfers, military presence, religious similarity, geographic
proximity, proportion of a donor export or imports traded with a particular recipient
country, stock of private direct investment from a donor to a recipient country. While per
capita income is often included in empirical analysis to control for recipient needs, other
variables such as infant mortality, literacy rate, and life expectancy are also widely used in aid
allocation regressions for that purpose.
Fourth, as I mentioned above, researchers have recently started to focus on the
impact of the recipients’ governance on donors’ aid allocation decisions. The reviewed
studies use various indicators to measure the quality of governance in recipient countries,
including personal integrity rights (Apodaca and Stohl 1999), political and civil rights
(Alesina and Dollar 2000, Trumbull and Wall 1994, Svensson 19999, Neumayer 2003), rule
of law and corruption (Alesina and Dollar 2000, Alesina and Weder 2000, Neumayer 2003).
For instance, Alesina and Weder (2000) explore the impact of the level of corruption of the
recipient country on aid flows and find no evidence that corruption negatively affects the
amount of foreign aid flows, but the Scandinavian countries appear to reward less corrupt
countries with higher amounts of aid and large donors such as U.S., U.K., Japan and others
appear indifferent to the level of corruption in a receiving country. According to Neumayer
(2003) all aspects of good governance (he controls for democracy, human rights, corruption,
rule of law, and regulatory burden) except for the rule of law have statistically significant
influence on donors’ decisions in eligibility stage. He also finds that democracy, respect for
human rights and low regulatory burden are statistically significant determinants of aid flows
for some donors. Alesina and Dollar (2000) also find that, at the margin, developing
countries that support political rights and civil liberties receive more aid, ceteris paribus.
Knack (2000) examines the interdependence between foreign aid and the quality of
governance by relating the quality of governance, as measured by indexes of bureaucratic
48
quality, the rule of law, corruption and their simple combination (the paper calls it the
quality of governance index, which is created by a simple summation of the first three
indicators) to aid variable, as measured by the total foreign aid as percentage of GDP and
percentage of government expenditures. The paper finds that higher levels of foreign aid
erode the quality of governance.
Fifth, in addition to explaining the impact of donor interests, recipient needs and
recipients’ governance on donors’ aid allocation policies, previous studies have revealed some
population bias in the allocation of foreign aid. For example, Dudley and Montmarquette
(1976) found a strongly significant correlation between per capita aid and the population of
recipient countries. Trumbull and Wall (1994) also found some evidence of population bias.
More recently, Neumayer (2003) found that there is no population bias at the eligibility
stage, but at the level stage certainly all donors have population bias, indicating that less
populous countries receive more per capita aid than more populous ones. The literature
suggests the following explanations of population bias: donors might think that there would
be a greater impact in small countries due to decreasing marginal benefits of aid allocation as
population size increases, relatively smaller aid absorbing capacity of more populous
countries, donors might be reluctant to concentrate aid in a few large countries, such as
China and India (Neumayer 2003).
Sixth, the literature also suggests that the determinants of bilateral and multilateral
aid will be different (Maizels and Nissanke, 1984) and there are important differences among
bilateral donors’ aid allocation decisions (Alesina and Dollar 2000). Alesina and Dollar
(2000) find that four Nordic countries, including Denmark, Finland, Norway and Sweden
behave similarly in that they allocate more aid to recipients with less per capita income, open
economies and democratic governance. Marginally, the US behaves similar to the Nordic
countries but allocates more aid to political allies, such as Egypt and Israel, as measured by
similar UN voting patterns. France and Japan allocate more aid to their political allies and
former colonies at the margin and pay less attention to recipient needs and good governance.

49
The earlier study by Dudley and Montmarquette (1976) also found similar differences
among donors.
Despite the above-mentioned important differences among them, individual donors’
aid allocation decisions are influenced by the total amount of aid received from the rest of
the donors. This is called a “bandwagon effect” whereby donor might expect that the impact
of its aid on recipient country would be higher, the greater the aid the rest of the donors
grants to a recipient country (Dudley and Montmarquette 1976). Literature also suggests
that there is some alliance among large donors. For example, Katada (1997) finds that
Japanese aid allocation decisions pursue the following simultaneous objectives: own political
and economic interests, collaboration with the USA in support of USA maintenance in the
developing world, and improvement of the USA-Japan relationship by satisfying US interests
in Asia-Pacific region.
Finally, some recent studies investigate incentives in donor-recipient relations, and
how they might influence the implementation of policy reforms intended to reduce poverty
and promote development (Svensson 1997, 2000). Svensson (1997) uses a game theoretic
model in which an altruistic donor allocates aid according to recipient needs, and the aid
allocation rule adversely affects recipients’ incentives to carry out policies to promote human
development indicators: infant mortality, life expectancy, and primary school enrollment.
The empirical tests show that recipient needs and population are the main determinants of
aid allocation, but aid flows have no statistically significant impact on promoting human
development indicators. Also some authors investigate donors’ aid allocation policies by
examining the interactions between donors and recipients (Casella and Eichengreen, 1996;
Svensson 2000; Lahiri and Raimondos-Moller, 2004). These studies show how policy
differences across donors may affect the development outcomes. They stress the importance
of the timing of aid disbursements and the degree to which aid flows are aimed at poor for
outcomes.
50
3.3. Governance and Its Relation to Foreign Aid and Development
What role can aid play in promoting development outcomes in recipient countries?
Overall, successful long-term development is a complex process that depends on many
factors. Nevertheless, the evidence suggests that the quality of governance in a country is
particularly important and will heavily influence its development. Compared to this factor,
other factors including foreign aid appear to be much less important in determining whether
a given country will achieve its development objectives, such as long-term economic growth
and poverty reduction. Probably, foreign aid is likely to be most helpful when it is combined
with better governance. However, what is the evidence regarding the role of governance in
economic development. How do I define quality of governance? In order to answer these
questions, in this section, I briefly review the development literature on the relationship
between governance and development and then discuss its relation to foreign aid.
The term governance is not new. However, it has become a key concept in
international development debate over the past 10 to 15 years. Since early 1990s, there has
been a growing interest among academia, policymakers and analysts of international
institutions and developing countries on the role of governance in development process.
Governance is used in several contexts such as corporate governance, international
governance, national governance and local governance. In this dissertation, the focus is in
national governance.
Despite a growing popularity of governance at both the theoretical and policy levels,
the term continues to mean different things to different organizations and researchers. There
are several definitions of governance. For example, the Oxford dictionary defines governance
as “the act or manner of governing, of exercising control or authority over actions of subjects;
a system of regulations.”28 The UNDP has adopted a definition that defines governance as
“the exercise of economic, political, and administrative authority to manage a country’s
28 Online Oxford English Dictionary

51
affairs at all levels.”29 Based on this definition, governance involves the mechanisms,
processes, and institutions, through which citizens and government institutions exercise their
legal rights and meet their obligations, and mediate conflicts. In this context, three
dimensions of governance are identified: political, economic and administrative. Political
dimension comprises the policy formulation, while economic dimension includes the
decision-making process that affects a country’s domestic economic activities and its
relationship with international economy and administrative dimension involves the system of
policy implementation.
In an influential study, Kaufmann et al (1999) proposed a broad and comprehensive
view of governance, which defines governance as the combination of rules and institutions by
which a country is governed. This includes (1) the way governments are selected, monitored
and replaced, (2) the capacity of the government to effectively formulate and implement
policies, and (3) the respect of citizens and the state for the rules and institutions that govern
political, social, and economic interactions among them (Kauffmann et al 1999 and 2003).
Moreover, Kaufmann et al (1999), using an unobserved components method, aggregated
various measures of governance into six aggregate indicators corresponding to six dimensions
of governance: voice and accountability, political stability, government effectiveness,
regulatory burden, rule of law, and corruption. This definition of and measurement of
governance is widely acknowledged by academia and international financial institutions
(such as World Bank, IMF, ADB, EBRD, etc.), and it is becoming very popular among
researchers and development practitioners.
Having given a brief discussion on the different definitions of governance, I turn to
the review of literature on the impact of governance on development effectiveness. Since all
definitions relate governance to institutions, the review of literature includes the studies that
explicitly test the impact of governance on development outcomes as well as the studies that
test the impact of institutions on development outcomes. As Jutting (2003) pointed out
29 UNDP, “Reconceptualizing Governance”, New York: UNDP 1997, pp.2-3.
52
institutions craft order and reshape incentives, thus building the governance structure of a
country and leading to the formation of national government.
A review of cross-sectional studies with respect to the impact of governance on
institutions on development outcomes results in the following conclusions:
First, there is an overall acknowledgement that various dimensions of governance
have a direct impact on economic growth. For example, Rodrik et al. (2004), using the rule
of law indicator from Kaufmann et al. (2002), found in a recent cross-sectional study that
the observed direct effect of the institutional quality of governance30 on income per capita is
positive and both statistically and practically significant. Hall and Jones (1999), using equally
weighed averages of five indicators from the ICRG (law and order, bureaucratic quality,
corruption, risk of expropriation and government repudiation of contracts), documented
that the differences in capital accumulation, productivity, and thus output per worker are
driven by differences in institutions and government policies.
Second, the development literature suggests that the country’s governance impacts its
rate of development. Particularly, it suggests that the characteristics of governance such as
political stability and social order, the quality of country’s governmental institutions and
capable government bureaucracy and administration are more likely to impact the long-term
development. These governmental institutions are composed of laws, regulations and other
formal mechanisms and organizations that protect property rights, make and enforce
contracts, provide regulatory framework (CBO 1997 and Mankiw 1995).
Third, democratic governance with market liberalization plays a crucial role in
sustaining the long-term growth, but without strong market institutions democracy will not
be able to sustain growth (Bhagwati 1995). The experiences of China and the newly
industrialized countries of East Asia shows that even authoritarian governments with strong
markets and public policies can facilitate and sustain long-term economic development
(World Bank 1993).
30 Rodrik et al. (2004) calls it just institutional quality
53
Fourth, besides the evidence on direct impact of governance on development
outcomes, literature suggests that governance and institutions have an indirect impact on the
economic growth and development. This indirect effect appears to run through their impact
on investment, conflict prevention and mitigation, policies and the stock of social capital
(Jutting 2003). In this context, Fedderke et al (2005) find that governance has an indirect
impact on output as well as a direct one. They estimate that the productivity of investment
increases by a factor of 1.6 between countries with the worst governance, and those with
moderate governance. The indirect impact of governance on development outcomes might
have important implications for aid effectiveness. The challenge for research is how to
identify the interaction effect of governance with foreign aid.
Finally, in a recent paper Glaeser et al (2004) present evidence suggesting that
human capital is a more basic source of the economic growth than are the institutions, and
that it is human capital that leads to institutional development. Independently of this
particular evidence, Alvarez et al (2000) and Barro (1999) also present similar evidence.
These findings raise significant questions about the validity of the evidence presented above.
3.4. Summing Up
Summarizing the evidence presented above, the following observations can be made
with respect to aid effectiveness and aid allocation:
• Past research primarily addresses two interrelated issues: the effectiveness of foreign
aid and determinants of aid flows. However, these two research areas rarely intersect.
Studies aiming to explain determinants of aid flows did not consider effectiveness
issues and vice versa.
• The evidence on the aid-growth relationship, which is at the center of aid
effectiveness and allocation debate, appears to be inconclusive. While conventional
wisdom suggests that aid works in “a good policy environment” but has little impact

54
in “a poor policy environment”, this perception is not fully supported by the
available studies.
• Past research to a great extent investigates the aid-growth relationship aiming to
estimate the impact of aggregate aid on growth despite the fact that a substantial part
of foreign assistance is not primarily intended to support growth. Aid is given for
many different purposes (sectors), as classified by OECD’s Development Assistance
Committee Credit Reporting System, and in many different forms. Therefore, one
cannot expect that aid allocated to different sectors will influence the economic
growth homogeneously.
• Previous research suggests that different aid flows are heterogeneous in their impact
on economic growth and support the importance of aid disaggregation in evaluating
the impact of aid on development outcomes. It also suggests that there is
heterogeneity with respect to the relationship between aid and development
outcomes across recipient countries.
• Donors’ aid allocation decisions seem to be neither entirely altruistic nor completely
self-serving, i.e., donors aim to promote their own interests and to address the needs
of recipient countries. Also, donors recently started focusing on the recipients’ quality
of governance and countries with better governance seem to receive more aid, at the
margin.
• Development effectiveness depends on many factors. The quality of governance
appears to be the most among them and the interaction of foreign aid with
governance seems significant for aid effectiveness.
55
Chapter 4. Methodological Approach
As indicated in the introduction, the main objective of the dissertation is to analyze
how foreign aid is allocated under the current system, how such allocation takes into account
the quality of recipients’ governance, and how current allocation patterns might have
affected the aid effectiveness, i.e., in promoting development outcomes in recipient
countries. The purpose of this chapter is to describe a conceptual approach and heuristic
model that outlines basic causal relationships between foreign aid, governance and
development outcomes, and present propositions that will be tested in subsequent sections.
This chapter also presents the testable hypothesis and specifications of empirical equations
for econometric analysis of aid effectiveness. Lastly in this chapter I present the theoretical
model of aid allocation that characterizes the optimal rent extraction-efficiency tradeoff faced
by the donors when designing their aid allocation policies and develop testable hypotheses
for econometric estimation.
4.1. Conceptual Framework
In reality, as suggested by previous studies, multiple factors influence the allocation
of foreign aid and its effectiveness. In order to improve the effectiveness of foreign aid,
donors aid allocation decisions should be guided by evaluation of the results of past policies.
Nevertheless, previous research on the topic rarely linked the effectiveness of official
development assistance to foreign aid allocation policies. Studies aiming to explain
determinants of aid flows do not consider effectiveness issues and vice versa. This dissertation
addresses this weakness by linking aid allocation policies and development effectiveness
through recipients’ quality of governance. Diagram 1 presents a simple heuristic framework
(omitting some plausible factors and relationships) for understanding the relationship
56
between foreign aid, governance and development outcomes31. The arrows in the diagram
represent the links among the respective variables, and potential direction of the causal
linkage. Within this simple framework, there are three transmission channels by which aid
might influence development outcomes. The first transmission channel is through its
potential impact on easing government budget constraints and investment needs of recipient
countries. Depending on the nature of government’s fiscal response and the degree of aid
fungibility, foreign aid may lead to greater consumption and investment or reduced taxation.
The second channel is through its interrelationship with governance and policy.
Foreign aid might encourage governments to improve the quality of governance and policy
or support bad governance and unsustainable policies damaging long-term development
prospectus.
The third channel is through improving the access to international capital markets.
In general, differences in access to international private capital markets have important
implications for foreign aid allocation and effectiveness. Foreign aid, through its positive
impact on governance, policies and economic infrastructure, might lead to increased access
to international capital markets and, thus, decrease the aid dependency. The magnitude and
composition of foreign direct investment and changes in sovereign and corporate credit
ratings might serve as approximate measures of the access to international private capital
markets.
As figure 4.1 shows, there are complex interactions between governance, foreign
private capital, public expenditures and growth outside of foreign aid. While I try to control
for other transmission channels in the analysis, my main focus is in the interaction of
governance and aid flows. What role does governance play in recipient countries in donors’
aid allocation policies? And how do aid allocation patterns impact the aid effectiveness?
Why is there a concern about the quality of governance? How is governance defined?
What dimensions of governance are important for promoting development outcomes? How
31 In developing this simple framework, I benefited from George Mavrotas (2003). Assessing Aid Effectiveness in Uganda: An Aid-Disaggregation Approach, Oxford Policy Management, Oxford, UK
57
is it measured? The most important reason is that, as evidenced in chapter 3, theory and
evidence suggest that countries with good governance are more likely to achieve better
development outcomes, including income per capita, educational attainment, health and so
forth (Knack and Keefer, 1995; Mauro, 1995; Hall and Jones, 1999; Acemoglu, Johnson
and Robinson, 2001 and 2002; Feng 2003, Baldacci at el, 2004; and many others)32. Also
recent research identifies poor governance as a major reason for ineffective public spending
(Mauro 1998, Abed and Gupta 2002, Rajkumar and Swaroop 2002). Since foreign
assistance works similarly to public spending in many ways, the lack of control for
governance could plausibly lead to biased and inconsistent results regarding aid effectiveness
in some previous studies.
In this context, as suggested by Mavrotas (2003), there could be two contrasting
experiences within which individual national practice may lie. At one extreme, foreign
assistance may contribute to a virtuous circle of development through initiating required
institutional and policy changes, relaxing savings and foreign exchange constraints, and
easing the access to international capital markets. The experiences of several Asian countries,
such as Korea Republic, Taiwan, and some others, appear to lie close to this extreme. These
countries benefited from extensive foreign assistance in earlier years, allowing them to
develop their economies and build democratic governance. At the other extreme, foreign
assistance may contribute to a vicious circle by delaying necessary institutional and policy
reforms, and encouraging rent seeking behavior and corruption both within society and
inside government structures. The experiences of many countries in Sub-Saharan Africa
appear to lie close to this extreme.
Given this discussion, it is then appropriate to hypothesize an important role for the
quality of governance in analyses of aid effectiveness and allocation. A focus on governance
does not imply that the variables emphasized by previous studies are unimportant, but it
32 It is necessary to mention that there are some economists who support the reverse idea, namely growth in income and human capital causes institutional improvement. This line of research is most closely associated with the work of Seymour Martin Lipset (1960) and seems to accord well with the experiences of South Korea and Taiwan, which grew rapidly under one-party autocracies and eventually turned to democracy. Glaeser et al (2004) is most recent work in this line.
58
does lead to a different emphasis in empirical inquiries. In this dissertation, the simple
hypothesis is that differences in governance and their interactions with different categories of
aid flows play an indispensable role in exploring the effectiveness of foreign aid in promoting
development outcomes.
If differences in governance and their interaction with different categories of foreign
aid were often a decisive influence on aid effectiveness, then the lack of control for these
interactions would plausibly lead to biased and inconsistent results regarding aid
effectiveness. By explicitly incorporating governance into the model, this dissertation helps
to mitigate this problem. This allows us to evaluate the role of governance in improving the
impact of aid in order to inform critical policy questions such as the allocation of aid
between recipient countries.
As mentioned in the previous chapter, there are several definitions of governance. It
is sometimes narrowly defined in terms of public sector management. However, in this
study, a broad and comprehensive view of governance is taken; governance is defined as the
combination of rules and institutions by which a country is governed. This includes (1) the
way governments are selected, monitored and replaced, (2) the capacity of the government to
effectively formulate and implement policies, and (3) the respect of citizens and the state for
the rules and institutions that govern political, social, and economic interactions among
them (Kauffmann, Kray, and Maztruzzi, 2003).
There are a number of approaches to measuring the quality of governance. In this
dissertation, I use two dimensions of governance. First, the democratic quality of governance
is approximated by combination of political rights and civil liberties indicators from
Freedom House. Second, the institutional quality of governance is approximated by rule of
law, bureaucratic quality, stability of government, and corruption indicators from the
International Country Risk Guide. The detailed discussion of these and other measures of
governance, and issues related to using them in empirical panel analysis is provided in the
next chapter.

59
Figure 4.1. Outline of Basic Causal Relationships Between Foreign Aid, Governance and Development Outcomes33
33 In developing this heuristic framework I have benefited from Mavrotas, George, Assessing Aid Effectiveness in Uganda: An Aid-Disaggregation Approach, Oxford Policy Management, Oxford, U.K., 2003
Foreign Aid
Foreign Private Capital
Governance and
Policy
Public Expenditures and
Domestic Investment
Domestic Private
Investment Growth
Poverty ReductionEducation
Health
Aid SelectivityAccess to International
Capital Markets and Aid
Dependency
Fiscal Response
Interaction of Aid with Governance
and Policy
60
Furthermore, as seen earlier, past research on this topic has mainly focused on
aggregate aid flows trying to match aid flows to a realistic time period over which they might
influence economic growth and other development outcomes34. However, as OECD’s DAC
suggests that aid flows are allocated to different sectors depending on “which specific area of
recipient’s economic or social structure is the transfer intended to foster”35. While one
category of contributions might intend to promote education, another category might intend
to foster agricultural development, and third category might just aim to provide balance-of-
payments support. These different categories of aid flows might not influence the economic
growth in the same way and uniformly. Also, it is plausible to expect that the interactions of
different categories of aid with various levels of governance in recipient countries will
produce different results.
One category of aid might help to foster economic development in a recipient
country by building physical capital while another type of aid might harm incentive
structures and encourage rent seeking behavior. Therefore, any evaluation of aid effectiveness
trying to estimate the impact of aggregate aid flows on economic growth and other
development outcomes is flawed. However, one can mitigate this conundrum to the degree
so one can disaggregate aid flows and isolate the impact of these disaggregated aid flows on
development outcomes.
Therefore, in contrast to most existing studies and in spirit of Clemens et al (2004), I
disaggregate aggregate aid into four categories and link the allocation and effectiveness of
sectoral aid flows to the recipients’ governance. However, differently from Clemens et al, I
disaggregate aggregate aid flows based on which specific sectors of recipient’s economy are
transfers intended to promote.
My evaluation approach is based on panel data regression for aid effectiveness and aid
allocation. The specifications of these equations are derived from an augmented neoclassical
34 As we discussed in previous chapters only few studies attempted to disaggregate aid flows. 35 OECD DAC “CRS Aid Activities documentation”

61
growth model and aid allocation model described in subsequent sections, and consistent with
the literature.
In disaggregating aid flows by sector, I follow the standard OECD classification.
Figure 4.2 provides a skeletal diagram of the disaggregated aid flows and their potential
impact. The four mutually exclusive, collectively exhaustive aid categories include the
following:
• Aid to production sectors is defined as aid funding for projects in agriculture,
manufacturing, mining, construction, trade, and tourism industries. This aid should
plausibly help recipient countries to accumulate physical capital.
• Aid to economic infrastructure is defined as an aid to build networks and services
that facilitate economic activity. This type of aid goes to energy distribution, auto
and railroad construction, equipment for communication and electronic networks,
and to financial infrastructure. This aid should probably help recipient countries by
improving the overall economic efficiency and boosting the demand for investment.
• Aid to social sector, including education, health, and water supply. This aid is more
likely to help recipients to build their human capital.
• The remaining aid flows are combined with other aid. This includes assistance for
the environment, gender projects, food aid, action relating to debt, budget and
balance of payments support, emergency and distress relief, aid for refugees, etc. This
aid has no pre-imposed sectoral allocation and is intended to smooth short-term
fluctuations or to support longer-term activities.
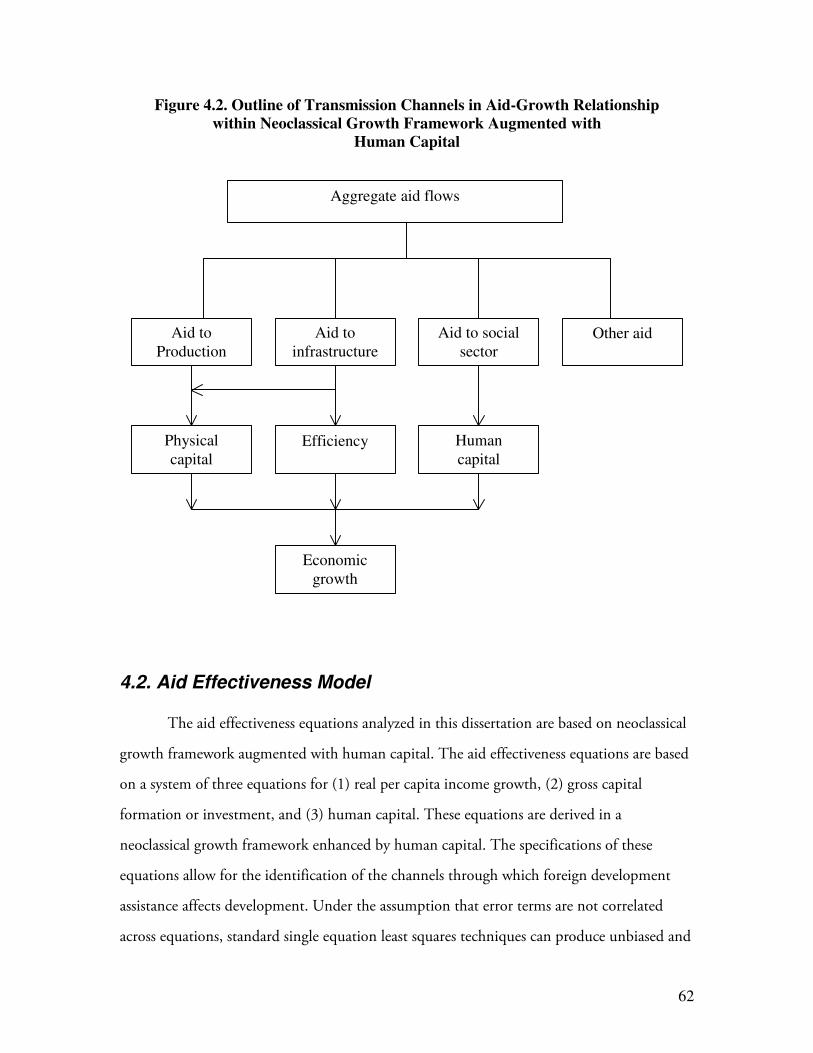
62
Figure 4.2. Outline of Transmission Channels in Aid-Growth Relationshipwithin Neoclassical Growth Framework Augmented with
Human Capital
Aggregate aid flows
Aid to Production
Aid to infrastructure
Aid to social sector
Other aid
Physical capital
Efficiency Human capital
Economic growth
4.2. Aid Effectiveness Model
The aid effectiveness equations analyzed in this dissertation are based on neoclassical
growth framework augmented with human capital. The aid effectiveness equations are based
on a system of three equations for (1) real per capita income growth, (2) gross capital
formation or investment, and (3) human capital. These equations are derived in a
neoclassical growth framework enhanced by human capital. The specifications of these
equations allow for the identification of the channels through which foreign development
assistance affects development. Under the assumption that error terms are not correlated
across equations, standard single equation least squares techniques can produce unbiased and
63
efficient estimates for each equation. However, there will be feedback structures between
these equations and thus, error terms across equations are likely to be correlated. Some other
estimation techniques, such as structural equation modeling or seemingly unrelated
equations (SUR) regression, might improve the precision of estimates, but appropriate
software was not available. The results here, based on single equation methods, remain
unbiased and the standard errors are correct even without using such multiple equation
methods.
I will test the following three hypotheses:
(1) Aid to production sector impacts the economic growth through its
impacts in capital accumulation by enlarging the pool of resources
available for investment and growth. If foreign aid to the production
sector supplements the domestic resources then the impact of this sectoral
aid flows on investment should be positive. If foreign aid substitutes for
domestic resources rather than supplementing them, then its impact on
investment and growth could be negative or trivial. There are two
plausible cases when aid flows might substitute for domestic resources.
First, since aid flows are similar to public investment, they may crowd out
private investment. Second, if a recipient is able to reduce its own public
investment expenditures and replace them by foreign aid. Further, I
assume that the magnitude and sign of this impact could be affected by
the quality of governance in recipient country. Therefore, aid to the
production sector enters the investment equation by its interactions with
the quality of governance. In general, one might expect that the impact of
better governance on the effect of aid to production sector would be
positive. Even in a favorable policy environment, however, this impact
might be negative or trivial, particularly if foreign aid causes crowding out
effect. Vice versa foreign aid might help raise the level of investment in
countries with poor governance if (1) it helps to ease the constraints on

64
public funds available for necessary public investments and (2) it funds
profitable investment projects in the private sector.
(2) As mentioned before, aid to economic infrastructure might impact growth
through one of or more of the three potential channels of influence. First,
it may improve total productivity in the economy. If it does so at all, it
must do so by reducing the private cost of production. For example, a
reduction of communication costs can make international knowledge
more accessible to local businesses and other establishments. Thus it
seems likely that countries with better communication infrastructure will
have easier and cheaper access to knowledge stocks, which in turn, should
lead to higher rates of total productivity growth. However, empirical
evidence suggests that in least developed countries economic growth is
primarily input-driven, i.e., capital accumulation and utilization of
additional labor, and that total factor productivity increases are negligible
if not zero (Forstner et al 2001, Krugman 1994, Young 1995, Collins and
Bosworth 1997). Therefore, one can expect this impact to be very small if
it does exist at all. Second, aid to economic infrastructure by improving its
quality may reduce cost of capital, and therefore increase the demand for
investment. Third, aid to economic infrastructure directly adds to
investment and helps to ease the constraints on public funds available for
necessary public investments. Correspondingly, I assume that the
magnitude and sign of these impacts could be affected by the quality of
governance in a recipient country. Hence, the interactions of aid to
economic infrastructure with governance enter both growth and
investment equations with one period lag.
(3) Aid to social sector aims to improve human capital and living standards in
recipient countries, for example, by supporting primary education or basic
health care. Therefore, it is expected that this portion of aid may impact

65
the growth by creating additional human capital. The interactions of aid
to social sector with governance enter the human capital equation.
4.2.1. Growth Equation4.2.1. Growth Equation4.2.1. Growth Equation4.2.1. Growth Equation
Drawing upon Mankiw, Romer, and Weil (1992), Barro (1996), Bassanini and
Scarpetta (2001), Bassanini et al (2004), Bloom and Sevilla (2004) and others, the growth
equation is based on a neoclassical growth model augmented by human capital. The per
capita output equation is assumed to take the following form:
y = f (k, h, Gov, A, X)
where y is real per capita gross domestic product; k denotes the capital labor ratio; h is
human capital; Gov and A denotes governance and aid variables, respectively, and X denotes
the set of other variables that may affect real per capita GDP. The latter may include quality
of governance and development aid variables along with inflation, trade openness, and
financial depth that further augment the neoclassical growth model with human capital.
Additionally, I assume there is a relationship between the lagged interactions of
development assistance that goes into economic infrastructure and the recipient countries’
quality of governance. Following Baldacci et al (2004), it is also assumed that both the initial
stock and incremental human capital affect per capita economic growth. This is an
important assumption because I propose that aid that goes to social sector may impact the
growth of per capita GDP by helping the recipient countries to build human capital. Hence,
the following equation describes the growth (g) of real per capita GDP36:
g = f Hsk, h, ∆h, Gov, X, AL
where sk is the net investment (incremental capital), h denotes the stock of human capital,
and óh is the change in human capital, Gov, X and A denote governance, aid and other
control variables. I approximate human capital mainly by years of schooling and add lagged
36 A detailed derivation of the growth specification, based on Bassanini and Scarpetta (2001), and Bassanini, Scarpetta and Hemmings (2001), is provided in Appendix 2.
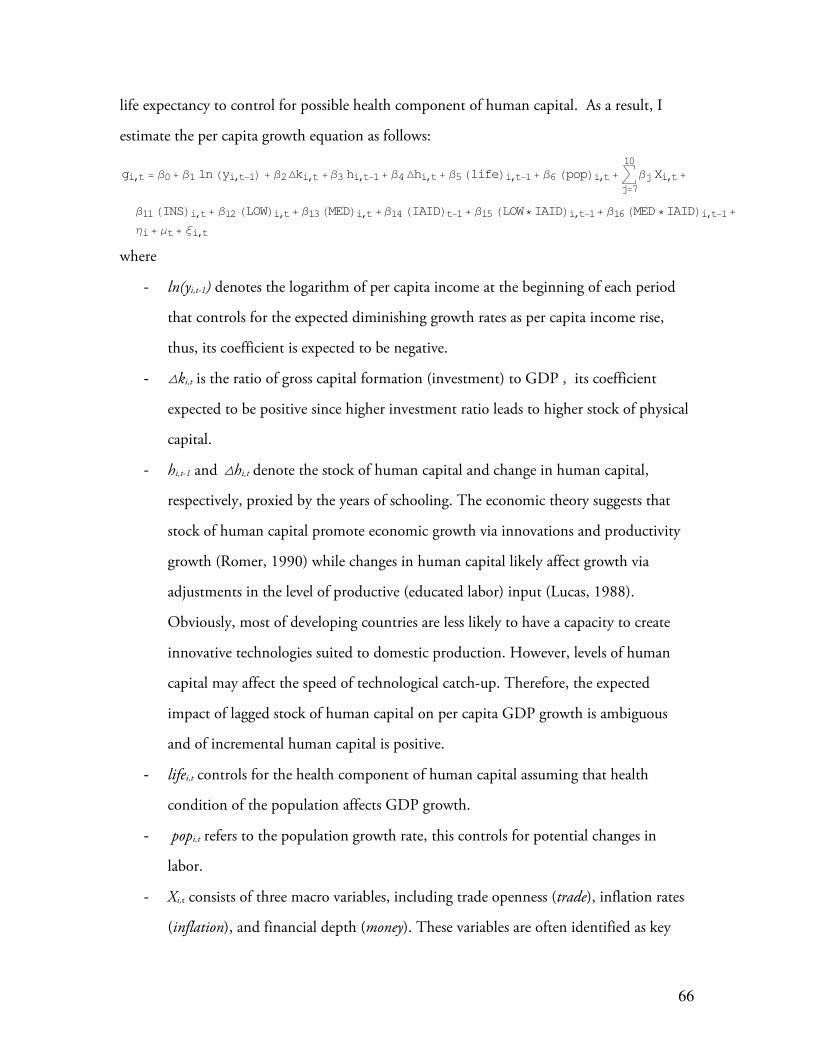
66
life expectancy to control for possible health component of human capital. As a result, I
estimate the per capita growth equation as follows:
gi,t = β0+ β1 ln Hyi,t−1L + β2 ∆ki,t + β3 hi,t−1+ β4 ∆hi,t+ β5 HlifeLi,t−1+ β6 HpopLi,t+ ‚j=7
10βj Xi,t+
β11 HINSLi,t+ β12 HLOWLi,t+ β13 HMEDLi,t + β14 HIAIDLt−1+ β15 HLOW∗IAIDLi,t−1+ β16 HMED∗IAIDLi,t−1+
ηi+ μt+ ξi,t
where
- ln(yi,t-1) denotes the logarithm of per capita income at the beginning of each period
that controls for the expected diminishing growth rates as per capita income rise,
thus, its coefficient is expected to be negative.
- óki,t is the ratio of gross capital formation (investment) to GDP , its coefficient
expected to be positive since higher investment ratio leads to higher stock of physical
capital.
- hi,t-1 and óhi,t denote the stock of human capital and change in human capital,
respectively, proxied by the years of schooling. The economic theory suggests that
stock of human capital promote economic growth via innovations and productivity
growth (Romer, 1990) while changes in human capital likely affect growth via
adjustments in the level of productive (educated labor) input (Lucas, 1988).
Obviously, most of developing countries are less likely to have a capacity to create
innovative technologies suited to domestic production. However, levels of human
capital may affect the speed of technological catch-up. Therefore, the expected
impact of lagged stock of human capital on per capita GDP growth is ambiguous
and of incremental human capital is positive.
- lifei,t controls for the health component of human capital assuming that health
condition of the population affects GDP growth.
- popi,t refers to the population growth rate, this controls for potential changes in
labor.
- Xi,t consists of three macro variables, including trade openness (trade), inflation rates
(inflation), and financial depth (money). These variables are often identified as key
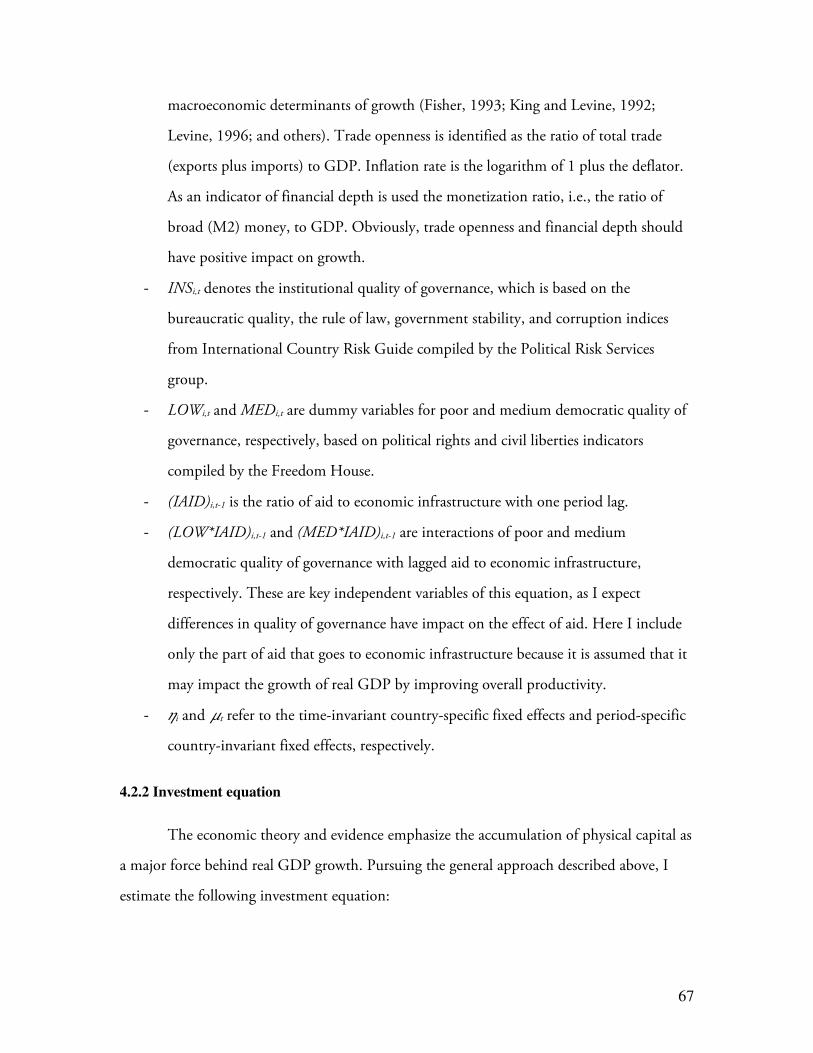
67
macroeconomic determinants of growth (Fisher, 1993; King and Levine, 1992;
Levine, 1996; and others). Trade openness is identified as the ratio of total trade
(exports plus imports) to GDP. Inflation rate is the logarithm of 1 plus the deflator.
As an indicator of financial depth is used the monetization ratio, i.e., the ratio of
broad (M2) money, to GDP. Obviously, trade openness and financial depth should
have positive impact on growth.
- INSi,t denotes the institutional quality of governance, which is based on the
bureaucratic quality, the rule of law, government stability, and corruption indices
from International Country Risk Guide compiled by the Political Risk Services
group.
- LOWi,t and MEDi,t are dummy variables for poor and medium democratic quality of
governance, respectively, based on political rights and civil liberties indicators
compiled by the Freedom House.
- (IAID)i,t-1 is the ratio of aid to economic infrastructure with one period lag.
- (LOW*IAID)i,t-1 and (MED*IAID)i,t-1 are interactions of poor and medium
democratic quality of governance with lagged aid to economic infrastructure,
respectively. These are key independent variables of this equation, as I expect
differences in quality of governance have impact on the effect of aid. Here I include
only the part of aid that goes to economic infrastructure because it is assumed that it
may impact the growth of real GDP by improving overall productivity.
- hi and mt refer to the time-invariant country-specific fixed effects and period-specific
country-invariant fixed effects, respectively.
4.2.2 Investment equation
The economic theory and evidence emphasize the accumulation of physical capital as
a major force behind real GDP growth. Pursuing the general approach described above, I
estimate the following investment equation:
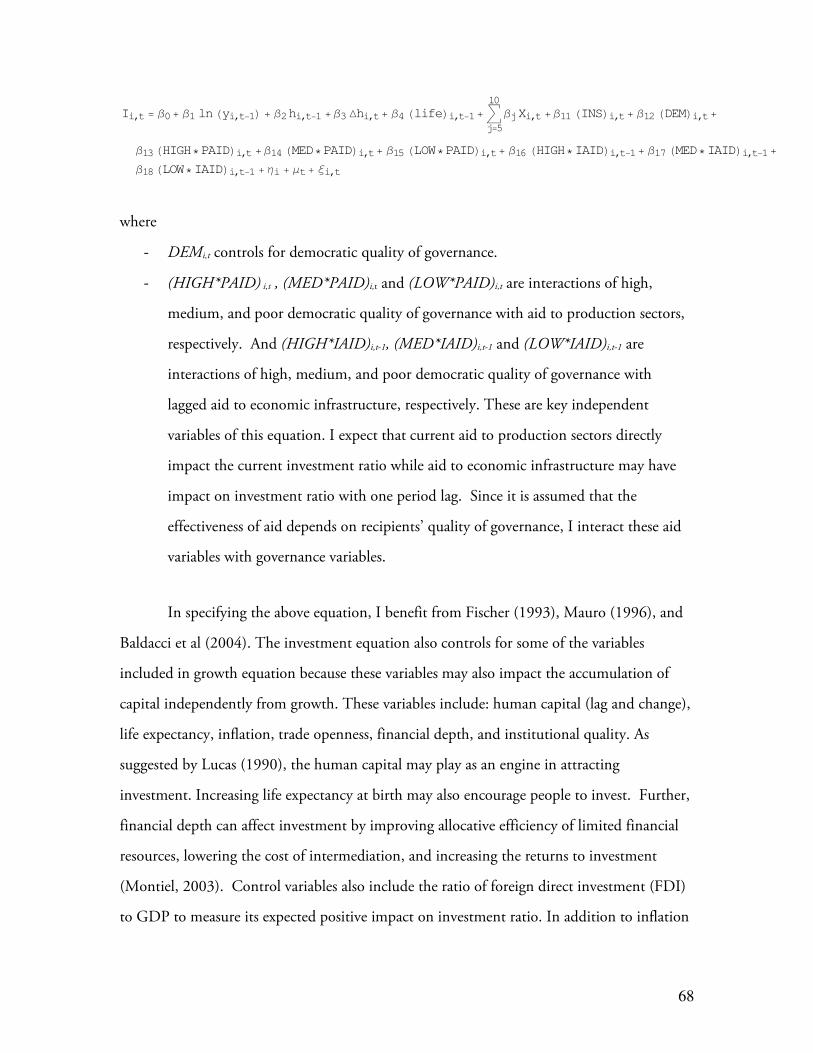
68
Ii,t = β0+ β1 ln Hyi,t−1L + β2 hi,t−1 + β3 ∆hi,t+ β4 HlifeLi,t−1+ ‚j=5
10βj Xi,t + β11 HINSLi,t+ β12 HDEMLi,t+
β13 HHIGH∗PAIDLi,t + β14 HMED∗PAIDLi,t+ β15 HLOW∗PAIDLi,t+ β16 HHIGH∗IAIDLi,t−1+ β17 HMED∗IAIDLi,t−1+
β18 HLOW∗IAIDLi,t−1 + ηi + μt+ ξi,t
where
- DEMi,t controls for democratic quality of governance.
- (HIGH*PAID) i,t , (MED*PAID)i,t and (LOW*PAID)i,t are interactions of high,
medium, and poor democratic quality of governance with aid to production sectors,
respectively. And (HIGH*IAID)i,t-1, (MED*IAID)i,t-1 and (LOW*IAID)i,t-1 are
interactions of high, medium, and poor democratic quality of governance with
lagged aid to economic infrastructure, respectively. These are key independent
variables of this equation. I expect that current aid to production sectors directly
impact the current investment ratio while aid to economic infrastructure may have
impact on investment ratio with one period lag. Since it is assumed that the
effectiveness of aid depends on recipients’ quality of governance, I interact these aid
variables with governance variables.
In specifying the above equation, I benefit from Fischer (1993), Mauro (1996), and
Baldacci et al (2004). The investment equation also controls for some of the variables
included in growth equation because these variables may also impact the accumulation of
capital independently from growth. These variables include: human capital (lag and change),
life expectancy, inflation, trade openness, financial depth, and institutional quality. As
suggested by Lucas (1990), the human capital may play as an engine in attracting
investment. Increasing life expectancy at birth may also encourage people to invest. Further,
financial depth can affect investment by improving allocative efficiency of limited financial
resources, lowering the cost of intermediation, and increasing the returns to investment
(Montiel, 2003). Control variables also include the ratio of foreign direct investment (FDI)
to GDP to measure its expected positive impact on investment ratio. In addition to inflation

69
rate, I include the high-inflation dummy to control for the possible nonlinear effects of
inflation on investment.
4.2.3. Human Capital Equation
This equation examines the impact of aid to social sector on human capital as
proxied by the years of schooling for different levels of governance quality. I benefited from
Baldacci et al (2004) in developing the following specification:
hi,t = β0+ β1 ln Hyi,tL + β2 HlifeLi,t + β3 HurbanLi,t+ β4 Hpop15Li,t+ β5 HgpiLi,t+ β6 ln HEDULi,t−1+
β7 HLOWLi,t+ β8 HMEDLi,t+ β9 HSAIDLi,t−1 + β10 HMED∗SAIDLi,t−1+ β11 HLOW∗SAIDLi,t−1+ ηi+ μt + ξi,t
where
- ln(yi,t) denotes the logarithm of current per capita income. Higher level of per capita
income is more likely to raise the demand for schooling; thus, its coefficient is
expected to be positive.
- (life)i,t-1 controls for the accumulated health assuming that healthier people will be
able to invest in education.
- (Urban)i,t denotes the share of urban population. This variable captures the effect of
superiority of education and other social services in urban areas in developing
countries.
- (Pop15)i,t is the share of population under age of 15. This variable intends to control
for age structure of population.
- (gpi)i,t denotes the gender parity indicator in education. This controls for gender
inequality in education, which is apparent in most of developing countries,
especially, in South Asia, Middle East and Africa.
- Ln(EDU)i,t-1 is the lagged five-year average of education spending. A logarithm of
education spending in percent of GDP used to control for diminishing returns to
education expenditures.
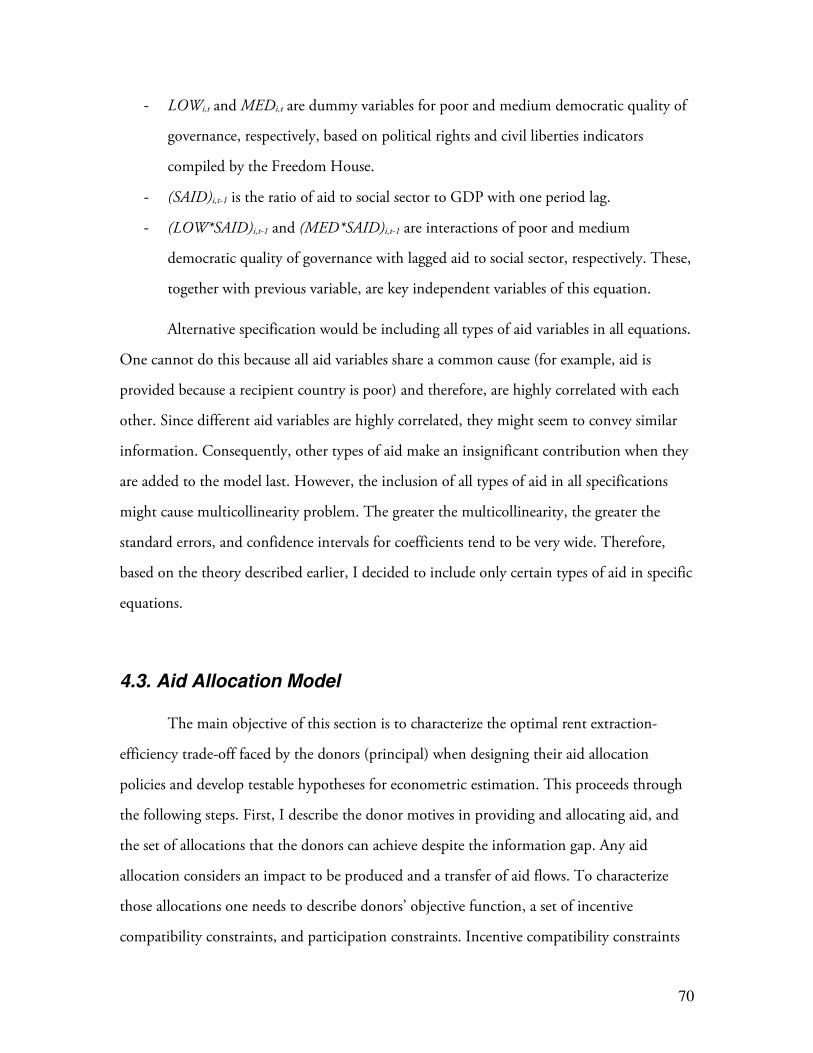
70
- LOWi,t and MEDi,t are dummy variables for poor and medium democratic quality of
governance, respectively, based on political rights and civil liberties indicators
compiled by the Freedom House.
- (SAID)i,t-1 is the ratio of aid to social sector to GDP with one period lag.
- (LOW*SAID)i,t-1 and (MED*SAID)i,t-1 are interactions of poor and medium
democratic quality of governance with lagged aid to social sector, respectively. These,
together with previous variable, are key independent variables of this equation.
Alternative specification would be including all types of aid variables in all equations.
One cannot do this because all aid variables share a common cause (for example, aid is
provided because a recipient country is poor) and therefore, are highly correlated with each
other. Since different aid variables are highly correlated, they might seem to convey similar
information. Consequently, other types of aid make an insignificant contribution when they
are added to the model last. However, the inclusion of all types of aid in all specifications
might cause multicollinearity problem. The greater the multicollinearity, the greater the
standard errors, and confidence intervals for coefficients tend to be very wide. Therefore,
based on the theory described earlier, I decided to include only certain types of aid in specific
equations.
4.3. Aid Allocation Model
The main objective of this section is to characterize the optimal rent extraction-
efficiency trade-off faced by the donors (principal) when designing their aid allocation
policies and develop testable hypotheses for econometric estimation. This proceeds through
the following steps. First, I describe the donor motives in providing and allocating aid, and
the set of allocations that the donors can achieve despite the information gap. Any aid
allocation considers an impact to be produced and a transfer of aid flows. To characterize
those allocations one needs to describe donors’ objective function, a set of incentive
compatibility constraints, and participation constraints. Incentive compatibility constraints
71
are due to information asymmetry while participation constraints are required to ensure that
recipients are willing to participate in the agreement. Incentive and participation constraints
give the set of feasible allocations. Second, once this characterization is achieved, I will
proceed to normative analysis and optimize donors’ objective function within the set of
incentive feasible allocations. Then, I investigate the impact of improvements of the donors’
information system on the optimal aid allocation.
In doing so, I implicitly apply the following assumptions that are standard for
principal-agent models (Laffont and Martimort 2002). First, it is assumed that donors and
recipients are both fully rational economic agents and maximize their own utility. Second,
there is information asymmetry between donors and recipients. Donors do not know
recipients’ private information, but the probability distribution of this information is
common knowledge. Third, the donors are expected utility maximizers.
I begin by examining potential sources of demand for foreign aid, including
objectives of each of these sources. The literature indicates two competing groups of motives
for providing aid: recipient needs and donor interests (Maizels and Nissanke 1984).
Recipients need foreign assistance to finance development while donors may pursue their
own political and economic interests in providing aid. I combine these two potentially
competing groups of rationales into a form of enlightened donors’ self-interest that
recognizes that a world with less poverty and diseases and better educated people is likely to
provide a more secure and more stable environment with more opportunities for all of the
world’s population. In this regard, the sources of demand for foreign aid can be summarized
as follows. First, citizens or taxpayers in donor countries have a real demand for foreign aid
because they want to have an impact on development outcomes in developing countries
because of genuine desire to help the poor and a belief that relatively small amount of tax
money spending on promoting development can make the world more secure and save
billions in security related expenses. Second, businesses in the developed world have demand
for foreign aid to promote their exports. Evidence suggests that a large part of aid money is
used to buy goods and services from donor country. Thus, donors are interested in

72
maximizing the total impact of aid. This allows us to describe foreign aid situation in terms
of principal-agent framework. One may assume that donors delegate to recipients the
production of impact on development and transfer foreign aid in exchange.
Now consider a donor who wants to delegate to recipients the production of h units
of impact on development outcomes. The value for the donor of these h units of impact is
H(h) where H′ > 0, H″ < 0 and H(0) = 0. The marginal value of the impact on development
is thus positive and strictly decreasing with the number of units received by the donor. In
terms of development outcomes, this impact could be an increase in per capita income and
schooling, a reduction in poverty and maternal and infant mortality, etc. The costs of
recipients are not observable to the donor, but it is common knowledge that the marginal
cost μ belongs to the set M = μ , μ. The recipient can be either efficient ( μ) or inefficient
( μ) with respective probabilities ρ and 1-ρ. I assume that the spread of uncertainty on the
recipient’s marginal cost is
. ∆μ = μ − μ >0 (1)
The variables of the problem considered thereafter are the impact produced (h)h)h)h) and
the aid transfer (a)(a)(a)(a) received by the recipient. Formally, there is a set of feasible allocations A
= h, a. Suppose there is no information asymmetry between the donors and the recipients.
The efficient allocation of aid budget is obtained by equating the donors’ marginal value of
impact and the recipients’ marginal cost. Hence, first-best allocation is obtained by the
following first order conditions
H' Hh∗L = μ (2)
. H' Hh¯∗L = μ (3)
Since the donors’ marginal value of impact is decreasing, the optimal impact levels
defined by (2) and (3) are such that h∗ >h
¯∗, i.e., the optimal level impact of an efficient
recipient is greater than that of an inefficient recipient.
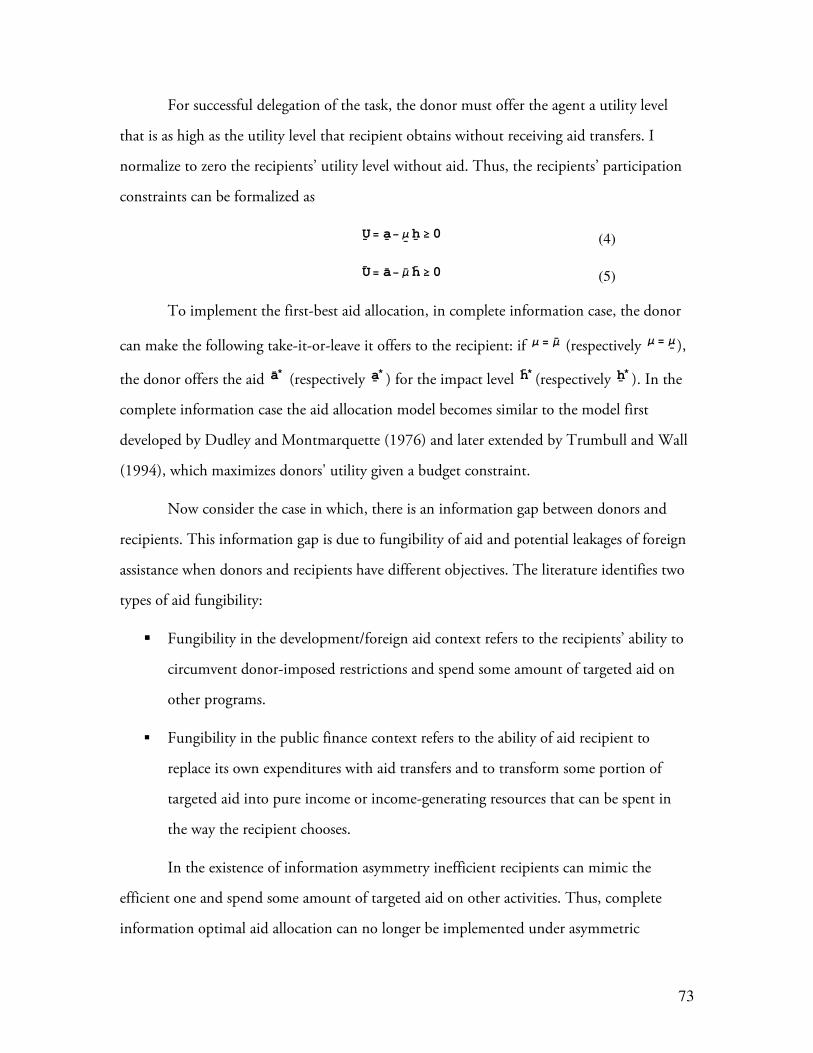
73
For successful delegation of the task, the donor must offer the agent a utility level
that is as high as the utility level that recipient obtains without receiving aid transfers. I
normalize to zero the recipients’ utility level without aid. Thus, the recipients’ participation
constraints can be formalized as
U= a− μ h ≥0 (4)
U¯
= a− μ h¯
≥0 (5)
To implement the first-best aid allocation, in complete information case, the donor
can make the following take-it-or-leave it offers to the recipient: if μ = μ (respectively μ = μ),
the donor offers the aid a∗ (respectively a
∗) for the impact level h
¯∗(respectively h
∗). In the
complete information case the aid allocation model becomes similar to the model first
developed by Dudley and Montmarquette (1976) and later extended by Trumbull and Wall
(1994), which maximizes donors' utility given a budget constraint.
Now consider the case in which, there is an information gap between donors and
recipients. This information gap is due to fungibility of aid and potential leakages of foreign
assistance when donors and recipients have different objectives. The literature identifies two
types of aid fungibility:
Fungibility in the development/foreign aid context refers to the recipients’ ability to
circumvent donor-imposed restrictions and spend some amount of targeted aid on
other programs.
Fungibility in the public finance context refers to the ability of aid recipient to
replace its own expenditures with aid transfers and to transform some portion of
targeted aid into pure income or income-generating resources that can be spent in
the way the recipient chooses.
In the existence of information asymmetry inefficient recipients can mimic the
efficient one and spend some amount of targeted aid on other activities. Thus, complete
information optimal aid allocation can no longer be implemented under asymmetric

74
information. Using the language of incentive theory, one can say that complete information
aid allocation is not incentive compatible. That is why incentive compatibility constraints
have to be added to the complete information optimal aid allocation model. Further, under
complete information, I assumed that donors are able to maintain all types of recipients at
their zero status quo utility level. However, since donors want to allocate aid to all types of
recipients this will not be possible when there is information asymmetry. Inefficient
recipients would get some information rent by mimicking an efficient recipient:
U= a− μ h¯
= a− μ h¯
+∆μ h¯
= U¯
+ ∆μ h¯
(6)
where the first term is zero status quo utility level of efficient recipient and second term is
information rent coming from inefficient recipients ability to mimic the efficient recipient.
Since donors want to allocate some positive amount of aid to less efficient recipients, donors
have to give up some positive information rent to relatively inefficient recipients. For
simplicity, I denote the respective information rents of efficient and inefficient recipients as
U and U¯
.
Now I can formalize donors’ utility maximization problem. The respective expected
utilities that donor gets from allocating aid to efficient and inefficient types of recipients are
ρ HH HhL− aL and H1− ρL IH Hh¯L − aM
The expected information rent can be written as
ρ U+H1− ρL U¯
So donors will maximize the expected total utility from allocating aid between
efficient and inefficient recipients minus the expected information rent of the recipients, i.e.,
maxa,h
9ρ HH HhL− aL +H1− ρL IH Hh¯L− aM= − 9ρ U+H1− ρL U¯ =
(7)
subject to incentive compatibility, participation and budget constraints.
The incentive compatibility constraints can be written as:
a− μ h ≥ a− μ h¯
(8)
a− μ h¯
≥ a− μ h (9)
The participation constraints are same as in (4) and (5):
U= a− μ h ≥0
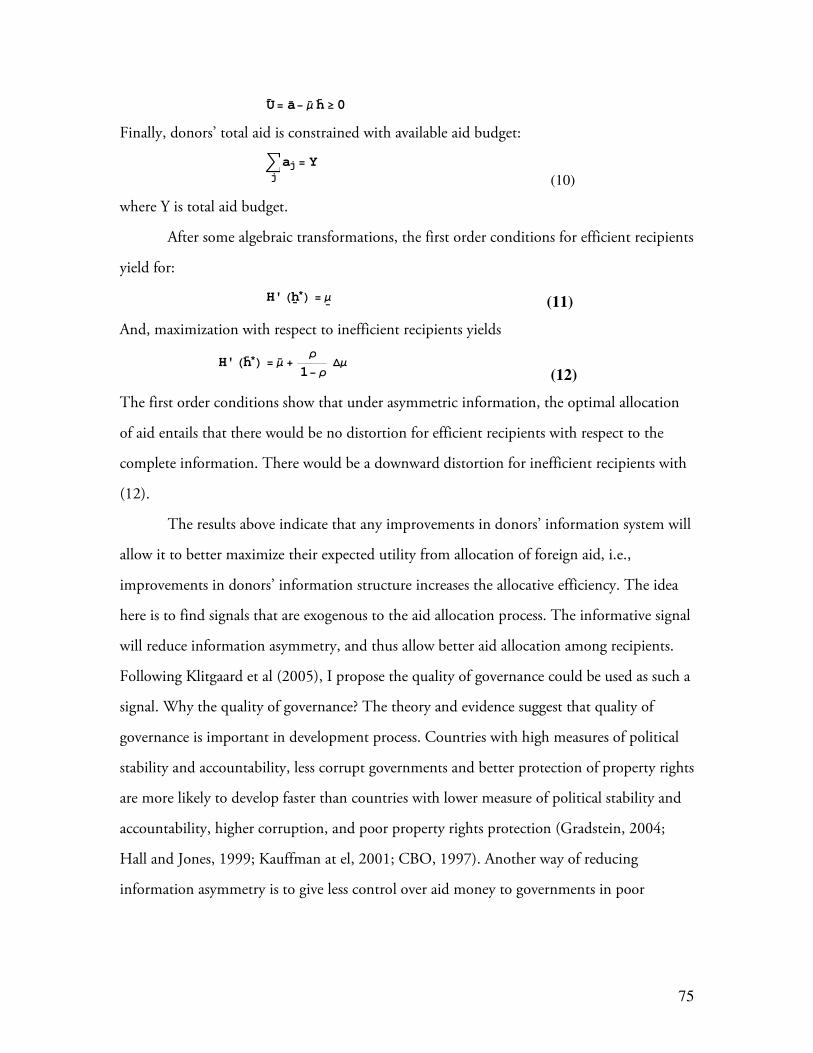
75
U¯
= a− μ h¯
≥0
Finally, donors’ total aid is constrained with available aid budget:
‚j
aj = Y
(10)
where Y is total aid budget.
After some algebraic transformations, the first order conditions for efficient recipients
yield for:
H' Hh∗L = μ (11)
And, maximization with respect to inefficient recipients yields
H' Hh¯∗L = μ +ρ
1− ρ ∆μ
(12)
The first order conditions show that under asymmetric information, the optimal allocation
of aid entails that there would be no distortion for efficient recipients with respect to the
complete information. There would be a downward distortion for inefficient recipients with
(12).
The results above indicate that any improvements in donors’ information system will
allow it to better maximize their expected utility from allocation of foreign aid, i.e.,
improvements in donors’ information structure increases the allocative efficiency. The idea
here is to find signals that are exogenous to the aid allocation process. The informative signal
will reduce information asymmetry, and thus allow better aid allocation among recipients.
Following Klitgaard et al (2005), I propose the quality of governance could be used as such a
signal. Why the quality of governance? The theory and evidence suggest that quality of
governance is important in development process. Countries with high measures of political
stability and accountability, less corrupt governments and better protection of property rights
are more likely to develop faster than countries with lower measure of political stability and
accountability, higher corruption, and poor property rights protection (Gradstein, 2004;
Hall and Jones, 1999; Kauffman at el, 2001; CBO, 1997). Another way of reducing
information asymmetry is to give less control over aid money to governments in poor
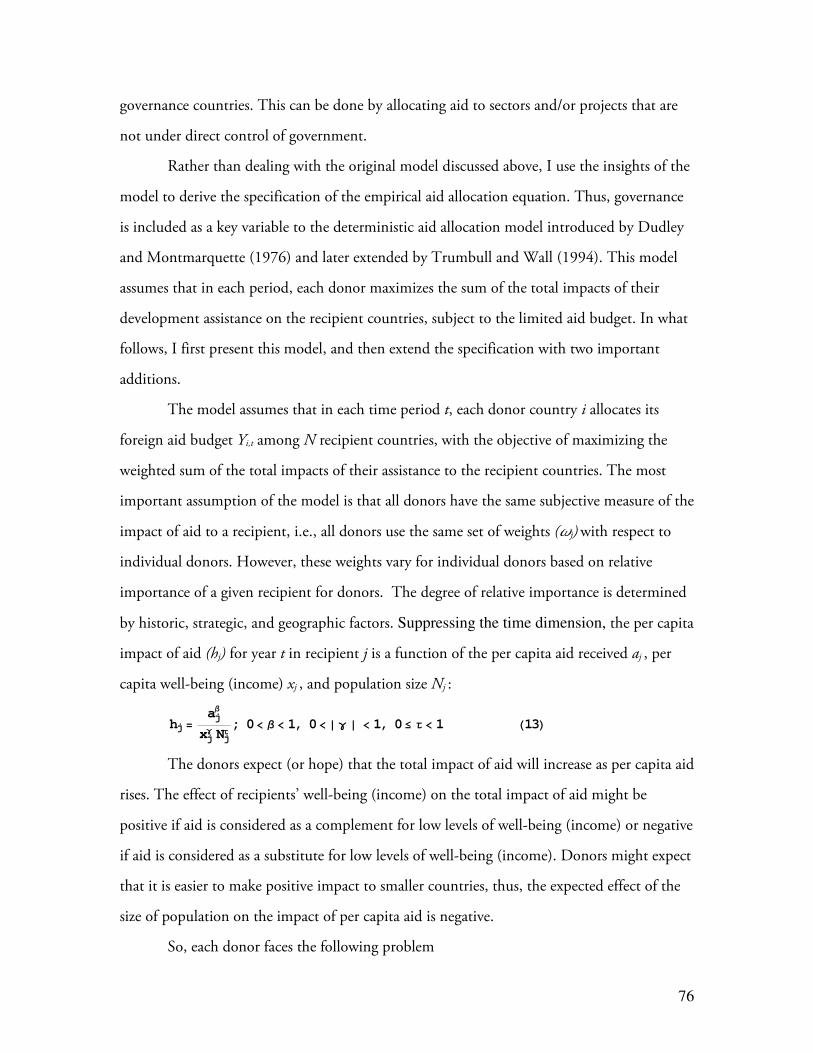
76
governance countries. This can be done by allocating aid to sectors and/or projects that are
not under direct control of government.
Rather than dealing with the original model discussed above, I use the insights of the
model to derive the specification of the empirical aid allocation equation. Thus, governance
is included as a key variable to the deterministic aid allocation model introduced by Dudley
and Montmarquette (1976) and later extended by Trumbull and Wall (1994). This model
assumes that in each period, each donor maximizes the sum of the total impacts of their
development assistance on the recipient countries, subject to the limited aid budget. In what
follows, I first present this model, and then extend the specification with two important
additions.
The model assumes that in each time period t, each donor country i allocates its
foreign aid budget Yi,t among N recipient countries, with the objective of maximizing the
weighted sum of the total impacts of their assistance to the recipient countries. The most
important assumption of the model is that all donors have the same subjective measure of the
impact of aid to a recipient, i.e., all donors use the same set of weights (wj) with respect to
individual donors. However, these weights vary for individual donors based on relative
importance of a given recipient for donors. The degree of relative importance is determined
by historic, strategic, and geographic factors. Suppressing the time dimension, the per capita
impact of aid (hj) for year t in recipient j is a function of the per capita aid received aj , per
capita well-being (income) xj , and population size Nj :
hj =aj
β
xjγ Njτ
; 0< β < 1, 0<» γ » < 1, 0≤ τ < 1 H13L
The donors expect (or hope) that the total impact of aid will increase as per capita aid
rises. The effect of recipients’ well-being (income) on the total impact of aid might be
positive if aid is considered as a complement for low levels of well-being (income) or negative
if aid is considered as a substitute for low levels of well-being (income). Donors might expect
that it is easier to make positive impact to smaller countries, thus, the expected effect of the
size of population on the impact of per capita aid is negative.
So, each donor faces the following problem
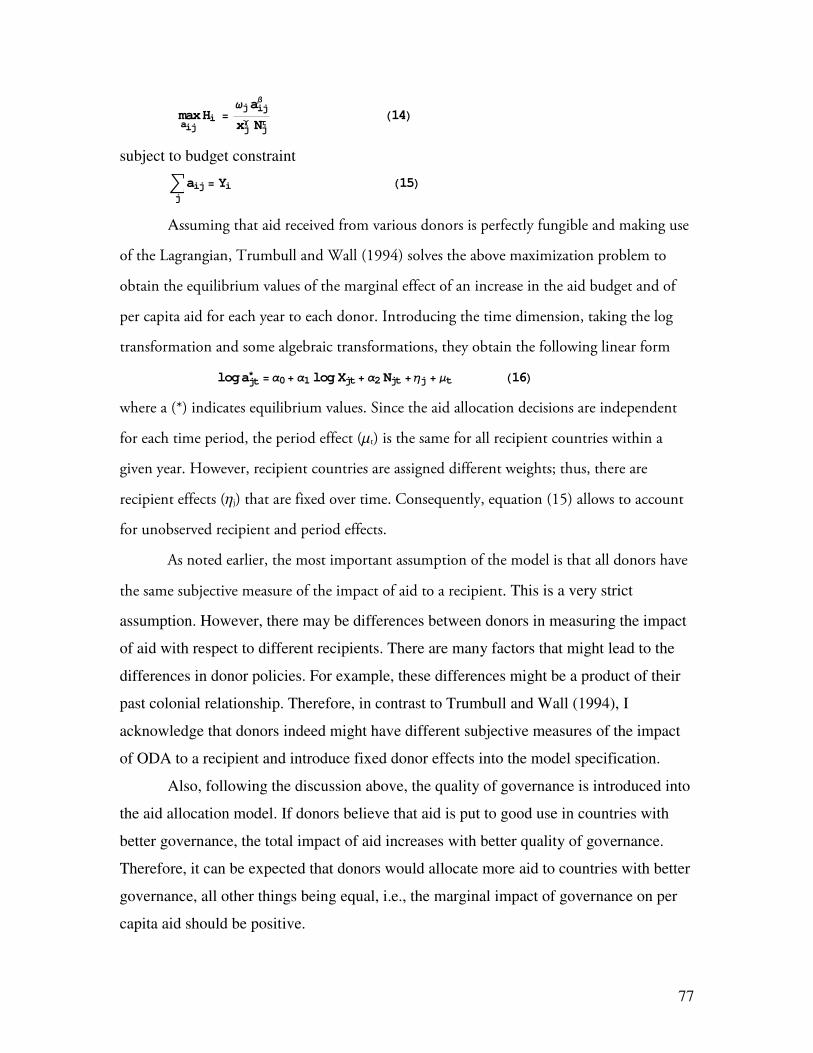
77
maxaij
Hi =ωj aij
β
xjγ Njτ
H14L
subject to budget constraint
‚j
aij = Yi H15L
Assuming that aid received from various donors is perfectly fungible and making use
of the Lagrangian, Trumbull and Wall (1994) solves the above maximization problem to
obtain the equilibrium values of the marginal effect of an increase in the aid budget and of
per capita aid for each year to each donor. Introducing the time dimension, taking the log
transformation and some algebraic transformations, they obtain the following linear form
logajt∗ = α0+ α1 log Xjt+ α2 Njt +ηj + μt H16L
where a (*) indicates equilibrium values. Since the aid allocation decisions are independent
for each time period, the period effect (mt) is the same for all recipient countries within a
given year. However, recipient countries are assigned different weights; thus, there are
recipient effects (hj) that are fixed over time. Consequently, equation (15) allows to account
for unobserved recipient and period effects.
As noted earlier, the most important assumption of the model is that all donors have
the same subjective measure of the impact of aid to a recipient. This is a very strict
assumption. However, there may be differences between donors in measuring the impact
of aid with respect to different recipients. There are many factors that might lead to the
differences in donor policies. For example, these differences might be a product of their
past colonial relationship. Therefore, in contrast to Trumbull and Wall (1994), I
acknowledge that donors indeed might have different subjective measures of the impact
of ODA to a recipient and introduce fixed donor effects into the model specification.
Also, following the discussion above, the quality of governance is introduced into
the aid allocation model. If donors believe that aid is put to good use in countries with
better governance, the total impact of aid increases with better quality of governance.
Therefore, it can be expected that donors would allocate more aid to countries with better
governance, all other things being equal, i.e., the marginal impact of governance on per
capita aid should be positive.
78
Based on these considerations, I change the equation (16) by introducing a donor
subscript, governance, donor effects and other control variables. Thus, we obtain the
following specification of the aid allocation model that allows us to estimate the marginal
effects of the three groups of independent variables on aid allocation while isolating
unobserved donor, recipient and period effects:
Aid i,j,t = α0+ α1 Zi,j,t+ α2 Xj,t + α3 HGOVLj,t+ δi+ ηj+ μt + ξi,j,t (17)
where
- Z is a matrix of time-variant strategic and economic relationships between a donor
and a recipient. This includes donors’ exports to recipient countries and political
similarities between donors and recipients as revealed by the voting behavior in the
UN General assembly.
- X is a matrix of time-variant control variables for recipient-country j at time t. This
includes per capita GDP, population size, life expectancy at birth, amount of aid
received from other donors, military grants received from United States, and a
dummy variable for a failed state.
- GOV denotes the key independent variable, which is quality of governance. For this
purposes, I use institutional quality and democratic quality of governance.
In this model, donors’ aid allocation decisions are motivated by two broad groups
of rationales for providing foreign aid: donors’ self-interest (strategic, political, and
economic) and altruism or recipient-needs (promoting economic development, poverty
reduction, improving schooling, reducing maternal and infant mortality). Further, the
quality of governance enters the model as an information signal that allows donors to
make judgment about potential efficiency of the utilization of their aid. The model
assumes that in each period, each donor maximizes the sum of the total impacts of their
development assistance on the recipient countries, subject to the limited aid budget.
Furthermore, for the purposes of analytical clarity, I assume that donors’ make aid
allocation decisions in two stages: eligibility and level stages37. Also, the level stage is divided
37We fully understand that, in reality, donors may make these decisions simultaneously.
79
into two: an aggregate and a sectoral level. The dependent variable is different in each stage.
In the eligibility stage, the dependent variable is a binary decision variable on whether or not
a country is deemed eligible to receive aid. Following the common usage in the aid allocation
literature, I assume a country is eligible to receive aid if it gets any positive amount of aid. At
the level stage, donors will decide how much aid to allocate in a given recipient country.
Thus, the dependent variable in this stage is the actual level of aid allocated to the eligible
country. In sectoral allocation stage, donors allocate aid among different sectors. In this
research, I deal with three subparts of aid: aid to production sectors, aid to social sectors, and
aid to economic infrastructure. Therefore, in this stage the dependent variables are: per
capita aid to production sector, per capita aid to social sector, and per capita aid to economic
infrastructure.
The linked evaluation of aid effectiveness and aid allocation by using the
specifications derived in this chapter raises a host of identification and data related issues.
These issues will be discussed in more detail in the following chapter.
80
Chapter 5. Data and Identification Strategy
This chapter addresses data and identification problems. Evaluating the effectiveness
of foreign aid and determinants of donors’ aid allocation in a cross-country setting using
panel data is plagued by several problems. These issues are related to empirical estimation
and include: the availability and quality of data, measurement errors, possible omission of
variables and unobserved heterogeneity, endogeneity or reverse causality between regressors,
autocorrelation within panels and cross-sectional correlation across panels. In the following
sections, I will provide the sources of the data, present descriptive statistics of the data,
discuss issues related to using various measures of governance in the context of panel data
analysis, discuss identification issues, and propose the estimation techniques.
5.1. Data sources and computations
A panel dataset covering both bilateral and multilateral donors, and more than 140
recipient countries from 1973 to 2002 was compiled for the purposes of this dissertation
research (see appendix 4 for a list of donors and appendix 5 for a list of recipient countries).
I utilize data from various sources38. First, the official foreign aid data for 1973-2002 are
derived from OECD Development Assistance Committee Creditor Reporting System
(CRS). The data cover all major bilateral and multilateral donors (four large bilateral donors
provide about 70 percent of total ODA/OA: U.S., Japan, France, and Germany; (figure
5.1)).
Using CRS data, I compute sectoral allocation of ODA disbursements. Probably one
of the reasons why an analysis of this kind has just started is that disaggregated aid
disbursements are not readily available. The sectoral allocation of aid disbursements must
therefore be estimated based on commitments data, which is available from CRS. In
38 A more detailed description of the data used and sources are given in Appendix 3.

81
estimating the sectoral allocation of aid disbursements, I use the approach suggested by
Clemens et al (2004). I classified 375,490 donor-recipient transactions in the CRS database
from 1973-2002 into four sectors as described earlier. Then I assume that the fraction of aid
disbursements in each of aid categories in a given period is equal to the fraction of
commitments in each category in that period.
Figure 5.1. Cumulative Bilateral Aid: 1973-2002, at constant dollars
UK
US
JapanGermany
France
Netherlands
Italy
Sweden
CanadaFinland
Other
UK US Japan Germany France Netherlands Italy Sweden Canada Finland Other
In reality, there could be some variations from this equality if there is a time gap
between commitment and disbursements. The longer the delay between commitment and
disbursement the greater is the variation from the above assumption. Clemens et al (2004)
finds that this estimation method is reliable and allows one to estimate “disaggregated
disbursements to a high degree of accuracy” except for humanitarian aid. Further, averaging
variables over five-year periods will significantly smooth the short-term fluctuations between
commitments and disbursements and reduce the measurement error. Figure 5.2 shows the
dynamics of sectoral allocation of aid flows from 1973 to 2002. It is clear from this figure
that on average about two third of total aid is allocated to infrastructure, production and
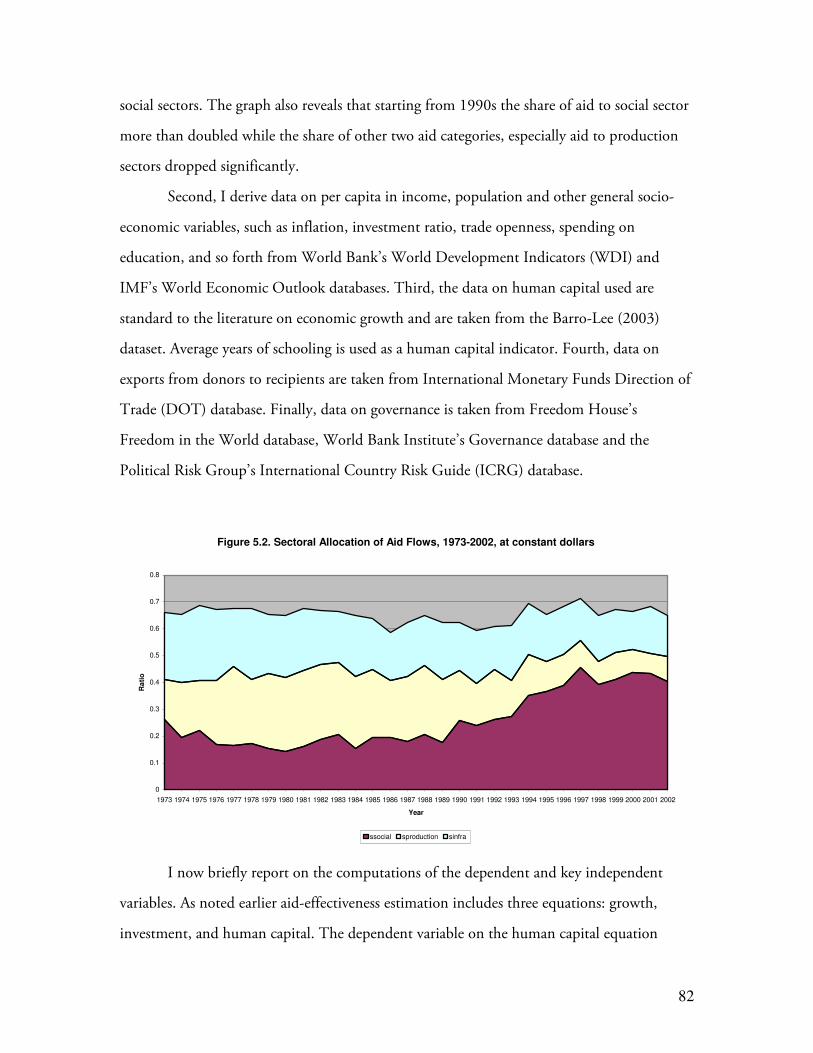
82
social sectors. The graph also reveals that starting from 1990s the share of aid to social sector
more than doubled while the share of other two aid categories, especially aid to production
sectors dropped significantly.
Second, I derive data on per capita in income, population and other general socio-
economic variables, such as inflation, investment ratio, trade openness, spending on
education, and so forth from World Bank’s World Development Indicators (WDI) and
IMF’s World Economic Outlook databases. Third, the data on human capital used are
standard to the literature on economic growth and are taken from the Barro-Lee (2003)
dataset. Average years of schooling is used as a human capital indicator. Fourth, data on
exports from donors to recipients are taken from International Monetary Funds Direction of
Trade (DOT) database. Finally, data on governance is taken from Freedom House’s
Freedom in the World database, World Bank Institute’s Governance database and the
Political Risk Group’s International Country Risk Guide (ICRG) database.
Figure 5.2. Sectoral Allocation of Aid Flows, 1973-2002, at constant dollars
0
0.1
0.2
0.3
0.4
0.5
0.6
0.7
0.8
1973 1974 1975 1976 1977 1978 1979 1980 1981 1982 1983 1984 1985 1986 1987 1988 1989 1990 1991 1992 1993 1994 1995 1996 1997 1998 1999 2000 2001 2002
Year
Rat
io
ssocial sproduction sinfra
I now briefly report on the computations of the dependent and key independent
variables. As noted earlier aid-effectiveness estimation includes three equations: growth,
investment, and human capital. The dependent variable on the human capital equation
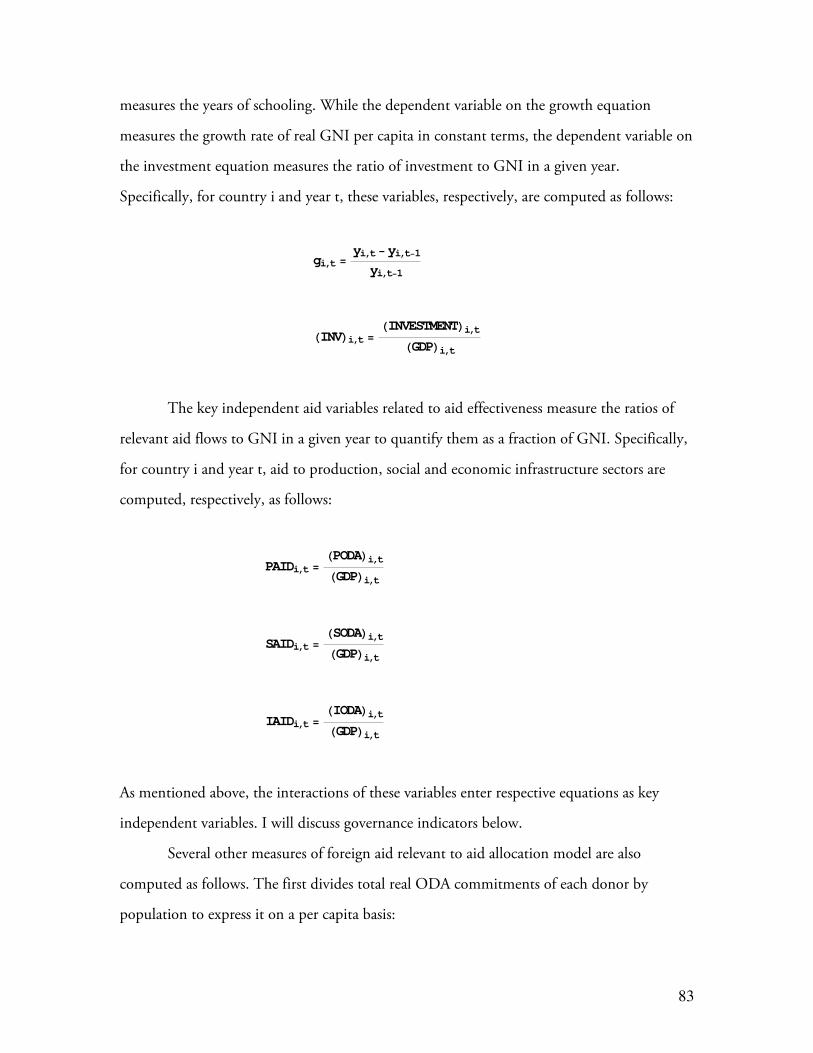
83
measures the years of schooling. While the dependent variable on the growth equation
measures the growth rate of real GNI per capita in constant terms, the dependent variable on
the investment equation measures the ratio of investment to GNI in a given year.
Specifically, for country i and year t, these variables, respectively, are computed as follows:
gi,t =yi,t−yi,t−1
yi,t−1
HINVLi,t =HINVESTMENTLi,t
HGDPLi,t
The key independent aid variables related to aid effectiveness measure the ratios of
relevant aid flows to GNI in a given year to quantify them as a fraction of GNI. Specifically,
for country i and year t, aid to production, social and economic infrastructure sectors are
computed, respectively, as follows:
PAIDi,t =HPODALi,tHGDPLi,t
SAIDi,t =HSODALi,tHGDPLi,t
IAIDi,t =HIODALi,tHGDPLi,t
As mentioned above, the interactions of these variables enter respective equations as key
independent variables. I will discuss governance indicators below.
Several other measures of foreign aid relevant to aid allocation model are also
computed as follows. The first divides total real ODA commitments of each donor by
population to express it on a per capita basis:

84
AIDPi,j,t =HODALi,j,tHPOPLi,t
To put aid flows in additional perspective, three similar measures of sectoral real
ODA commitments are constructed in a similar way:
PAIDPi,j,t =HPODALi,j,tHPOPLi,t
IAIDPi,j,t =HIODALi,j,tHPOPLi,t
SAIDPi,j,t =HSODALi,j,tHPOPLi,t
An important aspect of this study is related to governance and its relation to aid
effectiveness. There are many aspects of governance that may matter for development and aid
effectiveness. Ideally we would like to account for all possible dimensions in order to avoid
estimation problems. However, this is not a feasible approach because of the lack of sufficient
degrees of freedom. Thus, we need governance measures that have long time runs, and wide
country coverage, and that are highly correlated with other dimensions of governance.
5.2. Descriptive Statistics of the Data
This subsection will provide a brief analysis on the nature and quality of main
variables. First, univariate statistics reveal that most variables are deviated from the normal
distribution. These statistics for key variables are presented in table 5.139. The distributions
of most variables (except for growth, political rights and civil liberties) are skewed to the
right, i.e. the right tails are longer than the left tails. Also, the distributions of most variables
39 Descriptive statistics for all variables including control variables are provided in appendix 6.
85
have extremely strong peaks and more rapid decays compared to the normal distribution.
Almost all variables (except for political rights, civil liberties, log income and years of
schooling) have major outliers.
The distributions of real per capita income (income) and its log transformation
(lincome) are both skewed to the right. However, while the distribution of per capita income
is severely right tailed, the distribution of its log transformation is only mildly skewed to the
right and even becomes more symmetric over time. The median and mean of its distribution
become virtually equal over time and the spread of the distribution is relatively stable. The
growth variable has a relatively symmetric, two-tailed distribution with mild skewness (the
skewness coefficient of -0.2). However, the standard deviation and interquartile range tend
to fluctuate over time, the spread increases up to the mid-1990s and then reduces fully.
Simple average of the annual growth across all countries in the sample also tends to fluctuate,
with relatively high rates from the early 1970s up to the early 1980s. Then, however, it
contracts and again picks up starting from the mid-1990s. Average growth across all
countries fell below zero in the early 1980s and the early 1990s. While the former is
explained with worldwide debt crisis of the 1980s, the latter could be explained mostly with
a decline of income in formerly socialist countries of Eastern Europe and the Former Soviet
Union.
The measures of the center (both mean and median) and spread (standard deviation
and interquartile range) of the investment ratio (inv) fluctuate over time with a general
declining trend, while skewness and kurtosis oscillates with no particular trend. Overall,
average investment ratio across all countries steadily rises from the early 1970s to 1981 when
it peaks at 25.8 percent, then sharply drops the following year and slightly rises from the
mid-1980s to the mid-1990s, and falls thereafter. The human capital variables (average years
of schooling (syears) and change in years of schooling (syearsch)) have relatively stable
distributions over time, but the average years of schooling is moderately skewed to the right
while its change is symmetrically distributed.
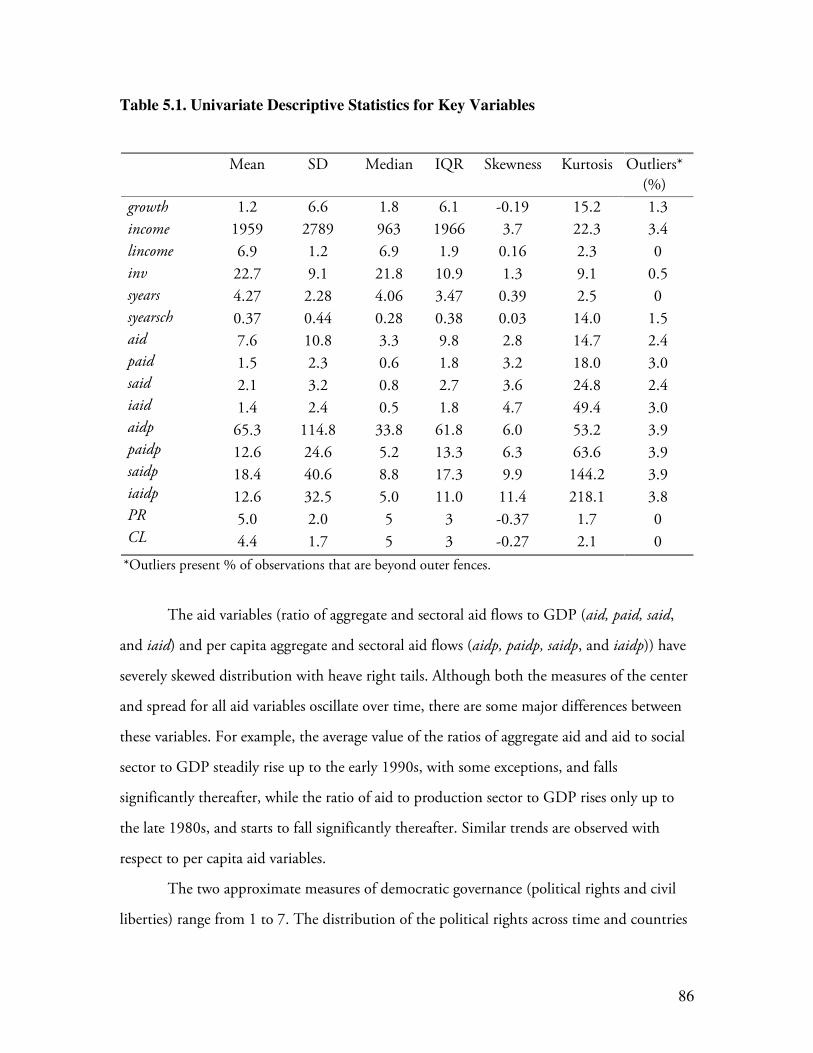
86
Table 5.1. Univariate Descriptive Statistics for Key Variables
Mean SD Median IQR Skewness Kurtosis Outliers*
(%)
growth
income
lincome
inv
syears
syearsch
aid
paid
said
iaid
aidp
paidp
saidp
iaidp
PR
CL
1.2
1959
6.9
22.7
4.27
0.37
7.6
1.5
2.1
1.4
65.3
12.6
18.4
12.6
5.0
4.4
6.6
2789
1.2
9.1
2.28
0.44
10.8
2.3
3.2
2.4
114.8
24.6
40.6
32.5
2.0
1.7
1.8
963
6.9
21.8
4.06
0.28
3.3
0.6
0.8
0.5
33.8
5.2
8.8
5.0
5
5
6.1
1966
1.9
10.9
3.47
0.38
9.8
1.8
2.7
1.8
61.8
13.3
17.3
11.0
3
3
-0.19
3.7
0.16
1.3
0.39
0.03
2.8
3.2
3.6
4.7
6.0
6.3
9.9
11.4
-0.37
-0.27
15.2
22.3
2.3
9.1
2.5
14.0
14.7
18.0
24.8
49.4
53.2
63.6
144.2
218.1
1.7
2.1
1.3
3.4
0
0.5
0
1.5
2.4
3.0
2.4
3.0
3.9
3.9
3.9
3.8
0
0
*Outliers present % of observations that are beyond outer fences.
The aid variables (ratio of aggregate and sectoral aid flows to GDP (aid, paid, said,
and iaid) and per capita aggregate and sectoral aid flows (aidp, paidp, saidp, and iaidp)) have
severely skewed distribution with heave right tails. Although both the measures of the center
and spread for all aid variables oscillate over time, there are some major differences between
these variables. For example, the average value of the ratios of aggregate aid and aid to social
sector to GDP steadily rise up to the early 1990s, with some exceptions, and falls
significantly thereafter, while the ratio of aid to production sector to GDP rises only up to
the late 1980s, and starts to fall significantly thereafter. Similar trends are observed with
respect to per capita aid variables.
The two approximate measures of democratic governance (political rights and civil
liberties) range from 1 to 7. The distribution of the political rights across time and countries
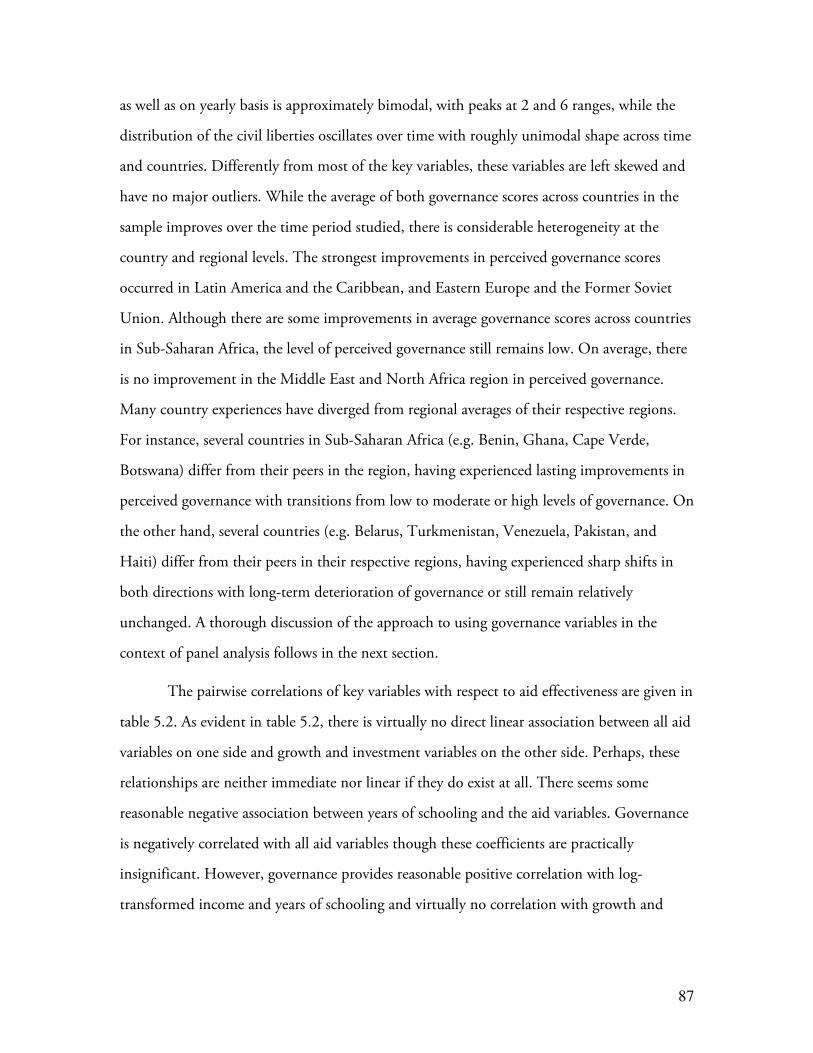
87
as well as on yearly basis is approximately bimodal, with peaks at 2 and 6 ranges, while the
distribution of the civil liberties oscillates over time with roughly unimodal shape across time
and countries. Differently from most of the key variables, these variables are left skewed and
have no major outliers. While the average of both governance scores across countries in the
sample improves over the time period studied, there is considerable heterogeneity at the
country and regional levels. The strongest improvements in perceived governance scores
occurred in Latin America and the Caribbean, and Eastern Europe and the Former Soviet
Union. Although there are some improvements in average governance scores across countries
in Sub-Saharan Africa, the level of perceived governance still remains low. On average, there
is no improvement in the Middle East and North Africa region in perceived governance.
Many country experiences have diverged from regional averages of their respective regions.
For instance, several countries in Sub-Saharan Africa (e.g. Benin, Ghana, Cape Verde,
Botswana) differ from their peers in the region, having experienced lasting improvements in
perceived governance with transitions from low to moderate or high levels of governance. On
the other hand, several countries (e.g. Belarus, Turkmenistan, Venezuela, Pakistan, and
Haiti) differ from their peers in their respective regions, having experienced sharp shifts in
both directions with long-term deterioration of governance or still remain relatively
unchanged. A thorough discussion of the approach to using governance variables in the
context of panel analysis follows in the next section.
The pairwise correlations of key variables with respect to aid effectiveness are given in
table 5.2. As evident in table 5.2, there is virtually no direct linear association between all aid
variables on one side and growth and investment variables on the other side. Perhaps, these
relationships are neither immediate nor linear if they do exist at all. There seems some
reasonable negative association between years of schooling and the aid variables. Governance
is negatively correlated with all aid variables though these coefficients are practically
insignificant. However, governance provides reasonable positive correlation with log-
transformed income and years of schooling and virtually no correlation with growth and
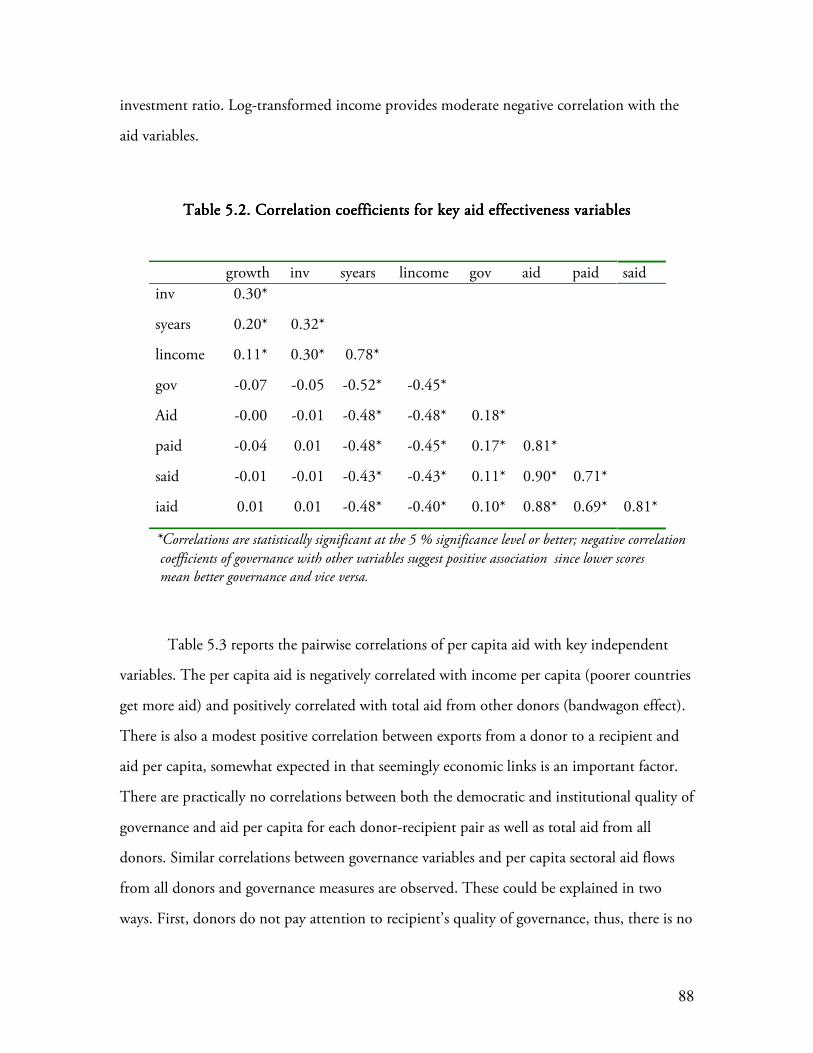
88
investment ratio. Log-transformed income provides moderate negative correlation with the
aid variables.
Table 5.2. Correlation coefficients for key aid effectiveness variablesTable 5.2. Correlation coefficients for key aid effectiveness variablesTable 5.2. Correlation coefficients for key aid effectiveness variablesTable 5.2. Correlation coefficients for key aid effectiveness variables
growth inv syears lincome gov aid paid said
inv 0.30*
syears 0.20* 0.32*
lincome 0.11* 0.30* 0.78*
gov -0.07 -0.05 -0.52* -0.45*
Aid -0.00 -0.01 -0.48* -0.48* 0.18*
paid -0.04 0.01 -0.48* -0.45* 0.17* 0.81*
said -0.01 -0.01 -0.43* -0.43* 0.11* 0.90* 0.71*
iaid 0.01 0.01 -0.48* -0.40* 0.10* 0.88* 0.69* 0.81*
*Correlations are statistically significant at the 5 % significance level or better; negative correlation
coefficients of governance with other variables suggest positive association since lower scores
mean better governance and vice versa.
Table 5.3 reports the pairwise correlations of per capita aid with key independent
variables. The per capita aid is negatively correlated with income per capita (poorer countries
get more aid) and positively correlated with total aid from other donors (bandwagon effect).
There is also a modest positive correlation between exports from a donor to a recipient and
aid per capita, somewhat expected in that seemingly economic links is an important factor.
There are practically no correlations between both the democratic and institutional quality of
governance and aid per capita for each donor-recipient pair as well as total aid from all
donors. Similar correlations between governance variables and per capita sectoral aid flows
from all donors and governance measures are observed. These could be explained in two
ways. First, donors do not pay attention to recipient’s quality of governance, thus, there is no
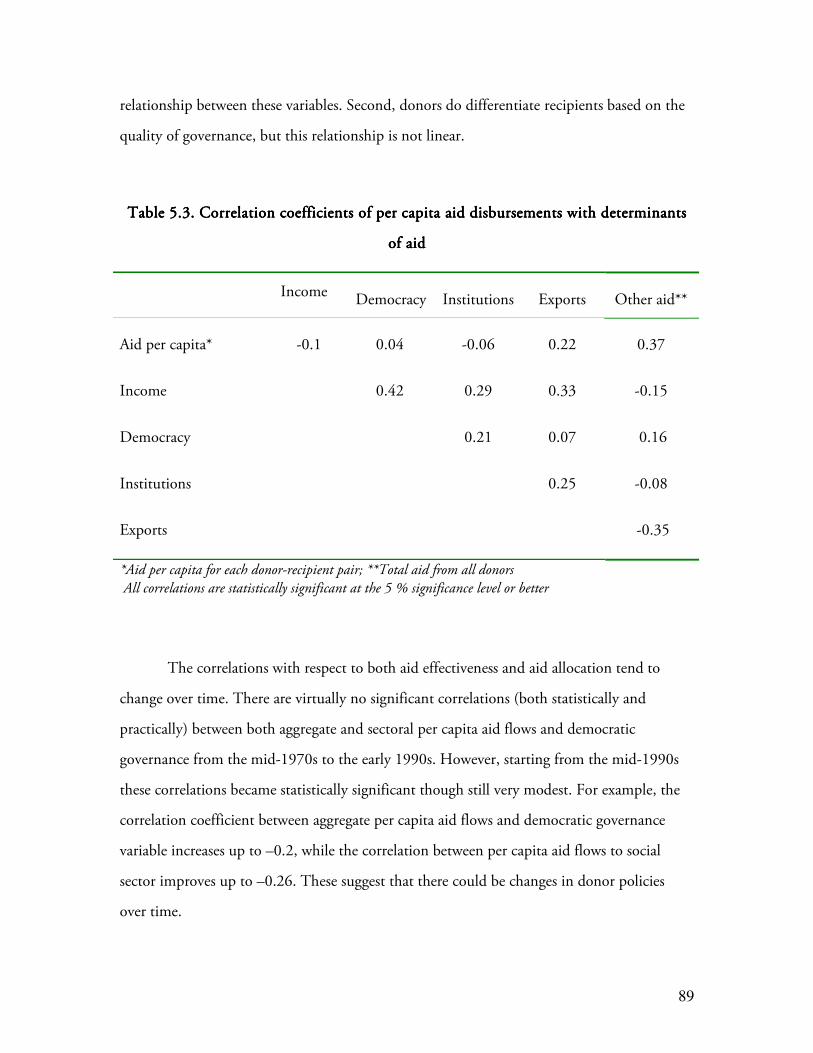
89
relationship between these variables. Second, donors do differentiate recipients based on the
quality of governance, but this relationship is not linear.
Table 5.3. Correlation coefficients of per capita aid disbursements with determinants Table 5.3. Correlation coefficients of per capita aid disbursements with determinants Table 5.3. Correlation coefficients of per capita aid disbursements with determinants Table 5.3. Correlation coefficients of per capita aid disbursements with determinants
of aidof aidof aidof aid
Income
Democracy Institutions Exports Other aid**
Aid per capita*
Income
Democracy
Institutions
Exports
-0.1
0.04
0.42
-0.06
0.29
0.21
0.22
0.33
0.07
0.25
0.37
-0.15
0.16
-0.08
-0.35
*Aid per capita for each donor-recipient pair; **Total aid from all donors
All correlations are statistically significant at the 5 % significance level or better
The correlations with respect to both aid effectiveness and aid allocation tend to
change over time. There are virtually no significant correlations (both statistically and
practically) between both aggregate and sectoral per capita aid flows and democratic
governance from the mid-1970s to the early 1990s. However, starting from the mid-1990s
these correlations became statistically significant though still very modest. For example, the
correlation coefficient between aggregate per capita aid flows and democratic governance
variable increases up to –0.2, while the correlation between per capita aid flows to social
sector improves up to –0.26. These suggest that there could be changes in donor policies
over time.
90
The detailed analysis of the relationship between total aid per capita and the quality
of governance in recipient countries indicate that there is strong heterogeneity across
recipient countries. There is positive correlation for 48 recipient countries, negative
correlation for 22 recipients, and no statistically significant correlation for 72 countries. The
average quality of governance (simple mean for all recipients) is improved from 1975 to
2000, but on average per capita aid has a declining trend in that period (figure 5.3). One
explanation for the latter is that the number of countries eligible to receive a foreign aid
increased significantly as the cold war and socialism ended in Eastern Europe and the Former
Soviet Union.
Figure 5.3. Governance and Aid Per Capita Over Time, 1972-2002
0
10
20
30
40
50
60
1975 1980 1985 1990 1995 2000
Year
Aid
Per
Cap
ita,
C
on
stan
t $U
S
-0.4
-0.2
0
0.2
0.4
Go
vern
ance
, sc
ore
prdac gov
The descriptive analysis of the data shows that the raw data have a lot of noise and
fluctuations. The literature suggests (Durlauf et al 2004, Baldacci et al 2004) that to reduce
the short-term fluctuations and the noise in the data, one can use four-five year averages. I
use five-year averages of the variables in estimating the equations. For example, the first
observation is the average for the 1973-1977 period, following with the average for the 1978-
1982 period and so forth. The econometric analysis of aid effectiveness and allocation using
panel data confronts some methodological challenges. The sources of the challenges and
possible solutions will be discussed in the following sections.

91
5.3. Using Measures of Governance in the Context of Panel Analysis
In empirical analysis, two governance variables are used. The institutional quality of
governance is approximated with a combination of four ICRG indicators (bureaucratic
quality, rule of law, government stability, and corruption) while the democratic quality of
governance is approximated by a combination of the Freedom House’s political rights and
civil liberties indicators. The main focus is on the democratic quality of governance while the
institutional quality of governance variable enters the estimation mainly for control purposes.
There are two grounds for this approach: conceptual and practical. First, the notion of good
governance combines features of a government in which ordinary citizens have the rights and
liberties to govern themselves (democracy) with arrangements and mechanisms that are used
to manage public affairs accordingly to accepted rules and procedures (institutions). The
democratic quality of governance creates conditions for increased accountability, citizen
participation and meaningful decentralization of authority making them accessible to
citizens. The institutional quality of governance allows the efficient fulfillment of those rights
and liberties by the incorporation of the views of citizens and political groups in the
formulation of policies and equitable delivery of public services. These two dimensions of
governance have to dynamically interact to reinforce good governance. The basic dynamic
here is that initially political rights and liberties (even if they are very limited) generate
demand for appropriate institutions. Consequently, improved institutions create conditions
for better fulfillment of rights and liberties.
The practical ground is based on the availability of more comprehensive measures of
governance because as mentioned previously the concept of governance is multi-dimensional
and most governance indicators intend to measure only one dimension. Therefore, one needs
to find measures as comprehensive as possible. As mentioned earlier, I use the Freedom
House’s two indicators – political rights and civil liberties – because they are available over
long period of time and provide wide country coverage. The general characteristics of the

92
values of these categorical variables and some exemplary countries are presented in tables 5.4
and 5.5.
One may argue that these indicators are not objective measures; thus, they only
describe perceptions about the democratic quality of governance. However, even though the
Freedom House’s indicators are subjective measures, they may still be a reasonable signal
about the quality of governance across countries and are constructed applying the same
procedures for all countries. Thus they can be safely accepted as a proxy for the quality of
governance. Another concern: even if they somehow measure or proxy the actual democratic
quality of governance in recipient countries, they describe only one dimension of
governance, i.e., the dimension of democracy. However, it turned out that this concern also
is not necessary. To the best of my knowledge, the World Bank Institute constructed the
most comprehensive and sophisticated measurement of governance publicly available at the
moment (Kauffmann et al, 2003). This measurement of governance includes six aggregate
indicators of governance that capture “(1) the process by which governments are selected,
monitored and replaced, (2) the capacity of government to effectively formulate and
implement sound policies, and (3) the respect of citizens and the state for institutions that
govern economic and social interactions among them.” It turns out that there are strong
correlations between these six indicators and Freedom House’s two indicators (correlation
coefficients vary from 0.6 to 0.9). Moreover, canonical correlation analysis indicates that a
simple linear combination of World Bank’s governance variables is highly dependent on and
can be predicted using the linear combination of political rights and the civil liberties
variables (canonic correlation is 0.95).
How can one interpret these correlations? These strong correlation coefficients
suggest that these indicators of governance are measuring very similar things. Thus, it can be
assumed that a latent governance variable that is constructed from political rights and civil
liberties indicators is a reasonable proxy of the quality of governance40. Further, the
40 Nevertheless, these two indexes do not cover the meaning of “governance”, although they are the best we have, and they are closely correlated with other governance variables. Therefore, the results should be viewed with some caution.
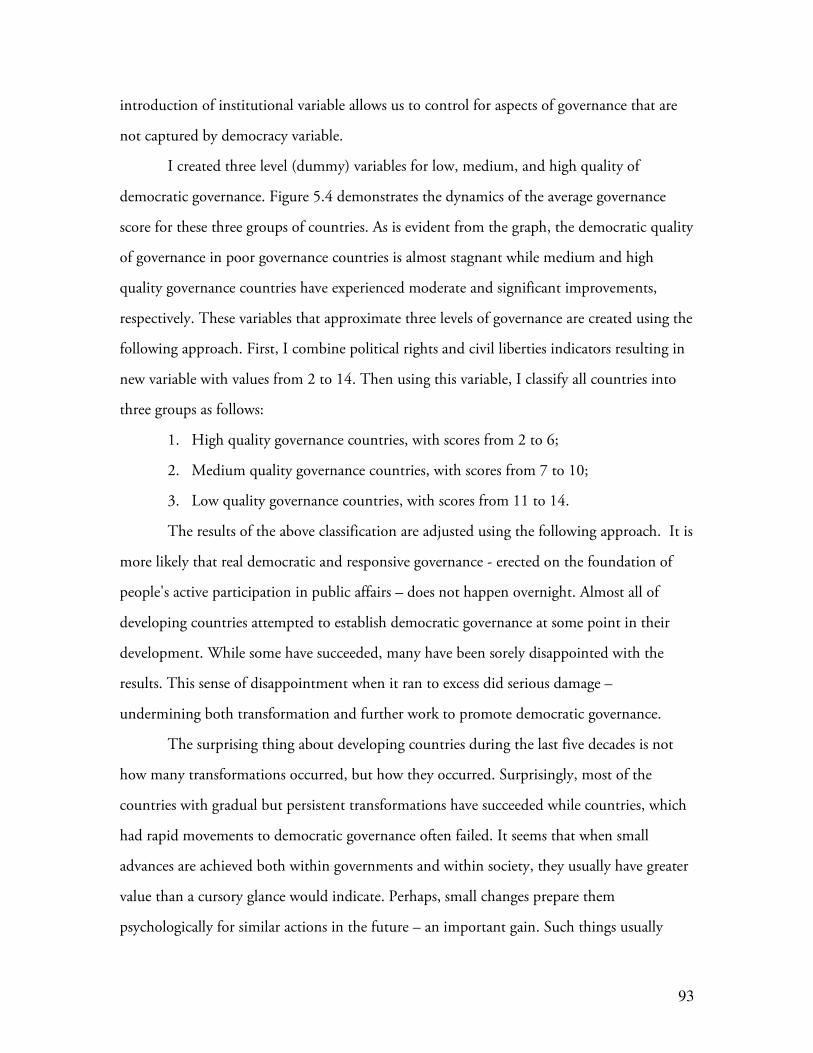
93
introduction of institutional variable allows us to control for aspects of governance that are
not captured by democracy variable.
I created three level (dummy) variables for low, medium, and high quality of
democratic governance. Figure 5.4 demonstrates the dynamics of the average governance
score for these three groups of countries. As is evident from the graph, the democratic quality
of governance in poor governance countries is almost stagnant while medium and high
quality governance countries have experienced moderate and significant improvements,
respectively. These variables that approximate three levels of governance are created using the
following approach. First, I combine political rights and civil liberties indicators resulting in
new variable with values from 2 to 14. Then using this variable, I classify all countries into
three groups as follows:
1. High quality governance countries, with scores from 2 to 6;
2. Medium quality governance countries, with scores from 7 to 10;
3. Low quality governance countries, with scores from 11 to 14.
The results of the above classification are adjusted using the following approach. It is
more likely that real democratic and responsive governance - erected on the foundation of
people's active participation in public affairs – does not happen overnight. Almost all of
developing countries attempted to establish democratic governance at some point in their
development. While some have succeeded, many have been sorely disappointed with the
results. This sense of disappointment when it ran to excess did serious damage –
undermining both transformation and further work to promote democratic governance.
The surprising thing about developing countries during the last five decades is not
how many transformations occurred, but how they occurred. Surprisingly, most of the
countries with gradual but persistent transformations have succeeded while countries, which
had rapid movements to democratic governance often failed. It seems that when small
advances are achieved both within governments and within society, they usually have greater
value than a cursory glance would indicate. Perhaps, small changes prepare them
psychologically for similar actions in the future – an important gain. Such things usually
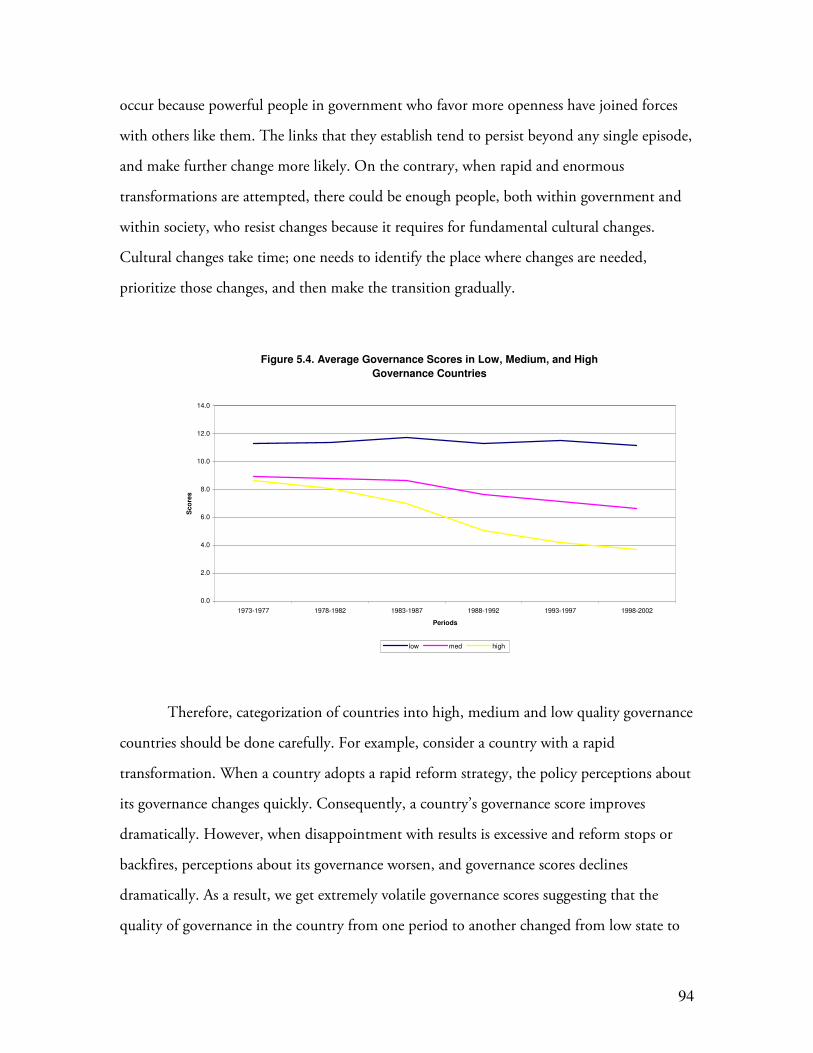
94
occur because powerful people in government who favor more openness have joined forces
with others like them. The links that they establish tend to persist beyond any single episode,
and make further change more likely. On the contrary, when rapid and enormous
transformations are attempted, there could be enough people, both within government and
within society, who resist changes because it requires for fundamental cultural changes.
Cultural changes take time; one needs to identify the place where changes are needed,
prioritize those changes, and then make the transition gradually.
Figure 5.4. Average Governance Scores in Low, Medium, and High Governance Countries
0.0
2.0
4.0
6.0
8.0
10.0
12.0
14.0
1973-1977 1978-1982 1983-1987 1988-1992 1993-1997 1998-2002
Periods
Sco
res
low med high
Therefore, categorization of countries into high, medium and low quality governance
countries should be done carefully. For example, consider a country with a rapid
transformation. When a country adopts a rapid reform strategy, the policy perceptions about
its governance changes quickly. Consequently, a country’s governance score improves
dramatically. However, when disappointment with results is excessive and reform stops or
backfires, perceptions about its governance worsen, and governance scores declines
dramatically. As a result, we get extremely volatile governance scores suggesting that the
quality of governance in the country from one period to another changed from low state to
95
high state and vice versa. However, such rapid changes were unlikely to happen. It was more
likely that only perceptions about the quality of governance changed over time but the actual
quality of governance never improved. Therefore, I categorize countries with similar patterns
of governance scores as a low governance country for entire period.
Another example, consider a country with a gradual but persistent changes in
governance. When we compare its more modest achievements with dramatic
transformations, we often perceive it like a failure. But we are using inappropriate yardsticks
to measure its achievements. We need to recognize that thoroughgoing transformations are
extreme rarities and that most of the time; it is incremental change and not massive
transformation that is needed. In the end, those countries with gradual and persistent change
will move from low state to medium and eventually to high governance state. Therefore, I
categorize countries with similar patterns of change as high quality governance countries for
all periods. Similar logic is applied to medium governance categorization.
Applying the approach above, I assessed country by country the patterns of changes
in governance scores for all countries. Based on the results of this detailed analysis, I made
adjustments to the categorization above. This adjusted classification applies to the entire time
span.

96
Table 5.4. General Characteristics of Political Rights Scores
Score Description Examples of Countries
1 Country has a fully competitive electoral process with free and fair elections and competitive political parties; and opposition has actual power and plays an important role
Barbados, Bulgaria, Cape Verde, Costa Rica, Grenada, Hungary
2 As ranking 1, however, such factors as political corruption, political discrimination against minorities, and foreign military influence on political process may be present and weaken the quality of political freedom
Bolivia, Botswana, Brazil, Chile, Croatia, El Salvador, Ghana, India, Jamaica, Mexico, Namibia, Peru, Senegal
3 Less effective enforcement of competitive election process than 1 and 2
Albania, Argentina, Benin, Ecuador, Honduras, Indonesia, Macedonia
4 Ditto3, but government may have been selected outside the public view by various fraction leaders
Bangladesh, Bosnia-Herzegovina, Burkina-Faso, Columbia, Djibouti, Georgia, Guatemala
5 No effective electoral process in place, however, struggle for consensus among variety of political, ethnic and other groups in society
Bahrain, Central African Republic, Comoros, Ethiopia Malaysia, Russia
6 No competitive electoral processes are allowed and a country is ruled by one party dictatorships, religious hierarchies, military juntas, or autocrats, however, leaders may respond to certain popular (cultural, religious and ethnic) desire
Afghanistan, Algeria, Bhutan, Burundi, Cambodia, Chad, Congo, Cote d’Ivoire, Iran, Jordan, Lebanon, Liberia, Pakistan, Qatar, Somalia, Tajikistan
7 Political rights are absent or virtually nonexistent and power is controlled by political despots only
Burma, China, Cuba, Eritrea, Iraq, North Korea, Libya, Rwanda, Sudan
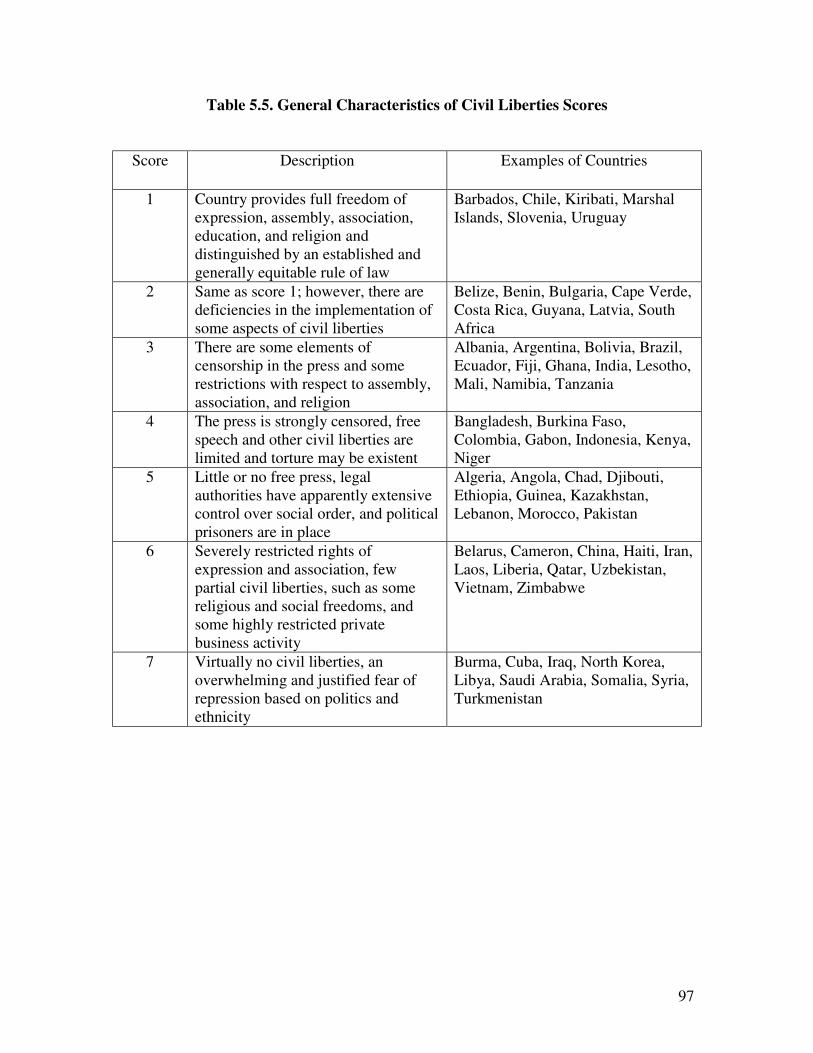
97
Table 5.5. General Characteristics of Civil Liberties Scores
Score Description Examples of Countries
1 Country provides full freedom of expression, assembly, association, education, and religion and distinguished by an established and generally equitable rule of law
Barbados, Chile, Kiribati, Marshal Islands, Slovenia, Uruguay
2 Same as score 1; however, there are deficiencies in the implementation of some aspects of civil liberties
Belize, Benin, Bulgaria, Cape Verde, Costa Rica, Guyana, Latvia, South Africa
3 There are some elements of censorship in the press and some restrictions with respect to assembly, association, and religion
Albania, Argentina, Bolivia, Brazil, Ecuador, Fiji, Ghana, India, Lesotho, Mali, Namibia, Tanzania
4 The press is strongly censored, free speech and other civil liberties are limited and torture may be existent
Bangladesh, Burkina Faso, Colombia, Gabon, Indonesia, Kenya, Niger
5 Little or no free press, legal authorities have apparently extensive control over social order, and political prisoners are in place
Algeria, Angola, Chad, Djibouti, Ethiopia, Guinea, Kazakhstan, Lebanon, Morocco, Pakistan
6 Severely restricted rights of expression and association, few partial civil liberties, such as some religious and social freedoms, and some highly restricted private business activity
Belarus, Cameron, China, Haiti, Iran, Laos, Liberia, Qatar, Uzbekistan, Vietnam, Zimbabwe
7 Virtually no civil liberties, an overwhelming and justified fear of repression based on politics and ethnicity
Burma, Cuba, Iraq, North Korea, Libya, Saudi Arabia, Somalia, Syria, Turkmenistan

98
5.4. Identification Issues and Estimation Techniques
The core questions regarding aid effectiveness are how different categories of aid
affect the economic growth and whether the interaction of different levels of governance with
different categories of aid flows is significant in promoting growth. The main question
regarding aid allocation is whether the quality of governance in recipient countries affects the
donors’ aid allocation decisions.
First, consider a general model specification that examines the research questions
regarding aid effectiveness:
Yjt = β0+ β1 Governancejt+ β2 Aidjt +β3 HGovernance XAidLjt+ βjt Xjt+ ξjt
where Y is a development outcome variable for recipient-country j at time t, Governance is a
matrix of governance variable for recipient j at time t, Aid is a matrix of disaggregated aid
variables for recipient j at time t, (Governance X Aid) is an interaction between the quality of
governance and aid variables, X is a matrix of control variables, and x is an observed error
term.
Second, consider the general form that explores whether the quality of governance
has an impact on donors aid allocation policies:
Aidijt = α0+ α1 Governancejt+ α1 Xjt +ξijt
where Governance is a matrix of governance variables for recipient j at time t, X is a matrix of
control variables for recipient-country j at time t. Aid is an aid variable, aid per capita from
donor i to recipient-country j at time t, for example, x is unobserved error term.
I will start with identifying estimation issues that are common for both specifications.
Then I will discuss specific solutions. In addressing the research questions formulated above
empirically, we face at least two methodological estimation challenges, and one related to the

99
nature of the panel data is used in the analysis. These estimation issues are relevant to both
specifications mentioned earlier.
First, the most immediate aspect of the model specification is unobserved
heterogeneity or the omitted (third) variable effect. Overall, the literature suggests that over
50 variables are considerably correlated with growth (Levine and Renelt, 1992). One may
include in the model whenever these variables are available. However, many of these variables
are not readily available across countries and time periods. Moreover, some of these variables
are not observed. For example, literature suggests that country-specific effects, such as
cultural factors, can impact both growth and exploratory variables simultaneously.
Another source of unobserved heterogeneity is measurement error. If the explanatory
variable we observe is measured with significant error, the unobserved error term in the
relation of interest will contain the measurement error that will be correlated with the
regressor. These have potentially serious consequences if explanatory variables to be
correlated with those unobservable variables, whereas in a regression model regressors and
unobservables are uncorrelated by construction. If those correlations between observables
and unobservables are not zero then it renders standard estimation subject to bias and
inconsistency, i.e., if unobservables that have direct impact on both dependent and
explanatory variables are omitted, the error term will be correlated with explanatory variables
and regression coefficients will be biased measures of the parameters of interest (Wooldridge
2002, Arellano 2003).
Contemporary econometrics provides a response to the presence of time invariant
unobserved heterogeneity. If unobservable variables are country specific and time invariant,
unbiased estimates of the models can be obtained by using fixed effects (or first-difference)
estimation. This estimator is more appropriate because it embraces the cases when
covariances of unobservables with explanatory variables are not zero.
The fixed effects estimator is motivated by a model when unobserved error term xjt
includes both a zero-mean country-specific time invariant component hj and a zero-mean

100
random component njt independent of all other values this random component and country
specific component, i.e.,
xjt jt jt jt = = = = hj j j j + + + + njt jt jt jt ....
Since the fixed effects estimator captures only time invariant country specific
unobserved effects, it is most likely that temporal events render standard estimation subject
to bias and inconsistency. For example, the debt crisis in the early 1980s extended to a
number of developing countries and most likely affected both development outcomes and
aid variables. Or, the collapse of socialism at the end of 1980s and the early 1990s affected
development outcomes and governance in formerly socialist countries. This also affected the
aid flows to not only transition countries but to many developing countries in other parts of
world.
One generalization, which produces unbiased and consistent estimates in the more
general case, is the difference-in-difference (DOD) estimator that is one of the most popular
estimation tools for applied policy research to evaluate the effects of policy interventions.
This estimator assumes that unobserved error term xjt has a factor structure, including a zero-
mean country-specific time-invariant component hj, a zero time-specific country-invariant
component, and a zero-mean random component njt independent of all other values this
random component, and country and time specific components, i.e.,
xjt = hj + mt + njt .
So, this specification (the DOD) introduces a second difference, which allows the estimation
to capture the unobserved effects of time specific events. Unbiased and consistent estimation
can then proceed by means of two fixed effects on first and second differences, where first
difference isolates the time invariant unobserved effects, the second difference the event or
time-specific unobserved effects.
Second, it is often argued that the relationship between aid flows and the quality of
governance, and between development outcomes and aid flows are endogenous and can be
interpreted in two ways. The evidence of a causal relationship between these variables is
101
inconclusive. For instance, shocks to economic growth and income may well carry
implications for the stability of governance structures, the amount and sectoral allocation of
aid flows and vice versa. If this is the case then it violates conditional independence
assumption. From a theoretical point of view, the best approach is thorough and extensive
econometric analysis using valid instrumental variables (IV). However, finding valid
instrumental variables can be a formidable task. The impact of aid on development outcome
is not instantaneous. It takes time for the aid effect to be fully transmitted into development
outcomes. Therefore, it makes sense to relate lagged aid flows to development outcomes.
Such a specification, to some extent, may allow us to avoid the problem of two-way causality
if it indeed exists. Therefore, I specify the models assuming the causation running from aid
allocation patterns to development outcomes41.
Third, another problem frequently encountered in aid effectiveness studies relates to
outliers, values of the dependent variable that are abnormal, given the values of the
explanatory variables (response outliers), or odd values of explanatory variables (design
outliers). As table 5.1 presents, outliers are somewhat of a problem for some variables in the
dataset. One way of dealing with outliers is mere exclusion of them. However, this can
substantially alter the results of regression analysis. Another way of solving the problem could
be re-estimation of the model iteratively omitting one observation at a time to see that what
exerts a significant influence on the set of estimates. I have chosen robust regression to
address the problem related to outliers. Robust regression results will be provided for the
purposes of robustness check. The advantage of the robust estimation procedure is that it
minimizes the influence of extreme observations on the estimated equation rather than
omitting them. The robust estimation procedure involves an iteratively weighted least
squares method whereby the outliers are identified and weights assigned. Robust regression
uses the Huber/White/sandwich estimator of variance in place of the traditional calculation.
41 I fully understand that this assumption will only address some issues related to two-way causality, but it will not provide a full solution for the problem. Indeed, a fully satisfactory solution may not exist.
102
This alternative variance estimator produces consistent standard errors even if the data are
weighted or the residuals are not identically distributed.
Fourth, the panel data that are used in this study consists of repeated measurements
on the same unit, the recipient, that are “pooled” with those of other units to provide a
combination of longitudinal and cross-sectional information. Therefore, there is a strong
possibility of the existence of autocorrelation within panels and cross-sectional correlation
and/or heteroskedasticity across panels. In most panel data, the error terms associated with
successive observations on the same unit - the observation for Uganda in 1999 and Uganda
in 2000, for instance - are correlated with each other. The same could be true of spatially
related units, such as countries in the same geographic region - the observations for countries
of Sub-Saharan Africa, for example - that are subject to similar exogenous influences.
Another possibility is that most economies of most developing countries are dominated by a
limited number of commodities. Therefore, fluctuations in world commodity markets may
produce similar effects for a number of countries.
Further, it is highly possible that estimates may have a different or non-equal
variance of errors across countries and time periods. The first of these two problems can be
demonstrated on the variance-covariance matrix of the error term as a pattern in which the
off-diagonal elements are non-zero, while the second problem can be shown as a pattern in
which these elements are non-equal. In general, estimates of models of this structure are
flawed if one uses the simple OLS estimation method. Analysis of this data requires
techniques that are robust to both problems mentioned above. Generalized least squares
(GLS) methods are most often considered the most efficient approach, since they can specify
the structure of the data and account for it directly (Green 2001).
So far I have highlighted a number of estimation issues and possible solutions
relevant to the analysis of aid effectiveness and allocation using panel data. In the following, I
will provide some details. First, I start with the aid effectiveness model. The estimations of
growth, investment and human capital equations start with ordinary least squares models.
However, as mentioned above, OLS will produce biased results for panel data. Here one has
103
to focus on all three aspects of the model specification discussed earlier. The first aspect of
the model specification is unobserved heterogeneity due to time-specific events and omitted
(third) variable effect, i.e. unobservable variables that may affect the quality of governance,
aid flows, and development outcomes. Since these unobservables are country specific and
time invariant or time-specific and country invariant, consistent estimates of the models are
obtained using difference-in-differences estimator.
A second aspect of model specification is endogeneity or reverse causality given the
likelihood of the two-way causality between development outcomes and aid flows. As
mentioned before, the aid effectiveness model relates aid variables to development outcomes
with one period lag assuming the causation running from aid allocation patterns to
development outcomes42. Third, robust and FGLS estimators are employed to address the
issues related to the possibility of the existence of autocorrelation within panels, cross-
sectional correlation and/or heteroskedasticity across panels, and non-equal variances of
errors across countries and time periods.
Now I turn to the aid allocation model. As mentioned elsewhere, the objective of aid
allocation model is to evaluate the effect of governance on foreign aid flows. Identifying this
effect requires controlling for any systematic shocks to foreign aid flows that are correlated
with, but not due to, the governance. I do so in three ways in the two-part estimation below.
First, I include period effects, to capture any global trends in foreign aid flows. Second, I
include donor dummies, to control for differences in donor aid allocation policies. Third, I
include recipient effects, to control for differences in donors’ behavior towards individual
recipient countries. That is, I identify the pure effect of governance variable on bilateral
foreign aid flows. This identification strategy is applied separately to examine three research
questions. At the first step, I estimate the effect of governance on the probability of supplying
foreign aid by donors to given recipient country using random effects probit estimator.
Then, I estimate the effect of governance on per capita aggregate aid flows as well as per
42 I fully understand that this assumption will only address some issues related to two-way causality, but it will not provide a full solution for the problem. Indeed, a fully satisfactory solution may not exist.

104
capita sectoral aid flows, conditional on positive decision in the first step, using difference-of-
differences estimator. The identifying assumption of these estimators is standard difference-
in-differences: it simply requires there be no recipient-specific or donor-specific effects over
this period of time that affect the outcome variables. I control for following determinants of
aid: per capita income, recipients’ population, economic and political links between a donor
and a recipient, and so called “bandwagon effects.” A “bandwagon effect” is the observation
that a donor provides aid to a particular recipient because many other donors do the same. In
other words, the “bandwagon effect” arises when a donor’s preference for a recipient
increases as the amount of aid given by other donors increases. I also control for some
macroeconomic variables to see if this will change the results. I do not explicitly control for
time invariant characteristics in donor-recipient relationships, such as colonial background,
ethnic and religious fractionalizations, but the identification strategy described above allows
to implicitly control for fixed relationships between donors and recipients.
The sample includes both recipients and non-recipients of aid from the bilateral
donors under consideration. Thus, some of bilateral aid commitment flows are equal to zero,
because donors tend to allocate aid only to specific targeted countries. Consequently, we deal
with a censored variable, which implies that estimates are flawed if one models average aid,
including the zeros. A misleading regression model will be fitted since zero outcomes are the
result of a non-random aid allocation process. Consider an alternative approach, which
assumes excluding the non-aid recipients from the sample. This truncates the error term if
the donors’ have systematically used some criteria to partition aid recipients from non-
recipients and thus violates an important assumption that the expectation of the error term is
zero. There is a group of limited variable modeling techniques, which allows to model the
data with censored character: two-part model, Heckman’s two-step method and type one
Tobit model. Each of these estimation techniques has its own strength and weaknesses.
Following the aid allocation literature (Neumayer 2003), I have chosen a two-part model: in
the first step, a probability model determines the likelihood of giving aid, and in a second, a
difference-in-difference model explaining aid disbursements estimated, conditional only on
105
strictly positive aid commitments. This procedure assumes that the choice of the recipient is
independent from the amount allocated to this recipient in the second step.
As mentioned above, the second part of the aid allocation model examines the per
capita aggregate aid flows as well as per capita sectoral aid flows, conditional on positive
decision in the first step, using difference-of-differences estimator. For the per capita
aggregate aid flows model I use ordinary least squares and/or time series cross-sectional
generalized least squares estimation techniques. However, one cannot safely use these
techniques for the sectoral per capita aid flows model because some donors tend to allocate
aid only to specific targeted sectors. Hence, we deal with a censored variable, which implies
that estimates are flawed if one models the sectoral aid flows, including the zeros. If the share
of zero values is big, then the above mentioned techniques result in misleading outcomes.
Therefore, I estimate the sectoral per capita aid flows models by using standard tobit and
cross-sectional time series tobit techniques.
106
Chapter 6. Analysis and Discussion of the Results
Employing the framework developed in chapter 4 and using the data described in
chapter 5, this chapter empirically examines the impact of disaggregated aid on development
outcomes. Then, I present the results of aid allocation models. Thereafter, I relate the
findings to previous literature and development practice.
6.1. Aid Effectiveness
An innovation of this dissertation is that I estimate the impact of aid on growth in a
different manner than typical of the aid-growth literature. To make the link to the existing
literature, I begin with analysis of the impact of aggregate aid on per capita aid growth. The
results of different specifications of difference-in-difference estimator for the aggregate aid
flows are presented in table 6.1. The most significant variables in the regression are initial
income, investment ratio, education and health capital, and inflation. Change in educational
capital appears to be more important than its stock. The effect of inflation on growth appears
to be nonlinear (high inflation dummy), especially high levels of inflation are harmful for per
capita growth.
As concerns to aggregate aid, I begin with a base regression presented in column 1
(DOD1 model) of table 6.1. This regression suggests that there is no significant relationship
between aid and growth. I then extend the model including the interaction of aggregate aid
with the quality of governance (democracy). This makes aggregate aid and its interaction
with governance statistically significant (DOD3 model). Taking the derivative of growth
with respect to aid, we see that the slope of this derivative in the governance dimension is
slightly positive. This suggests that aid has relatively higher positive impact on growth in
countries with better governance. While the conditional variable (governance) in this study is
different from Burnside and Dollar (2000, policy environment), the result is similar to their
findings. However, this result is not robust to adding and dropping other variables into the
107
model. For example, if one adds the democracy variable into the model the coefficients for
aggregate aid becomes statistically insignificant (DOD2 model). The coefficient for the
interaction variable is statistically significant only at 10% significance level.
Further, I estimate the model allowing the interactions of aggregate aid with different
levels of governance (DOD4 and DOD5 models). These results suggest that the impact of
aggregate aid on growth in low- and medium governance countries is virtually zero. The
results also imply that this impact might be slightly positive for high-governance countries.
However, using a chi-squared statistic test (c2=5.46, p-value=0.1413), I cannot reject the
null hypothesis (three estimated coefficients are equal) at 5% significance level and conclude
there is no difference in regression coefficients between the three groups of countries. Thus,
the results suggest that the impact of aggregate aid on growth is insignificant and indifferent
to the quality of governance.
As noted earlier, aid flows are allocated to different sectors of recipients’ economy.
These different categories of aid flows might not impact economic growth uniformly.
Therefore, any evaluation of the impact of aggregate aid on growth is flawed because
different categories of aid might impact growth through different transmission channels. I
attempt to mitigate this challenge by disaggregating aid flows and estimating the impact of
these disaggregated aid flows on economic growth.
As mentioned earlier, the empirical approach in this study is based on panel data
regressions in a system of three equations. The estimation results for growth, investment and
human capital equations are presented in tables 6.5-6.8. The results for alternative
specifications, used for robustness check are also reported in these tables. In most cases the
coefficients are statistically significant, and all equations have a good fit. The equations
explain from 50 to 65 percent of the variation in per capita growth, about 50 percent of the
variation in investment ratio and almost 80 percent of the variation in human capital (years
of schooling). Goodness-of-fit of these models was assessed by F-test and Chi-squared test. In
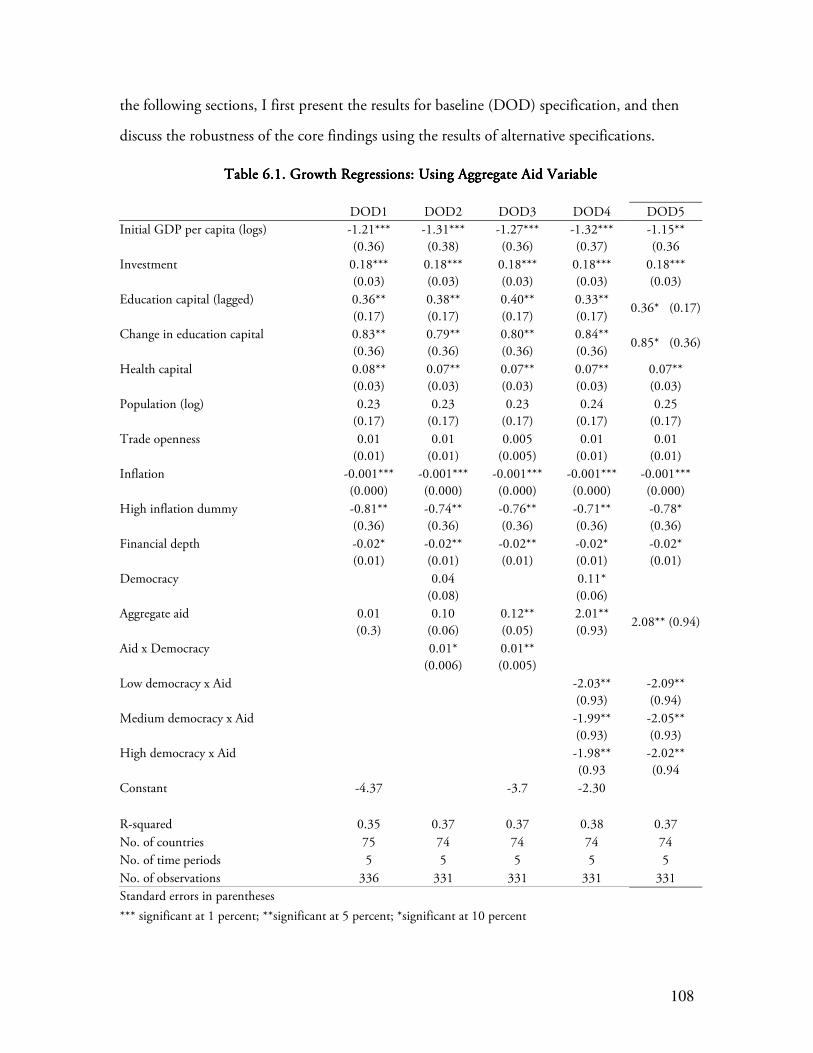
108
the following sections, I first present the results for baseline (DOD) specification, and then
discuss the robustness of the core findings using the results of alternative specifications.
Table 6.1. Growth Regressions: Using Aggregate Aid VariableTable 6.1. Growth Regressions: Using Aggregate Aid VariableTable 6.1. Growth Regressions: Using Aggregate Aid VariableTable 6.1. Growth Regressions: Using Aggregate Aid Variable
DOD1 DOD2 DOD3 DOD4 DOD5
Initial GDP per capita (logs) -1.21***
(0.36)
-1.31***
(0.38)
-1.27***
(0.36)
-1.32***
(0.37)
-1.15**
(0.36
Investment 0.18***
(0.03)
0.18***
(0.03)
0.18***
(0.03)
0.18***
(0.03)
0.18***
(0.03)
Education capital (lagged) 0.36**
(0.17)
0.38**
(0.17)
0.40**
(0.17)
0.33**
(0.17) 0.36* (0.17)
Change in education capital 0.83**
(0.36)
0.79**
(0.36)
0.80**
(0.36)
0.84**
(0.36) 0.85* (0.36)
Health capital 0.08**
(0.03)
0.07**
(0.03)
0.07**
(0.03)
0.07**
(0.03)
0.07**
(0.03)
Population (log) 0.23
(0.17)
0.23
(0.17)
0.23
(0.17)
0.24
(0.17)
0.25
(0.17)
Trade openness 0.01
(0.01)
0.01
(0.01)
0.005
(0.005)
0.01
(0.01)
0.01
(0.01)
Inflation -0.001***
(0.000)
-0.001***
(0.000)
-0.001***
(0.000)
-0.001***
(0.000)
-0.001***
(0.000)
High inflation dummy -0.81**
(0.36)
-0.74**
(0.36)
-0.76**
(0.36)
-0.71**
(0.36)
-0.78*
(0.36)
Financial depth -0.02*
(0.01)
-0.02**
(0.01)
-0.02**
(0.01)
-0.02*
(0.01)
-0.02*
(0.01)
Democracy
0.04
(0.08)
0.11*
(0.06)
Aggregate aid 0.01
(0.3)
0.10
(0.06)
0.12**
(0.05)
2.01**
(0.93) 2.08** (0.94)
Aid x Democracy
0.01*
(0.006)
0.01**
(0.005)
Low democracy x Aid
-2.03**
(0.93)
-2.09**
(0.94)
Medium democracy x Aid
-1.99**
(0.93)
-2.05**
(0.93)
High democracy x Aid
-1.98**
(0.93
-2.02**
(0.94
Constant -4.37 -3.7 -2.30
R-squared 0.35 0.37 0.37 0.38 0.37
No. of countries 75 74 74 74 74
No. of time periods 5 5 5 5 5
No. of observations 336 331 331 331 331
Standard errors in parentheses
*** significant at 1 percent; **significant at 5 percent; *significant at 10 percent
109
6.1.1 The Core Results
This section tests the three hypotheses regarding the link between disaggregated aid
flows and development outcomes. The following analysis is based on the results of the
baseline (difference-in-differences) model. As mentioned earlier, the difference-in-difference
estimator produces unbiased and consistent estimates of the parameters of interest by means
of two fixed effects on first and second differences, where first difference isolates the time
invariant unobserved effects, the second difference the period specific unobserved effects.
Moreover, the baseline specifications relate lagged values of key independent variables, where
appropriate, to dependent variables to mitigate endogeneity problem.
Table 6.2 reports the results of the test for the impact of aid to production sector on
investment. The first important and somewhat puzzling result emerging from table 6.2 is
that aid to production sector in countries with low governance has a positive and significant
contemporaneous impact on capital accumulation (investment). The estimated impact from
the OLS model is 0.78. However, one might argue that the OLS result is biased due to time-
invariant country specific and country-invariant time specific effects. Therefore, I estimated
DOD model, which allows us to control for these specific effects. This reduces the estimated
impact of aid to production on investment to 0.71. This means that a percentage point
increase in the ratio of aid to production sector to GDP leads to 0.71 percentage point
increase in investment ratio, on average, in recipient countries with low quality of
governance. In other words, one standard deviation increase in aid to production sector to
GDP ratio will cause about 1.6-percentage point increase in the investment ratio on average,
other things being equal. Further, the results for the growth equation (table 6.4) suggest that
a percentage point increase in investment ratio is associated with 0.2 percent increase in per
capita GDP growth rate, on average. Thus, one standard deviation increase in aid to
production sector to GDP ratio leads to 0.33 percentage point increase in average annual
growth rates, on average, in recipient countries with low quality of governance.
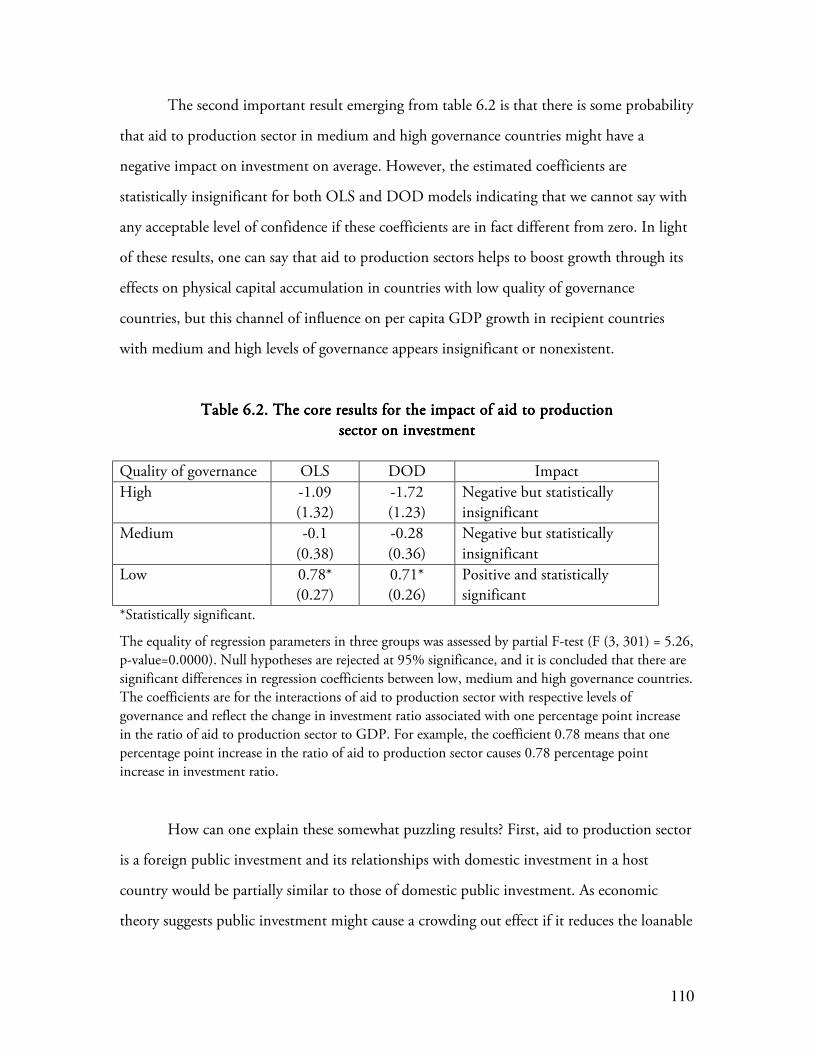
110
The second important result emerging from table 6.2 is that there is some probability
that aid to production sector in medium and high governance countries might have a
negative impact on investment on average. However, the estimated coefficients are
statistically insignificant for both OLS and DOD models indicating that we cannot say with
any acceptable level of confidence if these coefficients are in fact different from zero. In light
of these results, one can say that aid to production sectors helps to boost growth through its
effects on physical capital accumulation in countries with low quality of governance
countries, but this channel of influence on per capita GDP growth in recipient countries
with medium and high levels of governance appears insignificant or nonexistent.
Table 6.2. The core results for the impact of aid to productionTable 6.2. The core results for the impact of aid to productionTable 6.2. The core results for the impact of aid to productionTable 6.2. The core results for the impact of aid to production
sector on investmentsector on investmentsector on investmentsector on investment
Quality of governance OLS DOD Impact
High -1.09
(1.32)
-1.72
(1.23)
Negative but statistically
insignificant
Medium -0.1
(0.38)
-0.28
(0.36)
Negative but statistically
insignificant
Low 0.78*
(0.27)
0.71*
(0.26)
Positive and statistically
significant *Statistically significant.
The equality of regression parameters in three groups was assessed by partial F-test (F (3, 301) = 5.26,
p-value=0.0000). Null hypotheses are rejected at 95% significance, and it is concluded that there are
significant differences in regression coefficients between low, medium and high governance countries.
The coefficients are for the interactions of aid to production sector with respective levels of
governance and reflect the change in investment ratio associated with one percentage point increase
in the ratio of aid to production sector to GDP. For example, the coefficient 0.78 means that one
percentage point increase in the ratio of aid to production sector causes 0.78 percentage point
increase in investment ratio.
How can one explain these somewhat puzzling results? First, aid to production sector
is a foreign public investment and its relationships with domestic investment in a host
country would be partially similar to those of domestic public investment. As economic
theory suggests public investment might cause a crowding out effect if it reduces the loanable

111
funds available for private investment and distorts relative prices, reducing the level of private
investment. If the positive impact of increased foreign public investment in production
sectors outweighs the negative impact of reduced private investment then investment ratio
will increase and lead to higher growth rates. In the opposite case, the negative impact of
reduced private investment completely cancels or even overrides the positive impact of
increased public investment, and economic growth will remain unchanged or be even
reduced. Actually, the evidence suggests that contemporaneous effect of public investment
on private investment, in countries with medium to high level of democratic governance, is
negative and statistically significant. For example, Mitra (2006) provides considerable
empirical evidence suggesting that public investment in India has been crowding out private
investment. Second, foreign aid flows into production sector, as a foreign public investment
will impact domestic private investment similar to foreign private investment. According to
empirical studies foreign direct investment appears to crowd-out domestic investments in net
terms (Alfaro 2003, Kumar and Pradhan 2002, etc.).
Now, recall that there is a considerable positive association between the quality of
governance and per capita income across countries. Countries with poor governance also
have low per capita income. As Sachs (2005) suggests, majority of households in those
countries live below subsistence level and there is no domestic (both personal and public)
savings to finance private investment. Therefore, foreign aid intended to finance investment
in productive sectors would not cause a crowding-out effect simply because there is no
private investment to begin with. On the contrary, countries with moderate to high level of
governance might have domestic savings to finance profitable private investment projects and
the negative impact of reduced private investment might completely cancel out or even
overrate the positive impact of increased public investment.
Let us now turn to testing the second hypothesis. Table 6.3 reports the results of the
test for the impact of aid to economic infrastructure on investment and growth. First, as
expected, there is no evidence that aid to economic infrastructure directly impacts economic
growth by helping to improve the overall efficiency of a recipient’s economy, i.e., improving
112
total factor productivity in a recipient country. The estimated coefficients for the interactions
of aid to economic infrastructure with high and medium levels of governance are positive but
statistically insignificant suggesting that the estimated parameters of interest are not different
from zero. The estimated coefficient for the interaction of this category of aid with low
governance is negative but also statistically insignificant. Therefore, one cannot make any
decisive conclusion regarding the direct impact of aid to economic infrastructure on the per
capita GDP growth. These findings are consistent with empirical evidence that in the least
developed countries the economic growth is primarily input-driven and total factor
productivity increases are negligible if not zero (Forstner et al 2001, Krugman 1994, Young
1995, Collins and Bosworth 1997). Thus, aid to economic infrastructure might impact the
economic growth through capital accumulation if it does impact at all.
Second, the test of the impact of aid to economic infrastructure on the investment
ratio shows that this impact is positive and statistically significant for recipient countries with
high and medium quality of governance, but virtually insignificant (both practically and
statistically) for countries with low quality of governance, on average. The estimated
coefficients (DOD model) for the interaction of the lagged (one period) aid to economic
infrastructure with medium and high levels of governance are 1.4 and 2.71, respectively.
This indicates that a percentage point increase in the aid to economic infrastructure to GDP
ratio in an average country with medium quality of governance leads to 1.4 percentage point
increase in the investment ratio. This impact is even greater in countries with high quality of
governance leading to 2.7 percent increase in the investment ratio, on average. Furthermore,
recalling the result from the growth equation, a percentage point increase in the investment
ratio is associated with 0.2 percentage point increase in average annual per capita GDP
growth, one can say that one standard deviation increase in aid to economic infrastructure to
GDP ratio leads to 0.67 % and 1.3 % increase in average annual per capita growth rates, on
average, respectively.
How can one explain these results? The contribution of aid to economic
infrastructure on investment and thus to economic growth is similar those of public

113
investment to infrastructure. Theoretically, the basic connection between infrastructure and
investment, and growth is simple. The stock of public highways, bridges, communication
systems, and other infrastructure is essential to the profitable and efficient private sector
production and distribution of goods and services. The potential importance of public
investment to economic infrastructure was discussed by Aschauer and Greenwood (1985).
First, an increase in public investment on infrastructure would be expected directly to raise
the level of domestic investment. Second, under certain circumstances, public capital
(infrastructure) and private factors of production – labor and capital – may be
complementary inputs in the production process so that an increase in the stock of economic
infrastructure reduces the cost of capital and thereby increases the demand for private
investment. Donors’ decision to increase aid to economic infrastructure might well
encourage domestic and foreign investors to invest more in the country. The predictions of
the economic theory are supported by empirical evidence on the positive and significant
impact of public investment on private capital spending (Aschauer 1989, Munnel 1990, and
Holtz-Eakin 1992).
The empirical evidence also indicates that the quality of governance will not only impact the
selection of new infrastructure projects, but will also affect the rate of return that a country
gets from its existing infrastructure (Tanzi and Davoodi 1997). Tanzi and Davoodi (1997)
provide the following reasons for this evidence: first, to the extent that corruption is
persistent, the existing infrastructure has also been contaminated because past investments
were also misdirected or distorted by corruption; second, higher spending on new
infrastructure projects will reduce the resources available to maintain existing infrastructure.
The implications of theoretical underpinning and empirical evidence for the results
are as follows. First, countries with better governance are probably using the aid to economic
infrastructure more efficiently, and thereby the investment ratio in these countries is
positively influenced by aid to economic infrastructure through its direct addition to
domestic investment and indirect impact by reducing the cost of capital and thus increasing
demand for private investment. In contrast, countries with low quality of governance are
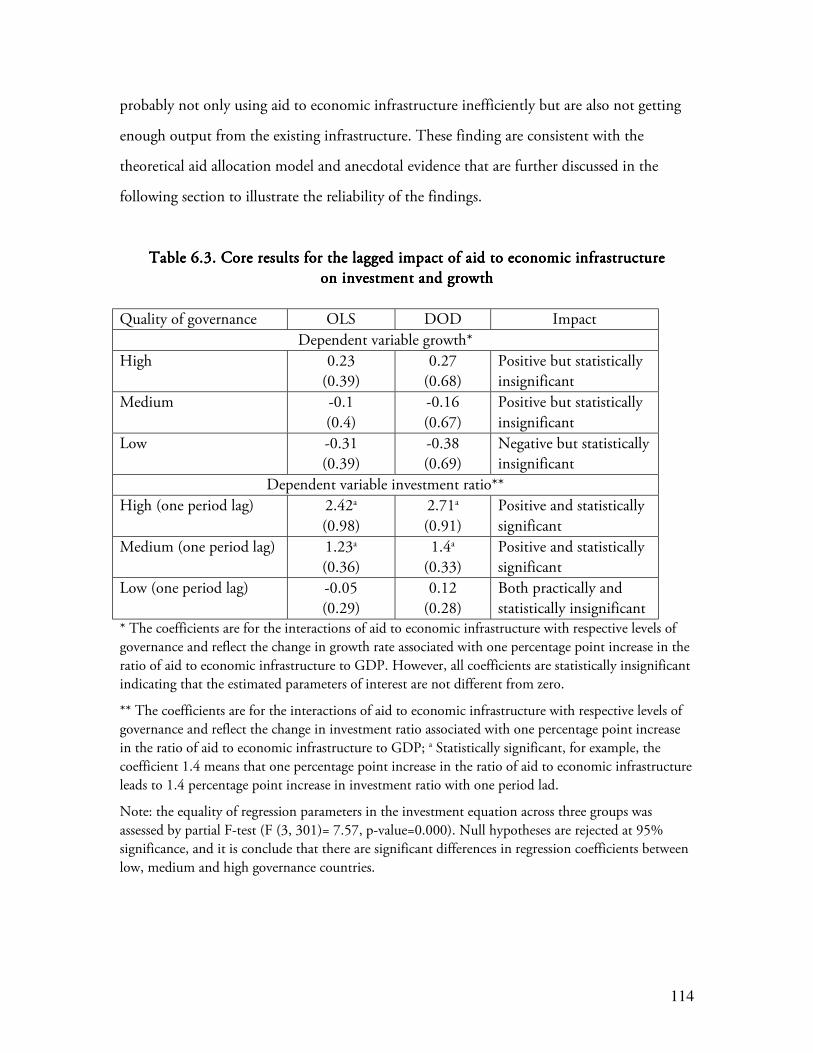
114
probably not only using aid to economic infrastructure inefficiently but are also not getting
enough output from the existing infrastructure. These finding are consistent with the
theoretical aid allocation model and anecdotal evidence that are further discussed in the
following section to illustrate the reliability of the findings.
Table 6.3. Core results for the lagged impact of aid to economic infrastructureTable 6.3. Core results for the lagged impact of aid to economic infrastructureTable 6.3. Core results for the lagged impact of aid to economic infrastructureTable 6.3. Core results for the lagged impact of aid to economic infrastructure
on investment and growthon investment and growthon investment and growthon investment and growth
Quality of governance OLS DOD Impact
Dependent variable growth*
High 0.23
(0.39)
0.27
(0.68)
Positive but statistically
insignificant
Medium -0.1
(0.4)
-0.16
(0.67)
Positive but statistically
insignificant
Low -0.31
(0.39)
-0.38
(0.69)
Negative but statistically
insignificant
Dependent variable investment ratio**
High (one period lag) 2.42a
(0.98)
2.71a
(0.91)
Positive and statistically
significant
Medium (one period lag) 1.23a
(0.36)
1.4a
(0.33)
Positive and statistically
significant
Low (one period lag) -0.05
(0.29)
0.12
(0.28)
Both practically and
statistically insignificant * The coefficients are for the interactions of aid to economic infrastructure with respective levels of
governance and reflect the change in growth rate associated with one percentage point increase in the
ratio of aid to economic infrastructure to GDP. However, all coefficients are statistically insignificant
indicating that the estimated parameters of interest are not different from zero.
** The coefficients are for the interactions of aid to economic infrastructure with respective levels of
governance and reflect the change in investment ratio associated with one percentage point increase
in the ratio of aid to economic infrastructure to GDP; a Statistically significant, for example, the
coefficient 1.4 means that one percentage point increase in the ratio of aid to economic infrastructure
leads to 1.4 percentage point increase in investment ratio with one period lad.
Note: the equality of regression parameters in the investment equation across three groups was
assessed by partial F-test (F (3, 301)= 7.57, p-value=0.000). Null hypotheses are rejected at 95%
significance, and it is conclude that there are significant differences in regression coefficients between
low, medium and high governance countries.

115
Now let us turn to test the third hypothesis. Table 6.4 reports the results of the test
on the impact of aid to social sector on creating additional human capital. As is evident in
this table, overall aid to social sector has a lagged negative and statistically significant effect
on years of schooling. However, its effect in countries with a medium quality of governance
is insignificant and in countries with a low quality of governance is positive and statistically
significant. However, this effect is very small. One standard deviation increase in aid to social
sector to GDP ratio will lead to only 0.13 years increase in average years of schooling, on
average. Both the lagged stock and flow of human capital affect the per capita growth. If the
effect of the flow of human capital is positive and statistically significant, the effect of the
lagged stock of human capital on growth is positive but statistically insignificant.
Additionally, the flow of human capital also affects growth indirectly via investment.
The results on the impact of aid to social sector on years of schooling, except for
countries with low quality of governance, contradict my expectations. Obviously, one would
expect that aid to social sector would help to increase the average years of schooling.
However, there seem some plausible explanations for these results. First, the dependent
variable is average years of schooling, and I am trying to estimate the impact of aid to social
sector on average years of schooling with one period lag, i.e., in five years. However, it is
possible that the full effect of social spending on average years of schooling will realize in a
longer period of time. Moreover, aid to social sector includes aid to education, health care,
water and sanitation. Perhaps, the spending on health, water and sanitation will have an
impact on average years of schooling indirectly via health capital. In fact, the human capital
model includes lagged health capital as an explanatory variable and its effect on average years
of schooling is positive and significant (table 6.8).
Second, the quality of data for developing countries in general, and on average years
of schooling in particular, are very poor quality and contains a lot of measurement error. For
example, Tooley and Dixon (2006) in a recent edition of the Index of Economic Freedom,
sponsored by the Heritage Foundation and The Wall Street Journal, report that government
data on education in the Lagos State of Nigeria underestimates the number of children in
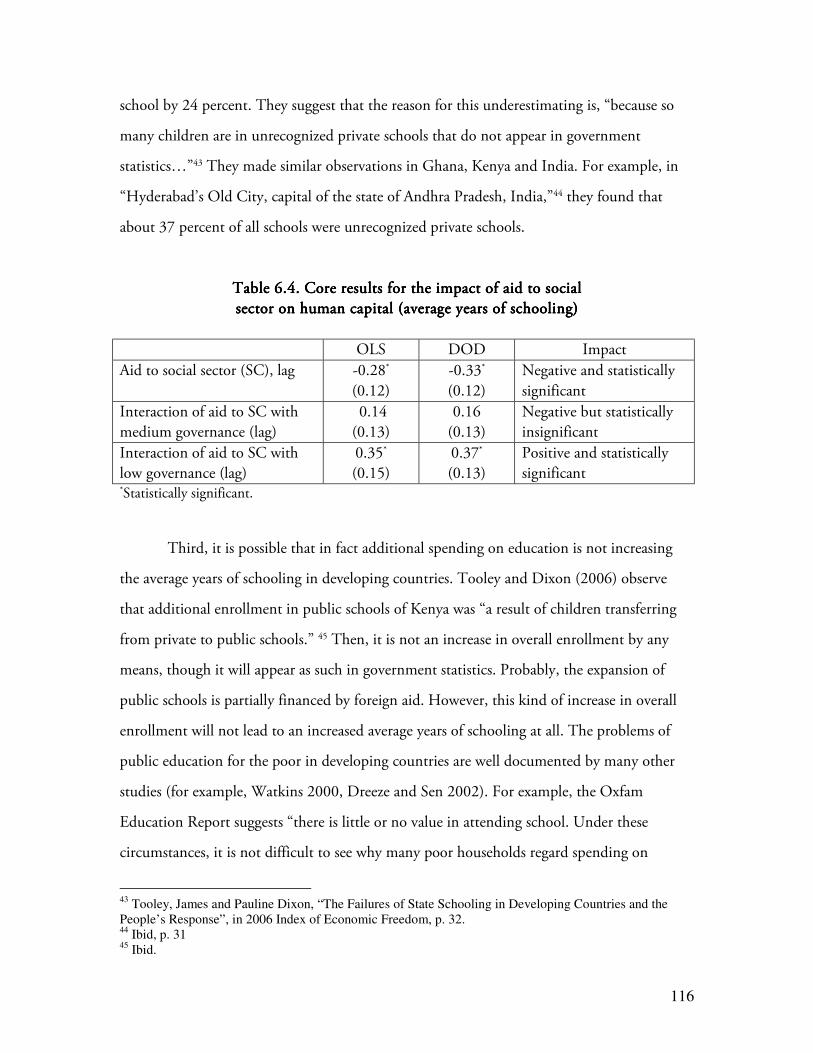
116
school by 24 percent. They suggest that the reason for this underestimating is, “because so
many children are in unrecognized private schools that do not appear in government
statistics…”43 They made similar observations in Ghana, Kenya and India. For example, in
“Hyderabad’s Old City, capital of the state of Andhra Pradesh, India,”44 they found that
about 37 percent of all schools were unrecognized private schools.
Table 6.4. Core results for the impact of aid to socialTable 6.4. Core results for the impact of aid to socialTable 6.4. Core results for the impact of aid to socialTable 6.4. Core results for the impact of aid to social
sector on human capital (average years of schooling)sector on human capital (average years of schooling)sector on human capital (average years of schooling)sector on human capital (average years of schooling)
OLS DOD Impact
Aid to social sector (SC), lag -0.28*
(0.12)
-0.33*
(0.12)
Negative and statistically
significant
Interaction of aid to SC with
medium governance (lag)
0.14
(0.13)
0.16
(0.13)
Negative but statistically
insignificant
Interaction of aid to SC with
low governance (lag)
0.35*
(0.15)
0.37*
(0.13)
Positive and statistically
significant *Statistically significant.
Third, it is possible that in fact additional spending on education is not increasing
the average years of schooling in developing countries. Tooley and Dixon (2006) observe
that additional enrollment in public schools of Kenya was “a result of children transferring
from private to public schools.” 45 Then, it is not an increase in overall enrollment by any
means, though it will appear as such in government statistics. Probably, the expansion of
public schools is partially financed by foreign aid. However, this kind of increase in overall
enrollment will not lead to an increased average years of schooling at all. The problems of
public education for the poor in developing countries are well documented by many other
studies (for example, Watkins 2000, Dreeze and Sen 2002). For example, the Oxfam
Education Report suggests “there is little or no value in attending school. Under these
circumstances, it is not difficult to see why many poor households regard spending on
43 Tooley, James and Pauline Dixon, “The Failures of State Schooling in Developing Countries and the People’s Response”, in 2006 Index of Economic Freedom, p. 32. 44 Ibid, p. 31 45 Ibid.
117
(public) education as a bad use of scarce resources.”46 Dreeze and Sen (2002) observed
similar evidence of gross failure of public education for the poor in India.
The results from the baseline (DOD) model with respect to other control variables
are as follows:
Accumulated health capital (life expectancy at birth) positively impacts both
investment and growth with one period lag. However, its impact on growth is
statistically insignificant. Thus, health capital helps boost growth via its effects on
investment and schooling. Although I did not estimate the health capital equation,
there is possibility that aid to social sector has positive impact on health capital.
The institutional quality of governance has both direct and indirect (via investment)
effects on per capita growth. The coefficients for institutional quality are positive and
statistically significant in both growth and investment equations. The direct effect of
democracy on dependent variables is statistically insignificant, except for low quality
of governance. Countries with poor democratic quality of governance, all other
things being equal, tend to have growth of about 1.1 percent lower per annum than
other countries with better governance, the effect capturing the impact of a discrete
change in governance.
As to other control variables, initial income levels matter for per capita growth, and
its impact is negative as expected, i.e., average growth rates diminish as per capita
income rises, all other things being equal. Inflation has direct negative impact on
growth, but its impact on investment is negative only in high inflation environments.
Trade openness has no direct significant impact on growth but its impact via
investment is positive. The financial depth has positive indirect impact on growth via
investment. Foreign direct investment positively influences the investment ratio, but
the coefficient is less than one. One percentage point increase in FDI to GDP ratio
associates only with a half percentage point increase in investment ratio, on average.
46 K. Watkins, “The Oxfam education report”, 2000, p. 230.
118
The human capital equation suggests that the years of schooling are positively
associated with gender parity in education and negatively correlated with the age
structure of population. The share of urban population has no significant association
with years of schooling. Countries with poor democratic quality of governance, other
things being equal, have average years of schooling of about 0.8 years lower than
other countries. This effect captures the impact of a discrete change in governance
from lower-than-medium to higher-than-medium.
The estimated coefficients are consistent under different estimators and changes in
model specifications. In the next section, I will discuss the robustness of the results.
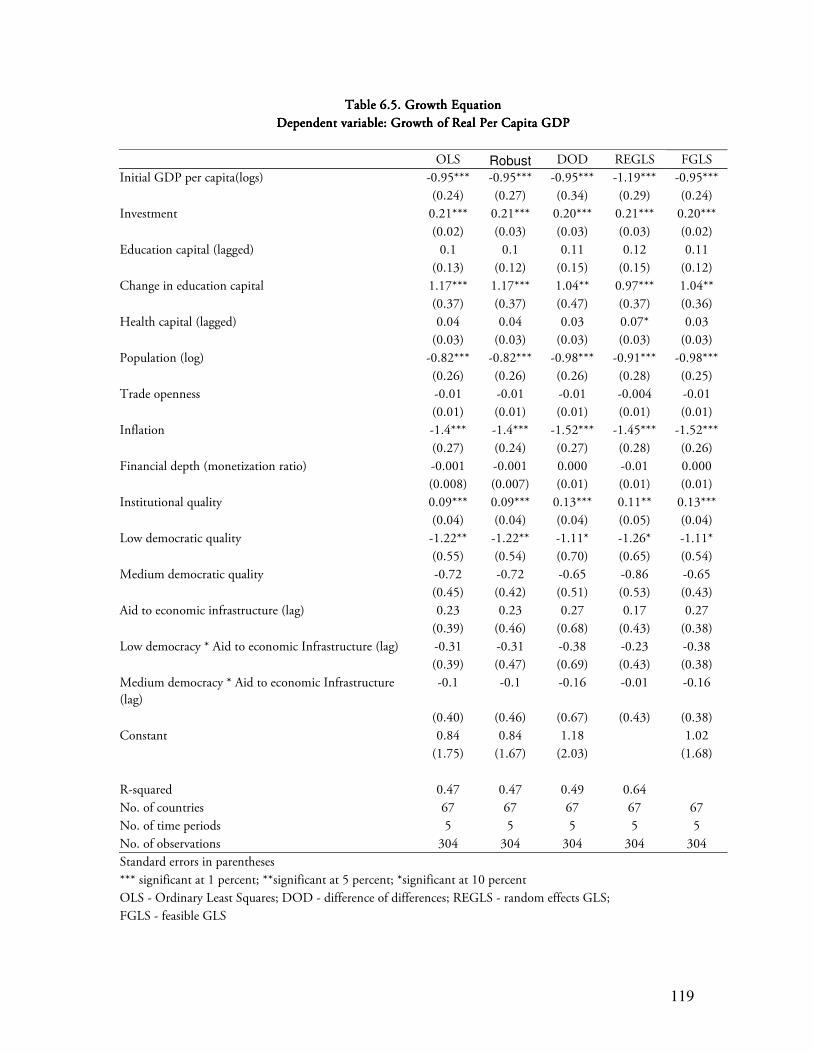
119
Table 6.5. Growth EquationTable 6.5. Growth EquationTable 6.5. Growth EquationTable 6.5. Growth Equation
Dependent variable: Growth of Real Per Capita GDPDependent variable: Growth of Real Per Capita GDPDependent variable: Growth of Real Per Capita GDPDependent variable: Growth of Real Per Capita GDP
OLS Robust DOD REGLS FGLS
-0.95*** -0.95*** -0.95*** -1.19*** -0.95*** Initial GDP per capita(logs)
(0.24) (0.27) (0.34) (0.29) (0.24)
Investment 0.21*** 0.21*** 0.20*** 0.21*** 0.20***
(0.02) (0.03) (0.03) (0.03) (0.02)
Education capital (lagged) 0.1 0.1 0.11 0.12 0.11
(0.13) (0.12) (0.15) (0.15) (0.12)
Change in education capital 1.17*** 1.17*** 1.04** 0.97*** 1.04**
(0.37) (0.37) (0.47) (0.37) (0.36)
Health capital (lagged) 0.04 0.04 0.03 0.07* 0.03
(0.03) (0.03) (0.03) (0.03) (0.03)
Population (log) -0.82*** -0.82*** -0.98*** -0.91*** -0.98***
(0.26) (0.26) (0.26) (0.28) (0.25)
Trade openness -0.01 -0.01 -0.01 -0.004 -0.01
(0.01) (0.01) (0.01) (0.01) (0.01)
Inflation -1.4*** -1.4*** -1.52*** -1.45*** -1.52***
(0.27) (0.24) (0.27) (0.28) (0.26)
Financial depth (monetization ratio) -0.001 -0.001 0.000 -0.01 0.000
(0.008) (0.007) (0.01) (0.01) (0.01)
Institutional quality 0.09*** 0.09*** 0.13*** 0.11** 0.13***
(0.04) (0.04) (0.04) (0.05) (0.04)
Low democratic quality -1.22** -1.22** -1.11* -1.26* -1.11*
(0.55) (0.54) (0.70) (0.65) (0.54)
Medium democratic quality -0.72 -0.72 -0.65 -0.86 -0.65
(0.45) (0.42) (0.51) (0.53) (0.43)
Aid to economic infrastructure (lag) 0.23 0.23 0.27 0.17 0.27
(0.39) (0.46) (0.68) (0.43) (0.38)
Low democracy * Aid to economic Infrastructure (lag) -0.31 -0.31 -0.38 -0.23 -0.38
(0.39) (0.47) (0.69) (0.43) (0.38)
Medium democracy * Aid to economic Infrastructure
(lag)
-0.1 -0.1 -0.16 -0.01 -0.16
(0.40) (0.46) (0.67) (0.43) (0.38)
Constant 0.84 0.84 1.18 1.02
(1.75) (1.67) (2.03) (1.68)
R-squared 0.47 0.47 0.49 0.64
No. of countries 67 67 67 67 67
No. of time periods 5 5 5 5 5
No. of observations 304 304 304 304 304
Standard errors in parentheses *** significant at 1 percent; **significant at 5 percent; *significant at 10 percent
OLS - Ordinary Least Squares; DOD - difference of differences; REGLS - random effects GLS;
FGLS - feasible GLS
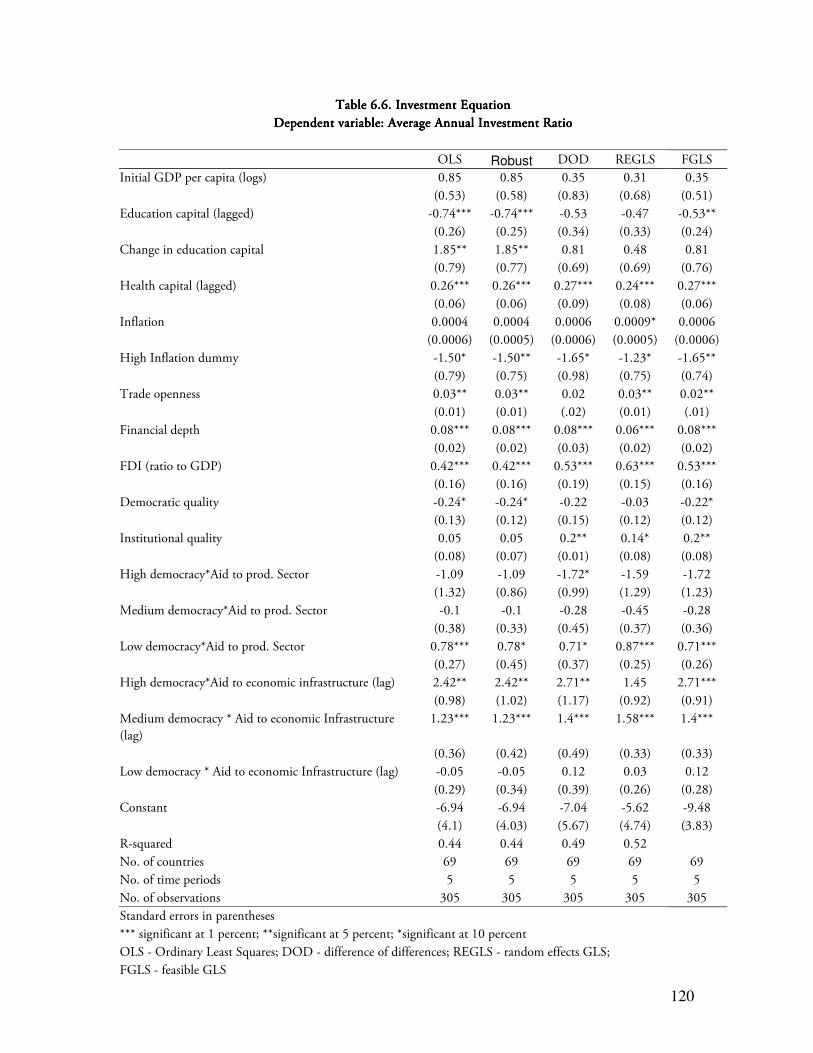
120
Table 6.6. Investment EquationTable 6.6. Investment EquationTable 6.6. Investment EquationTable 6.6. Investment Equation
Dependent variable: Average Annual Investment RatioDependent variable: Average Annual Investment RatioDependent variable: Average Annual Investment RatioDependent variable: Average Annual Investment Ratio
OLS Robust DOD REGLS FGLS
0.85 0.85 0.35 0.31 0.35 Initial GDP per capita (logs)
(0.53) (0.58) (0.83) (0.68) (0.51)
Education capital (lagged) -0.74*** -0.74*** -0.53 -0.47 -0.53**
(0.26) (0.25) (0.34) (0.33) (0.24)
Change in education capital 1.85** 1.85** 0.81 0.48 0.81
(0.79) (0.77) (0.69) (0.69) (0.76)
Health capital (lagged) 0.26*** 0.26*** 0.27*** 0.24*** 0.27***
(0.06) (0.06) (0.09) (0.08) (0.06)
Inflation 0.0004 0.0004 0.0006 0.0009* 0.0006
(0.0006) (0.0005) (0.0006) (0.0005) (0.0006)
High Inflation dummy -1.50* -1.50** -1.65* -1.23* -1.65**
(0.79) (0.75) (0.98) (0.75) (0.74)
Trade openness 0.03** 0.03** 0.02 0.03** 0.02**
(0.01) (0.01) (.02) (0.01) (.01)
Financial depth 0.08*** 0.08*** 0.08*** 0.06*** 0.08***
(0.02) (0.02) (0.03) (0.02) (0.02)
FDI (ratio to GDP) 0.42*** 0.42*** 0.53*** 0.63*** 0.53***
(0.16) (0.16) (0.19) (0.15) (0.16)
Democratic quality -0.24* -0.24* -0.22 -0.03 -0.22*
(0.13) (0.12) (0.15) (0.12) (0.12)
Institutional quality 0.05 0.05 0.2** 0.14* 0.2**
(0.08) (0.07) (0.01) (0.08) (0.08)
High democracy*Aid to prod. Sector -1.09 -1.09 -1.72* -1.59 -1.72
(1.32) (0.86) (0.99) (1.29) (1.23)
Medium democracy*Aid to prod. Sector -0.1 -0.1 -0.28 -0.45 -0.28
(0.38) (0.33) (0.45) (0.37) (0.36)
Low democracy*Aid to prod. Sector 0.78*** 0.78* 0.71* 0.87*** 0.71***
(0.27) (0.45) (0.37) (0.25) (0.26)
High democracy*Aid to economic infrastructure (lag) 2.42** 2.42** 2.71** 1.45 2.71***
(0.98) (1.02) (1.17) (0.92) (0.91)
Medium democracy * Aid to economic Infrastructure
(lag)
1.23*** 1.23*** 1.4*** 1.58*** 1.4***
(0.36) (0.42) (0.49) (0.33) (0.33)
Low democracy * Aid to economic Infrastructure (lag) -0.05 -0.05 0.12 0.03 0.12
(0.29) (0.34) (0.39) (0.26) (0.28)
Constant -6.94 -6.94 -7.04 -5.62 -9.48
(4.1) (4.03) (5.67) (4.74) (3.83)
R-squared 0.44 0.44 0.49 0.52
No. of countries 69 69 69 69 69
No. of time periods 5 5 5 5 5
No. of observations 305 305 305 305 305
Standard errors in parentheses *** significant at 1 percent; **significant at 5 percent; *significant at 10 percent OLS - Ordinary Least Squares; DOD - difference of differences; REGLS - random effects GLS;
FGLS - feasible GLS

121
Table 6.7. Human Capital Equation (excluding institutional quality variable)Table 6.7. Human Capital Equation (excluding institutional quality variable)Table 6.7. Human Capital Equation (excluding institutional quality variable)Table 6.7. Human Capital Equation (excluding institutional quality variable)
Dependent variable: Average Years of SchoolingDependent variable: Average Years of SchoolingDependent variable: Average Years of SchoolingDependent variable: Average Years of Schooling
OLS Robust DOD REGLS FGLS
0.02 0.02 0.1 0.40*** 0.1 Current GDP per capita (logs)
(0.13) (0.14) (0.25) (0.12) (0.13)
Health capital (lagged life expectancy) 0.05*** 0.05*** 0.04* 0.01 0.04***
(0.01) (0.01) (0.02) (0.01) (0.01)
Urban population (share) 0.01** 0.01** 0.01 0.02*** 0.01*
(0.005) (0.005) (0.01) (0.01) (0.01)
Population under 15 (share) -0.08*** -0.08*** -0.07*** -0.06*** -0.07***
(0.01) (0.01) (0.02) (0.01) (0.01)
Gender parity in education 0.04*** 0.04*** 0.04*** 0.02*** 0.04***
(0.01) (0.01) (.01) (0.01) (.01)
Log of education expendures (lag) 0.36** 0.36** 0.34 0.19* 0.34**
(0.16) (0.16) (0.25) (0.10) (0.15)
Low democracy -0.73*** -0.73*** -0.79* -0.86** -0.79***
(0.24) (0.24) (0.43) (0.35) (0.23)
Medium democracy -0.33* -0.33 -0.37 -0.52 -0.37*
(0.2) (0.23) (0.42) (0.32) (0.19)
Aid to social sector (lag) -0.28** -0.28*** -0.33*** -0.18** -0.33***
(0.12) (0.09) (0.12) (0.07) (0.12)
Low democracy * Aid to social sector (lag) 0.35*** 0.35*** 0.37** 0.16** 0.37***
(0.13) (0.10) (0.15) (0.08) (0.13)
Medium democracy * Aid to social sector (lag)
0.14 0.14 0.16 0.14* 0.16
(0.13) (0.09) (0.14) (0.08) (0.13)
Constant 0.86 0.86 0.36 0.91 0.61
(1.1) (1.15) (1.89) (1.25) (1.1)
R-squared 0.79 0.79 0.8 0.79
No. of countries 80 80 80 80 80
No. of time periods 5 5 5 5 5
No. of observations 291 291 291 291 291
Standard errors in parentheses *** significant at 1 percent; **significant at 5 percent; *significant at 10 percent OLS - Ordinary Least Squares; DOD - difference of differences; REGLS - random effects GLS;
FGLS - feasible GLS
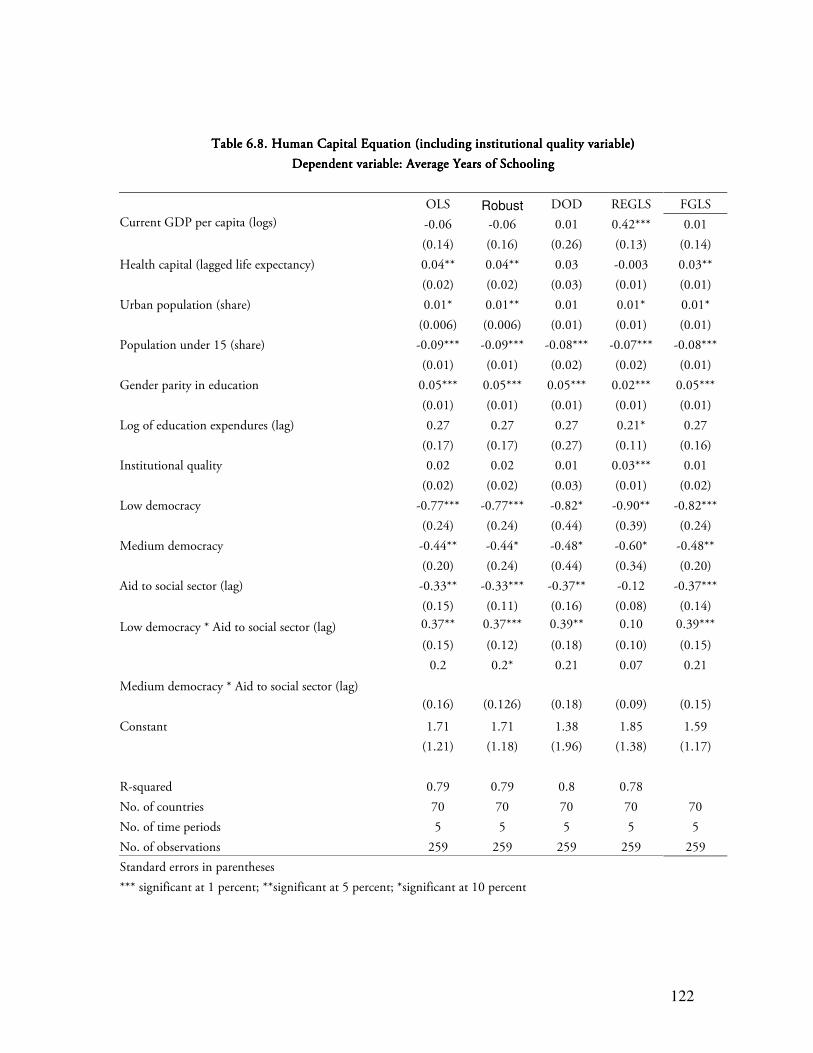
122
Table 6.8. Human Capital Equation (including institutional quality variable)Table 6.8. Human Capital Equation (including institutional quality variable)Table 6.8. Human Capital Equation (including institutional quality variable)Table 6.8. Human Capital Equation (including institutional quality variable)
Dependent variable: Average Years of SchoolingDependent variable: Average Years of SchoolingDependent variable: Average Years of SchoolingDependent variable: Average Years of Schooling
OLS Robust DOD REGLS FGLS
-0.06 -0.06 0.01 0.42*** 0.01 Current GDP per capita (logs)
(0.14) (0.16) (0.26) (0.13) (0.14)
Health capital (lagged life expectancy) 0.04** 0.04** 0.03 -0.003 0.03**
(0.02) (0.02) (0.03) (0.01) (0.01)
Urban population (share) 0.01* 0.01** 0.01 0.01* 0.01*
(0.006) (0.006) (0.01) (0.01) (0.01)
Population under 15 (share) -0.09*** -0.09*** -0.08*** -0.07*** -0.08***
(0.01) (0.01) (0.02) (0.02) (0.01)
Gender parity in education 0.05*** 0.05*** 0.05*** 0.02*** 0.05***
(0.01) (0.01) (0.01) (0.01) (0.01)
Log of education expendures (lag) 0.27 0.27 0.27 0.21* 0.27
(0.17) (0.17) (0.27) (0.11) (0.16)
Institutional quality 0.02 0.02 0.01 0.03*** 0.01
(0.02) (0.02) (0.03) (0.01) (0.02)
Low democracy -0.77*** -0.77*** -0.82* -0.90** -0.82***
(0.24) (0.24) (0.44) (0.39) (0.24)
Medium democracy -0.44** -0.44* -0.48* -0.60* -0.48**
(0.20) (0.24) (0.44) (0.34) (0.20)
Aid to social sector (lag) -0.33** -0.33*** -0.37** -0.12 -0.37***
(0.15) (0.11) (0.16) (0.08) (0.14)
Low democracy * Aid to social sector (lag) 0.37** 0.37*** 0.39** 0.10 0.39***
(0.15) (0.12) (0.18) (0.10) (0.15)
Medium democracy * Aid to social sector (lag)
0.2 0.2* 0.21 0.07 0.21
(0.16) (0.126) (0.18) (0.09) (0.15)
Constant 1.71 1.71 1.38 1.85 1.59
(1.21) (1.18) (1.96) (1.38) (1.17)
R-squared 0.79 0.79 0.8 0.78
No. of countries 70 70 70 70 70
No. of time periods 5 5 5 5 5
No. of observations 259 259 259 259 259
Standard errors in parentheses *** significant at 1 percent; **significant at 5 percent; *significant at 10 percent
123
6.1.2 Checking the Robustness of Results
In this section, the results from the preceding section are subjected to several
robustness checks. The estimated models generate parameter estimates that are generally
robust with respect to a several changes. The results do not change dramatically if we:
• Control for the impact of outliers using robust regression estimator.
• Check for the presence of autocorrelation within panels and cross-sectional
correlation and/or heteroskedasticity across panels using feasible generalized least
squares estimator.
• Change model specifications by adding and dropping additional control
variables.
In most cases, the results from these models are consistent with the baseline
specification, and all equations have a good fit. Tables 6.5-6.8 also report the results from the
GLS random effects estimator. However, the results from this model are sometimes
noticeably different from other estimates in the study. This is expected because the Hausman
specification test, the classical test of model specification, does not indicate the
appropriateness of the random effects estimator. If there is correlation between the
unobserved country-specific random effects and the regressors, then the random effects
model may not be more powerful and parsimonious. In the presence of such a correlation,
the random effects model would be inconsistently estimated, and thus the results from DOD
and FGLS models would be the consistent estimates of the parameters of interest.
The results for key independent variables are robust across all estimated models with
minor fluctuations47. For example, the estimated coefficient for the interaction of aid to
production sector with low governance varies between 0.71 (DOD model) and 0.87
(random effects GLS model), and statistically significant across all models (table 6.5).
47 I did not find any alternative governance measures that provide sufficient time series data to check the robustness of our results. However, using an alternative governance measure would not most likely generate inconsistent results, given the strong cross-sectional correlations we found among various governance measures (0.6-0.9).
124
Similarly, the estimated coefficient for the interaction of aid to economic infrastructure with
medium governance fluctuates in the interval between 1.23 (OLS model) and 1.58 (random
effects GLS model), and it is statistically significant across all estimated models (table 6.5).
However, the estimated coefficient for the interaction of aid to economic infrastructure with
high governance, from the random effects GLS model, is significantly smaller than the results
of other models, though its sign does not change (table 6.5). Nevertheless, I do not worry
about this result. As noted before, in the presence of correlation between the unobserved
country-specific random effects and the regressors, the random effects GLS model might
produce inconsistent results. The estimated coefficients for key independent variables in
human capital equation (table 6.6 and table 6.7) are also robust across all models, except
random effects GLS model including institutional quality variable. The estimates for other
key independent variables are also consistent across all estimated models.
Further, the estimates on direct impact of governance on growth and other
dependent variables are also broadly robust across all estimated models and consistent with
the literature. The different specifications of the growth model suggest that a discrete jump
from a low-governance to a high governance country is associated with an increase in the per
capita GDP growth rate of about 1.1 to 1.3 percentage points. This effect is similar to the
results obtained by Baldacci et al (2004) and Mauro (1996). For example, Baldacci (2004)
finds that a discrete jump from a low-governance country to a high-governance country is
associated with a 1.6 percentage point increase in the growth rate.
Furthermore, the estimates for control variables, such as inflation, openness,
population, financial depth, gender parity in education, foreign direct investment are also
generally robust across all estimated models and consistent with literature. For example,
Baldacci (2004) finds that, on average, high inflation countries are likely to have about 1.8
percentage point lower annual growth rate than other countries. The estimated parameters
suggest that high inflation countries are likely to have about 1.7 percentage point lower
growth rate per annum than other countries.
125
6.2. Aid Allocation
The objective here is to explore donors aid allocation policies. The key independent
variable in the analyses is the quality of governance. Particularly, the focus is on democratic
quality of governance. In the analysis, we want to see how recipients’ quality of governance
influences donors’ aid allocation decisions. I start with aggregate aid flows and then turn to
aid allocation decisions of individual donors.
6.2.1 Aggregate aid flows
The regression results on aggregate aid flows are reported in tables 6.9-6.13. I start
with a simpler standard model, such as probit (eligibility stage) and OLS (level stage); then I
provide the results from more sophisticated estimations. The results are robust and do not
change dramatically when we:
• Control for donor, recipient and period fixed effects.
• Use more sophisticated estimators such as random effects probit (eligibility stage)
and FGLS (level stage), random effects tobit (sector stage).
• Add and drop additional control variables.
Aid Eligibility StageAid Eligibility StageAid Eligibility StageAid Eligibility Stage
At aggregate level, the democratic quality of governance positively influences the
likelihood of being eligible for foreign aid and the estimated coefficient is statistically
significant. By using probit results, one may suggest that low-governance countries have
about 0.2-point (associated with estimated coefficient of –1.05, table 6.8, probit model 2)
lower probability of receiving foreign aid than high-governance countries, all other things
being equal. Similarly, medium-governance countries have about 0.16-point (associated with

126
estimated coefficient of -0.79) lower probability of receiving foreign aid, all other things
being equal. These effects would change slightly when one uses the results from random
effects probit estimators with recipients as an independent unit, and donor and period fixed
effects (table 6.8, RE Probit models 1-4). Nevertheless, I suggest, based on these findings,
that the democratic quality of governance positively influences the eligibility of developing
countries to receive a foreign aid. With respect to the institutional quality of governance, the
probit model shows that it also positively affects the dependent variable, but its marginal
impact on the probability of aid eligibility is very small. Moreover, the random effects probit
model indicates that the marginal effect of the institutional quality of governance on aid
eligibility is virtually none. Therefore, we cannot reject the null hypothesis that institutional
quality of governance has no effect on aid eligibility.
As different variations of random effects probit models suggest, on average,
population size plays a positive role in the aid eligibility decisions at aggregate level. As
expected, per capita income has significant and negative effect on aid eligibility, which
suggests that donors are more likely to select poorer countries, but life expectancy plays an
insignificant role in donors’ decision making once per capita income is controlled for. As
concerns donors’ interests, on average, donors seem select their trade partners with greater
probability. The estimates also suggest that so-called “bandwagon effects” have positive
influence on aid eligibility. These results are consistent with our theoretical model of aid
allocation. The coefficients for a failed state dummy, political similarity, and US military
grants are inconsistent across estimated models, but insignificant most of the time indicating
that they are not important in determining the eligibility for foreign aid.
Aid Levels StageAid Levels StageAid Levels StageAid Levels Stage
Let us turn to the aid levels stage and examine whether the quality of governance
influences donors’ decisions at this stage. All estimated models have a good fit and explain
about 60 to 70 percent of the variations in per capita aid disbursements. The estimated
127
results suggest (table 6.9) that the democratic quality of governance has significant positive
effect on the amount of per capita aid flows. At the margin, low-governance countries receive
about 0.73-0.95 percent or 0.48-0.62 dollars less per capita aid than high governance
countries. Similar results, but with smaller magnitude, can be observed with respect
medium-governance countries. The result for institutional quality of governance is
insignificant.
The results also suggest that, similarly to eligibility stage, recipient needs play a
positive and significant role in donors aid allocation decision. The estimated coefficients for
recipient needs variables (income per capita and life expectancy) are significant across all
estimated models. For example, a one percent decline in GDP per capita associates with 0.77
to 1.1 percent increase in per capita aid disbursements, depending on the specification of the
estimated model. Similarly, a one year change in life expectancy associates with about 1 to 3
percent change in per capita aid flows received. As concerns donors’ interests (trade link and
political similarities), only trade links have significant positive association with per capita aid
disbursements. On average, one percent increase in exports from a donor country to
recipient country is associated with about 0.5 percent to 0.8 percent increase in per capita aid
disbursements.
Besides explaining the allocation of aid flows with respect to quality of governance,
recipient needs and donor interests, the estimates show that there is a systematic bias with
respect to population size, which is consistent with past studies. More populous countries
receive less aid in per capita terms. Further, theoretical models of aid allocation predict so-
called “bandwagon effect” have significant positive association with per capita aid
disbursements. The elasticity of per capita aid disbursements with respect to per capita aid
received from other donors varies from 0.4 to 0.8 based on various specification of the
model. Among all estimated models, only one model (Probit 3) suggests that failed states
receive more per capita aid at the margin. Surprisingly political similarities between donors
and recipients have a significant negative impact on per capita aid disbursements.
128
Sectoral Allocation Stage Sectoral Allocation Stage Sectoral Allocation Stage Sectoral Allocation Stage
Tables 6.10-6.12 provide information on the results of sectoral allocation models.
The analysis of these results with respect to governance suggest that democratic quality of
governance has statistically significant positive impact per capita aid to production and social
sectors, but its impacts on aid per capita aid to economic infrastructure is insignificant.
Other things being equal, low-governance countries receive about 0.5 percent less per capita
aid to social sector (table 6.11) and about a quarter percent less per capita aid to production
sectors (table 6.12) than high governance countries. However, I find no significant difference
between the three groups of countries with respect to per capita aid to economic
infrastructure (table 6.13). I also find no significant differences between medium- and high-
governance countries with respect to any categories of aid. The institutional quality of
governance has no significant impact on sectoral allocation of aid.
The effects of variables, which control for donor interests and recipient needs, on per
capita sectoral aid flows are similar to those found at aggregate level stage. The failed state
dummy has a significant negative effect on aid to production sector. On average, failed states
receive about 0.12 percent less per capita aid to production sectors than other countries.
The analysis at aggregate level suggests that donors’ aid allocation decisions are
somewhat affected by both donors’ own interests and recipient needs. Also interesting are the
results due to the quality of governance. These results suggest that recipients with better
governance have a higher marginal probability of being eligible to receive foreign aid. They
also receive more per capita aid at aggregate level as well as to production and social sectors,
at the margin. Further, I would like to investigate whether there is more evidence for an
impact of governance upon aid allocation once the aggregate aid flows are disaggregated into
individual bilateral donors. These relationships are investigated in the following section.

129
Table 6.9. Aid Equation: Eligibility Stage (all bilateral donors)Table 6.9. Aid Equation: Eligibility Stage (all bilateral donors)Table 6.9. Aid Equation: Eligibility Stage (all bilateral donors)Table 6.9. Aid Equation: Eligibility Stage (all bilateral donors)
Dependent variable: Eligibility DummyDependent variable: Eligibility DummyDependent variable: Eligibility DummyDependent variable: Eligibility Dummy
Probit RE Probit 1 2 3 1 2 3 4
GDP per capita (log) -0.60*** -0.62*** -0.55*** -0.44*** -0.46*** -0.42*** -0.43***
(0.04) (0.04) (0.03) (0.08) (0.08) (0.08) (0.06)
Population (log) -0.10*** -0.05 -0.002 0.26*** 0.30*** 0.30*** 0.25***
(0.03) (0.03) (0.02) (0.07) (0.06) (0.06) (0.05)
Life expectancy (log) -0.27 -0.1 -0.13 -0.33 -0.28 -0.43 -0.46
(0.21) (0.2) (0.16) (0.43) (0.42) (0.30) (0.36)
Exports (logs) 0.34*** 0.34*** 0.33*** 0.23*** 0.23*** 0.25*** 0.22***
(0.02) (0.02) (0.01) (0.03) (0.03) (0.02) (0.02)
Bandwagon Effect (log) 0.06* 0.15*** 0.11*** 0.37*** 0.45*** 0.32*** 0.30***
(0.03) (0.03) (0.02) (0.07) (0.06) (0.04) (0.03)
US military grants (log) -0.04*** -0.04*** -0.04*** 0.001 -0.001 -0.01
(0.01) (0.01) (0.01) (0.02) (0.02) (0.02)
Political similarity -0.18* -0.13* - 0.04 -0.06
(0.10) (0.10) (0.31) (0.30)
Failed State dummy 0.06 0.11* 0.13*** -0.06 0.003 0.02 0.07
(0.07) (0.07) (0.05) (0.11) (0.11) (0.08) (0.07)
Institutional quality 0.02*** 0.03*** 0.02*** -0.02* -0.02 -0.01 -0.01
(0.005) (0.005) (0.004) (0.01) (0.01) (0.01) (0.01)
Democratic quality 0.13*** 0.1***
(0.01) (0.02)
Low (autocracy) -1.05*** -0.90*** -1.11*** -1.07*** -1.02***
(0.09) (0.06) (0.2) (0.13) (0.14)
Medium -0.79*** -0.52*** -0.91*** -0.62*** -0.62***
(0.1) (0.06) (0.2) (0.12) (0.16)
Constant 6.95 5.17 4.53 7.97 6.52 6.52 2.71
No. of donor countries No. of recipients 98 99 98 99 101 105 No. of time periods 5 5 5 5 5 5 No. of observations 4526 4562 7806 4526 4562 7806 9558 Standard errors in parentheses *** significant at 1 percent; **significant at 5 percent; *significant at 10 percent
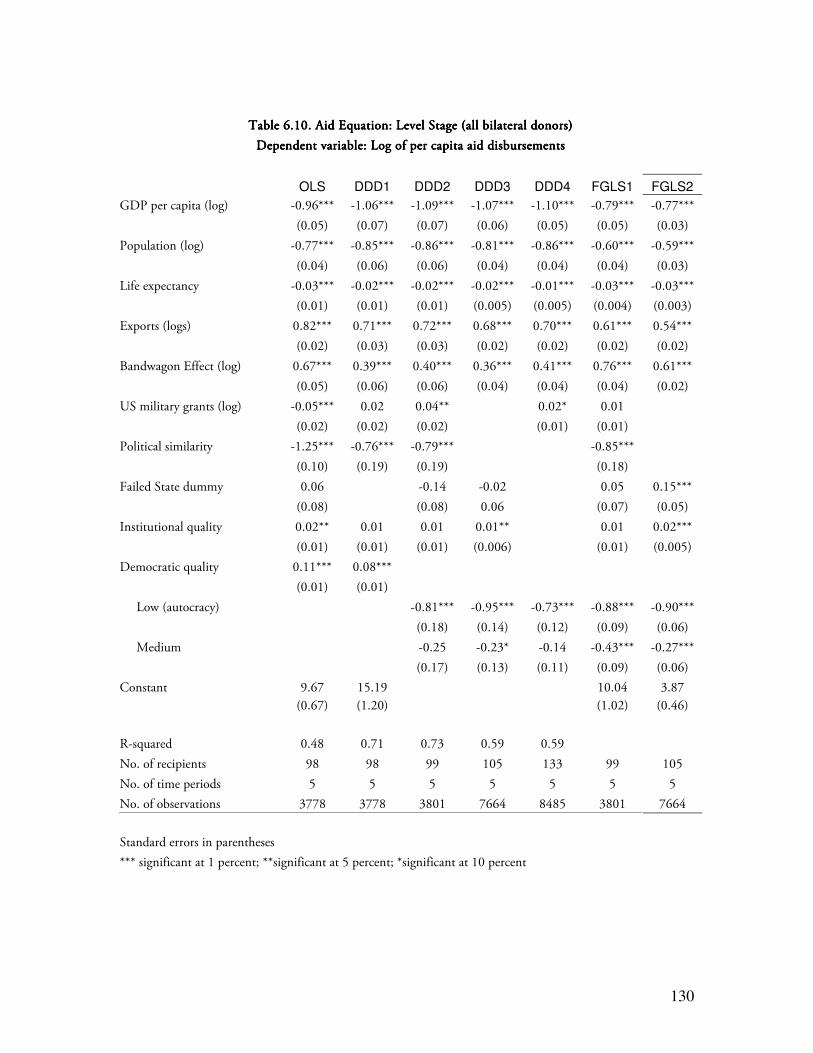
130
Table 6.10. Aid Equation: Level Stage Table 6.10. Aid Equation: Level Stage Table 6.10. Aid Equation: Level Stage Table 6.10. Aid Equation: Level Stage (all bilateral donors)(all bilateral donors)(all bilateral donors)(all bilateral donors)
Dependent variable: Log of per capita aid disbursementsDependent variable: Log of per capita aid disbursementsDependent variable: Log of per capita aid disbursementsDependent variable: Log of per capita aid disbursements
OLS DDD1 DDD2 DDD3 DDD4 FGLS1 FGLS2 GDP per capita (log) -0.96*** -1.06*** -1.09*** -1.07*** -1.10*** -0.79*** -0.77***
(0.05) (0.07) (0.07) (0.06) (0.05) (0.05) (0.03)
Population (log) -0.77*** -0.85*** -0.86*** -0.81*** -0.86*** -0.60*** -0.59***
(0.04) (0.06) (0.06) (0.04) (0.04) (0.04) (0.03)
Life expectancy -0.03*** -0.02*** -0.02*** -0.02*** -0.01*** -0.03*** -0.03***
(0.01) (0.01) (0.01) (0.005) (0.005) (0.004) (0.003)
Exports (logs) 0.82*** 0.71*** 0.72*** 0.68*** 0.70*** 0.61*** 0.54***
(0.02) (0.03) (0.03) (0.02) (0.02) (0.02) (0.02)
Bandwagon Effect (log) 0.67*** 0.39*** 0.40*** 0.36*** 0.41*** 0.76*** 0.61***
(0.05) (0.06) (0.06) (0.04) (0.04) (0.04) (0.02)
US military grants (log) -0.05*** 0.02 0.04** 0.02* 0.01
(0.02) (0.02) (0.02) (0.01) (0.01)
Political similarity -1.25*** -0.76*** -0.79*** -0.85***
(0.10) (0.19) (0.19) (0.18)
Failed State dummy 0.06 -0.14 -0.02 0.05 0.15***
(0.08) (0.08) 0.06 (0.07) (0.05)
Institutional quality 0.02** 0.01 0.01 0.01** 0.01 0.02***
(0.01) (0.01) (0.01) (0.006) (0.01) (0.005)
Democratic quality 0.11*** 0.08***
(0.01) (0.01)
Low (autocracy) -0.81*** -0.95*** -0.73*** -0.88*** -0.90***
(0.18) (0.14) (0.12) (0.09) (0.06)
Medium -0.25 -0.23* -0.14 -0.43*** -0.27***
(0.17) (0.13) (0.11) (0.09) (0.06)
Constant 9.67 15.19 10.04 3.87
(0.67) (1.20) (1.02) (0.46)
R-squared 0.48 0.71 0.73 0.59 0.59
No. of recipients 98 98 99 105 133 99 105
No. of time periods 5 5 5 5 5 5 5
No. of observations 3778 3778 3801 7664 8485 3801 7664
Standard errors in parentheses *** significant at 1 percent; **significant at 5 percent; *significant at 10 percent
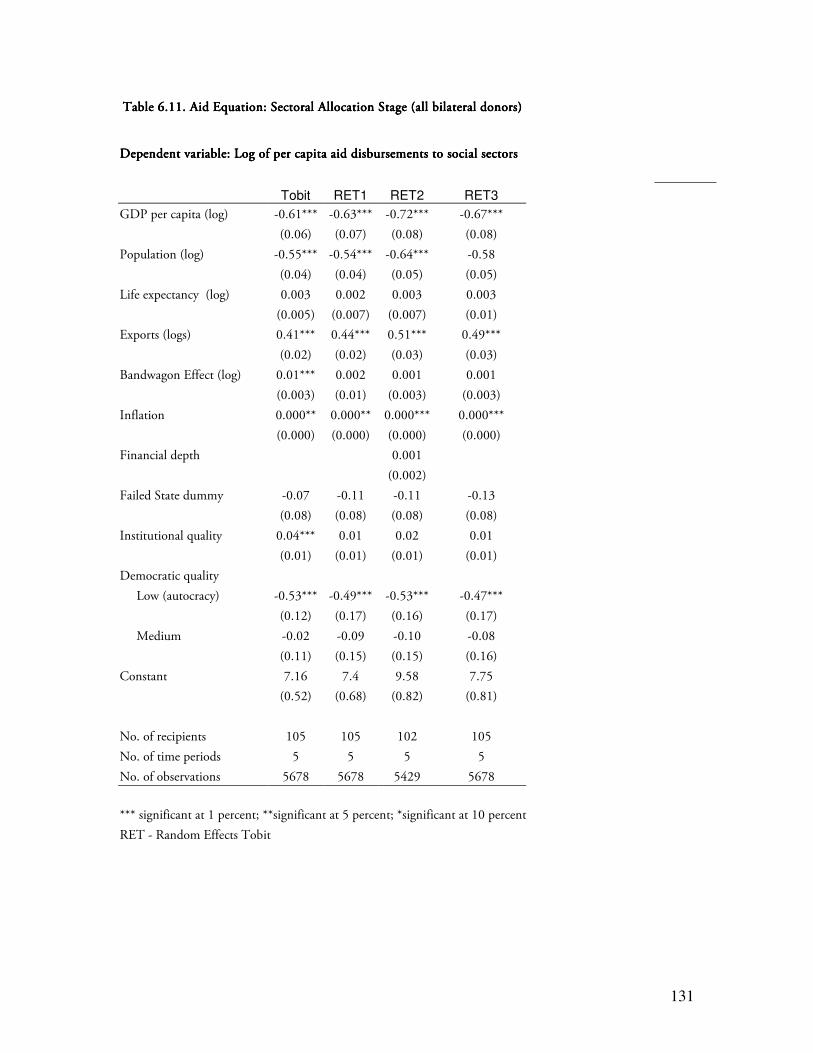
131
Table 6.11. Aid Equation: Sectoral Allocation Stage (all bilateral donors)Table 6.11. Aid Equation: Sectoral Allocation Stage (all bilateral donors)Table 6.11. Aid Equation: Sectoral Allocation Stage (all bilateral donors)Table 6.11. Aid Equation: Sectoral Allocation Stage (all bilateral donors)
Dependent variable: Log of per capita aid disbursements to social sectorsDependent variable: Log of per capita aid disbursements to social sectorsDependent variable: Log of per capita aid disbursements to social sectorsDependent variable: Log of per capita aid disbursements to social sectors
Tobit RET1 RET2 RET3 GDP per capita (log) -0.61*** -0.63*** -0.72*** -0.67***
(0.06) (0.07) (0.08) (0.08)
Population (log) -0.55*** -0.54*** -0.64*** -0.58
(0.04) (0.04) (0.05) (0.05)
Life expectancy (log) 0.003 0.002 0.003 0.003
(0.005) (0.007) (0.007) (0.01)
Exports (logs) 0.41*** 0.44*** 0.51*** 0.49***
(0.02) (0.02) (0.03) (0.03)
Bandwagon Effect (log) 0.01*** 0.002 0.001 0.001
(0.003) (0.01) (0.003) (0.003)
Inflation 0.000** 0.000** 0.000*** 0.000***
(0.000) (0.000) (0.000) (0.000)
Financial depth 0.001
(0.002)
Failed State dummy -0.07 -0.11 -0.11 -0.13
(0.08) (0.08) (0.08) (0.08)
Institutional quality 0.04*** 0.01 0.02 0.01
(0.01) (0.01) (0.01) (0.01)
Democratic quality
Low (autocracy) -0.53*** -0.49*** -0.53*** -0.47***
(0.12) (0.17) (0.16) (0.17)
Medium -0.02 -0.09 -0.10 -0.08
(0.11) (0.15) (0.15) (0.16)
Constant 7.16 7.4 9.58 7.75
(0.52) (0.68) (0.82) (0.81)
No. of recipients 105 105 102 105
No. of time periods 5 5 5 5
No. of observations 5678 5678 5429 5678
*** significant at 1 percent; **significant at 5 percent; *significant at 10 percent RET - Random Effects Tobit
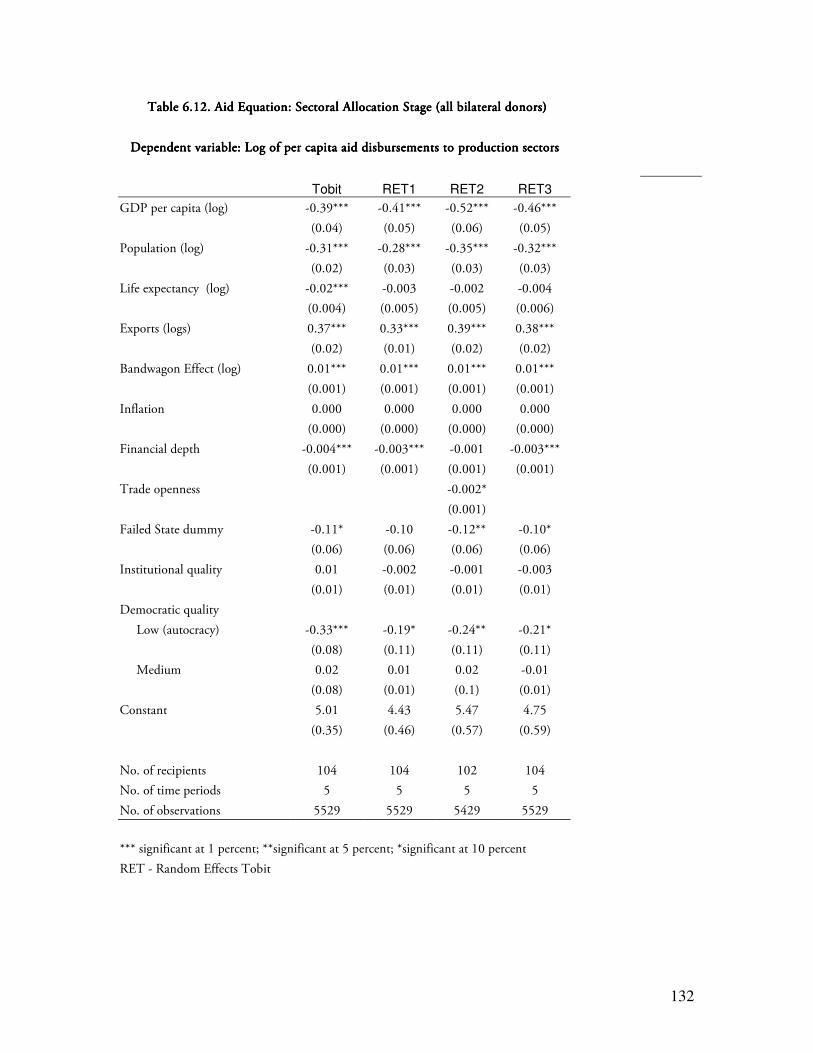
132
TablTablTablTable 6.12. Aid Equation: Sectoral Allocation Stage (all bilateral donors)e 6.12. Aid Equation: Sectoral Allocation Stage (all bilateral donors)e 6.12. Aid Equation: Sectoral Allocation Stage (all bilateral donors)e 6.12. Aid Equation: Sectoral Allocation Stage (all bilateral donors)
Dependent variable: Log of per capita aid disbursements to production sectorsDependent variable: Log of per capita aid disbursements to production sectorsDependent variable: Log of per capita aid disbursements to production sectorsDependent variable: Log of per capita aid disbursements to production sectors
Tobit RET1 RET2 RET3 GDP per capita (log) -0.39*** -0.41*** -0.52*** -0.46***
(0.04) (0.05) (0.06) (0.05)
Population (log) -0.31*** -0.28*** -0.35*** -0.32***
(0.02) (0.03) (0.03) (0.03)
Life expectancy (log) -0.02*** -0.003 -0.002 -0.004
(0.004) (0.005) (0.005) (0.006)
Exports (logs) 0.37*** 0.33*** 0.39*** 0.38***
(0.02) (0.01) (0.02) (0.02)
Bandwagon Effect (log) 0.01*** 0.01*** 0.01*** 0.01***
(0.001) (0.001) (0.001) (0.001)
Inflation 0.000 0.000 0.000 0.000
(0.000) (0.000) (0.000) (0.000)
Financial depth -0.004*** -0.003*** -0.001 -0.003***
(0.001) (0.001) (0.001) (0.001)
Trade openness -0.002*
(0.001)
Failed State dummy -0.11* -0.10 -0.12** -0.10*
(0.06) (0.06) (0.06) (0.06)
Institutional quality 0.01 -0.002 -0.001 -0.003
(0.01) (0.01) (0.01) (0.01)
Democratic quality
Low (autocracy) -0.33*** -0.19* -0.24** -0.21*
(0.08) (0.11) (0.11) (0.11)
Medium 0.02 0.01 0.02 -0.01
(0.08) (0.01) (0.1) (0.01)
Constant 5.01 4.43 5.47 4.75
(0.35) (0.46) (0.57) (0.59)
No. of recipients 104 104 102 104
No. of time periods 5 5 5 5
No. of observations 5529 5529 5429 5529
*** significant at 1 percent; **significant at 5 percent; *significant at 10 percent RET - Random Effects Tobit
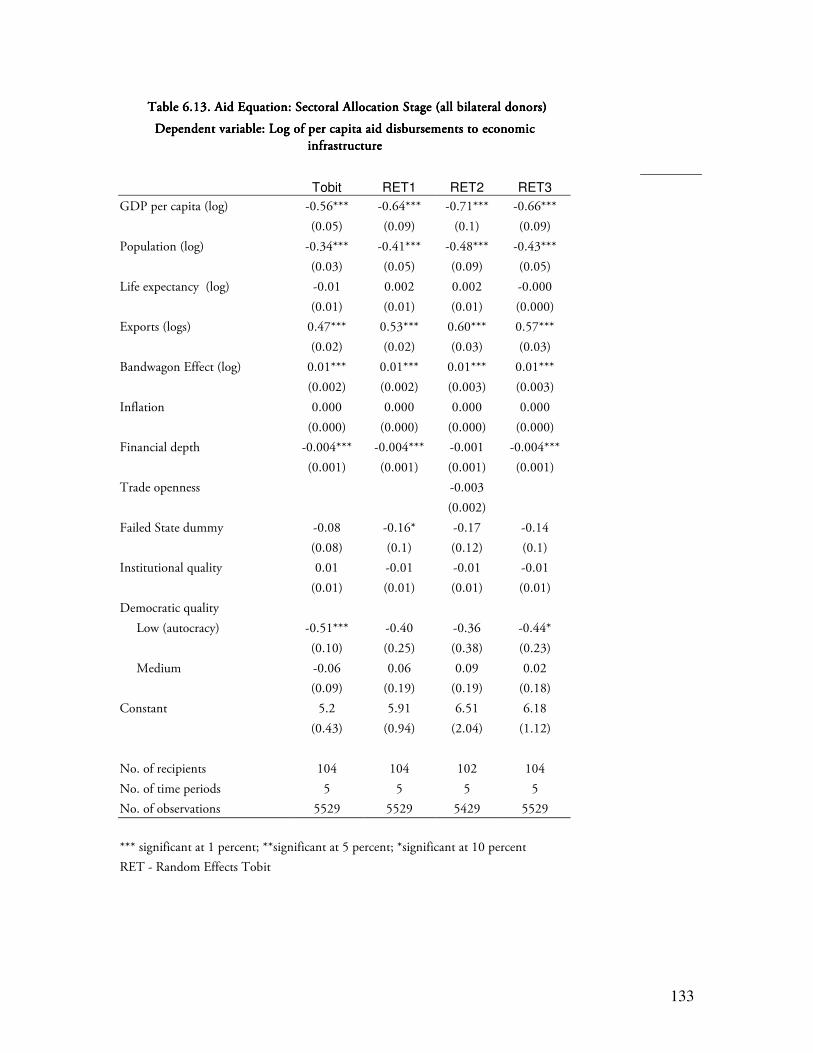
133
Table 6.13. Aid Equation: Sectoral Allocation Stage (all bilateral donors)Table 6.13. Aid Equation: Sectoral Allocation Stage (all bilateral donors)Table 6.13. Aid Equation: Sectoral Allocation Stage (all bilateral donors)Table 6.13. Aid Equation: Sectoral Allocation Stage (all bilateral donors)
Dependent variable: Log of per capita aid disbursements to economic Dependent variable: Log of per capita aid disbursements to economic Dependent variable: Log of per capita aid disbursements to economic Dependent variable: Log of per capita aid disbursements to economic
infrastructureinfrastructureinfrastructureinfrastructure
Tobit RET1 RET2 RET3 GDP per capita (log) -0.56*** -0.64*** -0.71*** -0.66***
(0.05) (0.09) (0.1) (0.09)
Population (log) -0.34*** -0.41*** -0.48*** -0.43***
(0.03) (0.05) (0.09) (0.05)
Life expectancy (log) -0.01 0.002 0.002 -0.000
(0.01) (0.01) (0.01) (0.000)
Exports (logs) 0.47*** 0.53*** 0.60*** 0.57***
(0.02) (0.02) (0.03) (0.03)
Bandwagon Effect (log) 0.01*** 0.01*** 0.01*** 0.01***
(0.002) (0.002) (0.003) (0.003)
Inflation 0.000 0.000 0.000 0.000
(0.000) (0.000) (0.000) (0.000)
Financial depth -0.004*** -0.004*** -0.001 -0.004***
(0.001) (0.001) (0.001) (0.001)
Trade openness -0.003
(0.002)
Failed State dummy -0.08 -0.16* -0.17 -0.14
(0.08) (0.1) (0.12) (0.1)
Institutional quality 0.01 -0.01 -0.01 -0.01
(0.01) (0.01) (0.01) (0.01)
Democratic quality
Low (autocracy) -0.51*** -0.40 -0.36 -0.44*
(0.10) (0.25) (0.38) (0.23)
Medium -0.06 0.06 0.09 0.02
(0.09) (0.19) (0.19) (0.18)
Constant 5.2 5.91 6.51 6.18
(0.43) (0.94) (2.04) (1.12)
No. of recipients 104 104 102 104
No. of time periods 5 5 5 5
No. of observations 5529 5529 5429 5529
*** significant at 1 percent; **significant at 5 percent; *significant at 10 percent RET - Random Effects Tobit
134
6.2.2. Donor by Donor Results
In this section the same approach is used to study the aid allocation patterns of
individual donors. Table 6.14 reports donor-by-donor results of the eligibility model
estimated by using random effects probit estimator, whereas table 6.15 reports the results of
the level stage, based on difference-in-differences estimator. Unlike the aggregate model, I
use the governance variable only in continuous form for this part of the study. The results
suggest that there are some important differences in individual donors’ aid allocation
policies.
The governance variable has statistically significant (at 5% significance level) positive
effect in the aid eligibility decisions of only four individual donors - Canada, Denmark,
Sweden and United States - but is statistically insignificant for other bilateral donors.
Additionally, six other donors also select countries with better governance with higher
probability, but the estimated coefficients on governance variable for these countries are
statistically insignificant. These donors are: Austria, Finland, Ireland, New Zealand, Norway,
and United Kingdom. The results of the DOD model indicate that only three donors,
including Belgium, Germany and New Zealand, reward countries with better governance
with more per capita aid. Again, seven other donors seem to reward countries with better
governance with more aid, but the estimated coefficients are statistically insignificant.
Overall, the results suggest that only seven bilateral donors reward countries with better
governance at eligibility stage or at level stage. Those seven donors provide about 46 percent
of total bilateral foreign aid. Thus, more than one half of the total bilateral foreign aid is
allocated disregarding the quality of governance. Note that since we are controlling for
recipients’ per capita income, these results cannot be explained by the fact that poorer
countries tend to have lower quality of governance (correlation is 0.5, see table 1), assuming
that donors are likely to give aid to poor countries.
In fact, all donors tend to provide aid to poorer countries with higher probability.
However, the estimated coefficient is statistically insignificant for one third of bilateral
135
donors, including Finland, Belgium, Greece, Japan, Netherlands and Portugal. Also as DOD
model suggests, all other things being equal, majority of donors give more aid to poorer
countries. However, in cases of donors such as Australia, Canada, Denmark, Greece, Ireland,
Italy, Japan and Spain, there is simply not a statistically significant relationship between aid
flows and recipients’ per capita income. Since I am controlling for two-dimensional fixed
effects, the recipient-specific or period-specific effects cannot explain these results.
Further, the analysis at aggregate level suggested that donors tend to give more aid to
those recipient countries that already have economic (trade) links with a donor. The
eligibility model suggests that the parameter estimate was positive for all donors, but only
nine of them were statistically significant. The level model estimated by using DOD
estimator suggests that eleven donors allocate more aid to their trade partners, at the margin.
Combining the results of these two models, one can say that thirteen individual donors give
more aid to recipients’ that have stronger economic links with a donor, ceteris paribus.
A “bandwagon effect” is a factor in which there is relatively clear consensus across all
bilateral donors. There are only four small donors (Greece, New Zealand, Portugal and
Spain) that have statistically insignificant parameter estimates corresponding to the aid the
rest of the bilateral donors provide to a given recipient country. All other donors in the first
step and/or second step have a positive parameter estimates corresponding to the
“bandwagon effect.” Thus, bilateral donors tend to give higher evaluation to the impact of
their aid, the greater the aid that the rest of the donors give to a particular recipient country.
Finally, I would like to see whether there is population bias in individual donor’s aid
allocation decisions. The results suggest that not all individual donors have population bias.
Only about half of the individual donors have positive statistically significant population
bias.
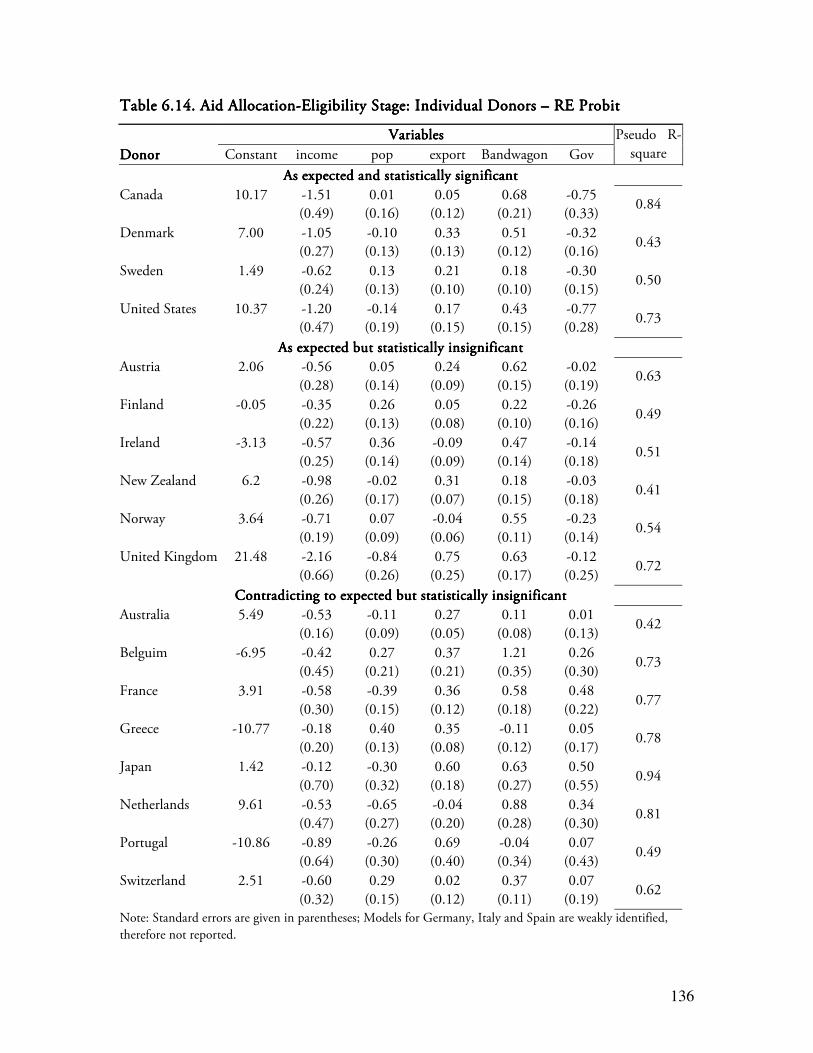
136
Table 6.14. Aid AllocationTable 6.14. Aid AllocationTable 6.14. Aid AllocationTable 6.14. Aid Allocation----Eligibility Stage: Individual Donors Eligibility Stage: Individual Donors Eligibility Stage: Individual Donors Eligibility Stage: Individual Donors –––– RE Probit RE Probit RE Probit RE Probit
VariablesVariablesVariablesVariables
DonorDonorDonorDonor Constant income pop export Bandwagon Gov
Pseudo R-
square
As expected and statistically significantAs expected and statistically significantAs expected and statistically significantAs expected and statistically significant
Canada 10.17 -1.51
(0.49)
0.01
(0.16)
0.05
(0.12)
0.68
(0.21)
-0.75
(0.33) 0.84
Denmark 7.00 -1.05
(0.27)
-0.10
(0.13)
0.33
(0.13)
0.51
(0.12)
-0.32
(0.16) 0.43
Sweden 1.49 -0.62
(0.24)
0.13
(0.13)
0.21
(0.10)
0.18
(0.10)
-0.30
(0.15) 0.50
United States 10.37 -1.20
(0.47)
-0.14
(0.19)
0.17
(0.15)
0.43
(0.15)
-0.77
(0.28) 0.73
As expected but statistically insignificantAs expected but statistically insignificantAs expected but statistically insignificantAs expected but statistically insignificant
Austria 2.06 -0.56
(0.28)
0.05
(0.14)
0.24
(0.09)
0.62
(0.15)
-0.02
(0.19) 0.63
Finland -0.05 -0.35
(0.22)
0.26
(0.13)
0.05
(0.08)
0.22
(0.10)
-0.26
(0.16) 0.49
Ireland -3.13 -0.57
(0.25)
0.36
(0.14)
-0.09
(0.09)
0.47
(0.14)
-0.14
(0.18) 0.51
New Zealand 6.2 -0.98
(0.26)
-0.02
(0.17)
0.31
(0.07)
0.18
(0.15)
-0.03
(0.18) 0.41
Norway 3.64 -0.71
(0.19)
0.07
(0.09)
-0.04
(0.06)
0.55
(0.11)
-0.23
(0.14) 0.54
United Kingdom 21.48 -2.16
(0.66)
-0.84
(0.26)
0.75
(0.25)
0.63
(0.17)
-0.12
(0.25) 0.72
Contradicting to expected but statistically insignificantContradicting to expected but statistically insignificantContradicting to expected but statistically insignificantContradicting to expected but statistically insignificant
Australia 5.49 -0.53
(0.16)
-0.11
(0.09)
0.27
(0.05)
0.11
(0.08)
0.01
(0.13) 0.42
Belguim -6.95 -0.42
(0.45)
0.27
(0.21)
0.37
(0.21)
1.21
(0.35)
0.26
(0.30) 0.73
France 3.91 -0.58
(0.30)
-0.39
(0.15)
0.36
(0.12)
0.58
(0.18)
0.48
(0.22) 0.77
Greece -10.77 -0.18
(0.20)
0.40
(0.13)
0.35
(0.08)
-0.11
(0.12)
0.05
(0.17) 0.78
Japan 1.42 -0.12
(0.70)
-0.30
(0.32)
0.60
(0.18)
0.63
(0.27)
0.50
(0.55) 0.94
Netherlands 9.61 -0.53
(0.47)
-0.65
(0.27)
-0.04
(0.20)
0.88
(0.28)
0.34
(0.30) 0.81
Portugal -10.86 -0.89
(0.64)
-0.26
(0.30)
0.69
(0.40)
-0.04
(0.34)
0.07
(0.43) 0.49
Switzerland 2.51 -0.60
(0.32)
0.29
(0.15)
0.02
(0.12)
0.37
(0.11)
0.07
(0.19) 0.62
Note: Standard errors are given in parentheses; Models for Germany, Italy and Spain are weakly identified,
therefore not reported.

137
Table 6.15. Aid Allocation Table 6.15. Aid Allocation Table 6.15. Aid Allocation Table 6.15. Aid Allocation –––– Level Stage: Individual Donors (DOD Model) Level Stage: Individual Donors (DOD Model) Level Stage: Individual Donors (DOD Model) Level Stage: Individual Donors (DOD Model)
Variables Donor Constant Income Pop Export Bandw-n Gov R2 F-stat. p-value
Negative and statistically significant Belguim
5.93 -0.74 (0.30)
-0.67 (1.29)
0.27 (0.14)
0.52 (0.11)
-0.26 (0.13) 0.26 9.96 0.0000
Germany 3.85
-0.33 (0.18)
-0.65 (0.56)
0.21 (0.07)
0.91 (0.06)
-0.17 (0.07) 0.54 47.27 0.0000
New Zealand -15.56
-0.51 (0.47)
1.50 (1.50)
-0.003 (0.09)
0.02 (0.20)
-0.72 (0.21) 0.38 9.37 0.0000
Negative but statistically insignificant Austria
-9.53 -1.31 (0.47)
1.47 (1.72)
0.30 (0.12)
0.36 (0.17)
-0.05 (0.2) 0.24 9.82 0.0000
Canada 13.97
-0.43 (0.29)
-1.86 (0.90)
0.34 (0.07)
0.79 (0.11)
-0.03 (0.12) 0.3 17.4 0.0000
Ireland -34.35
0.46 (0.40)
2.66 (1.43)
-0.25 (0.10)
0.26 (0.15)
-0.24 (0.18) 0.45 45.48 0.0000
Japan -0.56
-0.23 (0.23)
-0.57 (0.71)
0.61 (0.08)
0.83 (0.07)
-0.01 (0.1) 0.58 56.02 0.0000
Norway 20.78
-1.10 (0.45)
-2.06 (1.74)
0.30 (0.09)
0.60 (0.19)
-0.11 (0.19) 0.22 8.24 0.0000
Spain -24.26
0.15 (3.97)
1.05 (14.98)
0.07 (0.88)
1.79 (1.01)
-2.69 (1.28) 0.35 1.72 0.1693
United Kingdom 14.74
-0.88 (0.31)
-1.42 (0.86)
0.30 (0.13)
0.49 (0.12)
-0.06 (0.12) 0.17 7.46 0.0000
Positive but statistically insignificant Australia
5.89 0.24
(0.39) -1.50 (1.16)
0.16 (0.07)
0.36 (0.13)
0.06 (0.15) 0.11 3 0.0021
Denmark 8.02
-0.80 (0.55)
-1.09 (1.69)
0.67 (0.18)
0.91 (0.21)
0.10 (0.21) 0.27 8.65 0.0000
Finland -11.36
-1.14 (0.55)
1.42 (2.11)
0.20 (0.13)
0.82 (0.15)
0.31 (0.22) 0.2 5.41 0.0000
France -7.34
-0.49 (0.23)
-0.67 (0.70)
0.44 (0.08)
0.61 (0.07)
0.01 (0.09) 0.33 17.51 0.0000
Greece 111.89
2.86 (2.94)
-14.75 (8.68)
-0.48 (1.23)
0.38 (0.64)
0.93 (0.86) 0.98 18.09 0.0533
Italy
-17.57
-0.62
(0.42)
2.03
(1.55)
0.23
(0.16)
0.69
(0.15)
0.11
(0.16) 0.62 32.13 0.0000
Netherlands -13.12
-0.55 (0.27)
1.42 (0.77)
0.28 (0.09)
0.79 (0.09)
0.01 (0.11) 0.39 24.67 0.0000
Sweden -5.54
-1.35 (0.59)
0.98 (2.02)
0.21 (0.15)
0.78 (0.15)
0.27 (0.22) 0.18 4.9 0.0000
Switzerland 31.2
-1.19 (0.39)
-2.88 (1.38)
0.11 (0.11)
0.22 (0.11)
0.01 (0.16) 0.15 5.59 0.0000
United States -10.25
-0.95 (0.28)
1.47 (0.86)
-0.03 (0.09)
1.29 (0.10)
0.03 (0.12) 0.47 33.25 0.0000
Note: Standard errors are given in parentheses; Model for Portugal is not identified

138
6.3. Discussion of the results
In this section, I discuss the results presented in previous sections by relating them to
the recent empirical literature and development practice. The analysis of aid allocation at
aggregate level suggests that recipients with better governance have marginally higher
probability of being eligible to receive foreign aid. They also receive relatively higher per
capita aid at aggregate level. The donor-by-donor analysis shows that there are some
differences between individual donors. The quality of governance is statistically significant,
but only a marginally important determinant at the eligibility or level stage for some donors,
whereas others disregard governance in their aid allocation decisions. Overall, recipients’
governance influences donors’ aid allocation decisions only marginally. These results are
consistent with literature. Similar conclusions were made by Alesina and Dollar (2000),
Neumayer (2003) and others.
As concerns donors’ sectoral aid allocation decisions, donors seem to provide
relatively more per capita aid to production and social sectors of medium- and high-
governance countries as compared to low-governance countries. There is virtually no
difference in per capita aid flows to economic infrastructure across levels of governance.
These findings are important if one puts them into perspective of aid effectiveness. The
results regarding aid effectiveness suggested that aid to production (significantly) and social
(marginally) sectors are likely to be efficient in low-governance countries in promoting
economic growth, whereas aid to economic infrastructure is likely to be efficient in medium-
and high-governance countries. Therefore, given the results obtained in this dissertation it
seems that donors can improve the effectiveness of foreign aid by merely improving their aid
allocation decisions. The results suggest that reallocation of aid between sectors might
significantly increase the growth rate of per capita income in recipient countries regardless of
their governance.
139
In this context, I assess the impact of two following policy interventions: (1) an
increase in aid to production sector in low-governance countries by one percentage point by
reallocating the aid to economic infrastructure; (2) an increase in aid to economic
infrastructure in medium- and high-governance countries by one percentage point by
reallocating the aid to production sector. Assuming that the other factors, such as the quality
of governance, macroeconomic policy environment, external factors are unchanged, an
increase in aid to production sector in low-governance countries would increase the average
growth rate of per capita income in these countries by 0.15 percent per annum. Further, an
increase in aid to economic infrastructure in medium-governance countries by one
percentage point would increase the average annual growth rate of per capita income in these
countries by 0.29 percent, whereas the same policy intervention with respect to high-
governance countries would increase the average per capita GDP growth rate in these
countries by 0.57 percent.
Now I would like to see whether the findings of the study are consistent with the
predictions of the theoretical model, the recent empirical literature and development
practice. Let us start with the analysis of the consistency of the results with a theoretical aid
allocation model. The results on the impact of aid to production sector and aid to economic
infrastructure on investment and economic growth are consistent with the predictions of the
theoretical aid allocation model. Recall that the theoretical model from chapter 4 suggested
that any improvements in donors’ information system will allow to better maximize their
expected utility, i.e., impact on recipients’ development outcomes, from allocation of foreign
aid. Any improvements in donors’ information structure would increase the allocative
efficiency. The model also suggested that another way of reducing information asymmetry is
to give less control over aid money to governments in poor governance countries, i.e., by
allocating aid to sectors and/or projects that are not under direct control of government.
Generally, aid to production sector is directly delivered to non-governmental
(business) sector and government has very limited control over that aid. Moreover, this
140
category of aid is not subject to fungibility or is less fungible than other aid categories for two
reasons. First, as already noted, government has less control over this type of aid flows, and
thereby less ability to circumvent donor-imposed restrictions and spend some amount of aid
on other programs. Second, one would not expect that government would invest in the
production sector, and thereby cannot replace its own expenditures with aid transfers.
Therefore, aid to the production sector is more likely to be effective even in countries with
poor governance. As to medium- and high-governance countries, as mentioned elsewhere,
crowding out effect outplays the positive impact associated with aid because foreign aid
works similar to public investment.
In contrast, aid to economic infrastructure is given directly to government or
delivered through government and government has great or even full control over this
category of aid flows. Therefore, these aid flows are subject to both types of aid fungibility.
Recipient government can do both: circumvent donor-imposed restrictions and spend some
amount of targeted aid on other programs. Or, it can replace its own expenditures with aid
transfers. For example, recipient government can decide to reduce or even abandon its own
expenditures on physical expenditure if it expects that donors will allocate more aid for that
purpose. More speculatively, as Tanzi and Davodi (1997) stressed, “in cases of extreme
corruption, operation and maintenance on physical infrastructures, such as roads, will
deteriorate quickly to the point where they will need to be rebuilt, thus allowing some high
level officials the opportunity to extract another commission from the enterprises that will
undertake the project”48. Therefore, one would expect that countries with better governance
use aid to economic infrastructure better than others, which is evidence in the findings of
this study.
How do the results compare with existing studies? No direct comparison is possible since
my approach is quite different from most of the past studies. Nevertheless, I can relate my
findings to three groups of studies, including the influential study by Burnside and Dollar
48 Tanzi, Vito and Hamid Davoodi, “Corruption, Public Investment, and Growth”, IMF Working Paper No. 97/139, p. 9.
141
(2000). First, past research consistently found that foreign aid stimulates investment. For
example, Levy (1987 and 1988) finds that one percentage point increase in aid to GDP ratio
is associated with 0.86–1.08 percentage point increase in investment to GDP ratio. More
recently Hansen and Tarp (2001) in a cross-sectional study, including 56 of the least
developed countries, estimated that the coefficient is 0.71. Another study by Easterly (1999)
suggested that the relationship between foreign aid and investment is heterogeneous across
countries. My findings are not only consistent with the results of above-mentioned, and
other similar, studies; they further advance the cause about heterogeneity of the aid-
investment relationship. The results indicate that there is a positive relationship between
foreign aid and investment, but transmission channels seem different for different countries.
Countries with poor governance seem to benefit from aid to production sector while
countries with better governance will benefit more from aid to economic infrastructure. For
low-governance countries, one percentage point increase in aid to production sectors to GDP
ratio corresponds to 0.71-0.87 percentage point increase in the investment ratio. On the
other side, for medium-governance countries, one percentage point increase in aid to
economic infrastructure to GDP ratio associates with about 1.4 percentage point increase in
the investment ratio. Whereas, for high-governance countries, one percentage point increase
in aid to economic infrastructure to GDP ratio corresponds with about 2.7 percentage point
increase in the investment ratio. The results also suggest that aid to social sector might
stimulate domestic investment in recipient countries by improving human capital.
Second, Clemens et al (2004) claimed that when aid is properly defined, aid’s effect
on growth can be easily detected using cross-country data. They disaggregate foreign aid into
three categories with respect to their potential impact on growth: “short-impact”, “long-
impact” and other aid. Then find that so-called “short- impact” aid has significant positive
impact on economic growth. I further develop the idea on disaggregated impact of foreign
aid on growth. However, my approach is simple: I disaggregate aggregate aid flows based on
which specific sectors of recipient’s economy are transfers intended to promote, using
142
OECD’s official classification of aid flows. I believe that this approach is more appropriate
for purposes of donors’ aid allocation policies.
Third, my findings support Clemens et al (2004), Hansen and Tarp (2000) Dalgaard
et al (2004) and other similar studies in questioning the results of the “conditional”
literature, such as Burnside and Dollar (2000) - that aid works only in a “good policy
environment”, but not in all recipient countries. Moreover, the results extend that literature
by finding different channels through which foreign aid might promote the economic
growth and other development outcomes in developing countries. Motivated by the findings
of Burnside and Dollar (2000) and other similar studies, the rhetoric of policy debate on
foreign aid shifted significantly. The core question of debate on foreign aid may boil down to
this: should donors stop giving aid to countries with poor governance? These are countries
that have exhibited dismal development performance in the last several decades and have
extremely low per capita incomes, and undoubtedly, people of these countries are in the
greatest need of foreign aid, perhaps more than others. The results show that donors can
make a difference even in countries with poor governance by improving the allocation of
their aid budget.
How do the results relate to development practices of development institutions? The
following anecdotal evidence from the practice of ADB provides support for my findings.
The following evidence is drawn from the development practice of Asian
Development Bank (ADB)49. ADB provided assistance to the financial sector development in
Lao People’s Democratic Republic (PDR) with three financial sectors program loans50 as
they aimed to change policies and regulatory frameworks to upgrade state owned commercial
banks’ operations to best banking practice standards. However, the two completed program
loans failed to achieve the intended changes and the third program third program assistance
is underway. However, the donor is still facing the increased risk of information asymmetry
49 ADB, Operations Evaluations Department, Country Assistance Evaluation for Lao People’s Democratic Republic, April 2006 50 These loans are concessional and thus considered as ODA
143
and associated with that problematic behavior of the recipient government, and thus a
negative outcome, because the government who caused the problem did not suffer any
consequences, and probably benefited from previous concessional loans.
The same evaluation report provides the evidence of ADB’s contribution to
agricultural sector development in Lao PDR. ADB, together with other donors, such as
Japan, provided assistance to the agricultural sector development with several concessional
loans to support irrigation systems and agriculture commercialization. Some measurable
impacts from 1995 to 2004 includes: “(i) sustained agricultural output growth rate of 4.3
percent, (ii) increased rice yields from 2.5 tons to 3.2 tons per hectare, and (iii) achieved food
self-sufficiency in rice”51. In my classification of aid flows, aid to agricultural sector is
classified as aid to the production sector and aid to financial sector development is classified
as aid to economic infrastructure and Lao PDR is classified as a low-governance country.
Obviously, it is difficult to generalize from these anecdotal evidences; nevertheless, these
evidences are consistent with the findings.
51 Ibid, p. 38
144
Chapter 7. Conclusions and Policy Implications
Recently, rhetoric of foreign aid has been increasingly shifted towards the challenges
of development. Accordingly, donor countries have began to mobilize additional resources
for the needs of developing countries. Several donors have pledged to reach the United
Nation’s target level (0.7 percent of donor’s gross national income) for ODA over the next
decade or so, and others have begun to significantly increase their commitments for
development assistance. Moreover, recently, some have argued in favor of a massive increase
in foreign aid to Sub-Saharan Africa in order to escape from a poverty trap (UN 2005, Sachs
2005, Sachs et al. 2004)). Based on these new calls, pledges and greater commitments to
development assistance from donor nations, there is a possibility of significant scaling up of
foreign aid transfers far beyond the current and past levels.
From donor’s perspective, the commitment to increase aid flows to developing
countries is only the starting point. Donors have to achieve efficient allocation of aid flows
among recipients and various sectors of recipients’ economies in order to ensure that aid
resources will help to promote development outcomes. This in turn raises issues regarding
the role of the donors’ aid allocation policies in ensuring development effectiveness. The
contemporary wisdom suggests that countries with better governance are more likely to
utilize aid flows more efficiently.
This dissertation contributes to the policy debate and literature on aid effectiveness as
it explores how different categories of aid affect economic growth and whether the
interaction of different levels of governance with different categories of aid is significant in
promoting growth. The study makes some important assumptions regarding the measures of
governance and uses democratic quality and institutional quality as proxy measures of
governance. Although these two variables provide a reasonable measure of the quality of
governance, they do not fully cover all dimensions of governance and might miss some
components of governance. For example, while some components (e.g., “stability”) of these

145
governance measures connote security, they do not imply the same thing. Governance
without or with limited security is seriously halted, and more likely that critically impaired
from stand point of aid effectiveness. Therefore, the findings of the study should be
considered with some caution.
As a way of concluding the dissertation, this final chapter will summarize major
findings and derive policy implications based upon these conclusions.
7.1. Major Findings
This dissertation has examined some important propositions relating governance to
foreign aid allocation and effectiveness, and produced several empirical findings. This
research contributes to the debate on foreign aid through unraveling the critical
heterogeneous impacts of governance and different aid categories on development
effectiveness and aid allocation. The most important and salient results of the dissertation
can be summarized as follows:
• The fundamental finding of this dissertation supports the notion that governance does
matter for economic growth and aid effectiveness. It is evident that, on average, countries
with better governance have higher growth rates but the relationship between governance
and aid effectiveness is not straightforward. This relationship seems heterogeneous across
countries with different levels of governance and various categories of foreign aid. The
results suggest that the interactions of governance and different categories of aid are
important for aid effectiveness. Some categories of foreign aid can be effective even in
countries with poor governance.
• Aid to production sector appears to cause an increase in domestic investment for low-
governance countries whereas this effect for medium- and high-governance countries is
insignificant. Hence, aid to production sector can foster economic growth in low-
governance countries through capital accumulation.
146
• Aid to economic infrastructure appears to associate with a significant increase in
domestic investment and economic growth rates in medium- and high-governance
countries, but this impact is insignificant for low-governance countries.
• While the results do suggest that there are important direct and indirect (via investment)
links between human capital and growth, the relationship between aid to social sector
and human capital accumulation appears to be negative for high-governance countries,
insignificant for medium-governance countries, and slightly positive for low-governance
countries. Emphatically, these results do not mean that aid to social sector has no
considerable effect on development outcomes. Data limitations and measurement errors
could bias the results of the study one way or another. Therefore, any improvements in
data quality would definitely help to make the results more clear. I leave that to future
research.
• The analysis at the aggregate level suggests that donors appear to allocate seemingly more
aid to countries with better governance, at the margin. However, the results also suggest
that only seven bilateral donors reward countries with better governance one way or
another. Those seven donors provide about a half of the total bilateral foreign aid flows.
Additionally, a number of other donors also seem more likely to reward recipients with
better governance, but the estimated coefficients on governance variable for these
countries are statistically insignificant. Thus, it appears about a half of the total bilateral
foreign aid is allocated disregarding the quality of governance.
• The findings at the sectoral level suggest that the marginal impact of governance is
positive and significant on donors aid allocation decisions with respect to aid to
production and social sectors. However, this impact is insignificant with respect to aid to
economic infrastructure.
147
7.2. Policy Implications
From the preceding conclusions, it is possible to identify potentially important policy
implications for improving donors’ future aid allocation policies. First, one important policy
lesson is that to have sustained economic growth, recipient countries should improve and
maintain good governance. Therefore, donors should continue (if they are already doing so)
or start (if they are not doing so yet) to reward good governance.
Second, however, foreign aid has to be allocated among recipient countries not
simply based on the quality of governance, but donors in making decisions with respect to
aid allocation should take into account the quality of governance in combination with
sectoral needs of a given recipient. This study reveals large differentials in the effect of
different types of aid, depending on the level of recipients’ governance, on factor
accumulation and growth. The potential gains from reallocating aid transfers are enormous.
Production sectors should receive higher priority in donors’ portfolio in low-governance
countries, whereas economic infrastructure sector should receive higher priority in medium-
and high governance countries.
Third, donors have to give less control to government over aid money in low-
governance countries. Currently, foreign aid feeds into three channels: households, mainly
for consumption such as food aid; governments to support current and capital public
expenditures; and private (non-governmental) sector through microfinance programs to
establish and develop businesses. The third channel should receive higher priority for low-
governance countries. This is easier to do with aid to production sector, but not that easy
with aid to social sector and economic infrastructure. Nevertheless, as the recent edition of
the Index of Economic Freedom, sponsored by the Heritage Foundation and The Wall
Street Journal (Miles et al, 2006) reveals, donors may consider granting aid directly to new
private schools.
Fourth, improving the coordination of donors seems to be reasonable goal as this
research reveals some important differences among various donors.
148
Fifth, given the fact that donors are not considering ending foreign aid, it is more
desirable for research to move away from unproductive debate of whether aid is effective, and
focus on finding ways to improve aid allocation in order to enhance its effectiveness.
149
Reference
1. Abadie, Alberto. “Poverty, Political Freedom, and the Roots of Terrorism”, NBER
Working Paper 10859, 2005.
2. Agenor, Pierre-Richard and Peter J. Montiel. “Development Macroeconomics”,
Princeton University Press, 1999.
3. Alesina, Alberto and Dollar, David. “Who Gives Foreign Aid to Whom and Why?”
Journal of Economic Growth, March 2000, pp.33-63
4. Alesina, Alberto and Weder, Beatrice. “Do Corrupt Governments Receive Less
Foreign Aid?” 1999. NBER Working Paper #7108
5. Alfaro, Laura, “Foreign Direct Investment: Does the Sector Matter?” Working Paper,
Harvard Business School, 2003
6. Annan, Kofi. Vision for the New Millennium: We the Peoples: the role of the
United Nations in the 21st Century, New York: United Nations, 2000.
7. Baldacci, Emanuele, Benedict Clements, Sanjeev Gupta, and Qiang Cui, “Social
Spending, Human Capital, and Growth in Developing Countries: Implications for
Achieving the MDGs,” IMF Working Paper 04/217, 2004
8. Barro, Robert J. “Determinants of Economic Growth: A Cross-Country Empirical
Study,” NBER Working Paper No. 5968, Cambridge, MA, 1996
9. Barro, Robert, and Jong-Wha Lee, “International Data on Educational Attainment:
Updates and Implications,” Center for International Development Working Paper
No. 42, Cambridge, MA: Harvard University, 2003
10. Bauer, P.T. “Reality and Rhetoric: Studies in the Economics of Development,”
Cambridge: Harvard University Press, 1984
11. Benhabib, Jess, and Mark Spiegel, “The Role of Human Capital in Economic
Development: Evidence from Aggregate Cross-Country Data,” Journal of Monetary
Economics, Vol. 34, pp. 143-73
150
12. Beynon, Jonathan, “Policy Implications for Aid Allocations of Recent Research on
Aid Effectiveness and Selectivity,” in Mark Arvin (ed.), New Perspectives on Foreign
Aid and Economic Development, Praeger, Westport.
13. Bulíř Aleś and A. Javier Hamann. “Volatility of Development Aid: From the Frying
Pan into the Fire?” IMF Working Paper WP/06/65, Washington, D.C., 2006
14. Burnside, Craig and Dollar, David. “Aid, policies and growth.” American Economic
Review, September 2000, 90(4), pp.847-68
15. Chang, Charles C., Eduardo Fernandez-Arias, Lius Servén. “Measuring Aid Flows: A
New Approach.” The World Bank Policy Research Working Paper 2050, 1999
16. Clemens, Michael, Steve Radelet and Rikhil Bhavnani, “Counting Chickens When
They Hatch: The Short Term Effect of Aid on Growth,” Center For Global
Development, Working Paper No. 44, Washington, D.C., 2004
17. Collier, Paul and Dollar, David. “Aid, Allocation and Poverty Reduction.” European
Economic Review, September 2002, 45(1), pp.1-26
18. Cornia, G., Jolly, R. and Stewart, F. “Adjustment with a Human Face: Protecting
the Vulnerable and Promoting Growth,” Oxford: Clarendon Press, 1987
19. Dalgaard, Carl-Johan, Henrik Hansen and Finn Tarp, “On the Empirics of Foreign
Aid and Growth,” The Economic Journal, Vol. 114, June 2004, pp. F191-F216.
20. Dalgaard, Carl-Johan and Henrik Hansen, “On Aid, Growth, and Good Policies,”
CREDIT Research Paper, University of Nottingham, Centre for Research in
Economic Development and International Trade, 2000
21. Dollar, David and Victoria Levin “The Increasing Selectivity of Foreign Aid, 1984-
2002,” Policy Research Working Paper 3299, World Bank, Washington, D.C., 2004
22. Dudley, Leonard and Montmarquette, Claude. “A Model of the Supply of Bilateral
Foreign Aid.” American Economic Review, 66:1, March 1976, pp.132-142
23. Easterly, Williams, “Can Aid Buy Growth.” Journal of Economic Perspectives,
Volume 17, No. 3, Summer 2003, p.1-28.
151
24. Easterly, Williams, “The White Man’s Burden: Why the West’s Efforts to Aid the
Rest Have Done So Much Ill and So Little Good,” Penguin Press, 2005
25. Easterly, William; Levine, Ross and Roodman, David. “New Data, New Doubts: A
Comment on Burnside and Dollar’s “Aid, Policies, and Growth” (2000). The
American Economic Review, 2004
26. Easterly, Williams, “Can Foreign Aid Buy Growth,” Journal of Economic
Perspective, Vol. 17, No. 3, Summer 2003, pp. 23-48.
27. Easterly, Williams, “Elusive Quest for Growth: Economist’s Adventures and
Misadventures in the Tropics.” 2001.
28. Feng, Yi, “Political freedom, Political Instability, and Policy Uncertainty: A Study of
Political Institutions and Private Investment in Developing Countries,” International
Studies Quarterly, Vol. 45, pp. 271-294, 2001
29. Feng, Yi, “Democracy, Governance, and Economic Performance: Theory, Data
Analysis, and Case Studies,” The MIT Press, 2003
30. Fischer, Stanley, “Role of Macroeconomic Factors in Growth,” Journal of Monetary
Economics, Vol. 32, pp.485-512
31. Forstner, Helmut, Anders Isaksson, and Thiam Hee Ng, “Growth in Least
Developed Countries: An Empirical Analysis of Productivity Change, 1970-1992”
UNIDO, SIN Working Paper 1, 2001.
32. Freidman, Milton, “ Foreign Economic Aid: Means and Objectives,” in Bhagwati,
Jagdish and Richard Eckhaus (ed.) “Foreign Aid,” Harmondsworth, Penguin, 1970.
33. Gyimah-Brempong, Kwabena and Mark Wilson, “Health Capital and Economic
Growth in Sub-Saharan African and OECD Countries,” The Quarterly Review of
Economics and Finance, 44, pp. 296-320, 2004
34. Gradstein, Mark. “Governance and Growth,” Journal of Development Economics,
2004, 73, pp. 505-518
35. Grant, R. “The State of the World’s Children – UNICEF Report 1990,” Oxford:
Oxford University Press

152
36. Grant, R. and Nijman, J. (eds) “The Global Crisis in Foreign Aid,” Syracuse:
Syracuse State University Press, 1998
37. Griffin, “Foreign Capital, Domestic Savings and Economic Development”, Bulletin
of the Oxford University Institute of Economics and Statistics, Vol. 32, May 1970.
38. Guillaumount, Patrick and Chauvet, Lisa. “Aid and Performance: A Reassessment.”
Journal of Development Studies, August 2001, 37(6), pp. 66-92
39. Gupta, Sanjeev, Robert Powell, and Yongzheng Yang, “The Macroeconomic
Challenges of Scaling Up Aid to Africa,” IMF Working Paper 05/179, Washington,
D.C., 2005
40. Hansen, Henrik and Tarp, Finn. “Aid and Growth Regressions.” Journal of
Development Economics, Vol. 64 (2001), pp.547-570
41. Hansen, Henrik and Finn Tarp. “Aid Effectiveness Disputed,” in F. Tarp (ed.).
“Foreign Aid and Development,” London and New York, Routledge, 2000, pp. 103-
128
42. Heller, Peter S., “A Model of Public Fiscal Behavior in Developing Countries: Aid,
Investment, and Taxation,” The American Economic Review, Vol. 65, No. 3 (June
1975), pp. 429-445.
43. Heller, Peter S., “Pity the Finance Minister”: Issues in Managing a Substantial
Scaling Up of Aid Flows,” IMF Working Paper 05/180, Washington, D.C., 2005
44. Hjertholm, Peter and Howard White, “Foreign Aid in Historical Perspective:
Background and Trend,” in F. Tarp (ed.). “Foreign Aid and Development,” London
and New York, Routledge, 2000, pp. 80-102
45. James, P., E. Solberg, and M. Wolfson, “An Indentified Systemic Model of the
Democracy-Peace Nexus,” Defense and Peace Economics, 1999,Vol. 10, pp. 1-37.
46. Kanbur, Ravi. “Aid, Conditionality, and Debt in Africa,” in F. Tarp (ed.). “Foreign
Aid and Development,” London and New York, Routledge, 2000, pp. 409-422
47. Kanbur, Ravi. “The Economics of International Aid,” in “The Economics of Giving,
Reciprocity and Altruism,” ed. Jean Mercier-Ythier et al, 2006
153
48. Kaufmann, Daniel, Aart Kray and Pablo Zoido-Lobaton. “Governance Matters III”.
Policy Research Working Paper, The World Bank, 2003
49. Klein, Michael and Tim Harford, “The Market for Aid,” International Finance
Corporation, Washington, D.C., 2005
50. Klitgaard, Robert, Johan Fedderke, and Kamiljon Akramov, “Choosing and Using
Performance Measures: The Case of Foreign Aid”, in ed. Klitgaard and P. Light
“High Performance Governance: Structure, Leadership, Incentives”, RAND, 2005, pp.
407-446.
51. Klitgaard, Robert, “Tropical Gangsters,” New York: Basic Books, 1990
52. Knack, Stephen. “Aid Dependence and the Quality of Governance: A Cross-Country
Empirical Analysis.” World Bank Working Paper, 2000
53. Krueger, Alan, and Jitka Malečkovà, “Education, Poverty and Terrorism: Is There a
Causal Connection?” Journal of Economic Perspectives, Vol. 17, No. 4, 2003, pp.
119-144.
54. Krugman, Paul “The Myth of Asia’s Miracle”, Foreign Affairs, 1994, Vol. 73, pp.
62-78
55. Kumar, Nagesh and Jaya Prakash Pradhan, “Foreign Direct Investment, Externalities
and Economic Growth in Developing Countries: Some Empirical Explorations and
Implications for WTO Negotiations on Investment”, RIS Discussion Paper 27, 2002
56. Lächler, Ulrich and David Alan Aschauer “Public Investment and Economic Growth
in Mexico” World Bank Working Paper 1964, 1998
57. Lancaster, Carol and Samuel Wanqwe, “Managing a Smooth Transition from Aid
Dependence in Sub-Saharan Africa,” Oversees Development Council, Washington,
D.C., 2000
58. Laffont, Jean-Jacques and David Martimort. “The Theory of Incentives: The
Principal-Agent Model,” Princeton University Press, 2002
59. Lensink, Robert and Howard White, “Are There Negative Returns to Aid”, Journal
of development Studies, August 2001, Vol. 37, pp. 42-65.

154
60. Lensink, Robert and Howard White, “Aid Dependence: Issues and Indicators,”
Report for Expert Group on Development Issues, The Swedish Ministry of Foreign
Affairs, 1999
61. Levine, Ross and David Renelt, “A sensitivity Analysis of Cross-Country Growth
Regressions,” in The American Economic Review, Vol. 82, No. 4, 1992, pp. 942-
963
62. Little, Ian M.D. and J.A. Mirrlees. “International Aid,” London. George Allen and
Unwin Ltd, 1965.
63. Lucas, Robert E. Jr. “On the Mechanic of Economic Development,” Journal of
Monetary Economics, 1988, vol. 22, pp. 3-42.
64. Lucas, Robert E. Jr. “Why Doesn’t Capital Flow from Rich to Poor Countries?”
American Economic Review, 1990, vol. 80, pp. 92-96.
65. Maizels, A., and Nissanke, M. “Motivations for Aid to Developing Countries,”
World Development, 1984, pp.879-900
66. Mankiw, Gregory N., David Romer, and David N. Weil, “A Contribution to the
Empirics of Economic Growth,” Quarterly Journal of Economics, Vol. 107, pp. 407-
37.
67. Mavrotas, George, Assessing Aid Effectiveness in Uganda: An Aid-Disaggregation
Approach, Oxford Policy Management, Oxford, U.K., 2003
68. McGillivary, Mark, “Descriptive and Prescriptive Analyses of Aid Allocation,”
WIDER Discussion Paper No. 2003/21
69. McGillivary, Mark and Oliver Morrissey, “A Review of Evidence on the Fiscal
Effects of Aid,” CREDIT Research Paper, No. 01/13, University of Nottingham
70. Milanovic, Blanco. “Income, Inequality, and Poverty during the Transition from
Planned to Market Economy”, The World Bank, Washington, D.C., 1998
71. Mitra, Pritha, “Has Government Investment Crowded Out Private Investment in
India”, the paper was presented at the 2006 Annual Meeting of American Economics
Association.

155
72. Moore, Mick, “Death Without Taxes: Democracy, State Capacity, and Aid
Dependence in the Fourth World.” In G. White and M. Robinson (eds.), Towards a
Democratic Developmental State. Oxford: Oxford University Press, 1998
73. Mosley, P., J. Hudson, and S. Horrel “Aid, the Public Sector and the Market in less
Developed Countries: A Return to the Scene of the Crime”. Lournal of International
Development Vol.4, No. 2. pp. 139-150, 1992
74. Mosley, P., J. Hudson, and S. Horrel “Aid, the Public Sector and the Market in less
Developed Countries”. Economic Journal vol. 97, pp. 616-641, 1987
75. Neumayer, Eric, “The Pattern of Aid Giving: The Impact of Good Governance on
Development Assistance,” Routledge Studies in Development Economics, London,
2003
76. Ohlin, G. “The Evolution of Aid Doctrine,” in “Foreign Aid Policies Reconsidered,”
OECD, 1966.
77. OECD, “Is it ODA?” Note by the DAC Secretariat, Paris, 22 May 2001
78. OECD, Development Cooperation – 2004 Report, Paris: OECD, 2005
79. Quibria, M.G. “Development Effectiveness: What Does Recent Research Tell Us?”
ADB OED Working Paper 1, 2004
80. Radelet, Steven, “Bush and Foreign Aid,” Foreign Affairs, September/October 2003,
104-117
81. Radelet, Steven, “Aid Effectiveness and the Millennium Development Goals,”
Center for Global Development, Working Paper No. 39, 2004
82. Raffer, Kunibert, “ODA and Global Public Goods: A Trend Analysis of Past and
Present Spending Patterns. ODS Background Paper. New York: UNDP/ODS, 1999
83. Rajan, Raghuram G. and Arvind Subramanian, “Aid and Growth: What Does the
Cross-Country Evidence Really Show?” IMF Working Paper 05/127, Washington,
D.C., 2005a
84. Rajan, Raghuram G. and Arvind Subramanian, “What Undermines Aid’s Impact on
Growth?” IMF Working Paper 05/126, Washington, D.C., 2005b
156
85. Roodman, David “An Index of Donor Performance,” Working Paper 42, Center for
Global Development, Washington, D.C., 2004.
86. Ruttan, V.W. “United States Development Assistance Policy, Baltimore: John
Hopkins University Press, 1996
87. Sachs, Jeffrey. “The End of Poverty: Economic Possibilities for Our Time,” The
Penguin Press, New York, 2005.
88. Stiglitz, Joseph. “Towards a New Paradigm for Development”, 9th Raul Prebisch
Lecture, Geneva: UNCTAD, 1998
89. Svensson, Jakob, “When is Foreign Aid Policy Credible? Aid Dependence and
Conditionality,” Journal of Development Economics, Vol. 61 (2000) 61-84
90. Tarp, Finn. “Stabilization and Structural Adjustment: Macroeconomic Frameworks
for Analysing the Crisis in Sub-Saharan Africa”, Taylor and Francis Group, 1993
91. Trumbull, William N., and Howard Wall, “Estimating Aid Allocation Criteria with
Panel Data,” The Economic Journal, Vol. 104, No. 425, pp. 876-882, 1994
92. The National Security Strategy of the United States of America, Washington, D.C.,
The White House, September 2002.
http://www.state.gov/documents/organization/15538.pdf
93. U.K. Department for International Development. “Eliminating World Poverty:
Making Globalization Work for the Poor,” White Paper on International
Development Presented to Parliament by the Secretary of State for International
Development by Command of Her Majesty. London, December 2000.
94. USAID, Foreign Aid in the National Interest: Promoting Freedom, Security, and
Opportunity, Washington, D.C.: U.S. Agency for International Development, 2002
95. USAID, U.S. Foreign Aid: Meeting the Challenges of the Twenty-first Century,
Washington, D.C., U.S. Agency for International Development, White Paper, 2004
96. Young, A. ‘The Tyranny of Numbers: Confronting the Statistical Realities of the
East Asian Growth Experience’, Quarterly Journal of Economics, 1995, Vol. 110
pp.641-680.
157
97. Young, A. ‘Lessons from the East Asian Newly Industrialized Countries: A
Contrarian’s View’, European Economic Review, 1994, Vol. 38, pp. 964-973.
98. Wolf, Charles Jr., “Foreign Aid: Theory and Practice in Southern Asia,” Princeton
University Press, Princeton, New Jersey, 1960
99. Wolf, Charles, “Markets or Governments: Choosing Between Imperfect
Alternatives”, MIT Press, 1993
100. World Bank, “The East Asian Miracle: Economic Growth and Public Policy”,
Washington, D.C., 1993
101. World Bank, “Assessing Aid: What Works, What Doesn’t, and Why?”
Washington, D.C., 1998
102. World Bank. “A Case for aid: Building a Consensus for Development Assistance,”
Washington, D.C., 2002
103. World Bank. “Global Development Finance: Mobilizing Finance and Managing
Vulnerability,” Washington, D.C., 2005
104. World Bank. “Global Economic Prospects: Economic Implications of Remittances
and Migration,” Washington, D.C., 2006

158
Appendix 1
TheTheTheThe Millennium Development Goals Millennium Development Goals Millennium Development Goals Millennium Development Goals
Halve, between 1990 and 2015, the
proportion of people whose income is less
than one dollar a day
Eradicate extreme poverty
and hunger
Halve, between 1990 and 2015, the
proportion of people who suffer from hunger
Achieve universal primary
education
Ensure that by 2015 children everywhere,
boys and girls alike, will be able to complete
a full course of primary schooling
Promote gender equality and
empower women
Eliminate gender disparity in primary and
secondary education, preferably by 2005,
and to all levels of education no later than
2015
Reduce child mortality Reduce by two thirds, between 1990 and
2015, the under-five mortality rate
Improve maternal health Reduce by three quarters, between 1990 and
2015, the maternal mortality ratio
Have halted by 2015 and begun to reverse
the spread of HIV/AIDS
Combat HIV/AIDS, malaria
and other diseases
Have halted by 2015 and begun to reverse
the incidence of malaria and other major
diseases
Integrate the principles of sustainable
development into country policies and
programs and reverse the loss of
environmental resources
Halve by 2015 the proportion of people
without sustainable access to safe drinking
water and basic sanitation
Ensure environmental
sustainability
By 2020 to have achieved a significant
improvement in lives of at least 100 million
slum dwellers
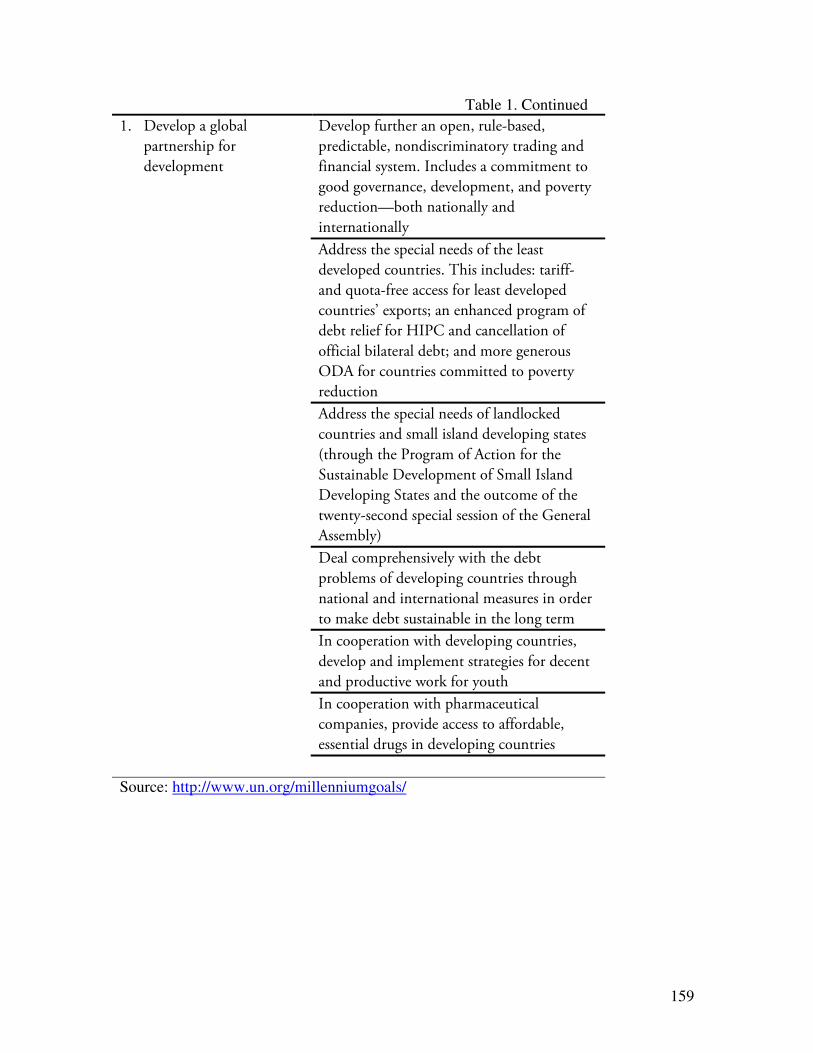
159
Table 1. Continued Develop further an open, rule-based,
predictable, nondiscriminatory trading and
financial system. Includes a commitment to
good governance, development, and poverty
reduction—both nationally and
internationally
Address the special needs of the least
developed countries. This includes: tariff-
and quota-free access for least developed
countries’ exports; an enhanced program of
debt relief for HIPC and cancellation of
official bilateral debt; and more generous
ODA for countries committed to poverty
reduction
Address the special needs of landlocked
countries and small island developing states
(through the Program of Action for the
Sustainable Development of Small Island
Developing States and the outcome of the
twenty-second special session of the General
Assembly)
Deal comprehensively with the debt
problems of developing countries through
national and international measures in order
to make debt sustainable in the long term
In cooperation with developing countries,
develop and implement strategies for decent
and productive work for youth
In cooperation with pharmaceutical
companies, provide access to affordable,
essential drugs in developing countries
1. Develop a global
partnership for
development
Source: http://www.un.org/millenniumgoals/
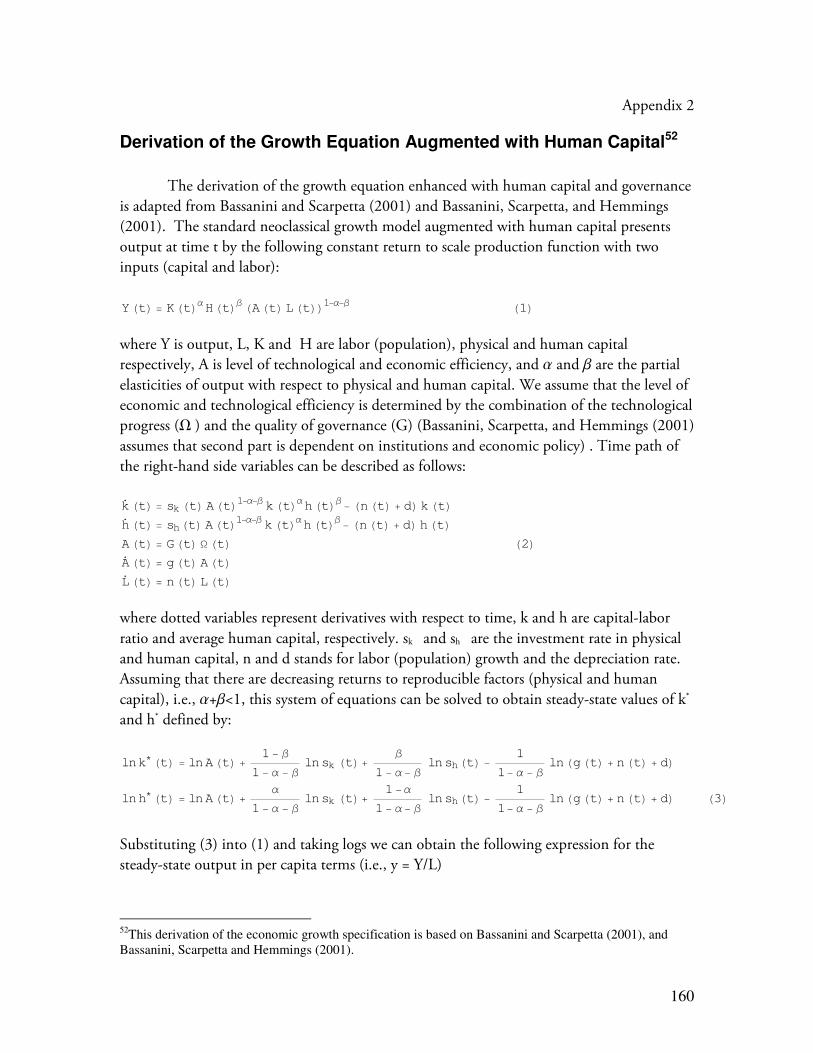
160
Appendix 2
Derivation of the Growth Equation Augmented with Human Capital52
The derivation of the growth equation enhanced with human capital and governance
is adapted from Bassanini and Scarpetta (2001) and Bassanini, Scarpetta, and Hemmings
(2001). The standard neoclassical growth model augmented with human capital presents
output at time t by the following constant return to scale production function with two
inputs (capital and labor):
Y HtL = K HtLα H HtLβ HA HtL L HtLL1−α−β H1L
where Y is output, L, K and H are labor (population), physical and human capital
respectively, A is level of technological and economic efficiency, and a and b are the partial
elasticities of output with respect to physical and human capital. We assume that the level of
economic and technological efficiency is determined by the combination of the technological
progress (W ) and the quality of governance (G) (Bassanini, Scarpetta, and Hemmings (2001)
assumes that second part is dependent on institutions and economic policy) . Time path of
the right-hand side variables can be described as follows:
k
HtL = sk HtL A HtL1−α−β k HtLα h HtLβ − Hn HtL + dL k HtLh
HtL = sh HtL A HtL1−α−β k HtLα h HtLβ − Hn HtL + dL h HtLA HtL = G HtL Ω HtL H2LA
HtL = g HtL A HtLL
HtL = n HtL L HtL
where dotted variables represent derivatives with respect to time, k and h are capital-labor
ratio and average human capital, respectively. sk and sh are the investment rate in physical
and human capital, n and d stands for labor (population) growth and the depreciation rate.
Assuming that there are decreasing returns to reproducible factors (physical and human
capital), i.e., a+b<1, this system of equations can be solved to obtain steady-state values of k*
and h* defined by:
lnk∗ HtL = lnA HtL +1− β
1− α − βlnsk HtL+
β
1− α − β lnsh HtL −
1
1− α − β ln Hg HtL + n HtL + dL
lnh∗ HtL = lnA HtL +α
1− α − βlnsk HtL+
1− α
1− α − β lnsh HtL −
1
1− α − β ln Hg HtL + n HtL + dL H3L
Substituting (3) into (1) and taking logs we can obtain the following expression for the
steady-state output in per capita terms (i.e., y = Y/L)
52This derivation of the economic growth specification is based on Bassanini and Scarpetta (2001), and Bassanini, Scarpetta and Hemmings (2001).
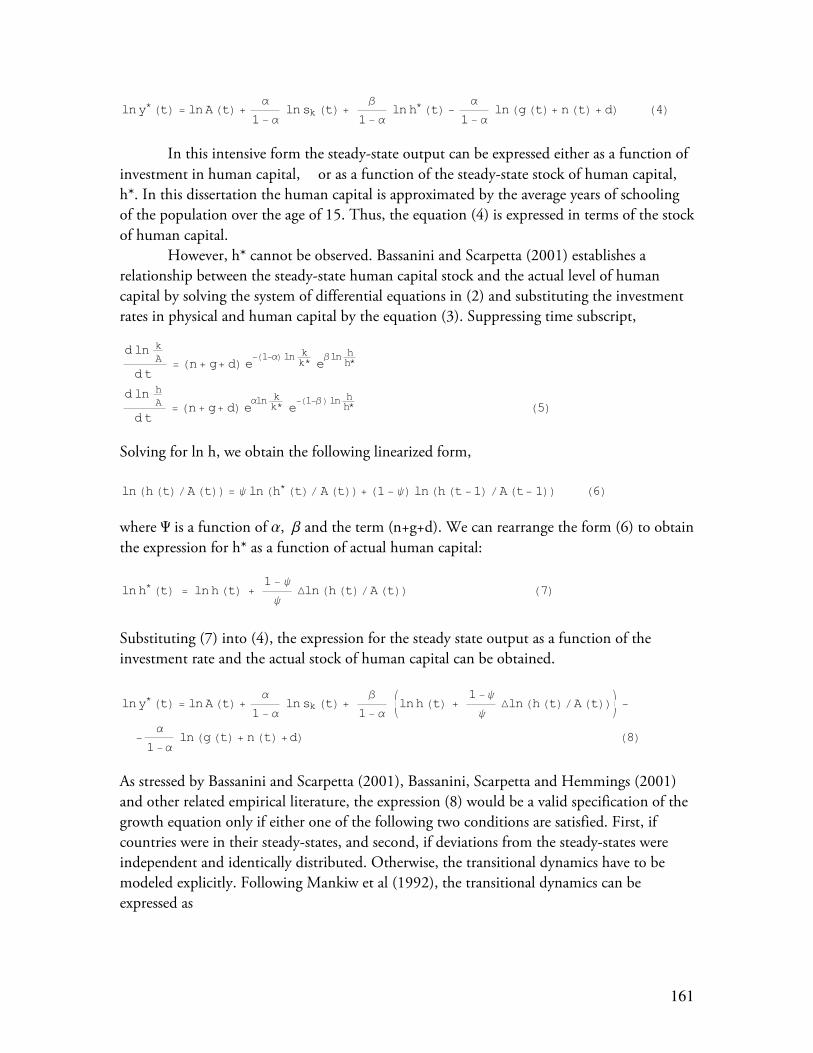
161
lny∗ HtL = lnA HtL +α
1 − αlnsk HtL +
β
1− α lnh∗ HtL −
α
1− α ln Hg HtL+ n HtL + dL H4L
In this intensive form the steady-state output can be expressed either as a function of
investment in human capital, or as a function of the steady-state stock of human capital,
h*. In this dissertation the human capital is approximated by the average years of schooling
of the population over the age of 15. Thus, the equation (4) is expressed in terms of the stock
of human capital.
However, h* cannot be observed. Bassanini and Scarpetta (2001) establishes a
relationship between the steady-state human capital stock and the actual level of human
capital by solving the system of differential equations in (2) and substituting the investment
rates in physical and human capital by the equation (3). Suppressing time subscript,
dln kA
dt= Hn+ g+ dL e
−H1−αL ln kk∗ e
βln hh∗
dln hA
dt= Hn+ g+ dL e
αln kk∗ e
−H1−βL ln hh∗ H5L
Solving for ln h, we obtain the following linearized form,
lnHh HtLêA HtLL = ψ lnHh∗ HtLê A HtLL+ H1 − ψL lnHh Ht −1L êAHt− 1LL H6L
where Y is a function of a, b and the term (n+g+d). We can rearrange the form (6) to obtain
the expression for h* as a function of actual human capital:
lnh∗ HtL = lnh HtL +1− ψ
ψ ∆lnHh HtLêA HtLL H7L
Substituting (7) into (4), the expression for the steady state output as a function of the
investment rate and the actual stock of human capital can be obtained.
lny∗ HtL = lnA HtL +α
1 − αlnsk HtL +
β
1− α iklnh HtL +
1− ψ
ψ ∆lnHh HtLêA HtLLy
−
−α
1− α ln Hg HtL + n HtL +dL H8L
As stressed by Bassanini and Scarpetta (2001), Bassanini, Scarpetta and Hemmings (2001)
and other related empirical literature, the expression (8) would be a valid specification of the
growth equation only if either one of the following two conditions are satisfied. First, if
countries were in their steady-states, and second, if deviations from the steady-states were
independent and identically distributed. Otherwise, the transitional dynamics have to be
modeled explicitly. Following Mankiw et al (1992), the transitional dynamics can be
expressed as
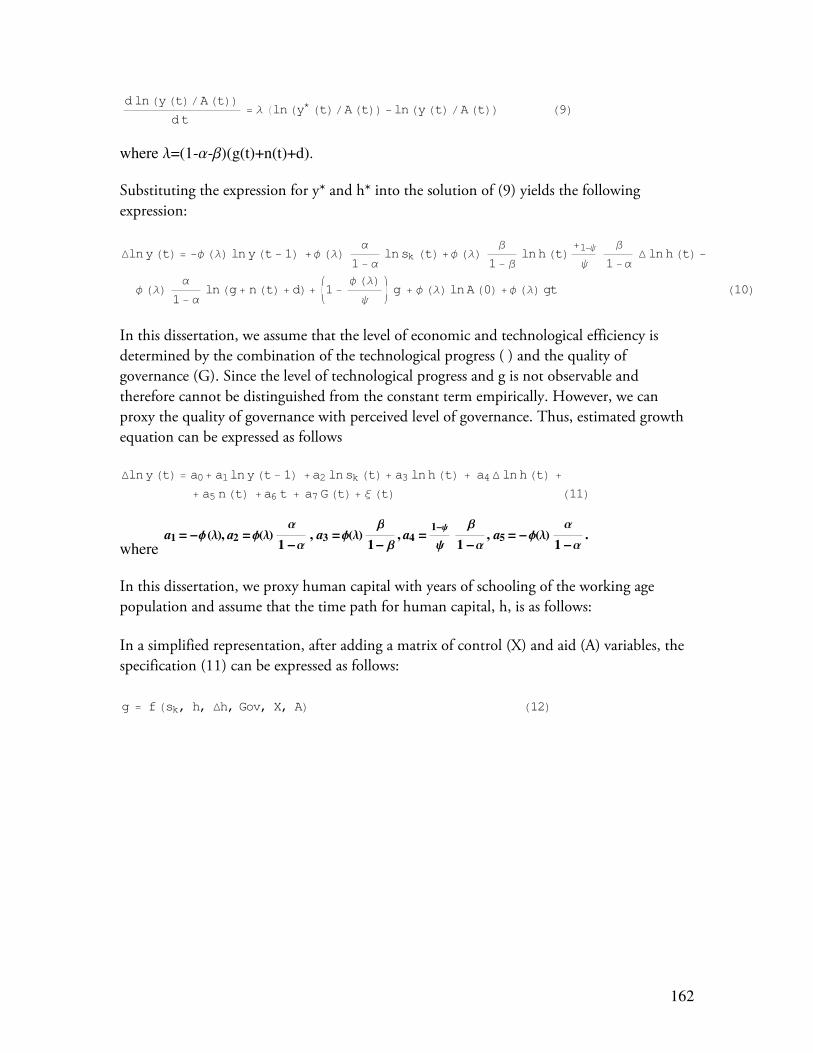
162
dlnHyHtLêAHtLLdt
= λ HlnHy∗ HtLêA HtLL −lnHy HtL êA HtLL H9L
where l=(1-a-b)(g(t)+n(t)+d).
Substituting the expression for y* and h* into the solution of (9) yields the following
expression:
∆lny HtL = −φ HλL lny Ht − 1L + φ HλL α
1 − αlnsk HtL + φ HλL
β
1− β lnh HtL +1−ψ
ψ
β
1− α ∆ lnh HtL −
φ HλL α
1− αlnHg+ n HtL + dL+
ik1 −
φ HλLψ
y
g + φ HλL lnA H0L + φ HλL gt H10L
In this dissertation, we assume that the level of economic and technological efficiency is
determined by the combination of the technological progress ( ) and the quality of
governance (G). Since the level of technological progress and g is not observable and
therefore cannot be distinguished from the constant term empirically. However, we can
proxy the quality of governance with perceived level of governance. Thus, estimated growth
equation can be expressed as follows
∆lny HtL = a0+ a1lny Ht − 1L +a2 lnsk HtL + a3 lnh HtL + a4 ∆ lnh HtL +
+ a5 n HtL +a6 t + a7 G HtL + ξ HtL H11L
wherea1 = -fHlL, a2 = fHlL
a
1 -a, a3 = fHlL
b
1- b, a4 =
1-y
y
b
1 -a, a5 = -fHlL
a
1 -a.
In this dissertation, we proxy human capital with years of schooling of the working age
population and assume that the time path for human capital, h, is as follows:
In a simplified representation, after adding a matrix of control (X) and aid (A) variables, the
specification (11) can be expressed as follows:
g = f Hsk, h, ∆h, Gov, X, AL H12L
163
Appendix 4
List of Donors Included in the Sample and Data Sources
Australia, Austria, Belgium, Canada, Denmark, Finland, France, Germany, Greece, Ireland, Italy,
Japan, Netherlands, New Zealand, Norway, Portugal, Spain, Sweden, Switzerland, UK, USA.
Appendix 5
List of aid recipients
Afghanistan, Albania, Algeria, Angola, Argentina, Armenia, Azerbaijan, Bangladesh,
Barbados, Belarus, Belize, Benin, Bhutan, Bolivia, Bosnia and Herzegovina, Botswana,
Brazil, Brunei, Bulgaria, Burkina Faso, Burundi, Cambodia, Cameroon, Cape Verde,
Central African Republic, Chad, Chile, China, Colombia, Comoros, Congo/Brazzaville,
Congo/Kinshasa, Costa Rica, Cote d'Ivoire, Croatia, Cuba, Cyprus, Czech Republic,
Djibouti, Dominican Republic, Ecuador, Egypt, El Salvador, Equatorial Guinea, Eritrea,
Estonia, Ethiopia, Fiji, Gabon, Gambia, Georgia, Ghana, Grenada, Guatemala, Guinea,
Guinea Bissau, Guyana, Haiti, Honduras, Hungary, India, Indonesia, Iran, Jamaica, Jordan,
Kazakhstan, Kenya, Korea Republic, Kyrgyz Republic, Laos, Latvia, Lebanon, Lesotho,
Liberia, Libya, Lithuania, Macedonia, Madagascar, Malawi, Malaysia, Maldives, Mali,
Malta, Marshall Islands, Mauritania, Mauritius, Mexico, Micronesia, Moldova, Mongolia,
Morocco, Mozambique, Myanmar, Namibia, Nepal, Nicaragua, Niger, Nigeria, Oman,
Pakistan, Panama, Papua New Guinea, Paraguay, Peru, Philippines, Poland, Romania,
Russia, Rwanda, Senegal, Serbia and Montenegro, Sierra Leone, Singapore, Slovak Republic,
Slovenia, Solomon Islands, Somalia, South Africa, Sri Lanka, Sudan, Suriname, Swaziland,
Syria, Tajikistan, Tanzania, Thailand, Togo, Tonga, Trinidad & Tobago, Tunisia, Turkey,
Turkmenistan, Uganda, Ukraine, Uruguay, Uzbekistan, Venezuela, Vietnam, Yemen,
Zambia, Zimbabwe.
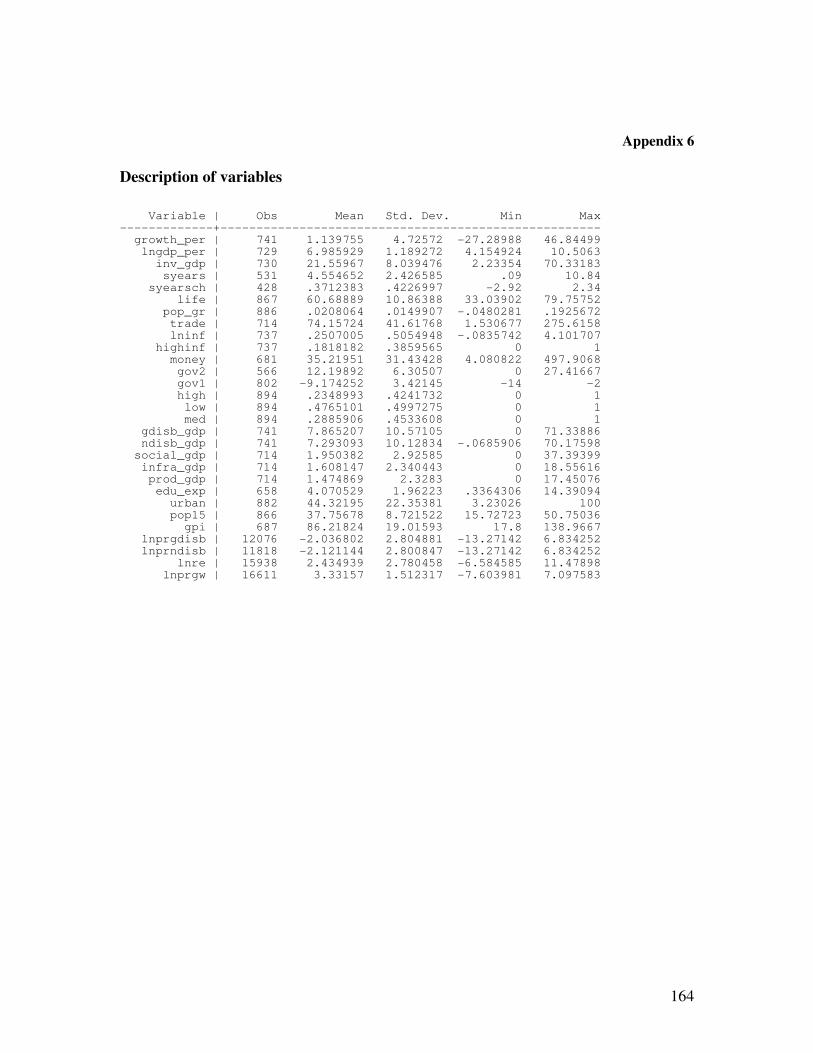
164
Appendix 6
Description of variables
Variable | Obs Mean Std. Dev. Min Max -------------+----------------------------------------------------- growth_per | 741 1.139755 4.72572 -27.28988 46.84499 lngdp_per | 729 6.985929 1.189272 4.154924 10.5063 inv_gdp | 730 21.55967 8.039476 2.23354 70.33183 syears | 531 4.554652 2.426585 .09 10.84 syearsch | 428 .3712383 .4226997 -2.92 2.34 life | 867 60.68889 10.86388 33.03902 79.75752 pop_gr | 886 .0208064 .0149907 -.0480281 .1925672 trade | 714 74.15724 41.61768 1.530677 275.6158 lninf | 737 .2507005 .5054948 -.0835742 4.101707 highinf | 737 .1818182 .3859565 0 1 money | 681 35.21951 31.43428 4.080822 497.9068 gov2 | 566 12.19892 6.30507 0 27.41667 gov1 | 802 -9.174252 3.42145 -14 -2 high | 894 .2348993 .4241732 0 1 low | 894 .4765101 .4997275 0 1 med | 894 .2885906 .4533608 0 1 gdisb_gdp | 741 7.865207 10.57105 0 71.33886 ndisb_gdp | 741 7.293093 10.12834 -.0685906 70.17598 social_gdp | 714 1.950382 2.92585 0 37.39399 infra_gdp | 714 1.608147 2.340443 0 18.55616 prod_gdp | 714 1.474869 2.3283 0 17.45076 edu_exp | 658 4.070529 1.96223 .3364306 14.39094 urban | 882 44.32195 22.35381 3.23026 100 pop15 | 866 37.75678 8.721522 15.72723 50.75036 gpi | 687 86.21824 19.01593 17.8 138.9667 lnprgdisb | 12076 -2.036802 2.804881 -13.27142 6.834252 lnprndisb | 11818 -2.121144 2.800847 -13.27142 6.834252 lnre | 15938 2.434939 2.780458 -6.584585 11.47898 lnprgw | 16611 3.33157 1.512317 -7.603981 7.097583