Supply Well Evaluation Report final - Hilmar Cheese Company
75
Transcript of Supply Well Evaluation Report final - Hilmar Cheese Company


Supply Well Evaluation Technical Report, Hilmar Cheese Company August 15, 2008 Page i
TABLE OF CONTENTS PAGE LIST OF FIGURES .............................................................................................................................. iii LIST OF TABLES ................................................................................................................................ iii LIST OF APPENDICES ...................................................................................................................... iv LIST OF ACRONYMS AND ABBREVIATIONS ........................................................................... v
EXECUTIVE SUMMARY ................................................................................................................ VI
1.0 INTRODUCTION ................................................................................................................. 1-1
2.0 BACKGROUND .................................................................................................................... 2-1 2.1 Site Location, Description and Land Use .................................................................. 2-1 2.2 Regulatory and Investigation Background and Status .............................................. 2-1 2.3 2008 Supply Well Sampling Background and Summary ......................................... 2-2
3.0 ENVIRONMENTAL SETTING ......................................................................................... 3-1 3.1 Site Setting .................................................................................................................. 3-1 3.2 Hydrogeology.............................................................................................................. 3-1
3.2.1 Groundwater Flow Direction ............................................................................... 3-2 3.3 Ambient Water Quality Conditions ........................................................................... 3-2
4.0 SUPPLY WELL SAMPLING RESULTS AND GEOCHEMICAL DISCUSSION ... 4-1 4.1 2008 Supply Well Sampling Results ......................................................................... 4-1
4.1.1 Total Dissolved Solids and Conductivity ............................................................ 4-1 4.1.2 Chloride ................................................................................................................. 4-1 4.1.3 Sodium .................................................................................................................. 4-1 4.1.4 Manganese and Iron ............................................................................................. 4-2 4.1.5 Nitrate .................................................................................................................... 4-2 4.1.6 Other Cations ........................................................................................................ 4-2 4.1.7 Other Analyses ..................................................................................................... 4-2
4.2 Geochemical Evaluation ............................................................................................. 4-3 4.2.1 HCC Source Indicator Evaluation ....................................................................... 4-3
4.2.1.1 Chloride .......................................................................................................... 4-4 4.2.2 Reduction/Oxidation Based Reactions ................................................................ 4-5
5.0 EVALUATION OF SUPPLY WELL IMPACTS ............................................................ 5-1 5.1 Technical Approach .................................................................................................... 5-1 5.2 Regulatory Thresholds ................................................................................................ 5-2 5.3 Potential Sources of Impact ........................................................................................ 5-2
5.3.1 HCC ...................................................................................................................... 5-2 5.3.2 Off-Site Sources ................................................................................................... 5-3

Supply Well Evaluation Technical Report, Hilmar Cheese Company August 15, 2008 Page ii
5.4 Determination of Impacted Supply Well Sources ..................................................... 5-4
6.0 CONCLUSION AND RECOMMENDATIONS .............................................................. 6-1 6.1 Conclusions ................................................................................................................. 6-1 6.2 Recommendations Regarding HCC Replacement of Impacted Water
Supplies ....................................................................................................................... 6-1
7.0 REFERENCES ...................................................................................................................... 7-1

Supply Well Evaluation Technical Report, Hilmar Cheese Company August 15, 2008 Page iii
LIST OF TABLES
Table 4-1 Supply Well Analytical Data
Table 4-2 Supply Well Analytical Data Comparison with Regulatory Thresholds
Table 4-3 Waste Water Analytical Summary
Table 5-1 Supply Well Findings Summary
LIST OF FIGURES
Figure 1-1 Site Location Map
Figure 2-1
Figure 2-2
Land Use and 2008 Supply Well Sampling Locations
Groundwater Investigation Sampling Locations
Figure 3-1 Well Construction Details for 2008 Private Wells Sampled
Figure 3-2 Potentiometric Surface Map
Figure 4-1 Total Dissolved Solids Detected in Supply Wells
Figure 4-2 Chloride Detected in Supply Wells
Figure 4-3 Sodium Detected in Supply Wells
Figure 4-4 Manganese Detected in Supply Wells
Figure 4-5 Nitrate Detected in Supply Wells Figure 4-6 Chloride Concentrations in HCC Waste Water and Groundwater Figure 4-7 Chloride and TDS Correlation in HCC Site Groundwater Figure 4-8 Chloride and TDS Correlation in Supply Well Samples
Figure 5-1 Decision Tree Approach for Weight of Evidence Evaluation of HCC as a Supply Well Impact Source
Figure 5-2 Supply Well Findings

Supply Well Evaluation Technical Report, Hilmar Cheese Company August 15, 2008 Page iv
LIST OF APPENDICES
Appendix A Total Dissolved Solid (TDS) Concentrations in Groundwater Figures (Source: JJ&A 2008 Phase II Investigation Data Deliverable and Summary Report)
Appendix B Chloride Ambient Calculations and Data Sets
Appendix C Supply Well Information Summary Table

Supply Well Evaluation Technical Report, Hilmar Cheese Company August 15, 2008 Page v
LIST OF ACRONYMS AND ABBREVIATIONS
AB Ambient Boring B&C Brown and Caldwell BOD Biochemical oxygen demand CAFO Confined Animal Feeding Operations CAO Cleanup and Abatement Order CEL Cation exchange capacity COC Constituent of Concern CPT Cone Penetrometer Test CSM Conceptual Site Model CVRWQCB Regional Water Quality Control Board, Central Valley Region V DWR Department of Water Resources Site Hilmar Cheese Facility and associated irrigated lands located in Hilmar, CA ft-bgs feet below ground surface Ft MSL Feet above mean sea level HCC Hilmar Cheese Company HP Hydropunch JJA Jacobson James & Associates K Potassium KJ Kennedy/Jenks Consultants mgd Million gallons per day mg/L milligrams per liter MCL Maximum contaminant level MW Monitoring Well NA Sodium USGS United States Geological Survey SGI The Source Group, Inc. SWRCB State Water Resources Control Board TDS Total Dissolved Solids TID Turlock Irrigation District USEPA U.S. Environmental Protection Agency WDR Waste Discharge Requirement

Supply Well Evaluation Technical Report, Hilmar Cheese Company August 15, 2008 Page vi
EXECUTIVE SUMMARY
In accordance with the Central Valley Regional Water Quality Control Board (CVRWQCB) Cleanup and Abatement Order No. R5-2004-0722, dated December 2, 2004 (CAO) and the CVRWQCB correspondence dated February 29, 2008, and on behalf of the Hilmar Cheese Company (HCC), Jacobson James & Associates (JJ&A) prepared this Supply Well Sampling Evaluation Technical Report (Technical Report) to evaluate potential impact of HCC wastewater on supply wells at, and in the vicinity of the HCC facility located at 9001 North Lander Avenue, Hilmar, California (the Site). Samples from forty one (41) supply wells were collected1 between May 12, and June 2, 2008 in accordance with the CVRWQCB approved JJ&A 2008 Area Water Supply Well Sampling Work Plan. The purpose of the sampling was to determine the water quality of nearby domestic and agricultural supply wells. The objectives of this report are to: (1) identify if HCC is the source of impact to supply wells sampled in 2008; and (2) evaluate and propose in kind replacement of the affected water supplies.
HCC constituents of concern (COC) are consistent with: (1) those potentially contributed to the groundwater by other nearby land uses, and (2) those associated with regional water quality degradation. A comparison of the 2008 supply well sampling data to the federal and state primary and secondary maximum contaminant levels (MCLs), taste and odor thresholds and agricultural use thresholds indicates that all wells exceed one or more of the regulatory thresholds. As such, a reported constituent concentration above a regulatory threshold in a supply well may not indicate impact by HCC. The impact can result from the regional water quality, or one or more local sources which are additive to the already degraded regional water quality.
Because the HCC constituents of concern are consistent with those present in the degraded regional ground water system and those potentially contributed by local land use, a weight of evidence approach was used to determine if HCC is the source of impact to supply wells. The weight of evidence approach considers the following factors:
• Constituent(s) causing the impact;
• Presence of a complete pathway from HCC;
• Well location and construction;
1 Due to access restrictions, a single blended water sample from supply wells IN-4 and IN-4A was collected.
Supply Well Evaluation Technical Report, Hilmar Cheese Company August 15, 2008 Page vii
• Other potential source(s) at or near the well(s);
• General supply well water chemistry;
• Consistency of supply well data with concentration trends from the HCC Site; and
• Supply well concentrations relative to estimated ambient levels.
Based on the evaluation of these factors, the weight of evidence indicates that HCC is the source of impact for 6 wells, a primary contributor of impact for 12 wells, not a primary contributor of impact for 5 wells, and not a source of impact for 8 wells. Additionally, a specific source could not be discerned from regional conditions for 11 wells. Data gaps have been identified to confirm these findings for specific wells.
HCC will contact the owners of the supply wells for which HCC has been identified as the source of impact and make the necessary arrangements to provide in kind replacement of the affected water supplies. Additionally, HCC will collect the information needed to fill the remaining data gaps and then contact the owners of any additional wells for which HCC is identified as the source. HCC will then make the necessary arrangements for in kind replacement of their affected water supplies, as necessary.

Supply Well Evaluation Technical Report, Hilmar Cheese Company August 15, 2008 Page 1-1
1.0 INTRODUCTION
In accordance with the Central Valley Regional Water Quality Control Board (CVRWQCB) Cleanup and Abatement Order No. R5-2004-0722, dated December 2, 2004 (CAO) and the CVRWQCB correspondence dated April 9, 2008, Jacobson James & Associates (JJ&A) on behalf of the Hilmar Cheese Company (HCC), has prepared this Supply Well Sampling Evaluation Technical Report (Technical Report) to evaluate potential impact of HCC waste water on supply wells at, and in the vicinity of the HCC facility located at 9001 North Lander Avenue, Hilmar, California (the Site, Figure 1-1). The supply well sampling was performed between May 12, and June 2, 2008 in accordance with the CVRWQCB approved Area Water Supply Well Sampling Work Plan (Work Plan) (JJ&A, 2008a).
This report will:
(1) Identify if HCC is the source of impact to supply wells sampled in 2008; and
(2) Evaluate and propose in kind replacement of the affected water supplies.
The report is organized as follows:
• Executive Summary
• Introduction (Section 1.0)
• Background (Section 2.0)
• Environmental Setting (Section 3.0)
• 2008 Supply Well Results and Geochemical Evaluations (Section 4.0)
• Evaluation of Supply Well Impacts and Identification of Data Gaps (Section 5.0)
• Conclusions and Recommendations (Section 6.0)
• References (7.0)

Supply Well Evaluation Technical Report, Hilmar Cheese Company August 15, 2008 Page 2-1
2.0 BACKGROUND
2.1 Site Location, Description and Land Use
Hilmar Cheese Company (HCC) operates a milk-processing facility located north of the town of Hilmar in Merced County, California (the Site). The facility and associated buildings occupy approximately 27 acres.
Land use in the vicinity of the Site is predominantly agricultural. A land use survey performed in 2007 identified land uses in the immediate vicinity of, and adjacent to, the Site as dairy/livestock (i.e., confined animal facility operations), poultry farms, field crops, orchards, and vineyards as presented in the 2007 Interim Data Deliverable and Field Investigation Summary prepared by The Source Group, Inc. (SGI, 2007). A figure illustrating the various land uses is provided as Figure 2-1.
2.2 Regulatory and Investigation Background and Status
The CAO requires delineation of the potential extent of impact by HCC operations, the identification and sampling of supply wells in the vicinity of the Site and the development of a conceptual site model (CSM). Additionally, the CAO requires evaluation and selection of remedial options, if determined to be necessary, to address impacts to water quality resulting from HCC operations.
Previous Site investigation work, performed in accordance with RWQCB approved work plans, includes a land use survey of the Site vicinity, lithological data collection using soil borings and Cone Penetrometer Test (CPT), down-hole geophysical logs, analysis of grab groundwater samples, monitoring well installations, monitoring well sampling and analysis, and water level data collection. The following reports, previously submitted to the RWQCB, describe the prior activities performed at the Site.
• 1995, December 22: Nolte and Associates, Inc. Hilmar Cheese Company, Characterization of Subsurface and Shallow Groundwater Conditions.
• 1999, February 11: Nolte and Associates, Inc. Hilmar Cheese Company, Monitoring Well Network Program Groundwater Analysis Report.
• 2005, March: Brown & Caldwell (B&C) Final Site Assessment Work Plan
• 2005, July 11: B&C. Water Supply Well Sampling Technical Report.

Supply Well Evaluation Technical Report, Hilmar Cheese Company August 15, 2008 Page 2-2
• 2007, August 31: SGI. Interim Data Deliverable and Field Investigation Summary, Hilmar Cheese Company, Hilmar, California.
• 2008, June 23: Phase II Investigation Data Deliverable and Summary Report, Hilmar Cheese Company, Hilmar, California.
• 2008, June 23: Technical Memorandum – Determination of Ambient TDS Concentrations for the Upper Aquifer, Hilmar Cheese Company, Hilmar, California.
• 2008, July 1: 2008 Area Supply Well Sampling Data Deliverable, Hilmar Cheese Company, Hilmar, California.
Routine monthly monitoring and sampling reports are also issued which present the work performed and results obtained pursuant to the WDRs.
Figure 2-2 depicts the locations of the CPT, Hydropunch™ (HP), ambient (AB) and monitoring well (MW) groundwater sample locations. As summarized in the Phase II Investigation Data Deliverable and Summary Report (JJ&A, 2008b), the complete lateral and vertical definition of groundwater impact from the HCC Site has not been defined and there are remaining data gaps. Figures from the Phase II Investigation Data Deliverable and Summary Report depicting the lateral and vertical extent of total dissolved solids (TDS) concentrations as currently defined are provided in Appendix A.
2.3 2008 Supply Well Sampling Background and Summary
The 2008 supply well sampling activities and results were described in the Area Supply Well Sampling Data Deliverable (JJ&A, 2008d) (Supply Well Data Deliverable) submitted to the RWQCB on July 1, 2008. This Supply Well Data Deliverable provided a summary of previous assessment activities in addition to the 2008 data collection activities, field measurements/observations and analytical data collected.
As described in the Supply Well Data Deliverable, JJ&A completed a survey of supply wells in the vicinity of HCC. A total of 73 supply wells were identified through review of the Water Supply Well Sampling Technical Report (B&C, 2005c), review of Department of Water Resources (DWR) well completion reports, field staff communication with property owners and Site reconnaissance. Forty two (42) of the 73 identified supply wells were sampled between May 12 and June 2, 2008.2 The supply wells sampled during the 2008 sampling event, in addition to other supply wells in the vicinity are illustrated on Figure 2-1. 2 Due to access restrictions, a single blended water sample from supply wells IN-4 and IN-4A was collected for a total of 41 samples.

Supply Well Evaluation Technical Report, Hilmar Cheese Company August 15, 2008 Page 3-1
3.0 ENVIRONMENTAL SETTING
3.1 Site Setting
The Site is located in the northern portion of the San Joaquin Valley at an elevation of approximately 90 feet above mean sea level (ft msl). The area gradually slopes westward from the Sierra Nevada Mountain Range to the San Joaquin River. As described above, land use is primarily rural agricultural.
3.2 Hydrogeology
Unconsolidated alluvial sediments were encountered beneath the Site to a total depth of the Phase II investigation (i.e., ~250 feet below ground surface [ft-bgs]) (JJ&A, 2008b). The sediments encountered include coarse grained lithologies such as silty sands and sands with lesser amounts of gravel encountered at depth. The coarse grained sediments are consistent with those deposited in a relatively high-energy fluvial system (e.g., ancient river). Fine grained sediments, including silts and clays were also encountered. The finer-grained sediments are consistent with those deposited in a relatively low-energy lacustrine (e.g., lake) environment or as overbank deposits. The stream and lake depositional environment descriptions are consistent with the findings of regional studies (USGS, 2004).
The groundwater table is encountered at a relatively shallow depth (generally ≤ 10 ft-bgs) (JJ&A, 2008b). Groundwater occurs in the upper 100 ft under unconfined to semi-confined conditions. Below this upper inter-bedded unit is a series of relatively laterally continuous finer-grained beds (clays and silts) separated by relatively laterally continuous coarser-grained units (sands and gravels). The fine grained units represent potential aquitards while the coarser grained units supply groundwater under semi-confined to confined conditions depending on the competency of the noted aquitards.
For purposes of assessing the lateral and vertical extent of impact at the Site, several hydro-stratigraphic horizons have been identified to the current investigation depth of 250 ft-bgs as described in the JJ&A Phase II Investigation and Data Deliverable and Summary Report (JJ&A, 2008b). The A- and B-Zones comprise the Upper Aquifer over the Corcoran Clay. The C- and D-Zones comprise the Lower Aquifer to the maximum depth of 250 ft-bgs explored through the Phase II work. This approach is useful for Site assessment purposes, and the supply wells are not constructed in a manner completely consistent with this framework. As example, many of the supply wells are screened across the lower portion of the A-Zone and the B-Zone, and many wells are screened through the Corcoran Clay.

Supply Well Evaluation Technical Report, Hilmar Cheese Company August 15, 2008 Page 3-2
Because the supply wells are generally screened across several zones, the supply wells were categorized as being screened exclusively above the Corcoran Clay, exclusively below the Corcoran Clay, across the Corcoran Clay and unknown, for purposes of the supply well evaluation. In addition, available data relative to the extent of the sanitary seal was reviewed. If the sanitary seal present was at least 50-feet thick, the well was considered as having and adequate sanitary seal. The categorization of the wells and the evaluation of sanitary seals is based on available well construction data, summarized on Figure 3-1.
3.2.1 Groundwater Flow Direction
The regional groundwater flow direction is generally to the south and west towards the San Joaquin River. Local irrigation practices, groundwater extraction, surface water storage and discharges to land have affected the natural flow regime.
There are monitoring wells installed at the Site that are monitored monthly to determine local groundwater levels in the shallow zone (i.e., the upper A-Zone). On August 4, 2008, a comprehensive round of water levels was collected from all HCC monitoring wells. A potentiometric surface map was constructed with the data from the upper A-Zone and is provided as Figure 3-2. A review of this figure indicates the flow direction was generally to the south and west of the HCC facility. There was an apparent groundwater mound observed south of the HCC storage ponds for highly treated water as measured in monitoring well MW-1. Additional mounds were observed north of the primary lands at MW-10 and on the southern end of the primary lands at MW-8.
Monitoring well pairs installed in the upper and lower A-Zone as well as in the B- and C-Zones exhibit downward vertical gradients likely generated by local groundwater pumping and surface water applications (JJ&A, 2008b). This is consistent with the regional conditions wherein years of groundwater extraction combined with irrigation have resulted in regional downward gradients (USGS, 2004). Additionally, the pumping of supply wells in the vicinity of the Site which are screened across multiple zones can be affecting vertical gradients by providing preferential groundwater flow paths (i.e., towards and down through the supply wells).
3.3 Ambient Water Quality Conditions
Ambient concentrations for TDS in groundwater were determined for water quality above the Corcoran Clay. The ambient data sets, statistical methods and calculations used to determine the ambient concentrations were presented in the June 23, 2008 Technical Memorandum: Determination of

Supply Well Evaluation Technical Report, Hilmar Cheese Company August 15, 2008 Page 3-3
Ambient TDS Concentrations for the Upper Aquifer (JJ&A, 2008c). The ambient TDS concentrations were determined to provide threshold values against which the Site data can be compared.
Ambient TDS concentrations were calculated for the upper portion of the A-Zone (corresponding to the upper 25 feet of the water table) and the lower portion of the A-Zone and the B-Zone (referred to as the “Upper Aquifer Supply Zone”). The Upper Aquifer Supply Zone overlies the Corcoran Clay and supplies wells in the vicinity of the HCC Site with water for irrigation and domestic use. The ambient TDS concentration calculated for the Upper Aquifer Supply Zone is 760 mg/L.
Supply Well Evaluation Technical Report, Hilmar Cheese Company August 15, 2008 Page 4-1
4.0 SUPPLY WELL SAMPLING RESULTS AND GEOCHEMICAL DISCUSSION
4.1 2008 Supply Well Sampling Results
This section presents the data from the 2008 supply well sampling event. The 2008 supply well analytical data, along with the 2005 supply well data, is provided in Table 4-1. A preliminary screening of the 2008 analytical data against potentially applicable regulatory thresholds was performed. Each data point was compared to available state or federal maximum contaminant levels (MCLs) for drinking water, including both primary and secondary MCLs. In addition, taste and odor thresholds and agricultural water quality standards were utilized. The results of this screening is provided in Table 4-2 and discussed below.
4.1.1 Total Dissolved Solids and Conductivity
All of the supply wells sampled during the 2008 sampling event had detectable concentrations of TDS ranging ranged from 160 milligrams per liter (mg/L) (DW-54) to 1,400 mg/L (IW-4). Thirty-five (35) of the supply wells had TDS levels in excess of the secondary MCL (500 mg/L) and the agricultural water quality standard (450 mg/L). The distribution of TDS is illustrated on Figure 4-1.
Conductivity measurements exhibited a consistent correlation to the TDS values observed. Conductivity values ranged from 290 micromhos/centimeter (umhos/cm) (DW-54) to 2,300 umohs/cm (IW-4). The distribution of conductivity is consistent with the distribution of TDS.
4.1.2 Chloride
All of the supply wells sampled during the 2008 sampling event had detectable concentrations of chloride ranging from 16 mg/L (DW-47) to 300 mg/L (IN7). Two of the supply wells had chloride levels in excess of the state and federal secondary MCL (250 mg/L) and ten exceeded the agricultural water quality standard for chloride (106 – 175 mg/L). The distribution of the chloride is illustrated on Figure 4-2. The distribution of chloride is similar to the distribution of TDS.
4.1.3 Sodium
All of the supply wells sampled during the 2008 sampling event had detectable concentrations of sodium ranging from 27 mg/L (DW-47) to 300 mg/L (DW35). All but one of the supply wells (DW-

Supply Well Evaluation Technical Report, Hilmar Cheese Company August 15, 2008 Page 4-2
47) had sodium concentrations above the taste and odor (30/60 mg/L), or the agricultural thresholds (69 mg/L). The distribution of the sodium is illustrated on Figure 4-3
4.1.4 Manganese and Iron
Thirty-one (31) of the supply wells sampled during the 2008 sampling event had detectable concentrations of manganese. Concentrations ranged from <0.010 mg/L (non-detectable) at ten locations to 2.5 mg/L (DW35). Twenty-five (25) of the supply wells had manganese concentrations above the state and federal secondary MCLs (0.05 mg/L) and the taste and odor threshold (0.2 mg/L). The distribution of manganese is illustrated on Figure 4-4.
There were only two supply wells that contained concentrations of iron above the laboratory reporting limit. Supply wells DW-35 and DW-35B contained dissolved iron concentrations of 0.38 mg/L and 0.40 mg/L, respectively.
4.1.5 Nitrate
All but 6 of the supply wells sampled during the 2008 sampling event had detected concentrations of nitrate (quantified as nitrogen) ranging from <0.02 mg/L (non-detectable concentrations at DW-54) to 95 mg/L (DW28). Twenty-seven (27) of the supply wells had nitrate concentrations above the state and federal secondary MCLs (45 and 10 mg/L, respectively).
There were no detections of total Kjeldahl nitrogen (TKN) or ammonia as nitrogen during the 2008 supply well sampling event. The distribution of nitrate is illustrated on Figure 4-5.
4.1.6 Other Cations
As shown in Table 4-3, potassium, calcium, sulfate and magnesium are cations present in the treated waste water discharged to the primary lands. All of these constituents were detected at concentrations below their respective regulatory thresholds as indicated on Table 4-2.
4.1.7 Other Analyses
In addition to the above constituents, several other geochemical parameters were quantified as indicated on Table 4-1 and as discussed below.

Supply Well Evaluation Technical Report, Hilmar Cheese Company August 15, 2008 Page 4-3
Alkalinity
All of the supply wells sampled during the 2008 sampling event contained detectable concentrations of bicarbonate and total alkalinity ranging from 93 mg/L (at DW-54) to 1,000 mg/L (IW-4). There was a single detection of carbonate alkalinity (1.7 mg/L at DW-38E) and no detections hydroxide alkalinity above the laboratory reporting limit (i.e., < 1.0 mg/L). There are no state and federal secondary MCLs, agricultural or taste and odor thresholds established for alkalinity.
Boron
Twenty-nine of the supply wells sampled during 2008 reported detectable concentrations of boron. The reported concentrations ranged from <0.10 mg/L (at 12 supply wells) to 0.28 mg/L (DW-104). There were no detections above the agricultural threshold established for boron.
Total Organic Carbon
All but two of the supply wells sampled during the 2008 sampling event contained detectable concentrations of total organic carbon. Reported concentrations ranged from < 0.20 mg/L (DW-54 and IN-7) to 8.7 mg/L (DW-20). There are no state and federal secondary MCLs, agricultural or taste and odor thresholds established for this parameter.
4.2 Geochemical Evaluation
This section provides an evaluation of the waste water and groundwater chemistry to determine if there are HCC source specific indicators. This section also provides a discussion of the reduction and oxidation reactions that can occur in the soil-groundwater system. This discussion is provided as several of the analytes quantified during the 2008 supply well sampling event are affected by these processes and reducing conditions exist in the Site groundwater due to the application of organic rich waste water.
4.2.1 HCC Source Indicator Evaluation
Table 4-3 summarizes the average yearly inorganic and water quality parameter constituent concentrations measured in waste water that was applied to the primary fields during the period 2001 – 2008 Examination of Table 4-3 indicates waste water concentrations of: biochemical oxygen demand (BOD) ranging from 179 – 5,334 mg/L; levels of TKN ranging from 93.8 – 219 mg/L; and levels of TDS ranging from 2,074 – 6,333 mg/L. These concentrations are reflective of the organic-rich, reduced nitrogen, dissolved solids-laden waste water characteristic of food and milk processors in the

Supply Well Evaluation Technical Report, Hilmar Cheese Company August 15, 2008 Page 4-4
Central Valley of California (CRWQCB, 2007). These parameters are also consistent with the other agricultural land uses in the area.
Review of the HCC groundwater indicates that of the characteristic waste water parameters noted above, only TDS is not rapidly transformed or attenuated near the source. As discussed in Section 3.3, an ambient TDS concentration of 760 mg/L has been developed for screening level purposes to assess potential HCC impact to the Upper Supply Well Zone (i.e., the Lower A-Zone and B-Zone). However, the non-specific nature of TDS (i.e., it is comprised of multiple anions and cations), combined with several neighboring potential sources of TDS, limits its effectiveness as an indicator of HCC-specific impact, particularly in the Upper Supply Well Zone. Additional geochemical evaluations were conducted to determine if there were other indicators of HCC-specific impact that could be used in conjunction with TDS. These evaluations initially identified the potential value of potassium and chloride. Potassium is subject to significant attenuation by cation exchange processes. The groundwater data showed that while potassium is a useful indicator of near-source impact, it is rapidly attenuated in the aquifer media beyond the immediate vicinity of the HCC primary lands.
Chloride was determined to be a potentially useful indicator beyond the immediate source area, as chloride is associated with the HCC waste water and it is widely regarded as a conservative tracer of saline water impacts to fresh groundwater. The geochemical evaluation of chloride and its use as an indicator of HCC-specific impact in conjunction with TDS as further discussed in the following section.
4.2.1.1 Chloride
Chloride concentrations in HCC waste water between 2001 and 2008 averaged between 197 mg/L and 486 mg/L (Table 4-3). When applied to land as a dissolved ion present in waste water, chloride is generally not affected by geochemical processes affecting the concentrations of other major ions or redox-sensitive parameters. As presented in the Study and Interpretation of the Chemical Characteristics of Natural Water (Hem, 1989), chloride ions do not significantly enter into oxidation-reduction reactions, form no important solute complexes (except at extremely high concentrations), do not form salts of low solubility, are not significantly adsorbed on mineral surfaces, and play few vital biochemical roles. Therefore, the circulation of chloride in the soil-groundwater system is generally through physical processes (e.g., dispersion and advection). Given these characteristics, chloride is widely regarded as a conservative tracer of saline water impacts to fresh groundwater. The challenge in using chloride as an indicator for HCC-related impact to supply zone wells is that chloride is a common and abundant component of other non-HCC source area waste streams in the area.

Supply Well Evaluation Technical Report, Hilmar Cheese Company August 15, 2008 Page 4-5
Figure 4-6 shows the concentrations of chloride observed in HCC waste water samples, Phase I CPT samples, Phase II HP, AB, and MW samples, and the 2008 supply well samples. Examination of Figure 4-6 shows a continuous distribution of chloride, with the highest chloride concentrations (i.e., those > 400 mg/L) associated exclusively with CPT, HP, and MW locations within the primary land application area or immediately proximal thereto. Comparatively, the highest measured chloride concentration in the supply zone wells is 250 mg/L (excluding the anomalous chloride value in the deep well IN-7), and the highest measured chloride value in the shallow zone “AB” ambient data set is 110 mg/L. For evaluation purposes, ambient chloride concentrations were calculated using data from the 2008 AB and 2005 supply zone data sets used to calculate the ambient TDS values (JJ&A, 2008c). The calculated ambient chloride concentrations are 110 mg/L and 54 mg/L for the Upper A-Zone and Supply Well Zone (i.e., Lower A- and B-Zone), respectively. Appendix B provides statistical calculations and data sets.
Figures 4-7 and 4-8 illustrate the relationship between chloride and TDS in data sets derived (1) primarily from sample locations within or near the discharge areas (i.e., Phase I CPT samples; Phase II HP samples, Phase II AB samples, Site MW samples) and (2) exclusively from the 2008 supply well sampling program. The correlation between chloride and TDS concentrations in these data sets is virtually identical. This indicates that chloride behaves geochemically similar near the source and at significant distance, both laterally and vertically, from the source area. This supports the premise that chloride is a conservative and effective indicator parameter for HCC-related impacts to supply zone wells, provided that other potential offsite sources of chloride can be identified.
4.2.2 Reduction/Oxidation Based Reactions
It is important to consider the behavior of select ions under the reduced conditions observed at the Site in order to understand their occurrence and distribution. The concentrations of some monitoring constituents in the soil-groundwater system are particularly affected by geochemical processes involving reduction and oxidation. These so called “redox” reactions, in which the participating constituents gain or lose electrons, can have a significant affect on the aqueous concentrations (i.e., solubility) of multi-valent elements commonly analyzed in water quality studies, particularly iron, manganese, and nitrogen (i.e., as nitrate and ammonia).
For iron and manganese, the general redox effect observed in groundwater is the enhanced solubility and mobility of the reduced forms of iron (Fe2+) and manganese (Mn2+). Therefore, higher concentrations of iron and manganese are generally observed in reduced groundwater relative to oxidized groundwater. The fate of nitrogen in groundwater is more complex due to the nitrogen cycle and the ability of nitrogen to form both positively and negatively charged ions. However, redox is also

Supply Well Evaluation Technical Report, Hilmar Cheese Company August 15, 2008 Page 4-6
a significant variable on the mobility of nitrogen in groundwater – either in the form of nitrate (NO3-)
or ammonium (NH4+). In this case, nitrate, because of its anionic character, is more mobile while ammonium, due to its strong positive charge, tends to be immobilized via sorption in clay-bearing sediments.
The effects of the redox processes noted above are reflected in groundwater data from the Site. Specific observations are as follows.
1. Manganese concentrations observed in shallow groundwater beneath the Site are elevated relative to the supply wells. It is noted that manganese is not a significant component of HCC waste water. The manganese observed is, therefore, due to the mobilization of naturally occurring manganese under locally reduced conditions. As you move away from the HCC source area, manganese concentrations decrease due to the increasing, and natural, oxidized state of the groundwater.
2. Ammonia concentrations observed in shallow groundwater beneath the Site are elevated relative to the supply wells (which typically exhibit non-detected ammonia concentrations). Shallow groundwater beneath the Site typically exhibit both detectable nitrate and ammonia in varying proportions. HCC waste water exhibits elevated ammonia relative to nitrate. These observed ammonia-nitrate relationships are reflective of the reducing source and changing redox conditions from shallow groundwater to the supply zone. The shallow groundwater reflects a transitional near-source redox environment where both nitrate and ammonia coexist. As you move away from the Site, ammonia concentrations decrease, and nitrate concentrations increase, due to the increasing, and natural, oxidized state of the groundwater and resulting transformation of reduced nitrogen (ammonia) to oxidized nitrogen (nitrate). Nitrate has not been an effective indicator of HCC impact to the supply zone (e.g., via transformation of ammonia from the source to nitrate further downgradient) due to the widespread presence of nitrate in groundwater related to regional agricultural operations.

Supply Well Evaluation Technical Report, Hilmar Cheese Company August 15, 2008 Page 5-1
5.0 EVALUATION OF SUPPLY WELL IMPACTS
This section provides an evaluation of the analytical data collected during 2008 to determine the potential impact from HCC operations on the privately owned sampled supply wells.
5.1 Technical Approach
A logical framework was developed to objectively evaluate the potential source(s) of impacted supply wells. Because the COCs are consistent with those present in the degraded regional ground water system and those potentially contributed by local land use, a weight of evidence approach was used to determine if HCC is the source of impact to supply wells.
A weight-of-evidence approach is appropriate in this scenario because there is no clear mechanism to determine the source of supply well impact and, as such, a high degree of professional judgment is necessary to make the determination. A decision tree, provided as Figure 5-1, was developed to illustrate the process used in the evaluation of each supply well. As shown on Figure 5-1, the result of the well by well evaluation fits within one of the following criteria:
Finding Description
1 Weight of Evidence Does Not Indicate HCC as a Source of Impact
2 Weight of Evidence Does Not Indicate HCC as a Source of Impact
3 Weight of Evidence Indicates HCC as a Source of Impact
4 Weight of Evidence Cannot Discern Potential Sources from Regional Ambient Conditions
5 Weight of Evidence Indicates Multiple Sources; HCC is a Primary Source
6 Weight of Evidence Indicates Multiple Sources; HCC Not a Primary Source
The categorization of each well is illustrated on Figure 5-2. As indicated on the decision tree, the role of ambient conditions is considered after the other criteria have been fully evaluated. As such, it has not been used as one of the primary criteria – but rather, as a last step in assessing the weight of evidence. The question “Is the Impact Above Ambient Levels?” applies to TDS and chloride, as the geochemical evaluation provided herein identified that chloride provided another means of assessing HCC as a source of impact. It should be noted that there are cases where the ambient TDS level was

Supply Well Evaluation Technical Report, Hilmar Cheese Company August 15, 2008 Page 5-2
not exceeded, but the ambient chloride level was – and in these cases, the weight of evidence was swung in the direction of HCC as a source (sole or one of several).
The following sections describe the steps in the process. Well-specific information used in the evaluation is summarized in Appendix C. Table 4-2 provides the 2008 supply well data comparison to regulatory thresholds, Figure 2-2 shows the 2008 well locations with land uses identified and Figure 3-1 provides the supply well construction summary.
5.2 Regulatory Thresholds
The 2008 supply well data set were screened against potentially applicable regulatory thresholds including primary and secondary federal and California MCLs, taste and odor thresholds and agricultural water quality standards. The use of these thresholds is not intended to establish Site specific water quality goals, as they do not consider regional water quality, among other factors.
The results of this preliminary screening are presented on Table 4-2. As previously indicated, every supply well sampled during the 2008 sampling event exceeded at least one regulatory threshold. Supply well DW-47 only reported arsenic above the Federal MCL; supply well DW-54 reported arsenic and sodium above the California MCL and Taste/Odor regulatory thresholds, respectively. The remaining thirty-nine (39) supply wells each exceeded several regulatory thresholds. Detections above a regulatory threshold do not necessarily establish HCC as the source of impact. As previously noted, there is documented regional degradation of groundwater quality due to natural conditions (e.g., arsenic) and agricultural activities conducted in the vicinity of the Site. As such, a concentration reported above a regulatory threshold is a trigger for further evaluation as presented on Figure 5-1.
5.3 Potential Sources of Impact
Potential sources of impact are divided into HCC-related sources and off-site sources. These are discussed separately below.
5.3.1 HCC
The primary source of groundwater impact from HCC is the discharge of treated waste water to 143 acres of contiguous fields known as the primary lands. Wastewater application began in 1985 and has since increased in volume discharged and area of application. It is noted that the HCC waste water treatment system has also been continually updated over this time. Discharge rates have fluctuated between 0.050 million gallons per day (mgd) in 1985 to a current rate of 1.863 mgd (KJ, 2008).

Supply Well Evaluation Technical Report, Hilmar Cheese Company August 15, 2008 Page 5-3
5.3.2 Off-Site Sources
Potential off-site sources include dairy/livestock (i.e., confined animal facility operations), farming operations and Turlock Irrigation District (TID) equipment in the vicinity of and adjacent to the Site as illustrated on Figure 2-2 and described below. All of the identified offsite operations represent potential sources of groundwater impact that is similar in character to HCC impact.
Dairy/Livestock: Multiple dairies are located within the vicinity of the Site. As presented in the Surrounding Property Land Use Survey (Interim Data Deliverable, Attachment A, SGI August 31, 2007), several non-dairy confined animal feeding operations (CAFO) are located in the Site vicinity. These CAFOs included poultry, horses and goats. In addition, a dairy was formerly located near the north east corner of August Road and Lander Avenue, in the vicinity of supply well DW-38. Dairies and other confined animal operations have the potential to impact groundwater quality.
Agricultural Crops: Many farms are located in the vicinity of the Site. Crops and orchards observed in the area include corn, oats and alfalfa field crops, a vineyard and almond orchards. The agricultural crops are typically irrigated with water supplied by TID using flood, furrow or spray irrigation systems. Agricultural operations (e.g., fertilizing) have the potential to impact groundwater quality. None of the supply wells sample during the 2008 sampling event indicated significant affect from irrigated lands associated primarily with farm lands.
TID Equipment: The TID irrigation equipment in the vicinity includes tile drains (with associated pumping stations), supply wells and Lateral Number 6 (located along the northern boundary of the Site). This equipment removes high salt content water from the plant root zones and provides irrigation water for agricultural use. Groundwater extraction from irrigation wells, especially improperly constructed wells (see below), have the potential to draw contamination from impacted zones, laterally and vertically, to un-impacted zones.
Supply Well Construction. While faulty well constructions do not represent a source of contamination, they may be responsible for spreading contamination from impacted zones to un-impacted zones. For example, inadequate sanitary seals could provide a preferential pathway for near surface impact to migrate to lower groundwater zones. In addition, wells constructed with well screens and/or filter packs completed between aquifer zones (e.g., across the Corcoran Clay) may provide a pathway for impacted groundwater in the upper zones to migrate to lower groundwater zones.
Available supply well construction data were reviewed. The results of the review are shown on Figure 3-1. Approximately ½ of the supply wells tested in 2008 are properly constructed and screened exclusively above the Corcoran Clay. These wells represent a very low risk of spreading

Supply Well Evaluation Technical Report, Hilmar Cheese Company August 15, 2008 Page 5-4
contamination between zones. A few wells (3) were screened exclusively below the Corcoran Clay. Several of the supply wells sampled are noted to have well screens and/or filter packs that are completed across the Corcoran Clay and, as such, represent a pathway for contaminant migration between zones. In addition, there are several wells where no well construction data is available. These wells may present a potential contamination pathway. Lastly, supply wells that were improperly abandoned may also provide a conduit to for contaminant migration to lower water bearing zones.
5.4 Determination of Impacted Supply Well Sources
The results of the supply well evaluation are as follows.
Finding 1: Weight of Evidence Does Not Indicate HCC as a Source of Impact for Arsenic or Nitrate
HCC is not a source of impact for arsenic or nitrate to the following supply wells: DW-38B DW-38C, DW-38D, DW-47, DW-54 and DW-62. Table 5-1 identifies data gaps to be filled to confirm findings.
Finding 2: Weight of Evidence Does Not Indicate HCC as a Source of Impact
HCC is not a source of impact to the following supply wells: DW-104 and IN-7. These well exhibit concentrations that exhibit an increasing trend away from the Site. Table 5-1 identifies data gaps to be filled to confirm findings.
Finding 3: Weight of Evidence Indicates HCC as a Source of Impact
HCC is a source of impact to the following supply wells: IN1, IN2, DW-35, DW-35B, DW-53 and IW-04. These supply wells are generally located on or adjacent to the HCC facility and associated primary lands. There is no apparent non-HCC source area located at, or immediately up-gradient of the subject location that has been identified as a potential source. Table 5-1 identifies data gaps to be filled to confirm findings.
Finding 4: Weight of Evidence Can Not Discern Potential Sources from Regional Ambient Conditions
The weight of evidence cannot discern potential sources from regional ambient conditions for the following supply wells: DW-101, DW-21, DW-27A, DW-29, DW-29A, DW-44, DW-97, DW-99, DW-C, IW-19 and IW-21. These supply wells typically exhibit potentially elevated concentrations of COCs that are similar to the HCC-related impact; however, these wells are typically located clearly up-gradient, or a significant distance away from the Site in a cross or down gradient direction. In some cases these wells are located immediately down gradient of a non-HCC source area (e.g., dairy). In

Supply Well Evaluation Technical Report, Hilmar Cheese Company August 15, 2008 Page 5-5
addition, the observed concentrations indicate impact from the adjacent, or up gradient non-HCC source area.
Finding 5: Weight of Evidence Indicates Multiple Sources; HCC is a Primary Source
The weight of evidence indicates multiple sources; HCC is a primary source for the following supply wells: DW-23, DW-24, DW-25, DW-34, DW-38E, DW-58, DW-60, DW-69, DW-74, IN-04/IN-04A, and IW-20. Wells in this category are located within an area that is, or may be, impacted by HCC operations and exhibit elevated concentrations of COCs. There are non-HCC source areas (e.g., dairy) located at, or near, the well that contribute to the impact observed in these wells. The exact magnitude of impact for these wells, due to HCC operations, has not been established. Table 5-1 identifies data gaps to be filled to confirm findings.
Finding 6: Weight of Evidence Indicates Multiple Sources; HCC Not a Primary Source
The weight of evidence indicates multiple sources; HCC is not a primary source of impact for the following supply wells: DW-20, DW-22/IW-3, DW-28, DW-65 and DW-38. Wells in this category are generally impacted with constituents that are similar in character to HCC-related impact though they may exhibit impact representative of off-site sources as well. The wells are generally located a significant distance from HCC and/or are located down gradient of a non-HCC source of the observed constituents. Table 5-1 identifies data gaps to be filled to confirm findings.
JJ&A notes that well DW-38 was used in the supply well data set to establish ambient concentrations of TDS and chloride. The 2008 water sample from DW-38 had TDS below the ambient concentration but chloride above the ambient concentration; as the chloride concentration in DW-38 increased between 2005 and 2008. If impact to this well is confirmed (through the data gap work) to be from a localized source versus representative of regional conditions, then revised ambient TDS and chloride levels will be calculated excluding this sample location. This iterative process is appropriate for purposes of ensuring representative ambient levels are calculated.

Supply Well Evaluation Technical Report, Hilmar Cheese Company August 15, 2008 Page 6-1
6.0 CONCLUSION AND RECOMMENDATIONS
6.1 Conclusions
Based on the information presented in the previous sections, the weight of evidence indicates that HCC is the source of impact for 6 supply wells, a primary contributor of impact to 12 supply wells, not a primary contributor of impact for 5 supply wells, and not a source of impact for 8 supply wells. Additionally, a specific source could not be discerned from regional conditions for 11 supply wells. Data gaps have been identified to confirm these findings for specific wells as identified in Table 5-1.
6.2 Recommendations Regarding HCC Replacement of Impacted Water Supplies
HCC will contact the owners of the supply wells for which HCC has been identified as the source of impact and make the necessary arrangements to provide in kind replacement of the affected water supplies. Additionally, HCC will collect the information needed to fill the remaining data gaps and then contact the owners of any additional wells for which HCC is identified as the source of impact. HCC will then make the necessary arrangements for in kind replacement of their affected water supplies, as necessary.

Supply Well Evaluation Technical Report, Hilmar Cheese Company August 15, 2008 Page 7-1
7.0 REFERENCES
Brown and Caldwell (B&C), 2005a. Water Supply Well Sampling Work Plan, Hilmar Cheese Company, Hilmar, California. January 27, 2005.
B&C, 2005b. Supplement to Water Supply Well Sampling Work Plan, Hilmar Cheese Company, Hilmar, California. March 4, 2005.
B&C, 2005c. Water Supply Well Sampling Technical Report, Hilmar Cheese Company, Hilmar, California. July 11, 2005.
CRWQCB, 2007. Hilmar Supplemental Environmental Project, In Compliance with Order No. R5-2006-0025. November 16, 2007.
Hem, J.D., 1989, Study and Interpretation of the Chemical Characteristics of Natural Water, Third Edition, United States Geological Survey Water-Supply Paper 2254, 263 pages.
Jacobson James & Associates (JJ&A), 2008a. Area Water Supply Well Sampling Work Plan, Hilmar Cheese Company, Hilmar, California. March 28, 2008.
JJ&A, 2008b. Phase II Investigation Data Deliverable and Summary Report, Hilmar Cheese Company, Hilmar, California. June 23, 2008.
JJ&A, 2008c. Technical Memorandum – Determination of Ambient TDS Concentrations for the Upper Aquifer, Hilmar Cheese Company, Hilmar, California. June 23, 2008.
JJ&A, 2008d. 2008 Area Supply Well Sampling Data Deliverable, Hilmar Cheese Company, Hilmar, California. July 1, 2008.
Kennedy/Jenks Consultants (KJ), 2008. Report of Waste Discharge. June 2, 2008.
Richards, B.K., et. al., 2004. Environmental Impacts of Applying Manure, Fertilizer, and Sewage Biosolids on a Dairy Farm. Journal of the American Water Resources Association (JAWRA), August 1994, pages 1025 - 1042.
Soil Survey for Merced County, United States Department of Agriculture Soil Conservation Service, 1962
The Source Group, Inc. (SGI), 2007. Interim Data Deliverable and Field Investigation Summary Report, Hilmar Cheese Company, Hilmar, California. August 31, 2007.
USGS, 2004. Hydrogeological Characterization of the Modesto Area, San Joaquin Valley, California, Scientific Investigations Report 2004-5232. 2004

TABLES

TABLE 4‐1SUPPLY WELL ANALYTICAL DATA
Supply Well Evaluation Technical ReportHilmar Cheese Company
Hilmar, California
Well ID Sample Date Bicarbon
ate Alkalinity
(mg/L)
Carbon
ate Alkalinity
(mg/L)
Hydroxide
Alkalinity
(mg/L)
Total A
lkalinity
(mg/L)
Ammon
ia as Nitrogen
(mg/L)
Chem
ical Oxygen Dem
and (m
g/L)
Chloride
(mg/L)
Cond
uctiv
ity (u
mho
s/cm
)
Total A
luminum
(mg/L)
Dissolved
Arsenic (m
g/L)
Total A
rsenic (m
g/L)
Total A
rsenic (u
g/L)
Total Barium (u
g/L)
Dissolved
Boron
(mg/L)
Total Boron
(mg/L)
Dissolved
Calcium
(mg/L)
Total Calcium
(mg/L)
Dissolved
Iron
(mg/L)
Total Iron (m
g/L)
Dissolved
Magnesium
(mg/L)
Total M
agnesium
(mg/L)
Dissolved
Manganese (m
g/L)
Total M
anganese (m
g/L)
Dissolved
Potassium
(mg/L)
Total Potassium
(mg/L)
Dissolved
Sod
ium (m
g/L)
Total Sod
ium (m
g/L)
Total H
ardn
ess (as CaCO
3) (m
g/L)
Nitrate (m
g/L)
Nitrate/Nitrite
as N (m
g/L)
Nitrate‐Nitrogen
(mg/L)
Nitrite
as N (m
g/L)
Nitrogen, N
itrite
(AS N) (mg/L)
pH (stand
ard un
its)
Phosph
orus (m
g/L)
Total D
issolved
Solids (m
g/L)
Total Fixed
Dissolved
Solids (m
g/L)
Total V
olatile Dissolved
Solids (m
g/L)
Sulfa
te (m
g/L)
Sulfide
(mg/L)
Total Kjeldahl N
itrogen
(mg/L)
Total O
rganic Carbo
n (m
g/L)
DW‐01 5/26/2005 180 <1 <1 180 <1 <5 12 610 <0.05 ‐‐ ‐‐ 3 120 ‐‐ <0.1 ‐‐ 60 ‐‐ <0.05 ‐‐ 22 ‐‐ <0.01 ‐‐ 3 ‐‐ 29 240 ‐‐ ‐‐ 25 ‐‐ ‐‐ 7.9 0.1 430 280 140 30 <0.1 <1 1.2 DW‐05 5/11/2005 230 <1 <1 230 <1 6 8 530 <0.05 ‐‐ ‐‐ 2 100 ‐‐ <0.1 ‐‐ 52 ‐‐ <0.05 ‐‐ 17 ‐‐ <0.01 ‐‐ 3 ‐‐ 37 200 ‐‐ ‐‐ 7.7 ‐‐ ‐‐ 8.1 0.09 370 270 93 15 <0.1 <1 0.9 DW‐06 5/11/2005 310 <1 <1 310 <1 7 20 800 <0.05 ‐‐ ‐‐ 3 150 ‐‐ <0.1 ‐‐ 71 ‐‐ <0.05 ‐‐ 21 ‐‐ <0.01 ‐‐ 4 ‐‐ 73 260 ‐‐ ‐‐ 14 ‐‐ ‐‐ 8.1 0.07 560 410 150 43 <0.1 <1 2.3 DW‐07 5/17/2005 350 <1 <1 350 <1 6 43 990 <0.05 ‐‐ ‐‐ 3 200 ‐‐ 0.1 ‐‐ 90 ‐‐ <0.05 ‐‐ 29 ‐‐ <0.01 ‐‐ 4 ‐‐ 74 340 ‐‐ ‐‐ 21 ‐‐ ‐‐ 7.9 0.09 640 510 120 44 <0.1 <1 2.4 DW‐07A 5/17/2005 280 <1 <1 280 <1 12 32 1100 <0.05 ‐‐ ‐‐ 3 260 ‐‐ 0.2 ‐‐ 120 ‐‐ <0.05 ‐‐ 33 ‐‐ 0.04 ‐‐ 3 ‐‐ 86 440 ‐‐ ‐‐ 65 ‐‐ ‐‐ 7.8 0.58 850 570 280 68 <0.1 <1 3.9 DW‐08 5/17/2005 240 <1 <1 240 <1 8 26 730 <0.05 ‐‐ ‐‐ 2 150 ‐‐ <0.1 ‐‐ 84 ‐‐ <0.05 ‐‐ 23 ‐‐ <0.01 ‐‐ 2 ‐‐ 40 300 ‐‐ ‐‐ 25 ‐‐ ‐‐ 7.9 0.08 530 360 170 41 <0.1 <1 3 DW‐10 5/11/2005 180 <1 <1 180 <1 <5 70 590 ‐‐ ‐‐ <0.05 14 200 ‐‐ <0.1 ‐‐ 30 ‐‐ 0.19 ‐‐ 10 ‐‐ 0.19 ‐‐ 4 ‐‐ 76 120 ‐‐ ‐‐ <0.2 ‐‐ ‐‐ 8.2 0.1 340 300 43 15 <0.1 <1 1 DW‐101 5/25/2005 240 <1 <1 240 <1 8 42 740 <0.05 ‐‐ ‐‐ 3 130 ‐‐ <0.1 ‐‐ 72 ‐‐ <0.05 ‐‐ 24 ‐‐ 0.05 ‐‐ 3 ‐‐ 41 280 ‐‐ ‐‐ 19 ‐‐ ‐‐ 7.7 <0.2 490 340 140 23 <0.1 <1 3.2 DW‐101 5/14/2008 220 <1.0 <1.0 220 <1.0 ‐‐ 45 700 ‐‐ 0.0031 ‐‐ ‐‐ ‐‐ 0.10 ‐‐ 66 ‐‐ <0.050 ‐‐ 22 ‐‐ 0.042 ‐‐ 2.9 ‐‐ 40 ‐‐ ‐‐ ‐‐ ‐‐ 17 ‐‐ ‐‐ ‐‐ ‐‐ 450 ‐‐ ‐‐ 19 ‐‐ <1.0 2.7 DW‐10180 5/18/2005 370 <1 <1 370 <1 16 35 1100 0.08 ‐‐ ‐‐ 5 210 ‐‐ 0.1 ‐‐ 100 ‐‐ <0.05 ‐‐ 31 ‐‐ 0.08 ‐‐ 2 ‐‐ 100 380 ‐‐ ‐‐ 45 ‐‐ ‐‐ 7.9 <0.2 810 620 180 51 <0.1 <1 5.7 DW‐102 5/26/2005 250 <1 <1 250 <1 <5 26 720 <0.05 ‐‐ ‐‐ 8 120 ‐‐ <0.1 ‐‐ 51 ‐‐ <0.05 ‐‐ 17 ‐‐ 0.01 ‐‐ 2 ‐‐ 80 200 ‐‐ ‐‐ 20 ‐‐ ‐‐ 8.1 0.2 480 310 160 29 <0.1 <1 1.2 DW‐103 5/4/2005 290 <1 <1 290 <1 <5 31 820 <0.05 ‐‐ ‐‐ 5 170 ‐‐ 0.1 ‐‐ 65 ‐‐ <0.05 ‐‐ 18 ‐‐ 0.02 ‐‐ 3 ‐‐ 100 240 ‐‐ ‐‐ 18 ‐‐ ‐‐ 8 0.09 550 430 120 56 <0.1 <1 1.9 DW‐104 5/5/2005 430 <1 <1 430 <1 8 68 1100 <0.05 ‐‐ ‐‐ 8 270 ‐‐ 0.2 ‐‐ 80 ‐‐ <0.05 ‐‐ 23 ‐‐ 0.13 ‐‐ 4 ‐‐ 160 290 ‐‐ ‐‐ 13 ‐‐ ‐‐ 8 0.13 720 560 170 61 <0.1 <1 3.4 DW‐104 5/15/2008 350 <1.0 <1.0 350 <1.0 ‐‐ 57 1000 ‐‐ 0.0081 ‐‐ ‐‐ ‐‐ 0.28 ‐‐ 70 ‐‐ <0.050 ‐‐ 20 ‐‐ 0.11 ‐‐ 3.2 ‐‐ 130 ‐‐ ‐‐ ‐‐ ‐‐ 14 ‐‐ ‐‐ ‐‐ ‐‐ 640 ‐‐ ‐‐ 57 ‐‐ <1.0 2.8 DW‐105 5/11/2005 210 <1 <1 210 <1 5 9 510 <0.05 ‐‐ ‐‐ 4 92 ‐‐ <0.1 ‐‐ 41 ‐‐ <0.05 ‐‐ 15 ‐‐ <0.01 ‐‐ 3 ‐‐ 37 160 ‐‐ ‐‐ 8.1 ‐‐ ‐‐ 8 0.06 350 280 79 16 <0.1 <1 0.85 DW‐106 5/27/2005 190 <1 <1 190 <1 <5 38 630 <0.05 ‐‐ ‐‐ 24 140 ‐‐ <0.1 ‐‐ 42 ‐‐ <0.05 ‐‐ 14 ‐‐ 0.89 ‐‐ 2 ‐‐ 73 160 ‐‐ ‐‐ 12 ‐‐ ‐‐ 8.1 0.21 400 300 110 39 <0.1 <1 1.1 DW‐12 12/18/1996 280 ‐‐ ‐‐ ‐‐ ‐‐ ‐‐ 34 650 ‐‐ ‐‐ ‐‐ ‐‐ ‐‐ ‐‐ ‐‐ ‐‐ 60 ‐‐ <0.1 ‐‐ 21 ‐‐ 0.07 ‐‐ 5.4 ‐‐ 55 ‐‐ ‐‐ ‐‐ 12 <0.4 ‐‐ 7.0 ‐‐ 430 ‐‐ ‐‐ 23 ‐‐ ‐‐ ‐‐DW‐12 5/12/2005 230 <1 <1 230 <1 <5 36 620 <0.05 ‐‐ ‐‐ 6 120 ‐‐ <0.1 ‐‐ 49 ‐‐ <0.05 ‐‐ 16 ‐‐ 0.02 ‐‐ 4 ‐‐ 59 190 ‐‐ ‐‐ 6.8 ‐‐ ‐‐ 8 0.07 440 340 92 23 <0.1 <1 1.5 DW‐18 5/12/2005 250 <1 <1 250 <1 6 29 740 <0.05 ‐‐ ‐‐ 6 90 ‐‐ <0.1 ‐‐ 79 ‐‐ <0.05 ‐‐ 23 ‐‐ 0.04 ‐‐ 2 ‐‐ 37 290 ‐‐ ‐‐ 18 ‐‐ ‐‐ 8.1 0.11 490 370 110 32 <0.1 <1 3.4 DW‐19 5/12/2005 300 <1 <1 300 <1 10 37 940 <0.05 ‐‐ ‐‐ 3 140 ‐‐ 0.1 ‐‐ 75 ‐‐ <0.05 ‐‐ 21 ‐‐ 0.02 ‐‐ 3 ‐‐ 99 270 ‐‐ 67 27 ‐‐ <0.05 8.2 0.11 630 530 97 42 <0.1 <1 3.2 DW‐20 6/1/2005 260 <1 <1 260 <1 14 47 980 <0.05 ‐‐ ‐‐ 3 160 ‐‐ <0.1 ‐‐ 110 ‐‐ <0.05 ‐‐ 34 ‐‐ 0.03 ‐‐ 3 ‐‐ 30 410 ‐‐ ‐‐ 41 ‐‐ ‐‐ 7.8 <5 680 400 270 37 <0.1 <1 5.8 DW‐20 5/19/2008 380 <1.0 <1.0 380 <1.0 ‐‐ 64 1300 ‐‐ 0.0040 ‐‐ ‐‐ ‐‐ 0.25 ‐‐ 170 ‐‐ <0.050 ‐‐ 53 ‐‐ 0.051 ‐‐ 4.0 ‐‐ 38 ‐‐ ‐‐ ‐‐ ‐‐ 54 ‐‐ ‐‐ ‐‐ ‐‐ 920 ‐‐ ‐‐ 42 ‐‐ <1.0 8.7 DW‐21 6/24/2004 210 ‐‐ ‐‐ ‐‐ ‐‐ ‐‐ 46 740 ‐‐ ‐‐ ‐‐ ‐‐ ‐‐ ‐‐ ‐‐ ‐‐ 76 ‐‐ <0.02 ‐‐ 25 ‐‐ 0.04 ‐‐ 3.0 ‐‐ 42 ‐‐ ‐‐ ‐‐ 21 <0.1 ‐‐ 7.3 ‐‐ 570 ‐‐ ‐‐ 25 ‐‐ ‐‐ ‐‐DW‐21 5/25/2005 270 <1 <1 270 <1 9 34 740 <0.05 ‐‐ ‐‐ 3 130 ‐‐ <0.1 ‐‐ 79 ‐‐ <0.05 ‐‐ 25 ‐‐ 0.13 ‐‐ 3 ‐‐ 37 300 ‐‐ ‐‐ 17 ‐‐ ‐‐ 7.6 <0.2 480 360 120 23 <0.1 <1 3.8 DW‐21 5/14/2008 220 <1.0 <1.0 220 <1.0 ‐‐ 43 740 ‐‐ 0.0036 ‐‐ ‐‐ ‐‐ 0.10 ‐‐ 74 ‐‐ <0.050 ‐‐ 24 ‐‐ 0.13 ‐‐ 2.7 ‐‐ 40 ‐‐ ‐‐ ‐‐ ‐‐ 20 ‐‐ ‐‐ ‐‐ ‐‐ 470 ‐‐ ‐‐ 22 ‐‐ <1.0 2.0 DW‐23 10/3/1995 150 ‐‐ ‐‐ ‐‐ ‐‐ ‐‐ 28 520 ‐‐ ‐‐ ‐‐ ‐‐ ‐‐ ‐‐ ‐‐ ‐‐ 53 ‐‐ <0.1 ‐‐ 18 ‐‐ 0.054 ‐‐ 3.0 ‐‐ 24 ‐‐ ‐‐ ‐‐ 17 <0.4 ‐‐ 6.9 ‐‐ 360 ‐‐ ‐‐ 25 ‐‐ ‐‐ ‐‐DW‐23 5/5/2005 770 <1 <1 770 <1 9 94 1600 <0.05 ‐‐ ‐‐ 2 340 ‐‐ <0.1 ‐‐ 190 ‐‐ <0.05 ‐‐ 66 ‐‐ 1 ‐‐ 4 ‐‐ 70 750 ‐‐ ‐‐ 8.4 ‐‐ ‐‐ 7.6 0.1 990 810 180 13 <0.1 <1 4.2 DW‐23 5/14/2008 500 <1.0 <1.0 500 <1.0 ‐‐ 72 1200 ‐‐ 0.0021 ‐‐ ‐‐ ‐‐ 0.10 ‐‐ 140 ‐‐ <0.050 ‐‐ 51 ‐‐ 0.66 ‐‐ 3.8 ‐‐ 52 ‐‐ ‐‐ ‐‐ ‐‐ 15 J‐ ‐‐ ‐‐ ‐‐ ‐‐ 800 ‐‐ ‐‐ 16 ‐‐ <1.0 3.3 DW‐24 5/5/2005 410 <1 <1 410 <1 5 92 1000 <0.05 ‐‐ ‐‐ 7 220 ‐‐ <0.1 ‐‐ 100 ‐‐ <0.05 ‐‐ 36 ‐‐ 0.29 ‐‐ 4 ‐‐ 86 400 ‐‐ ‐‐ 8.6 ‐‐ ‐‐ 7.6 0.14 680 540 130 16 <0.1 <1 1.8 DW‐24 5/14/2008 460 <1.0 <1.0 460 <1.0 ‐‐ 110 1200 ‐‐ 0.0059 ‐‐ ‐‐ ‐‐ <0.10 ‐‐ 120 ‐‐ <0.050 ‐‐ 42 ‐‐ 0.29 ‐‐ 4.1 ‐‐ 93 ‐‐ ‐‐ ‐‐ ‐‐ 5.9 ‐‐ ‐‐ ‐‐ ‐‐ 740 ‐‐ ‐‐ 19 ‐‐ <1.0 2.1 DW‐25 5/5/2005 190 <1 <1 190 <1 <5 42 860 <0.05 ‐‐ ‐‐ <2 140 ‐‐ 0.2 ‐‐ 100 ‐‐ <0.05 ‐‐ 30 ‐‐ <0.01 ‐‐ 5 ‐‐ 34 370 ‐‐ ‐‐ 41 ‐‐ ‐‐ 7.8 0.1 650 390 260 46 <0.1 <1 3.1 DW‐25 5/14/2008 270 <1.0 <1.0 270 <1.0 ‐‐ 66 1000 ‐‐ <0.0020 ‐‐ ‐‐ ‐‐ <0.10 ‐‐ 130 ‐‐ <0.050 ‐‐ 38 ‐‐ <0.010 ‐‐ 3.0 ‐‐ 34 ‐‐ ‐‐ ‐‐ ‐‐ 36 ‐‐ ‐‐ ‐‐ ‐‐ 700 ‐‐ ‐‐ 53 ‐‐ <1.0 3.0 DW‐27 5/3/2005 430 <1 <1 430 <1 12 170 1700 <0.05 ‐‐ ‐‐ 2 290 ‐‐ 0.2 ‐‐ 150 ‐‐ <0.05 ‐‐ 42 ‐‐ 0.05 ‐‐ 3 ‐‐ 140 550 ‐‐ ‐‐ 38 ‐‐ ‐‐ 7.7 0.09 1100 880 220 100 <0.1 <1 6.1 DW‐27A 5/19/2008 270 <1.0 <1.0 270 <1.0 ‐‐ 36 900 ‐‐ 0.0050 ‐‐ ‐‐ ‐‐ 0.12 ‐‐ 82 ‐‐ <0.050 ‐‐ 29 ‐‐ 0.25 ‐‐ 3.0 ‐‐ 71 ‐‐ ‐‐ ‐‐ ‐‐ 22 ‐‐ ‐‐ ‐‐ ‐‐ 600 ‐‐ ‐‐ 56 ‐‐ <1.0 1.9 DW‐28 5/4/2005 330 <1 <1 330 <1 10 88 1500 <0.05 ‐‐ ‐‐ 8 340 ‐‐ 0.1 ‐‐ 180 ‐‐ <0.05 ‐‐ 54 ‐‐ <0.01 ‐‐ 11 ‐‐ 50 670 ‐‐ ‐‐ 72 ‐‐ ‐‐ 7.5 0.21 1100 660 470 110 <0.1 <1 5.2 DW‐28 5/13/2008 380 <1.0 <1.0 380 <1.0 ‐‐ 140 1700 ‐‐ 0.0067 ‐‐ ‐‐ ‐‐ 0.20 ‐‐ 230 ‐‐ <0.050 ‐‐ 69 ‐‐ 0.032 ‐‐ 11 ‐‐ 77 ‐‐ ‐‐ ‐‐ ‐‐ 95 ‐‐ ‐‐ ‐‐ ‐‐ 1300 ‐‐ ‐‐ 170 J+ ‐‐ <1.0 7.1
Notes:mg/L = milligrams per literug/L = micrograms per literumhos/cm = micromhos per centimeter‐‐ = Not analyzedDetections are in bold font. 1 of 4

TABLE 4‐1SUPPLY WELL ANALYTICAL DATA
Supply Well Evaluation Technical ReportHilmar Cheese Company
Hilmar, California
Well ID Sample Date Bicarbon
ate Alkalinity
(mg/L)
Carbon
ate Alkalinity
(mg/L)
Hydroxide
Alkalinity
(mg/L)
Total A
lkalinity
(mg/L)
Ammon
ia as Nitrogen
(mg/L)
Chem
ical Oxygen Dem
and (m
g/L)
Chloride
(mg/L)
Cond
uctiv
ity (u
mho
s/cm
)
Total A
luminum
(mg/L)
Dissolved
Arsenic (m
g/L)
Total A
rsenic (m
g/L)
Total A
rsenic (u
g/L)
Total Barium (u
g/L)
Dissolved
Boron
(mg/L)
Total Boron
(mg/L)
Dissolved
Calcium
(mg/L)
Total Calcium
(mg/L)
Dissolved
Iron
(mg/L)
Total Iron (m
g/L)
Dissolved
Magnesium
(mg/L)
Total M
agnesium
(mg/L)
Dissolved
Manganese (m
g/L)
Total M
anganese (m
g/L)
Dissolved
Potassium
(mg/L)
Total Potassium
(mg/L)
Dissolved
Sod
ium (m
g/L)
Total Sod
ium (m
g/L)
Total H
ardn
ess (as CaCO
3) (m
g/L)
Nitrate (m
g/L)
Nitrate/Nitrite
as N (m
g/L)
Nitrate‐Nitrogen
(mg/L)
Nitrite
as N (m
g/L)
Nitrogen, N
itrite
(AS N) (mg/L)
pH (stand
ard un
its)
Phosph
orus (m
g/L)
Total D
issolved
Solids (m
g/L)
Total Fixed
Dissolved
Solids (m
g/L)
Total V
olatile Dissolved
Solids (m
g/L)
Sulfa
te (m
g/L)
Sulfide
(mg/L)
Total Kjeldahl N
itrogen
(mg/L)
Total O
rganic Carbo
n (m
g/L)
DW‐29 5/19/2005 260 <1 <1 260 <1 <5 20 790 <0.05 ‐‐ ‐‐ 5 120 ‐‐ <0.1 ‐‐ 79 ‐‐ <0.05 ‐‐ 25 ‐‐ 0.06 ‐‐ 2 ‐‐ 52 300 ‐‐ ‐‐ 25 ‐‐ ‐‐ 7.9 <0.2 570 400 160 52 <0.1 <1 1.7 DW‐29 5/13/2008 350 <1.0 <1.0 350 <1.0 ‐‐ 110 1200 ‐‐ 0.0058 ‐‐ ‐‐ ‐‐ 0.15 ‐‐ 150 ‐‐ <0.050 ‐‐ 45 ‐‐ 0.22 ‐‐ 3.0 ‐‐ 81 ‐‐ ‐‐ ‐‐ ‐‐ 32 ‐‐ ‐‐ ‐‐ ‐‐ 900 ‐‐ ‐‐ 86 ‐‐ <1.0 UJ‐ 7.7 DW‐29A 5/19/2005 250 <1 <1 250 <1 5 20 770 <0.05 ‐‐ ‐‐ 7 120 ‐‐ <0.1 ‐‐ 68 ‐‐ <0.05 ‐‐ 22 ‐‐ 0.12 ‐‐ 2 ‐‐ 64 260 ‐‐ ‐‐ 22 ‐‐ ‐‐ 7.9 <0.2 540 400 140 49 <0.1 <1 1.2 DW‐29A 5/13/2008 280 <1.0 <1.0 280 <1.0 ‐‐ 36 830 ‐‐ 0.0063 ‐‐ ‐‐ ‐‐ 0.11 ‐‐ 92 ‐‐ <0.050 ‐‐ 30 ‐‐ 0.18 ‐‐ 2.7 ‐‐ 55 ‐‐ ‐‐ ‐‐ ‐‐ 22 ‐‐ ‐‐ ‐‐ ‐‐ 610 ‐‐ ‐‐ 49 ‐‐ <1.0 1.8 DW‐31 5/12/2005 400 <1 <1 400 <1 7 37 1000 <0.05 ‐‐ ‐‐ 13 120 ‐‐ <0.1 ‐‐ 120 ‐‐ <0.05 ‐‐ 43 ‐‐ <0.01 ‐‐ 2 ‐‐ 37 480 ‐‐ ‐‐ 21 ‐‐ ‐‐ 8 0.1 640 490 150 46 <0.1 <1 2.2 DW‐33 1/10/2001 220 ‐‐ ‐‐ ‐‐ ‐‐ ‐‐ 14 590 ‐‐ ‐‐ ‐‐ ‐‐ ‐‐ ‐‐ ‐‐ ‐‐ 32 ‐‐ <0.1 ‐‐ 12 ‐‐ <0.03 ‐‐ 3.2 ‐‐ 65 ‐‐ ‐‐ ‐‐ 15 <0.4 ‐‐ 7.7 ‐‐ 400 ‐‐ ‐‐ 30 ‐‐ ‐‐ ‐‐DW‐34 5/3/2005 420 <1 <1 420 <1 <5 160 1200 <0.05 ‐‐ ‐‐ 6 370 ‐‐ 0.1 ‐‐ 110 ‐‐ <0.05 ‐‐ 37 ‐‐ 0.05 ‐‐ 4 ‐‐ 88 430 ‐‐ ‐‐ 7.2 ‐‐ ‐‐ 7.4 0.16 750 630 120 18 <0.1 <1 2.1 DW‐34 5/15/2008 340 <1.0 <1.0 340 <1.0 ‐‐ 240 1400 ‐‐ 0.010 ‐‐ ‐‐ ‐‐ <0.10 ‐‐ 100 ‐‐ <0.050 ‐‐ 35 ‐‐ <0.010 ‐‐ 5.0 ‐‐ 140 ‐‐ ‐‐ ‐‐ ‐‐ 2.5 ‐‐ ‐‐ ‐‐ ‐‐ 800 ‐‐ ‐‐ 7.8 ‐‐ <1.0 1.0 DW‐35 5/13/2005 800 <1 <1 800 <1 18 140 1800 <0.05 ‐‐ ‐‐ 2 200 ‐‐ 0.2 ‐‐ 120 ‐‐ <0.05 ‐‐ 37 ‐‐ 3.6 ‐‐ 4 ‐‐ 240 450 ‐‐ ‐‐ <0.4 ‐‐ ‐‐ 7.7 0.07 1100 960 120 33 <0.1 <1 7.7 DW‐35 5/20/2008 700 <1.0 <1.0 700 <1.0 ‐‐ 250 2100 ‐‐ 0.014 ‐‐ ‐‐ ‐‐ 0.24 ‐‐ 150 ‐‐ 0.38 ‐‐ 52 ‐‐ 2.5 ‐‐ 4.6 ‐‐ 300 ‐‐ ‐‐ ‐‐ ‐‐ <2.0 ‐‐ ‐‐ ‐‐ ‐‐ 1300 ‐‐ ‐‐ 95 ‐‐ <1.0 6.1 DW‐35B 5/13/2005 870 <1 <1 870 <1 10 160 2000 <0.05 ‐‐ ‐‐ <2 420 ‐‐ 0.1 ‐‐ 160 ‐‐ <0.05 ‐‐ 48 ‐‐ 0.47 ‐‐ 3 ‐‐ 210 600 ‐‐ ‐‐ 0.7 ‐‐ ‐‐ 7.7 0.17 1200 1000 150 25 <0.1 <1 7.8 DW‐35B 5/20/2008 830 <1.0 <1.0 830 <1.0 ‐‐ 210 2100 ‐‐ <0.0020 ‐‐ ‐‐ ‐‐ 0.15 ‐‐ 180 ‐‐ 0.40 ‐‐ 60 ‐‐ 0.47 ‐‐ 4.0 ‐‐ 220 ‐‐ ‐‐ ‐‐ ‐‐ <1.0 ‐‐ ‐‐ ‐‐ ‐‐ 1200 ‐‐ ‐‐ 24 ‐‐ <1.0 3.9 DW‐38 5/13/2005 200 <1 <1 200 <1 <5 36 770 <0.05 ‐‐ ‐‐ 2 120 ‐‐ <0.1 ‐‐ 66 ‐‐ <0.05 ‐‐ 18 ‐‐ <0.01 ‐‐ 2 ‐‐ 62 240 ‐‐ ‐‐ 22 ‐‐ ‐‐ 8.1 0.16 510 400 110 52 <0.1 <1 1.2 DW‐38 5/19/2008 220 <1.0 <1.0 220 <1.0 ‐‐ 70 920 ‐‐ 0.0028 ‐‐ ‐‐ ‐‐ 0.13 ‐‐ 94 ‐‐ <0.050 ‐‐ 27 ‐‐ <0.010 ‐‐ 2.5 ‐‐ 62 ‐‐ ‐‐ ‐‐ ‐‐ 22 ‐‐ ‐‐ ‐‐ ‐‐ 590 ‐‐ ‐‐ 62 ‐‐ <1.0 1.9 DW‐38B 5/13/2005 220 <1 <1 220 <1 <5 28 700 <0.05 ‐‐ ‐‐ 5 100 ‐‐ <0.1 ‐‐ 56 ‐‐ <0.05 ‐‐ 16 ‐‐ <0.01 ‐‐ 2 ‐‐ 70 200 ‐‐ ‐‐ 17 ‐‐ ‐‐ 8.1 0.12 460 380 86 41 <0.1 <1 0.99 DW‐38B 5/19/2008 200 <1.0 <1.0 200 <1.0 ‐‐ 24 680 ‐‐ 0.0091 ‐‐ ‐‐ ‐‐ 0.14 ‐‐ 50 ‐‐ <0.050 ‐‐ 17 ‐‐ <0.010 ‐‐ 2.5 ‐‐ 68 ‐‐ ‐‐ ‐‐ ‐‐ 16 ‐‐ ‐‐ ‐‐ ‐‐ 460 ‐‐ ‐‐ 44 ‐‐ <1.0 0.89 DW‐38C 5/19/2008 190 <1.0 <1.0 190 <1.0 ‐‐ 30 550 ‐‐ 0.077 ‐‐ ‐‐ ‐‐ 0.11 ‐‐ 23 ‐‐ <0.050 ‐‐ 12 ‐‐ 0.22 ‐‐ <2.0 ‐‐ 83 ‐‐ ‐‐ ‐‐ ‐‐ 6.3 ‐‐ ‐‐ ‐‐ ‐‐ 370 ‐‐ ‐‐ 22 ‐‐ <1.0 0.37 DW‐38D 5/19/2008 170 <1.0 <1.0 170 <1.0 ‐‐ 25 490 ‐‐ 0.056 ‐‐ ‐‐ ‐‐ 0.11 ‐‐ 16 ‐‐ <0.050 ‐‐ 9.5 ‐‐ 0.31 ‐‐ <2.0 ‐‐ 81 ‐‐ ‐‐ ‐‐ ‐‐ 2.9 ‐‐ ‐‐ ‐‐ ‐‐ 320 ‐‐ ‐‐ 24 ‐‐ <1.0 0.49 DW‐38E 5/19/2008 180 1.7 <1.0 180 <1.0 ‐‐ 97 700 ‐‐ 0.094 ‐‐ ‐‐ ‐‐ 0.12 ‐‐ 20 ‐‐ 0.073 ‐‐ 9.6 ‐‐ 0.12 ‐‐ 2.1 ‐‐ 120 ‐‐ ‐‐ ‐‐ ‐‐ <0.40 ‐‐ ‐‐ ‐‐ ‐‐ 390 ‐‐ ‐‐ 17 ‐‐ <1.0 0.97 DW‐40 5/12/2005 280 <1 <1 280 <1 <5 26 860 <0.05 ‐‐ ‐‐ 4 150 ‐‐ <0.1 ‐‐ 70 ‐‐ <0.05 ‐‐ 22 ‐‐ <0.01 ‐‐ 3 ‐‐ 87 260 ‐‐ 60 22 ‐‐ <0.05 8.1 0.29 560 460 100 45 <0.1 <1 1.4 DW‐43 5/6/2005 210 <1 <1 210 <1 <5 26 730 <0.05 ‐‐ ‐‐ 6 85 ‐‐ <0.1 ‐‐ 77 ‐‐ <0.05 ‐‐ 18 ‐‐ <0.01 ‐‐ 2 ‐‐ 48 270 ‐‐ ‐‐ 22 ‐‐ ‐‐ 8 0.18 520 490 27 48 <0.1 <1 2 DW‐44 5/19/2005 290 <1 <1 290 <1 <5 29 780 <0.05 ‐‐ ‐‐ 5 200 ‐‐ <0.1 ‐‐ 59 ‐‐ <0.05 ‐‐ 16 ‐‐ 0.09 ‐‐ 3 ‐‐ 91 210 ‐‐ ‐‐ 15 ‐‐ ‐‐ 7.9 <0.2 520 420 98 49 <0.1 <1 1.9 DW‐44 5/20/2008 240 <1.0 <1.0 240 <1.0 ‐‐ 27 710 ‐‐ 0.0048 ‐‐ ‐‐ ‐‐ 0.15 ‐‐ 50 ‐‐ <0.050 ‐‐ 15 ‐‐ 0.068 ‐‐ 3.3 ‐‐ 84 ‐‐ ‐‐ ‐‐ ‐‐ 9.5 ‐‐ ‐‐ ‐‐ ‐‐ 460 ‐‐ ‐‐ 48 ‐‐ <1.0 UJ‐ 1.4 DW‐46 7/15/2005 300 <1 <1 300 <1 <1 48 730 <0.05 ‐‐ ‐‐ 6 190 ‐‐ 0.1 ‐‐ 110 ‐‐ <0.05 ‐‐ 33 ‐‐ 0.04 ‐‐ 2 ‐‐ 59 410 130 ‐‐ 29 ‐‐ ‐‐ 7.8 ‐‐ 680 470 220 66 <0.1 <1 3 DW‐47 5/26/2005 170 <1 <1 170 <1 <5 17 550 <0.05 ‐‐ ‐‐ 6 60 ‐‐ <0.1 ‐‐ 62 ‐‐ <0.05 ‐‐ 15 ‐‐ <0.01 ‐‐ <2 ‐‐ 26 220 ‐‐ ‐‐ 11 ‐‐ ‐‐ 8.1 <0.2 390 270 120 57 <0.1 <1 1.9 DW‐47 5/20/2008 180 <1.0 <1.0 180 <1.0 ‐‐ 16 590 ‐‐ 0.0060 ‐‐ ‐‐ ‐‐ <0.10 ‐‐ 67 ‐‐ <0.050 ‐‐ 18 ‐‐ <0.010 ‐‐ <2.0 ‐‐ 27 ‐‐ ‐‐ ‐‐ ‐‐ 16 ‐‐ ‐‐ ‐‐ ‐‐ 410 ‐‐ ‐‐ 45 ‐‐ <1.0 UJ‐ 1.7 DW‐50 5/4/2005 210 <1 <1 210 <1 <5 23 810 <0.05 ‐‐ ‐‐ 2 160 ‐‐ <0.1 ‐‐ 88 ‐‐ <0.05 ‐‐ 28 ‐‐ 0.04 ‐‐ 3 ‐‐ 39 340 ‐‐ ‐‐ 32 ‐‐ ‐‐ 7.9 0.09 570 400 160 71 <0.1 <1 1.5 DW‐52 5/4/2005 820 <1 <1 820 <1 10 150 1800 <0.05 ‐‐ ‐‐ <2 480 ‐‐ <0.1 ‐‐ 230 ‐‐ <0.05 ‐‐ 74 ‐‐ 0.15 ‐‐ 4 ‐‐ 70 880 ‐‐ ‐‐ 7.2 ‐‐ ‐‐ 7.4 0.1 1100 910 220 18 <0.1 <1 5.2 DW‐53 5/6/1991 220 ‐‐ ‐‐ ‐‐ ‐‐ ‐‐ 45 680 ‐‐ ‐‐ ‐‐ ‐‐ ‐‐ ‐‐ ‐‐ ‐‐ 56 ‐‐ 0.07 ‐‐ 21 ‐‐ 0.026 ‐‐ ‐‐ ‐‐ 55 ‐‐ ‐‐ ‐‐ 15 ‐‐ ‐‐ 7.8 ‐‐ 430 ‐‐ ‐‐ 37 ‐‐ ‐‐ ‐‐DW‐53 5/25/2005 140 <1 <1 140 <1 <5 15 590 <0.05 ‐‐ ‐‐ 5 110 ‐‐ <0.1 ‐‐ 51 ‐‐ <0.05 ‐‐ 17 ‐‐ <0.01 ‐‐ 2 ‐‐ 43 200 ‐‐ ‐‐ 27 ‐‐ ‐‐ 8 <0.2 410 260 160 38 <0.1 <1 0.97 DW‐53 5/20/2008 410 <1.0 <1.0 410 <1.0 ‐‐ 140 1400 ‐‐ 0.0038 ‐‐ ‐‐ ‐‐ 0.20 ‐‐ 150 ‐‐ <0.050 ‐‐ 50 ‐‐ <0.010 ‐‐ 4.6 ‐‐ 84 ‐‐ ‐‐ ‐‐ ‐‐ 21 ‐‐ ‐‐ ‐‐ ‐‐ 870 ‐‐ ‐‐ 49 ‐‐ <1.0 UJ‐ 2.4 DW‐54 5/17/2005 100 <1 <1 100 <1 <5 30 280 <0.05 ‐‐ ‐‐ 57 <50 ‐‐ <0.1 ‐‐ 5.4 ‐‐ 0.05 ‐‐ 2.1 ‐‐ 0.04 ‐‐ <2 ‐‐ 53 22 ‐‐ ‐‐ <0.2 ‐‐ ‐‐ 8.2 0.81 170 160 17 <1 <0.1 <1 0.23 DW‐54 5/14/2008 93 <1.0 <1.0 93 <1.0 ‐‐ 33 290 ‐‐ 0.058 ‐‐ ‐‐ ‐‐ <0.10 ‐‐ 5.3 ‐‐ 0.052 ‐‐ 2.1 ‐‐ 0.033 ‐‐ <2.0 ‐‐ 53 ‐‐ ‐‐ ‐‐ ‐‐ <0.20 ‐‐ ‐‐ ‐‐ ‐‐ 160 ‐‐ ‐‐ <2.0 ‐‐ <1.0 <0.20 DW‐55 5/11/2005 310 <1 <1 310 <1 <5 20 790 <0.05 ‐‐ ‐‐ 2 140 ‐‐ 0.1 ‐‐ 64 ‐‐ <0.05 ‐‐ 20 ‐‐ <0.01 ‐‐ 4 ‐‐ 75 240 ‐‐ ‐‐ 14 ‐‐ ‐‐ 8.1 0.08 530 370 160 42 <0.1 <1 2.4 DW‐58 5/18/2005 470 <1 <1 470 <1 <5 57 1100 <0.05 ‐‐ ‐‐ 3 220 ‐‐ <0.1 ‐‐ 120 ‐‐ <0.05 ‐‐ 45 ‐‐ <0.01 ‐‐ 3 ‐‐ 53 480 ‐‐ ‐‐ 15 ‐‐ ‐‐ 7.8 0.1 730 560 160 34 <0.1 <1 3 DW‐58 5/19/2008 530 <1.0 <1.0 530 <2.0 UJ+ ‐‐ 80 1300 ‐‐ 0.0034 ‐‐ ‐‐ ‐‐ 0.18 ‐‐ 140 ‐‐ <0.050 ‐‐ 56 ‐‐ 0.044 ‐‐ 3.8 ‐‐ 67 ‐‐ ‐‐ ‐‐ ‐‐ 11 ‐‐ ‐‐ ‐‐ ‐‐ 780 ‐‐ ‐‐ 28 ‐‐ <1.0 3.5
Notes:mg/L = milligrams per literug/L = micrograms per literumhos/cm = micromhos per centimeter‐‐ = Not analyzedDetections are in bold font. 2 of 4

TABLE 4‐1SUPPLY WELL ANALYTICAL DATA
Supply Well Evaluation Technical ReportHilmar Cheese Company
Hilmar, California
Well ID Sample Date Bicarbon
ate Alkalinity
(mg/L)
Carbon
ate Alkalinity
(mg/L)
Hydroxide
Alkalinity
(mg/L)
Total A
lkalinity
(mg/L)
Ammon
ia as Nitrogen
(mg/L)
Chem
ical Oxygen Dem
and (m
g/L)
Chloride
(mg/L)
Cond
uctiv
ity (u
mho
s/cm
)
Total A
luminum
(mg/L)
Dissolved
Arsenic (m
g/L)
Total A
rsenic (m
g/L)
Total A
rsenic (u
g/L)
Total Barium (u
g/L)
Dissolved
Boron
(mg/L)
Total Boron
(mg/L)
Dissolved
Calcium
(mg/L)
Total Calcium
(mg/L)
Dissolved
Iron
(mg/L)
Total Iron (m
g/L)
Dissolved
Magnesium
(mg/L)
Total M
agnesium
(mg/L)
Dissolved
Manganese (m
g/L)
Total M
anganese (m
g/L)
Dissolved
Potassium
(mg/L)
Total Potassium
(mg/L)
Dissolved
Sod
ium (m
g/L)
Total Sod
ium (m
g/L)
Total H
ardn
ess (as CaCO
3) (m
g/L)
Nitrate (m
g/L)
Nitrate/Nitrite
as N (m
g/L)
Nitrate‐Nitrogen
(mg/L)
Nitrite
as N (m
g/L)
Nitrogen, N
itrite
(AS N) (mg/L)
pH (stand
ard un
its)
Phosph
orus (m
g/L)
Total D
issolved
Solids (m
g/L)
Total Fixed
Dissolved
Solids (m
g/L)
Total V
olatile Dissolved
Solids (m
g/L)
Sulfa
te (m
g/L)
Sulfide
(mg/L)
Total Kjeldahl N
itrogen
(mg/L)
Total O
rganic Carbo
n (m
g/L)
DW‐59 5/19/2005 230 <1 <1 230 <1 8 38 640 <0.05 ‐‐ ‐‐ <2 120 ‐‐ <0.1 ‐‐ 68 ‐‐ <0.05 ‐‐ 22 ‐‐ <0.01 ‐‐ 3 ‐‐ 32 260 ‐‐ ‐‐ 11 ‐‐ ‐‐ 7.6 0.57 420 270 150 24 <0.1 <1 2.7 DW‐60 5/18/2005 220 <1 <1 220 <1 24 44 890 <0.05 ‐‐ ‐‐ 8 160 ‐‐ <0.1 ‐‐ 85 ‐‐ <0.05 ‐‐ 32 ‐‐ 0.25 ‐‐ 3 ‐‐ 48 340 ‐‐ ‐‐ 43 ‐‐ ‐‐ 7.5 0.99 680 470 220 31 <0.1 <1 9.4 DW‐60 5/15/2008 220 <1.0 <1.0 220 <1.0 ‐‐ 62 1000 ‐‐ 0.0095 ‐‐ ‐‐ ‐‐ 0.17 ‐‐ 89 ‐‐ <0.050 ‐‐ 34 ‐‐ 0.43 ‐‐ 4.0 ‐‐ 64 ‐‐ ‐‐ ‐‐ ‐‐ 43 ‐‐ ‐‐ ‐‐ ‐‐ 710 ‐‐ ‐‐ 36 ‐‐ <1.0 UJ‐ 7.2 DW‐62 5/26/2005 120 <1 <1 120 <1 <5 34 450 <0.05 ‐‐ ‐‐ 23 100 ‐‐ <0.1 ‐‐ 23 ‐‐ 0.08 ‐‐ 7.3 ‐‐ 0.19 ‐‐ <2 ‐‐ 63 87 ‐‐ ‐‐ 1.8 ‐‐ ‐‐ 8.2 <0.2 280 220 60 50 <0.1 <1 0.93 DW‐62 5/20/2008 120 <1.0 <1.0 120 <1.0 ‐‐ 38 500 ‐‐ 0.017 ‐‐ ‐‐ ‐‐ <0.10 ‐‐ 27 ‐‐ <0.050 ‐‐ 9.0 ‐‐ 0.22 ‐‐ <2.0 ‐‐ 64 ‐‐ ‐‐ ‐‐ ‐‐ 3.4 ‐‐ ‐‐ ‐‐ ‐‐ 310 ‐‐ ‐‐ 58 ‐‐ <1.0 UJ‐ 0.87 DW‐63 5/25/2005 220 <1 <1 220 <1 <5 34 690 <0.05 ‐‐ ‐‐ 34 170 ‐‐ <0.1 ‐‐ 38 ‐‐ 0.31 ‐‐ 16 ‐‐ 0.47 ‐‐ 2 ‐‐ 90 160 ‐‐ ‐‐ <0.2 ‐‐ ‐‐ 8.1 <0.2 440 370 69 100 <0.1 <1 2 DW‐64 5/4/2005 330 <1 <1 330 <1 24 140 1300 <0.05 ‐‐ ‐‐ 5 120 ‐‐ 0.2 ‐‐ 150 ‐‐ <0.05 ‐‐ 41 ‐‐ 0.07 ‐‐ 3 ‐‐ 74 540 ‐‐ ‐‐ 34 ‐‐ ‐‐ 7.7 0.09 960 640 320 76 <0.1 <1 10 DW‐65 11/19/1997 140 ‐‐ ‐‐ ‐‐ ‐‐ ‐‐ 30 590 ‐‐ ‐‐ ‐‐ ‐‐ ‐‐ ‐‐ ‐‐ ‐‐ 62 ‐‐ <0.1 ‐‐ 21 ‐‐ <0.03 ‐‐ 2.8 ‐‐ 29 ‐‐ ‐‐ ‐‐ 23 <0.4 ‐‐ 7.3 ‐‐ 490 ‐‐ ‐‐ 25 ‐‐ ‐‐ ‐‐DW‐65 5/3/2005 330 <1 <1 330 <1 10 71 1000 <0.05 ‐‐ ‐‐ 3 220 ‐‐ 0.1 ‐‐ 120 ‐‐ <0.05 ‐‐ 39 ‐‐ 0.08 ‐‐ 3 ‐‐ 43 460 ‐‐ ‐‐ 29 ‐‐ ‐‐ 7.5 0.19 690 520 180 39 <0.1 <1 4.9 DW‐65 5/13/2008 380 <1.0 <1.0 380 <1.0 ‐‐ 93 1100 ‐‐ 0.0050 ‐‐ ‐‐ ‐‐ 0.19 ‐‐ 140 ‐‐ <0.050 ‐‐ 46 ‐‐ 0.15 ‐‐ 3.4 ‐‐ 59 ‐‐ ‐‐ ‐‐ ‐‐ 25 ‐‐ ‐‐ ‐‐ ‐‐ 810 ‐‐ ‐‐ 44 ‐‐ <1.0 5.6 DW‐67 6/24/2004 390 ‐‐ ‐‐ ‐‐ ‐‐ ‐‐ 91 1000 ‐‐ ‐‐ ‐‐ ‐‐ ‐‐ ‐‐ ‐‐ ‐‐ 100 ‐‐ <0.02 ‐‐ 36 ‐‐ 0.28 ‐‐ 4.0 ‐‐ 72 ‐‐ ‐‐ ‐‐ 12 <0.1 ‐‐ 7.1 ‐‐ 730 ‐‐ ‐‐ 19 ‐‐ ‐‐ ‐‐DW‐68 5/6/2005 95 <1 <1 95 <1 <5 32 270 <0.05 ‐‐ ‐‐ 22 <50 ‐‐ <0.1 ‐‐ 7.5 ‐‐ <0.05 ‐‐ 3.2 ‐‐ 0.07 ‐‐ 2 ‐‐ 48 32 ‐‐ ‐‐ <0.2 ‐‐ ‐‐ 8.1 0.09 170 140 35 <1 <0.1 <1 <0.2 DW‐69 12/29/1998 270 ‐‐ ‐‐ ‐‐ ‐‐ ‐‐ 64 860 ‐‐ ‐‐ ‐‐ ‐‐ ‐‐ ‐‐ ‐‐ ‐‐ 81 ‐‐ <0.1 ‐‐ 37 ‐‐ 0.2 ‐‐ 3.7 ‐‐ 43 ‐‐ ‐‐ ‐‐ 18 <0.4 ‐‐ 7.9 ‐‐ 510 ‐‐ ‐‐ 30 ‐‐ ‐‐ ‐‐DW‐69 5/3/2005 290 <1 <1 290 <1 <5 150 1000 <0.05 ‐‐ ‐‐ 16 240 ‐‐ 0.1 ‐‐ 74 ‐‐ <0.05 ‐‐ 24 ‐‐ 0.05 ‐‐ 3 ‐‐ 110 280 ‐‐ ‐‐ 5.9 ‐‐ ‐‐ 7.5 0.19 630 540 87 21 <0.1 <1 1.4 DW‐69 5/15/2008 440 <1.0 <1.0 440 <1.0 ‐‐ 110 1200 ‐‐ 0.0065 ‐‐ ‐‐ ‐‐ <0.10 ‐‐ 120 ‐‐ <0.050 ‐‐ 44 ‐‐ 0.36 ‐‐ 3.4 ‐‐ 82 ‐‐ ‐‐ ‐‐ ‐‐ 6.3 ‐‐ ‐‐ ‐‐ ‐‐ 730 ‐‐ ‐‐ 16 ‐‐ <1.0 1.4 DW‐74 6/2/2008 200 <1 <1 200 <1 ‐‐ 100 940 ‐‐ 0.0056 ‐‐ ‐‐ ‐‐ <0.1 ‐‐ 90 ‐‐ <0.05 ‐‐ 27 ‐‐ <0.01 ‐‐ 3.8 ‐‐ 60 ‐‐ ‐‐ ‐‐ ‐‐ 13 ‐‐ ‐‐ ‐‐ ‐‐ 560 ‐‐ ‐‐ 52 ‐‐ 1.6 3.6 DW‐79 5/6/2005 260 <1 <1 260 <1 <5 25 780 <0.05 ‐‐ ‐‐ 4 240 ‐‐ <0.1 ‐‐ 67 ‐‐ <0.05 ‐‐ 18 ‐‐ 0.04 ‐‐ 3 ‐‐ 78 240 ‐‐ ‐‐ 18 ‐‐ ‐‐ 7.9 0.12 520 410 110 55 <0.1 <1 1.8 DW‐95 11/29/1995 230 ‐‐ ‐‐ ‐‐ ‐‐ ‐‐ 21 670 ‐‐ ‐‐ ‐‐ ‐‐ ‐‐ ‐‐ ‐‐ ‐‐ 57 ‐‐ <0.1 ‐‐ 15 ‐‐ <0.03 ‐‐ 3.0 ‐‐ 69 ‐‐ ‐‐ ‐‐ 21 <0.8 ‐‐ 7.5 ‐‐ 480 ‐‐ ‐‐ 46 ‐‐ ‐‐ ‐‐DW‐96 8/19/1997 79 ‐‐ ‐‐ ‐‐ ‐‐ ‐‐ 11 170 ‐‐ ‐‐ ‐‐ ‐‐ ‐‐ ‐‐ ‐‐ ‐‐ 12 ‐‐ <0.1 ‐‐ 3.5 ‐‐ <0.03 ‐‐ 3.6 ‐‐ 18 ‐‐ ‐‐ ‐‐ 1.3 <0.4 ‐‐ 8 ‐‐ 120 ‐‐ ‐‐ 3.6 ‐‐ ‐‐ ‐‐DW‐97 9/27/2000 130 ‐‐ ‐‐ ‐‐ ‐‐ ‐‐ 64 410 ‐‐ ‐‐ ‐‐ ‐‐ ‐‐ ‐‐ ‐‐ ‐‐ 9.2 ‐‐ 0.17 ‐‐ 3.8 ‐‐ 0.058 ‐‐ 2.3 ‐‐ 69 ‐‐ ‐‐ ‐‐ <0.4 <0.4 ‐‐ 7.2 ‐‐ 130 ‐‐ ‐‐ <2 ‐‐ ‐‐ ‐‐DW‐97 5/19/2005 170 <1 <1 170 <1 6 25 800 <0.05 ‐‐ ‐‐ 3 130 ‐‐ 0.1 ‐‐ 74 ‐‐ <0.05 ‐‐ 20 ‐‐ <0.01 ‐‐ 3 ‐‐ 66 270 ‐‐ 130 34 ‐‐ <0.05 8 <0.2 570 360 220 87 <0.1 <1 1.5 DW‐97 5/13/2008 170 <1.0 <1.0 170 <1.0 ‐‐ 34 790 ‐‐ 0.0038 ‐‐ ‐‐ ‐‐ 0.11 ‐‐ 78 ‐‐ <0.050 ‐‐ 22 ‐‐ <0.010 ‐‐ 2.9 ‐‐ 59 ‐‐ ‐‐ ‐‐ ‐‐ 32 ‐‐ ‐‐ ‐‐ ‐‐ 580 ‐‐ ‐‐ 78 ‐‐ <1.0 UJ‐ 0.99 DW‐99 5/5/2005 240 <1 <1 240 <1 6 20 700 <0.05 ‐‐ ‐‐ 4 100 ‐‐ <0.1 ‐‐ 57 ‐‐ <0.05 ‐‐ 19 ‐‐ 0.02 ‐‐ 2 ‐‐ 68 220 ‐‐ ‐‐ 22 ‐‐ ‐‐ 7.7 0.11 510 380 130 35 <0.1 <1 1.3 DW‐99 5/14/2008 230 <1.0 <1.0 230 <1.0 ‐‐ 24 790 ‐‐ 0.0054 ‐‐ ‐‐ ‐‐ <0.10 ‐‐ 66 ‐‐ <0.050 ‐‐ 22 ‐‐ 0.011 ‐‐ 2.8 ‐‐ 69 ‐‐ ‐‐ ‐‐ ‐‐ 25 J‐ ‐‐ ‐‐ ‐‐ ‐‐ 530 ‐‐ ‐‐ 51 ‐‐ <1.0 1.3 DW‐A 6/24/2004 220 ‐‐ ‐‐ ‐‐ ‐‐ ‐‐ 27 810 ‐‐ ‐‐ ‐‐ ‐‐ ‐‐ ‐‐ ‐‐ ‐‐ 80 ‐‐ <0.02 ‐‐ 21 ‐‐ 0.01 ‐‐ 4.0 ‐‐ 61 ‐‐ ‐‐ ‐‐ 32 <0.1 ‐‐ 7.8 ‐‐ 620 ‐‐ ‐‐ 49 ‐‐ ‐‐ ‐‐DW‐B 6/24/2004 220 ‐‐ ‐‐ ‐‐ ‐‐ ‐‐ 26 770 ‐‐ ‐‐ ‐‐ ‐‐ ‐‐ ‐‐ ‐‐ ‐‐ 63 ‐‐ <0.02 ‐‐ 16 ‐‐ <0.01 ‐‐ 3.0 ‐‐ 83 ‐‐ ‐‐ ‐‐ 20 <0.1 ‐‐ 7.7 ‐‐ 570 ‐‐ ‐‐ 33 ‐‐ ‐‐ ‐‐DW‐C 6/24/2004 230 ‐‐ ‐‐ ‐‐ ‐‐ ‐‐ 22 710 ‐‐ ‐‐ ‐‐ ‐‐ ‐‐ ‐‐ ‐‐ ‐‐ 58 ‐‐ <0.02 ‐‐ 19 ‐‐ 0.01 ‐‐ 3.0 ‐‐ 66 ‐‐ ‐‐ ‐‐ 22 <0.1 ‐‐ 7.6 ‐‐ 520 ‐‐ ‐‐ 35 ‐‐ ‐‐ ‐‐DW‐C 5/4/2005 230 <1 <1 230 <1 6 26 740 <0.05 ‐‐ ‐‐ 3 120 ‐‐ 0.1 ‐‐ 89 ‐‐ <0.05 ‐‐ 22 ‐‐ 0.03 ‐‐ 2 ‐‐ 27 310 ‐‐ ‐‐ 25 ‐‐ ‐‐ 7.9 0.14 520 400 120 44 <0.1 <1 2.9 DW‐C 5/14/2008 230 <1.0 <1.0 230 <1.0 ‐‐ 44 870 ‐‐ 0.0025 ‐‐ ‐‐ ‐‐ <0.10 ‐‐ 100 ‐‐ <0.050 ‐‐ 29 ‐‐ <0.010 ‐‐ 2.5 ‐‐ 35 ‐‐ ‐‐ ‐‐ ‐‐ 27 J‐ ‐‐ ‐‐ ‐‐ ‐‐ 590 ‐‐ ‐‐ 49 ‐‐ <1.0 2.3 DW‐D 6/24/2004 180 ‐‐ ‐‐ ‐‐ ‐‐ ‐‐ 36 680 ‐‐ ‐‐ ‐‐ ‐‐ ‐‐ ‐‐ ‐‐ ‐‐ 72 ‐‐ <0.02 ‐‐ 20 ‐‐ <0.01 ‐‐ 2.0 ‐‐ 39 ‐‐ ‐‐ ‐‐ 23 <0.1 ‐‐ 7.8 ‐‐ 480 ‐‐ ‐‐ 35 ‐‐ ‐‐ ‐‐IN‐01 5/2/2005 310 <1 <1 310 <1 6 120 970 <0.05 ‐‐ ‐‐ 24 170 ‐‐ <0.1 ‐‐ 62 ‐‐ <0.05 ‐‐ 20 ‐‐ 0.03 ‐‐ 3 ‐‐ 110 240 ‐‐ ‐‐ 6.8 ‐‐ ‐‐ 7.5 0.17 600 510 86 26 <0.1 <1 1.6 IN‐01 5/12/2008 500 <1.0 <1.0 500 <1.0 ‐‐ 170 1400 ‐‐ 0.0056 ‐‐ ‐‐ ‐‐ 0.11 ‐‐ 120 ‐‐ <0.050 ‐‐ 41 ‐‐ 0.076 ‐‐ 3.8 ‐‐ 160 ‐‐ ‐‐ ‐‐ ‐‐ 6.8 ‐‐ ‐‐ ‐‐ ‐‐ 930 ‐‐ ‐‐ 29 ‐‐ <1.0 2.2 IN‐02 5/2/2005 160 <1 <1 160 <1 <5 250 1000 <0.05 ‐‐ ‐‐ 4 260 ‐‐ <0.1 ‐‐ 42 ‐‐ <0.05 ‐‐ 15 ‐‐ 0.05 ‐‐ 5 ‐‐ 130 170 ‐‐ ‐‐ <0.8 ‐‐ ‐‐ 7.7 0.28 610 520 95 <1 <0.1 <1 <0.2 IN‐02 5/12/2008 240 <1.0 <1.0 240 <1.0 ‐‐ 71 780 ‐‐ 0.0051 ‐‐ ‐‐ ‐‐ <0.10 ‐‐ 70 ‐‐ <0.050 ‐‐ 22 ‐‐ 0.055 ‐‐ 2.5 ‐‐ 75 ‐‐ ‐‐ ‐‐ ‐‐ 11 ‐‐ ‐‐ ‐‐ ‐‐ 550 ‐‐ ‐‐ 38 ‐‐ <1.0 1.5 IN‐03 5/17/2005 230 <1 <1 230 <1 10 24 780 <0.05 ‐‐ ‐‐ 4 130 ‐‐ 0.1 ‐‐ 80 ‐‐ <0.05 ‐‐ 23 ‐‐ 0.04 ‐‐ <2 ‐‐ 39 290 ‐‐ ‐‐ 27 ‐‐ ‐‐ 8 0.09 550 390 160 33 <0.1 <1 4.5
IN‐04/‐04A 5/18/2005 240 <1 <1 240 <1 8 48 660 <0.05 ‐‐ ‐‐ 21 150 ‐‐ <0.1 ‐‐ 39 ‐‐ <0.05 ‐‐ 16 ‐‐ 0.18 ‐‐ 4 ‐‐ 76 160 ‐‐ ‐‐ 3.6 ‐‐ ‐‐ 8 0.09 390 330 63 27 <0.1 <1 2.4
Notes:mg/L = milligrams per literug/L = micrograms per literumhos/cm = micromhos per centimeter‐‐ = Not analyzedDetections are in bold font. 3 of 4

TABLE 4‐1SUPPLY WELL ANALYTICAL DATA
Supply Well Evaluation Technical ReportHilmar Cheese Company
Hilmar, California
Well ID Sample Date Bicarbon
ate Alkalinity
(mg/L)
Carbon
ate Alkalinity
(mg/L)
Hydroxide
Alkalinity
(mg/L)
Total A
lkalinity
(mg/L)
Ammon
ia as Nitrogen
(mg/L)
Chem
ical Oxygen Dem
and (m
g/L)
Chloride
(mg/L)
Cond
uctiv
ity (u
mho
s/cm
)
Total A
luminum
(mg/L)
Dissolved
Arsenic (m
g/L)
Total A
rsenic (m
g/L)
Total A
rsenic (u
g/L)
Total Barium (u
g/L)
Dissolved
Boron
(mg/L)
Total Boron
(mg/L)
Dissolved
Calcium
(mg/L)
Total Calcium
(mg/L)
Dissolved
Iron
(mg/L)
Total Iron (m
g/L)
Dissolved
Magnesium
(mg/L)
Total M
agnesium
(mg/L)
Dissolved
Manganese (m
g/L)
Total M
anganese (m
g/L)
Dissolved
Potassium
(mg/L)
Total Potassium
(mg/L)
Dissolved
Sod
ium (m
g/L)
Total Sod
ium (m
g/L)
Total H
ardn
ess (as CaCO
3) (m
g/L)
Nitrate (m
g/L)
Nitrate/Nitrite
as N (m
g/L)
Nitrate‐Nitrogen
(mg/L)
Nitrite
as N (m
g/L)
Nitrogen, N
itrite
(AS N) (mg/L)
pH (stand
ard un
its)
Phosph
orus (m
g/L)
Total D
issolved
Solids (m
g/L)
Total Fixed
Dissolved
Solids (m
g/L)
Total V
olatile Dissolved
Solids (m
g/L)
Sulfa
te (m
g/L)
Sulfide
(mg/L)
Total Kjeldahl N
itrogen
(mg/L)
Total O
rganic Carbo
n (m
g/L)
IN‐04/‐04A 5/15/2008 470 <1.0 <1.0 470 <1.0 ‐‐ 59 1300 ‐‐ 0.0070 ‐‐ ‐‐ ‐‐ 0.21 ‐‐ 150 ‐‐ <0.050 ‐‐ 50 ‐‐ 0.49 ‐‐ 4.6 ‐‐ 72 ‐‐ ‐‐ ‐‐ ‐‐ 32 ‐‐ ‐‐ ‐‐ ‐‐ 880 ‐‐ ‐‐ 50 ‐‐ <1.0 7.7 IN‐05 5/19/2005 120 <1 <1 120 <1 <5 70 440 <0.05 ‐‐ ‐‐ 76 53 ‐‐ <0.1 ‐‐ 10 ‐‐ 0.22 ‐‐ 4.1 ‐‐ 0.07 ‐‐ <2 ‐‐ 78 42 ‐‐ ‐‐ <0.2 ‐‐ ‐‐ 8.2 0.25 250 210 47 <1 <0.1 <1 <0.2 IN‐07 5/5/2005 160 <1 <1 160 <1 <5 240 1000 <0.05 ‐‐ ‐‐ 4 260 ‐‐ <0.1 ‐‐ 47 ‐‐ <0.05 ‐‐ 17 ‐‐ 0.07 ‐‐ 5 ‐‐ 140 190 ‐‐ ‐‐ <0.2 ‐‐ ‐‐ 8 0.16 620 520 110 <1 <0.1 <1 <0.2 IN‐07 5/20/2008 150 <1.0 <1.0 150 <1.0 ‐‐ 300 1200 ‐‐ 0.014 ‐‐ ‐‐ ‐‐ 0.16 ‐‐ 55 ‐‐ <0.050 ‐‐ 21 ‐‐ 0.12 ‐‐ 5.8 ‐‐ 170 ‐‐ ‐‐ ‐‐ ‐‐ <0.60 ‐‐ ‐‐ ‐‐ ‐‐ 760 ‐‐ ‐‐ <6.0 ‐‐ <1.0 UJ‐ <0.20 IN‐09 5/25/2005 170 <1 <1 170 <1 <5 160 840 <0.05 ‐‐ ‐‐ 10 150 ‐‐ 0.1 ‐‐ 25 ‐‐ <0.05 ‐‐ 6.8 ‐‐ 0.33 ‐‐ 2 ‐‐ 130 90 ‐‐ ‐‐ <0.2 ‐‐ ‐‐ 8.1 <0.2 500 440 57 15 <0.1 <1 0.42 IW‐03 5/3/2005 320 <1 <1 320 <1 11 70 1000 <0.05 ‐‐ ‐‐ 4 220 ‐‐ 0.1 ‐‐ 120 ‐‐ 0.55 ‐‐ 39 ‐‐ 0.13 ‐‐ 3 ‐‐ 44 460 ‐‐ ‐‐ 29 ‐‐ ‐‐ 7.6 0.21 700 480 210 39 <0.1 <1 5 IW‐03 5/13/2008 400 <1.0 <1.0 400 <1.0 ‐‐ 94 1100 ‐‐ 0.0048 ‐‐ ‐‐ ‐‐ 0.11 ‐‐ 140 ‐‐ 0.094 ‐‐ 48 ‐‐ 0.23 ‐‐ 3.6 ‐‐ 60 ‐‐ ‐‐ ‐‐ ‐‐ 27 ‐‐ ‐‐ ‐‐ ‐‐ 800 ‐‐ ‐‐ 44 ‐‐ <1.0 5.2 IW‐04 5/3/2005 1100 <1 <1 1100 <1 11 180 2200 <0.05 ‐‐ ‐‐ 2 610 ‐‐ 0.1 ‐‐ 270 ‐‐ <0.05 ‐‐ 81 ‐‐ 0.09 ‐‐ 4 ‐‐ 100 1000 ‐‐ ‐‐ <5 Jo ‐‐ ‐‐ 7 0.12 1400 1200 220 25 <0.1 <1 7.6 IW‐04 5/15/2008 1000 <1.0 <1.0 1000 <1.0 ‐‐ 210 2300 ‐‐ <0.0020 ‐‐ ‐‐ ‐‐ 0.16 ‐‐ 280 ‐‐ 0.39 ‐‐ 83 ‐‐ 0.27 ‐‐ 3.9 ‐‐ 160 ‐‐ ‐‐ ‐‐ ‐‐ <1.0 ‐‐ ‐‐ ‐‐ ‐‐ 1400 ‐‐ ‐‐ 33 ‐‐ <1.0 6.3 IW‐17 6/1/2005 940 <1 <1 940 <1 25 150 2000 <0.05 ‐‐ ‐‐ 15 500 ‐‐ 0.1 ‐‐ 220 ‐‐ 1.6 ‐‐ 72 ‐‐ 3.4 ‐‐ 4 ‐‐ 140 840 ‐‐ ‐‐ 3.2 ‐‐ ‐‐ 7.4 <5 1300 1100 120 47 <0.1 1.1 9.9 IW‐19 5/3/2005 210 <1 <1 210 <1 5 54 820 <0.05 ‐‐ ‐‐ 3 140 ‐‐ <0.1 ‐‐ 75 ‐‐ <0.05 ‐‐ 23 ‐‐ <0.01 ‐‐ 3 ‐‐ 54 280 ‐‐ ‐‐ 27 ‐‐ ‐‐ 7.8 0.07 560 420 140 35 <0.1 2.7 3.4 IW‐19 5/20/2008 190 <1.0 <1.0 190 <1.0 ‐‐ 53 810 ‐‐ 0.0029 ‐‐ ‐‐ ‐‐ 0.12 ‐‐ 73 ‐‐ <0.050 ‐‐ 24 ‐‐ 0.013 ‐‐ 3.3 ‐‐ 51 ‐‐ ‐‐ ‐‐ ‐‐ 27 ‐‐ ‐‐ ‐‐ ‐‐ 540 ‐‐ ‐‐ 32 ‐‐ <1.0 UJ‐ 2.9 IW‐20 6/1/2005 580 <1 <1 580 <1 11 110 1500 <0.05 ‐‐ ‐‐ 12 370 ‐‐ <0.1 ‐‐ 150 ‐‐ 1.1 ‐‐ 46 ‐‐ 1.5 ‐‐ 6 ‐‐ 98 560 ‐‐ ‐‐ 19 ‐‐ ‐‐ 7.5 <5 940 750 190 33 <0.1 <1 7.2 IW‐20 5/15/2008 550 <1.0 <1.0 550 <1.0 ‐‐ 150 1600 ‐‐ 0.012 ‐‐ ‐‐ ‐‐ 0.12 ‐‐ 150 ‐‐ 1.2 ‐‐ 50 ‐‐ 1.5 ‐‐ 8.3 ‐‐ 140 ‐‐ ‐‐ ‐‐ ‐‐ 19 ‐‐ ‐‐ ‐‐ ‐‐ 1000 ‐‐ ‐‐ 56 ‐‐ <1.0 7.0 IW‐21 6/1/2005 140 <1 <1 140 <1 <5 17 540 <0.05 ‐‐ ‐‐ 4 99 ‐‐ <0.1 ‐‐ 55 ‐‐ <0.05 ‐‐ 16 ‐‐ <0.01 ‐‐ 2 ‐‐ 24 200 ‐‐ ‐‐ 22 ‐‐ ‐‐ 7.9 <5 390 260 130 30 <0.1 <1 1.4 IW‐21 5/14/2008 220 <1.0 <1.0 220 <1.0 ‐‐ 53 810 ‐‐ 0.0032 ‐‐ ‐‐ ‐‐ <0.10 ‐‐ 85 ‐‐ <0.050 ‐‐ 26 ‐‐ <0.010 ‐‐ 2.4 ‐‐ 36 ‐‐ ‐‐ ‐‐ ‐‐ 22 ‐‐ ‐‐ ‐‐ ‐‐ 520 ‐‐ ‐‐ 30 ‐‐ <1.0 3.3 IW‐22 6/1/2005 250 <1 <1 250 <1 6 27 790 <0.05 ‐‐ 4 110 <0.1 73 <0.05 21 0.01 2 62 270 ‐‐ ‐‐ 25 ‐‐ ‐‐ 7.9 <5 540 430 110 37 <0.1 <1 1.8
Notes:mg/L = milligrams per literug/L = micrograms per literumhos/cm = micromhos per centimeter‐‐ = Not analyzedDetections are in bold font. 4 of 4

TABLE 4‐2
SUPPLY WELL ANALYTICAL DATA COMPARISON WITH REGULATORY THRESHOLDS1
Supply Well Evaluation Technical ReportHilmar Cheese Company
Hilmar, California
Ammon
ia as Nitrogen
(mg/L)
Chlorid
e (m
g/L)
Cond
uctivity
(umho
s/cm
)
Dissolved
Arsen
ic (m
g/L)
Dissolved
Boron
(mg/L)
Dissolved
Iron
(mg/L)
Dissolved
Mangane
se (m
g/L)
Dissolved
Sod
ium (m
g/L)
Nitrate‐Nitrogen
(mg/L)
Total D
issolved
Solids (m
g/L)
Sulfate (m
g/L)
‐‐ ‐‐ ‐‐ 0.05 ‐‐ ‐‐ ‐‐ ‐‐ 45 ‐‐ ‐‐
‐‐ ‐‐ ‐‐ 0.01 ‐‐ ‐‐ ‐‐ ‐‐ 10 ‐‐ ‐‐
‐‐ 250 900 2 ‐‐ ‐‐ 0.3 0.05 ‐‐ ‐‐ 500 250
‐‐ 250 ‐‐ ‐‐ ‐‐ 0.3 0.05 ‐‐ ‐‐ 500 250
1.5 ‐‐ ‐‐ ‐‐ ‐‐ ‐‐ ‐‐ 30‐60 4 ‐‐ ‐‐ 250 5
‐‐ 106‐175 6 700 0.1 0.7/0.75 3 5 0.2 69 ‐‐ 450 ‐‐
Well ID Sample Date
DW‐20 5/19/2008 <1.0 64 1300 0.004 0.25 <0.050 0.051 38 54 920 42DW‐21 5/14/2008 <1.0 43 740 0.0036 0.1 <0.050 0.13 40 20 470 22DW‐23 5/14/2008 <1.0 72 1200 0.0021 0.1 <0.050 0.66 52 15 J‐ 800 16DW‐24 5/14/2008 <1.0 110 1200 0.0059 <0.10 <0.050 0.29 93 5.9 740 19DW‐25 5/14/2008 <1.0 66 1000 <0.0020 <0.10 <0.050 <0.010 34 36 700 53DW‐27A 5/19/2008 <1.0 36 900 0.005 0.12 <0.050 0.25 71 22 600 56DW‐28 5/13/2008 <1.0 140 1700 0.0067 0.2 <0.050 0.032 77 95 1300 170 J+DW‐29 5/13/2008 <1.0 110 1200 0.0058 0.15 <0.050 0.22 81 32 900 86DW‐29A 5/13/2008 <1.0 36 830 0.0063 0.11 <0.050 0.18 55 22 610 49DW‐34 5/15/2008 <1.0 240 1400 0.01 <0.10 <0.050 <0.010 140 2.5 800 7.8DW‐35 5/20/2008 <1.0 250 2100 0.014 0.24 0.38 2.5 300 <2.0 1300 95DW‐35B 5/20/2008 <1.0 210 2100 <0.0020 0.15 0.4 0.47 220 <1.0 1200 24DW‐38 5/19/2008 <1.0 70 920 0.0028 0.13 <0.050 <0.010 62 22 590 62DW‐38B 5/19/2008 <1.0 24 680 0.0091 0.14 <0.050 <0.010 68 16 460 44DW‐38C 5/19/2008 <1.0 30 550 0.077 0.11 <0.050 0.22 83 6.3 370 22DW‐38D 5/19/2008 <1.0 25 490 0.056 0.11 <0.050 0.31 81 2.9 320 24DW‐38E 5/19/2008 <1.0 97 700 0.094 0.12 0.073 0.12 120 <0.40 390 17DW‐44 5/20/2008 <1.0 27 710 0.0048 0.15 <0.050 0.068 84 9.5 460 48DW‐47 5/20/2008 <1.0 16 590 0.006 <0.10 <0.050 <0.010 27 16 410 45DW‐53 5/20/2008 <1.0 140 1400 0.0038 0.2 <0.050 <0.010 84 21 870 49DW‐54 5/14/2008 <1.0 33 290 0.058 <0.10 0.052 0.033 53 <0.20 160 <2.0 DW‐58 5/19/2008 <2.0 UJ+ 80 1300 0.0034 0.18 <0.050 0.044 67 11 780 28DW‐60 5/15/2008 <1.0 62 1000 0.0095 0.17 <0.050 0.43 64 43 710 36DW‐62 5/20/2008 <1.0 38 500 0.017 <0.10 <0.050 0.22 64 3.4 310 58DW‐65 5/13/2008 <1.0 93 1100 0.005 0.19 <0.050 0.15 59 25 810 44DW‐69 5/15/2008 <1.0 110 1200 0.0065 <0.10 <0.050 0.36 82 6.3 730 16DW‐74 6/2/2008 <1 100 940 0.0056 <0.1 <0.05 <0.01 60 13 560 52DW‐97 5/13/2008 <1.0 34 790 0.0038 0.11 <0.050 <0.010 59 32 580 78DW‐99 5/14/2008 <1.0 24 790 0.0054 <0.10 <0.050 0.011 69 25 J‐ 530 51DW‐101 5/14/2008 <1.0 45 700 0.0031 0.1 <0.050 0.042 40 17 450 19DW‐104 5/15/2008 <1.0 57 1000 0.0081 0.28 <0.050 0.11 130 14 640 57DW‐C 5/14/2008 <1.0 44 870 0.0025 <0.10 <0.050 <0.010 35 27 J‐ 590 49IN‐01 5/12/2008 <1.0 170 1400 0.0056 0.11 <0.050 0.076 160 6.8 930 29IN‐02 5/12/2008 <1.0 71 780 0.0051 <0.10 <0.050 0.055 75 11 550 38
IN‐04/‐04A 5/15/2008 <1.0 59 1300 0.007 0.21 <0.050 0.49 72 32 880 50IN‐07 5/20/2008 <1.0 300 1200 0.014 0.16 <0.050 0.12 170 <0.60 760 <6.0 IW‐03 5/13/2008 <1.0 94 1100 0.0048 0.11 0.094 0.23 60 27 800 44IW‐04 5/15/2008 <1.0 210 2300 <0.0020 0.16 0.39 0.27 160 <1.0 1400 33IW‐19 5/20/2008 <1.0 53 810 0.0029 0.12 <0.050 0.013 51 27 540 32
AgriculturalE
CA Primary MCLsAWater Quality Objective
Fed Primary MCLsB
CA Secondary MCLsC
Taste & Odor ThresholdsEFed Secondary MCLsD
Notes:mg/L = milligrams per literug/L = micrograms per literumhos/cm = micromhos per centimeter‐‐ = Not availableDetections are in bold font. 1 of 2

TABLE 4‐2
SUPPLY WELL ANALYTICAL DATA COMPARISON WITH REGULATORY THRESHOLDS1
Supply Well Evaluation Technical ReportHilmar Cheese Company
Hilmar, California
Ammon
ia as Nitrogen
(mg/L)
Chlorid
e (m
g/L)
Cond
uctivity
(umho
s/cm
)
Dissolved
Arsen
ic (m
g/L)
Dissolved
Boron
(mg/L)
Dissolved
Iron
(mg/L)
Dissolved
Mangane
se (m
g/L)
Dissolved
Sod
ium (m
g/L)
Nitrate‐Nitrogen
(mg/L)
Total D
issolved
Solids (m
g/L)
Sulfate (m
g/L)
‐‐ ‐‐ ‐‐ 0.05 ‐‐ ‐‐ ‐‐ ‐‐ 45 ‐‐ ‐‐
‐‐ ‐‐ ‐‐ 0.01 ‐‐ ‐‐ ‐‐ ‐‐ 10 ‐‐ ‐‐
‐‐ 250 900 2 ‐‐ ‐‐ 0.3 0.05 ‐‐ ‐‐ 500 250
‐‐ 250 ‐‐ ‐‐ ‐‐ 0.3 0.05 ‐‐ ‐‐ 500 250
1.5 ‐‐ ‐‐ ‐‐ ‐‐ ‐‐ ‐‐ 30‐60 4 ‐‐ ‐‐ 250 5
‐‐ 106‐175 6 700 0.1 0.7/0.75 3 5 0.2 69 ‐‐ 450 ‐‐
Well ID Sample Date
AgriculturalE
CA Primary MCLsAWater Quality Objective
Fed Primary MCLsB
CA Secondary MCLsC
Taste & Odor ThresholdsEFed Secondary MCLsD
IW‐20 5/15/2008 <1.0 150 1600 0.012 0.12 1.2 1.5 140 19 1000 56IW‐21 5/14/2008 <1.0 53 810 0.0032 <0.10 <0.050 <0.010 36 22 520 30
2 = Recommended level; Upper level = 1600 umhos/cm; Short‐term level = 2200 umhos/cm.3 = Second value from Reference 16 (CVRWQB, 2007).4 = USEPA Drinking Water Advisory. From Reference 33. This limit has a range of values between the first and second numbers shown.5 = USEPA Drinking Water Advisory. From Reference 33. 6 = Level included in Cleanup and Abatement Order No. R5‐2004‐0722; provided in place of source E.A = CCR Title 22‚ Division 4‚ Chapter 15‚ Article 4.B = 40 CFR Part 141.C = CCR Title 22‚ Division 4‚ Chapter 15‚ Article 16‚ Section 64449.D = 40 CFR Part 143‚ Section 3.E = Central Valley Regional Water Quality Control Board (CVRWQCB), 2007. A Compilation of Water Quality Goals. Updated August, 2007.
At or above CA or Fed Primary MCLAt or above CA or Fed Secondary MCLAt or above Taste & Odor Thresholds
At or above Agricultural
1 = Most stringent of primary maximum contaminant level (MCL), secondary MCL, agricultural or taste and odor threshold used for screening if multiple regulatory thresholds established.
Notes:mg/L = milligrams per literug/L = micrograms per literumhos/cm = micromhos per centimeter‐‐ = Not availableDetections are in bold font. 2 of 2

TABLE 4‐3
TREATED WASTE WATER ANALYTICAL SUMMARY1,2
Supply Well Evaluation Technical ReportHilmar Cheese Company
Hilmar, CA
Compound units 2001 2002 2003 2004 2005 2006 2007 2008 8‐yr Average
Alkalinity, bicarbonate (as CaCO3) mg/L 388 332 389 227 1231 1500 1448 1455 871.25
Ammonia as Nitrogen mg/L 37 23 29 25 54 62 107 76 51.63
BOD mg/L 5334 3879 4289 4086 178 645 519 205 2391.88
Calcium mg/L 120 134 126 70 120 96 89 57 101.50
Chloride mg/L 486 197 241 320 388 288 290 300 313.75
COD mg/L 9360 6728 6518 6968 623 2086 1572 896 4343.88
EC umhos/cm 3916 2495 2768 2720 3420 3506 3561 3610 3249.50
Iron mg/L 1 2.5 2.6 1.1 16.83 11.61 3.3 2.4 5.17
Magnesium mg/L 25 19 15 14 12.09 15 14 17 16.39
Nitrate‐nitrogen mg/L 82 101 94 40 1.3 4 1 3 40.79
pH standard units 6.5 6.7 6.7 5.7 7.9 8.1 8 8 7.20
Phosphorus, total mg/L 88 73 78 89 16 64 48 51 63.38
Potassium mg/L 253 164 223 358 188 169 165 179 212.38
Sodium mg/L 679 346 384 304 499 618 586 673 511.13
Solids, total dissolved mg/L 6333 4596 4885 4836 2074 2248 2100 2217 3661.13
Sulfate mg/L 51 30 22 25 78 32 39 39 39.50
Sulfide mg/L 0.29 0.18 0.13 0.13 9.36 4.2 2.7 2.05 2.38
TKN mg/L 189 119 136 146 93 207 218 121 153.63
Notes:mg/L = miligrams per literumhos/cm = micromhos per centimeter1‐ Treated wastewater applied to primary lands. 2 ‐ Brown and Caldwell, Report of Waste Disharge, Hilmar Cheese Company, Hilmar, California. August 2004. HCC, Monthly Water Quality Monitoring Reports. January ‐ December, 2005. KennedyJenks, Report of Waste Discharge, Hilmar Cheese Company, Hilmar, California. June 2008.

TABLE 5‐1SUPPLY WELL FINDINGS SUMMARY
Supply Well Evaluation Technical ReportHilmar Cheese Company
Hilmar, CA
Supply Well SourcesFinding Number/Description
Description of Finding: Sources of impact based on weight of evidence
Wells categorized by finding
Data Gaps Identified Data Required to Address Data Gap
1: Weight of evidence doesn’t indicate that HCC is the source of the impact (arsenic or nitrate).
No evidence of groundwater impact due to HCC operations. Groundwater quality thresholds may be exceeded (e.g., MCL for arsenic and nitrate), but the observed impact is not due to HCC operations.
DW‐38B, W‐38C, DW‐38D, DW‐47, DW‐54
and DW‐62.
1. No data gaps were identified and/or supply wells require no further evaluation.
not applicable
2: Weight of evidence doesn’t indicate that HCC is source of the observed impact.
Wells in this category exhibit elevated concentrations of HCC‐related chemicals (e.g., chloride); however the data is not consistent with the observed hydraulic and/or chemical gradients.
DW‐104 and IN‐7 1. No data gaps were identified and/or supply wells require no further evaluation.
not applicable
3: Weight of evidence indicates HCC as a source of groundwater impact.
Evidence of impact likely due to HCC operations. No other sources located at, or immediately up‐gradient of the subject locations have been positively identified.
IN1, IN2, DW‐35, DW‐35B, DW‐53 and DW‐
23/IW‐04.
1. chemical migration pathway for detected impact at DW‐53 is unclear.
Determine well construction for IW‐21 and magnitude of local groundwater extraction at this location.
4: Weight of evidence can't discern potential sources of groundwater impact from regional ambient conditions.
Wells are located in an area that may, or may not be, hydraulically down‐gradient of HCC operations. HCC‐related constituents (e.g., TDS and chloride) are detected; however, the concentrations are consistent with the range of regional ambient levels.
DW‐101, DW‐21, DW‐27A, DW‐29, DW‐
29A, DW‐44, DW‐97, DW‐99, DW‐C, IW‐19
and IW‐21.
1. Discernment and/or quantification of impact due to regional sources versus HCC‐related impact. 2. Source of elevated chloride concentration reported at DW‐97.
Characterization of ambient levels for HCC‐related chemicals and characterization of dairy‐related chemicals may aid in distinguishing HCC from regional impact. Characterize discrete water samples collected above and below Corcoran Clay at DW‐97.
5: Weight of evidence indicates multiple sources of impact; HCC is a primary contributor.
Wells are located down, or cross gradient, of HCC in an area that is, or may be, impacted by HCC operations. Wells exhibit elevated concentrations of HCC‐related contaminants. There are non‐HCC source areas (e.g., dairy) that likely contribute significant impact to these wells. The exact magnitude of impact due to HCC operations, has not been established.
DW‐23, DW‐24, DW‐25, DW‐34, DW‐38E, DW‐58, DW‐60, DW‐69, DW‐74, IN‐04/IN‐
04A and IW‐20
1. Differentiation between dairy and HCC‐related wastes.2. Source of impact at IN‐04/IN04A is unclear (IN‐04A has an inadequate sanitary seal).3. Source of groundwater at IW‐20.4. Determine source of groundwater characterized in the area surrounding DW‐74.
Procure discreet sample from IN‐04, along with a well construction log of IN‐04A and IW‐20. Characterization of ambient levels for HCC‐related chemicals and characterization of diary related chemicals. Procure well construction logs from DW‐38‐series wells to correlate data with DW‐74.
6: Weight of evidence indicates multiple sources of impact; HCC is not the primary contributor.
These supply wells typically exhibit elevated concentrations of constituents that are similar to the HCC‐related impact; however, are located a significant distance away from the site or in an up gradient or cross gradient direction. In addition, the observed concentrations indicate significant impact from an adjacent, or up gradient non‐HCC source.
DW‐20, DW‐28, DW‐38, DW‐65 and IW‐
3/DW‐22.
1. Discernment and/or quantification of impact due to regional sources versus HCC‐related impact.
Characterization of ambient levels for HCC‐related chemicals and characterization of dairy‐related chemicals may aid in distinguishing HCC from regional impact.
Findings based on evaluation of analytical data in conjunction with hydro-geological data as illustrated on the flow chart presented as Figure 5-1.

FIGURES


FIGURE 3‐1WELL CONSTRUCTION DETAILS FOR 2008 PRIVATE WELLS SAMPLED
Supply Well Evaluation Technical ReportHilmar Cheese Company
Hilmar, California
Notes:Construction details from DWR Well Completion Reports.(1) Well Log lists a seal depth of 110 feet below ground surface (ft‐bgs).(2) Filter interval is assumed based on lack of information.(3) Casing from 0 to X ft‐bgs, no screen interval.
0
50
100
150
DW‐3
DW‐10
DW‐12
DW‐21
DW‐23
DW‐24
DW‐27
DW‐29
DW‐29A
DW‐31
DW‐34
DW‐38
DW‐40 (1
DW‐42
DW‐44 (2
DW‐51 (3
DW‐53
DW‐54
DW‐55
DW‐61
DW‐62
DW‐63
DW‐65
DW‐66
DW‐67
DW‐68
DW‐69
DW‐70 (3
DW‐74
DW‐75
DW‐78
DW‐79
DW‐80
DW‐97
DW‐98
DW‐99
DW‐100
DW‐101
DW‐102
DW‐103
DW‐104
DW‐105
DW‐106
IN‐1/IW‐6
IN‐2
IN‐3/DW‐
IN‐4/DW‐
IN‐5/DW‐
IN‐6/DW‐
IN‐7
IN‐8/DW‐
IN‐9
IW‐3/DW
IW‐4/DW
IW‐5/DW
IW‐7/DW
IW‐8/DW
IW‐9/DW
IW‐10/DW
IW‐11/DW
IW‐12/DW
IW‐13/DW
IW‐14/DW
IW‐15/DW
IW‐16/DW
IW‐17/DW
IW‐18/DW
IW‐19
w grade
)
200
250
300
350
400
Dep
th (fee
t be
low
Notes:Construction details from DWR Well Completion Reports.(1) Well Log lists a seal depth of 110 feet below ground surface (ft‐bgs).(2) Filter interval is assumed based on lack of information.(3) Casing from 0 to X ft‐bgs, no screen interval.
Total Depth (material unknown) Screen Interval Casing Filter Pack Seal


FIGURE 4‐6CHLORIDE CONCENTRATIONS IN HCC WASTE WATER AND GROUNDWATER
Supply Well Evaluation Technical ReportHilmar Cheese Company
Hilmar, California
Waste Water Effluent Averages (by year)
Monitoring Wells (March 13 ‐ April 10, 2008)
Phase II Hydropunch Data (2008)
2002 2003 2004 2001
MW‐6
MW‐5
MW‐13
HP‐05@228'HP‐03@190'
2006
2007 2008
2005
0 100 200 300 400 500 600
milligrams per liter
Phase I Data (2007)
Phase II Shallow Ambient Data (2008)
Supply Well Data (2008)
CPT‐8@72'
IN‐7 (outlier)

FIGURE 4‐7CHLORIDE AND TDS CORRELATION IN HCC SITE GROUNDWATER
Supply Well Evaluation Technical ReportHilmar Cheese Company
Hilmar, California
2000
2500
3000
er liter)
0
500
1000
1500
0 100 200 300 400 500 600
TDS (m
illigrams pe
Chloride (milligrams per liter)

FIGURE 4‐8CHLORIDE AND TDS CORRELATION IN SUPPLY WELL SAMPLES
Supply Well Evaluation Technical ReportHilmar Cheese Company
Hilmar, California
1000
1200
1400
1600
per lite
r)
0
200
400
600
800
0 50 100 150 200 250 300 350
TDS (m
illigrams p
Chloride (milligrams per liter)

Figure 5-1Decision Tree Approach for Weight of Evidence Evaluation
of HCC as a Supply Well Impact SourceHilmar Cheese Company
Hilmar, California
Yes No
Does the Well Exceed
RegulatoryThresholds(1)?
Well(s) Impacted Above Regulatory Thresholds for Agricultural or Drinking
Water Use
Well Water Quality Does not Exceed Regulatory Thresholds for Agricultural or Drinking Water Use
START
No
Yes
No
No /Unlikely
COCs Exceeding Regulatory
Thresholds are consistent with HCC COCs?
FINDING 1Weight of Evidence Does Not
Indicate HCC as a Source of Impact for Arsenic or Nitrate
Does the Hydrogeologic and Chemical Data
Indicate a Complete Pathway from HCC to
the Well?
FINDING 2Weight of Evidence Does Not
Indicate HCC as a Source of Impact
Is the Detection (concentration and location) Consistent
with the Concentration Trend from the HCC site?
Yes Yes
Yes
Yes
No No
Yes
No Yes
Yes
Are There Other Potential Sources of Impact at or Near the
Well?
Are the COCs Consistent with the
Other Offsite Sources?
Does the Analtyical Data Indicate Other Potential Sources(2)? Is the Detection
(concentration and location)
Consistent with the Concentration Trend from the
HCC site?
Is the Impact Yes
No
No /Unknown
No/ Unknown
Yes Yes
(1) The most stringent of federal and state agricultural and drinking water use (MCLs and taste/odor) thresholds using sources consistent with those cited in A Compilation of Water Quality Goals (RWQCB, Central Valley Region; Aug 2003 with updates).
No/Unknown
FINDING 4Weight of Evidence Can Not Discern Potential Sources from Regional Ambient Conditions
FINDING 6Weight of Evidence Indicates Multiple
Sources HCC is not Primary
Is the Impact Above Ambient Levels?
FINDING 3Weight of Evidence Indicates HCC as the
Source
Is the Impact Above Ambient Levels?
HCC site?Above Ambient Levels?
FINDING 5Weight of Evidence Indicates Multiple
Sources HCC is Primary


APPENDIX A
TOTAL DISSOLVED SOLID (TDS) CONCENTRATIONS IN GROUNDWATER FIGURES
(SOURCE: JJ&A 2008 PHASE II INVESTIGATION DATA DELIVERABLE AND
SUMMARY REPORT)


APPENDIX B
AMBIENT CHLORIDE CALCULATIONS AND DATA SET

SHALLOW ZONE STATISTICAL CALCULATION for
CHLORIDE

1. Concentrations (mg/l) Parameter: Chloride Original Data (Not Transformed) NO NON-DETECTED RESULTS Total Measurements: 22 ambient locations
Loc.1 Meas. ND Date Conc. Original AB-01 (10) 1 0 (0%) 4/8/2008 58 58
AB-01 (25) 1 0 (0%) 4/8/2008 14 14
AB-02 (10) 1 0 (0%) 4/8/2008 48 48
AB-02 (25) 1 0 (0%) 4/8/2008 35 35
AB-03 (12) 1 0 (0%) 3/31/2008 13 13
AB-03 (25) 1 0 (0%) 3/31/2008 17 17
AB-04 (25) 1 0 (0%) 3/31/2008 18 18
AB-05 (12) 1 0 (0%) 4/1/2008 94 94
AB-05 (25) 1 0 (0%) 4/1/2008 110 110
AB-05A (25) 1 0 (0%) 4/1/2008 100 100
AB-06 (12) 1 0 (0%) 4/1/2008 85 85
AB-06 (25) 1 0 (0%) 4/1/2008 100 100
AB-07 (10) 1 0 (0%) 4/7/2008 24 24
AB-07 (25) 1 0 (0%) 4/7/2008 9.6 9.6
AB-08 (12) 1 0 (0%) 4/1/2008 84 84
AB-08 (25) 1 0 (0%) 4/1/2008 64 64
AB-09 (14) 1 0 (0%) 4/7/2008 8 8
1 Sample depth for each location is provided in parentheses after location ID, excluding monitoring well MW-20.

AB-09 (25) 1 0 (0%) 4/7/2008 13 13
AB-10 (10) 1 0 (0%) 4/8/2008 13 13
AB-10 (25) 1 0 (0%) 4/8/2008 47 47
MW-20 1 0 (0%) 4/10/2008 12 12
CPT-11 (14) 1 0 (0%) 6/20/2007 10 10

2. Dixon's Test for Outliers Parameter: Chloride Original Data (Not Transformed) NO NON-DETECTED RESULTS For 22 Measurements 5% Level of Significance Iteration Highest Lowest Critical Outlier 1 0.1 0.0217391 0.43 None Loc.1 Date Conc. Outlier
AB-01 (10) 4/8/2008 58 FALSE
AB-01 (25) 4/8/2008 14 FALSE
AB-02 (10) 4/8/2008 48 FALSE
AB-02 (25) 4/8/2008 35 FALSE
AB-03 (12) 3/31/2008 13 FALSE
AB-03 (25) 3/31/2008 17 FALSE
AB-04 (25) 3/31/2008 18 FALSE
AB-05 (12) 4/1/2008 94 FALSE
AB-05 (25) 4/1/2008 110 FALSE
AB-05A (25) 4/1/2008 100 FALSE
AB-06 (12) 4/1/2008 85 FALSE
AB-06 (25) 4/1/2008 100 FALSE
AB-07 (10) 4/7/2008 24 FALSE
AB-07 (25) 4/7/2008 9.6 FALSE
AB-08 (12) 4/1/2008 84 FALSE
AB-08 (25) 4/1/2008 64 FALSE
AB-09 (14) 4/7/2008 8 FALSE
AB-09 (25) 4/7/2008 13 FALSE

AB-10 (10) 4/8/2008 13 FALSE
AB-10 (25) 4/8/2008 47 FALSE
MW-20 4/10/2008 12 FALSE
CPT-11 (14) 6/20/2007 10 FALSE
3.a. Shapiro-Wilk Test of Normality Parameter: Chloride Normality Test of Parameter Concentrations Original Data (Not Transformed) NO NON-DETECTED RESULTS K = 11 for 22 measurements i x(i) x(n-i+1) x(n-1+1)-x(i) a(n-i+1) b(i) 1 8 110 102 0.459 46.818 2 9.6 100 90.4 0.3156 28.5302 3 10 100 90 0.2571 23.139 4 12 94 82 0.2131 17.4742 5 13 85 72 0.1764 12.7008 6 13 84 71 0.1443 10.2453 7 13 64 51 0.115 5.865 8 14 58 44 0.0878 3.8632 9 17 48 31 0.0618 1.9158 10 18 47 29 0.0368 1.0672 11 24 35 11 0.0122 0.1342 12 35 24 -11 13 47 18 -29 14 48 17 -31 15 58 14 -44 16 64 13 -51 17 84 13 -71 18 85 13 -72 19 94 12 -82 20 100 10 -90 21 100 9.6 -90.4 22 110 8 -102
Sum of b values = 151.753 Sample Standard Deviation = 36.0918 W Statistic = 0.841855 5% Critical value of 0.911 exceeds 0.841855 Evidence of non-normality at 95% level of significance 1% Critical value of 0.878 exceeds 0.841855 Evidence of non-normality at 99% level of significance

3.b. Shapiro-Wilk Test of Normality Parameter: Chloride Normality Test of Parameter Concentrations Natural Logarithm Transformation NO NON-DETECTED RESULTS K = 11 for 22 measurements i x(i) x(n-i+1) x(n-1+1)-x(i) a(n-i+1) b(i) 1 2.07944 4.70048 2.62104 0.459 1.20306 2 2.26176 4.60517 2.34341 0.3156 0.739579 3 2.30259 4.60517 2.30259 0.2571 0.591995 4 2.48491 4.54329 2.05839 0.2131 0.438643 5 2.56495 4.44265 1.8777 0.1764 0.331227 6 2.56495 4.43082 1.86587 0.1443 0.269245 7 2.56495 4.15888 1.59393 0.115 0.183302 8 2.63906 4.06044 1.42139 0.0878 0.124798 9 2.83321 3.8712 1.03799 0.0618 0.0641476 10 2.89037 3.85015 0.959776 0.0368 0.0353198 11 3.17805 3.55535 0.377294 0.0122 0.00460299 12 3.55535 3.17805 -0.377294 13 3.85015 2.89037 -0.959776 14 3.8712 2.83321 -1.03799 15 4.06044 2.63906 -1.42139 16 4.15888 2.56495 -1.59393 17 4.43082 2.56495 -1.86587 18 4.44265 2.56495 -1.8777 19 4.54329 2.48491 -2.05839 20 4.60517 2.30259 -2.30259 21 4.60517 2.26176 -2.34341 22 4.70048 2.07944 -2.62104
Sum of b values = 3.98591 Sample Standard Deviation = 0.92297 W Statistic = 0.888099 5% Critical value of 0.911 exceeds 0.888099 Evidence of non-normality at 95% level of significance 1% Critical value of 0.878 is less than 0.888099 Data is normally distributed at 99% level of significance 4. Non-Parametric Tolerance Interval Parameter: Chloride Original Data (Not Transformed) NO NON-DETECTED RESULTS Total Percent Non-Detects = 0% Background measurements (n) = 22 Maximum Background Concentration = 110 Minimum Coverage = 87.3% Average Coverage = 95.6522%
Upper Tolerance Limit (UTL) = 110

UPPER AQUIFER SUPPLY ZONE STATISTICAL CALCULATION for
CHLORIDE

1. Concentrations (MG/L) Parameter: Chloride Original Data (Not Transformed) NO NON-DETECTED RESULTS Total Measurements: 9 ambient locations (after excluding 1 statistical outlier)
Loc.1 Meas. ND Date Conc. Original DW-103 1 0 (0%) 5/4/2005 31 31
DW-105 1 0 (0%) 5/11/2005 9 9
DW-12 1 0 (0%) 5/12/2005 36 36
DW-38 1 0 (0%) 5/13/2005 36 36
DW-40 1 0 (0%) 5/12/2005 26 26
DW-44 1 0 (0%) 5/19/2005 29 29
DW-55 1 0 (0%) 5/11/2005 20 20
DW-62 1 0 (0%) 5/26/2005 34 34
DW-79 1 0 (0%) 5/6/2005 25 25
1 2005 data used for consistency with data set used in Technical Memorandum, Determination of Ambient TDS Concentrations for the Upper Aquifer (Jacobson James & Associates, June 2008). Wells shown are 2005 sample locations analyzed for chloride.
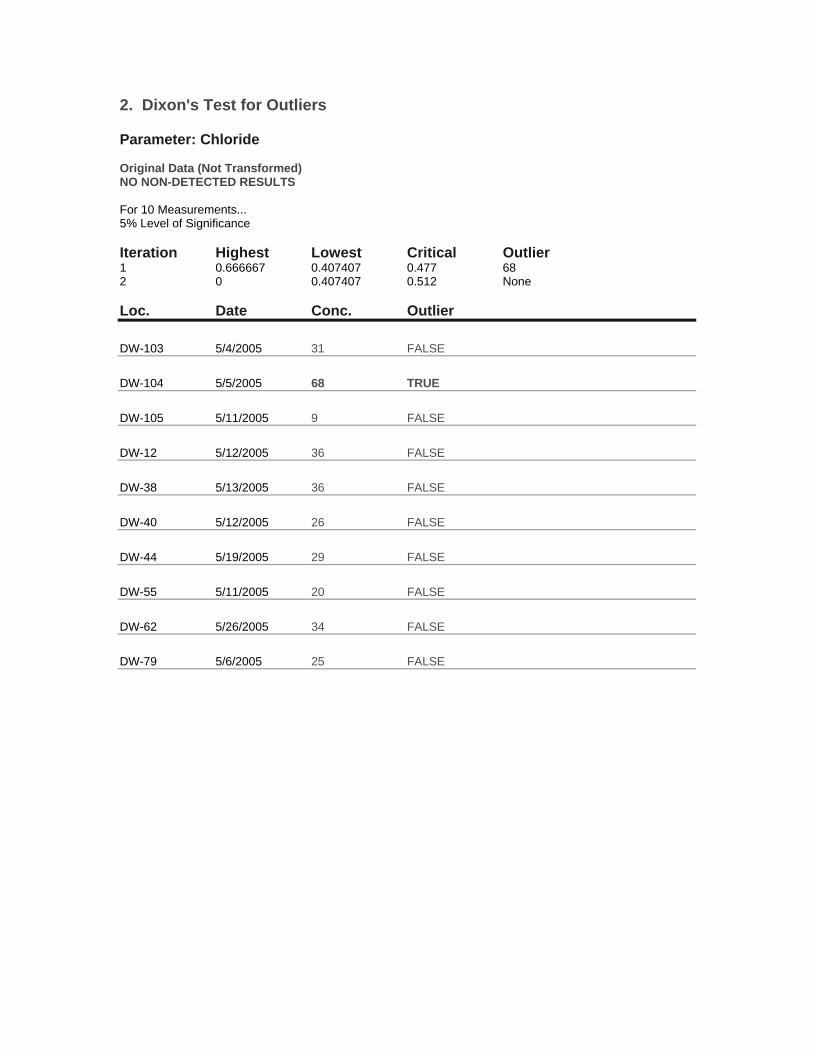
2. Dixon's Test for Outliers Parameter: Chloride Original Data (Not Transformed) NO NON-DETECTED RESULTS For 10 Measurements... 5% Level of Significance Iteration Highest Lowest Critical Outlier 1 0.666667 0.407407 0.477 68 2 0 0.407407 0.512 None Loc. Date Conc. Outlier
DW-103 5/4/2005 31 FALSE
DW-104 5/5/2005 68 TRUE
DW-105 5/11/2005 9 FALSE
DW-12 5/12/2005 36 FALSE
DW-38 5/13/2005 36 FALSE
DW-40 5/12/2005 26 FALSE
DW-44 5/19/2005 29 FALSE
DW-55 5/11/2005 20 FALSE
DW-62 5/26/2005 34 FALSE
DW-79 5/6/2005 25 FALSE

3. Shapiro-Wilks Test of Normality Parameter: Chloride Normality Test of Parameter Concentrations Original Data (Not Transformed) NO NON-DETECTED RESULTS K = 4 for 9 measurements (after excluding 1 statistical outlier) i x(i) x(n-i+1) x(n-1+1)-x(i) a(n-i+1) b(i) 1 9 36 27 0.5888 15.8976 2 20 36 16 0.3244 5.1904 3 25 34 9 0.1976 1.7784 4 26 31 5 0.0947 0.4735 5 29 29 0 6 31 26 -5 7 34 25 -9 8 36 20 -16 9 36 9 -27
Sum of b values = 23.3399 Sample Standard Deviation = 8.7178 W Statistic = 0.895972 5% Critical value of 0.829 is less than 0.895972 Data is normally distributed at 95% level of significance 1% Critical value of 0.764 is less than 0.895972 Data is normally distributed at 99% level of significance

ChlorideProbability Plot of Measured Values for All Wells
Correlation Coefficient = 0.9460850.946085 > 0.912 -- Normality test succeeds at 95% level
-2.0
-1.5
-1.0
-0.5
0.0
0.5
1.0
1.5
2.0N
orm
al Q
uant
iles
0.0 0.5 1.0 1.5 2.0 2.5 3.0 3.5 4.0
Concentration (MG/L x 10) 4. Parametric Tolerance Interval Analysis Parameter: Chloride Original Data (Not Transformed) NO NON-DETECTED RESULTS USEPA 1989 Guidance Tolerance Limit Formula (One-Tailed) Background observations = 9 Background mean = 27.3333 Background standard deviation = 8.7178 One-sided normal tolerance factor (K) at 95% confidence = 3.031
Upper tolerance limit (UTL) = 53.757

APPENDIX C
SUPPLY WELL INFORMATION SUMMARY TABLE

APPENDIX CSUPPLY WELL INFORMATION SUMMARY TABLE
Supply Well Evaluation Technical ReportHilmar Cheese Company
Hilmar, California
Well Approximate Location
Relative to HCCSanitary Seal Adequate
Well Construction Detail Available
Magnitude of impact Observed Data Trends 2005 ‐ 2008Potentially affected by
non‐HCC sourceFinding (see Figure 5‐1)
DW‐201,800 feet northwest of primary lands.
Unknown No well log available TDS/EC, Mn and nitrate exceeds MCLs.Increase in TDS/EC, nitrate and other chemicals.
This well is located potentially downgradient of a Dairy.
6
DW‐211,000 feet northwest of primary lands.
Yes YesExceeds MCL for arsenic and Mn, agricultural for TDS.
Decreasing TDS. Sampled in 2004/2005 and 2008, data consistent
This well is located on or downgradient of a Dairy.
4
DW‐23
900 feet west of the primary lands, on residential property surrounded by irrigated lands.
Yes Yes Exceeds MCL for TDS/EC and nitrate.Increasing concentrations observed between 1995 and 2005, with slight decrease in 2008.
This well is located on or downgradient of a Dairy.
5
DW‐241,200 feet west of primary lands, on residential property.
Yes Yes Exceeds MCL for TDS/EC.Slight increases in TDS/EC between 2005 and 2008.
No other sources apparent.
5
DW‐251,200 feet west of primary lands, on residential property.
Unknown No well log available Exceeds MCL for TDS/EC and nitrate.Slight increases in TDS/EC and slight decrease in nitrate between 2005 and 2008.
No other sources apparent.
5
DW‐27A
1,200 feet west of primary lands, on residential property, down gradient of bass pond.
Yes Yes Exceeds MCL for TDS/EC and nitrate. No prior data.No other sources apparent.
4
DW‐282,800 feet west‐south west of primary lands. Residential property
Unknown No well log available Exceeds MCL for TDS/EC and nitrate.Increase in TDS, chloride, max nitrate and sulfate detection at this location.
No other sources apparent.
6
DW‐29
450 feet east of intersection of Columbus and August, north side of road.
Yes YesExceeds primary MCL for TDS and secondary MCL for nitrate. Exceeds agricultural for chloride, Mn and Na.
Increase in concentration of TDS/EC, chloride, and nitrate. Slight decrease in Mn.
Downgradient of CAFO.
4
DW‐29A
300 feet east, 300 feet north of intersection of Columbus Ave and August Ave.
Yes YesExceeds secondary MCL for TDS and Mn; exceeds primary MCL for nitrate.
Decrease in concentration of Mn, Fe and Na. Increase in chloride; slight increase in TDS.
No other sources apparent.
4
DW‐34South of HCC along August Rd.
Yes YesExceeds primary MCL for arsenic, secondary MCL for TDS, and agricultural for Na and chloride.
Increase in chloride, decrease in Mn, Na and nitrate. Slight increase in TDS.
This well is located on or downgradient of a Dairy.
5
1 of 4

APPENDIX CSUPPLY WELL INFORMATION SUMMARY TABLE
Supply Well Evaluation Technical ReportHilmar Cheese Company
Hilmar, California
Well Approximate Location
Relative to HCCSanitary Seal Adequate
Well Construction Detail Available
Magnitude of impact Observed Data Trends 2005 ‐ 2008Potentially affected by
non‐HCC sourceFinding (see Figure 5‐1)
DW‐35South of HCC along August Rd.
Unknown No well log availableExceeds primary MCL for arsenic, secondary MCL for TDS, Fe and chloride, and agricultural for Mn and Na.
Increase in TDS and chloride. Decrease in Mn and Na.
Adjacent to a dairy (upgradient).
3
DW‐35BSouth of HCC along August Rd.
Unknown No well log availableExceeds secondary MCL for TDS, Fe and nitrate, and agricultural for chloride, Mn and Na.
No change in TDS. Increase in chloride. Decrease in Mn, Na and nitrate
Adjacent to a dairy (upgradient).
3
DW‐38 600 feet west of Site. NoInadequate sanitary
sealSlight exceedance of MCLs for nitrate and TDS/EC.
Slight increase in TDS, chloride noted, other constituents comparable.
Well is reportedly adjacent/down‐gradient of a former CAFO.
6
DW‐38B 800 feet west of Site. Unknown No well log available Slight exceedance of MCLs for nitrate. Results comparable.Well is reportedly upgradient of a former CAFO.
1
DW‐38C 600 feet west of Site. Unknown No well log available Exceeds Federal/State MCL for arsenic. No prior data.Well is downgradient of a former CAFO.
1
DW‐38D 800 feet west of Site. Unknown No well log available Exceeds MCL for arsenic. No prior data.No other sources apparent.
1
DW‐38E100 feet east of primary land.
Unknown No well log availableExceeds primary MCL for arsenic, secondary MCL for Mn, and agricultural for Na.
No prior data.No other sources apparent.
5
DW‐441300 feet south of HCC Site.
NoInadequate sanitary
sealExceeds secondary MCL for Mn, and agricultural for TDS and Na.
Decrease in Na and TDS.No other sources apparent.
4
DW‐47 400 feet southeast of HCC. Unknown No well log available Exceeds primary MCL for nitrate.No change. Lowest chloride and sodium detections.
No other sources apparent.
1
DW‐53100 feet east of primary land, south of Lateral No. 6.
Yes YesExceeds primary MCL for nitrate, secondary MCL for TDS, and agricultural for chloride and Na.
Increase in chloride andTDS. Decrease in Na and nitrate.
No other sources apparent.
3
DW‐54800 feet north of primary lands along Lander.
Yes Yes Exceeds Federal/State MCL for arsenic.No change. Lowest TDS concentration in supply wells sampled.
No other sources apparent.
1
DW‐58Dairy north of primary lands, south of Lateral No. 6.
Unknown No well log availableExceeds primary MCL for nitrate and secondary MCL for TDS.
Slight increase in TDS; increase in chloride; decrease in Na and nitrate.
This well is located on or downgradient of a Dairy.
5
DW‐60 North of primary lands. Unknown No well log availableExceeds primary MCL for nitrate, secondary MCL for TDS, and agricultural for Mn.
Increase in chloride; slight increase in TDS; decrease in Mn and Na.
This well is located on or downgradient of a Dairy.
5
DW‐622,500 feet southwest of primary lands.
Yes YesExceeds Federal MCL for arsenic and agricultural for Mn.
Slight increase in TDS; increase in Na, chloride; decrease in Fe and Mn.
No other sources apparent.
1
2 of 4

APPENDIX CSUPPLY WELL INFORMATION SUMMARY TABLE
Supply Well Evaluation Technical ReportHilmar Cheese Company
Hilmar, California
Well Approximate Location
Relative to HCCSanitary Seal Adequate
Well Construction Detail Available
Magnitude of impact Observed Data Trends 2005 ‐ 2008Potentially affected by
non‐HCC sourceFinding (see Figure 5‐1)
DW‐651600 feet west of primary lands.
Yes YesExceeds primary MCL for nitrate and secondary for TDS and Mn.
Increase in TDS and chloride; decrease in Mn, Na and nitrate.
This well is located on or downgradient of a Dairy.
6
DW‐69 200 ft south of August Rd. Yes YesExceeds secondary MCL for TDS and agricultural for chloride, Mn and Na.
Increase in TDS and Na; decrease in chloride, nitrate and Mn.
This well is located on or downgradient of a Dairy.
5
DW‐74300 ft east of Lander Ave along August Rd.
Yes YesExceeds primary MCL for nitrate and secondary MCL for TDS.
No prior data.Downgradient of a former CAFO.
5
DW‐97 100 feet east of HCC. Yes YesExceeds primary MCL for nitrate and secondary for TDS.
Slight increase in TDS and chloride; decrease in Na.
No other sources apparent.
4
DW‐991900 feet west of primary lands.
Yes YesExceeds primary MCL for nitrate, secondary for TDS, and agricultural for Na.
Slight increase in TDS and nitrate; decrease in Mn and Na.
No other sources apparent.
4
DW‐1011,000 feet northwest of primary lands.
Yes YesGroundwater exceeds Federal MCL for nitrate and agricultural thresholds for TDS/EC.
Slight decrease in TDS. This well is located on or downgradient of a Dairy.
4
DW‐1042,600 ft south of Site, residential area.
Yes Yes TDS/EC, Mn and nitrate exceeds MCLs.Data comparable; slight decrease in concentration indicated for TDS/EC, Mn. and Na.
No other sources apparent.
2
DW‐Clocated along lat no 6 1900 ft west of primary lands.
Unknown No well log availableExceeds primary MCL for nitrate and secondary for TDS.
Increase in chloride and nitrate; slight increase in TDS; decrease in Mn and Na.
No other sources apparent.
4
IN‐1 Located on HCC Site. Yes YesExceeds secondary MCL for TDS and Mn and agricultural for chloride and Na.
Increase in TDS and chloride; decrease in Mn and Na.
No other sources apparent.
3
IN‐2 Located on HCC Site. Yes YesExceeds primary MCL for nitrate, secondary MCL for TDS and Mn, and agricultural for Na.
Increase in nitrate; decrease in TDS, chloride, Mn and Na.
No other sources apparent.
3
IN‐4/DW‐56*400 feet north of primary lands.
No
Screened above the Corcoran Clay;
unknown material from bottom of screen to total
depth
Exceeds primary MCL for nitrate, secondary MCL for TDS, and agricultural for Mn and Na.
Significant increase in TDS and nitrate; increase in chloride; decrease in Mn and Na.
This well is located on or downgradient of a Dairy.
5
IN‐4A*401 feet north of primary lands.
Unknown No well log availableExceeds primary MCL for nitrate, secondary MCL for TDS, and agricultural for Mn and Na.
Significant increase in TDS and nitrate; increase in chloride; decrease in Mn and Na.
This well is located on or downgradient of a Dairy.
5
3 of 4

APPENDIX CSUPPLY WELL INFORMATION SUMMARY TABLE
Supply Well Evaluation Technical ReportHilmar Cheese Company
Hilmar, California
Well Approximate Location
Relative to HCCSanitary Seal Adequate
Well Construction Detail Available
Magnitude of impact Observed Data Trends 2005 ‐ 2008Potentially affected by
non‐HCC sourceFinding (see Figure 5‐1)
IN‐71400 feet north of primary land.
Yes YesExceeds primary MCL for arsenic, secondary MCL for TDS, chloride and Mn, and agricultural for Na.
Increase in TDS, chloride and nitrate; decrease in Mn and Na. Max chloride detection.
This well is located potentially downgradient of a Dairy.
2
IW‐3/DW‐221800 feet west of primary lands.
Unknown No well log availableExceeds primary MCL for nitrate, secondary MCL for TDS, and agricultural for Mn.
Increase in TDS, nitrate and chloride; decrease in Mn, Fe and Na.
This well is located on or downgradient of a Dairy.
6
IW‐4/DW‐32located 400 feet southwest of primary lands.
Yes YesExceeds secondary MCL for TDS and Fe and agricultural for chloride, Mn and Na.
No change in TDS. Increase in chloride; decrease in Mn, Na and nitrate
No other sources apparent.
3
IW‐192,500 feet west of primary lands.
Yes YesExceeds primary MCL for nitrate, secondary MCL for TDS, and Taste and Odor for sodium.
Results comparable.This well is located on or downgradient of a Dairy.
4
IW‐20Immediately north of primary land.
Unknown No well log availableExceeds primary MCL for nitrate, arsenic, secondary MCL for TDS and Fe, and agricultural for Mn and chloride.
Slight increase in TDS; increase in chloride; decrease in Fe, Mn and Na. Highest iron and potassium detections.
This well is located on or downgradient of a Dairy.
5
IW‐21Located along Lateral No. 6, east of HCC.
Unknown No well log availableExceeds primary MCL for nitrate and secondary MCL for TDS.
Increase in TDS and chloride; decrease in Na.
No other sources apparent.
4
Screened above the Corcoran ClayScreened across the Corcoran ClayScreened below the Corcoran ClayUnknown
* IN‐04/DW‐56 and IN‐04A wells are manifolded together, a single blended water sample was collected
4 of 4