
Supply-Side Policy: Short-Run Options Chapter 16 Copyright © 2010 by the McGraw-Hill Companies,...
40
Supply-Side Policy: Short-Run Options Chapter 16 Copyright © 2010 by the McGraw-Hill Companies, Inc. All rights reserved. McGraw-Hill/Irwin
-
Upload
tyrone-johns -
Category
Documents
-
view
214 -
download
0
Transcript of Supply-Side Policy: Short-Run Options Chapter 16 Copyright © 2010 by the McGraw-Hill Companies,...
Supply-Side Policy: Short-Run OptionsChapter 16
Copyright © 2010 by the McGraw-Hill Companies, Inc. All rights reserved.McGraw-Hill/Irwin

16-2
Supply-Side Policy
• Any policies that alter the willingness or ability to supply goods at various price levels will shift the aggregate supply curve– How does the aggregate supply curve affect macro
outcomes?– How can the aggregate supply curve be shifted?

16-3
Aggregate Supply
• The macro economy experienced stagflation in the 1970s
• Stagflation: The simultaneous occurrence of substantial unemployment and inflation
• No shift of the aggregate demand curve can solve inflation and unemployment at the same time
16-4
Aggregate Supply
• The shape and shifts in aggregate supply hold the clues on how stagflation may occur
• Aggregate supply: The total quantity of output that producers are willing and able to supply at alternative price levels in a given time period, ceteris paribus
16-5
Shape of the AS Curve
• The response of producers to an AD shift is expressed in the slope and position of the AS curve
• There are three views concerning the shape– Keynesian AS– Monetarist AS– Hybrid AS

16-6
Keynesian AS
• Little risk of inflation during a recession
• Producers increase output, not prices, when aggregate demand picks up
• Inflation becomes a problem only if demand increases beyond capacity

16-7
Monetarist AS
• Changes in money supply affect prices but not output
• Rising prices don’t entice producers to increase output because costs rise just as fast
• AS is vertical and located at full employment

16-8
Hybrid AS
• At low rates of output AS is horizontal
• At high rates of output AS is nearly vertical
• In between, AS is gently upward sloping
• The closer the economy is to capacity, the greater the risk that fiscal or monetary stimulus will cause inflation

16-9
The Inflation-Unemployment Tradeoff
• Fiscal and monetary policies cannot reduce unemployment and inflation at the same time
• Because AS curve is upward-sloping– Rightward shifts of AD increase both prices and
output– Leftward shifts of AD decrease prices and output

16-10
The Phillips Curve
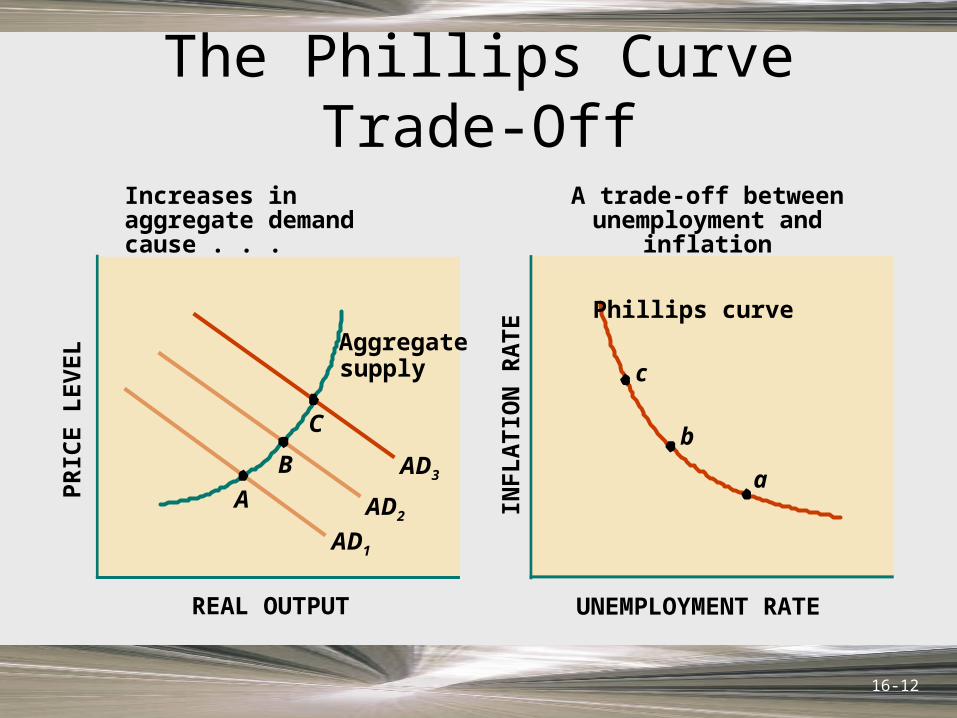
• Phillips curve: A historical (inverse) relationship between the rate of unemployment and the rate of inflation; commonly expresses a trade-off between the two
• The trade-off originates in the upward-sloping AS curve

16-11
The Phillips Curve
0 1 2 3 4 5 6 7
11
10
9
8
7
6
5
4
32
1
Unemployment Rate (percent)
Infl
atio
n R
ate
(per
cen
t)
B
A
C
16-12
The Phillips Curve Trade-Off
UNEMPLOYMENT RATE
INF
LA
TIO
N R
AT
E
A trade-off between unemployment and inflation
REAL OUTPUT
PR
ICE
LE
VE
L
Increases in aggregate demand cause . . .
Aggregatesupply
B
C
AD1
AD2A
AD3
Phillips curve
c
b
a

16-13
The Inflationary Flashpoint
• Phillips curve indicates there is bound to be a trade-off between unemployment and inflation at some point in economic expansions and contractions
• Inflationary flashpoint: The rate of output at which inflationary pressures intensify; point of inflection on AS curve

16-14
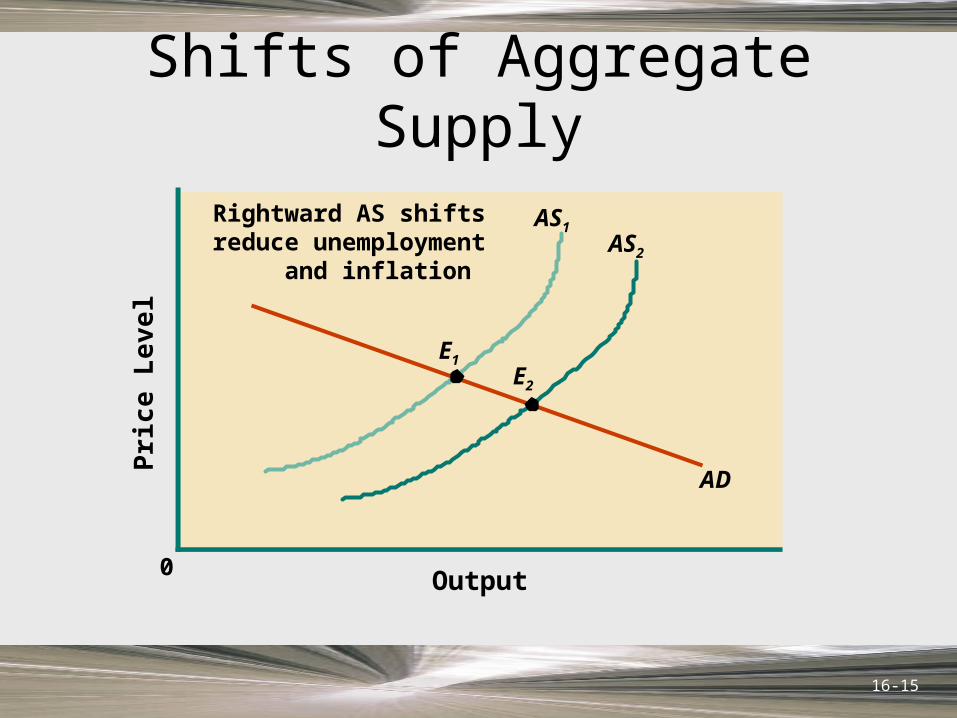
Shifts of the AS Curve
• Many economists argue that the economy can attain lower levels of unemployment without higher inflation
• Only a rightward shift of the AS curve can reduce unemployment and inflation at the same time
16-15
Output0
Pri
ce
Lev
el
Shifts of Aggregate Supply
AS1
E1
AD
AS2
E2
Rightward AS shifts reduce unemployment and inflation

16-16
Phillips Curve Shift
• The Phillips curve shifts left when the AS curve shifts right, and vice versa
• The unemployment-inflation trade-off eases when the Phillips curve shifts to the left

16-17
1 2 3 4 5 6 7 8Unemployment Rate (percent)
Infl
atio
n R
ate
(per
cen
t)
Phillips Curve Shift
4
2
a
b
PC2
PC1 Rightward AS shifts cause leftward Phillips curve shifts

16-18
Leftward AS Shifts: All Bad News
• Leftward AS shifts create stagflation
• Supply-side shocks can shift the AS curve to the left
• Leftward shifts of aggregate supply cause rightward shifts in the Philips curve
16-19
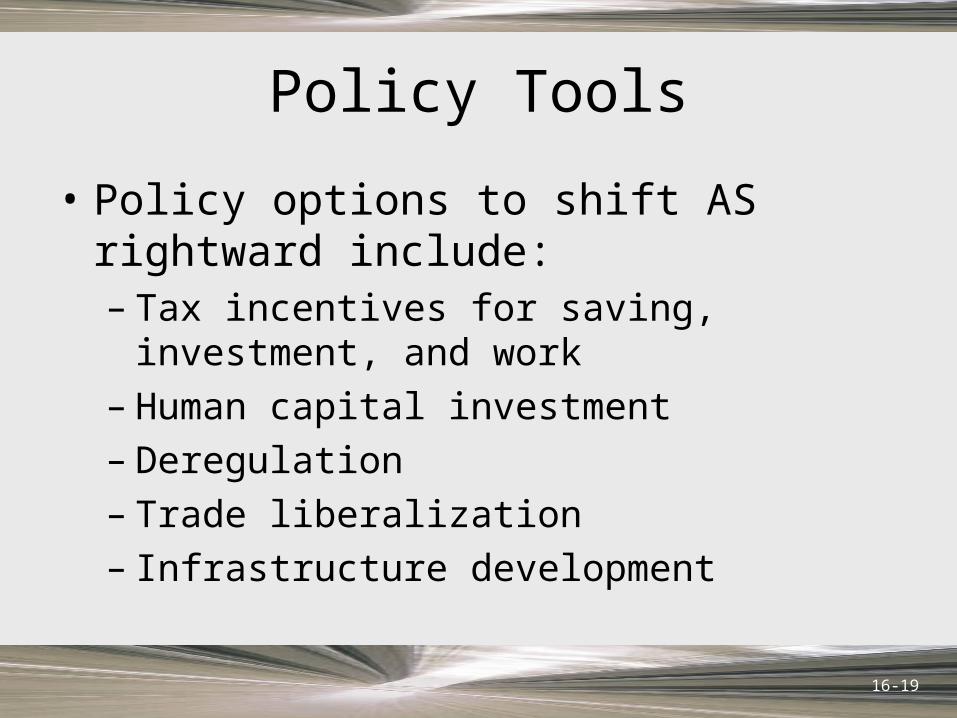
Policy Tools
• Policy options to shift AS rightward include:– Tax incentives for saving, investment, and work– Human capital investment– Deregulation– Trade liberalization– Infrastructure development
16-20
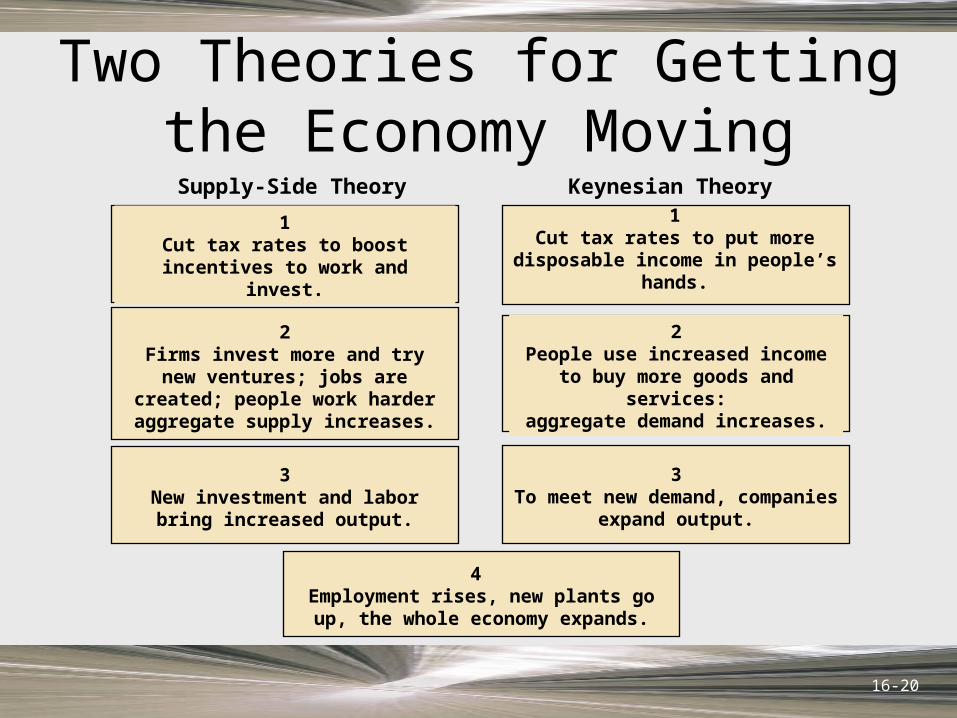
Two Theories for Getting the Economy Moving
1Cut tax rates to boost incentives to
work and invest.
1Cut tax rates to put more disposable
income in people’s hands.
2People use increased income to buy
more goods and services:aggregate demand increases.
2Firms invest more and try new
ventures; jobs are created; people work harder aggregate supply
increases.
3New investment and labor
bring increased output.
3To meet new demand, companies
expand output.
4 Employment rises, new plants go up, the
whole economy expands.
Supply-Side Theory Keynesian Theory
16-21
Tax Incentives
• In Keynesian economics, tax cuts are used to increase aggregate demand
• Direct effects of taxes on the supply of goods are the concern of supply-side economists
• Taxes not only alter disposable income but also affect incentives to work and produce

16-22
Marginal Tax Rates
• Supply-side theory places special emphasis on marginal tax rates– Marginal Tax Rate: The tax rate imposed on the
last (marginal) dollar of income
• If the marginal tax rate is high, there is less incentive to work

16-23
Marginal Tax Rates
• Progressive marginal tax rates discourage entrepreneurship
• Growth rate, investment, and employment of small businesses are affected by marginal tax rates
• Corporate investment decisions are also affected by corporate tax rates
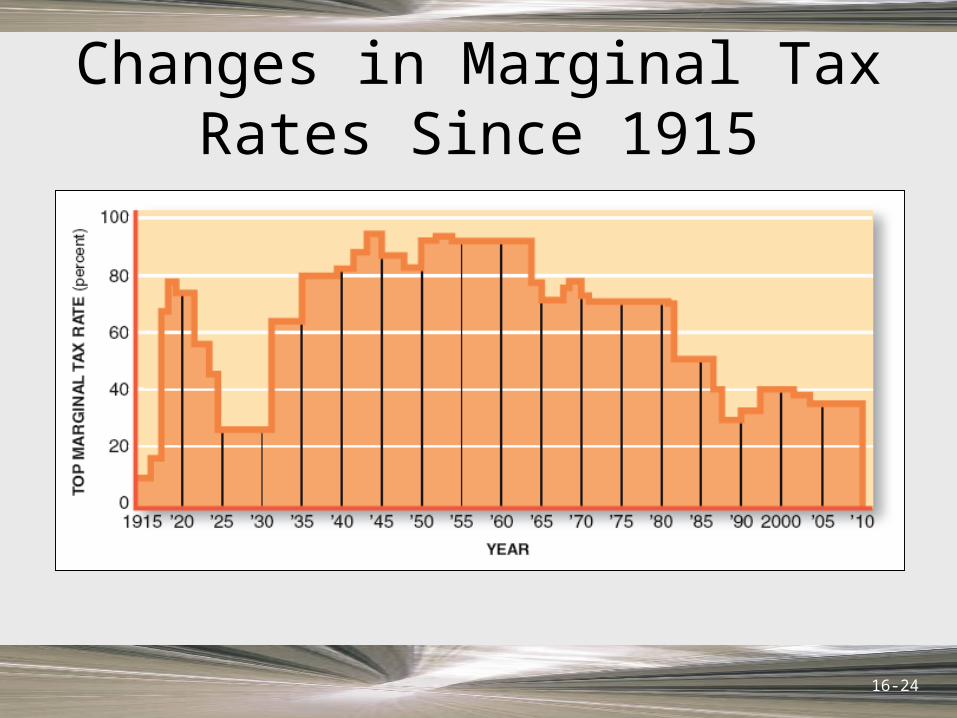
16-24
Changes in Marginal Tax Rates Since 1915

16-25
Tax-Induced Supply Shifts
• A reduction in marginal tax rates shifts the aggregate supply curve to the right
• Work effort, entrepreneurship, and investment increase
• Tax rebates do not shift AS, because they are a one-time windfall and do not effect marginal tax rates• Tax rebate: A lump-sum refund of taxes paid
16-26
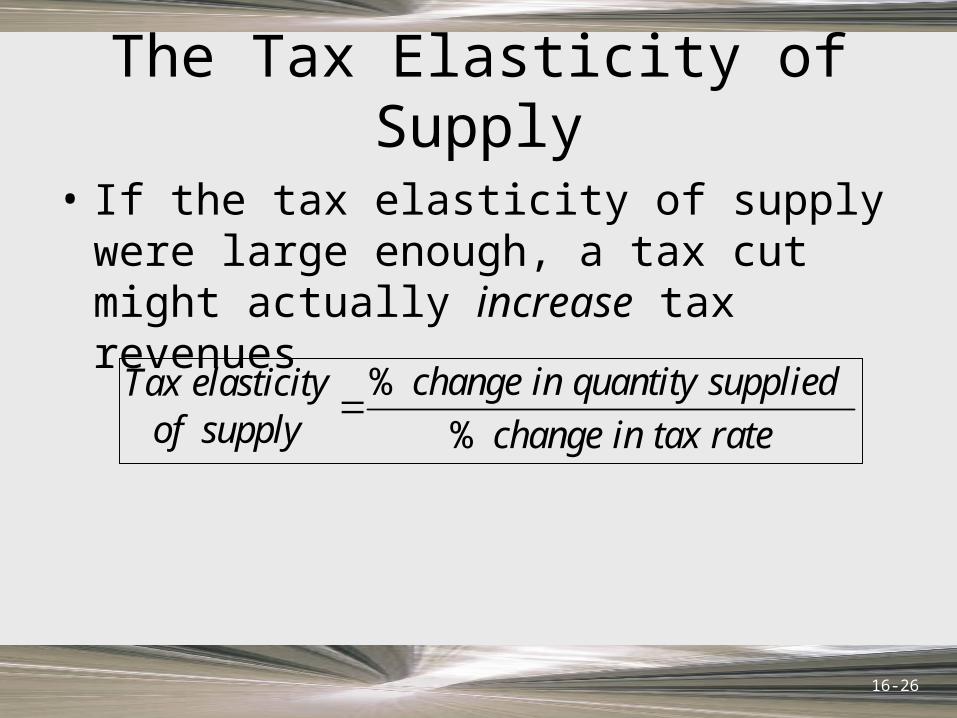
The Tax Elasticity of Supply
• If the tax elasticity of supply were large enough, a tax cut might actually increase tax revenues
% %
change in quantity suppliedTax elasticityof supply change in tax rate

16-27
Savings and Investment Incentives
• Supply-side economists favor tax incentives that encourage saving
• Tax incentives for investment are an alternative lever for shifting aggregate supply– Examples include investment tax credits and
cutting capital gains tax rates

16-28
Human Capital Investment
• Tax incentives to businesses that offer worker training are a viable policy tool for future shifts in aggregate supply
• Expansion and improvement of the education system through increases in education spending will develop human capital gradually

16-29
Human Capital Investment
• Addressing discriminatory barriers through affirmative action programs can reduce artificial barriers between job seekers and job openings
• Restructuring of transfer payments can reduce impact on labor supply

16-30
Deregulation
• Government regulations limit the flexibility of producers and tend to raise production costs, shifting AS to the left
• Government intervention in factor markets increases the cost of supplying goods and services in many ways

16-31
Minimum Wage and Mandatory Benefits
• Minimum-wage laws increase the cost to employers of hiring additional workers, shifting the aggregate supply curve leftward
• By requiring employers to provide specific fringe benefits, the government increases the cost of doing business

16-32
Occupational Health and Safety
• OSHA, the Occupational Health and Safety Administration, forces employers to conform to certain minimum safety conditions at workplaces
• The additional costs shift the aggregate supply curve to the left

16-33
Product Markets
• Government regulations also raise costs in product markets
• Regulation of transportation costs constrains producer’s ability to respond demand increases
• Food and drug standards, enforced by the Food and Drug Administration (FDA), cause companies to incur additional costs as well
16-34
Reducing Costs
• The basic contention of supply-side economists is that the regulatory costs are now too high
• They favor deregulating the production process in order to shift aggregate supply to the right

16-35
Easing Trade Barriers
• In the factor markets, reducing tariffs or quotas on imports of production inputs decrease production costs and increase aggregate supply
• In the product markets, foreign suppliers increase the quantity of output available at any given price level, helping flatten the AS curve

16-36
Easing Trade Barriers
• Free trade pacts like the North American Free Trade Agreement (NAFTA) tend to shift aggregate supply rightward
• Allowing immigration of foreign-born workers can increase the pool of skilled labor and help shift the aggregate supply curve to the right

16-37
Infrastructure Development
• Improving the nation’s infrastructure reduces costs of supplying goods and services
• Infrastructure: The transportation, communications, education, judicial, and other institutional systems that facilitate market exchanges

16-38
Expectations
• Because investment is always a bet on future economic conditions, expectations directly affect the shape of the AS curve

16-39
Rebuilding America
• The output of the American economy depends on public as well as private investment
• Declining infrastructure investment reduces actual and potential output
• Infrastructure improvements will increase aggregate supply, boosting both short-run and long-run economic outcomes
Supply-Side Policy: Short-Run OptionsEnd of Chapter 16
Copyright © 2010 by the McGraw-Hill Companies, Inc. All rights reserved.McGraw-Hill/Irwin