Supply Chain Transformation Strategy Technology Update ...
27
Transcript of Supply Chain Transformation Strategy Technology Update ...


Supply Chain Transformation Strategy
Current Focus
Technology Update
Strategic Sourcing Results
Page 2

WSSC 2016 Procurement Spend was $550M 780 Active Suppliers 1300 Department requests 1020 POs Processed 200 Solicitations 530 Change orders 160 Task Orders $6.5M in P Card spend on12,000 transactions Complaints about The process – “Infinite” Our commitment – “Continuous Improvement”
Page 3

Page 4

• Aggressive Stretch Objectives • Total Cost of Ownership
Perspective • ROIC / ROE goals • Objectives Shared Across Entire
Organization • Incentives / Consequences • Supplier Performance Metrics
• Spend Analysis & Category Management • Demand Aggregation • Electronic RFIs, RFPs • Reverse Auctions • Optimization & Decision Support • Contract Mgmt & Compliance • Results Tracking & Reporting • Supplier Performance Evaluation • Project Mgmt & Executive Dashboard
• Structure that works in your culture • Cross-functional involvement • Speaking with One Voice • Commitment to Continuous Learning • Professional Career Track • Governance
• Strategic Sourcing • Negotiations Management • All Spend Categories in Scope • Risk Management • Partnerships with Suppliers • Supplier Recognition • Contract Management & Supplier Centric Strategies • Cost Reduction Planning / Tracking • Budget Adjustments to Preserve Cost Reductions • Low-Cost Country Sourcing • Consortium Buying • Asset Recovery • Selective Outsourcing
• Core Part of Corporate Strategy
Objectives Best Practices
Optimized Organization
Innovation & Technology
Procurement Role
Good Leadership
• The Right Leader • Leadership Culture at all Levels • Bias to Action and Results
$
Blue = Underway Red = To Be Completed Black = Not planned
Transformation Initiatives Across Six Key Dimensions for Sustainable Supply Chain Management Transformation
The “Transformation Roadmap” has brought us through three years of change and development. Evaluating where we are - “now is the time” to evaluate - what has happened and what needs to happen next.

Prudent Financial Management
Reduce/Mitigate Rate Increases
Find resources for service and system improvement
Communicate credibly with stakeholders
Reinforce Public Trust
Page 6

Increase process efficiencies through elimination, simplification, & standardization of procurement activities
Foster organizational behaviors designed
towards cross-functional collaborative teams with common procurement goals
Reduce the Total Cost of Operations for WSSC to help ensure financial stability and to minimize rate increases
Page 7

• Benchmark procurement best practices • Set continuous improvement goals • Engage stakeholders in the decision making process
• Assess existing supplier relationships • Evaluate supplier performance • Assess and promote employee development
• Simplify and streamline procurement • Manage total cost of operations • Leverage client collaboration
• Support WSSC Strategic Priorities • Align with individual goals • Support SLMBE goals • Support local commerce
• Identify possible cost reduction opportunities • Target strategic suppliers • Assess supply needs
Best In
Class
Operational Excellence
e-catalogs & Electronic approvals
Procure-to-Pay Technology Contractor Performance
Evaluation
Strategic Sourcing | Contracting Officer Representatives I Cross functional
Collaboration
Supply Chain Transformation (proof of concept)
Sustain
Evaluate
Leverage
Align
2014 2013
2016 2015
2017
2019
2018
Assess
Page 8

• Enhance strategic and tactical skillset
• Lead strategic sourcing teams with seamless execution of sourcing strategies
• Contracting Officer
Representatives (CORs) emerge as Subject Matter Experts
• Facilitate professional certification
• Refine Intake Process
• Reduce cycle times
• Improve supplier performance
• Support SLMBE goals & process efficiencies
• Identify new sourcing/cost savings opportunities
• Integrate strong data analytics
• Implement Oracle Procure-To-Pay
• Implement Procurement Dashboard
• Implemented Contractor Performance Evaluation Tool
People Process Technology
Page 9
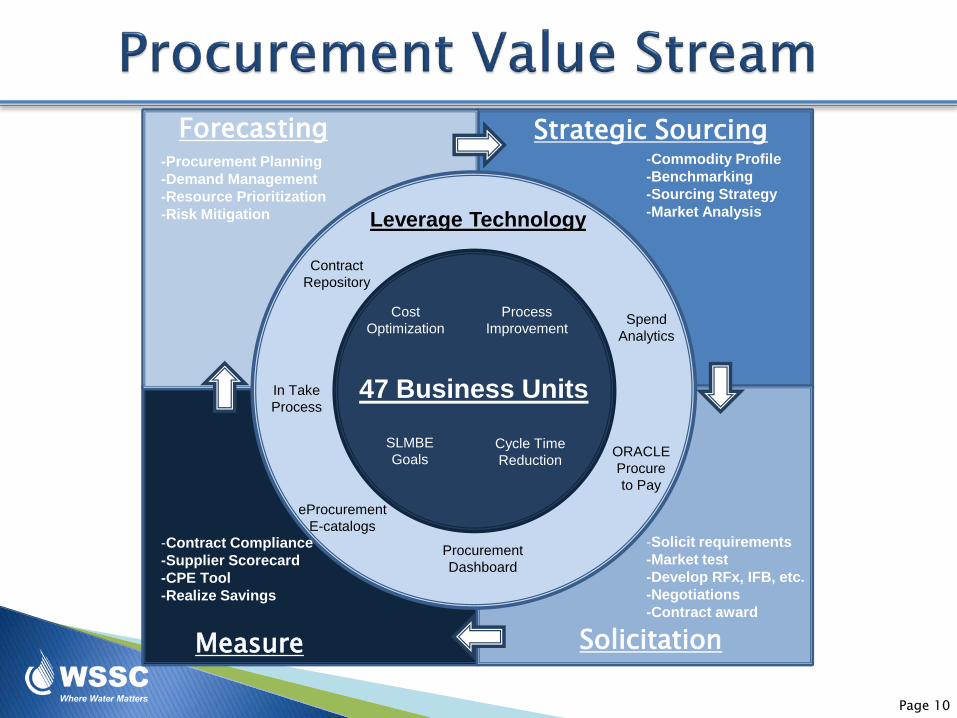
Strategic Sourcing
Solicitation
Forecasting
Measure
47 Business Units
-Commodity Profile -Benchmarking -Sourcing Strategy -Market Analysis
-Solicit requirements -Market test -Develop RFx, IFB, etc. -Negotiations -Contract award
-Procurement Planning -Demand Management -Resource Prioritization -Risk Mitigation
-Contract Compliance -Supplier Scorecard -CPE Tool -Realize Savings
ORACLE Procure to Pay
In Take Process
Procurement Dashboard
Contract Repository
Cycle Time Reduction
SLMBE Goals
Spend Analytics
Process Improvement
Cost Optimization
Leverage Technology
eProcurement E-catalogs
Page 10

Seamless document management and transparency from procurement planning to invoice payment.
Benefits: ◦ Improved coordination between Procurement and User
Departments ◦ Improved alignment of SLMBE process ◦ Reduced errors in processing requests ◦ Reduced cycle time ◦ Simplified invoicing process ◦ Better data
Business Need Intake Requisition Sourcing Contract Purchase Order Receiving Invoicing Pay
Page 11

Page 12

Page 13

Page 14
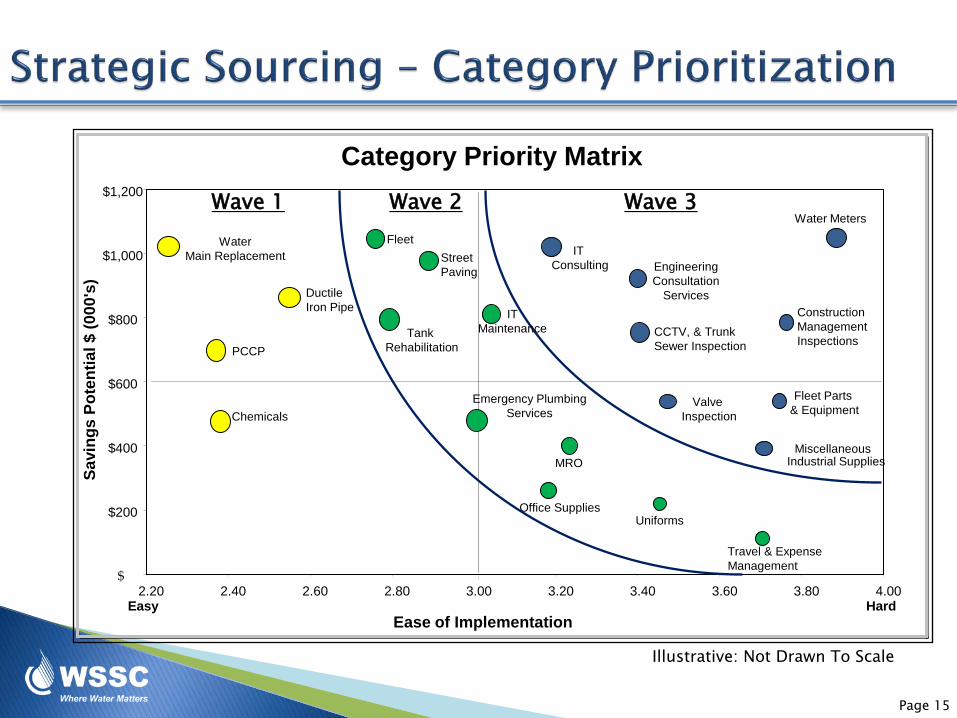
Category Priority Matrix
CCTV, & Trunk Sewer Inspection
Engineering Consultation
Services
Water Meters
Street Paving
Fleet IT
Consulting
Emergency Plumbing Services
Valve Inspection
Tank Rehabilitation
Miscellaneous Industrial Supplies
Construction Management Inspections
Water Main Replacement
Fleet Parts & Equipment
Uniforms Office Supplies
Chemicals
Travel & Expense Management
$
$200
$400
$600
$800
$1,000
$1,200
2.20 2.40 2.60 2.80 3.00 3.20 3.40 3.60 3.80 4.00
Ease of Implementation
Savi
ngs
Pote
ntia
l $ (0
00's
)
Easy Hard
Wave 1 Wave 2 Wave 3
IT Maintenance
MRO
PCCP
Ductile Iron Pipe
Illustrative: Not Drawn To Scale
Page 15

Page 16
Annualized - Expense Awarded - Capital
Cost Reductions 9,437,624$ 7,982,968$ Cost Avoidances 4,735,404$ 12,877,030$ Total Value Add 14,173,028$ 20,859,998$ Market / Currency Impacts (+ / -) -$ -$ Total Net Benefits (CR / CA) 14,173,028$ 20,859,998$
New Discounts Taken (CR)Improved Net Terms (improved cash balances)
Inventory ConsignmentInventory Min / Max reductions
Other Revenue Enhancement (sale of scrap, etc.)
Inve
stmen
t Total Investment, comprised of: Advisors (training, coaching, best practices, communications, transformation initiatives across six dimensions, etc.) + Team Costs (internal, part-time WSSC costs supporting SCM Transformation)
Ultra conservative: Only Cost Reduction on Expenses compared to Investment
CR
/ C
A
Cost Reduction / Cost Avoidance
Supply Chain Management Transformation: NOV 1, 2013 TO DEC 31, 2015
Inve
ntor
y Inventory Management (Improved Cash Balances)
Paym
ent
Term
s Payment Terms (Improved Discounts & Improved Cash Balances)
$2,964,984.00
318%
Return on Investment - alternatives
RO
I

Annualized - Expense Awarded - Capital
Cost Reductions 1,155,592$ 6,985,233$ Cost Avoidances 1,397,709$ 6,180,465$ Total Value Add 2,553,301$ 13,165,698$ Market / Currency Impacts (+ / -) -$ -$ Total Net Benefits (CR / CA) 2,553,301$ 13,165,698$
New Discounts Taken (CR)Improved Net Terms (improved cash balances)
Inventory ConsignmentInventory Min / Max reductions
Other Revenue Enhancement (sale of scrap, etc.)
Inve
ntor
y Inventory Management (Improved Cash Balances)
FY 2016
CR
/ C
A
Cost Reduction / Cost Avoidance
Paym
ent
Term
s Payment Terms (Improved Discounts & Improved Cash Balances)
Page 17
Key Projects: 1. South Adelphi 60" Transmission WMR & Relocation 2. Bradmoor Drive 20" Transmission Water Main Replacement 3. Refuse Removal Services
Page 18
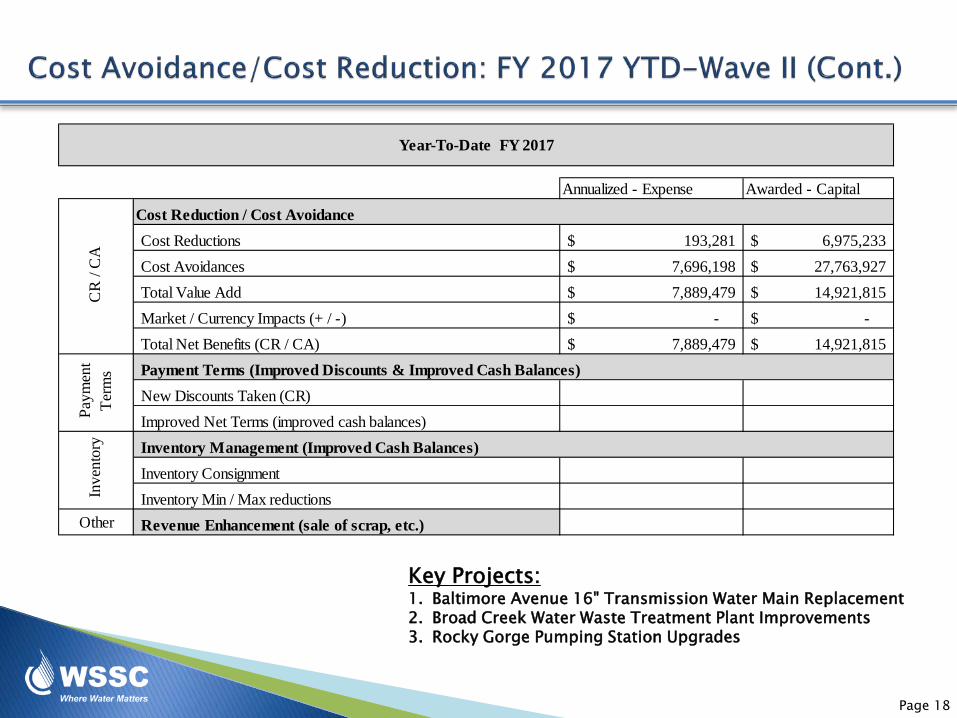
Key Projects: 1. Baltimore Avenue 16" Transmission Water Main Replacement 2. Broad Creek Water Waste Treatment Plant Improvements 3. Rocky Gorge Pumping Station Upgrades
Annualized - Expense Awarded - Capital
Cost Reductions 193,281$ 6,975,233$ Cost Avoidances 7,696,198$ 27,763,927$ Total Value Add 7,889,479$ 14,921,815$ Market / Currency Impacts (+ / -) -$ -$ Total Net Benefits (CR / CA) 7,889,479$ 14,921,815$
New Discounts Taken (CR)Improved Net Terms (improved cash balances)
Inventory ConsignmentInventory Min / Max reductions
Other Revenue Enhancement (sale of scrap, etc.)
Inve
ntor
y Inventory Management (Improved Cash Balances)
Paym
ent
Term
s Payment Terms (Improved Discounts & Improved Cash Balances)
Year-To-Date FY 2017
CR
/ C
A
Cost Reduction / Cost Avoidance

Objectives
Key Strategies
Results
• Streamline and improve the acquisition process for acquiring fleet vehicles • Develop replacement strategy that optimizes fleet vehicle’s life and usability • Standardize the fleet based upon job function and impact on repairs and
maintenance • Reduce the total cost of ownership for each vehicle • Develop a Total Cost of Ownership (TCO) to track TCO on a ongoing basis
• Review the vehicle acquisition process for opportunities to reduce purchasing times
• Develop a methodology to standardize the fleet by job function and class of vehicle
• Mapped processes and reduced acquisition timeline by six months • Completed Total Cost model for all elements of Fleet management –
acquisition, operation, maintenance, repair • Completed strategic sourcing of CCTV and Jet Rodder trucks resulting in $1M
in savings • Optimization has generated an additional $8M in savings
Fleet
Page 19

Page 20

Our Team Our Leadership Procurement Cycle Times Reduction Activities Strategic Sourcing Teams Successes The Supply Chain Steering Committee Our SLMBE Partners Continued staff and leadership development Our Technology Partners Our Customers Our Company
Page 21

22
QUESTIONS

Page 23

Category Objective Strategy Results
Water & Wastewater Chemicals
• Ensure continuity of operations and reduce supply risk
• Establish alternatives for single sourced Polyaluminum Chloride (PACL)
• Develop sourcing options for Methanol
• Update specs & testing protocols • Expand supply base & identify
alternative products • Leverage volume to reduce cost • Negotiate with single source suppliers
• Bulk Chemicals – reduced costs by 9.5% resulting in $414K in annual savings
• PACL Sole Source – negotiated $340K reduction
Tank Rehabilitation
• Develop a Repair & Rehab Schedule • Reduce cost for tank inspection • Streamline contracting process • Increase contractor pool
• Establish a contracting approach to meet operating schedules
• Conduct a formal sourcing event to promote competitive pricing
• Execute a sourcing plan that focuses on a phased rehabilitation schedule
• Reduced lead times by 3 to 6 months
• Reduced inspection & design re-work
• Establish a pool of qualified contractors and sub-contractors
• Task 1: $440K savings • Task 2: $262K savings
Page 24
Appendix

Category Objective Strategy Results
Water Main Replacement
• Reduce the costs of design and construction for water main repair, replacement & rehabilitation (WMR3)
• Streamline process and reduce time to award of WMR3 contracts
• Identify best practices in contracting • Evaluate potential for contracting with
a defined pool of prequalified suppliers • Implement processes to reduce
change orders, errors in design, and reduced cycle times from bid-to-award
• Drive competition to reduce costs
• 10 Qualified Suppliers to provide water main replacement services for two years.
• 12 Awarded tasks • $10.1M in cost avoidance to date • $753K in cost reduction to date • Procurement Cycle Time Reduced
from 180 days to 41 days.
Ductile Iron Pipe
• Seek value-added services • Ensure a reliable supply of pipe /
materials to support the program and emergency repairs
• Identify / specify new pipe materials – improving quality and reliability
• Identify & Evaluate pipe market through (RFI)
• Encourage bidders to present innovative approaches via RFP
• Leverage WSSC’s category spend
• Price Reductions – New Contract • On small diameter pipe @ 75% of
spend = $200K per year • On large diameter = $400K per
year • Pricing Stability - first 18 months
of contract • WSSC furnishes materials for
University City III project - immediate savings of $194K
Page 25
Appendix

Low (3%)
Avg.(5%)
High(10%)
Street Paving & Repair 35,000,000$ 1,050,000$ 1,750,000$ 3,500,000$ Direct
Tank Rehabilitation 15,000,000$ 450,000$ 750,000$ 1,500,000$ Indirect
Fleet 14,819,000$ 444,570$ 740,950$ 1,481,900$ Indirect
IT Maintenance 5,000,000$ 150,000$ 250,000$ 500,000$ Indirect
MRO 4,800,000$ 144,000$ 240,000$ 480,000$ Indirect
Cleaning & Restoration 1,200,000$ 36,000$ 60,000$ 120,000$ Direct
Office Supplies 750,000$ 22,500$ 37,500$ 75,000$ Indirect
Uniforms 555,000$ 16,650$ 27,750$ 55,500$ Indirect
Travel Management(Displaced Customers & Employees)
480,000$ 14,400$ 24,000$ 48,000$ Direct
Total Spend 77,604,000$ 2,328,120$ 3,880,200$ 7,760,400$
Estimated Savings Range Category
Estimated Annual Spend
Customer Impact
1) $702K combined savings for Task 1 & Task 2. 2). Actual Fleet savings are $13.2M over a 5 year period.
2
Page 26
Appendix
1
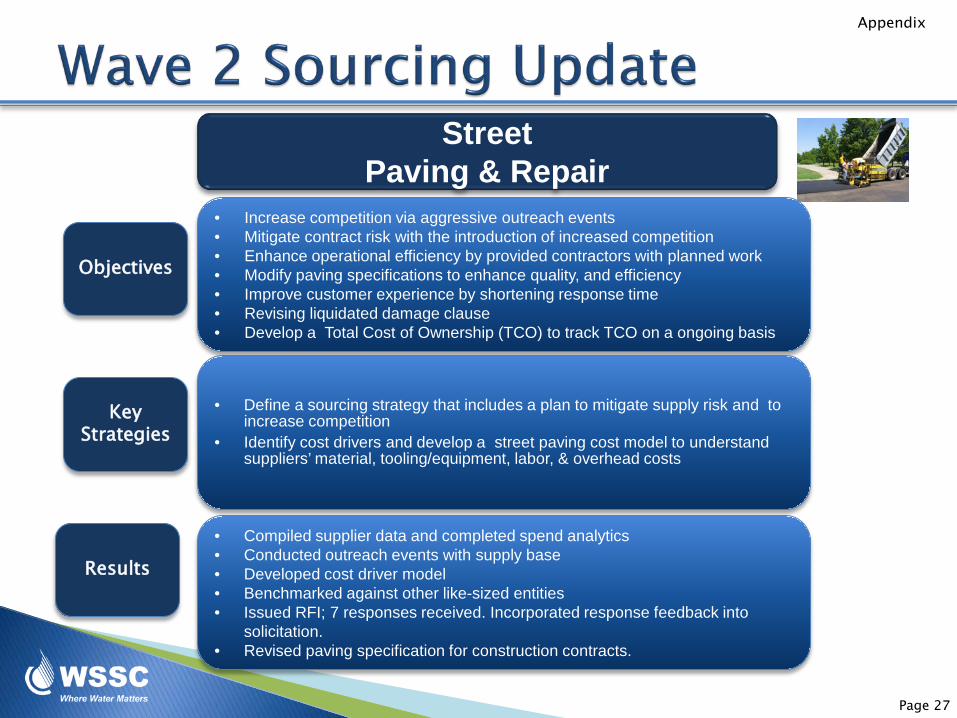
Objectives
Key Strategies
Results
• Increase competition via aggressive outreach events • Mitigate contract risk with the introduction of increased competition • Enhance operational efficiency by provided contractors with planned work • Modify paving specifications to enhance quality, and efficiency • Improve customer experience by shortening response time • Revising liquidated damage clause • Develop a Total Cost of Ownership (TCO) to track TCO on a ongoing basis
• Define a sourcing strategy that includes a plan to mitigate supply risk and to increase competition
• Identify cost drivers and develop a street paving cost model to understand suppliers’ material, tooling/equipment, labor, & overhead costs
• Compiled supplier data and completed spend analytics • Conducted outreach events with supply base • Developed cost driver model • Benchmarked against other like-sized entities • Issued RFI; 7 responses received. Incorporated response feedback into
solicitation. • Revised paving specification for construction contracts.
Street Paving & Repair
Page 27
Appendix