Supply Chain Strategy, Product Characteristics, and ... · 668 Supply Chain Strategy and Product...
30
Decision Sciences Volume 40 Number 4 November 2009 C 2009, The Author Journal compilation C 2009, Decision Sciences Institute Supply Chain Strategy, Product Characteristics, and Performance Impact: Evidence from Chinese Manufacturers ∗ Yinan Qi † University of International Business and Economics, School of Business, No. 10, Huixing Dongjie, Chaoyang District, Beijing, China, 100029; e-mail: [email protected] Kenneth K. Boyer Management Sciences Department, Fisher College of Business, Ohio State University, Columbus, OH, 43210, e-mail: [email protected] Xiande Zhao Department of Decision Sciences and Managerial Economics, The Chinese University of Hong Kong, Leung Kau Kui Building, CUHK, Shatin, Hong Kong, e-mail: [email protected] ABSTRACT Supply chain management has become one of the most popular approaches to en- hance the global competitiveness of business corporations today. Firms must have clear strategic thinking in order to effectively organize such complicated activities, resources, communications, and processes. An emerging body of literature offers a framework that identifies three kinds of supply chain strategies: lean strategy, agile strategy, and lean/agile strategy based on in-depth case studies. Extant research also suggests that supply chain strategies must be matched with product characteristics in order for firms to achieve better performance. This article investigates supply chain strategies and em- pirically tests the supply chain strategy model that posits lean, agile, and lean/agile approaches using data collected from 604 manufacturing firms in China. Cluster anal- yses of the data indicate that Chinese firms are adopting a variation of lean, agile, and lean/agile supply chain strategies identified in the western literature. However, the data reveal that some firms have a traditional strategy that does not emphasize either lean or agile principles. These firms perform worse than firms that have a strategy focused on lean, agile, or lean/agile supply chain. The strategies are examined with respect to product characteristics and financial and operational performance. The article makes significant contributions to the supply chain management literature by examining the supply chain strategies used by Chinese firms. In addition, this work empirically tests the applicability of supply chain strategy models that have not been rigorously tested empirically or in the fast-growing Chinese economy. ∗ This research is supported by a research grant from “211” Key Disciplines Development Project of University of International Business and Economics (project #73200033), an RGC Direct allocation grant (project #2070386), and a research fund from Center for Supply Chain Management and Logistics, Li & Fung Institute of Supply Chain Management and Logistics, The Chinese University of Hong Kong. † Corresponding author. 667
Transcript of Supply Chain Strategy, Product Characteristics, and ... · 668 Supply Chain Strategy and Product...
Decision SciencesVolume 40 Number 4November 2009
C© 2009, The AuthorJournal compilation C© 2009, Decision Sciences Institute
Supply Chain Strategy, ProductCharacteristics, and Performance Impact:Evidence from Chinese Manufacturers∗Yinan Qi†University of International Business and Economics, School of Business, No. 10, HuixingDongjie, Chaoyang District, Beijing, China, 100029; e-mail: [email protected]
Kenneth K. BoyerManagement Sciences Department, Fisher College of Business, Ohio State University,Columbus, OH, 43210, e-mail: [email protected]
Xiande ZhaoDepartment of Decision Sciences and Managerial Economics, The Chinese Universityof Hong Kong, Leung Kau Kui Building, CUHK, Shatin, Hong Kong,e-mail: [email protected]
ABSTRACT
Supply chain management has become one of the most popular approaches to en-hance the global competitiveness of business corporations today. Firms must have clearstrategic thinking in order to effectively organize such complicated activities, resources,communications, and processes. An emerging body of literature offers a frameworkthat identifies three kinds of supply chain strategies: lean strategy, agile strategy, andlean/agile strategy based on in-depth case studies. Extant research also suggests thatsupply chain strategies must be matched with product characteristics in order for firmsto achieve better performance. This article investigates supply chain strategies and em-pirically tests the supply chain strategy model that posits lean, agile, and lean/agileapproaches using data collected from 604 manufacturing firms in China. Cluster anal-yses of the data indicate that Chinese firms are adopting a variation of lean, agile, andlean/agile supply chain strategies identified in the western literature. However, the datareveal that some firms have a traditional strategy that does not emphasize either leanor agile principles. These firms perform worse than firms that have a strategy focusedon lean, agile, or lean/agile supply chain. The strategies are examined with respect toproduct characteristics and financial and operational performance. The article makessignificant contributions to the supply chain management literature by examining thesupply chain strategies used by Chinese firms. In addition, this work empirically teststhe applicability of supply chain strategy models that have not been rigorously testedempirically or in the fast-growing Chinese economy.
∗This research is supported by a research grant from “211” Key Disciplines Development Project ofUniversity of International Business and Economics (project #73200033), an RGC Direct allocation grant(project #2070386), and a research fund from Center for Supply Chain Management and Logistics, Li &Fung Institute of Supply Chain Management and Logistics, The Chinese University of Hong Kong.
†Corresponding author.
667

668 Supply Chain Strategy and Product Characteristics
Subject Areas: Analysis of Variance (ANOVA), Cluster Analysis, ProductCharacteristics, Strategic Management, and Supply Chain Design.
INTRODUCTION
Today’s competition is not between autonomous business entities, but betweenintegrated supply chains (Lambert & Cooper, 2000). Therefore, supply chain man-agement has received increasing attention from practitioners and academia. Effec-tively managing the flow of materials from supply sources to the ultimate customerrepresents a major challenge for today’s managers (Mabert & Venkataramanan,1998). Thus, firms need to posses a clear strategic planning in order to effectivelyorganize such complicated activities, resources, communications, and processes.Prior research has identified three major supply chain strategies: lean, agile, andlean/agile strategies (Christopher, 2000; Christopher & Towill, 2000; Bruce, Daly,& Towers, 2004; Yusuf, Gunasekaran, Adeleye, & Sivayoganathan, 2004). Re-search on supply chain strategy is closely linked with product characteristics. Forexample, Fisher (1997) and Christopher and Towill (2000) posit that supply chainstrategies must match with product characteristics, competitive strategies, and theenvironment in order for them to be effective.
Despite its well-recognized importance, research on supply chain strategyis still in its infancy. Most studies on supply chain strategy are based on casestudies of companies in western or highly developed countries (e.g., the UnitedStates, Canada, Europe, or Japan) and are highly descriptive. While these studieshelp us understand the concept of supply chain strategies, there remains a needfor large-scale empirical testing and validation of the conceptual frameworks em-ployed (Flynn, Sakakibara, Schroeder, Bates, & Flynn, 1990). Furthermore, moststudies on supply chain strategies are based on observations from companies in theUnited States or Europe. Very few studies have examined supply chain strategiesin emerging economies and cultural settings other than North America and Europe.Relatively little is known about supply chain management in China (Zhao, Flynn,& Roth, 2007). In particular, there are no published systematic studies on supplychain strategies in China.
China is the world’s fastest growing economy with a gross domestic product(GDP) growth rate of 11.1% in 2006, making it the fourth largest economy in termsof GDP (Wikipedia, 2007). Chinese manufacturers play very important roles inthe global supply chain. The extremely rapid growth has created great pressureon supply chain relationships between Chinese manufacturers and companies inother countries (Farh, Cannella, & Li, 2006). To illustrate, Zhao, Sum, Qi, Zhang,and Lee (2006) find that the patterns of operations strategies adopted by Chinesemanufacturers are quite different from those from western companies. Zhao et al.(2006) call for more investigations of how Chinese manufacturers compete in theglobal marketplace. Similarly, Jiang, Frazier, and Heiser (2007) conduct a thoroughreview of the China-related supply chain literature and emphasize the necessity ofan in-depth study on supply chain strategies in China.
Based on the calls of the aforementioned authors, we focus our researchon Chinese firms. While there are limitations to research using a single country,there are also important benefits. From a Chinese perspective, it is important to

Qi, Boyer, and Zhao 669
understand how to use supply chain strategy to compete effectively and to evaluatehow well western models fit in this environment. From a western perspective, itis important for managers and researchers to understand the application of supplychain strategy by their Chinese partners in order to work effectively with them toleverage their capabilities. Findings of studies on China’s supply chain strategieswill contribute to the theoretical development on supply chain management andprovide important and interesting managerial implications to practitioners.
The current study investigates supply chain strategies adopted by Chinesemanufacturers and seeks to empirically test the lean/agile supply chain strat-egy framework posited by several researchers (Fisher, 1997; Christopher, 2000;Christopher & Towill, 2000; Bruce et al., 2004; Yusuf et al., 2004). We developa survey instrument to assess product characteristics, supply chain strategy, andfinancial and operational performance and collect data from 604 manufacturingplants in China. More specifically, the objectives of this research are the following:
(i) To develop and test a taxonomy of supply chain strategies used by Chinesemanufacturers. We use as our foundation the lean/agile supply chainstrategy model that has received substantial research attention.
(ii) To assess the role and fit of product characteristics with the supply chainstrategy employed.
(iii) To assess the impact of supply chain strategies on financial and operationalperformance.
In the next section, the theoretical background and research hypotheses arepresented. This is followed by a description of research methodology. Next, ana-lytical results are presented. Finally, the article is concluded with major findings,contributions, limitations, and future research directions.
THEORETICAL BACKGROUND AND HYPOTHESES
While there is a substantial body of theory and empirical support for the funda-mental frameworks underlying operations strategy, the literature on supply chainstrategy is in a more developmental stage. There has been a great deal of discussion,but relatively little consensus and empirical testing of supply chain strategies. Oneof the more influential works is that of Fisher (1997), who proposed a frameworkthat describes the relationship between product characteristics and supply chainstrategy. Fisher argued that supply chain strategy must be aligned with productcharacteristics. The posited 2 × 2 matrix consisted of two supply chain strategiesand two product types. The two strategies were labeled as physically efficientand market-responsive. Each strategy was matched with a product type. Func-tional products have a relatively predictable demand while innovative productshave a relatively unpredictable demand. Functional products are characterized bylonger product life cycles, lower product variety, and relatively long lead times. Incontrast, innovative products are characterized by short life cycles, high productvariety, and short lead times. Fisher’s framework considered functional productsto require a physically efficient supply chain, while innovative products required amarket-responsive supply chain. Thus, there is a “match” when functional products

670 Supply Chain Strategy and Product Characteristics
Figure 1: Research model.
are paired with a physically efficient supply chain or when innovative products arepaired with a market-responsive supply chain. The framework by Fisher (1997)has been cited by numerous authors, yet the work is somewhat limited due to itsuse of small sample observations of a few companies. The need to match supplychain strategy with product characteristics has been examined and supported viacase study research conducted by Childerhouse, Aitken, and Towill (2002) andAitken, Childerhouse, and Towill (2003).
Our general research model is presented in Figure 1. This shows that we firstidentify and classify firms according to their approach to supply chain strategy(Hypotheses 1a–c). Then, we examine how product characteristics affect the choiceof strategy (Hypotheses 2a–c). Finally, we test for performance outcomes based onsupply chain strategy (Hypotheses 3a–c). Fisher’s model is thus tested in separate,yet linked steps because it is not feasible to test the model in a single, holistic step.
Supply Chain Strategies
Several authors have taken Fisher’s work and collected empirical data to supportand refine the theory. In particular, much of this work has been focused on exam-ining two fundamental supply chain strategies: lean, which is roughly equivalentto Fisher’s physically efficient and agile, which is roughly equivalent to Fisher’smarket-responsive. Lean means developing a value stream focused on eliminatingall kinds of waste (Naylor, Naim, & Berry, 1999). Since the early 1990s, manufac-turing companies around the world have implemented a lean production strategyto increase their competitiveness (Bruun & Mefford, 2004). Lean practices requirea stable product demand in order to facilitate a level production schedule, whichin turn leads to reduced cycle time, work-in-process, and finished goods invento-ries. Recently, lean thinking in manufacturing (Womack & Jones, 2003) has beenextended to the broader supply chain. The major objective of a lean supply chainstrategy is to reduce cost and enhance efficiency through elimination of wastes inboth inter- and intra-organizational processes. Lean supply chains are best matchedwith a relatively stable environment.
In contrast to lean, the goal of an agile supply chain is to provide customer-driven products with unique features to the market quickly in order to maintain acompetitive advantage in a rapidly changing environment. Decreasing product lifecycles and rapidly changing customer requirements have increased the pressure

Qi, Boyer, and Zhao 671
on the entire supply chain to provide products and services in a quicker andmore responsive manner. In particular, with the emergence of e-business, theresponsiveness of the supply chain becomes an increasingly important competitiveweapon in the marketplace. In order to cope with the challenges of an increasinglyturbulent and dynamic environment, researchers such as Kidd (1994) and Goldman,Nagel, and Preiss (1995) proposed a new paradigm: agility. Yusuf, Sarhadi, andGunasekaran (1999) described agility as “the successful exploration of competitivebases (speed, flexibility, innovation proactivity, quality, and profitability) throughthe integration of reconfigurable resources and best practices in a knowledge-richenvironment to provide customer-driven products and services in a fast changingmarket environment.” Recently, researchers including Christopher (2000), Mason-Jones, Naylor, and Towill (2000) and Yusuf et al. (2004), have extended the ideaof agility from individual companies to broader supply chains. These researcherssuggest that an agile supply chain strategy can help manufacturers deal with a rapidenvironmental change more efficiently and effectively. For example, Christopher(2000) argues that leveraging supplier relations allows companies to create agilesupply chains by reducing lead time between organizations. Lee (2004) emphasizedthat agility can help the supply chain respond to short-term changes quickly andmanage the external disturbance easily. When the market environment is moredynamic and turbulent, companies need to adopt an agile supply chain strategy.
While most authors focus on a single one of these two types of supply chainstrategies, Bruce et al. (2004) identified a combination strategy called “leagile”strategy. “Leagile takes the view that lean and agile approaches shall be combinedat a decoupling point for optimal supply chain management” (Bruce et al., 2004,p. 155). A leagile supply chain can operate cost-effectively or in a lean mannerin the upstream supply chain and responsively to volatility or in an agile mannerin the market downstream (Bruce et al., 2004). While authors have identified thisapproach and shown some companies to be successful with it, it is worth pointingout that the leagile strategy is likely to be challenging due to the need to mastertwo different and sometimes conflicting managerial styles. Selldin and Olhager(2007) found that some companies operate on a “supply chain frontier” by seekingto combine physical efficiency (we label this as lean) and market responsive (welabel this as agile) supply chains, but noted that this position was difficult to achieveand worthy of further research attention. Our expectation is that implementing aleagile strategy will be very challenging—somewhat analogous to operating at thebusiness’ performance frontier (Schmenner & Swink, 1998). In particular, a leagilestrategy involves managing the upstream and downstream portions of the supplychain in a very different manner. Our questions use a single firm as the unit ofanalysis and ask the respondent to answer looking both upstream and downstream.While this key informant approach is not the optimal way to measure two directionsin the supply chain, we believe that it is effective in capturing the respondent’sintent regarding his/her own company’s supply chain strategy. Due to our difficultyin assessing the decoupling point based on a single informant, our findings willbe presented as lean/agile rather than leagile because we can not explicitly assesshow companies combine the two approaches.
The existing typology of supply chain strategies (i.e., agile, lean, andlean/agile) is identified and described through case studies of companies in the

672 Supply Chain Strategy and Product Characteristics
United States or Europe. As China has become an important manufacturing centerin the world and has become an attractive target for global sourcing, Chinese man-ufacturers are establishing closer relationships with supply chain partners in thewestern world. Chinese managers are learning modern supply chain managementprinciples and practices from their partners and beginning to implement modernsupply chain strategies and practices to enhance their relationships with their part-ners and improve their performance (Zhao, Huo, Flynn, & Yeung, 2008). Muchof the manufacturing in China is low cost focused, thus it might be expected thatlean approaches would dominate over agile. However, Porter’s (1986) strategictheory suggests that companies may pursue competitive niches through differen-tiation and thus some Chinese companies may also pursue agile strategy to meetthe dynamically changing needs of the customer. Furthermore, companies mayhave to emphasize both lean and agile strategies in order to achieve lower cost ina rapidly changing environment. As such, we examine a general proposition withrespect to Chinese manufacturers, followed by three specific hypotheses. A priori,there is greater support for Hypothesis 1a regarding lean than for Hypothesis 1bor 1c:
Proposition 1: Chinese manufacturers can be mapped using the typology of lean,agile, and lean and agile supply chain strategies.
H1a: A subset of Chinese manufacturers pursues a supply chain strategyfocused on lean strategy.
H1b: A subset of Chinese manufacturers pursues a supply chain strategyfocused on agile strategy.
H1c: A subset of Chinese manufacturers pursues a supply chain strategyfocused on both lean and agile strategies.
Product Characteristics and Supply Chain Strategies
The manufacture of products with different characteristics incurs two categoriesof supply chain costs: production costs (Cooper, 1990) and market mediation costs(Fisher, 1997). Production costs include material, labor, manufacturing, overheadcosts, and production technology investments (Randall & Ulrich, 2001). Mediationcosts occur due to market variability (Randall & Ulrich, 2001). Mediation costsinclude inventory holding costs, product mark-down costs, and opportunity costsfor not having the right products to meet the demands. Production and mediationcosts can be influenced by the choice of supply chain strategy as noted by Fisher(1997) and examined in the work of Randall and Ulrich (2001).
When selecting an appropriate supply chain strategy, the first step for manu-facturers is to consider the characteristics of end-products, including product lifecycle length, predictability of demand, product variety, and market standards forlead times and service (Fisher, 1997). Similarly, Huang, Uppal, and Shi (2002)also argue that the primary factor associated with supply chain strategy selec-tion is the product characteristics of a particular supply chain. The literature hasreached a general consensus that companies providing functional products need

Qi, Boyer, and Zhao 673
efficient/lean chains, while companies offering innovative products require a moreresponsive/agile supply chain.
Several studies have examined the relationship between supply chain strategyand product characteristics. Childerhouse et al. (2002) described the evolution offocused-demand chains over a long period of time via a case study that examinesthe path along which a UK lighting company developed from a traditional supplychain to an organization with four focused-demand chains. Using the DWV3(delivery window, variability, volume, and variety) scheme, they classified themajor products of the company into four clusters. For each cluster, they proposeda corresponding focused-demand chain strategy. Aitken et al. (2003) found foursimilar supply chain strategies that are used in different phases in the product lifecycle, which can be considered as a proxy for product characteristics.
Narasimhan and Kim (2002) proposed four factors that can affect supplychain strategy selection: nature of business, competitive environment, technolog-ical intensity of the product, and product and market characteristics. Their studytheoretically highlighted the importance of product characteristics, but because itfocused on supply chain integration it did not examine specific supply chain strate-gies. Similarly, Huang et al. (2002) emphasized the relationship between productcharacteristics and supply chain strategy selection. They then proposed a computerprogram to select supply chain strategy according to the product characteristics,but the program was not tested using actual empirical data.
Bruce et al. (2004) analyzed different supply chain strategies, including lean,agile, and lean/agile, in the textiles and clothing industry. According to the authorsthis industry manufactures primarily innovative products because its products tendto have short product life cycles, high volatility, and low predictability. By ex-amining four case studies, the authors argue that the lean/agile approach is mostappropriate for the textiles and clothing industry. Companies in this industry requirea quick response to customer demands and strong strategic alliances and sourcingrelationships with their suppliers in order to gain a sustainable competitive edge.The focused sample in the research by Bruce et al. (2004) thus provides limitedsupport for the hypothesized relationships between product characteristics andsupply chain strategies. We note that while Bruce et al. (2004) identified lean/agileas a strategy, there is limited support due to the small sample. There is a strongneed to examine this strategy to test whether it is feasible because conceptually itis likely to be very difficult to successfully capture the positive benefits of lean andagile in a single firm or supply chain.
In a broad-based empirical study, Safizadeh, Ritzman, and Mallick (2000)found that strategic emphasis tends to shift from flexibility and a high-performancedesign quality to a consistent quality and cost as companies move away from cus-tomization toward standardization. While this study was focused on operationsstrategy within individual firms and was not examining the product characteris-tics/supply chain strategy relationship explicitly, it does provide some support forthe fundamental relationship.
In a study tightly focused on a single industry, Randall and Ulrich (2001)explore the relationship among product variety, supply chain structure, and firmperformance using data from the U.S. bicycle industry. Utilizing different types ofcost, the authors classified companies into two groups based on product variety:

674 Supply Chain Strategy and Product Characteristics
production-dominant and mediation-dominant. Similarly, a supply chain structureis characterized along two dimensions: the distance of production facilities froma target market and the degree to which production facilities reach a minimumefficient scale. Randall and Ulrich (2001) found that the firms using scale-efficientprocesses and located away from target market will use a production-dominantvariety policy. In contrast, firms using scale-inefficient processes and located nearthe target market will use a mediation-dominant variety policy. While this studyprovides substantial support for the relationship between product variety and sup-ply chain structure (location of its production facilities), it did not clearly examinethe relationship of a firm’s supply chain strategy and product characteristics. Itemploys specialized measures to test the relationships that are limited in their gen-eralizability. Furthermore, there are two other limitations. First, the study focuseson the bicycle industry, thus its conclusion may not be generalizable to firms thatproduce a larger variety of products. Second, the study classified the groups usingthe sample median and then tested their associations. This approach requires datafrom an entire industry—which is not feasible for a broad range of studies. Thus,there is a need for a more broadly applicable methodology.
A recent study by Selldin and Olhager (2007) closely mirrors our work. Theseauthors examine the relationship between product characteristics and supply chainstrategy using a sample of 128 Swedish companies. Selldin and Olhager (2007)found support for the matrix proposed by Fisher (1997) in that companies whereproduct characteristics and supply chain strategy were well matched outperformedcompanies with poor match. Selldin and Olhager (2007) call for further researchin other countries to support, validate, and elaborate their work.
Based on this review of the literature, several studies have supported the re-lationship between product characteristics and supply chain strategy. Howeverthe bulk of extant research is based on deductive reasoning and case anal-yses. Little systematic broad-sample empirical analysis has tested these rela-tionships. There is an increasing acknowledgment that inductive-based propo-sitions and theories should be verified through deductive analyses (Flynn et al.,1990). The current research seeks to address this gap by providing empiricalevidence to validate the relationship between supply chain strategy and prod-uct characteristics. We accomplish this by empirically deriving a supply chainstrategy taxonomy using data collected from 604 manufacturers in China. The re-sults of the empirical taxonomy are compared to those predicted by the Fisher(1997), Selldin and Olhager (2007), and other researchers. It is also testedby correlating supply chain strategies with product characteristics. We believethat Chinese manufacturers are matching their supply chain strategy and prod-uct characteristics and thus propose the following proposition and three relatedhypotheses:
Proposition 2: Supply chain strategy are correlated with product characteristics.
H2a: Companies utilizing a lean supply chain strategy will have highervalue of functional product characteristics.
H2b: Companies utilizing an agile supply chain strategy will have highervalue of innovative products characteristics.
Qi, Boyer, and Zhao 675
H2c: Companies utilizing a lean/agile supply chain strategy will havehigh value of functional and innovative products characteristics.
Impact of Supply Chain Strategy on Performance
As discussed earlier, the characteristics of three types of supply chain strategies(lean, agile, and lean/agile) are different. The lean supply chain strategy requiresthat manufacturers make cost reduction their first priority. Adopters of lean strategymay implement practices such as mass production, just-in-time, and long-termsupplier relationships to eliminate waste and achieve a lower cost. On the otherhand, the agile supply chain strategy underscores flexibility and responsiveness.Hence, adopters of agile strategy need more capacity buffers to handle the marketvolatility. In the short run, there are likely to be trade-offs between the two kindsof strategies. However, over time, companies may develop innovative ways toimprove both leanness and agility. One way to do this is to combine the leanand agile approaches at a decoupling point to form the lean/agile supply chainby operating cost-effectively in the upstream supply chain and responsively tovolatility in the market downstream as observed by Bruce et al. (2004). Firms mayalso use other ways to develop both the lean and agile capabilities in their supplychain. Each of these supply chain strategies has been identified in prior literaturebased on relatively small sample sizes, thus there is a strong need to assess theireffectiveness in a larger sample. In particular, the successful implementation of alean/agile strategy seems to be a more challenging hurdle than implementing eithera lean or agile strategy due to the need to master two sets of guiding principles.
Since Porter (1986) proposed the well-known typology of competitive strate-gies, many studies have examined the firm’s strategic behavior and their impacts onperformance. Several studies found that the firm’s performance would deteriorateif it does not have a clear strategic thinking (Dess & Davis, 1984). However, thestrategic management literature strongly emphasizes that strategy involves carefulmatches between internal strategy, organization and structure, and external envi-ronment (Bozart, Warsing, Flynn, & Flynn, 2009). We believe that similar thinkingcan be extended in supply chain strategies and test the following proposition andhypotheses:
Proposition 3: Supply chain strategy significantly influences firm’s performance.
H3a: Supply chain strategy significantly influences firm’s financialperformance.
H3b: Supply chain strategy significantly influences firm’s customer serviceperformance.
H3c: Supply chain strategy significantly influences firm’s operating costperformance.
RESEARCH METHODOLOGY
In this research, data are collected via a mail survey. The unit of analysis isthe manufacturing company. The supply chain manager, operations manager, and
676 Supply Chain Strategy and Product Characteristics
general manager were selected as potential respondents for this study. Managersin these positions have enough knowledge to answer the questions we asked inthe questionnaire, specifically the questions concerning the supply chain strategiesand practices used in the company.
Questionnaire Design
The items designed to measure supply chain strategy are extracted from a variety ofsources, including Katayama and Bennett (1999), Yusuf et al. (1999), Christopher(2000), Mason-Jones et al. (2000), and Heikkila (2002). The items employed inthe current study are shown in the Appendix. In the questionnaire, we listed severalstatements that describe the characteristics of lean and agile supply chain. Then, weasked the respondents to answer “to what extent do you agree that the supply chainof your company’s major product/product mix has the following characteristics?”The measurement scales employ a seven-point Likert scale with 1 = stronglydisagree and 7 = strongly agree.
The measurement items for product characteristics are extracted from Fisher(1997), Childerhouse et al. (2002), and Huang et al. (2002). The items are di-vided into two parts. In part 1, we include three statements related to the generalcharacteristics of product. The question asked in the first part is “to what extentare the following statements suitable descriptions of your company’s end productsor production process.” These items are seven-point Likert scales with 1 = mostunsuitable and 7 = most suitable as the anchors. The item in part two requiresthe respondents to provide estimates regarding the introduction interval of newproducts. We asked the respondents to indicate the best estimate for times rangingfrom 1 = <3 months to 7 = ≥5 years.
The items for the financial performance and operational performance arebased on Beamon (1999), Gunasekaran, Patel, and Tirtiroglu (2001), De Toniand Tonchia (2001), and Vickery, Jayaram, Droge, and Calantone (2003). In ourquestionnaire, we include six dimensions of financial performance based on ourliterature review of commonly used measures. They are return on investment(ROI), return on assets (ROA), Market Share, Growth in ROI, Growth in ROA,and Growth in Market Share. We also include 15 items of operational performancein the questionnaire. The question asked is “to what extent does your companyperform compared with your main competitors?” The items are seven-point Likertscales ranging from 1 = much worse and 7 = much better.
The questionnaire includes some other questions concerning the characteris-tics of the firm, which include ownership, the role (leader or subordinate), and theposition (supplier, components manufacturer or finished product manufacturers)of the firm in the supply chain.
Questionnaire Translation
To ensure the reliability of the questionnaire, the English version of the question-naire was first developed by the research team and reviewed by knowledgeableprofessors of operations management. This version was translated into Chinese,and then translated back to English. The back-translated English version was then
Qi, Boyer, and Zhao 677
checked against the original English version. As a result, some questions werereworded to better reflect the original meaning of the questions in English.
The Chinese version of the questionnaire was then pilot-tested on more than40 manufacturing managers from Tianjin, Guangzhou, and Hong Kong in China.The data collected from the pilot study were used to assess whether every questionin the questionnaire was understood correctly by the respondents. When there wasa confusion or ambiguity in the wording of the questions or scales, modificationswere made. The combination of translation to Chinese, back translation to English,and a careful pilot testing provides important evidence to support reliability andvalidity of measurement in research in developing countries, particularly China(Zhao, Flynn, & Roth, 2007).
Data Collection and Nonresponse Bias
Geographically, China is a very large country with 31 provinces and autonomousregions, cities under the direct administrative guidance of the central government,and two special administrative regions (Hong Kong and Macau). Therefore, it isvery difficult to obtain samples from all parts of China. Furthermore, the topicof this research is relatively new for managers in China. Hence, we sought toselect the target cities in which the manufacturing companies are relatively betterdeveloped and supply chain management concepts are better established than otherareas in China. As a result, we chose three representative cities from economicallyadvanced areas in China: Beijing, Shanghai, and Guangzhou.
We used a database provided by Beijing Ebuywww Info Co. Ltd in oursampling. Founded in August 2000, Ebuywww provides a high-quality list ofChinese companies. The source of information is based on a close relationshipbetween Ebuywww and various business journals, the government statistical bu-reaus, and various industrial societies. The data provided by Ebuywww are usedby numerous large multinational companies to identify and assess potential sup-pliers in China. As suggested by Li, Rao, Ragu-Nathan, and Ragu-Nathan (2005),the target sampling list was limited to manufacturers with more than 100 em-ployees because manufacturers with fewer than 100 employees seldom engage insophisticated supply chain management. There were 9,764 companies that met theaforementioned criteria. Within each city, we selected companies using probabilitysampling according to distributions of industries and the number of employees inthe database.
To maximize the response rate, we followed the approach used in Frohlich(2002). A total of 3,187 companies were selected from the database and con-tacted by telephone. However, 463 companies could not be reached because thetelephone numbers were incorrect or the company had moved or closed down.Of the remaining 2,724 companies, 614 completed the questionnaire after severalrounds of follow-up calls, which represent an effective response rate of about 23%.This response rate is comparable to or higher than recent studies on operationsmanagement (Das & Joshi, 2007; Rabinovich, Knemeyer, & Mayer, 2007). Afterscreening, we determined that 10 of the 614 questionnaires had not been completedproperly and were thus removed from further analysis. Therefore, 604 responseswere used in our subsequent analysis.

678 Supply Chain Strategy and Product Characteristics
Table 1: Industry distribution of respondents and population.
Industries Respondents Population
Food and beverage 10.10% 8.66%Electronic and communication equipment 8.79% 8.38%Transportation equipment 8.63% 8.79%Textile and garment 33.22% 33.37%Electrical equipment 8.38% 10.93%Machinery 16.12% 17.74%Chemicals and petroleum 7.17% 6.97%Plastic and latex 5.37% 5.16%
Total 100% 100%
To assess nonresponse, we compared the industry distributions of the re-spondent companies and the population per the advice of Malhotra and Grover(1998). The results are shown in Table 1. Table 1 shows that the percentages ofthe respondents were close to the percentages of companies in the populationfor most industries, A chi-square test (χ2 = 1.17) indicated no significant differ-ence between the distribution of respondents and the overall population (p > .05),suggesting that our sample was not biased toward any particular industry.
Profiles of Respondents
Table 2 provides a profile of the respondents to the survey. Part A indicates theposition of each respondent within the company, with the largest grouping beingproduction and operations manager, general manager, or factory director. Therespondents cover a variety of positions—all relating to some aspect of supplychain management. Part B shows that a majority of the respondents have beenwith the company longer than 5 years. These results show that our respondentsare capable of answering the questions about product characteristics, supply chainstrategies, and financial performance.
Table 3 shows the profile of the responding companies by size, ownership,and their roles and position in the supply chain. Part A shows that more than40% of the responding companies had fewer than 200 employees, over 84% hadfewer than 500 employees, and about 7% had 1,000 or more employees. Part Bshows about 35% of the respondents had annual sales of below 10 million Yuan(approx US$1.46 million), and 7% of the companies had annual sales of over 250million Yuan (approx US$36.44 million). This distribution is typical of Chinesemanufacturing companies, which are more likely to be in the medium-size category(100–1,000 employees) and have lower revenue than companies in more developedcountries such as North America and Europe.
Another important factor that can potentially influence supply chain man-agement is the ownership of Chinese companies. Part C shows that there is a highpercentage of state-owned enterprises (companies in which capital investmentsare wholly or partly owned by the state and are directly or indirectly controlledand managed by government) and collective-owned enterprises (where capitalis wholly or partly owned by laborers working in these enterprises, municipal

Qi, Boyer, and Zhao 679
Table 2: Respondent profile.
A. Job Title Frequency Percent (%)
General manager 84 13.9Production and operations manager 245 40.5SCM and logistics manager 4 0.7Purchasing and supply manager 3 0.5Factory director 97 16.1General manager assistant 58 9.6Chief financial officer (CFO) 17 2.8Marketing manager 39 6.5R&D manager 27 4.5Others 30 4.9
Total 604 100
B. Years with the company<5 282 46.75–9 171 28.310–14 80 13.215–19 36 6.0≥20 35 5.8
Total 604 100
R&D = research and development; SCM = supply chain management.
government, or some types of social organizations). Another 30% of companiesare private. The wholly foreign owned enterprises and joint ventures are about30%. The final 10% of responding companies are joint-stock companies.
Finally, parts D and E indicate the position of the company within the supplychain. A majority of respondents consider their company to be in a leadership(61.8%) versus a subordinate role. Similarly, a majority of firms are considered to behigher value-added manufacturers (72.2%) rather than raw material or componentssuppliers.
Assessing Reliability and Validity
As suggested by Narasimhan and Jayaram (1998), we performed an exploratoryfactor analysis for each construct to ensure the unidimensionality of the scales.The factor analysis was done on items LS1–LS7 and AS1–AS7 in the Appendix.In the first step, indicator items are deleted if they load on more than two factorsor their factor loadings on are smaller than .5 (Johnson & Wichern, 1998) or ifthere are cross-loadings higher than .40 (Hair, Anderson, Tatham, & Black, 1998).Moreover, the items that did not load on the factor they were designed to measurewere also deleted per Chen and Paulraj (2004). According to these criteria, wedropped LS4 because it has factor loadings below .50 for all factors. We alsodropped item AS2 due to its high cross-loading (above .40).
In the second step, another factor analysis is done to assess unidimensionality.Eigenvalues, loadings, and percentage of explained variances for each constructare provided in the Appendix, which also shows item means and correlations. Thescale for lean strategy consists of six items and explains 25.2% of the variance

680 Supply Chain Strategy and Product Characteristics
Table 3: Company profile.
Percent (%)
A. Number of employees100–199 42.7200–499 41.6500–999 9.61,000–4,999 5.55,000 or more 0.7
B. Annual sales (in million Yuan, 1 US$ = � 6.86 RMB)Below 5 (0.73 million USD) 14.45–10 (0.73–1.46 USD) 18.210–15 (1.46–2.19 USD) 13.215–25 (2.19–3.64 USD) 13.625–30 (3.64–4.37 USD) 7.930–50 (4.37–7.29 USD) 11.150–100 (7.29–14.58 USD) 9.9100–250 (14.58–36.44 USD) 4.8250–500 (36.44–72.88 USD) 3.8500 to 1000 (72.88–145.77 USD) 1.3Above 1000 (145.77 USD) 1.7
C. OwnershipState-owned 20.5Collective owned 11.1Private owned 30.0Wholly foreign owned 13.1Joint-venture 14.7Joint-stock company 10.3
D. Role of company within supply chainLeader 61.8Subordinate 38.2
E. Position of company in supply chainRaw material supplier 10.3Components supplier 17.5Manufacturer 72.2
Total 100
(eigenvalue = 3.02/12 items). The scale for agile strategy consists of six items andexplains 22.8% of the variance (eigenvalue = 2.70/12 items).
The Appendix also shows results for two separate exploratory factoranalyses—one on operational performance and one on financial performance. Thefactor analysis for operational performance resulted in two factors. One is labeledCustomer Service because it consists of 10 items that all focus on some aspect re-lating to services, quality, flexibility, or delivery. In comparison, the second factoris labeled Operating Cost because its five items focus on costs of products. Theeigenvalues are 5.18 and 2.86, respectively, thus these factors account for 53.6%of the variance. A separate factor analysis for the financial performance measuresshows that it is unidimensional with a single factor (eigenvalue = 3.96) accountingfor 66.06% of the overall variance.
Qi, Boyer, and Zhao 681
Flynn et al. (1990) suggested that the most widely accepted measure ofa measure’s internal consistency is Cronbach’s alpha. The Appendix shows theCronbach’s alpha results for the lean and agile strategy and the operational andfinancial performance constructs. The alpha values are larger than .60, the thresholdvalue recommended by Nunnally (1978) and Flynn et al. (1990). The data suggestthat our constructs possess sufficient reliability.
We assessed the convergent validity by using confirmatory factor analysis(CFA), suggested by O’Leary-Kelly and Vokurka (1998). The model fit indicesare chi-square(486) = 2169.03, root mean square error of approximation = 0.076,comparative fit index = 0.95, and Tucker Lewis index = 0.94, which are betterthan the threshold values recommended by Hu and Bentler (1998). Furthermore,all of the factor loadings in our CFA model are greater than .5 and the t-valuesare significantly greater than 2.0. As a result, convergent validity is ensured in ourstudy. To assess discriminant validity, we compared the unconstrained model withthe constrained models of the constructs used in our study (Choi & Eboch, 1998). Asignificant difference of the χ2 between the constrained and unconstrained modelswould indicate high discriminant validity (Choi & Eboch, 1998). In our study, allof the differences of χ2 are significant, which shows support to the discriminantvalidity of the constructs.
RESULTS
The Taxonomy of Supply Chain Strategies
Cluster analysis was used to develop a taxonomy based on the constructs for leanand agile supply chain characteristics. We followed several rules similar to thoseused in Kathuria (2000) and Frohlich and Dixon (2001) to select the number ofclusters. As in Frohlich and Dixon (2001), we used a hierarchical cluster analysisto generate a hierarchical dendogram and an agglomeration schedule table. Ourgoal was to balance parsimony or few clusters with accuracy (more clusters retainsmore data). The choice of the final number of clusters is a subjective one that isgenerally guided by a few rules of thumb. Lehmann (1979) indicates the numberof clusters should lie between n/30 and n/60. Because our sample size is 604,this would suggest a solution with between 10 and 20 clusters. Unfortunately,this high number of clusters makes managerial interpretability difficult due tothe lack of parsimony. We employed K-mean cluster analysis to generate three-,four-, and five-cluster solutions. After a careful examination of the three-, four-, and five-cluster solutions, we decided that the four-cluster solution shown inTable 4 provided the best interpretability. The five-cluster group had two clustersthat were very similar in that they were heavily focused on lean with very littleemphasis on agile. The three-cluster choice did not have the group that focusedprimarily on agile to the exclusion of lean. We feel that the four-cluster choiceprovides more explanatory power than the choice of three clusters without theadded complexity of a five-cluster solution, thus we chose four clusters, which isa common number in the literature (Roth & Miller, 1992; Boyer, Ward, & Leong,1996). We prefer the four-cluster solution because it provides more explanatorypower—in fact we believe the difference between Lean/agile and Traditional to bevery important.
682 Supply Chain Strategy and Product Characteristics
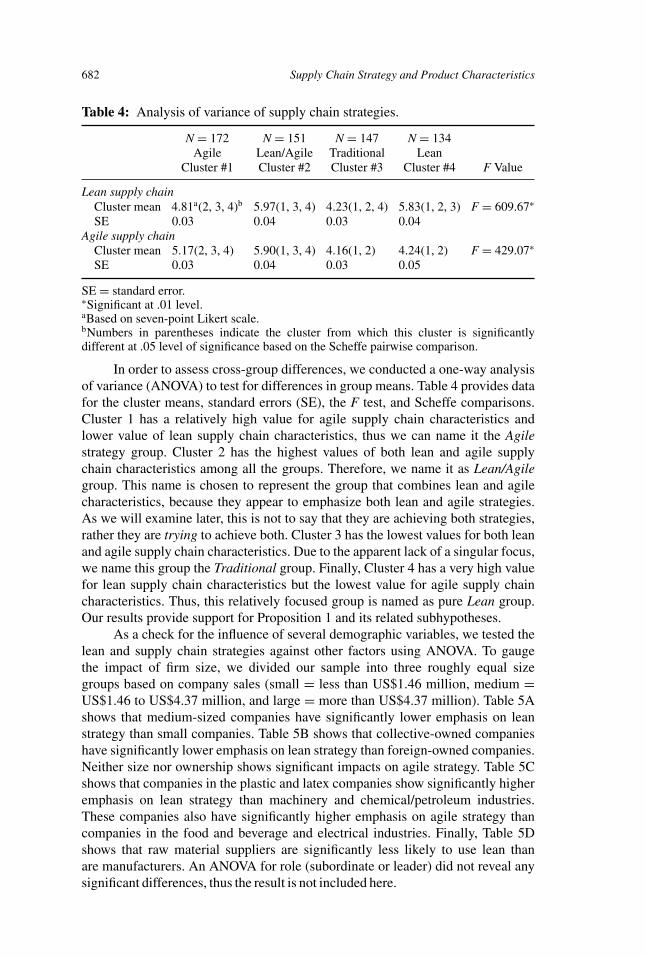
Table 4: Analysis of variance of supply chain strategies.
N = 172 N = 151 N = 147 N = 134Agile Lean/Agile Traditional Lean
Cluster #1 Cluster #2 Cluster #3 Cluster #4 F Value
Lean supply chainCluster mean 4.81a(2, 3, 4)b 5.97(1, 3, 4) 4.23(1, 2, 4) 5.83(1, 2, 3) F = 609.67∗SE 0.03 0.04 0.03 0.04
Agile supply chainCluster mean 5.17(2, 3, 4) 5.90(1, 3, 4) 4.16(1, 2) 4.24(1, 2) F = 429.07∗SE 0.03 0.04 0.03 0.05
SE = standard error.∗Significant at .01 level.aBased on seven-point Likert scale.bNumbers in parentheses indicate the cluster from which this cluster is significantlydifferent at .05 level of significance based on the Scheffe pairwise comparison.
In order to assess cross-group differences, we conducted a one-way analysisof variance (ANOVA) to test for differences in group means. Table 4 provides datafor the cluster means, standard errors (SE), the F test, and Scheffe comparisons.Cluster 1 has a relatively high value for agile supply chain characteristics andlower value of lean supply chain characteristics, thus we can name it the Agilestrategy group. Cluster 2 has the highest values of both lean and agile supplychain characteristics among all the groups. Therefore, we name it as Lean/Agilegroup. This name is chosen to represent the group that combines lean and agilecharacteristics, because they appear to emphasize both lean and agile strategies.As we will examine later, this is not to say that they are achieving both strategies,rather they are trying to achieve both. Cluster 3 has the lowest values for both leanand agile supply chain characteristics. Due to the apparent lack of a singular focus,we name this group the Traditional group. Finally, Cluster 4 has a very high valuefor lean supply chain characteristics but the lowest value for agile supply chaincharacteristics. Thus, this relatively focused group is named as pure Lean group.Our results provide support for Proposition 1 and its related subhypotheses.
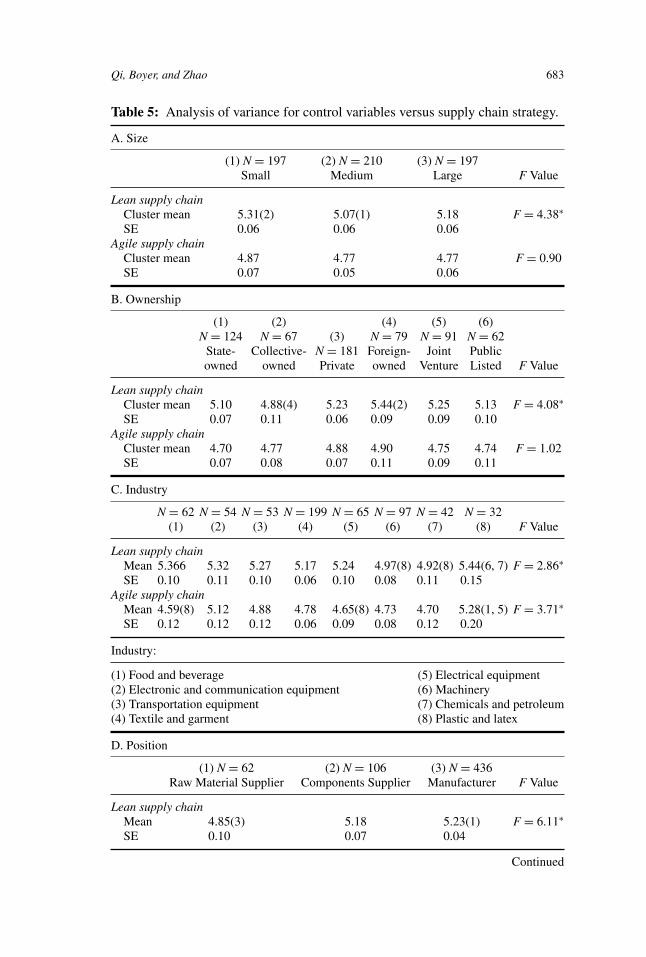
As a check for the influence of several demographic variables, we tested thelean and supply chain strategies against other factors using ANOVA. To gaugethe impact of firm size, we divided our sample into three roughly equal sizegroups based on company sales (small = less than US$1.46 million, medium =US$1.46 to US$4.37 million, and large = more than US$4.37 million). Table 5Ashows that medium-sized companies have significantly lower emphasis on leanstrategy than small companies. Table 5B shows that collective-owned companieshave significantly lower emphasis on lean strategy than foreign-owned companies.Neither size nor ownership shows significant impacts on agile strategy. Table 5Cshows that companies in the plastic and latex companies show significantly higheremphasis on lean strategy than machinery and chemical/petroleum industries.These companies also have significantly higher emphasis on agile strategy thancompanies in the food and beverage and electrical industries. Finally, Table 5Dshows that raw material suppliers are significantly less likely to use lean thanare manufacturers. An ANOVA for role (subordinate or leader) did not reveal anysignificant differences, thus the result is not included here.
Qi, Boyer, and Zhao 683
Table 5: Analysis of variance for control variables versus supply chain strategy.
A. Size
(1) N = 197 (2) N = 210 (3) N = 197Small Medium Large F Value
Lean supply chainCluster mean 5.31(2) 5.07(1) 5.18 F = 4.38∗SE 0.06 0.06 0.06
Agile supply chainCluster mean 4.87 4.77 4.77 F = 0.90SE 0.07 0.05 0.06
B. Ownership
(1) (2) (4) (5) (6)N = 124 N = 67 (3) N = 79 N = 91 N = 62
State- Collective- N = 181 Foreign- Joint Publicowned owned Private owned Venture Listed F Value
Lean supply chainCluster mean 5.10 4.88(4) 5.23 5.44(2) 5.25 5.13 F = 4.08∗SE 0.07 0.11 0.06 0.09 0.09 0.10
Agile supply chainCluster mean 4.70 4.77 4.88 4.90 4.75 4.74 F = 1.02SE 0.07 0.08 0.07 0.11 0.09 0.11
C. Industry
N = 62 N = 54 N = 53 N = 199 N = 65 N = 97 N = 42 N = 32(1) (2) (3) (4) (5) (6) (7) (8) F Value
Lean supply chainMean 5.366 5.32 5.27 5.17 5.24 4.97(8) 4.92(8) 5.44(6, 7) F = 2.86∗SE 0.10 0.11 0.10 0.06 0.10 0.08 0.11 0.15
Agile supply chainMean 4.59(8) 5.12 4.88 4.78 4.65(8) 4.73 4.70 5.28(1, 5) F = 3.71∗SE 0.12 0.12 0.12 0.06 0.09 0.08 0.12 0.20
Industry:
(1) Food and beverage (5) Electrical equipment(2) Electronic and communication equipment (6) Machinery(3) Transportation equipment (7) Chemicals and petroleum(4) Textile and garment (8) Plastic and latex
D. Position
(1) N = 62 (2) N = 106 (3) N = 436Raw Material Supplier Components Supplier Manufacturer F Value
Lean supply chainMean 4.85(3) 5.18 5.23(1) F = 6.11∗SE 0.10 0.07 0.04
Continued

684 Supply Chain Strategy and Product Characteristics
Table 5: (Continued)
D. Position
(1) N = 62 (2) N = 106 (3) N = 436Raw Material Supplier Components Supplier Manufacturer F Value
Agile supply chainMean 4.77 4.78 4.81 F = 0.09SE 0.09 0.09 0.04
SE = standard error.∗Significant at .01 level.No roles tested.
Product Characteristics and Supply Chain Strategies
More important than simply determining the supply chain strategies in Table 4,we wish to assess the degree of fit between the product characteristics and eachstrategy. To do this, we examine the two product characteristics factors labeledFunctional and Innovative, as shown in the Appendix. The Functional scale islabeled as such because the two items that load highly are both associated withmore functional products (Fisher, 1997; Selldin & Olhager, 2007). Namely, PC3asks about the volume of each product type with higher responses indicating highervolume and PC4 asks about the length of the introduction interval with a highernumber indicating longer intervals for new production introductions. In both cases,the high loadings fit with a more functional product. The second scale is labeled asInnovative because the two items that load highly are associated with innovativeproducts (Fisher, 1997; Selldin & Olhager, 2007). PC1 addresses the variation indemand for each product, with higher responses equating to high variability, whilePC2 addresses the time-to-market with high responses equating to shorter times.The high loadings fit well with an innovative product. As shown in the Appendix,the two factors explain 67.3% of the variance.
Table 6 provides the results of an ANOVA of the two product characteristicsbased on the supply chain strategy group from Table 4. The data generally fitwith the predictions of Fisher (1997) and Selldin and Olhager (2007). In partic-ular, the lean strategy group has the lowest value for Innovative and a relatively
Table 6: Analysis of variance of product characteristics by supply chain strategy.
(1) Agile (2) Lean/Agile (3) Traditional (4) Lean(n = 172) (n = 151) (n = 147) (n = 134) F Value
FunctionalCluster mean 4.72(2, 3) 5.08(1, 3) 4.20(1, 2, 4) 4.85(3) F = 18.32∗SE 0.08 0.08 0.09 0.09
InnovativeCluster mean 4.58(3, 4) 4.50(3, 4) 4.22(1, 2) 4.09(1, 2) F = 6.88∗SE 0.07 0.10 0.07 0.11
SE = standard error.∗Significant at .01 level.Numbers in parentheses indicate the cluster from which this cluster is significantlydifferent at .05 level of significance based on the Scheffe pairwise comparison.

Qi, Boyer, and Zhao 685
high value for Functional products. In contrast, the Agile and Lean/Agile groupshave the highest values for Innovative. Interestingly, there is less difference forfunctional product characteristics, with the main difference in that the traditionalstrategy group is significantly lower than the other groups. It is unclear why thereis insignificant difference between the Agile and Lean groups in the functionalproduct characteristics. It may be because most Chinese companies are produc-ing functional products and they need both lean and agile capabilities in order toreduce cost. In other words, all of the companies have some functional products,but the Lean companies are different in that they make little or no effort to pursueinnovative products while the agile and lean/agile companies do emphasize moreon innovative products.
In summary, the data in Table 6 provide good support for Proposition 2 andrelated Hypotheses. While the fit between product characteristics is not always asstrong as we would like, it is relatively good. Selldin and Olhager (2007) used amore bivariate approach, but ended their research noting that there was a need toexamine firms on the supply chain frontier—or our Lean/Agile group—thus weexamine the relationship between strategy and performance next.
Impact of Supply Chain Strategy on Performance
To examine the impact of a fit between product characteristics and supply chainstrategies on financial performance, we conduct a one-way ANOVA of supplychain strategy on financial performance and two operational performance factors—customer service and operating cost. The results of the ANOVA are shown inTable 7.
For all three performance measures, the Traditional group is significantlyworse than the other three groups. The Lean/Agile group is the best performinggroup overall, with significantly better customer service than all other three groupsand significantly better operating cost performance than Agile and Traditionalcompanies. The Lean group has significantly better operating cost than the Agile
Table 7: Analysis of variance of financial and operational performance by supplychain strategy.
(1) N = 172 (2) N = 151 (3) N = 147 (4) N = 134Agile Lean/Agile Traditional Lean F Value
Financial performanceCluster mean 4.68 (3) 4.90 (3) 4.25 (1, 2, 4) 4.75 (3) F = 15.33∗SE 0.06 0.08 0.05 0.09
Customer ServiceCluster mean 5.42 (2, 3) 5.90 (1, 3, 4) 4.73 (1, 2, 4) 5.60 (2, 3) F = 76.75∗SE 0.06 0.05 0.05 0.06
Operating CostCluster mean 4.80 (2, 3, 4) 5.19 (1, 3) 4.33 (1, 2, 4) 5.17 (1, 3) F = 45.24∗SE 0.05 0.07 0.05 0.07
SE = standard error.∗Significant at .01 level.Numbers in parentheses indicate the cluster from which this cluster is significantlydifferent at .05 level of significance based on the Scheffe pairwise comparison.

686 Supply Chain Strategy and Product Characteristics
group. This supports the concept that a Lean strategy should improve operatingcosts better than an Agile strategy. Interestingly, the Agile group does not havebetter customer service than the Lean group. Overall, the data provide good supportfor Proposition 3 and its three related subhypotheses.
DISCUSSION
Our study is one of the first large-scale empirical studies to investigate supplychain strategies and examine the relationship between product characteristics andsupply chain strategy. Using data from Chinese manufacturers and statistical analy-ses, we obtained several important results regarding supply chain strategy, productcharacteristics, and financial performance. The focus on Chinese companies is par-ticularly important, because supply chain characteristics that have been developedand validated in heavily industrialized and developed nations of the world havenot been tested in rapidly developing countries such as China. Our study confirmsthe generalizability of previous research findings in the fastest growing economyof the world, China.
First, our research shows that manufacturers in China can be classified intofour strategic groups: lean, agile, lean/agile, and traditional. The first three groupsare consistent with those found in prior research. This result shows that the conceptsof lean, agile, and lean/agile strategies in developed economies can be general-ized to more dynamic and developing economies. The identification of companiesutilizing agile and lean/agile strategies is of particular interest. The focus of multi-national companies in seeking to reduce costs through outsourcing in China andother Asian countries, suggests that the agile strategy proposed by researchersincluding Fisher (1997), Christopher (2000), and Yusuf et al. (2004), may not beapplicable in China. In contrast, our findings suggest that a subset of companiesis successfully applying an agile or lean/agile strategy in China. Furthermore, ourresearch goes beyond a descriptive approach and provides prescriptive insights.For managers, this indicates that it is possible to follow a strategy that focuses oneither developing a lean or agile supply chain strategy. A combination of the two,or lean/agile, appears to outperform either strategy individually, but likely requiresmore challenging management.
Second, we examine the product characteristics/supply chain strategy ma-trix proposed by Fisher (1997). While this matrix has been widely accepted byresearchers, it has not been tested in a broad empirical manner. Results of a clusteranalysis indicate that a firm’s product characteristics match well the supply chainstrategy predicted by existing typologies. In particular, a lean strategy is associatedwith very low values for innovative products while an agile strategy is marked bymuch higher values for innovative products. These results provide support for theproduct characteristics/supply chain strategy matrix.
Finally, we test for differences in financial performance of companies usingdifferent supply chain strategies. The group with a traditional strategy was foundto have substantially worse financial and operational performance due to its lackof emphasis on supply chain capabilities. This suggests that choosing a focusedpath—either lean or agile or a combination—is of a substantial benefit. The threegroups of companies with emphasis on lean, agile, or a combination of the twostrategies have statistically equal financial performance. These results provide

Qi, Boyer, and Zhao 687
support for the concept of equifinality or the ability to achieve similar positiveoutcomes by pursuing different supply chain strategies. This extends prior researchon a corporate strategy to the area of supply chain strategy (Doty, Glick, & Huber,1993). Interestingly, the lean/agile strategy performed better than other strategiesin terms of customer Service and better than all strategies except lean on operatingcost performance. In addition, the lean/agile strategy and lean strategy performedsignificantly better than agile strategy in terms of operating cost. These resultssubstantiate the previous findings that agile capabilities can help firms increasecustomer service, while lean capabilities can improve cost performance.
Although this study makes a significant contribution to the supply chainmanagement research, there are some limitations as well as numerous opportunitiesfor future research. First, while the study provides support for the applicability of ageneral typology of supply chain strategies and the product characteristics/supplychain strategy (PC/SCS) matrix in the rapidly developing economy of China, thedata underscore the complexity of supply chain management. There is clearlya strong need to continue to refine and improve both measures of supply chainstrategy and the ways in which it is implemented. It will also be fruitful to test andvalidate the measures of supply chain strategy and product characteristics and toexamine the PC/SCS matrix using data from different industries and from differentparts of the world.
Second, there is a strong need to identify the factors that influence the choiceof supply chain strategies and investigate their impacts on adoption of supply chainstrategies and effectiveness of these strategies. These factors will include compet-itive environment, competitive strategies, and organizational characteristics. Forexample, how does the firm’s competitive strategy influence supply chain strategyand how does environmental uncertainty influence the effectiveness of supply chainstrategies? Investigations of these questions will help firms adopt the most effectivestrategies to enhance their performance. Furthermore, more in-depth investigationsof how ownership and governance mechanism of firms within the supply influencethe choice and implementation of supply chain strategies can also help to revealhow firms interact with each other in strategic supply chain decisions.
Finally, this study used cross-sectional data to testify the conceptual model.Future longitudinal studies would be very helpful to provide insights regardingevolutionary changes between product characteristics and supply chain strategy.In particular, there is a strong need to study and map the evolutionary path ofChinese companies over the next 10 years to see how closely it parallels anddiverges from the path taken by North American, European, and Japanese firms inthe past decades. [Received: December 2007. Accepted: May 2009.]
REFERENCES
Aitken, J., Childerhouse, P., & Towill, D. (2003). The impact of product life cycleon supply chain strategy. International Journal of Production Economics,85(2), 127–140.
Beamon, B. M. (1999). Measuring supply chain performance. International Jour-nal of Operations & Production Management, 19(3), 275–292.

688 Supply Chain Strategy and Product Characteristics
Boyer, K. K., Ward, P. T., & Leong, G. K. (1996). Approaches to the factory of thefuture: An empirical taxonomy. Journal of Operations Management, 14(4),297–313.
Bozart, C. C., Warsing, D. P., Flynn, B. B., & Flynn, E. J. (2009). The impactof supply chain complexity on manufacturing plant performance. Journal ofOperations Management, 27(1), 78–93.
Bruce, M., Daly, L., & Towers, N. (2004). Lean or agile: A solution for supply chainmanagement in the textiles and clothing industry? International Journal ofOperations & Production Management, 24(2), 151–170.
Bruun, P., & Mefford, R. N. (2004). Lean production and the internet. InternationalJournal of Production Economics, 89(3), 247–260.
Chen, I. J., & Paulraj, A. (2004). Towards a theory of supply chain manage-ment: The constructs and measurements. Journal of Operations Manage-ment, 22(2), 119–150.
Childerhouse, P., Aitken, J., & Towill, D. R. (2002). Analysis and design of focuseddemand chains. Journal of Operations Management, 20(6), 675–689.
Choi, T. Y., & Eboch, K. (1998). The TQM paradox: Relations among TQM prac-tices, plant performance, and customer satisfaction. Journal of OperationsManagement, 17(1), 59–75.
Christopher, M. (2000). The agile supply chain: Competing in volatile markets.Industrial Marketing Management, 29(1), 37–44.
Christopher, M., & Towill, D. R. (2000). Supply chain migration from lean andfunctional to agile and customized. Supply Chain Management: An Interna-tional Journal, 5(4), 206–213.
Cooper, R. (1990). Cost classification in unit-based and activity-based manufac-turing cost systems. Journal of Cost Management, 6(Fall), 4–14.
Das, S. R., & Joshi, M. P. (2007). Process innovativeness in technology servicesorganizations: Roles of differentiation strategy, operational autonomy andrisk-taking propensity. Journal of Operations Management, 25(3), 643–660.
De Toni, A., & Tonchia, S. (2001). Performance measurement systems: Models,characteristics and measures. International Journal of Operations & Pro-duction Management, 21(1/2), 46–70.
Dess, G., & Davis, P. (1984). Porter’s (1980) generic strategies as determinants ofstrategic groups membership and organizational performance. Academy ofManagement Journal, 27(3), 467–488.
Doty, D. H., Glick, W. H., & Huber, G. P. (1993). Fit, equifinality, and organi-zational effectiveness: A test of two configurational theories. Academy ofManagement Journal, 36(6), 1196–1250.
Farh, J. L., Cannella, A. A., & Li, C. (2006). Approaches to scale developmentin Chinese management research. Management and Organizational Review,2(3), 301–318.
Fisher, M. L. (1997). What is the right supply chain for your product? HarvardBusiness Review, 75(2), 105–116.

Qi, Boyer, and Zhao 689
Flynn, B. B., Sakakibara, S., Schroeder, R. G., Bates, K. A., & Flynn, E. J.(1990). Empirical research methods in operations management. Journal ofOperations Management, 9(2), 250–284.
Frohlich, M. T. (2002). Techniques for improving response rates in OM surveyresearch. Journal of Operations Management, 20(1), 53–62.
Frohlich, M. T., & Dixon, J. R. (2001). A taxonomy of manufacturing strategiesrevisited. Journal of Operations Management, 19(5), 541–558.
Goldman, S., Nagel, R., & Preiss, K. (1995). Agile competitors and virtual orga-nizations. New York: Van Nostrand Reinhold.
Gunasekaran, A., Patel, C., & Tirtiroglu, E. (2001). Performance measures andmetrics in a supply chain environment. International Journal of Operations& Production Management, 21(1/2), 71–87.
Hair, J. F., Anderson, R. E., Tatham, R. L., & Black, W. C. (1998). Multivariatedata analysis (5th ed.). Upper Saddle River, NJ: Prentice Hall.
Heikkila, J. (2002). From supply to demand chain management: Efficiency andcustomer satisfaction. Journal of Operations Management, 20(6), 747–767.
Hu, L., & Bentler, P. M. (1998). Fit indices in covariance structure modeling: Sen-sitivity to underparameterized model misspecification. Psychological Meth-ods, 3(4), 424–453.
Huang, S. H., Uppal, M., & Shi, J. (2002). A product driven approach to manufac-turing supply chain selection. Supply Chain Management: An InternationalJournal, 7(4), 189–199.
Jiang, B., Frazier, G. V., & Heiser, D. (2007). China-related POM research: Aliterature review and suggestions for future research. International Journalof Operations and Production Management, 27(7), 662–684.
Johnson, R. A., & Wichern, D. W. (1998). Applied multivariate statistical analysis.Upper Saddle River, N.J.: Prentice-Hall.
Katayama, H., & Bennett, D. (1999). Agility, adaptability and leanness: A compar-ison of concepts and a study of practice. International Journal of ProductionEconomics, 60–61, 43–51.
Kathuria, R. (2000). Competitive priorities and managerial performance: A tax-onomy of small manufacturers. Journal of Operations Management, 18(6),627–641.
Kidd, P. T. (1994). Agile manufacturing: Forging new frontiers. Boston: Addison-Wesley Longman.
Lambert, D. M., & Cooper, M. C. (2000). Issues in supply chain management.Industrial Marketing Management, 29(1), 65–83.
Lee, H. (2004). The triple-A supply chain. Harvard Business Review, 82(10),102–112.
Lehmann, D. R. (1979). Market research and analysis. Homewood, IL: R. D.Irwin.
Li, S., Rao, S. S., Ragu-Nathan, T. S., & Ragu-Nathan, B. (2005). Developmentand validation of a measurement instrument for studying supply chain man-agement practices. Journal of Operations Management, 23(6), 618–641.
690 Supply Chain Strategy and Product Characteristics
Mabert, V. A., & Venkataramanan, M. A. (1998). Special research focus on supplychain linkages: Challenges for design and management in the 21st century.Decision Sciences, 29(1), 537–552.
Malhotra, M. K., & Grover, V. (1998). An assessment of survey research in POM:From construct to theory. Journal of Operations Management, 16(4), 407–425.
Mason-Jones, R., Naylor, B., & Towill, D. R. (2000). Lean, agile or leagile?Matching your supply chain to the marketplace. International Journal ofProduction Research, 38(17), 4061–4070.
Narasimhan, R., & Jayaram, J. (1998). An empirical investigation of the an-tecedence and consequences of manufacturing goal achievement in NorthAmerican, European and Pan Pacific firms. Journal of Operations Manage-ment, 16(4), 159–176.
Narasimhan, R., & Kim, S.W. (2002). Effect of supply chain integration on the re-lationship between diversification and performance: Evidence from Japaneseand Korean firms. Journal of Operations Management, 20(3), 303–323.
Naylor, J. B., Naim, M. M., & Berry, D. (1999). Leagility: Integrating the leanand agile manufacturing paradigms in the total supply chain. InternationalJournal of Production Economics, 62(1–2), 107–118.
Nunnally, J. C. (1978). Psychometric theory (2nd ed.). New York: McGraw-Hill.O’Leary-Kelly, S. W., & Vokurka, R. J. (1998). The empirical assessment of
construct validity. Journal of Operations Management, 16(4), 387–405.Porter, M. E. (1986). Competitive strategy: Techniques for analyzing industries
and competitors. New York: Free Press.Rabinovich, E., Knemeyer, A. M., & Mayer, C. M. (2007). Why do internet
commerce firms incorporate logistics service providers in their distributionchannels? The role of transaction costs and network strength. Journal ofOperations Management, 25(3), 661–681.
Randall, T., & Ulrich, K. (2001). Product variety, supply chain structure, and firmperformance: Analysis of the U.S. bicycle industry. Management Science,47(12), 1588–1604.
Roth, A. V., & Miller, J. G. (1992). Success factors in manufacturing. BusinessHorizons, 35(4), 73–81.
Safizadeh, M. H., Ritzman, L. P., & Mallick, D. (2000). Revisiting alternativetheoretical paradigms in manufacturing strategy. Production and OperationsManagement, 9(2), 111–127.
Schmenner, R. W., & Swink, M. L. (1998). On theory in operations management.Journal of Operations Management, 17(1), 97–113.
Selldin, E., & Olhager, J. (2007). Linking products with supply chains: TestingFisher’s model. Supply Chain Management: An International Journal, 12(1),42–51.
Vickery, S. K., Jayaram, J., Droge, C., & Calantone, R. (2003). The effectsof an integrative supply chain strategy on customer service and financialperformance: An analysis of direct versus indirect relationships. Journal ofOperations Management, 21(5), 523–539.

Qi, Boyer, and Zhao 691
Yusuf, Y. Y., Gunasekaran, A., Adeleye, E. O., & Sivayoganathan, K. (2004). Agilesupply chain capabilities: Determinants of competitive objectives. EuropeanJournal of Operational Research, 159(2), 379–392.
Yusuf, Y. Y., Sarhadi, M., & Gunasekaran, A. (1999). Agile manufacturing: Thedrivers, concepts and attributes. International Journal of Production Eco-nomics, 62(1–2), 33–43.
Wikipedia (2007). Economy of the People’s Republic of China, accessed Oc-tober 4, 2007, Available at http://en.wikipedia.org/wiki/Economy_of_the_People’s_Republic_of_China.
Womack, J., & Jones, D. (2003). Lean thinking. London: Simon & Schuster.
Zhao, X., Huo, B., Flynn, B., & Yeung, H. (2008). The impact of power and relation-ship commitment on the integration between manufacturers and customersin a supply chain. Journal of Operations Management, 26(3), 368–388.
Zhao, X., Sum, C. C., Qi, Y., Zhang, H., & Lee, T. S. (2006). A taxonomyof manufacturing strategies in China. Journal of Operations Management,24(5), 621–636.
Zhao, X., Flynn, B. B., & Roth, A. V. (2007). Decision science research in China:Current status, opportunities, and propositions for research in supply chainmanagement, logistics, and quality management. Decision Sciences, 38(1),39–80.
APPENDIX: ITEMS AND SCALES
The following items are rated from 1 = Strongly Disagree to 7 = Strongly Agree
Table A1: Factor analysis for supply chain strategy.
Lean Strategy Agile StrategyEigenvalue = 3.02 Eigenvalue = 2.70
Cronbach’s Cronbach’sAlpha = 0.79 Alpha = 0.75
LS1. Our supply chain suppliespredictable products
.717 −.015
LS2. Our supply chain reduces anykind of waste as much as possible
.758 .183
LS3. Our supply chain reduces coststhrough mass production.
.566 .182
LS4. Our supply chain providescustomer with standardizedproductsa
NA NA
LS5. Our supply chain needs tomaintain a long and rigidrelationship with a small number ofsuppliers
.718 .057
LS6. Our supply chain selects thesuppliers based on their performanceon cost and quality
.733 .157
Continued

692 Supply Chain Strategy and Product Characteristics
Table A1: (Continued)
Lean Strategy Agile StrategyEigenvalue = 3.02 Eigenvalue = 2.70
Cronbach’s Cronbach’sAlpha = 0.79 Alpha = 0.75
LS7. Our supply chain structureseldom changes
.638 .039
AS1. Our supply chain always facesthe volatile customer demand
.020 .573
AS2. Our supply chain responds to thechanging market environmentquicklya
NA NA
AS3. It is necessary for our supplychain to maintain a higher capacitybuffer to respond to volatile market
.287 .525
AS4. Our supply chain providescustomer with personalized products
.002 .670
AS5. Our supply chain selects thesuppliers based on their performanceon flexibility and responsiveness
.206 .677
AS6. Our supply chain needs tomaintain a short and flexiblerelationship with a large number ofsuppliers
.149 .715
AS7. Our supply chain structure oftenchanges in order to cope withvolatile market
.015 .760
Note: The numbers greater than 0.50 are in bold.aThese items were dropped from the final construct due to low loadings on the primaryfactor (below 0.50) or high cross-loadings (above 0.40).
Operational performance (OP) rated from 1 = Much Worse than Competition to7 = Much Better than Competition.
Table A2: Factor analysis for operational performance.
Customer Service Operating CostEigenvalue = 5.18 Eigenvalue = 2.86
Cronbach’s Alpha = 0.90 Cronbach’s Alpha = 0.77
OP1. Unit manufacturing cost .122 .714OP2. Inventory turnover .171 .763OP3. Overall labor productivity .301 .651OP4. Stockout cost .131 .641OP5. Obsolescence cost .228 .672OP6. Overall product quality .674 .302OP7. Customer service level .771 .221OP8. Pre-sale customer service .756 .075OP9. Product supports .772 .088OP10. Responsiveness to customers .721 .113
Continued

Qi, Boyer, and Zhao 693
Table A2: (Continued)
Customer Service Operating CostEigenvalue = 5.18 Eigenvalue = 2.86
Cronbach’s Alpha = 0.90 Cronbach’s Alpha = 0.77
OP11. Delivery speed .697 .232OP12. Delivery dependability .692 .283OP13. Volume flexibility .683 .249OP14. Product mix flexibility .643 .214OP15. New product flexibility .630 .268
Note: The numbers greater than 0.50 are in bold.
Financial performance (FP) rated from 1 = Much Worse than Competition to 7 =Much Better than Competition.
Table A3: Factor analysis for financial performance.
Financial Performance Eigenvalue =3.96 Cronbach’s Alpha = 0.90
FP1. Return on investment (ROI) .853FP2. Return on sale (ROS) .808FP3. Market share .737FP4. Growth in ROI .852FP5. Growth in ROS .839FP6. Growth in market share .781
Note: The numbers greater than 0.50 are in bold.
Product Characteristics (PC)—To what extent are the following statements suit-able descriptions of your company’s end products or production process? (Ratedfrom 1 = Most Unsuitable to 7 = Most Suitable)PC4 was rated on the following scale:1 = <3 months, 2 = 3–6 months, 3 = 7–11 months, 4 = 1–2 years, 5 = 2–3 years,6 = 3–5 years, 7 = >5 years
Table A4: Factor analysis for product characteristics.
Innovative FunctionalEigenvalue = 1.38 Eigenvalue = 1.32
PC1. The demand of each type of endproduct vary quickly
.841 −.055
PC2. The new product’stime-to-market is very short
.787 .225
PC3. The volume of each type of endproduct is very high
−.056 .828
PC4. The introduction interval of newproducts
.223 .763
Note: The numbers greater than 0.50 are in bold.

694 Supply Chain Strategy and Product Characteristics
Item
Cor
rela
tion
s:
Agi
lesu
pply
chai
nSt
rate
gy(A
S)
Mea
nSD
LS1
LS2
LS3
LS4
LS5
LS6
LS7
AS1
Lea
nSu
pply
Cha
inSt
rate
gy(L
S)A
S14.
571.
260
0.12
0.14
−0.0
2−0
.01
0.08
0.12
1A
S2M
ean
SDL
S1A
S25.
081.
160.
250.
440.
270.
210.
240.
390.
240.
331
AS3
LS1
5.19
1.09
1L
S2A
S34.
921.
160.
160.
220.
260.
160.
210.
260.
180.
260.
391
AS4
LS2
5.27
1.24
0.49
1L
S3A
S44.
611.
440.
040.
080.
060.
140.
070.
10.
080.
210.
20.
341
AS5
LS3
51.
240.
30.
381
LS4
AS5
4.93
1.13
0.14
0.28
0.19
0.12
0.12
0.22
0.16
0.38
0.43
0.3
0.36
1A
S6L
S4∗
5.29
1.18
0.3
0.33
0.28
1L
S5A
S64.
961.
180.
130.
220.
160.
150.
130.
220.
090.
310.
420.
280.
360.
421
AS7
LS5
5.31
1.17
0.4
0.42
0.32
0.53
1L
S6A
S74.
841.
230.
020.
160.
160.
10.
090.
11−0
.02
0.31
0.36
0.35
0.37
0.4
0.53
1L
S65.
371.
180.
380.
540.
340.
470.
491
Fina
ncia
lper
form
ance
(FP)
FP1
LS7
4.94
1.18
0.38
0.39
0.25
0.19
0.35
0.32
FP1
4.57
1.09
0.15
0.13
0.18
0.26
0.26
0.27
0.05
−0.0
40.
140.
190.
180.
130.
160.
131
FP2
OP1
0FP
24.
641.
090.
140.
170.
130.
240.
280.
260.
09−0
.03
0.12
0.13
0.14
0.11
0.06
0.11
0.73
1FP
3O
P10
1O
P11
FP3
4.68
1.14
0.09
0.11
0.11
0.2
0.17
0.21
0.15
−0.0
50.
130.
130.
150.
090.
080.
050.
590.
531
FP4
OP1
10.
181
OP1
2FP
44.
611.
150.
060.
030.
140.
210.
160.
180.
080.
030.
140.
210.
190.
10.
130.
160.
620.
580.
541
FP5
OP1
20.
220.
231
OP1
3FP
54.
651.
110.
050.
050.
170.
210.
190.
20.
040.
050.
150.
180.
210.
130.
20.
220.
620.
540.
50.
761
FP6
OP1
30.
130.
190.
211
OP1
4FP
64.
71.
130
0.02
0.13
0.2
0.14
0.19
0.01
0.01
0.11
0.17
0.23
0.14
0.14
0.19
0.57
0.51
0.46
0.61
0.64
1O
P14
0.39
0.35
0.32
0.32
1
Ope
ratin
gC
ostP
erfo
rman
ce(O
S)O
P1O
P15
0.42
0.38
0.29
0.35
0.29
OP1
4.76
1.04
0.15
0.09
0.17
0.16
0.14
0.26
0.11
0.03
0.13
0.14
0.14
0.19
0.1
0.12
0.36
0.36
0.36
0.38
0.39
0.45
1O
P2O
P24.
921.
150.
190.
230.
210.
20.
260.
320.
240.
050.
210.
140.
110.
110.
060.
020.
360.
330.
370.
320.
320.
30.
511
OP3
OP3
5.07
1.1
0.22
0.32
0.22
0.25
0.26
0.37
0.25
0.06
0.29
0.2
0.11
0.26
0.21
0.14
0.38
0.36
0.38
0.36
0.37
0.39
0.42
0.47
1O
P4O
P44.
651.
120.
220.
110.
150.
20.
170.
240.
130.
130.
130.
190.
20.
140.
110.
010.
270.
240.
250.
260.
260.
240.
280.
340.
331
OP5
OP5
4.91
1.18
0.27
0.28
0.2
0.19
0.18
0.28
0.21
0.14
0.22
0.18
0.12
0.24
0.2
0.1
0.32
0.33
0.25
0.28
0.31
0.25
0.34
0.42
0.37
0.47
1
Cus
tom
erSe
rvic
e(C
S)Pe
rfor
man
ceO
P6O
P65.
441.
080.
310.
360.
250.
430.
390.
460.
240.
020.
260.
220.
120.
180.
220.
130.
390.
420.
320.
320.
320.
280.
260.
310.
390.
250.
111
OP7
OP7
5.43
1.12
0.29
0.3
0.18
0.32
0.33
0.42
0.15
0.06
0.26
0.2
0.12
0.19
0.23
0.19
0.35
0.38
0.25
0.32
0.31
0.27
0.23
0.31
0.38
0.25
0.03
0.05
1O
P8O
P85.
331.
130.
270.
170.
150.
320.
270.
290.
120.
050.
20.
20.
180.
150.
160.
210.
320.
290.
220.
280.
310.
230.
20.
20.
220.
230.
130.
210.
291
OP9
OP9
5.42
1.11
0.28
0.21
0.18
0.33
0.28
0.35
0.14
0.01
0.25
0.29
0.16
0.15
0.17
0.2
0.32
0.35
0.27
0.34
0.37
0.27
0.2
0.21
0.29
0.2
0.14
0.14
0.2
0.19
1O
P10
5.44
1.05
0.22
0.25
0.19
0.27
0.26
0.27
0.15
0.06
0.28
0.17
0.18
0.24
0.22
0.25
0.29
0.3
0.23
0.25
0.3
0.26
0.2
0.24
0.34
0.15
0.14
0.11
0.11
0.2
0.12
OP1
15.
621.
030.
320.
310.
230.
320.
340.
360.
210
0.28
0.21
0.04
0.18
0.19
0.15
0.33
0.34
0.2
0.24
0.25
0.2
0.23
0.29
0.39
0.19
0.19
0.11
0.26
0.14
0.24
OP1
25.
621.
070.
340.
350.
250.
390.
390.
390.
210.
020.
270.
210.
120.
160.
190.
150.
330.
340.
210.
240.
270.
210.
240.
350.
360.
250.
10.
060.
210.
110.
2O
P13
5.38
1.06
0.26
0.33
0.27
0.35
0.34
0.34
0.19
0.12
0.31
0.3
0.21
0.22
0.21
0.2
0.29
0.28
0.22
0.27
0.3
0.21
0.27
0.32
0.31
0.22
0.12
0.02
0.14
0.01
0.1
OP1
45.
21.
160.
110.
120.
240.
250.
170.
270.
090.
140.
230.
320.
310.
260.
250.
270.
320.
260.
250.
310.
350.
280.
240.
260.
310.
230.
360.
360.
380.
270.
32O
P15
5.24
1.23
0.14
0.13
0.19
0.23
0.18
0.25
0.07
0.12
0.24
0.28
0.34
0.26
0.27
0.33
0.32
0.24
0.25
0.35
0.38
0.32
0.29
0.28
0.34
0.26
0.36
0.33
0.36
0.24
0.33
Not
e:A
llco
rrel
atio
ns>
0.07
are
sign
ifica
ntat
p<
.05,
allc
orre
latio
ns>
0.09
are
sign
ifica
ntat
p<
.01.

Qi, Boyer, and Zhao 695
Yinan Qi is an assistant professor of operations management at the School ofBusiness, University of International Business and Economics. He received aPhD in operations management from The Chinese University of Hong Kong andjoined the University of International Business and Economics in 2006. He hastaught courses on operations management, supply chain management, and businessstrategy game. He has published several journal articles in publications includingJournal of Operations Management and International Journal of Operations andProduction Management.
Kenneth K. Boyer is a Dean’s Distinguished Professor of operations managementat the Fisher College of Business, Ohio State University. He is co-editor in chiefof the Journal of Operations Management. He previously was a professor ofsupply chain management at the Broad College of Management, Michigan StateUniversity from 2000 to 2008. Prior to that, he was an assistant/associate professorat DePaul University from 1995 to 2000. He earned a BS in mechanical engineeringfrom Brown University and an MA and a PhD in business administration from OhioState University. He worked as a project engineer with General Dynamics ElectricBoat Division in Groton, CT. He has published more than 40 journal articles inpublications including Management Science, Journal of Operations Management,and Production and Operations Management Sciences.
Xiande Zhao is a professor of operations management in the Department ofDecision Sciences and Managerial Economics and is director of the Center forSupply Chain Management and Logistics, Li and Fung Institute of Supply ChainManagement and Logistics, The Chinese University of Hong Kong. He receivedhis PhD in operations management and a minor in international business at theUniversity of Utah. He has published more than 50 journal articles in Journalof Operations Management, Production and Operations Management, Journal ofConsumer Research, and International Journal of Production Research. He is anassociate editor of the Journal of Operations Management, Decision Sciences,Operations Management Research, and International Journal of Business andSystems. He is the president of the Asia Pacific Institute of Decision Sciences andInternational Association of Information and Management Sciences.

This document is a scanned copy of a printed document. No warranty is given about the accuracy of the copy.
Users should refer to the original published version of the material.