
Supply Chain Insights LLC Copyright © 2015, p. 1 Sales and Operations Planning Study Summary Charts...
54
Supply Chain Insights LLC Copyright © 2015, Sales and Operations Planning Study Summary Charts January 6 – September 14, 2015
-
Upload
alexia-hardy -
Category
Documents
-
view
213 -
download
0
Transcript of Supply Chain Insights LLC Copyright © 2015, p. 1 Sales and Operations Planning Study Summary Charts...

Supply Chain Insights LLC Copyright © 2015, p. 1
Sales and Operations Planning Study
Summary ChartsJanuary 6 – September 14, 2015

Supply Chain Insights LLC Copyright © 2015, p. 2
Agenda
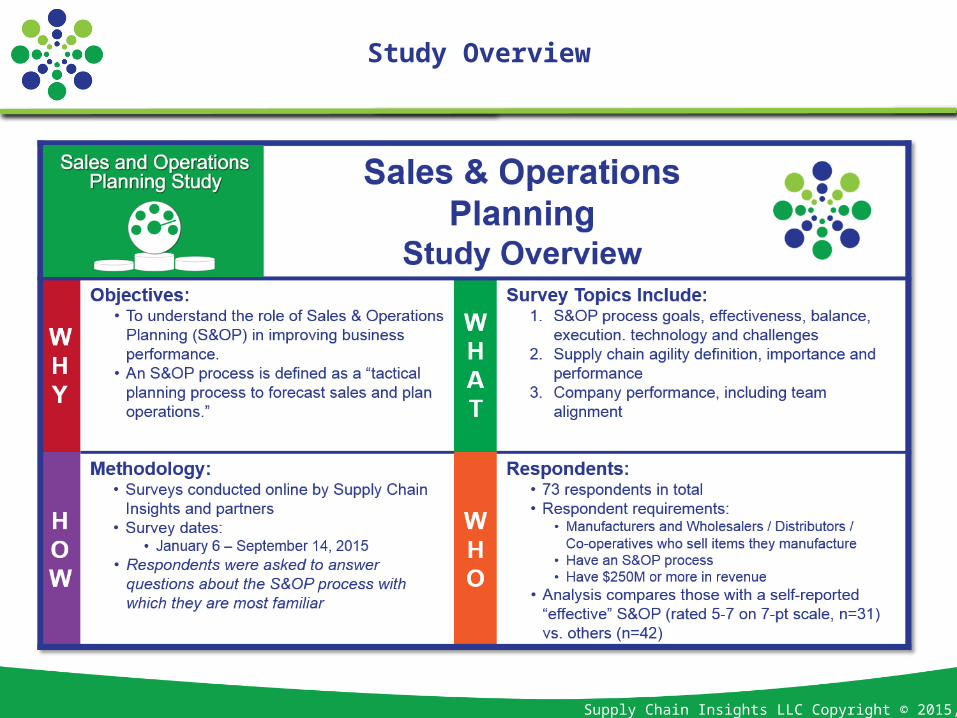
Study Overview
Sales & Operations Planning
Supply Chain Agility
Company Performance
Supply Chain Insights LLC Copyright © 2015, p. 3
Study Overview

Supply Chain Insights LLC Copyright © 2015, p. 4
Most Respondents Are Manufacturers, in Process Industries, and with $6B in Revenue on Average

Supply Chain Insights LLC Copyright © 2015, p. 5
Top Industries for Respondents Include Food & Beverage, Chemical, and Consumer Packaged Goods

Supply Chain Insights LLC Copyright © 2015, p. 6
The Majority of Respondents Work in a Supply Chain Role,Primarily at the Director or Manager Levels,
and Are Based in North America or Western Europe

Supply Chain Insights LLC Copyright © 2015, p. 7
Agenda
Study Overview
Sales & Operations Planning
Supply Chain Agility
Company Performance

Supply Chain Insights LLC Copyright © 2015, p. 8
Performance Summary
Supply Chain Insights LLC Copyright © 2015, p. 9
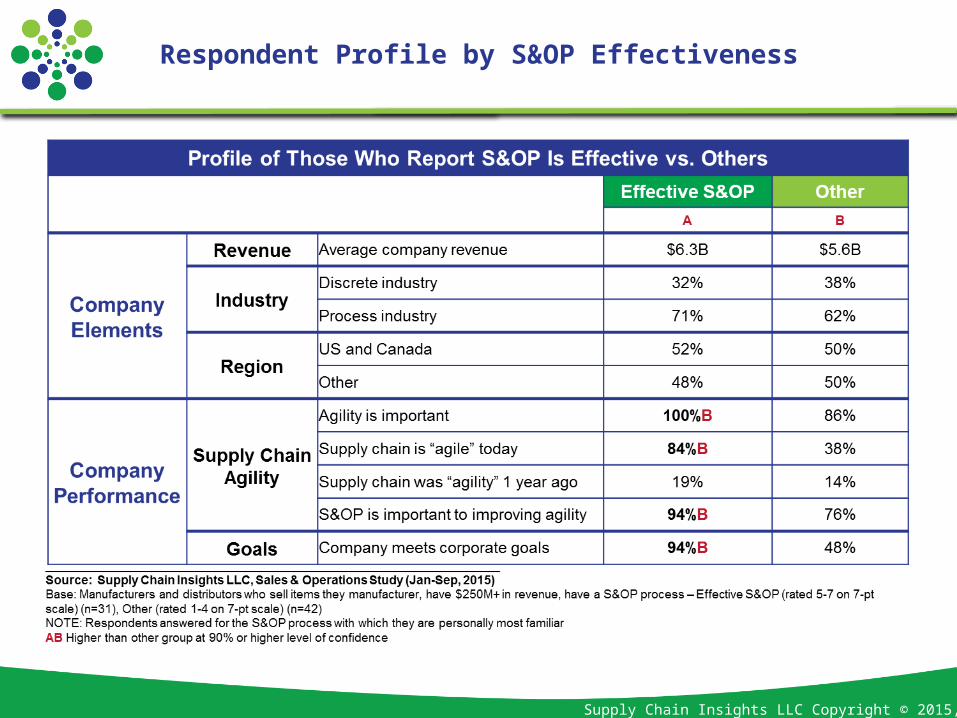
Respondent Profile by S&OP Effectiveness

Supply Chain Insights LLC Copyright © 2015, p. 10
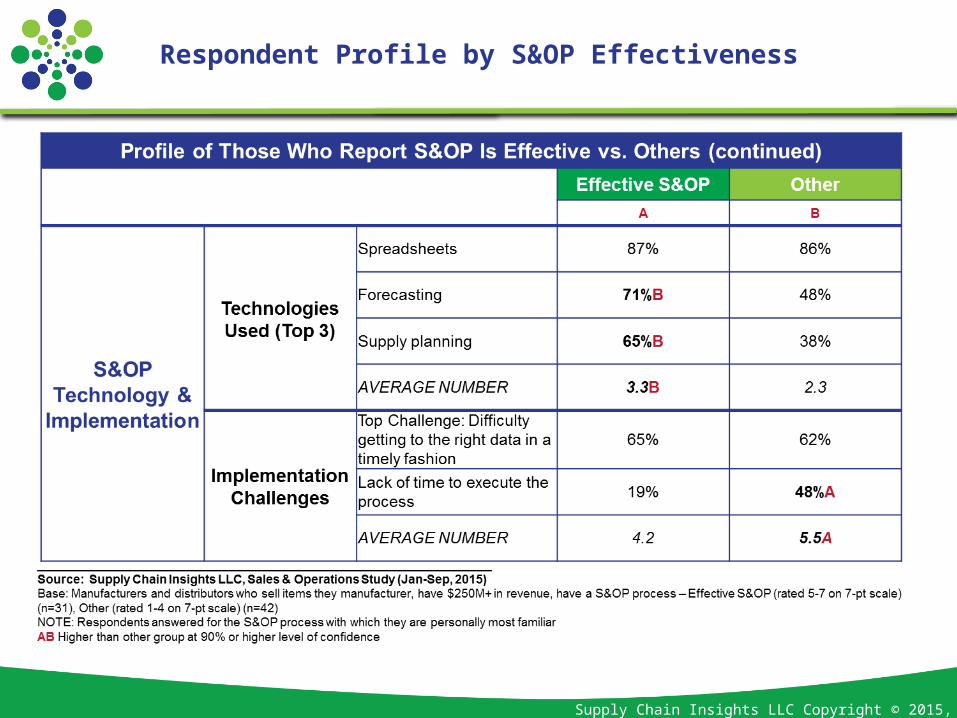
Respondent Profile by S&OP Effectiveness
Supply Chain Insights LLC Copyright © 2015, p. 11
Respondent Profile by S&OP Effectiveness

Supply Chain Insights LLC Copyright © 2015, p. 12
Over Two-Thirds Use “S&OP” to Describe the Process
Supply Chain Insights LLC Copyright © 2015, p. 13
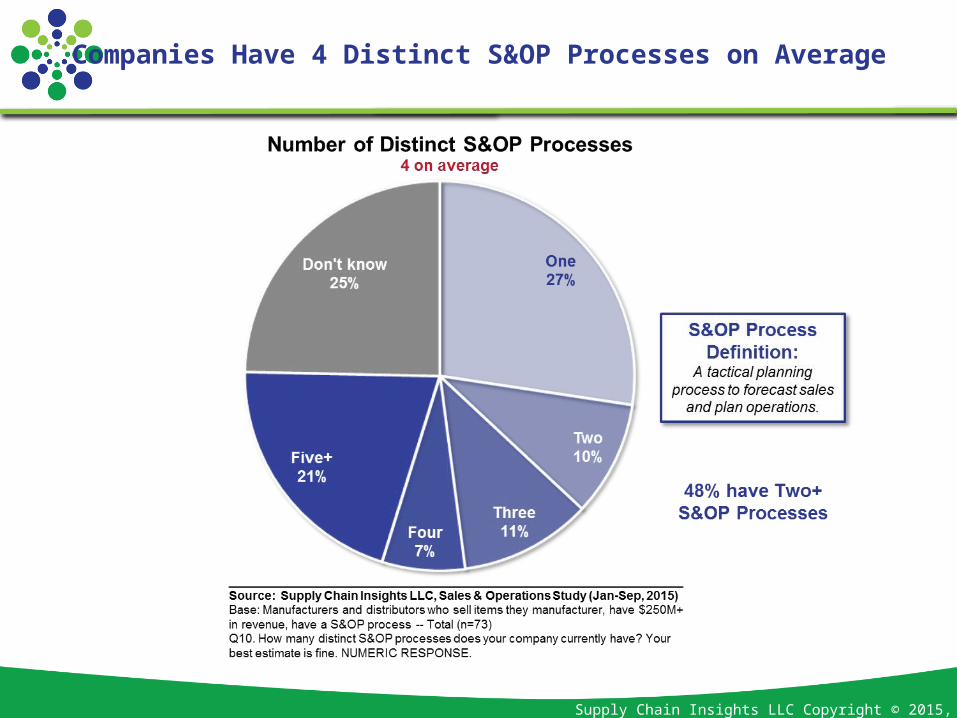
Companies Have 4 Distinct S&OP Processes on Average
Supply Chain Insights LLC Copyright © 2015, p. 14
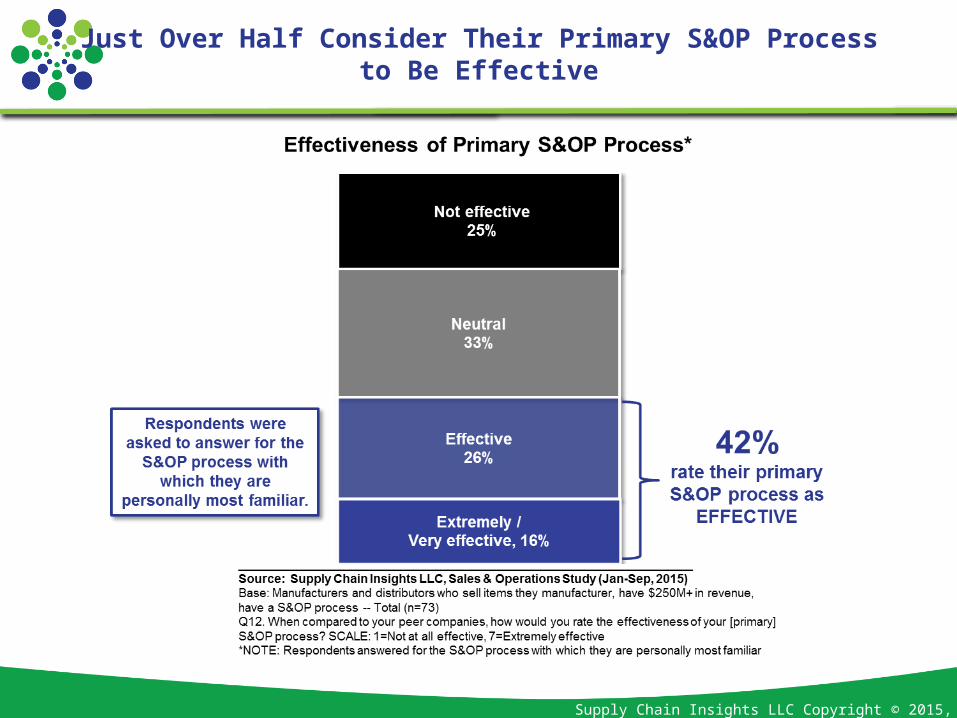
Just Over Half Consider Their Primary S&OP Processto Be Effective

Supply Chain Insights LLC Copyright © 2015, p. 15
Volunteered Reasons for Why Primary S&OP ProcessIs Effective
Supply Chain Insights LLC Copyright © 2015, p. 16
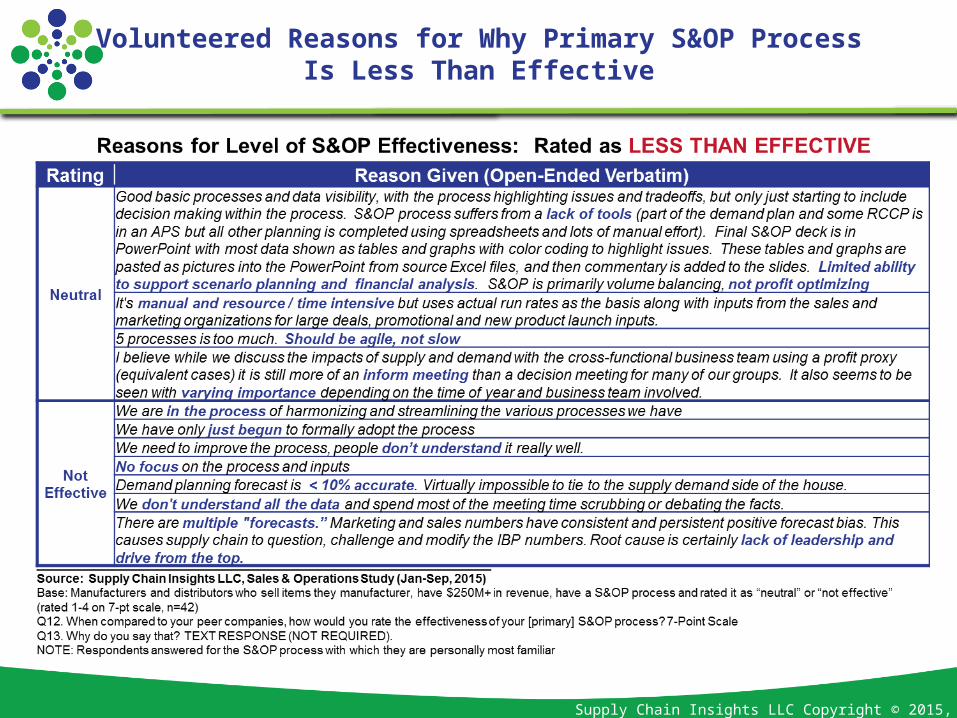
Volunteered Reasons for Why Primary S&OP ProcessIs Less Than Effective
Supply Chain Insights LLC Copyright © 2015, p. 17
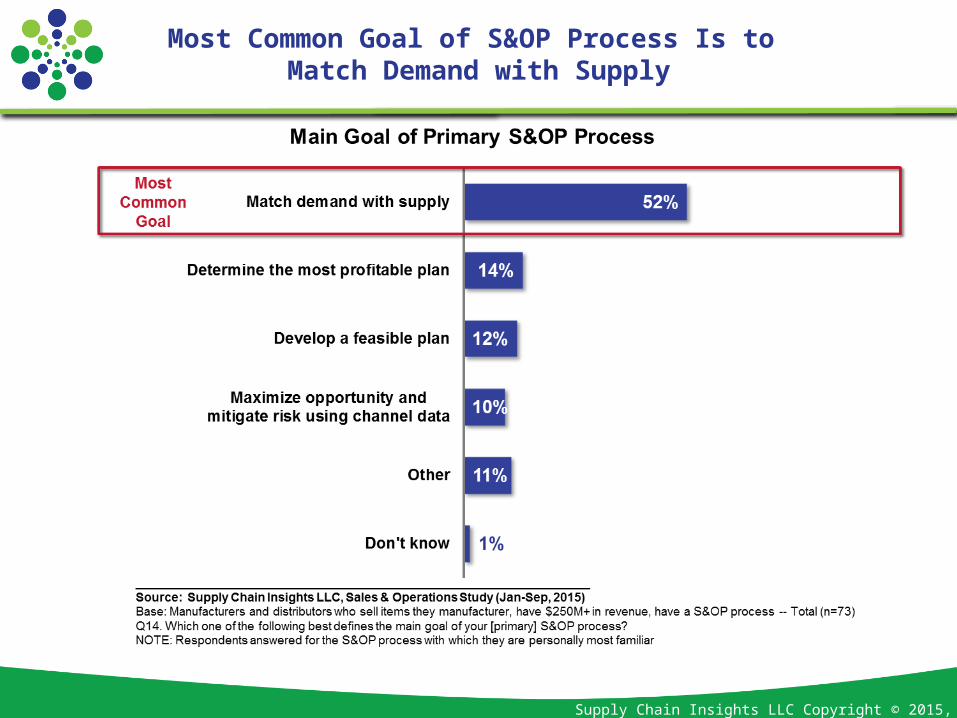
Most Common Goal of S&OP Process Is to Match Demand with Supply

Supply Chain Insights LLC Copyright © 2015, p. 18
Those Who Report an Effective S&OP Are More Likelyto Say the Goal Is to Determine the Most Profitable Plan
Supply Chain Insights LLC Copyright © 2015, p. 19
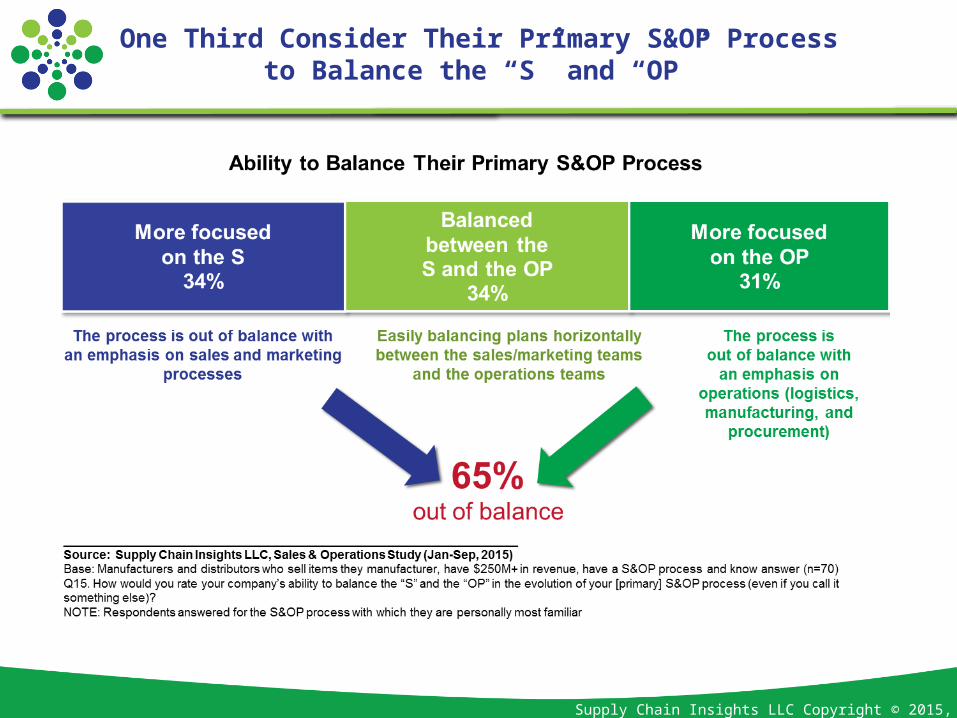
One Third Consider Their Primary S&OP Processto Balance the “S” and “OP”
Supply Chain Insights LLC Copyright © 2015, p. 20
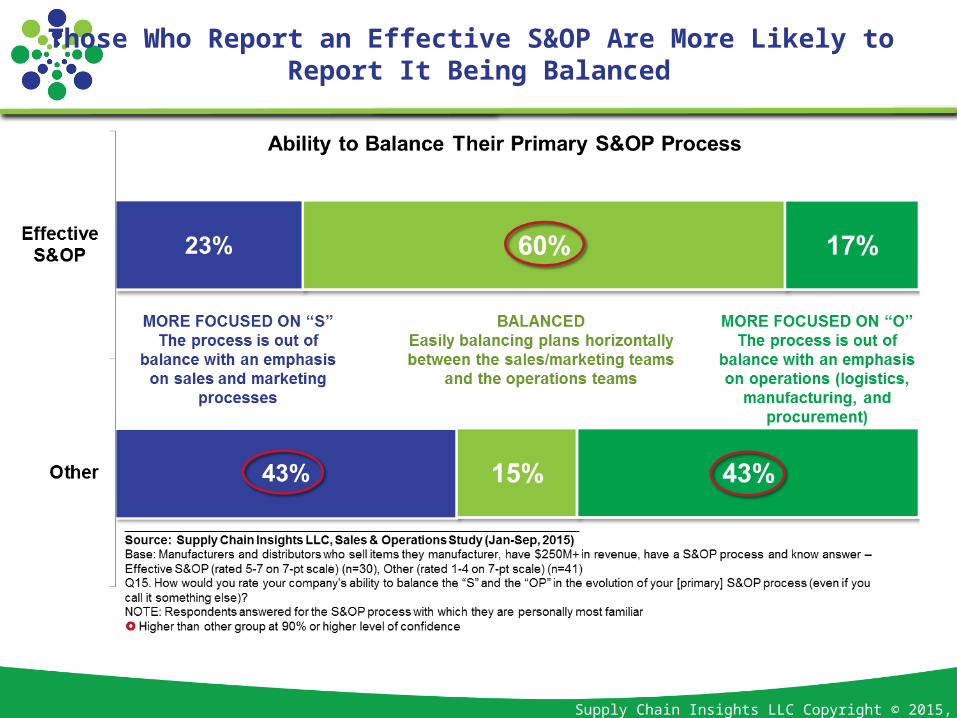
Those Who Report an Effective S&OP Are More Likely to Report It Being Balanced

Supply Chain Insights LLC Copyright © 2015, p. 21
Two-Fifths Report Primary S&OP ProcessIs Executed at Least Most of the Time
Supply Chain Insights LLC Copyright © 2015, p. 22
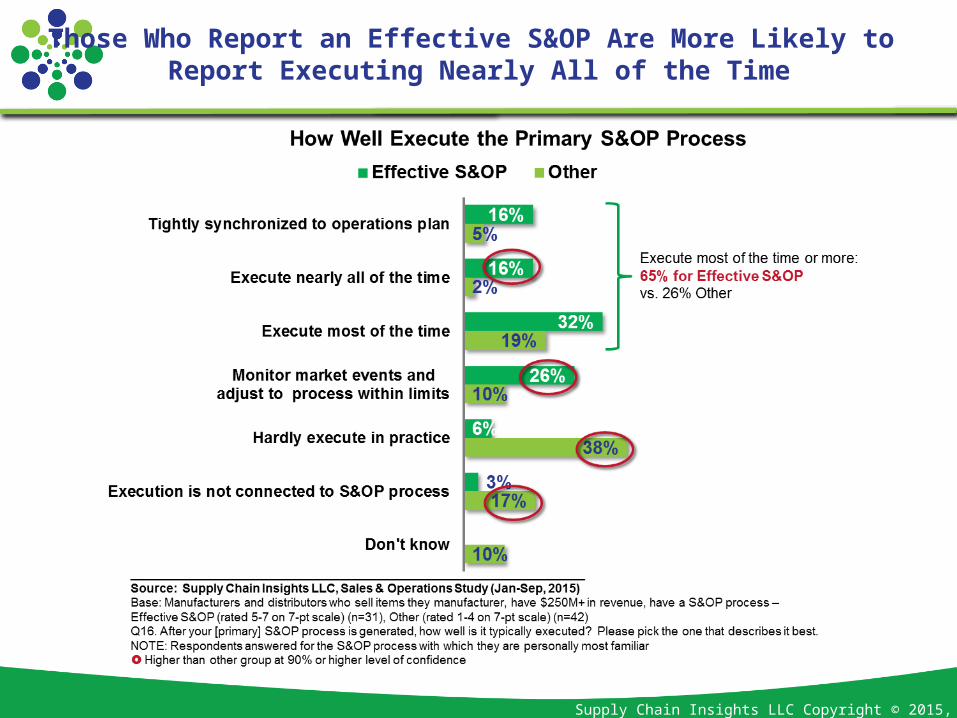
Those Who Report an Effective S&OP Are More Likely to Report Executing Nearly All of the Time
Supply Chain Insights LLC Copyright © 2015, p. 23
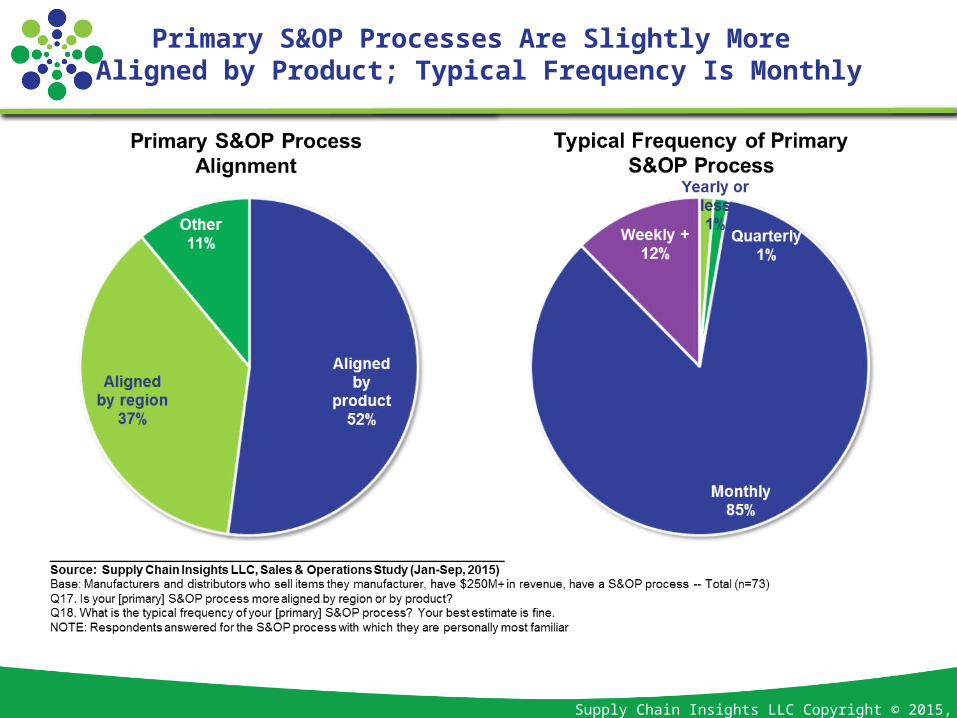
Primary S&OP Processes Are Slightly More Aligned by Product; Typical Frequency Is Monthly
Supply Chain Insights LLC Copyright © 2015, p. 24
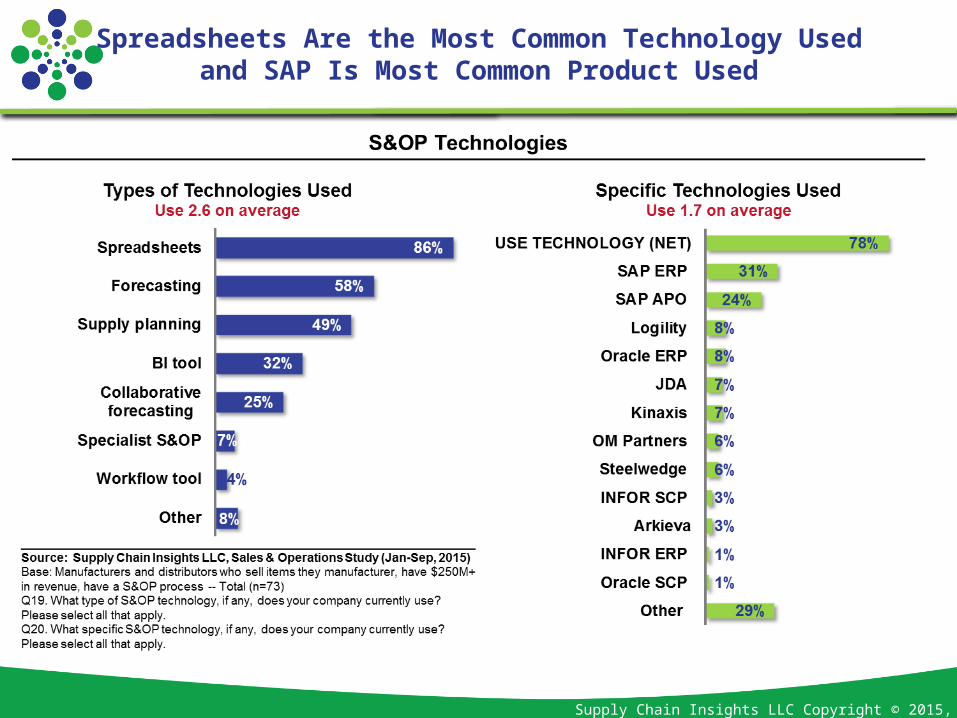
Spreadsheets Are the Most Common Technology Usedand SAP Is Most Common Product Used
Supply Chain Insights LLC Copyright © 2015, p. 25
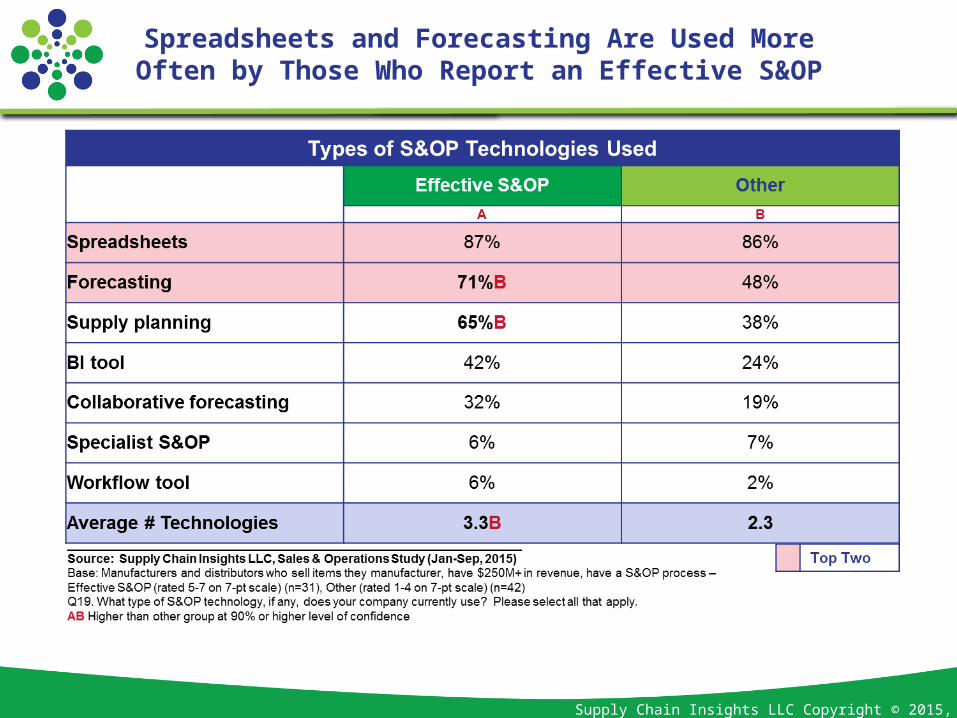
Spreadsheets and Forecasting Are Used MoreOften by Those Who Report an Effective S&OP
Supply Chain Insights LLC Copyright © 2015, p. 26
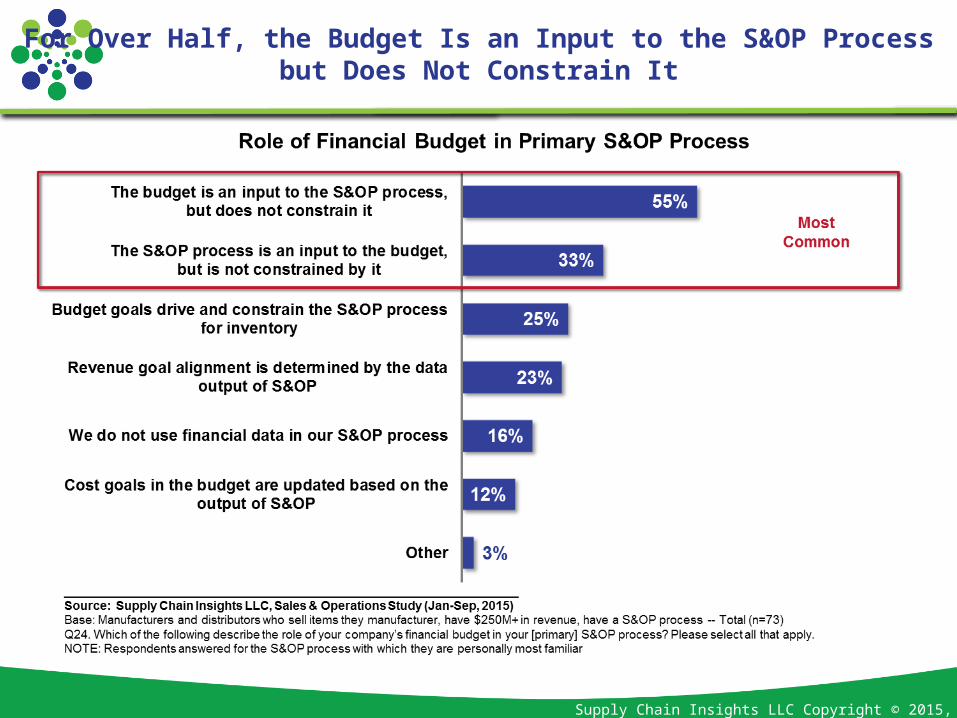
For Over Half, the Budget Is an Input to the S&OP Processbut Does Not Constrain It
Supply Chain Insights LLC Copyright © 2015, p. 27
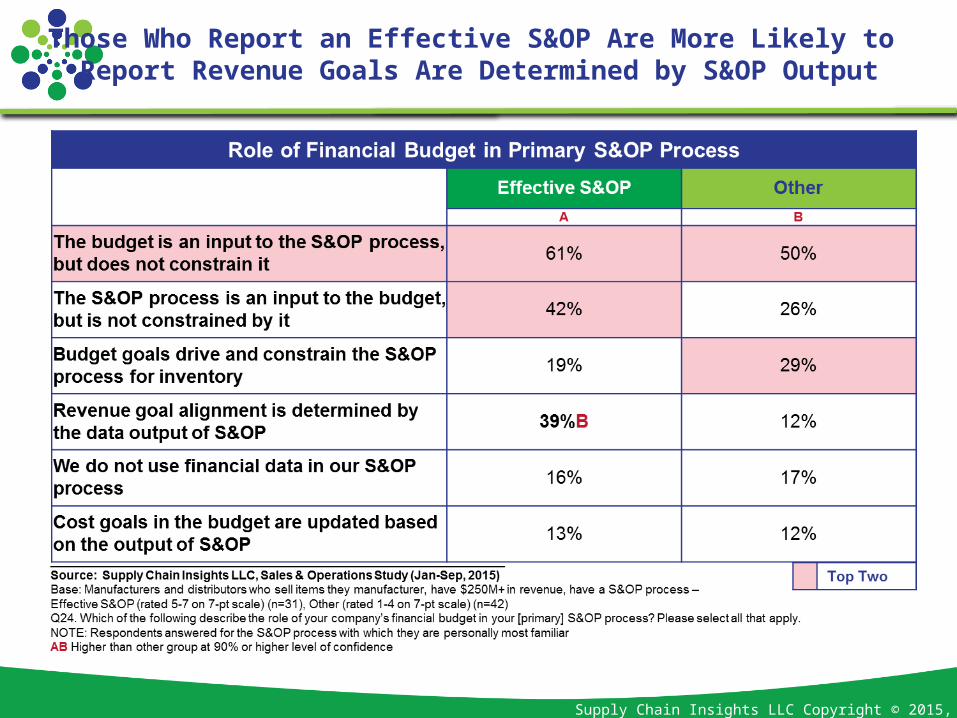
Those Who Report an Effective S&OP Are More Likely to Report Revenue Goals Are Determined by S&OP Output

Supply Chain Insights LLC Copyright © 2015, p. 28
Sales-Operations Collaboration Is Among Most Importantand Top Performing Element of S&OP Processes

Supply Chain Insights LLC Copyright © 2015, p. 29
Managing Opportunities/Risk, and Managing Process Flow Show Greatest Performance vs. Importance Gaps
Supply Chain Insights LLC Copyright © 2015, p. 30
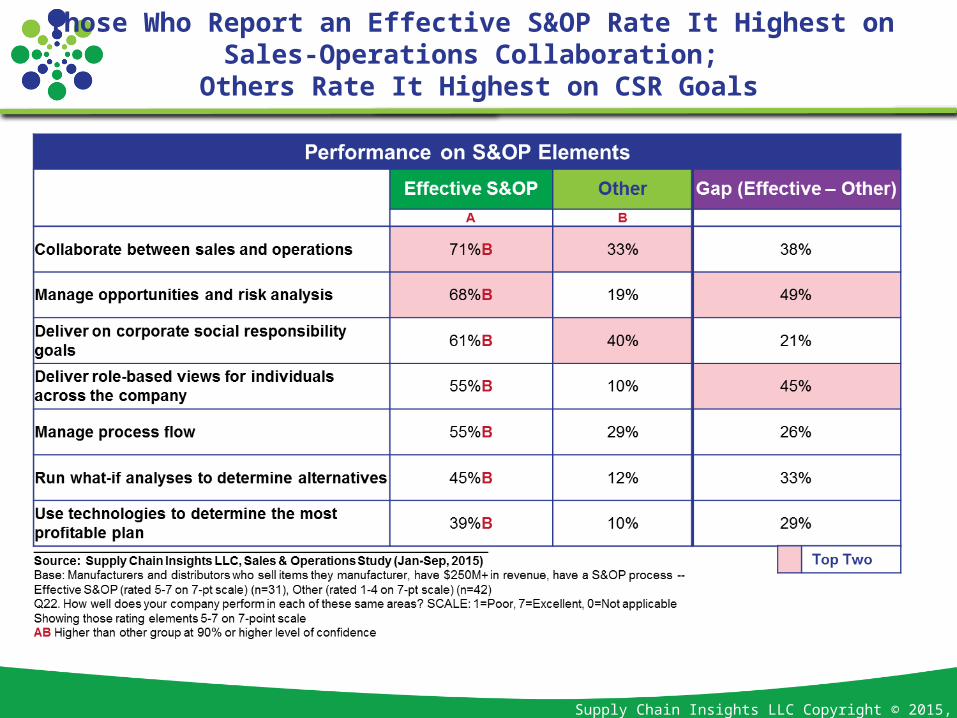
Those Who Report an Effective S&OP Rate It Highest on Sales-Operations Collaboration;
Others Rate It Highest on CSR Goals

Supply Chain Insights LLC Copyright © 2015, p. 31
Most Common Challenge with S&OP ImplementationIs Getting to Right Data in Timely Fashion
Supply Chain Insights LLC Copyright © 2015, p. 32
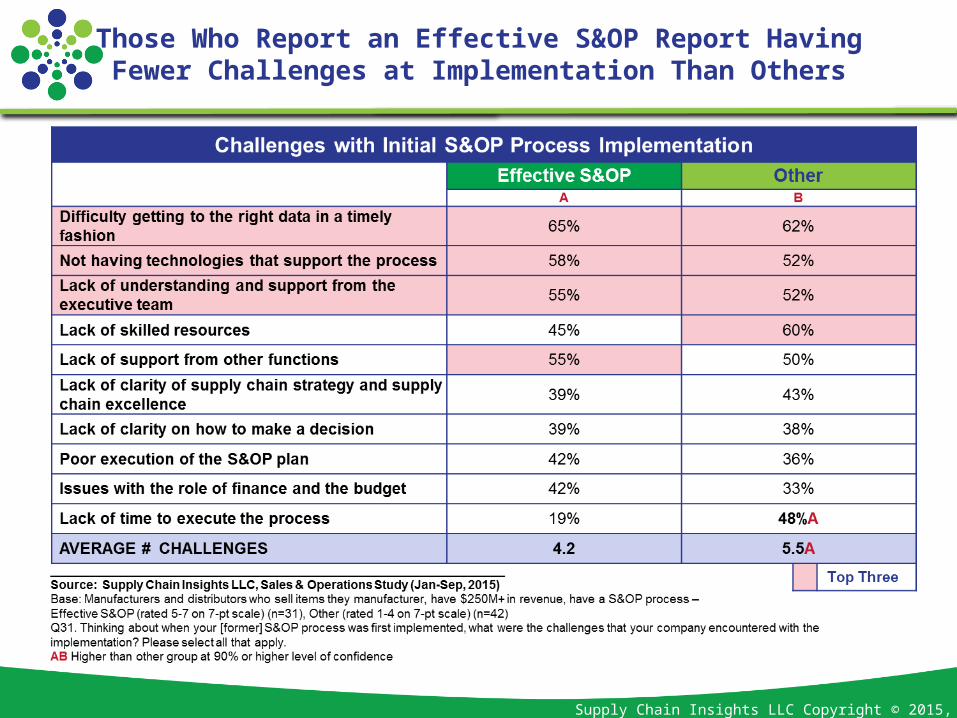
Those Who Report an Effective S&OP Report HavingFewer Challenges at Implementation Than Others
Supply Chain Insights LLC Copyright © 2015, p. 33
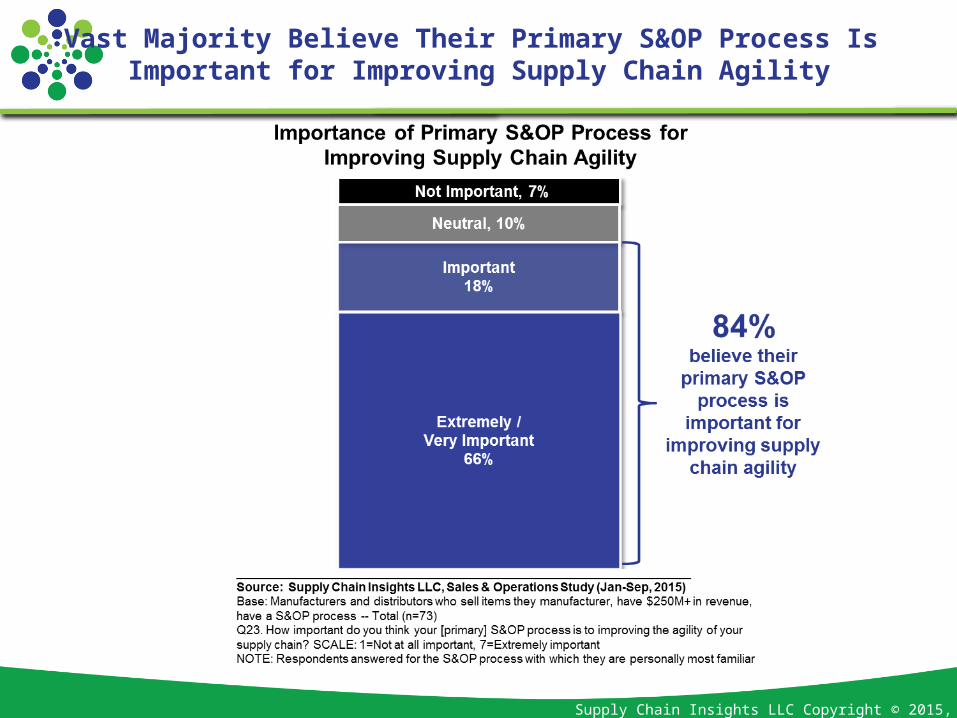
Vast Majority Believe Their Primary S&OP Process Is Important for Improving Supply Chain Agility

Supply Chain Insights LLC Copyright © 2015, p. 34
Those Who Report an Effective S&OP Are More Likelyto Believe It Improves Supply Chain Agility
Supply Chain Insights LLC Copyright © 2015, p. 35
Agenda
Study Overview
Sales & Operations Planning
Supply Chain Agility
Company Performance
Supply Chain Insights LLC Copyright © 2015, p. 36
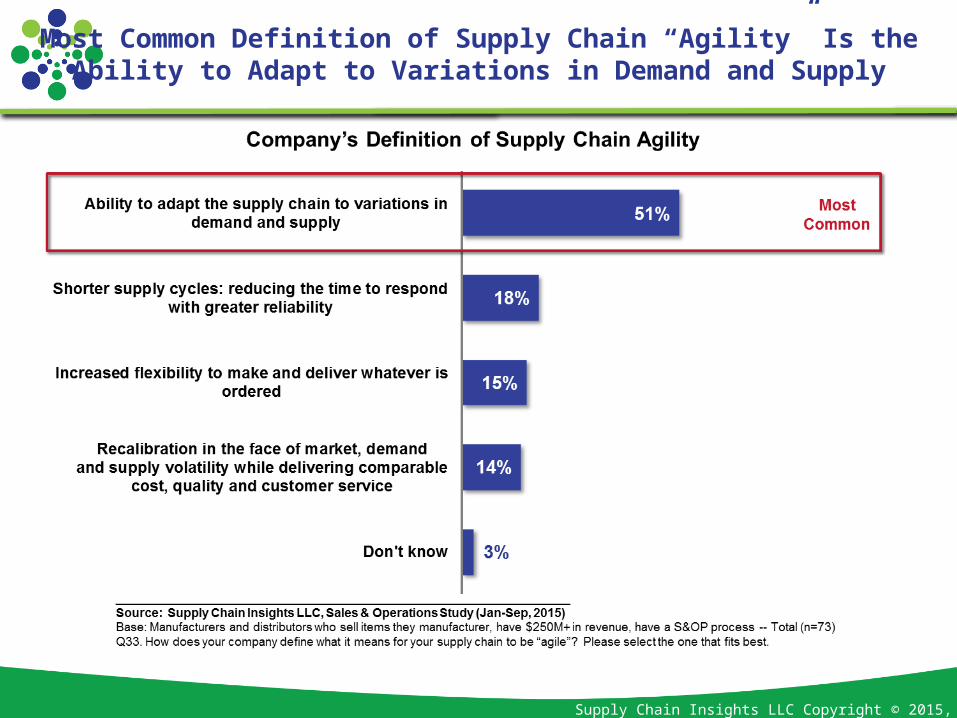
Most Common Definition of Supply Chain “Agility” Is theAbility to Adapt to Variations in Demand and Supply
Supply Chain Insights LLC Copyright © 2015, p. 37
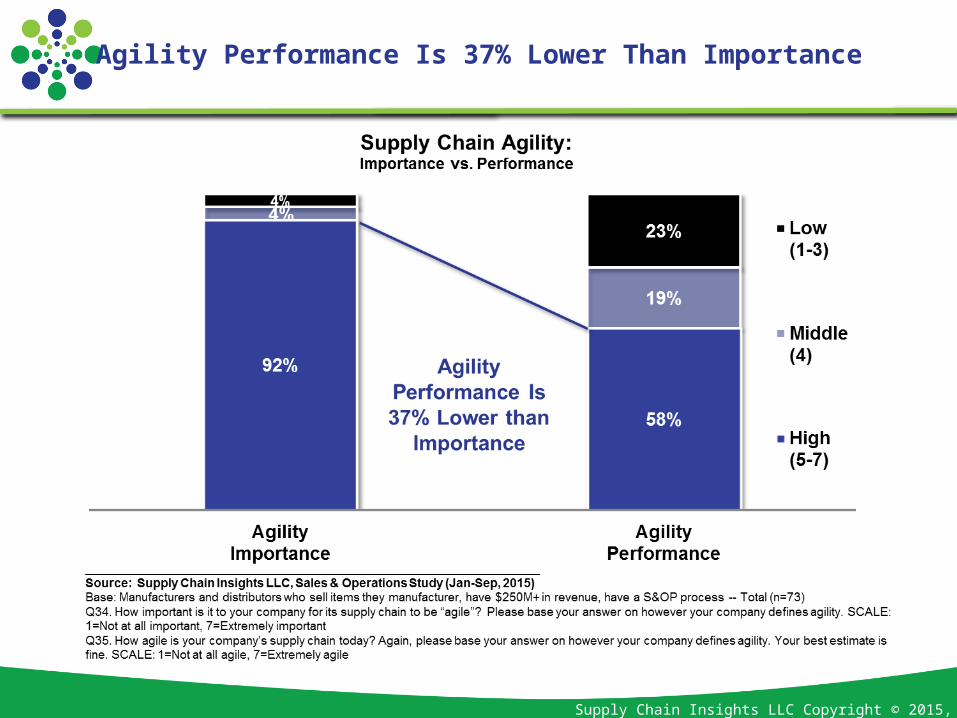
Agility Performance Is 37% Lower Than Importance
Supply Chain Insights LLC Copyright © 2015, p. 38
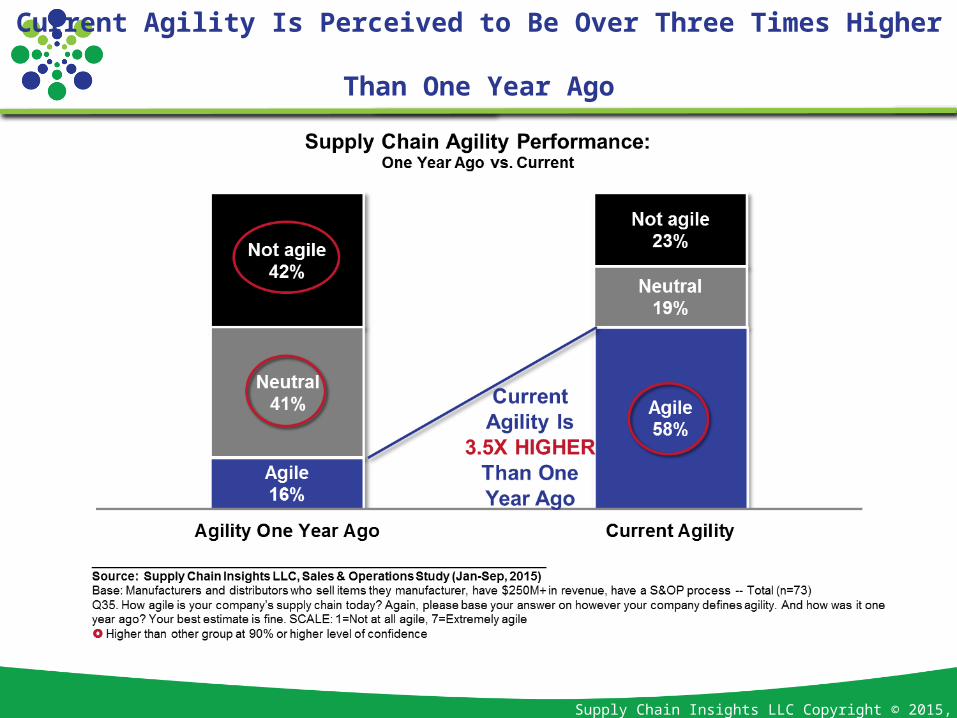
Current Agility Is Perceived to Be Over Three Times Higher Than One Year Ago
Supply Chain Insights LLC Copyright © 2015, p. 39
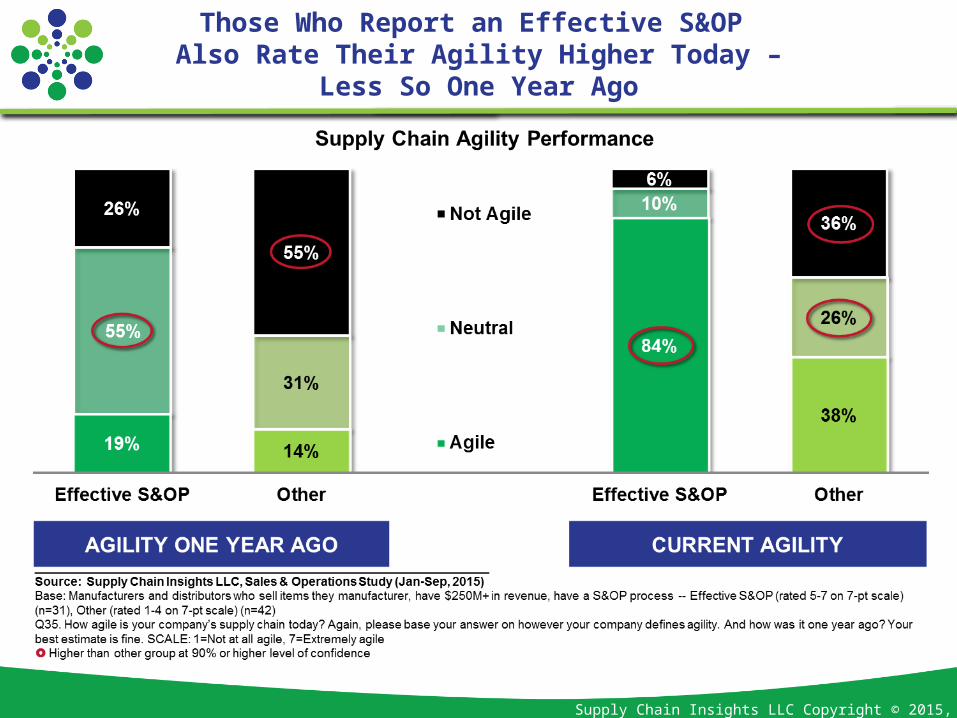
Those Who Report an Effective S&OP Also Rate Their Agility Higher Today –
Less So One Year Ago
Supply Chain Insights LLC Copyright © 2015, p. 40
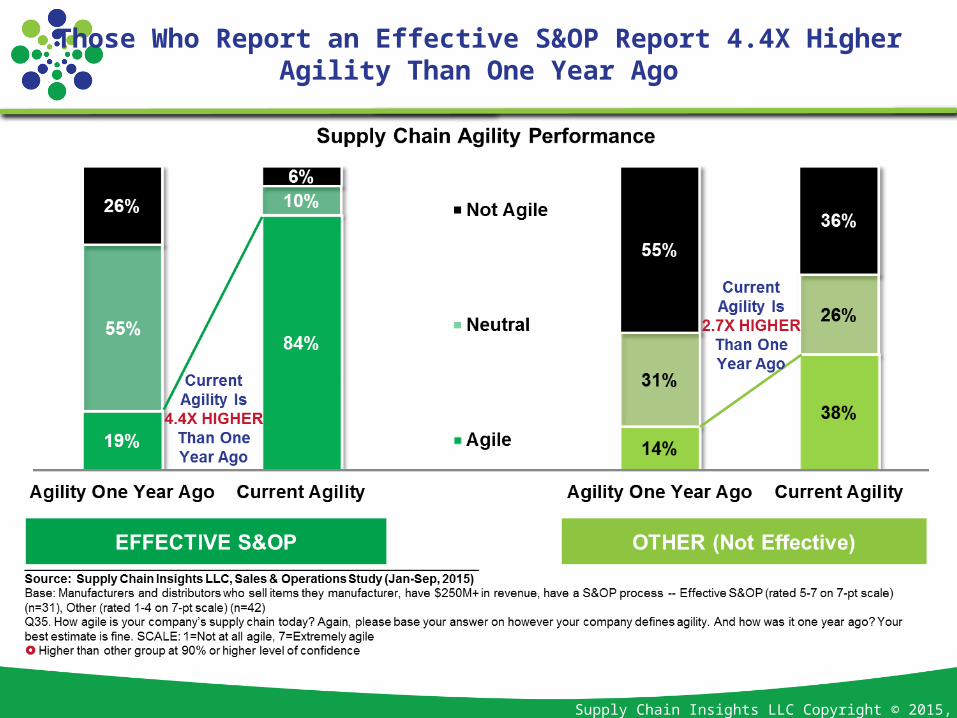
Those Who Report an Effective S&OP Report 4.4X HigherAgility Than One Year Ago
Supply Chain Insights LLC Copyright © 2015, p. 41
Agenda
Study Overview
Sales & Operations Planning
Supply Chain Agility
Company Performance
Supply Chain Insights LLC Copyright © 2015, p. 42
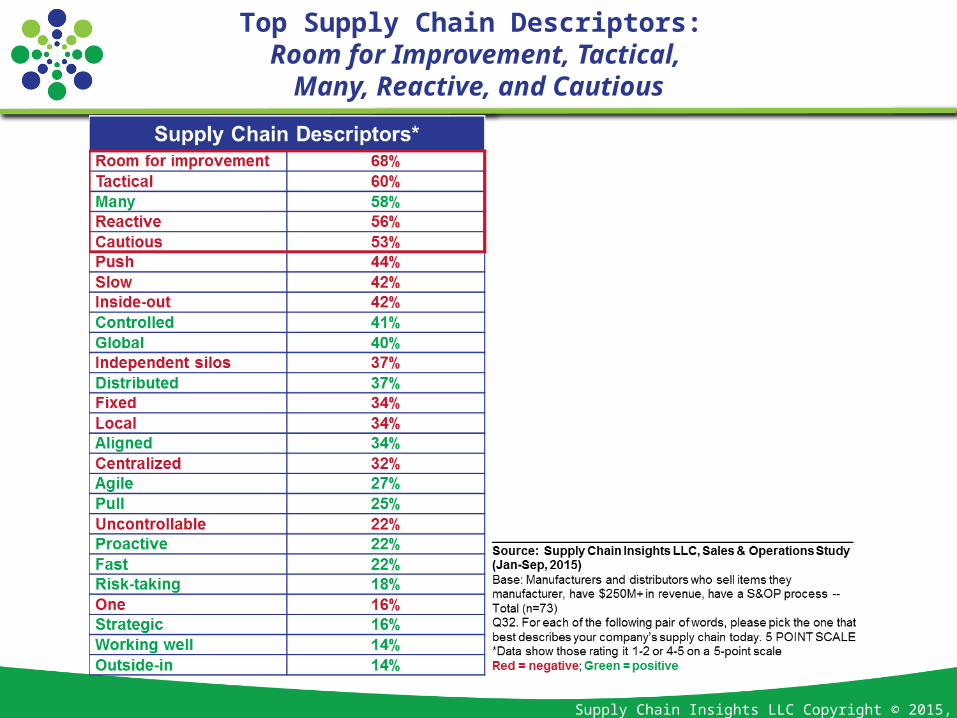
Top Supply Chain Descriptors: Room for Improvement, Tactical,
Many, Reactive, and Cautious
Supply Chain Insights LLC Copyright © 2015, p. 43
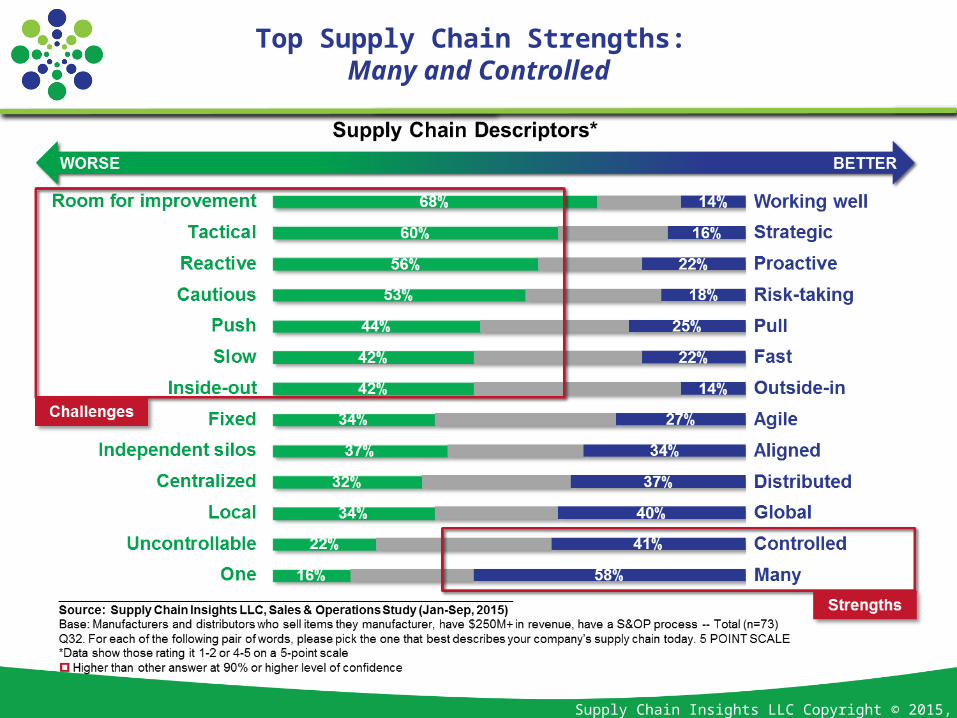
Top Supply Chain Strengths: Many and Controlled
Supply Chain Insights LLC Copyright © 2015, p. 44
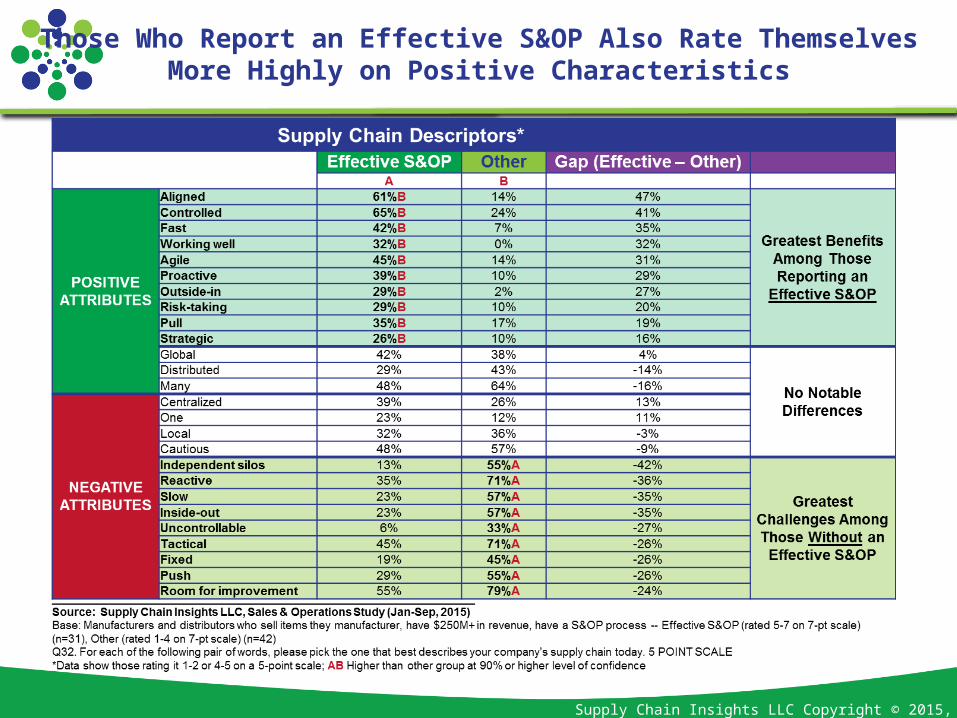
Those Who Report an Effective S&OP Also Rate ThemselvesMore Highly on Positive Characteristics
Supply Chain Insights LLC Copyright © 2015, p. 45
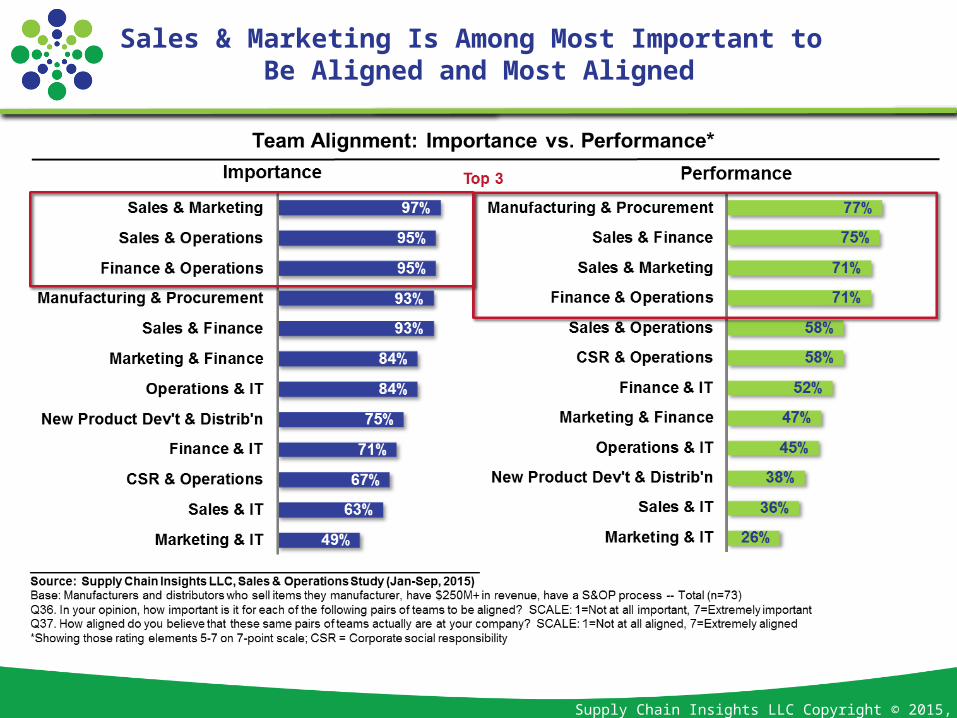
Sales & Marketing Is Among Most Important to Be Aligned and Most Aligned

Supply Chain Insights LLC Copyright © 2015, p. 46
Greatest Alignment Gaps Are with Operations & IT, Sales & Operations, Marketing & Finance, and
New Product Development & Distribution
Supply Chain Insights LLC Copyright © 2015, p. 47
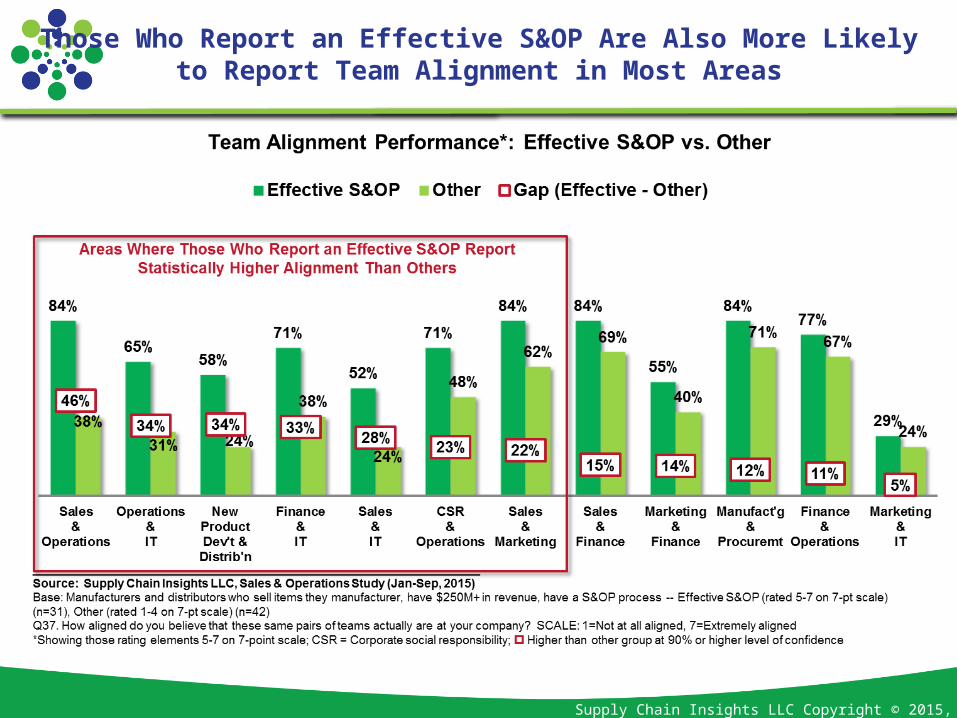
Those Who Report an Effective S&OP Are Also More Likelyto Report Team Alignment in Most Areas
Supply Chain Insights LLC Copyright © 2015, p. 48
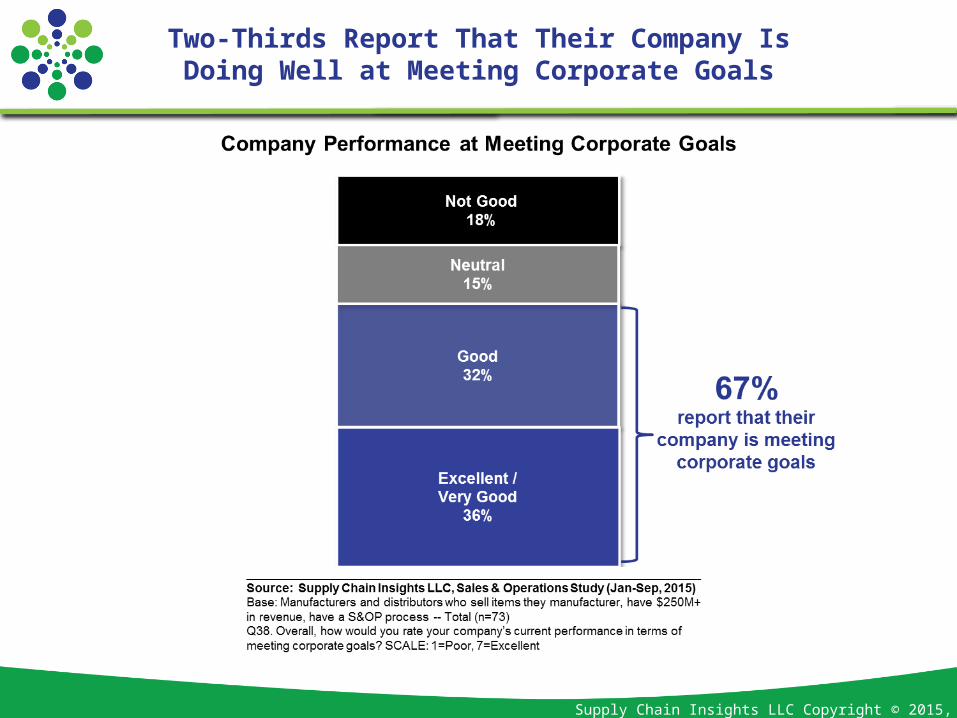
Two-Thirds Report That Their Company IsDoing Well at Meeting Corporate Goals
Supply Chain Insights LLC Copyright © 2015, p. 49
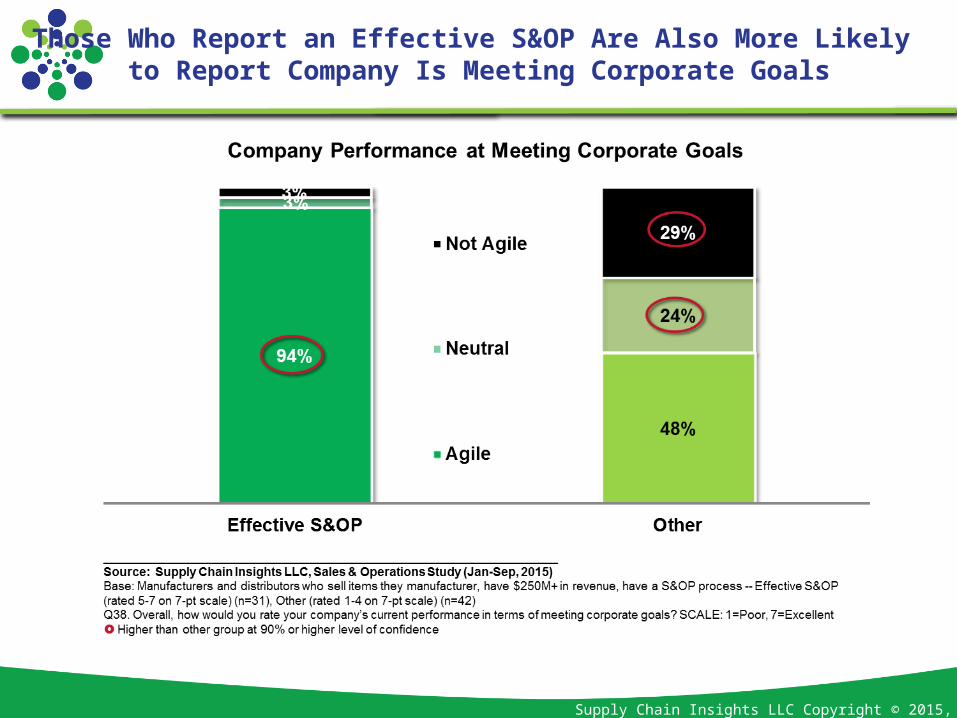
Those Who Report an Effective S&OP Are Also More Likely to Report Company Is Meeting Corporate Goals
Supply Chain Insights LLC Copyright © 2015, p. 50
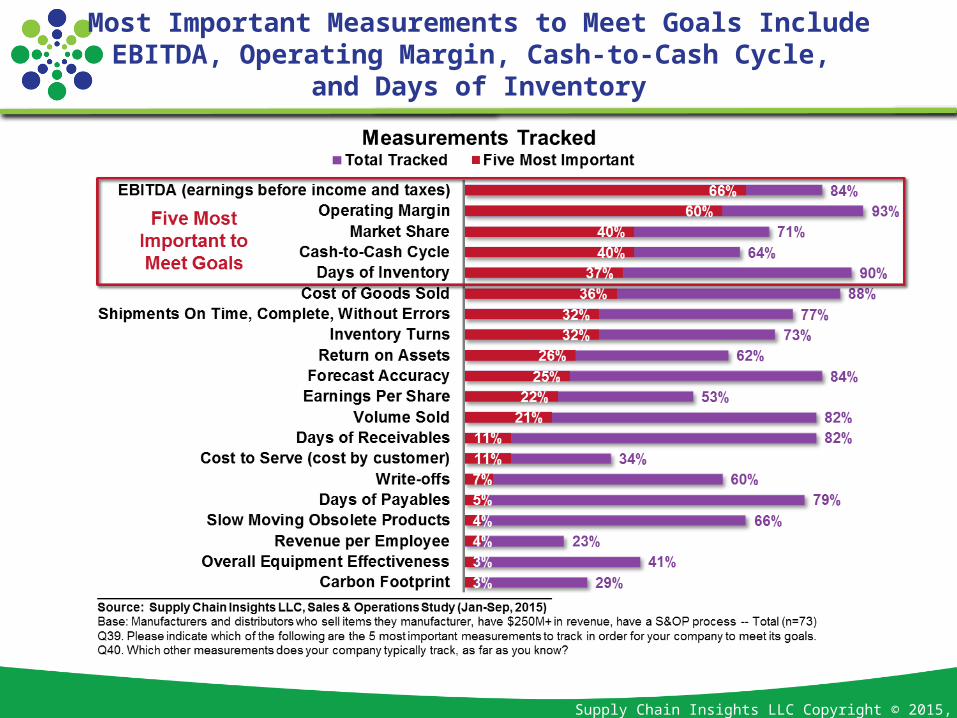
Most Important Measurements to Meet Goals IncludeEBITDA, Operating Margin, Cash-to-Cash Cycle,
and Days of Inventory
Supply Chain Insights LLC Copyright © 2015, p. 51
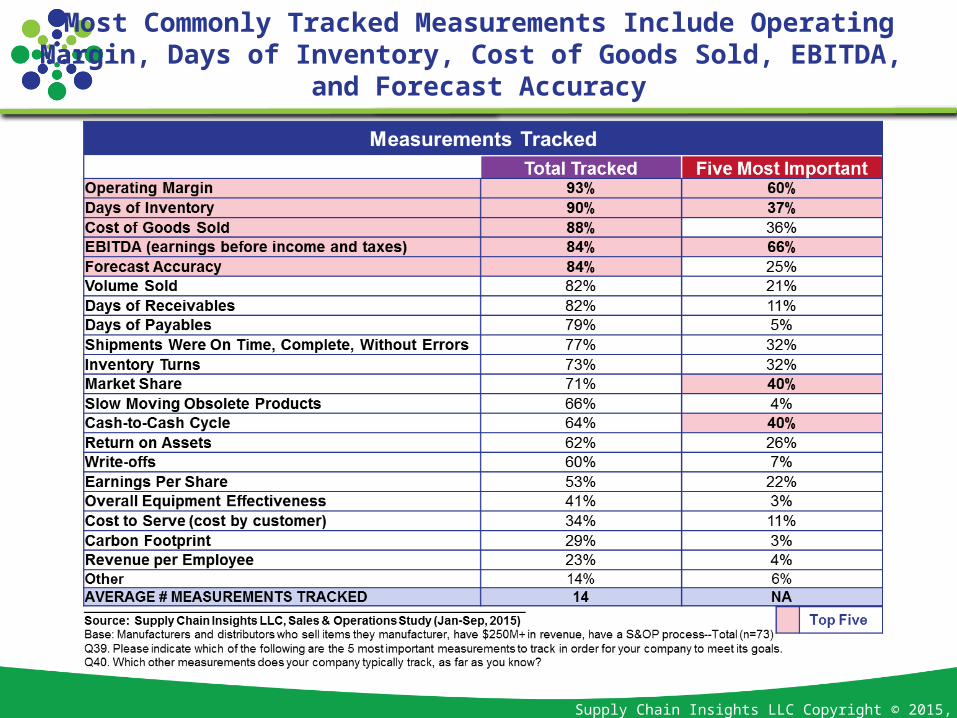
Most Commonly Tracked Measurements Include OperatingMargin, Days of Inventory, Cost of Goods Sold, EBITDA,
and Forecast Accuracy

Supply Chain Insights LLC Copyright © 2015, p. 52
Those Who Report an Effective S&OP Track MoreMeasurements
Supply Chain Insights LLC Copyright © 2015, p. 53
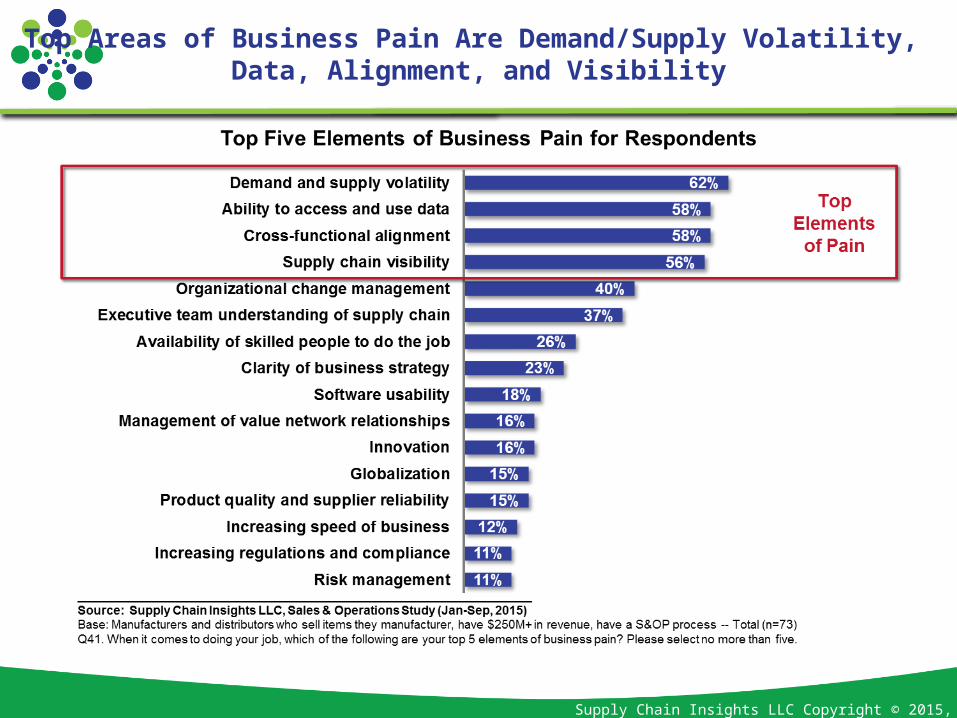
Top Areas of Business Pain Are Demand/Supply Volatility, Data, Alignment, and Visibility
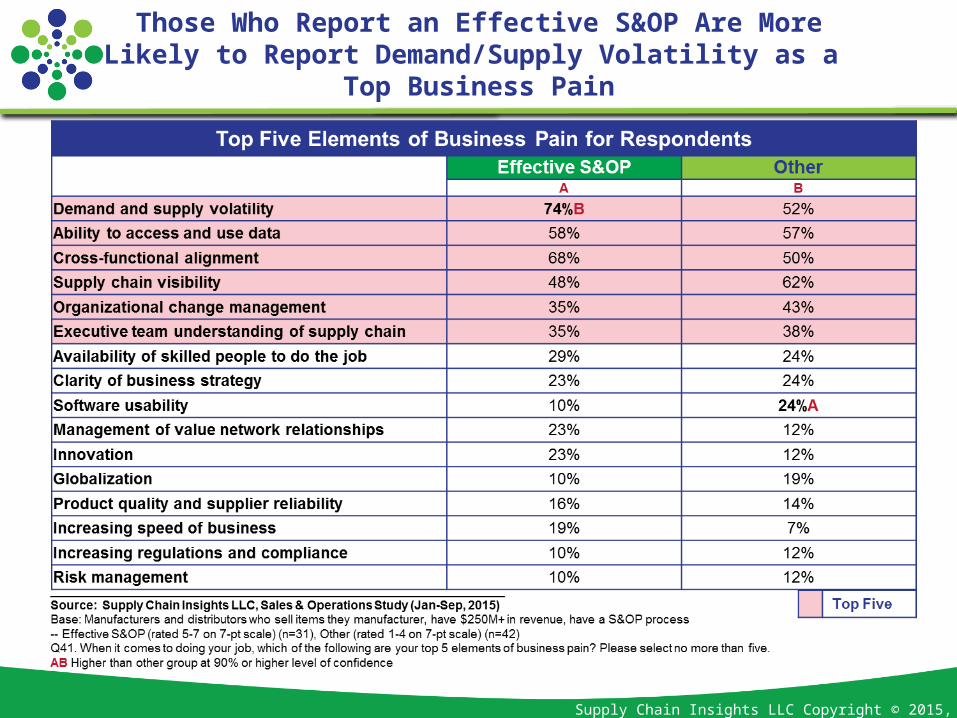
Supply Chain Insights LLC Copyright © 2015, p. 54
Those Who Report an Effective S&OP Are MoreLikely to Report Demand/Supply Volatility as a
Top Business Pain


![[Insights Secure – 2015] UPSC Mains Que...t Events_ 08 September 2015 - InSIGHTS](https://static.fdocuments.us/doc/165x107/563dba5c550346aa9aa4f05f/insights-secure-2015-upsc-mains-quet-events-08-september-2015-insights.jpg)


