supply chain Chapter20.ppt
40
© 2009 Pearson Prentice Hall. All rights reserved. Inventory Management, Just-in-Time, and Simplified Costing Met hods
Transcript of supply chain Chapter20.ppt

8/14/2019 supply chain Chapter20.ppt
http://slidepdf.com/reader/full/supply-chain-chapter20ppt 1/40
© 2009 Pearson Prentice Hall. All rights reserved.
Inventory Management,
Just-in-Time,
and Simplified Costing Methods

8/14/2019 supply chain Chapter20.ppt
http://slidepdf.com/reader/full/supply-chain-chapter20ppt 2/40

8/14/2019 supply chain Chapter20.ppt
http://slidepdf.com/reader/full/supply-chain-chapter20ppt 3/40
© 2009 Pearson Prentice Hall. All rights reserved.
Costs Associated with
Goods for Sale Managing inventories to increase net income
requires effectively managing costs that fall intothese five categories:
1. Purchasing Costs
2. Ordering Costs
3. Carrying Costs
4. Stockout Costs5. Quality Costs

8/14/2019 supply chain Chapter20.ppt
http://slidepdf.com/reader/full/supply-chain-chapter20ppt 4/40
© 2009 Pearson Prentice Hall. All rights reserved.
Management of Inventory Costs1. Purchasing Costs – the cost of goods acquired from
suppliers, including freight
2. Ordering Costs – the costs of preparing and issuingpurchase orders, receiving and inspecting the itemsincluded in the orders, and matching invoicesreceived, purchases orders and delivery records to
make payments

8/14/2019 supply chain Chapter20.ppt
http://slidepdf.com/reader/full/supply-chain-chapter20ppt 5/40
© 2009 Pearson Prentice Hall. All rights reserved.
Management of Inventory Costs3. Carrying Costs – the costs that arise while holding
inventory of goods for sale. This includes theopportunity cost of the investment tied up in
inventory, and costs associated with storage4. Stockout Costs – the costs that result when a
company runs out of a particular item for whichthere is customer demand (stockout) and the
company must act quickly to meet the demand orsuffer the costs of not meeting it

8/14/2019 supply chain Chapter20.ppt
http://slidepdf.com/reader/full/supply-chain-chapter20ppt 6/40
© 2009 Pearson Prentice Hall. All rights reserved.
Management of Inventory Costs5. Quality Costs – the costs that result when features
and characteristics of a product or service are not inconformance with customer specifications. These
costs include:1. Prevention
2. Appraisal
3. Internal Failure
4. External Failure

8/14/2019 supply chain Chapter20.ppt
http://slidepdf.com/reader/full/supply-chain-chapter20ppt 7/40
© 2009 Pearson Prentice Hall. All rights reserved.
The First Step in Managing
Goods for Sale The first decision in managing goods for sale is how
much to order of a given product
Economic Order Quality (EOQ) is a decision modelthat calculates the optimal quantity of inventory toorder under a given set of assumptions

8/14/2019 supply chain Chapter20.ppt
http://slidepdf.com/reader/full/supply-chain-chapter20ppt 8/40
© 2009 Pearson Prentice Hall. All rights reserved.
Basic EOQ Assumptions There are only ordering & carrying costs The same quantity is ordered at each reorder point Demand, purchase-order lead time, ordering costs,
and carrying costs are known with certainty Purchasing costs per unit are unaffected by the
quantity ordered No stockouts occur
EOQ ignores purchasing costs, stockout costs andquality costs

8/14/2019 supply chain Chapter20.ppt
http://slidepdf.com/reader/full/supply-chain-chapter20ppt 9/40
(c) 2009 Pearson Prentice Hall. All rights reserved.
EOQ Formula
2DP
CEOQ =
D = Demand in units for specified period
P = Relevant ordering costs per purchase order C = Relevant carrying costs of one unit in stock for
the time period used for D

8/14/2019 supply chain Chapter20.ppt
http://slidepdf.com/reader/full/supply-chain-chapter20ppt 10/40
© 2009 Pearson Prentice Hall. All rights reserved.
Ordering & Carrying Costs
Illustrated

8/14/2019 supply chain Chapter20.ppt
http://slidepdf.com/reader/full/supply-chain-chapter20ppt 11/40
© 2009 Pearson Prentice Hall. All rights reserved.
Ordering Points The second decision in managing goods for sale is
when to order a given product
Reorder Point – the quantity level of inventory on
hand that triggers a new purchase order
Reorder Number of units sold Purchase Order
Point per unit of time Lead TimeX=

8/14/2019 supply chain Chapter20.ppt
http://slidepdf.com/reader/full/supply-chain-chapter20ppt 12/40
© 2009 Pearson Prentice Hall. All rights reserved.
Ordering Points Illustrated

8/14/2019 supply chain Chapter20.ppt
http://slidepdf.com/reader/full/supply-chain-chapter20ppt 13/40
© 2009 Pearson Prentice Hall. All rights reserved.
Inventory Management and
Safety Stock
Safety Stock is inventory held at all times regardless ofthe quantity of inventory ordered using the EOQ
model Safety stock is a buffer against unexpected increases in
demand, uncertainty about lead time, and unavailabilityof stock from suppliers

8/14/2019 supply chain Chapter20.ppt
http://slidepdf.com/reader/full/supply-chain-chapter20ppt 14/40
© 2009 Pearson Prentice Hall. All rights reserved.
Safety Stock Computation Illustration

8/14/2019 supply chain Chapter20.ppt
http://slidepdf.com/reader/full/supply-chain-chapter20ppt 15/40
© 2009 Pearson Prentice Hall. All rights reserved.
Estimating Inventory-Related Relevant
Costs
Carrying Costs
Stockout Costs
Ordering Costs

8/14/2019 supply chain Chapter20.ppt
http://slidepdf.com/reader/full/supply-chain-chapter20ppt 16/40
© 2009 Pearson Prentice Hall. All rights reserved.
Carrying Costs Relevant inventory carrying costs consist of relevant
incremental costs and the relevant opportunity cost ofcapital
Relevant Incremental Costs – those costs of thepurchasing firm that change with the quantity ofinventory held

8/14/2019 supply chain Chapter20.ppt
http://slidepdf.com/reader/full/supply-chain-chapter20ppt 17/40
© 2009 Pearson Prentice Hall. All rights reserved.
Opportunity Costs Relevant Opportunity Cost of Capital – the return
foregone by investing capital in inventory rather thanelsewhere. This cost equals the required rate of returnmultiplied by the unit costs that vary with the numberof units purchased and are incurred at the time theunits are received

8/14/2019 supply chain Chapter20.ppt
http://slidepdf.com/reader/full/supply-chain-chapter20ppt 18/40
© 2009 Pearson Prentice Hall. All rights reserved.
Cost of a Prediction Error Three steps in determining the cost of a prediction
error:1. Compute the monetary outcome from the best action
that could be taken, given the actual amount of thecost per purchase order
2. Compute the monetary outcome from the best actionbased on the incorrect amount of the predicted costper purchase order
3. Compute the difference between Steps 1 & 2

8/14/2019 supply chain Chapter20.ppt
http://slidepdf.com/reader/full/supply-chain-chapter20ppt 19/40
© 2009 Pearson Prentice Hall. All rights reserved.
Just-in-Time Purchasing Just-in-Time (JIT) Purchasing is the purchase of
materials or goods so they are delivered just as neededfor production or sales
JIT is popular because carrying costs are actually muchgreater than estimated because warehousing, handing,shrinkage and investment costs have not beencorrectly estimated

8/14/2019 supply chain Chapter20.ppt
http://slidepdf.com/reader/full/supply-chain-chapter20ppt 20/40
© 2009 Pearson Prentice Hall. All rights reserved.
JIT Purchasing JIT reduces the cost of placing a purchase order
because: Long-term purchasing agreements define price and
quality terms. Individual purchase orders covered bythose agreements require no additional negotiationregarding price or quality
Companies are using electronic links to place purchaseorders at a small fraction of traditional methods (phoneor mail)
Companies are using purchase-order cards

8/14/2019 supply chain Chapter20.ppt
http://slidepdf.com/reader/full/supply-chain-chapter20ppt 21/40
© 2009 Pearson Prentice Hall. All rights reserved.
Relevant Costs in JIT Purchasing Purchasing Costs
Stockout Costs
Quality Costs

8/14/2019 supply chain Chapter20.ppt
http://slidepdf.com/reader/full/supply-chain-chapter20ppt 22/40
© 2009 Pearson Prentice Hall. All rights reserved.
Relationship Between Carrying &
Ordering Costs Illustrated
8/14/2019 supply chain Chapter20.ppt
http://slidepdf.com/reader/full/supply-chain-chapter20ppt 23/40
© 2009 Pearson Prentice Hall. All rights reserved.
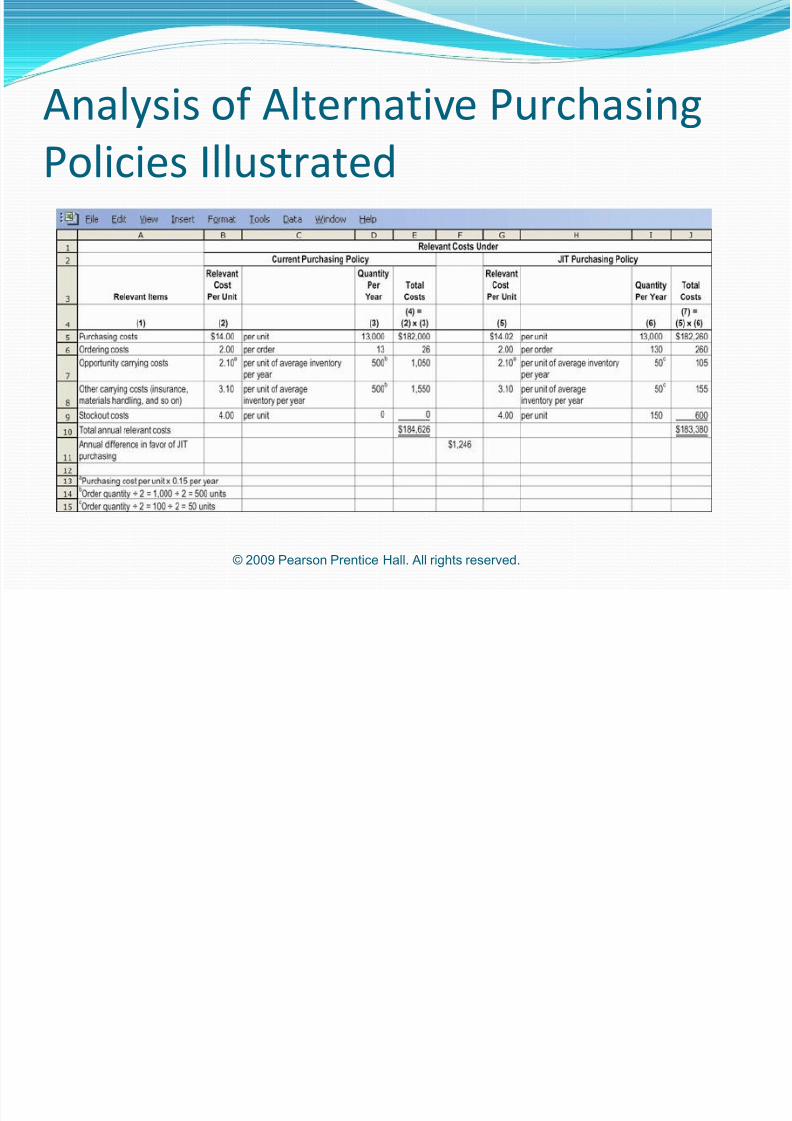
Analysis of Alternative Purchasing
Policies Illustrated

8/14/2019 supply chain Chapter20.ppt
http://slidepdf.com/reader/full/supply-chain-chapter20ppt 24/40
© 2009 Pearson Prentice Hall. All rights reserved.
JIT Purchasing and
Supply-Chain Analysis Supply chain describes the flow of goods, services,
and information from the initial sources of materials
and services to the delivery of products toconsumers (both inside & outside the firm)
Supply Chain members share information andplan/coordinate activities
Supplier evaluations are critical to JIT Purchasingimplementation

8/14/2019 supply chain Chapter20.ppt
http://slidepdf.com/reader/full/supply-chain-chapter20ppt 25/40
© 2009 Pearson Prentice Hall. All rights reserved.
Supplier Evaluation Illustrated

8/14/2019 supply chain Chapter20.ppt
http://slidepdf.com/reader/full/supply-chain-chapter20ppt 26/40
© 2009 Pearson Prentice Hall. All rights reserved.
Inventory Management and Materials
Requirements Planning
Materials Requirements Planning (MRP) – a “push-through” system that manufactures finished goods for
inventory on the basis of demand forecasts

8/14/2019 supply chain Chapter20.ppt
http://slidepdf.com/reader/full/supply-chain-chapter20ppt 27/40
© 2009 Pearson Prentice Hall. All rights reserved.
MRP Information Inputs MRP uses three information sources to determine
the necessary outputs at each stage of production1. Demand forecasts of final products
2. A bill of materials detailing the materials, components,and subassemblies for each final product
3. The quantities of materials, components, and productinventories to determine the necessary outputs at each
stage of production

8/14/2019 supply chain Chapter20.ppt
http://slidepdf.com/reader/full/supply-chain-chapter20ppt 28/40
© 2009 Pearson Prentice Hall. All rights reserved.
MRP Takes into account lead time to purchase materials
and to manufacture components and finishedproducts
Sets a master production schedule specifyingquantities and timing of each item to be produced
The output of each department is pushed throughthe production line whether it is needed or not
“Push Through” may result in an accumulation ofinventory

8/14/2019 supply chain Chapter20.ppt
http://slidepdf.com/reader/full/supply-chain-chapter20ppt 29/40
© 2009 Pearson Prentice Hall. All rights reserved.
Inventory Management and
JIT Production JIT (Lean) Production – is a “demand-pull”
manufacturing system that manufactures each
component in a production line as soon as and only when needed by the next step in the production line
Demand triggers each step of the productionprocess, starting with customer demand for a
finished product and working backward
Demand pulls an order through the production line

8/14/2019 supply chain Chapter20.ppt
http://slidepdf.com/reader/full/supply-chain-chapter20ppt 30/40
© 2009 Pearson Prentice Hall. All rights reserved.
JIT Production Goals1. Meet customer demand in a timely basis,
2. with high-quality products,
3. at the lowest possible cost.

8/14/2019 supply chain Chapter20.ppt
http://slidepdf.com/reader/full/supply-chain-chapter20ppt 31/40
© 2009 Pearson Prentice Hall. All rights reserved.
JIT Production Features Production is organized in manufacturing cells, a
grouping of all the different types of equipment usedto make a given product
Workers are hired and trained to be multi-skilled(cross-trained)
Defects are aggressively eliminated
Setup time is reduced
Suppliers are selected on the basis of their ability todeliver quality materials in a timely manner

8/14/2019 supply chain Chapter20.ppt
http://slidepdf.com/reader/full/supply-chain-chapter20ppt 32/40
© 2009 Pearson Prentice Hall. All rights reserved.
Other Benefits of JIT Production Lower overhead costs
Lower inventory levels
Heightened emphasis on improving quality byeliminating the specific causes of rework, scrap, and waste
Lower manufacturing lead times

8/14/2019 supply chain Chapter20.ppt
http://slidepdf.com/reader/full/supply-chain-chapter20ppt 33/40
© 2009 Pearson Prentice Hall. All rights reserved.
JIT and Enterprise Resource Planning
Systems (ERP)
JIT success hinges on the speed of information flowsfrom customers to manufacturers to suppliers
ERP is a system with a single database that collectsdata and feeds it into software applicationssupporting all of a firm’s business activities
ERP gives managers, workers, customers and
suppliers access to operating information ERP can be expensive, large, and unwieldy

8/14/2019 supply chain Chapter20.ppt
http://slidepdf.com/reader/full/supply-chain-chapter20ppt 34/40
© 2009 Pearson Prentice Hall. All rights reserved.
Performance Measures and
Control in JIT Financial performance measures such as inventory
turnover ratio
Nonfinancial performance measures of time,inventory, and quality such as: Manufacturing lead times
Units produced per hour
Days of inventory on hand
Setup time as a % of total manufacturing time
Number of defective units as a % of total units produced

8/14/2019 supply chain Chapter20.ppt
http://slidepdf.com/reader/full/supply-chain-chapter20ppt 35/40
© 2009 Pearson Prentice Hall. All rights reserved.
Backflush Costing Backflush Costing omits recording some or all of the
journal entries relating to the stages from thepurchase of direct materials to the sale of finished
goods Since some stages are omitted, the journal entries for asubsequent stage use normal or standard costs to workbackward to “flush out” the costs in the cycle for which
journal entries were not made
Contrasts to traditional normal and standard costingsystems using sequential tracking: recording journalentries at each trigger point in the productionprocess

8/14/2019 supply chain Chapter20.ppt
http://slidepdf.com/reader/full/supply-chain-chapter20ppt 36/40
© 2009 Pearson Prentice Hall. All rights reserved.
Special Considerations in Backflush
Costing
Backflush costing does not necessarily comply with
GAAP However, inventory levels may be immaterial, negating
the necessity for compliance
Backflush costing does not leave a good audit trail –
the ability of the accounting system to pinpoint theuses of resources at each step of the productionprocess

8/14/2019 supply chain Chapter20.ppt
http://slidepdf.com/reader/full/supply-chain-chapter20ppt 37/40
© 2009 Pearson Prentice Hall. All rights reserved.
Sample Journal Entries in Backflush Costing

8/14/2019 supply chain Chapter20.ppt
http://slidepdf.com/reader/full/supply-chain-chapter20ppt 38/40
© 2009 Pearson Prentice Hall. All rights reserved.
Sample
GeneralLedger
Flows inBackflush
Costing

8/14/2019 supply chain Chapter20.ppt
http://slidepdf.com/reader/full/supply-chain-chapter20ppt 39/40
© 2009 Pearson Prentice Hall. All rights reserved.
Lean Accounting Lean Accounting is a costing method that supports
creating value for the customer by costing the entire value stream, not individual products or departments,
thereby eliminating waste in the accounting process

8/14/2019 supply chain Chapter20.ppt
http://slidepdf.com/reader/full/supply-chain-chapter20ppt 40/40
© 2009 P P ti H ll All i ht d