SUPPLY AND DEMAND SIDE DAN CIURIAK...
56
Trade and development discussion paper no. 02/2010 SUPPLY AND DEMAND SIDE CONSTRAINTS AS BARRIERS FOR ETHIOPIAN EXPORTS – POLICY OPTIONS DAN CIURIAK Munich, August 2010 bkp DEVELOPMENT RESEARCH & CONSULTING
-
Upload
dangkhuong -
Category
Documents
-
view
215 -
download
0
Transcript of SUPPLY AND DEMAND SIDE DAN CIURIAK...
Trade and development discussion paper no. 02/2010
SUPPLY AND DEMAND SIDE CONSTRAINTS AS BARRIERS FOR
ETHIOPIAN EXPORTS – POLICY OPTIONS
DAN CIURIAK
Munich, August 2010
bkp DEVELOPMENT RESEARCH & CONSULTING

Author: Dan Ciuriak. Email: [email protected] Copyright rests with the author. One of the founding principles of BKP Development Research and Consulting is to bridge the gap which all too often exists between development research and politics. The purpose of BKP Trade and Development Discussion Papers is to provide policy relevant insights which are based on thorough study, and to stimulate discussion about policies and strategies for development. The content of this discussion paper is the sole responsibility of the author and can in no way be taken to reflect the views of BKP Development Research & Consulting. BKP DEVELOPMENT RESEARCH & CONSULTING GMBH ROMANSTRASSE 74. 80639 MUNICH. GERMANY PHONE +49-89-1787 6047. FAX +49-89-1787 6049 E-MAIL [email protected]
Further information and other discussion papers can be obtained from: WWW.BKP-DEVELOPMENT.DE
TDDP 02/2010 PAGE i
Supply and Demand Side Constraints as Barriers for Ethiopian Exports – Policy Options1
DAN CIURIAK ABSTRACT This study seeks to identify and estimate the relative importance of supply- versus demand-side constraints on Ethiopia’s exports. Ethiopia has tried radically different trade strategies in the past, including a strategy of import replacement/protection for infant industries during the Imperial period, a heavily state-managed trading system during the military government era, and a market-oriented liberalized approach supported by the international financial institutions in the most recent period. It is presently engaged in various trade initiatives, including accession to the World Trade Organization, negotiations with the European Union on an Economic Partnership Agreement and with African regional partners towards a Tripartite Free Trade Area (TFTA). The study finds that the constraints on Ethiopia’s trade performance are mainly domestic, secondarily in its neighbourhood, and thirdly in its trade with African partners more generally. Ethiopia’s macroeconomic policy mix and high administrative costs of trade work both to depress the share of trade in economic activity and to widen the deficit on goods trade. At the same time, the high costs of firm formation and the high margins and concentrated market structure of producer services, both a function of domestic policy frameworks, help to explain the evidently under-developed state of Ethiopia’s private sector; unless addressed, this would limit the supply side response to trade liberalization. Optimistically, the paper argues that eminently achievable infrastructure and regional customs cooperation developments, in conjunction with domestic administrative process reforms, would be “game changers” for Ethiopia in terms of its trade performance and industrial development.
Ethiopia, exports, liberalization, trade costs, firm-level dynamics Keywords:
JEL Codes:
1 This is a revised version of a paper prepared for the Fifth Annual National Private Sector Development
Conference: Strengthening the Role of the Private Sector in International Trade Negotiations, Addis Ababa, 22 2010.
F13, F14, F15

TDDP 02/2010 PAGE iii
TABLE OF CONTENTS
1 INTRODUCTION .................................................................................................. 1
2 EVALUATING CONSTRAINTS TO ETHIOPIA’S EXPORTS .................................... 3
2.1 Constraints on Ethiopia’s exports are largely domestic and local .......... 3
2.2 Ethiopia’s trade imbalance: the policy mix as an export constraint ....... 5
2.3 Trade costs as a constraint on exports .....................................................9
2.4 Private Sector Under-Development as an Export Constraint ................ 15
2.5 Domestic producer service margins as an export constraint ................. 19
2.6 Thick borders as an export constraint .................................................... 20
2.7 Tariff Barriers Maintained by Ethiopia’s Regional Trading Partners: some “back of the envelope” quantitative assessments ....... 22
3 ADDRESSING SUPPLY-SIDE CONSTRAINTS TO ETHIOPIA’S EXPORTS ................ 25
3.1 The macroeconomic policy mix ............................................................... 25
3.2 Trade costs ............................................................................................... 26
3.3 Private Sector Development ................................................................... 26
3.4 Regional Trade Negotiations .................................................................. 27
3.5 Towards A Private-Public Partnership on the Trade Agenda ................ 27
4 CONCLUDING REMARKS ................................................................................... 28
REFERENCES .............................................................................................................. 29
APPENDIX 1: EAST AND SOUTH AFRICAN REGIONAL TRADE LIBERALIZATION ............................................................................................... 32
APPENDIX 2: CALIBRATING EXPECTED RELATIVE LEVELS OF TRADE ....................46

TDDP 02/2010 PAGE 1
1 INTRODUCTION Ethiopia has tried radically different trade strategies in the past, including a strategy of import replacement/protection for infant industries during the Imperial period, a heavily state-managed trading system during the military government era, and a market-oriented liberalized approach supported by the international financial institutions in the most recent period. Each of these trade regimes incorporated the policy objective of diversifying Ethiopia’s export palette to reduce dependence on coffee and other cash crops. Numerous trade-related technical assistance projects have already been implemented. Policies promoting exports have been adopted. However, Ethiopia finds itself in 2010 with an export palette of limited diversification and, notwithstanding rapid growth in exports, a steeply widening trade deficit, leaving it dependent on inflows of financial assistance to pay its import bill. In this context, Ethiopia is engaged in various trade initiatives: Negotiations towards trade agreements with regional partners, including regarding the
establishment of a Tripartite Free Trade Area (TFTA) comprising the members of the Common Market of Eastern and Southern Africa (COMESA), the East African Community (EAC) and the Southern African Development Community (SADC);
Negotiations with extra-regional partners, in particular the prospective Economic Partnership Agreement with the European Union; and
Accession to the World Trade Organization. It is salient and timely therefore to assess the relative importance of demand-side constraints on Ethiopia’s exports, some of which can be reduced through trade negotiations, versus supply-side constraints which require supportive domestic policies. In recent years, analysis of international trade has focused increasingly on firm-level dynamics. The new empirical literature shows that underlying the aggregate trends in exports and imports is a dynamic process of firms entering and exiting foreign markets, introducing new export products and dropping obsolete products, and diversifying across markets. Overall growth in a country’s exports depends importantly on the number of new entrants exceeding the number of established exporters being pushed out of export markets, and the number of new product introductions more than offsetting the number of old products losing markets. The new empirical literature also focuses on the costs of entering new markets and how reduction of these costs can generate trade in new products and markets where previously there was no trade. The focus has shifted from the country to the firm, from the static to the dynamic, and from the macroeconomic to the microeconomic underpinnings of trade.
CIURIAK: SUPPLY AND DEMAND SIDE CONSTRAINTS AS BARRIERS FOR ETHIOPIAN EXPORTS PAGE 2
This paper seeks to bring this perspective to the analysis of Ethiopia’s trade performance and policies. It argues that a successful Ethiopian trade strategy must be conceived in a dynamic, longer-term framework which involves the ability to sustain: A flow of competitive industrial products gaining access to export markets to augment the
export palette and replace obsolete/uncompetitive products that lose their international market niche.
A flow of export market entrants, including firms newly establishing their first export market presence and existing exporters diversifying the destinations for their products, augmenting the population of exporting firms and replacing firms exiting export markets.
Improvements in physical infrastructure and logistical capacity to efficiently move goods and services to markets abroad, including transport and information & telecommunications (ICT) capabilities, in order to lower trade costs and thus to expand the number of firms that can enter foreign markets.
Institutional support to help firms surmount the manifold difficulties of entering foreign markets by reducing the up-front sunk costs of such entry, and creating as stable a trading environment as possible to minimize the frictional costs of failed export market entry.
The paper is organized in two parts. The first part evaluates constraints to Ethiopia’s trade. It addresses in turn: the relative importance of the major sources of constraints; the trade effects of Ethiopia’s macroeconomic policy mix; the major role of domestic administrative costs of importing and exporting as a determinant of Ethiopia’s trade performance and industrial development; the under-development of the private sector in the context of high costs of domestic market entry as a factor weakening the dynamics of export market entry; market structure issues and associated high producer services costs as an export constraint; the issue of “missing trade” with neighboring countries due to lacking physical infrastructure and inefficient border arrangements; and finally the traditional constraint on trade, namely tariff protection maintained by Ethiopia’s regional trading partners. The second part suggests how Ethiopia’s trading community might, in light of the foregoing evaluation of trade barriers, approach the complex tax of progressively dismantling them, in terms of both substance and process, including the important issue of sequencing. The details of the quantitative analysis reported in the main body of the paper are set out and discussed in Appendixes 1 and 2. In brief summary, the paper finds that the major constraints to Ethiopia’s trade performance are mainly domestic, secondarily in its neighborhood and thirdly in its trade with African partners more generally. Ethiopia’s macroeconomic policy mix and high administrative costs of trade work both to depress the share of trade in economic activity and to widen the deficit on goods trade. At the same time, the high costs of firm formation and the high margins and concentrated market structure of producer services, both a function of domestic policy frameworks, help to explain the evidently under-developed state of Ethiopia’s private sector; unless addressed, this would be a major factor in constraining the supply side response to trade liberalization. Optimistically, the paper argues that several eminently achievable infrastructure and regional cooperation developments, in conjunction with domestic administrative process reforms, would be “game changers” for Ethiopia in terms of its trade performance and industrial development.
TDDP 02/2010 PAGE 3
Given these domestic macroeconomic and microeconomic policies, Ethiopia would stand to benefit from regional trade liberalization; absent these policy reforms, Ethiopia would experience minor negative impacts on measurable factors and would be counting on non-measurable elements to realize benefits from trade liberalization. One way or the other, the paper argues that it is “safe to go in the water” for Ethiopia in respect of participation in the TFTA. It also recommends an exporter dialogue on the macroeconomic policy mix and suggests criteria for an export-friendly policy mix, and continued microeconomic framework reforms.
2 EVALUATING CONSTRAINTS TO ETHIOPIA’S EXPORTS This section identifies and evaluates the relative importance of supply-side constraints facing Ethiopian exports. The focus is on merchandise exports. However, it is to be noted that, in 2008, services exports—mainly transportation services (principally Ethiopian Airlines and Ethiopian Shipping Lines), tourism, communications, and insurance and financial services—totaled about US$1.8 billion compared to goods exports of $1.6 billion2
.
2.1 Constraints on Ethiopia’s exports are largely domestic and local In 2009, Ethiopia had worldwide goods exports of US$ 2.2 billion and worldwide goods imports of US$ 10.9 billion, for a goods trade deficit of US$ 8.7 billion. To what extent is the low level of exports plausibly to be attributed to demand-side constraints and where might these constraints principally be located? To answer these questions, we draw on the basic principles of the gravity model of trade which holds that the intensity of bilateral trade with individual trading partners increases with the size of the trading partner’s economy and decreases the further away that trading partner is. As elaborated in Appendix 2, all else being equal, we would expect the ratio of two countries’ imports from Ethiopia to be approximately equal to the ratio of their respective GDPs divided by the ratio of their respective distances from Ethiopia. Since the European Union (EU) provides Ethiopia with tariff-free access, and compared to the other major global economies has fewer alternative trading opportunities with economies similar to Ethiopia, we would expect the ratio of most countries’ imports from Ethiopia to EU imports from Ethiopia (the “Import ratio” in Table 1) to be somewhat smaller than their “Gravity ratio” (the ratios of their respective GDPs, divided by the ratios of their respective distances from Ethiopia).
2 Source: calculated by the author based on an estimated ratio of goods and services exports to GDP of 13.2
percent (DFAT, 2010) and the reported level of exports of goods from UN Comtrade. Note that data from the most recent IMF Article IV consultations, reported on a fiscal year basis, suggest a level of exports of non-factor services of about US$ 1.7 billion in calendar year 2008 compared to goods exports of about US$ 1.5 billion (International Monetary Fund 2009: Table 5(a) at p. 22). For a discussion of growth in Ethiopia’s services trade see Access Capital (2010).
CIURIAK: SUPPLY AND DEMAND SIDE CONSTRAINTS AS BARRIERS FOR ETHIOPIAN EXPORTS PAGE 4
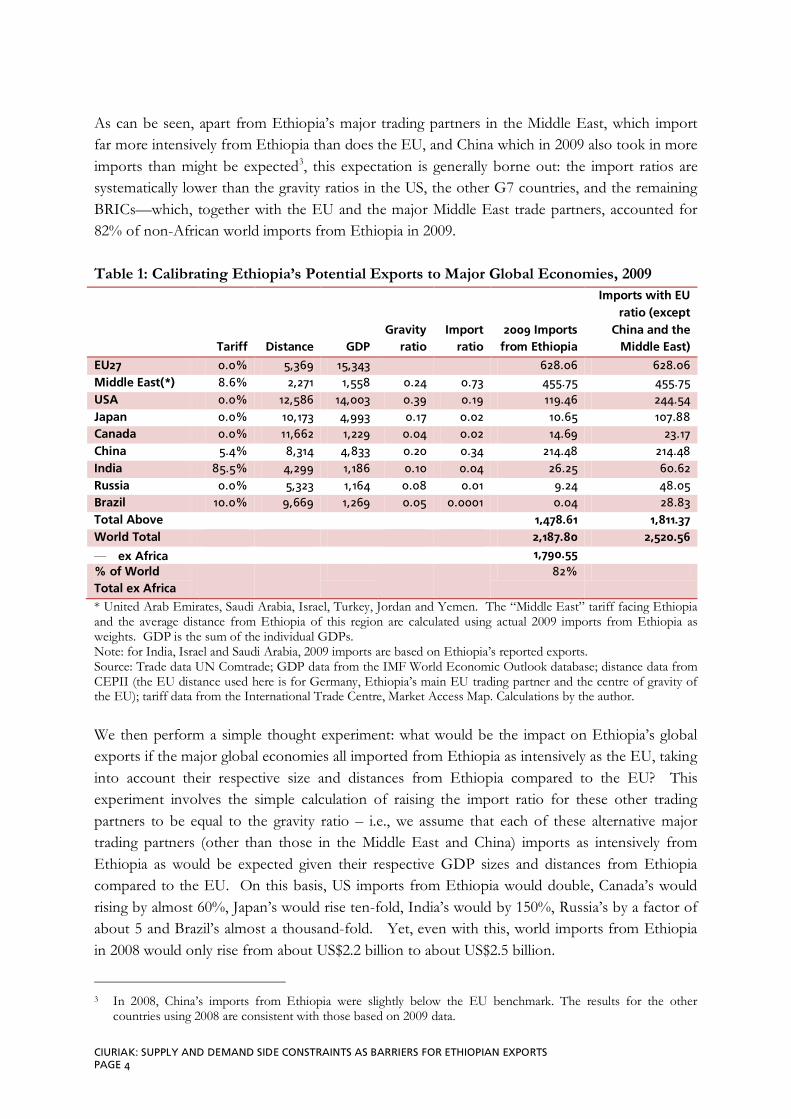
As can be seen, apart from Ethiopia’s major trading partners in the Middle East, which import far more intensively from Ethiopia than does the EU, and China which in 2009 also took in more imports than might be expected3
, this expectation is generally borne out: the import ratios are systematically lower than the gravity ratios in the US, the other G7 countries, and the remaining BRICs—which, together with the EU and the major Middle East trade partners, accounted for 82% of non-African world imports from Ethiopia in 2009.
Table 1: Calibrating Ethiopia’s Potential Exports to Major Global Economies, 2009
Tariff Distance GDP Gravity
ratio Import
ratio 2009 Imports
from Ethiopia
Imports with EU ratio (except
China and the Middle East)
EU27 0.0% 5,369 15,343 628.06 628.06 Middle East(*) 8.6% 2,271 1,558 0.24 0.73 455.75 455.75 USA 0.0% 12,586 14,003 0.39 0.19 119.46 244.54 Japan 0.0% 10,173 4,993 0.17 0.02 10.65 107.88 Canada 0.0% 11,662 1,229 0.04 0.02 14.69 23.17 China 5.4% 8,314 4,833 0.20 0.34 214.48 214.48 India 85.5% 4,299 1,186 0.10 0.04 26.25 60.62 Russia 0.0% 5,323 1,164 0.08 0.01 9.24 48.05 Brazil 10.0% 9,669 1,269 0.05 0.0001 0.04 28.83 Total Above 1,478.61 1,811.37 World Total 2,187.80 2,520.56
— ex Africa 1,790.55 % of World Total ex Africa
82%
* United Arab Emirates, Saudi Arabia, Israel, Turkey, Jordan and Yemen. The “Middle East” tariff facing Ethiopia and the average distance from Ethiopia of this region are calculated using actual 2009 imports from Ethiopia as weights. GDP is the sum of the individual GDPs. Note: for India, Israel and Saudi Arabia, 2009 imports are based on Ethiopia’s reported exports. Source: Trade data UN Comtrade; GDP data from the IMF World Economic Outlook database; distance data from CEPII (the EU distance used here is for Germany, Ethiopia’s main EU trading partner and the centre of gravity of the EU); tariff data from the International Trade Centre, Market Access Map. Calculations by the author. We then perform a simple thought experiment: what would be the impact on Ethiopia’s global exports if the major global economies all imported from Ethiopia as intensively as the EU, taking into account their respective size and distances from Ethiopia compared to the EU? This experiment involves the simple calculation of raising the import ratio for these other trading partners to be equal to the gravity ratio – i.e., we assume that each of these alternative major trading partners (other than those in the Middle East and China) imports as intensively from Ethiopia as would be expected given their respective GDP sizes and distances from Ethiopia compared to the EU. On this basis, US imports from Ethiopia would double, Canada’s would rising by almost 60%, Japan’s would rise ten-fold, India’s would by 150%, Russia’s by a factor of about 5 and Brazil’s almost a thousand-fold. Yet, even with this, world imports from Ethiopia in 2008 would only rise from about US$2.2 billion to about US$2.5 billion.
3 In 2008, China’s imports from Ethiopia were slightly below the EU benchmark. The results for the other
countries using 2008 are consistent with those based on 2009 data.
TDDP 02/2010 PAGE 5
Accordingly, we can safely conclude that main demand- and supply-side constraints on Ethiopia’s export performance lie not in global markets but in Ethiopia itself or in its local neighborhood—Africa.
2.2 Ethiopia’s trade imbalance: the policy mix as an export constraint
We next consider the implications of Ethiopia’s overall trade deficit. Trade deficits are not necessarily a policy “problem” in the sense that they require policy adjustments. In some cases, deficits may simply indicate a stronger growth performance in the deficit country than in its major trading partners. In a similar vein, they may reflect transient adverse terms-of-trade developments if prices for major export commodities fall while those for important imports rise. Such cyclical/transient deficits should however self-correct over the course of the business cycle. Deficits may also reflect an excess of investment opportunities that domestic savings cannot finance, resulting in net capital inflows and a mirror current account deficit. A rapidly growing developing country with strong domestic capital formation would, in the normal case, be in current account deficit, which in turn would largely consist of a goods trade deficit. Further, trade deficits are not necessarily indicative of a trade policy problem or by the same token a problem that can be solved by trade policy instruments alone. In general, high import taxes or barriers also act indirectly as a tax on exports; the net result is a lower trade share of GDP but there is no definitive implication for the balance of trade. The external balance is, in the long run, decided by other factors. However, in the highly important medium term, a country’s policy mix can contribute to an external deficit by, in effect, taxing exports. For example, the use of the exchange rate as an external anchor for monetary policy can lead to an increase in the real effective exchange rate and widen trade deficits in a medium-term context. For a country like Ethiopia, which is counting on an export-led development strategy, getting the policy mix right is thus very important. While an in-depth assessment of Ethiopia’s macroeconomic policy framework is well beyond the scope of the present paper, it is important to note that the macroeconomic policy framework in place during the 2000s did work to constrain Ethiopia’s exports. Ethiopia’s overall economic strategy was premised on rapid growth supported by significant increases in development assistance4
4 See the Sustainable Development and Poverty Reduction Program (SDPRP) prepared in 2002.
. An IMF study which examined the feasibility of Ethiopia’s plan noted that channeling part of the expected increase in domestic demand abroad through increased imports would serve to contain the potential wage and price pressures under this strategy; indeed, the study projected a significant widening in the external deficit (excluding official development assistance) from
CIURIAK: SUPPLY AND DEMAND SIDE CONSTRAINTS AS BARRIERS FOR ETHIOPIAN EXPORTS PAGE 6
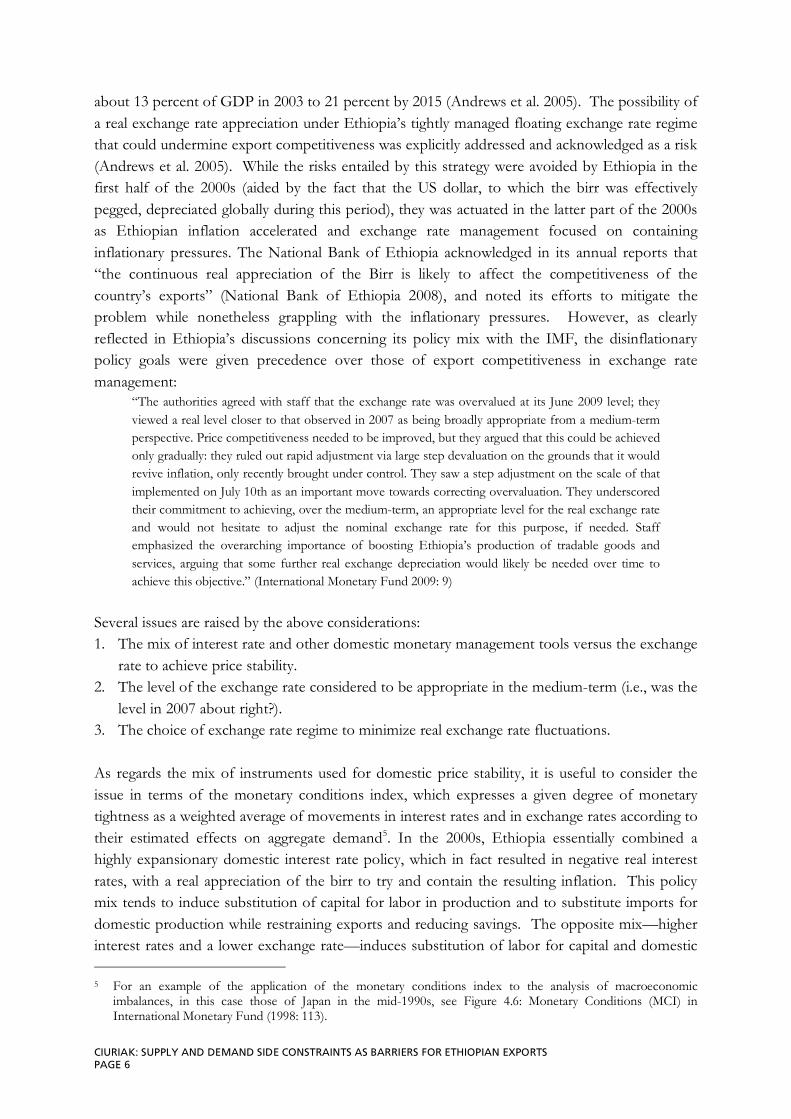
about 13 percent of GDP in 2003 to 21 percent by 2015 (Andrews et al. 2005). The possibility of a real exchange rate appreciation under Ethiopia’s tightly managed floating exchange rate regime that could undermine export competitiveness was explicitly addressed and acknowledged as a risk (Andrews et al. 2005). While the risks entailed by this strategy were avoided by Ethiopia in the first half of the 2000s (aided by the fact that the US dollar, to which the birr was effectively pegged, depreciated globally during this period), they was actuated in the latter part of the 2000s as Ethiopian inflation accelerated and exchange rate management focused on containing inflationary pressures. The National Bank of Ethiopia acknowledged in its annual reports that “the continuous real appreciation of the Birr is likely to affect the competitiveness of the country’s exports” (National Bank of Ethiopia 2008), and noted its efforts to mitigate the problem while nonetheless grappling with the inflationary pressures. However, as clearly reflected in Ethiopia’s discussions concerning its policy mix with the IMF, the disinflationary policy goals were given precedence over those of export competitiveness in exchange rate management:
“The authorities agreed with staff that the exchange rate was overvalued at its June 2009 level; they viewed a real level closer to that observed in 2007 as being broadly appropriate from a medium-term perspective. Price competitiveness needed to be improved, but they argued that this could be achieved only gradually: they ruled out rapid adjustment via large step devaluation on the grounds that it would revive inflation, only recently brought under control. They saw a step adjustment on the scale of that implemented on July 10th as an important move towards correcting overvaluation. They underscored their commitment to achieving, over the medium-term, an appropriate level for the real exchange rate and would not hesitate to adjust the nominal exchange rate for this purpose, if needed. Staff emphasized the overarching importance of boosting Ethiopia’s production of tradable goods and services, arguing that some further real exchange depreciation would likely be needed over time to achieve this objective.” (International Monetary Fund 2009: 9)
Several issues are raised by the above considerations: 1. The mix of interest rate and other domestic monetary management tools versus the exchange
rate to achieve price stability. 2. The level of the exchange rate considered to be appropriate in the medium-term (i.e., was the
level in 2007 about right?). 3. The choice of exchange rate regime to minimize real exchange rate fluctuations. As regards the mix of instruments used for domestic price stability, it is useful to consider the issue in terms of the monetary conditions index, which expresses a given degree of monetary tightness as a weighted average of movements in interest rates and in exchange rates according to their estimated effects on aggregate demand5
5 For an example of the application of the monetary conditions index to the analysis of macroeconomic
imbalances, in this case those of Japan in the mid-1990s, see Figure 4.6: Monetary Conditions (MCI) in International Monetary Fund (1998: 113).
. In the 2000s, Ethiopia essentially combined a highly expansionary domestic interest rate policy, which in fact resulted in negative real interest rates, with a real appreciation of the birr to try and contain the resulting inflation. This policy mix tends to induce substitution of capital for labor in production and to substitute imports for domestic production while restraining exports and reducing savings. The opposite mix—higher interest rates and a lower exchange rate—induces substitution of labor for capital and domestic
TDDP 02/2010 PAGE 7
production for imports, while encouraging exports and domestic savings6. Certainly from Ethiopia’s export perspective, the latter mix is preferable; arguably, it is also preferable from other policy perspectives as well since it favors more intensive use of Ethiopia’s abundant factor of production, labor, an important consideration as Ethiopia seeks to commercialize its agricultural sector, which in turn raises the issue of finding employment for surplus labor in the rural sector7
; and it encourages domestic savings, a vital issue for sustaining growth in the longer run.
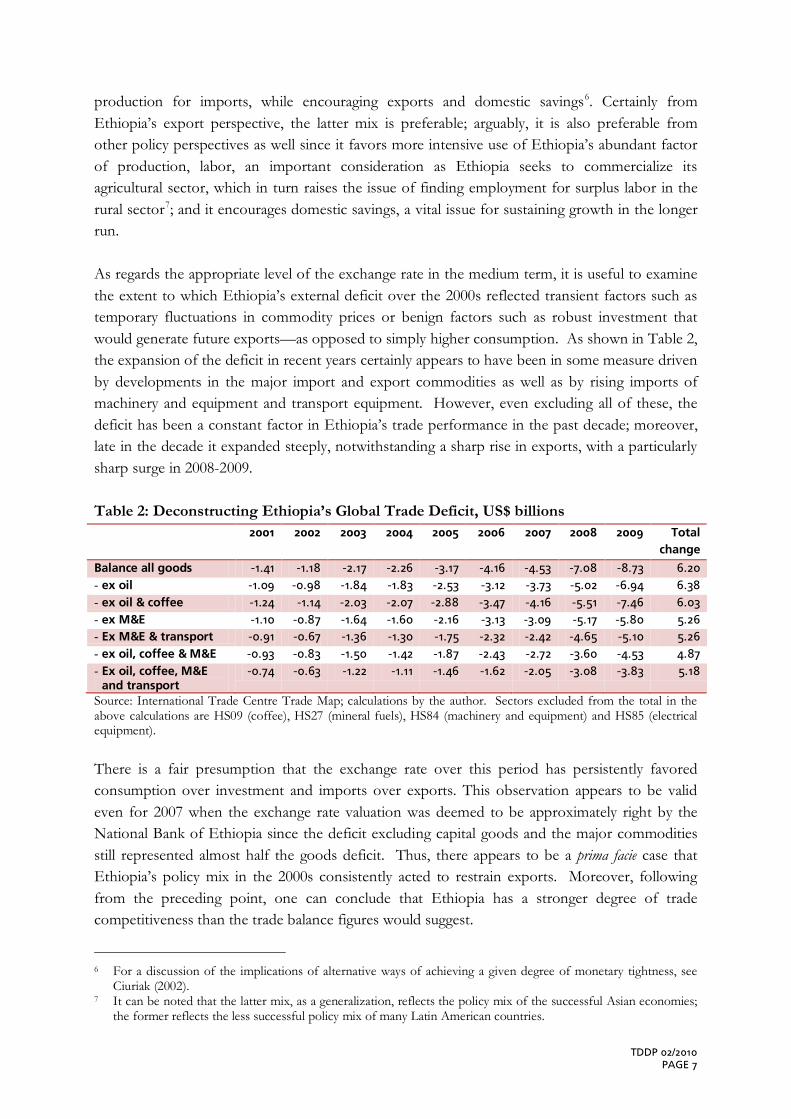
As regards the appropriate level of the exchange rate in the medium term, it is useful to examine the extent to which Ethiopia’s external deficit over the 2000s reflected transient factors such as temporary fluctuations in commodity prices or benign factors such as robust investment that would generate future exports—as opposed to simply higher consumption. As shown in Table 2, the expansion of the deficit in recent years certainly appears to have been in some measure driven by developments in the major import and export commodities as well as by rising imports of machinery and equipment and transport equipment. However, even excluding all of these, the deficit has been a constant factor in Ethiopia’s trade performance in the past decade; moreover, late in the decade it expanded steeply, notwithstanding a sharp rise in exports, with a particularly sharp surge in 2008-2009. Table 2: Deconstructing Ethiopia’s Global Trade Deficit, US$ billions 2001 2002 2003 2004 2005 2006 2007 2008 2009 Total
change
Balance all goods -1.41 -1.18 -2.17 -2.26 -3.17 -4.16 -4.53 -7.08 -8.73 6.20 - ex oil -1.09 -0.98 -1.84 -1.83 -2.53 -3.12 -3.73 -5.02 -6.94 6.38 - ex oil & coffee -1.24 -1.14 -2.03 -2.07 -2.88 -3.47 -4.16 -5.51 -7.46 6.03 - ex M&E -1.10 -0.87 -1.64 -1.60 -2.16 -3.13 -3.09 -5.17 -5.80 5.26 - Ex M&E & transport -0.91 -0.67 -1.36 -1.30 -1.75 -2.32 -2.42 -4.65 -5.10 5.26 - ex oil, coffee & M&E -0.93 -0.83 -1.50 -1.42 -1.87 -2.43 -2.72 -3.60 -4.53 4.87 - Ex oil, coffee, M&E
and transport -0.74 -0.63 -1.22 -1.11 -1.46 -1.62 -2.05 -3.08 -3.83 5.18
Source: International Trade Centre Trade Map; calculations by the author. Sectors excluded from the total in the above calculations are HS09 (coffee), HS27 (mineral fuels), HS84 (machinery and equipment) and HS85 (electrical equipment). There is a fair presumption that the exchange rate over this period has persistently favored consumption over investment and imports over exports. This observation appears to be valid even for 2007 when the exchange rate valuation was deemed to be approximately right by the National Bank of Ethiopia since the deficit excluding capital goods and the major commodities still represented almost half the goods deficit. Thus, there appears to be a prima facie case that Ethiopia’s policy mix in the 2000s consistently acted to restrain exports. Moreover, following from the preceding point, one can conclude that Ethiopia has a stronger degree of trade competitiveness than the trade balance figures would suggest.
6 For a discussion of the implications of alternative ways of achieving a given degree of monetary tightness, see
Ciuriak (2002). 7 It can be noted that the latter mix, as a generalization, reflects the policy mix of the successful Asian economies;
the former reflects the less successful policy mix of many Latin American countries.
CIURIAK: SUPPLY AND DEMAND SIDE CONSTRAINTS AS BARRIERS FOR ETHIOPIAN EXPORTS PAGE 8
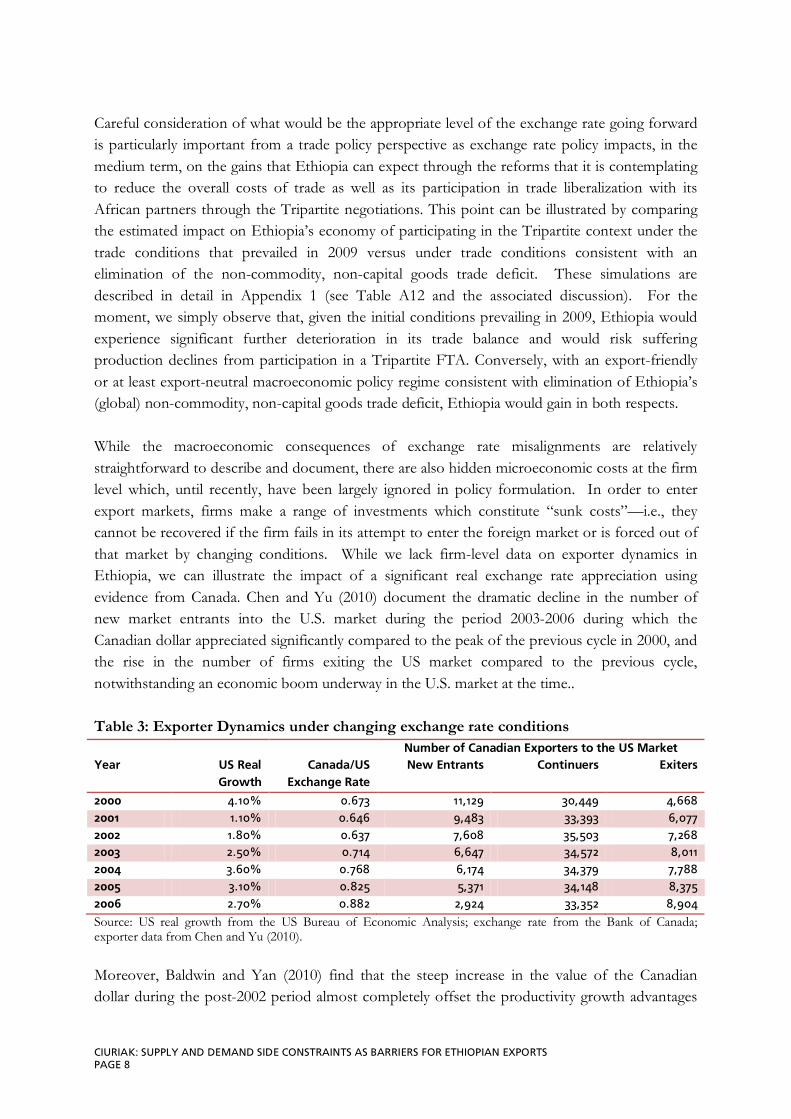
Careful consideration of what would be the appropriate level of the exchange rate going forward is particularly important from a trade policy perspective as exchange rate policy impacts, in the medium term, on the gains that Ethiopia can expect through the reforms that it is contemplating to reduce the overall costs of trade as well as its participation in trade liberalization with its African partners through the Tripartite negotiations. This point can be illustrated by comparing the estimated impact on Ethiopia’s economy of participating in the Tripartite context under the trade conditions that prevailed in 2009 versus under trade conditions consistent with an elimination of the non-commodity, non-capital goods trade deficit. These simulations are described in detail in Appendix 1 (see Table A12 and the associated discussion). For the moment, we simply observe that, given the initial conditions prevailing in 2009, Ethiopia would experience significant further deterioration in its trade balance and would risk suffering production declines from participation in a Tripartite FTA. Conversely, with an export-friendly or at least export-neutral macroeconomic policy regime consistent with elimination of Ethiopia’s (global) non-commodity, non-capital goods trade deficit, Ethiopia would gain in both respects. While the macroeconomic consequences of exchange rate misalignments are relatively straightforward to describe and document, there are also hidden microeconomic costs at the firm level which, until recently, have been largely ignored in policy formulation. In order to enter export markets, firms make a range of investments which constitute “sunk costs”—i.e., they cannot be recovered if the firm fails in its attempt to enter the foreign market or is forced out of that market by changing conditions. While we lack firm-level data on exporter dynamics in Ethiopia, we can illustrate the impact of a significant real exchange rate appreciation using evidence from Canada. Chen and Yu (2010) document the dramatic decline in the number of new market entrants into the U.S. market during the period 2003-2006 during which the Canadian dollar appreciated significantly compared to the peak of the previous cycle in 2000, and the rise in the number of firms exiting the US market compared to the previous cycle, notwithstanding an economic boom underway in the U.S. market at the time.. Table 3: Exporter Dynamics under changing exchange rate conditions Number of Canadian Exporters to the US Market Year US Real
Growth Canada/US
Exchange Rate New Entrants Continuers Exiters
2000 4.10% 0.673 11,129 30,449 4,668 2001 1.10% 0.646 9,483 33,393 6,077 2002 1.80% 0.637 7,608 35,503 7,268 2003 2.50% 0.714 6,647 34,572 8,011 2004 3.60% 0.768 6,174 34,379 7,788 2005 3.10% 0.825 5,371 34,148 8,375 2006 2.70% 0.882 2,924 33,352 8,904 Source: US real growth from the US Bureau of Economic Analysis; exchange rate from the Bank of Canada; exporter data from Chen and Yu (2010). Moreover, Baldwin and Yan (2010) find that the steep increase in the value of the Canadian dollar during the post-2002 period almost completely offset the productivity growth advantages
TDDP 02/2010 PAGE 9
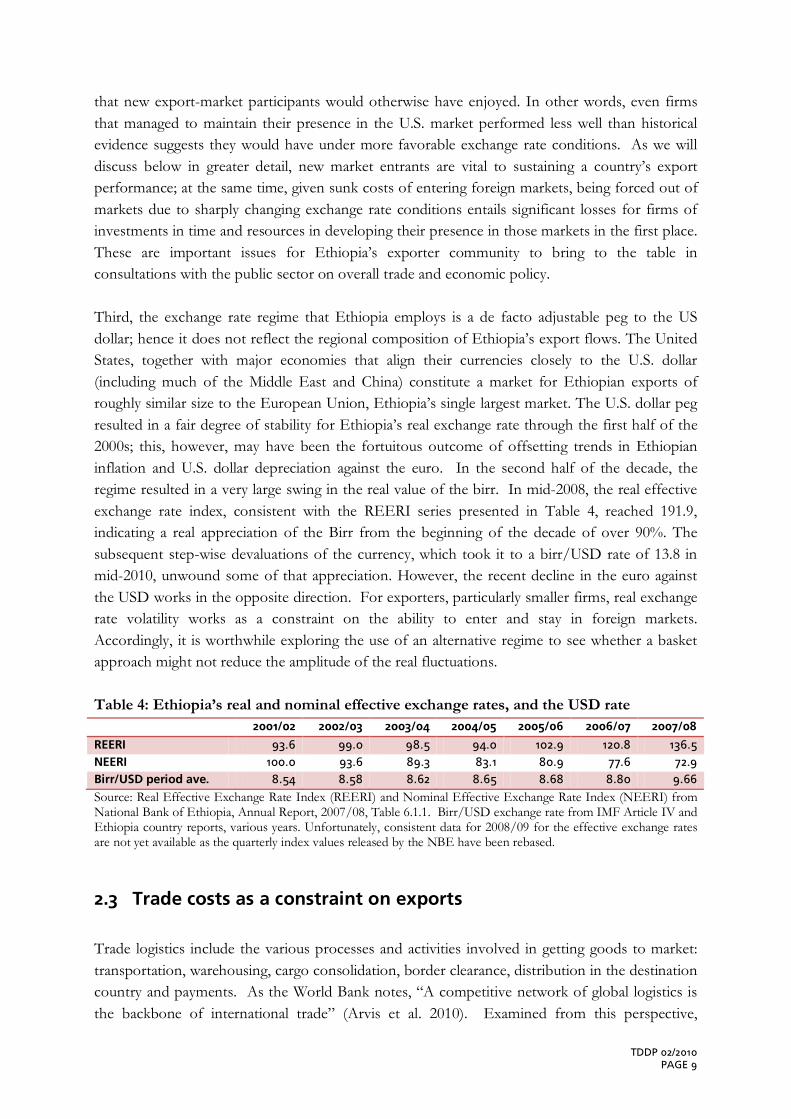
that new export-market participants would otherwise have enjoyed. In other words, even firms that managed to maintain their presence in the U.S. market performed less well than historical evidence suggests they would have under more favorable exchange rate conditions. As we will discuss below in greater detail, new market entrants are vital to sustaining a country’s export performance; at the same time, given sunk costs of entering foreign markets, being forced out of markets due to sharply changing exchange rate conditions entails significant losses for firms of investments in time and resources in developing their presence in those markets in the first place. These are important issues for Ethiopia’s exporter community to bring to the table in consultations with the public sector on overall trade and economic policy. Third, the exchange rate regime that Ethiopia employs is a de facto adjustable peg to the US dollar; hence it does not reflect the regional composition of Ethiopia’s export flows. The United States, together with major economies that align their currencies closely to the U.S. dollar (including much of the Middle East and China) constitute a market for Ethiopian exports of roughly similar size to the European Union, Ethiopia’s single largest market. The U.S. dollar peg resulted in a fair degree of stability for Ethiopia’s real exchange rate through the first half of the 2000s; this, however, may have been the fortuitous outcome of offsetting trends in Ethiopian inflation and U.S. dollar depreciation against the euro. In the second half of the decade, the regime resulted in a very large swing in the real value of the birr. In mid-2008, the real effective exchange rate index, consistent with the REERI series presented in Table 4, reached 191.9, indicating a real appreciation of the Birr from the beginning of the decade of over 90%. The subsequent step-wise devaluations of the currency, which took it to a birr/USD rate of 13.8 in mid-2010, unwound some of that appreciation. However, the recent decline in the euro against the USD works in the opposite direction. For exporters, particularly smaller firms, real exchange rate volatility works as a constraint on the ability to enter and stay in foreign markets. Accordingly, it is worthwhile exploring the use of an alternative regime to see whether a basket approach might not reduce the amplitude of the real fluctuations. Table 4: Ethiopia’s real and nominal effective exchange rates, and the USD rate 2001/02 2002/03 2003/04 2004/05 2005/06 2006/07 2007/08
REERI 93.6 99.0 98.5 94.0 102.9 120.8 136.5 NEERI 100.0 93.6 89.3 83.1 80.9 77.6 72.9 Birr/USD period ave. 8.54 8.58 8.62 8.65 8.68 8.80 9.66 Source: Real Effective Exchange Rate Index (REERI) and Nominal Effective Exchange Rate Index (NEERI) from National Bank of Ethiopia, Annual Report, 2007/08, Table 6.1.1. Birr/USD exchange rate from IMF Article IV and Ethiopia country reports, various years. Unfortunately, consistent data for 2008/09 for the effective exchange rates are not yet available as the quarterly index values released by the NBE have been rebased.
2.3 Trade costs as a constraint on exports Trade logistics include the various processes and activities involved in getting goods to market: transportation, warehousing, cargo consolidation, border clearance, distribution in the destination country and payments. As the World Bank notes, “A competitive network of global logistics is the backbone of international trade” (Arvis et al. 2010). Examined from this perspective,

CIURIAK: SUPPLY AND DEMAND SIDE CONSTRAINTS AS BARRIERS FOR ETHIOPIAN EXPORTS PAGE 10
Ethiopia is one of the most difficult places in the world from which to engage in the global economy. Ethiopia ranks 123rd out of 155 countries in the World Bank’s trade logistics survey (Arvis et al. 2010). Corroborating this finding, Ethiopia ranks 159th
in terms of trading across borders in the World Bank’s Doing Business survey.
One obvious consequence of relatively high trade costs is a relatively low trade share of GDP. Since some products must be imported regardless of the level of trade costs, whereas customers elsewhere have many alternative suppliers for each and every product that Ethiopia produces, the very, very low export share of GDP is perhaps an even better indicator of the impediments posed to trade by the costs of doing business across Ethiopia’s borders. The World Bank, in its Doing Business benchmarking methodology, breaks down trade costs into three general categories: the number of documents that must be processed to ship goods out of or into the country, the time it takes to carry out these procedures and to move goods to the nearest port, and the official fees and commercial costs involved in getting goods from the factory door to customers in other countries. Table 4 summarizes how Ethiopia ranks compared to the world’s best, to Africa’s best, and to the best in landlocked Africa in the latest rankings. Table 4: Costs of trading across borders in Ethiopia, 2010
ETH Best in World Best in Africa Best in Land-locked Africa (excluding SACU)
Export No. of Documents 8 2 France 4 Madagascar 6 Uganda et al.
Time (days) 49 5 Singapore etc. 11 Senegal 32 Mali
Cost (US$ per container) 1,940 450 Malaysia 690 Sao Tome & Principe
1,713 Malawi
Import No. of Documents 8 2 France 5 Djibouti 7 Uganda
Time (days) 45 3 Singapore 14 Senegal 34 Uganda
Cost (US$ per container) 2,993 439 Singapore 577 Sao Tome & Principe
2,570 Malawi
Source: World Bank, Doing Business 2010: Ethiopia. Ethiopia’s monetary and time costs of trade are, to some extent, elevated simply by its being landlocked. Trade costs in terms of both time and money are documented as being systematically higher for landlocked versus coastal countries, not only in Africa but also elsewhere, including in Europe (Arvis et al. 2010: Table 2.6). At the same time, as argued by Arvis et al. (2007, 2010), this is not because the distance to ports or the unit cost of transportation services are necessarily unusually high in landlocked countries—e.g., Addis Ababa is closer to a port than a major industrial centre like Munich, Germany, and in fact to a brand new container port at Doraleh, Djibouti, managed by a global port management company equipped to operate in a modern trade environment, and featuring all the modern physical infrastructure, including a quay of 1050m and draught of 18m to allow it serve 15,000 TEU super post-Panamax vessels, giant Gantry cranes to unload containers and the full gamut of modern information technology systems for
TDDP 02/2010 PAGE 11
trade in place8
. Rather, the problems lie in the poor state of transit systems (in particular of trade corridor infrastructure development and maintenance) as well as vulnerability of transportation services to rent-seeking activities (e.g., transit procedures that exploit monopoly advantages to extract payment of additional fees or duties or to make movement of goods subject to excessive control in the transit country).
As regards the physical aspects of transit systems, there appears to be much work to be done. According to material tabled at a December 2009 experts group meeting organized by the African Development Bank Group on transit ports servicing landlocked countries, which includes Ethiopia: Interfacing road and rail systems to most Sub-Saharan ports are in poor condition and do not
support container transport. Container usage is accordingly confined to ports and their immediate vicinity, with very low
volumes of containerized transit traffic into landlocked hinterland countries; imports move inland transported in general cargo.
Statistics are not available for Ethiopia itself but we note that a recent press report suggested that half the containers inbound for Ethiopia are unstuffed and 90 percent of the outward bound containers are stuffed in Djibouti9
, indicating considerable potential to reduce costs through seamless multi-modal links between freight forwarders located in Ethiopia and the port.
The importance of improving its transportation infrastructure has long been recognized in Ethiopia. A road development program was launched in 1997, with one of the first projects being the 442 km Modjo-Awash-Gewane-Mille portion of the import-export corridor. A $100 million loan from the World Bank was recently arranged for Stage II of the project. Moreover, upgrades have been made to the railway link to Djibouti (although it is still not functional and the plans for development of a full-fledged multi-modal link appear to remain on hold). And Ethiopian Shipping Lines is in the process of introducing multi-modal capacity within Ethiopia, including shipping goods to two dry ports in the country10
.
However, as noted by Shelley (2009), multi-modal transport is dependent on rail for efficiency on journeys of more than about 600 km, which is what is needed to connect Ethiopia’s emerging industrial district in the Addis Ababa area to seaports. In the case of the Ethiopia-Djibouti line, tracks and bridges need to be improved to support heavy loads such as fuel oil tanks and faster trains. The level of ambition of the recent improvements to the railway link appears to fall well short of these standards—and stands in sharp contrast to the level of ambition shown in the building of Doraleh Port which leap-frogged the existing container ports in East Africa in terms of providing modern facilities. 8 See Eye for Transport. 2009. “DP World opens new Doraleh Container Terminal” February 10, 2009,
http://www.eft.com/content/dp-world-opens-new-doraleh-container-terminal; accessed August 9, 2010. 9 Tamrat G. Giorgis, “Djibouti Grants Monopoly on Part of Port Operation,” AllAfrica.com, 20 April 2010. 10 Capital Ethiopia, “Ethiopian Shipping Lines to Build Dry Port in Oromia State”,
http://www.capitalethiopia.com/index.php?view=article&id=12442%3Adukem-to-get-esl-container-terminal&option=com_content&Itemid=4.
CIURIAK: SUPPLY AND DEMAND SIDE CONSTRAINTS AS BARRIERS FOR ETHIOPIAN EXPORTS PAGE 12
Given the cost advantages of high-speed trains—they use one-third as much energy as comparable air travel and less than one-fifth as much as road transport—high-speed rail has been described as a “game changer” for the United States (Gertler 2009). China has recognized these advantages and is moving rapidly to develop its own web of high-speed rail links: it has opened or will open 42 new high speed rail lines between 2009 and 2012, including a number that will handle freight11. Similarly, for Ethiopia, a high-speed modern rail link to Doraleh would be a “game changer”, effectively removing the cost handicap of being a landlocked, African country. To be sure, there are legitimate concerns about being hostage to rent extraction due to the lack of alternatives, but the answer to that surely is not to put the first line on hold but rather to fast-track a second line12
.
For potential gains from improved physical infrastructure to be realized, comparable improvements need to be made in border and transit procedures. Almost by definition, improving the efficiency of trade corridors requires regional cooperation and coordination, without which an individual country’s development initiatives in its own territory can yield little in the way of benefits. In this regard, for example, Uganda’s recent improvement in its rankings on the World Bank’s Logistics Performance Index is attributed to a successful project to facilitate transit at the Malaba Border Post in Kenya (Arvis et al. 2010: 19). Regional transit systems that facilitate transshipment of goods under customs control through a country have long been in place around the world. One example of such a system is the Transport International Routier (TIR) Convention, based on the UN Customs Convention on the International transport of Goods under Cover of TIR Carnets (1960). The TIR carnet, which is a single, harmonized transit document, reduces customs formalities at frontiers to a minimum. However, to be effective the system must be supported by a system of guarantees and an institutional framework of recognized freight operators. The system is used in Europe and elsewhere in the world. A similar system was formally adopted by the Economic Community of West African States (ECOWAS) in 1982 but failed to gain traction for lack of commitment in its implementation13
. Carnet-based systems are however part of the focus of the World Bank’s regional trade facilitation projects in Africa (Hoekman 2009). For Ethiopia, adopting such a system, in collaboration with Djibouti, would be an essential complementary reform to the recommended improvements in transport infrastructure.
Air cargo, which is particularly important for time-sensitive goods and which is not hostage to transit corridor issues can also face high trade costs since a very significant portion of the overall costs of trading across borders are administrative in nature. Djankov, Freund and Pham (2010) found that about 75 percent of the overall costs of trading across borders could be attributed, on average, to administrative costs. Importantly, they note that these costs tend to be nearly identical
11 New York Times, “China Sees Growth Engine in a Web of Fast Trains,” February 12, 2010. 12 We note that the physical capacity in the three major alternative ports, Port Sudan, Port of Assab and Berbera are
well short of the needs of large-scale modern container ships. Accordingly, even in the hopeful event of political stabilization in the Horn of Africa, the Djibouti option looms as the only realistic medium-term option.
13 The ECOWAS agreement was formally called the ECOWAS Transit Routier Inter-États (TRIE).
TDDP 02/2010 PAGE 13
for sea and air. For Ethiopia, reforms to import and export procedures that reduce the time it takes to execute trades would effectively move it closer to the global economy: distance can be measured in time, and for business time is money. Several other factors pertinent to the discussion of trade costs might be noted. First, with reference to the above discussion on trade imbalances, one “hidden” reason for high trade costs in Ethiopia is the great imbalance in goods trade: with goods imports 5 times the level of goods exports, a substantial proportion of the containers bound for Ethiopia leave empty. According to a recent press report, approximately 100,000 containers enter Djibouti with Ethiopia-bound goods while out-bound containers are estimated to reach between 30,000 and 40,000 units annually14. Since carriers build the cost of empty container retrieval into the prices they charge for loaded containers, this “deadheading” adds considerably to Ethiopia’s cost of trade15
. Accordingly, if Ethiopia adopts policies to reduce the imbalance in goods trade, it will also likely reduce the per-container cost of trade.
Second, in considering trade costs as an impediment to exports, it is important to recognize that high costs of importing are increasingly damaging for export performance since they make it more difficult for a country to participate in supply chains. Reflecting the increasing fragmentation of production across borders, one of the great drivers of global trade in recent decades has been trade in intermediate goods, which typically involve importing inputs for processing and then re-exporting the transformed components. In this context, time and money costs of importing products work just as perniciously to reduce exports as do costs directly associated with exporting. Ethiopia’s high cost of importing thus adds to the costs of exporting to form a powerful deterrence to its engaging in process trade. Third, long lead times for import and export are closely associated with heightened uncertainty concerning the exact amount of time that is required to import or export. Such uncertainty can be even more damaging for traders than the time costs themselves. As noted by Hummels:
“Lengthy shipping times impose inventory-holding and depreciation costs[16
] on shippers. Inventory-holding costs include both the capital cost of the goods while in transit, as well as the need to hold larger buffer-stock inventories at final destinations to accommodate variation in arrival time [...] These costs will be magnified in the presence of fragmentation. When countries specialize in stages of production and trade intermediate goods the inventory-holding and depreciation costs for early-stage value-added accrue throughout the duration of the production chain” (Hummels 2001).
14 Footnote 9 supra. 15 Empty container costs include repositioning of empty containers, terminal handling and storage fees, ship’s time,
and equipment per diems and repair. One estimate suggested that empty containers cost carriers, worldwide, almost US$ 23 billion in 2004 (UNESCAP: Container Port Volumes).
16 In Hummels’ analysis, depreciation captures any reason that a newly produced good might be preferable to an older good, including literal spoilage of fresh produce or cut flowers, items with immediate information content such as newspapers, and goods with complex characteristics for which demand cannot be forecast well in advance such as holiday toys and fashion garments.
CIURIAK: SUPPLY AND DEMAND SIDE CONSTRAINTS AS BARRIERS FOR ETHIOPIAN EXPORTS PAGE 14
Overall, Hummels found that each day in transit is equivalent to a 0.8% ad valorem tariff on the goods being shipped. While this estimate is derived from comparing transportation time and costs across different transportation modes, he notes that
“the estimates are informative about many policies and sources of technological change that speed goods to market. For example, eliminating or streamlining elaborate customs procedures allow imported goods reach their destinations more quickly. Investing in more efficient port infrastructure may accomplish similar goals. The estimates [...] indicate that a four-day wait for customs inspection is equivalent to the cost of explicit tariffs for most manufactures” (Hummels 2001).
A related approach using a different methodology by Djankov, Freund and Pham (2010) arrived at a complementary conclusion that a one percent increase in the time to execute a trade reduced the value of trade by 1.3 percent. Armed with these estimates, it is possible to provide some indication of the scale of trade gains that could be achieved by Ethiopia by reducing trade costs. The perennial question in such exercises is on what basis to make assumptions concerning the degree of feasible cost reductions. A conservative approach is to assume cost reductions to the level consistent with “best in region” – in Ethiopia’s case, that would be best in landlocked Africa. On this basis, the time to export would be reduced from 49 days to 32 and to import from 45 to 34. Similarly, the cost of exporting a container would be reduced from US$1,940 to US$1,713; and of importing a container from US$2,993 to US$2,573. However, a more ambitious approach for Ethiopia would be to emulate the most successful reformers in the region and elsewhere. Delving into this issue in depth is well beyond the feasible scope of the present note but a few observations can be made. Ghana for instance made very significant reductions in clearance times through the Airport, with times reduced to an average of two to four hours, from the two to three days average prior to the implementation of its fully automated TradeNet system for customs information (International Trade Centre 2008). We note that Ethiopia automated its customs and tax administration in 2004 but has not implemented the risk-based customs controls which that system enables; thus whereas the ease of paying taxes in Ethiopia has substantially improved, the ease of trading across borders has not. Accordingly, the potential for significant trade cost reductions in the Ethiopian context are available—and presumably feasible, given the example of Ghana. To put the issue of trade costs into quantitative perspective, Table 5 calculates the implied trade levels in 2009 if Ethiopia: had trade costs in line with best-in-region; or reduced its administrative costs to the lowest time in any jurisdiction17
.
17 For this calculation, administrative costs are assumed as per the Djankov, Freund and Pham (2010) estimates to
be 75 percent of the time costs. The lowest time in any jurisdiction for exports and imports are in Denmark and Singapore respectively. Taking these times as close to what is achievable minimum in terms of pure administrative costs and adding in Ethiopia’s non-administrative time costs (assumed to be 25 percent of current time costs of trade), would reduce time to export and import in Ethiopia to 17.25 and 14.25 days respectively.
TDDP 02/2010 PAGE 15
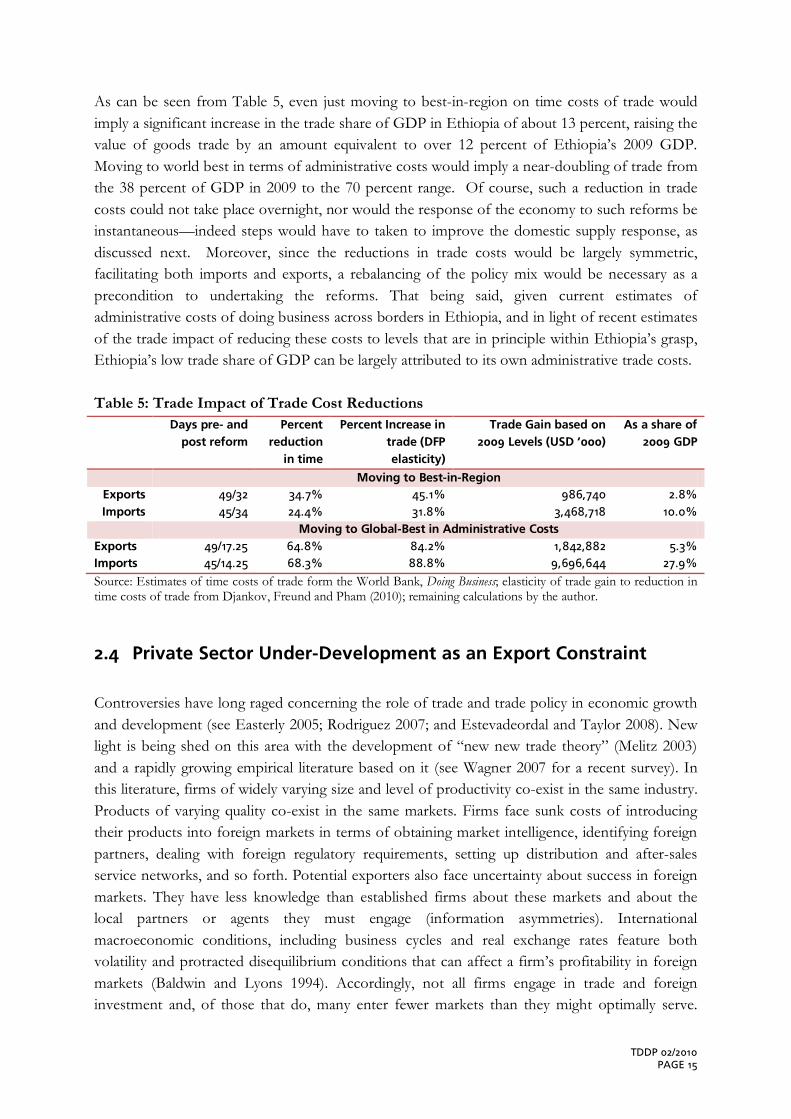
As can be seen from Table 5, even just moving to best-in-region on time costs of trade would imply a significant increase in the trade share of GDP in Ethiopia of about 13 percent, raising the value of goods trade by an amount equivalent to over 12 percent of Ethiopia’s 2009 GDP. Moving to world best in terms of administrative costs would imply a near-doubling of trade from the 38 percent of GDP in 2009 to the 70 percent range. Of course, such a reduction in trade costs could not take place overnight, nor would the response of the economy to such reforms be instantaneous—indeed steps would have to taken to improve the domestic supply response, as discussed next. Moreover, since the reductions in trade costs would be largely symmetric, facilitating both imports and exports, a rebalancing of the policy mix would be necessary as a precondition to undertaking the reforms. That being said, given current estimates of administrative costs of doing business across borders in Ethiopia, and in light of recent estimates of the trade impact of reducing these costs to levels that are in principle within Ethiopia’s grasp, Ethiopia’s low trade share of GDP can be largely attributed to its own administrative trade costs. Table 5: Trade Impact of Trade Cost Reductions Days pre- and
post reform Percent
reduction in time
Percent Increase in trade (DFP elasticity)
Trade Gain based on 2009 Levels (USD ‘000)
As a share of 2009 GDP
Moving to Best-in-Region Exports 49/32 34.7% 45.1% 986,740 2.8% Imports 45/34 24.4% 31.8% 3,468,718 10.0%
Moving to Global-Best in Administrative Costs Exports 49/17.25 64.8% 84.2% 1,842,882 5.3% Imports 45/14.25 68.3% 88.8% 9,696,644 27.9% Source: Estimates of time costs of trade form the World Bank, Doing Business; elasticity of trade gain to reduction in time costs of trade from Djankov, Freund and Pham (2010); remaining calculations by the author.
2.4 Private Sector Under-Development as an Export Constraint Controversies have long raged concerning the role of trade and trade policy in economic growth and development (see Easterly 2005; Rodriguez 2007; and Estevadeordal and Taylor 2008). New light is being shed on this area with the development of “new new trade theory” (Melitz 2003) and a rapidly growing empirical literature based on it (see Wagner 2007 for a recent survey). In this literature, firms of widely varying size and level of productivity co-exist in the same industry. Products of varying quality co-exist in the same markets. Firms face sunk costs of introducing their products into foreign markets in terms of obtaining market intelligence, identifying foreign partners, dealing with foreign regulatory requirements, setting up distribution and after-sales service networks, and so forth. Potential exporters also face uncertainty about success in foreign markets. They have less knowledge than established firms about these markets and about the local partners or agents they must engage (information asymmetries). International macroeconomic conditions, including business cycles and real exchange rates feature both volatility and protracted disequilibrium conditions that can affect a firm’s profitability in foreign markets (Baldwin and Lyons 1994). Accordingly, not all firms engage in trade and foreign investment and, of those that do, many enter fewer markets than they might optimally serve.
CIURIAK: SUPPLY AND DEMAND SIDE CONSTRAINTS AS BARRIERS FOR ETHIOPIAN EXPORTS PAGE 16
Indeed only relatively highly productive firms can absorb the costs of entering export markets and only the most productive of these can absorb the still higher costs of investing abroad while remaining profitable in those markets (Helpman et al. 2003). The flux of entry into and exit out of various foreign markets of firms and of individual products—or change at the “extensive margin”—is high. This constitutes an important factor in determining a country’s overall trade growth, alongside changes in sales by existing exporters of established products in established markets (which represents change at the “intensive margin”). In the modern world, rapid technological change renders yesterday’s market-leading products obsolete tomorrow, and worldwide investment in skills and equipment, economic infrastructure and institutional reforms incrementally changes relative national capabilities from year to year. As a result, the workshops of the world migrate and some locales see their economic fortunes wither even as others prosper. Sustaining access to foreign markets is as hard as achieving it. Traditionally, the gains from trade were interpreted as arising from specialization. While this is typically true at the firm level, it is not necessarily true at the national level. Particularly at lower levels of economic development, trade expansion is characterized by a high degree of diversification of products and markets (Imbs and Wacziarg 2003). Underlying this dynamic is a stream of new firms and new products entering new markets. For example, China’s remarkable expansion of exports following its accession to the World Trade Organization was accomplished in good measure by expansion of the number of different products it exported: to the US market alone, the product count (taking exports at the HS10 digit level as constituting an individual product) increased from 9,249 in 1998 to 13,123 products in 2006 (Acharya 2010: 286). Thus, while it is important to take into account the products and markets that already figure in a country’s export activity, it is perhaps even more important to consider the scope for trade creation in areas which are currently not traded—i.e., to fill in the “zeros” in the country’s trade matrix of products and destinations. Export diversification has long been a goal incorporated in Ethiopia’s national strategy of Agricultural Development Led Industrialization (ADLI), with the attainable objective being seen as expanding the processing of primary agricultural products. The policy goals underpinning this strategy are consistent with traditional objectives of developing countries seeking to counter declining terms of trade for their commodities and reducing export instability through a “portfolio effect”, and by reducing instability to encourage firms to incur the sunk costs to enter foreign markets (Hesse 2008). However, the important lesson to draw form the recent trade literature is that, given an underlying population of firms of varying levels of productivity, trade liberalization naturally induces diversification insofar as the most productive firms in various sectors are provided new export opportunities that were not there before—even in sectors which overall suffer a contraction in output due to import competition. Since public authorities generally lack information on the productivity distribution of the country’s firms, there tend be surprises in the wake of trade liberalization in the form of unexpected export successes. Accordingly, in considering Ethiopia’s trade prospects, it is important not to limit attention to
TDDP 02/2010 PAGE 17
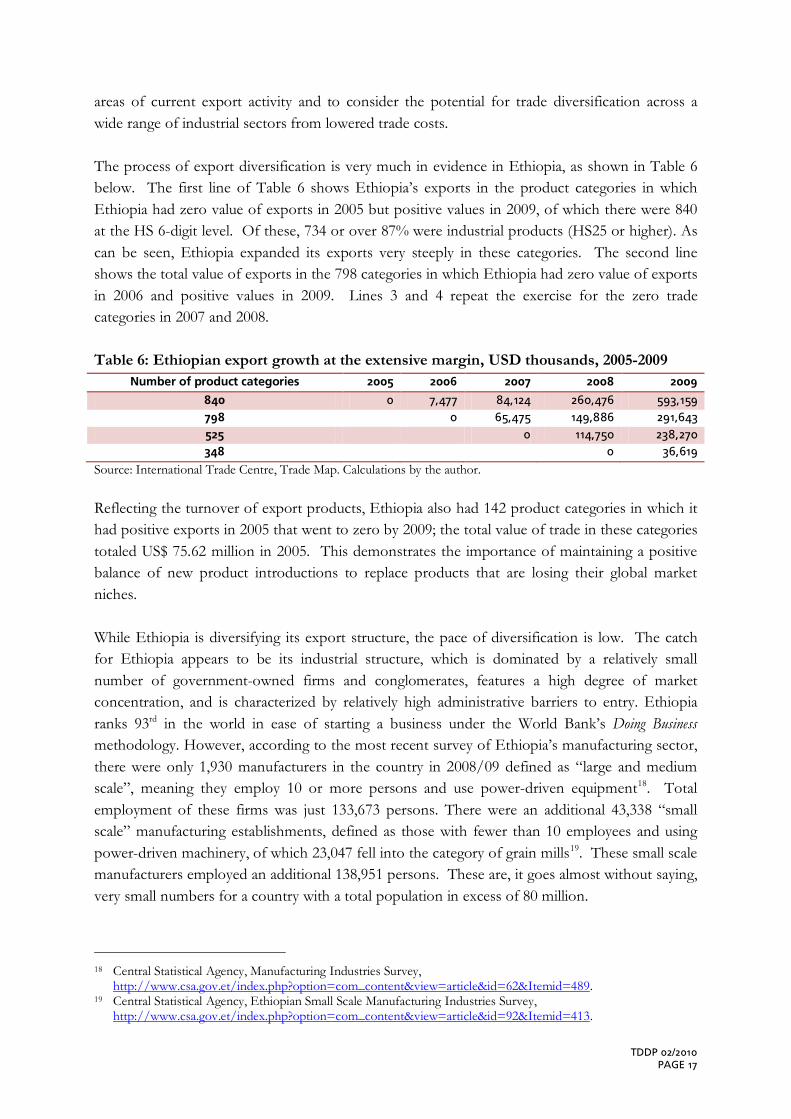
areas of current export activity and to consider the potential for trade diversification across a wide range of industrial sectors from lowered trade costs. The process of export diversification is very much in evidence in Ethiopia, as shown in Table 6 below. The first line of Table 6 shows Ethiopia’s exports in the product categories in which Ethiopia had zero value of exports in 2005 but positive values in 2009, of which there were 840 at the HS 6-digit level. Of these, 734 or over 87% were industrial products (HS25 or higher). As can be seen, Ethiopia expanded its exports very steeply in these categories. The second line shows the total value of exports in the 798 categories in which Ethiopia had zero value of exports in 2006 and positive values in 2009. Lines 3 and 4 repeat the exercise for the zero trade categories in 2007 and 2008. Table 6: Ethiopian export growth at the extensive margin, USD thousands, 2005-2009
Number of product categories 2005 2006 2007 2008 2009
840 0 7,477 84,124 260,476 593,159 798 0 65,475 149,886 291,643 525 0 114,750 238,270 348 0 36,619
Source: International Trade Centre, Trade Map. Calculations by the author. Reflecting the turnover of export products, Ethiopia also had 142 product categories in which it had positive exports in 2005 that went to zero by 2009; the total value of trade in these categories totaled US$ 75.62 million in 2005. This demonstrates the importance of maintaining a positive balance of new product introductions to replace products that are losing their global market niches. While Ethiopia is diversifying its export structure, the pace of diversification is low. The catch for Ethiopia appears to be its industrial structure, which is dominated by a relatively small number of government-owned firms and conglomerates, features a high degree of market concentration, and is characterized by relatively high administrative barriers to entry. Ethiopia ranks 93rd in the world in ease of starting a business under the World Bank’s Doing Business methodology. However, according to the most recent survey of Ethiopia’s manufacturing sector, there were only 1,930 manufacturers in the country in 2008/09 defined as “large and medium scale”, meaning they employ 10 or more persons and use power-driven equipment18. Total employment of these firms was just 133,673 persons. There were an additional 43,338 “small scale” manufacturing establishments, defined as those with fewer than 10 employees and using power-driven machinery, of which 23,047 fell into the category of grain mills19
. These small scale manufacturers employed an additional 138,951 persons. These are, it goes almost without saying, very small numbers for a country with a total population in excess of 80 million.
18 Central Statistical Agency, Manufacturing Industries Survey,
http://www.csa.gov.et/index.php?option=com_content&view=article&id=62&Itemid=489. 19 Central Statistical Agency, Ethiopian Small Scale Manufacturing Industries Survey,
http://www.csa.gov.et/index.php?option=com_content&view=article&id=92&Itemid=413.

CIURIAK: SUPPLY AND DEMAND SIDE CONSTRAINTS AS BARRIERS FOR ETHIOPIAN EXPORTS PAGE 18
Market economies in general are characterized by a high rate of firm formation and disappearance. This appears to be an essential aspect of the market system in channeling scarce resources to their most profitable uses—in a sense, the market is a form of “search engine” that tries out various possible products to see which ones can be produced with sufficient profit to stay in the market over the longer term. But for such a search engine to identify profitable niches in a rapidly changing and fiercely competitive global economy, the search—which includes market entry by new firms with new products—must be made as easy as possible. Ethiopia’s ranking under the World Bank’s Doing Business methodology for starting a business improved significantly in 2010 due to a reduction in the number of procedures required to start a company, the time it took to start a company, and the minimum capital required. However, given the concentrated market structure, substantially freer market entry may be required to develop the number and diversity of private sector firms that is a prerequisite for trade liberalization to generate the economic gains that theory predicts. Building on the preceding point, it is not enough to simply foster firm formation. Ethiopia requires the emergence of many, many successful firms, selling competitive products in its home market. Successful firms and competitive products do not emerge on a sustained basis under just any conditions. The modern competitiveness literature emphasizes the importance of the industrial districts described as far back as Marshall (1879) as the spawning grounds for new firms and products. The essential idea in this literature is that positive externalities such as knowledge spillovers20
generated by close proximity of competing and complementary forms of human and physical capital enhance the ability of a region to compete. Firms in such industrial districts— “clusters” in modern jargon—sit in a rich context, connected to and getting feedback from, factor and product markets, suppliers and customers, collaborators and competitors. It is the information flow within this setting that helps firms overcome the limitations of their own knowledge and enables them to both identify market opportunities and to develop the products that meet the market’s needs.
Ethiopia has only very recently developed its first industrial park in Dukem, with China’s support. This is a vital first step in the direction of creating a viable, dynamic industrial culture in Ethiopia21
. Combined with further reduction in the cost of establishing new firms, the development of further industrial areas, and facilitation of links between these industrial areas and with Ethiopia’s institutes of higher learning, especially its engineering schools, would be an important step in reducing the microeconomic barriers to Ethiopia’s ability to export successfully.
20 In this context, externalities are aspects of a firm’s operations that have “public good” characteristics—that is,
the firm does not fully capture all the benefits of its activities. For example, a firm that pioneers the path to exporting a given product to a given market may be imitated by other firms that did not invest in the cost of developing that market. More generally, the interchange of ideas and often personnel amongst companies within a local region acts like technology transfer, expanding capabilities of firms at little cost.
21 We note that Ethiopian Shipping Lines has plans to situate a container terminal in Dukem, connecting it to dry ports within Ethiopia. Accordingly, things are moving in the right direction.
TDDP 02/2010 PAGE 19
2.5 Domestic producer service margins as an export constraint At the plant or establishment level, specialization typically allows the achievement of higher levels of productivity22
. One aspect of increased specialization of manufacturing firms is out-sourcing of various types of functions such as intermediate inputs and internal services to firms specializing in these functions. By the same token, to be competitive globally, manufacturing firms need to have access to efficient, low-cost industrial inputs and producer services, including in the latter case, distribution systems within the country, transport, telecommunications and finance. High margins in these areas can systematically depress the competitiveness of a country’s manufacturing sector. Accordingly, efforts to create a viable industrial culture in Ethiopia can thus be undermined by inadequate development or excessive costs in producer services. In turn, under-development of industry works in the longer term to constrain growth of competitive exports.
While the services sector in Ethiopia is expanding its share of economic activity (Access Capital 2010), there appear to be grounds for concerns that market structure in the producer services sector might represent a constraint on the development of the industrial sector. While a detailed investigation into this issue is well beyond the scope of the present note, we note some anecdotal evidence obtained from the turbulent conditions reported in the cement market in recent years, reflecting among other things: A temporary restriction on cement imports, which had been permitted since 2006 on the
franco valuta basis (i.e., by importers with independent access to foreign exchange23
A temporary shutdown in power supply to domestic cement manufacturers. ).
A financial market report on the Ethiopian cement sector during this period noted the very high margins between the ex-factory price of cement, reported at 155 birr per quintal (=100 kg), and the retail price in Addis Ababa, reported in the 325-350 range. It went on to comment on the impact of imported cement on the prices in the domestic market as follows:
“Data for the first four months for 2009 [...] show that cement import prices (CIF basis) averaged Birr 152 per quintal [...] though retail prices averaged Birr 276 during this time frame. This implies that Birr 124 (or 45 percent) of the retail price of domestic cement reflects some combination of domestic transport costs, official charges, and retailer margins. A sizeable entry of much lower-priced imports would normally be expected to bring down domestic prices, but the fact that this has not taken place in the Ethiopian context is somewhat puzzling: the possible culprits here are high transport costs, high retailer margins, and/or obstacles in the trading regime (such as limited cement import licenses being offered) that work to reduce the amount of imports that would otherwise enter the country” (Access Capital Research 2009).
22 For a discussion of plant- versus firm-level economies or diseconomies of scale and scope, see Lileeva and Van
Biesebroeck (2010). 23 We note that one of the benefits of WTO accession for the Ethiopian economy would likely be the elimination
of such irregular import procedures with regular tariff barriers. This would serve both to decrease uncertainty about access to imports while also levelling the playing field within Ethiopia in this regard, and transfer some of the monopoly rents in the system to government in the form of tariff revenues.

CIURIAK: SUPPLY AND DEMAND SIDE CONSTRAINTS AS BARRIERS FOR ETHIOPIAN EXPORTS PAGE 20
Simply put, Ethiopia’s producer services appear to operate on the basis of high margins and low volumes; shifting to a low margin-high volume business strategy would fundamentally improve the ability of the underlying industrial sector to access export markets on a competitive basis, not least by gaining access to imported inputs at globally competitive prices.
2.6 Thick borders as an export constraint One of the features of Ethiopia’s pattern of bilateral trade is the remarkably low value of trade with its immediate neighbors. As a “stylized fact”, being adjacent to a trading partner doubles the intensity of trade with that partner compared to non-adjacent countries24
. To gain a sense of what might be more “normal” levels of bilateral trade between Ethiopia and its immediate neighbors, and thus a sense of what the boost to trade would be from a successful regional political process of regional community-building, we run a similar “thought experiment” to that in section 1.1 which considered how strong Ethiopia’s trade might be with the world’s major economies. In this case, we use Kenya’s trade with its immediate neighbors Tanzania and Uganda as benchmarks. The top panel in Table 7a below shows, from a Kenyan perspective, the tariffs it applies (“Tariff KEN M”), and that it faces(“Tariff KEN X) in trade with Tanzania and Ethiopia respectively. It also shows the bilateral distance between Kenya and each of these partners, the partners’ respective GDPs and the level of two-way trade they had with Kenya in 2008, based on the respective countries’ import statistics.
Table 7a: Benchmarking Ethiopia’s “missing” trade with immediate neighbors: 2008
Tariff KEN M
Tariff KEN X
Bilateral Distance
Partner GDP
2008 two-way
trade
2008 two-way trade adjusted
for tariffs
2008 two-way trade adjusted
for gravity
Kenya-Tanzania 0.0% 0.32% 550 20,721 536.18 216.39 Kenya-Ethiopia 1.45% 16.32% 1,186 25,658 33.40 33.90 124.20
Kenya-Uganda 0.0% 0.27% 479 14,529 586.75 221.38 Kenya-Ethiopia 1.45% 16.32% 1,186 25,658 33.40 33.90 157.87 Source: Tariff data from the International Trade Centre, Market Access Map; distance data from CEPII (figures used here are the regionally weighted distwces measure); GDP data are from the IMF, World Economic Outlook database; calculations are by the author. As can be seen, actual two-way trade between Kenya and Ethiopia amounted to US$ 33.4 million or only about 6 percent of the level of two-way trade between Kenya and Tanzania. However, this is not a fair comparison since the levels of tariffs in the two relationships are very different. Kenya applies no tariffs on its imports from Tanzania and Uganda and faces very low tariffs on its exports to these East African Community partners. By contrast, it levies a 1.45 percent tariff on Ethiopia and faces in turn a 16.32 percent tariff in Ethiopia. To level this playing field, we run a simulation using a standard partial equilibrium trade model to raise tariffs on trade between Kenya, Tanzania and Uganda equal to those that Kenya applies and faces in its trade with Ethiopia. The resulting trade levels are given in the next column in Table 7a; as can be seen,
24 The estimate is based on Frankel (2000: 5).

TDDP 02/2010 PAGE 21
Kenya’s bilateral trade with Ethiopia rises marginally due to the trade diversionary effects while its bilateral trade with both Tanzania (top panel) and Uganda (bottom panel) falls sharply. The final column shows the level of Kenya-Ethiopia trade taking into account the fact that Ethiopia had a GDP in 2008 that was 24 percent larger than Tanzania’s but its bilateral distance to Kenya was more than twice that of Tanzania’s; and the corresponding figures using Kenya-Uganda as the benchmark. Taking the gravity relationships into account (using conventional unitary elasticities for size and distance) results in an “expected” ratio of trade between Kenya and Ethiopia of about 57 percent of that between Kenya and Tanzania. Applying this ratio to the tariff-adjusted level of trade yields an estimate of how much two-way trade between Kenya and Ethiopia would have taken place in 2008, if the trading relationship were as intense as that between Kenya and Tanzania. The second panel runs the same experiment using the Kenya-Uganda relationship as a benchmark. We obtain a very similar level of “expected” trade for Kenya and Ethiopia of US$157.87 million or more than 4½ times the level observed. The average of the two estimates puts the “missing trade between Kenya and Ethiopia at a little over US$100 million. Applying the same principles to Ethiopia’s trade with its other neighbors provides a benchmark against which to evaluate observed trade levels. This experiment is carried out in Table 7b which seeks to identify the “missing” trade that could plausibly be attributed to the unsettled state of Ethiopia’s immediate neighborhood and under-developed level of regional cooperation. Table 7b: Evaluating Ethiopia’s “missing” trade with immediate neighbors: 2008
Distance GDP
Two-way trade 2008
Gravity Ratio to ETH/KEN
Implied Trade level
Missing trade
Djibouti 519 982 63.06 0.074 10.48 -52.59 Eritrea 586 1,476 0 0.099 13.95 13.95 Somalia 931 2,693 88.46 0.113 16.00 -72.46 Sudan (ex oil) 952 57,911 83.34 2.388 336.80 253.46 Uganda 1,178 14,529 1.12 0.484 68.28 67.17 Kenya 1,186 30236 33.40 1.000 141.04 107.63 Total 317.16 Total ex Djibouti and Somalia 442.21 Source: See Table 7a, except estimate for Somalia GDP, which is based on the CIA World Factbook estimate. The bottom line from Table 7b is that Ethiopia trades substantially less with its immediate neighbors than would normally be expected. Ignoring for the moment the special cases of Djibouti and (the former) Somalia, and excluding Ethiopia’s imports of oil from Sudan, the estimate of the total amount of under-trading in terms of two-way trade in 2008 is about US$ 440 million, with the implied trade level being 4.75 times larger than observed trade25
25 Part of this might, of course be explained by other factors that systematically affect trade costs, such as, for
example, the fact that Swahili is a national language in Uganda and is also a lingua franca in Tanzania and Kenya and elsewhere in the East African Community, but not in Ethiopia. Since English is also widely used as a lingua franca in the business community, it is difficult to know what part of the missing trade might be due to language/cultural factors. The above estimates based solely on size of economies, distance and bilateral tariffs is thus only a rough first indicator of the potential order of magnitude of the “missing trade” which is sufficient for the purposes of this paper, which is to provide broad quantitative parameters for Ethiopia’s trade potential. It
.
CIURIAK: SUPPLY AND DEMAND SIDE CONSTRAINTS AS BARRIERS FOR ETHIOPIAN EXPORTS PAGE 22
As regards the two-way trade with Djibouti, the reported data, which are based on Ethiopian export statistics, clearly overstate the actual amount of two-way trade since the Ethiopian export figures obviously identify exports being trans-shipped through Djibouti as exports to Djibouti. The estimated level may be taken as an approximation of the level of trade that actually takes place between the two jurisdictions. As regards the special case of Somalia, we report the figure obtained from applying our methodology as a matter of interest: given the very low level of economic output due to the political turmoil in this region, the amount of Ethiopian exports (dominated by chat) is surprisingly high. From another perspective, the idea of a “normal” level of trade is incompatible with the low level of economic activity actually registered in this region. Given a restoration of civil order, there would undoubtedly be a sharp rebound in economic activity and with it a restoration of a higher level of two-way trade. Several conclusions may be drawn from the foregoing discussion. First, seen in the perspective of the potential gains from addressing other trade obstacles, repairing regional political relationships, developing border infrastructure and advancing the regional economic cooperation agenda, although immensely important in many other dimensions, is not a “game changer” for Ethiopian trade. Second, by the same token, the low level of Ethiopia’s trade share of GDP cannot be laid at the foot of the political instability in the region. The instability is a contributing factor but not the main cause. Third, trade liberalization in the Tripartite region would generate a considerably greater trade response if the initial levels of trade were brought up to the levels that could be expected given significant progress on that political agenda of restoring regional stability.
2.7 Tariff Barriers Maintained by Ethiopia’s Regional Trading Partners: some “back of the envelope” quantitative assessments
Last but not least, we consider the conventional trade barriers maintained against Ethiopia’s exports by its regional trading partners. Ethiopia is in a position to have these reduced by participating in the Tripartite Free Trade Area (TFTA) which would combine the members of three existing regional economic communities: the Common Market of Eastern and Southern
may noted that Villoria (2008), using a gravity model that included the usual gamut of variables calculated Ethiopia’s “missing” two-way trade with all of Africa at US$ 200 million in 2001, or about 9% of Ethiopia’s global two-way trade.. The above estimate suggests missing trade with immediate neighbours amounted to about 3.4% of Ethiopia’s global two-way trade. Since trade with immediate neighbours tends to be more intensive, this suggests the figures calculated in this paper are not an exaggeration.
TDDP 02/2010 PAGE 23
Africa (COMESA), the East African Community (EAC) and the Southern African Development Community (SADC). The purpose of the TFTA is broader than simply liberalization of goods trade; it would address the movement of persons, joint implementation of infrastructure projects and other forms of co-operation of members. The discussion in the previous section has highlighted the scale of the potential trade gains from deepening regional cooperation; in this section, we consider only the implications of removing the barriers to goods trade. Ethiopia is a member of COMESA, but not of the other two communities, and has not signed onto the COMESA free trade agreement. While there are some trade preferences accorded to Ethiopia-COMESA trade, in general Ethiopia applies and faces significant levels of tariffs in trade with its major African trading partners. Ideally, estimation of the trade and broader economic impacts of a complex policy change such as a free trade agreement would be undertaken using a computable general equilibrium (CGE) model. CGE models are based on a social accounting matrix (SAM) that includes, for each economy represented, the following information: trade between each economy the effective rate of protection facing imports from each bilateral trade partner the main aggregates in the national economic accounts government revenues and expenditures the economy’s input-output table, which describes the inter-industry linkages within the
economy in terms of flows of goods and services, and the contribution made by primary factors of production (labor, capital and land) to each sector.
In recent years, there has been a concerted international effort in the context of the global Trade Analysis Project (GTAP), housed at Purdue University, to develop CGE modeling capability for Africa, including the development of a special African database. The GTAP Africa Data Base includes data for 30 African countries/regions and 9 other aggregated regions; and the 57 sectors of the GTAP 6 Data Base. One advantage of this dataset is that it includes an input output matrix for Ethiopia. A disadvantage given the importance of initial conditions in influencing the outcome of trade models is that it is based on 2001 data, which are quite dated from an Ethiopian trade perspective. For the present purposes we use a conventional partial equilibrium model and rely on sensitivity analysis using a wide range of assumptions about possible responses of trade to tariff reductions, of domestic demand to tariff-cut-induced price declines and of supply-side response to increased trade opportunities afforded by trade liberalization to identify robust conclusions. The main disadvantages of partial equilibrium models in comparison to CGE models when modeling complex economy-wide policy changes are that (a) the partial equilibrium framework does not capture the internal cross-sectoral linkages within an economy; and (b) the resource constraints facing an economy are not explicitly taken into account. The main implications of these issues are for the estimates of real economic output; the overall trade impacts are much less impacted by general equilibrium closure rules, although sectoral trade impacts can be importantly affected

CIURIAK: SUPPLY AND DEMAND SIDE CONSTRAINTS AS BARRIERS FOR ETHIOPIAN EXPORTS PAGE 24
by inter-industry linkages. Since our focus is on overall trade impacts, the use of a partial equilibrium as opposed to a general equilibrium modeling framework is not likely to affect the main conclusions in any major way. The various data and technical issues that must be addressed to provide quantitative assessments of the impact of Ethiopia’s participation in the TFTA process are set out in Appendix 1, along with the detailed results of that modeling exercise. Here we summarize the four main “take-away” points that emerge from this modeling exercise. First, overall, the economic impacts of participation in the TFTA trade liberalization process would be fairly modest for Ethiopia. In the context of policy frameworks and initial conditions induced by those frameworks that are similar to those prevailing in 2009, the quantifiable economic effects would be persistently negative, and Ethiopia would be counting on the non-quantifiable elements in the TFTA process to push the balance of costs and benefits into the black. Second, again from the perspective of the policy framework and initial conditions prevailing in 2009, the readily quantifiable costs of staying out of the TFTA process are very modest. The lack of significant trade diversion effects reflects the low level of African economic integration reflected in the initial conditions. Over time, as and when African integration increases, including Ethiopia, the costs to staying out of a regional agreement would tend to grow. Third, changing the initial conditions by adopting macroeconomic policies to bring merchandise trade, excluding oil, coffee and capital goods, into rough balance would be sufficient to allow Ethiopia to participate in the TFTA process on a win-win basis. Fourth, if suitable progress is made in regional cooperation to raise the base level of trade to the levels of intensity observed amongst Ethiopia’s other neighbors in the region, the trade expansion from liberalization under the TFTA would be close to doubled what would otherwise be the case. In summary, African economic integration would not be a “game changer” for Ethiopian trade, the way reducing trade costs would be. Under the initial conditions prevailing in 2009, there would be limited impacts, positive or negative for Ethiopia. Given policy adjustments to improve the initial conditions, Ethiopia could participate in the TFTA on a win-win basis with its African partners.

TDDP 02/2010 PAGE 25
3 ADDRESSING SUPPLY-SIDE CONSTRAINTS TO ETHIOPIA’S EXPORTS
The foregoing discussion has argued that the major factors constraining Ethiopia’s export and overall trade performance are within Ethiopia, secondarily in its immediate neighborhood and thirdly in its trade relations with its African partners. The quantification of these supply-side constraints, although generally “rough and ready” in nature, has established the great potential for trade expansion, but also the need for a wide variety of complementary policy adjustments, most of them not squarely in the trade policy area. These policy issues and the steps that might be taken by the Ethiopian private sector in its policy dialogue with the public authorities may be enumerated as follows.
3.1 The macroeconomic policy mix In the recent period of rapid economic growth, Ethiopia has combined a highly expansionary domestic interest rate policy with a real appreciation of the birr to contain the resulting inflationary pressures. As noted above, this policy mix tends to induce substitution of capital for labor in production and to substitute imports for domestic production while restraining exports and reducing savings. From Ethiopia’s export perspective, it would be advantageous going forward to adopt the opposite mix: namely, higher interest rates and a lower exchange rate. This mix induces substitution of labor for capital and domestic production for imports, while encouraging exports and domestic savings. Such a shift in macroeconomic policy would contribute to an expansion of the export base, a necessary development if Ethiopia is to be able to engage in broader trade liberalization initiatives such as the Tripartite agreement, with confidence of making economic gains and not suffering a serious further erosion of its external accounts. In terms of specific suggestions, three follow-up initiatives could be considered based on the foregoing: A regular dialogue between Ethiopia’s exporting community and the monetary authorities
concerning the level of the exchange rate and the exchange rate regime more generally. Specific attention by the monetary authorities to the goods trade balance excluding the major
commodities and capital goods as an indicator of whether trade deficits are benign or reflective of excessive consumption and an anti-export bias.
Specific research on the optimal exchange rate management regime given the pattern of Ethiopia’s trade to determine whether alternative regimes could reduce the large real exchange rate fluctuations observed in the past which have deleterious effects on the development of Ethiopia’s export capability.
CIURIAK: SUPPLY AND DEMAND SIDE CONSTRAINTS AS BARRIERS FOR ETHIOPIAN EXPORTS PAGE 26
3.2 Trade costs Without a doubt, the difficulties that Ethiopian firms encounter in trading across borders constitute the single most important reason for the low trade share, and extremely low export share, of GDP observed in Ethiopia. Ethiopia has made progress in improving the environment for business operations but has slid further down in the global rankings in terms of doing business across borders. However, notwithstanding Ethiopia’s current low ranking, with a few bold moves, it could catapult itself into the ranks of leading trading economies in terms of trade costs. In terms of specific suggestions, the following areas deserve follow-up action: Ethiopia is developing its first industrial park near Addis Ababa and ESL, Ethiopia’s main
carrier, is working to develop multi-modal capability. Several hundred kilometers away, a fully modern port capable of berthing post-Panamax freight carriers has started up operations. What is missing is a modern, heavy-duty, high-speed rail link between the two. With such a link, together with internal feeder lines and a carnet-based system of transit, Ethiopia could largely remove the disadvantages of being a landlocked African economy.
The administrative aspects of Ethiopia’s trade regime should be reviewed and re-engineered to levels consistent not just with “best-in-region” but “best-in-world”. Given the importance that trade will have to Ethiopia in the future, there is much sense in leap-frogging intermediate measures and going to first best in this vital area.
3.3 Private Sector Development The reality of the modern, globalized economy is that change is a constant factor. By the same token, constant adaptation is required for a country simply to stay in the same place, let alone get ahead. In the business world, adaptation is facilitated by the renewal of the population of firms through market entry and exit. A static vision of trade examines the scope for existing firms to gain at the margin from improvements in market access. A dynamic vision of trade focuses on the scope for trade to emerge in areas where there is no trade. The empirical evidence suggests that the latter dynamic—trade growth at the extensive margin—is key to sustained trade growth. For developing countries, this is evidenced by the documented trend to diversification of trade and underlying industrial production as countries develop. Ethiopia has made progress in reducing the number of procedures required to start a company, the time it takes to start a company and the minimum capital required. However, given the concentrated market structure, substantially freer market entry may be required to develop the number and diversity of private sector firms that is a prerequisite for trade liberalization to generate the economic gains that theory predicts. In terms of specific suggestions, the following courses of action may be considered:
TDDP 02/2010 PAGE 27
1. Give top priority to ensuring the success of Ethiopia’s first industrial park in Dukem and fast-track plans for more such developments. This is a vital first step in the direction of creating a viable, dynamic industrial culture in Ethiopia.
2. Build on the recent reforms that reduced the cost of establishing new firms; a major expansion in the number of businesses is key to a sustained success in export markets.
3. Facilitate links between these industrial areas and with Ethiopia’s institutes of higher learning, especially its engineering schools.
4. Increase competition in producer services to lower operating costs for industrial firms
3.4 Regional Trade Negotiations The foregoing discussion has argued that, given appropriate complementary macroeconomic and microeconomic policies, Ethiopia would benefit from full participation in the TFTA process. However, it has also been argued that, even in the absence of those policies, the quantifiable costs of participating are minor; given non-quantifiable benefits in terms of improved regional cooperation and increased domestic market competition, these should not stand in the way of Ethiopia participating. Apart from tariff elimination, the most pressing issue for Ethiopia to advance within the TFTA process would be the improvement of transit corridor cooperation, including the implementation of a carnet-based system for goods transiting neighboring countries.
3.5 Towards a Private-Public Partnership on the Trade Agenda The arguments developed above emphasize the dynamic nature of trade—the constant turnover in trading firms and in products being traded. This process has become ever more dynamic as globalization has intensified competition across all sectors. As demonstrated above, new export categories have contributed significantly to Ethiopia’s export growth in the past half-decade. At the same time, the overall pace of this diversification process appears to be relatively muted in Ethiopia, reflecting in our view the slow pace of new firm formation and the high costs of engaging in international trade. The essential feature of a sustainable export strategy for Ethiopia is thus to quicken the pace of introduction of new products into export markets and the pace of new firm formation to expand the population of firms from which export successes will emerge, as well as reducing trade costs. This is the key point, in our view, that the Ethiopian private sector needs to make in its discussions with the government.
CIURIAK: SUPPLY AND DEMAND SIDE CONSTRAINTS AS BARRIERS FOR ETHIOPIAN EXPORTS PAGE 28
Ethiopia has established processes for the trading community to engage policy makers at the ministerial level. While the process could obviously be further articulated26
, the key issue is how best to use the existing processes to help achieve coherence between trade and broader economic policy objectives.
First, a critical substantive aspect of any successful consultative mechanism is that it includes the development of appropriate fact-based analysis to support the discussions. In this regard, the Ethiopian private sector would clearly benefit from a small, dedicated trade policy analysis unit, equipped to provide professional quantitative analysis of Ethiopian trade policy. Second, reflecting the importance of new entrants into export markets to sustained export success, expanding the trade policy dialogue to include firms interested in entering export markets would be a helpful step. Finally, and perhaps most importantly, a wide-ranging dialogue seems required in Ethiopia concerning the implications of deeper integration into the global economy. At present, Ethiopia is isolated by poor infrastructure and the time and process costs of the various administrative procedures that firms must carry out in order to engage in foreign trade. But these barriers can be reduced or removed. And as they are removed, trade (and investment) and the associated global rules-based framework will reach deeper into Ethiopian society. Small differences in national regulatory frameworks (not to mention idiosyncratic features of Ethiopian life such as the unique calendar) then become minor or not-so-minor trade irritants. Given where Ethiopia is going, preparing the ground for this dialogue sooner rather than later would appear to be a wise move.
4 CONCLUDING REMARKS Ethiopia, as seen through the lens of sovereign risk assessments, is a high risk country: a recent Euler Hermes risk rating gave Ethiopia a “D”, the highest risk category27
. Both its macroeconomic situation and its industrial structure are seen as sources of risk. Seen through the perspective of trade balances, it is highly uncompetitive, shielded by high tariffs and dependent on aid inflows to pay its import bill. Seen through the perspective of connectivity, it is isolated in a dangerous region with very poor linkages to the rest of the world.
Yet seen in terms of potential, Ethiopia could transform many of those negatives into positives with a limited number of policy adjustments together with some key infrastructure development and some regional cooperation building. There is evidence of a positive dynamic as regards 26 See, for example, Ciuriak (2005) for a detailed discussion of Canada’s Permanent Consultations Framework
which includes a federal-provincial-territorial mechanism, sectoral advisory groups, an academic advisory panel, and multi-stakeholder consultative meetings and public outreach.
27 Euler Hermes Country Review: Ethiopia, 21 August, 2009.

TDDP 02/2010 PAGE 29
industrial development in the widening range of exported products. The means to quicken that pace is largely in Ethiopia’s own hands – it is a matter of administrative reform. Moreover, the TFTA process offers Ethiopia an opportunity to significantly improve its connectivity to the world. And the appearance that Ethiopia is uncompetitive may be misleading: given a macroeconomic policy mix that is friendly to exports, Ethiopia has good export prospects, with its African trading partners being in the forefront of those new opportunities.
REFERENCES
Access Capital. 2010. The Ethiopia Macroeconomic Handbook 2010.
Access Capital Research. 2009. “Sector Updater—Cement”, May 27, 2009; available at: http://www.accesscapitalsc.com/downloads/Ethiopia_SectorUpdaterCement.pdf.
Acharya, Ram C. 2010. “Canada’s Share of U.S. Product Markets: Dissecting the 1998-2006 Trends,” in Dan Ciuriak (ed.), Trade Policy Research 2010: Exporter Dynamics and Productivity. Ottawa: Foreign Affairs and International Trade Canada: 273-310.
Andrews, David et al. 2005. “Ethiopia: Scaling Up,” Finance and Development 42(3), September; available at: http://www.imf.org/external/pubs/ft/fandd/2005/09/andrews.htm.
Arvis, Jean-François et al. 2010. Connecting to compete 2010: trade logistics in the global economy. Washington, DC: World Bank.
Arvis, Jean-François et al. 2007. Connecting to compete 2007: trade logistics in the global economy. Washington, DC: World Bank.
Arvis, Jean-François et al. 2007a. “The cost of being landlocked: logistics costs and supply chain reliability.” Policy Research Working Paper 4258. World Bank, Washington, DC.
Baldwin, John and Beiling Yan. 2010. “Export Market Dynamics and Plant-level Productivity: Impact of Tariff Reductions and Exchange Rate Cycles,” in Dan Ciuriak (ed.), Trade Policy Research 2010: Exporter Dynamics and Productivity. Ottawa: Foreign Affairs and International Trade Canada: 19-62.
Baldwin, Richard E. and Richard K. Lyons. 1994. “Exchange rate hysteresis? Large versus small policy misalignments,” European Economic Review 38: 1-22.
Chen, Shenjie and Emily Yu. 2010. “Export Dynamics in Canada: Market Diversification in a Changing International Economic Environment,” in Dan Ciuriak (ed.), Trade Policy Research 2010: Exporter Dynamics and Productivity. Ottawa: Foreign Affairs and International Trade Canada: 241-272.
Ciuriak, Dan. 2002. “Japan’s Malaise: A Comment”, paper prepared for the Wilton Park Conference: “Managing the Global Economy: Building Recovery and Equity” 25-27 February 2002; available at http://papers.ssrn.com/sol3/papers.cfm?abstract_id=1546276
Ciuriak, Dan. 2005. “Canadian Trade Policy Development: Stakeholder Consultations and Public Policy Research,” in Dan Ciuriak (ed.), Trade Policy Research 2005. Ottawa: Foreign Affairs and International Trade Canada: 213-246.
Ciuriak, Dan and Shinji Kinjo. 2006. "Trade Specialization in the Gravity Model of International Trade", in Ciuriak, Dan (ed.) Trade Policy Research 2005 (Ottawa: Foreign Affairs and International Trade Canada): 189-198.
DFAT. 2010. Ethiopia: Fact Sheet, http://www.dfat.gov.au/geo/fs/ethi.pdf, accessed 08 August 2010.
Djankov, Simeon, Caroline Freund and Cong S. Pham. 2010. “Trading on Time,” Review of Economics and Statistics 92(1), February: 166-173.
CIURIAK: SUPPLY AND DEMAND SIDE CONSTRAINTS AS BARRIERS FOR ETHIOPIAN EXPORTS PAGE 30
Easterly, William. 2005. "National policies and economic growth: A Reappraisal" in Philippe Aghion and Steven Durlauf (eds.), Handbook of Economic Growth, Elsevier.
Estevadeordal, Antoni and Alan M. Taylor. 2008. “Is the Washington Consensus Dead? Growth, Openness, and the Great Liberalization, 1970s–2000s,” Mimeo, August.
Eurostat. 2009. “Transit Trade And Re-Export: Extrastat in the Context of the Modernized Community Customs Code,” note prepared for the meeting of the Group of Experts on the Impact of Globalisation on National Accounts, Geneva, 11-13 May 2009.
Francois, Joseph and Keith Hall. 2003. “Global simulation analysis of industry-level trade policy”, mimeo, The World Bank.
Frankel, Jeffrey A. 2000. “Assessing the Efficiency Gain from Further Liberalization,” paper delivered at the conference Efficiency, Equity and Legitimacy: The Multilateral Trading System at the Millennium, Harvard University (June 1-2, 2000); available at http://www.hks.harvard.edu/fs/jfrankel/CBG-TradeEffwFig.pdf.
Gertler, Peter. 2009. “High Speed Rail is a Game-changer,” Engineering News Record, 04/27/2009; http://enr.construction.com/opinions/viewpoint/2009/0427-HighSpeedRail.asp.
Helpman, Elhanan et al. 2003. “Export versus FDI,” Harvard Institute of Economic Research Discussion Paper No. 1998; available at http://ssrn.com/abstract=386924 or doi:10.2139/ssrn.386924.
Hertel, Thomas, David Hummels, Maros Ivanic and Roman Keeney. 2003. “How Confident Can We Be in CGE-Based Assessments of Free Trade Agreements?” GTAP Working Paper No. 26.
Hesse, Heike. 2008. “Export Diversification and Economic Growth,” Working Paper No. 21, Commission on Growth and Development, Washington, D.C.: The World Bank.
Hoekman, Bernard. 2009. Regional Cooperation and Trade and Transport Facilitation. Presentation, EIF Focal Points Global Workshop, Geneva July 8, 2009.
Holzner, Mario. 2008. “GSIM Measurement of the Effects of the EU accession of the Balkans and Turkey on Agricultural Trade”, South East European Journal of Economics and Business 3(1), April.
Hospers, Gert-Jan, Pierre Desrochers and Frédéric Sautet. 2009. “The next Silicon Valley? On the relationship between geographical clustering and public policy,” International Entrepreneurship and Management Journal 5(3), September: 285-299.
Hummels, David. 2001. David Hummels. 2001. “Time as a Trade Barrier,” mimeo, Purdue University.
Imbs, Jean and Romain Wacziarg. 2003. “Stages of Diversification.” American Economic Review 93(1): 63–86.
International Monetary Fund. 1998. World Economic Outlook, October.
International Monetary Fund. 2007. Regional Economic Outlook: Western Hemisphere: Chapter on Revenue Growth and the Strength of Underlying Fiscal Positions, November.
International Monetary Fund. 2009. IMF Country Report No. 09/296, September.
International Trade Centre. 2008. “Public - Private Partnership on Integrated Customs Services in Ghana”; available at: http://www.intracen.org/btp/issues/trade_facilitation/publications/ghana_case_study.pdf.
Lileeva, Alla and Johannes Van Biesebroeck. 2010. “The Impact of Trade and Technology Adoption on Production Flexibility in Canadian Manufacturing,” in Dan Ciuriak (ed.), Trade Policy Research 2010: Exporter Dynamics and Productivity. Ottawa: Foreign Affairs and International Trade Canada: 63-94.
Marshall, Alfred. 1879. “The Pure Theory of Domestic Value: The Pure Theory of Foreign Trade,” published for private circulation by Professor Henry Sidgwick.
Mayda, Anna Maria and Chad Steinberg. 2006. “Do South-South Trade Agreements Increase Trade? Commodity-Level Evidence from COMESA,” Occasional Paper O-2006/19 United Nations University Comparative Regional Integration Studies.
TDDP 02/2010 PAGE 31
Melitz, Marc J. 2003. “The Impact of Trade on Intra-Industry Reallocations and Aggregate Industry Productivity,” Econometrica 71(6): 1695-1725.
National Bank of Ethiopia. 2008. Annual Report 2007-08: Chapter IV – Developments in the External Sector.
Rodríguez, Francisco. 2007. “Openness and Growth: What Have We Learned?” DESA Working Paper No. 51, United Nations, Department of Economic and Social Affairs.
Shelley, David M. 2009. Final Report: To Improve And Update The Study On The Management Of Commercial Road Transport In Ethiopia – Volume I, Private Sector Development Hub, Addis Ababa Chamber of Commerce & Sectoral Associations.
Sölvell, Örjan, Göran Lindqvist and Christian Ketels. 2003. The Cluster Initiative Greenbook. Stockholm: Ivory Tower; available at: www.cluster-research.org.
Villoria, Nelson. 2008. “Estimation of Missing Intra-African Trade,” Paper submitted to the Eleventh Annual Conference on Global Economic Analysis. Helsinki, Finland, June 12-14, 2008.
Wagner, Joachim. 2007. “Exports and productivity: a survey of the evidence from firm-level data,” The World Economy 60(1): 60-82.
Yu, Wusheng. 2009. “Schemes for aggregating preferential tariffs in agriculture, export volume effects, and African LDCs,” Food Economics - Acta Agriculturae Scandinavica, Section C. 6(1): 56-71.
CIURIAK: SUPPLY AND DEMAND SIDE CONSTRAINTS AS BARRIERS FOR ETHIOPIAN EXPORTS PAGE 32
APPENDIX 1: EAST AND SOUTH AFRICAN REGIONAL TRADE LIBERALIZATION Evaluating trade constraints requires examination of trade flows in quantitative terms, both in terms of commodity composition and destination of exports. Examination of regional trade policy options requires consideration not only of bilateral trade between the target country, in this case Ethiopia and its partners, but also trade amongst the partners which might give rise to trade diversion depending on participation in free trade agreements. This appendix reports the results of simulation of trade liberalization in the context of the Tripartite agreement using a partial equilibrium modeling framework. General issues and caveats Consistent with general practice in empirical trade analysis, this study relies on import statistics to quantify trade flows in the east and south Africa region. Thus, for example, Ethiopia’s exports to Kenya are measured using Kenyan import statistics rather than Ethiopia’s export statistics. This approach is based on a number of considerations. First, by using import statistics for all flows, the valuation of trade flows is on the same basis: imports are valued including the cost of freight and insurance (c.i.f.) whereas exports are valued without these added costs of trade (f.o.b.). Based on worldwide averages, import flows tend to be valued about 10 percent higher than corresponding export flows28. Second, statistics for goods imports are generally considered by statistical agencies to be of higher quality than export statistics because imported goods are subject to duties; supporting import documentation thus receives more attention from customs and border agencies than does export documentation, since exports typically are not subject to taxes. Comparison of one country’s export statistics and a partner country’s import statistics (“mirror statistics”) often show significant discrepancies in terms of size of flows and commodity classification. With regard to tariff classification, the import statistics are likely to be more accurate since they reflect the tariff line under which the articles actually crossed the border. Discrepancies in mirror statistics in terms of scale of trade meanwhile can be due to transshipment; for example, exports may be declared in export documents to the first country of export, whereas the border agencies in the latter country distinguish whether the goods are destined for consumption in that country (and hence are subject to tariffs) or are destined for third countries29
28 Ten percent is the adjustment used by the International Monetary Fund in its Direction of Trade Statistics for
estimating the value of imports of a country for which data are missing, based on the export statistics of its trading partners. See, the introductory documentation, under “Consistency of Partner Country Data”, International Monetary Fund, Direction of Trade Statistics, various issues.
. Accordingly, there is a general presumption that both the commodity
29 Alternatively, the exporting country may accurately identify the final country of destination in its export statistics but the country of final import may classify the goods as coming from an intermediate transhipment point. This latter issue is of particular significance in Europe where inland countries classify overseas imports as coming from, for example, the Netherlands, the first port of entry for these goods in the European Union. Among statisticians, this issue is called the “Rotterdam effect”. See, for example, Eurostat (2009).
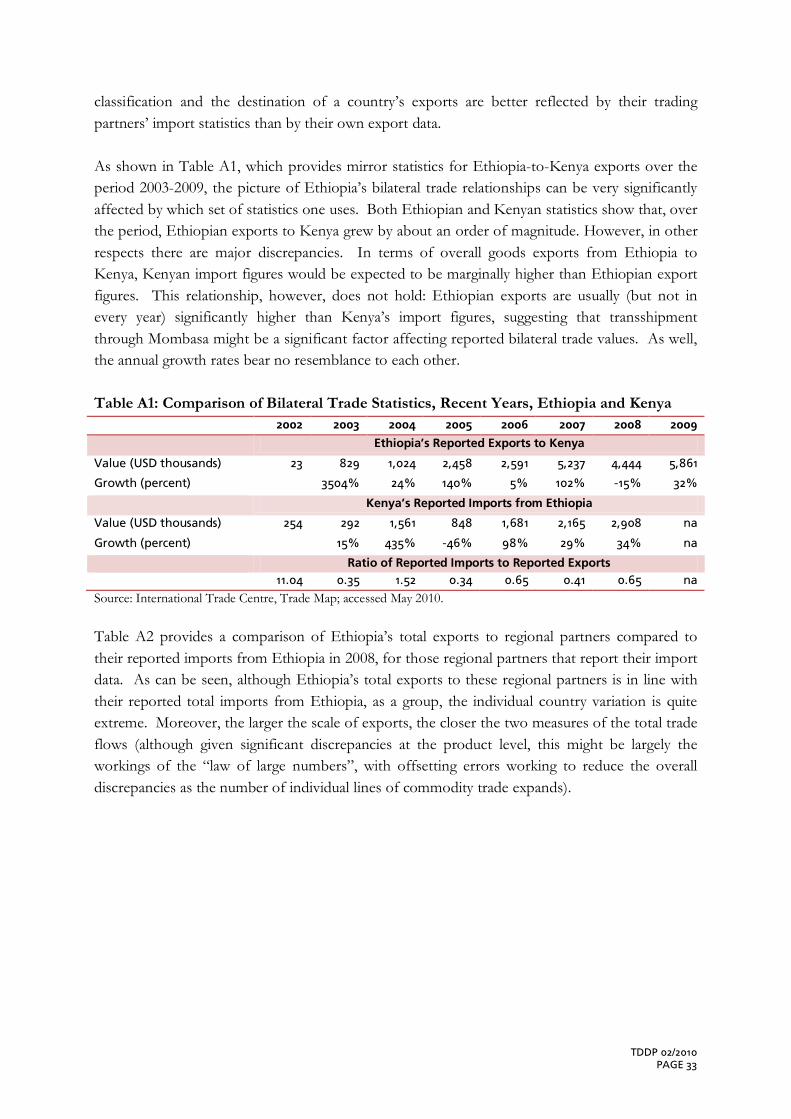
TDDP 02/2010 PAGE 33
classification and the destination of a country’s exports are better reflected by their trading partners’ import statistics than by their own export data. As shown in Table A1, which provides mirror statistics for Ethiopia-to-Kenya exports over the period 2003-2009, the picture of Ethiopia’s bilateral trade relationships can be very significantly affected by which set of statistics one uses. Both Ethiopian and Kenyan statistics show that, over the period, Ethiopian exports to Kenya grew by about an order of magnitude. However, in other respects there are major discrepancies. In terms of overall goods exports from Ethiopia to Kenya, Kenyan import figures would be expected to be marginally higher than Ethiopian export figures. This relationship, however, does not hold: Ethiopian exports are usually (but not in every year) significantly higher than Kenya’s import figures, suggesting that transshipment through Mombasa might be a significant factor affecting reported bilateral trade values. As well, the annual growth rates bear no resemblance to each other. Table A1: Comparison of Bilateral Trade Statistics, Recent Years, Ethiopia and Kenya 2002 2003 2004 2005 2006 2007 2008 2009
Ethiopia’s Reported Exports to Kenya
Value (USD thousands) 23 829 1,024 2,458 2,591 5,237 4,444 5,861
Growth (percent) 3504% 24% 140% 5% 102% -15% 32%
Kenya’s Reported Imports from Ethiopia
Value (USD thousands) 254 292 1,561 848 1,681 2,165 2,908 na
Growth (percent) 15% 435% -46% 98% 29% 34% na
Ratio of Reported Imports to Reported Exports 11.04 0.35 1.52 0.34 0.65 0.41 0.65 na Source: International Trade Centre, Trade Map; accessed May 2010. Table A2 provides a comparison of Ethiopia’s total exports to regional partners compared to their reported imports from Ethiopia in 2008, for those regional partners that report their import data. As can be seen, although Ethiopia’s total exports to these regional partners is in line with their reported total imports from Ethiopia, as a group, the individual country variation is quite extreme. Moreover, the larger the scale of exports, the closer the two measures of the total trade flows (although given significant discrepancies at the product level, this might be largely the workings of the “law of large numbers”, with offsetting errors working to reduce the overall discrepancies as the number of individual lines of commodity trade expands).

CIURIAK: SUPPLY AND DEMAND SIDE CONSTRAINTS AS BARRIERS FOR ETHIOPIAN EXPORTS PAGE 34
Table A2: Comparison of Ethiopia’s reported exports to regional partners and their reported imports from Ethiopia, all commodities, 2008, US dollars. Ethiopia's Exports Partner Country Imports Import/Export Ratio
Botswana 10,893 21,687 1.99 Burundi 38,225 50,478 1.32 Egypt 13,073,583 12,135,020 0.93 Kenya 4,444,218 2,908,156 0.65 Madagascar 280,530 52,774 0.19 Malawi 22,357 11,866 0.53 Mauritius 198,571 720,868 3.63 Mozambique 30,822 0 0.00 Namibia 38,916 130,334 3.35 Rwanda 83,197 1,177,537 14.15 Seychelles 4,279 3,220 0.75 South Africa 5,865,774 5,214,353 0.89 Sudan 74,095,142 75,032,228 1.01 Tanzania 337,369 27,449 0.08 Uganda 600,575 1,041,678 1.73 Zambia 210,525 209,959 1.00 Zimbabwe 65,247 38,459 0.59
Total 99,400,223 98,776,066 0.99 Source: UN Comtrade. There are similar issues of significant discrepancies in mirror statistics at the product level both as regards the level and growth of trade. Some of these discrepancies are likely the result of tariff classification differences between the importing and exporting jurisdictions. For example, consider Ethiopian exports of vegetable products to Kenya in 2007 and 2008. Table A3 shows reported data for HS code 7, which reports edible vegetables and roots, and HS 14, which reports miscellaneous vegetable products. The Kenyan import data show a modest decline in HS 7 imports from Ethiopia between 2007 and 2008, where Ethiopia shows a sharp increase from zero exports in 2007 to US$ 1.686 million. At the same time, Ethiopia’s exports under HS 14 fall of steeply between 2007 and 2008. Table A3: Comparing commodity-level trade flows in mirror statistics: Ethiopian exports of vegetables and tubers to Kenya, USD thousands. HS Product Description Kenya Imports Ethiopia Exports 2007 2008 2007 2008 2009
7 Edible vegetables and certain roots and tubers 1,517 1,497 0 1,686 5,005 14 Vegetable plaiting materials, vegetable products nes 0 0 3,611 605 0
Source: International Trade Centre, Trade Map; accessed May 2010. It seems plausible to conclude that, in 2007, products classified by Ethiopia as “vegetable products not otherwise specified” and thus falling under the Harmonized System (HS) code 14 in its export data were classified by Kenya more accurately as “Edible vegetables and certain roots and tubers” and thus falling under HS 7, in the latter country’s import data. By the same token, the growth registered in the Ethiopian export statistics under HS 7 between 2007 and 2008 was likely an inaccurate portrayal of actual trade in this product category, as Kenya’s figures show a small decline. Given these considerations, there are obvious cautions to be drawn about the
TDDP 02/2010 PAGE 35
interpretation of the apparent further steep growth in Ethiopia’s exports under HS 7 to Kenya in 2009 (for which mirror data from Kenya were not available as of this writing). Was there genuine growth in exports to the Kenyan fresh food market or was the statistical surge in this category a combination of shifting trade classifications combined possibly with transshipment of these products through Kenya to third markets? Absent specific knowledge of that market, the statistical evidence alone leaves the question open. That being said, both sets of data provide a broadly similar overall picture of Ethiopia’s exports to Kenya, with vegetables, pharmaceutical products, cotton, coffee and some manufactured goods constituting the most import export categories – although Ethiopia’s statistics indicate the most important manufactured goods are automobiles (HS87) while Kenya’s suggest they are aircraft parts (HS88). Accordingly, with sufficient caution, it is possible to draw lessons from the data. These types of issues are of practical importance for trade and economic analysis throughout the region. For example, the transshipment issue is particularly problematic in the case of Djibouti. Djibouti’s reported imports from the world are twice the size of its GDP. Its reported exports are one-fifth the size of its GDP. Moreover, its reported exports of live animals in 2007 of US138 million is greater than plausible estimates of its total domestic agricultural sector shipments (based on World Bank estimates of its agricultural sector share of GDP and IMF/World Bank estimates of its GDP). In short, both the level and the commodity composition of its reported trade bear little resemblance to that portion of its trade that is driven by domestic consumption and production and that is accordingly likely to be impacted by trade liberalization or facilitation. A third general observation concerning the trade data in east and south Africa is that most trade flows between most partners are small and inconsistent from year to year. The appearance is one of opportunistic trade, where occasional sales are made but consistent supply relationships cannot be sustained. This is an important qualitative feature of trade in the African context. Absent consistent supply relationships, the gains from trade are likely to be limited to static welfare gains from simple exchange, without the more significant gains associated with economies of scale, induced investment in internationally competitive technology, and knowledge spillovers from participation in export markets that drive firm-level productivity. Description of data and assumptions used for the trade simulations The Model The specific partial equilibrium model we use is the global simulation model (GSIM) developed by Francois and Hall, that is available in spreadsheet form and that is incorporated in the UN WITS/TRAINS trade analysis package30
30 For an example of the application of GSIM to a similar issue, see Mario Holzner (2008).
. GSIM is based on the Armington framework. Under
CIURIAK: SUPPLY AND DEMAND SIDE CONSTRAINTS AS BARRIERS FOR ETHIOPIAN EXPORTS PAGE 36
this framework, products are differentiated by country of origin. They are imperfect substitutes, with the degree of substitutability represented by the elasticity of substitution. This model allows the simultaneous evaluation of the impact on export and import flows amongst the TFTA partners as well as with third parties from reduction of trade costs within the region; accordingly, it allows the estimation of the implications for Ethiopia of joining the TFTA but also the costs of not joining, if the other participants do indeed follow through. The model results are driven by the assumptions about supply and demand elasticities which describe the response of production and demand in each economy to changes in price caused by the policy change, together with estimates of the elasticity of substitution. Model outputs include conventional estimates of economic production and the components of economic welfare, namely producer surplus, consumer surplus and tariff revenues. Importantly, the model allows representation of domestic production capacity in the form of domestic shipments for own use in each economy. This allows estimation of the impact of trade liberalization on production-linked and domestic-consumption-linked tax revenues, an important consideration for a jurisdiction like Ethiopia that is heavily dependent on border tax revenues. A full description of the model is available in Francois and Hall (2003). Trade and Trade Protection Data The data assembled for this study are derived primarily from the International Trade Centre (ITC) Trade Map. Where possible, import data are used to represent the level and commodity composition of trade. For a number of countries that are part of the east and south African region, import data are not available; in some cases, the ITC fills the gap using partner country export data. Typically, this is done without adjustment for valuation basis (c.i.f. vs. f.o.b.). In some cases, more up to date data are available from UN Comtrade; these are drawn on to supplement the ITC Trade Map data, including the use of partner export data to represent trade flows where the relevant import data are missing. Accordingly, the overall trade matrix for east and south African region is as complete as is possible. While some trade data are available for 2009, the most recent year for which relatively complete data are available is 2008. A particular complicating factor for assessing the impact of trade liberalization on Ethiopia is the rapidly changing context. Trade is growing rapidly and the underlying economic policy setting, particularly exchange rate conditions, is shifting. The last year for which reasonably complete data on an import-import basis are available for the region is 2008. However, trade statistics are available from Ethiopia for 2009. As these are more current, we use those for the simulations, with 2008 import-import data representing the pattern of trade in the other TFTA partners. From a practical perspective, there are likely to be only minor differences in the results compared to using fully updated 2009 data throughout the region. Given the basic arithmetic of partial equilibrium trade models, the results are dictated by the initial levels of trade, the height of initial trade barriers and the trade elasticities. Ethiopia had a significant trade deficit with its prospective TFTA partners in both 2008 and 2009 so the initial conditions are little different, whichever year’s data are used.
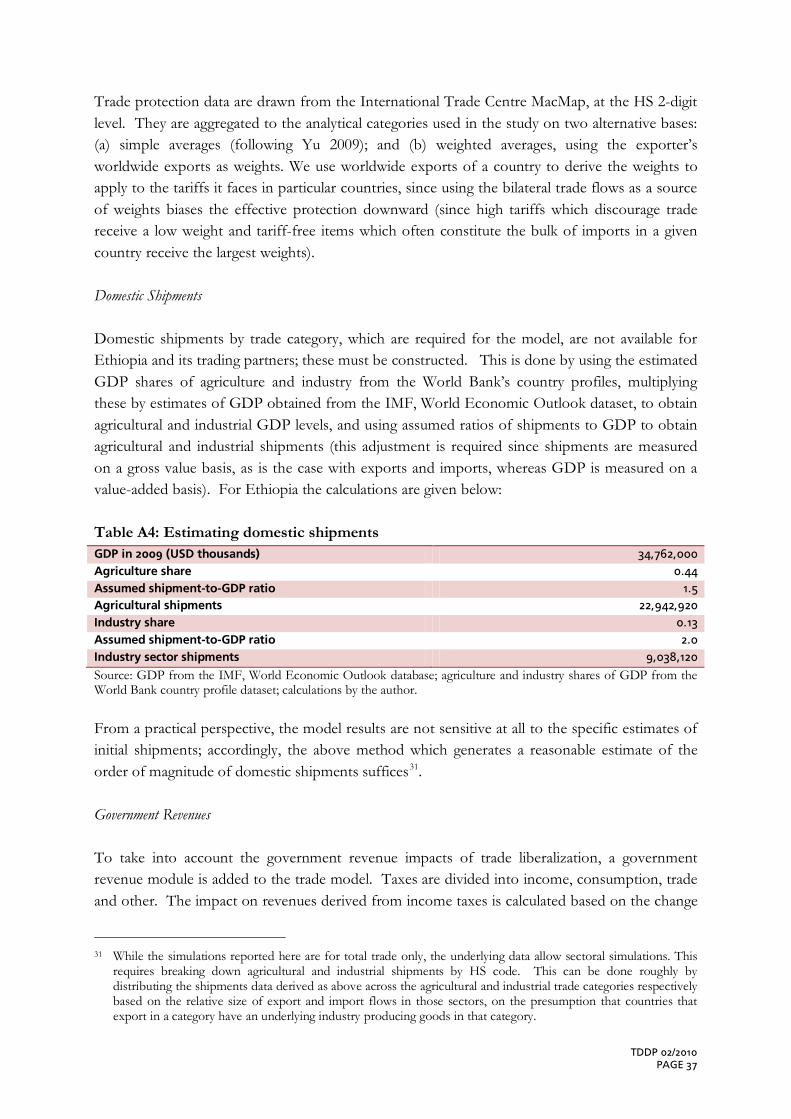
TDDP 02/2010 PAGE 37
Trade protection data are drawn from the International Trade Centre MacMap, at the HS 2-digit level. They are aggregated to the analytical categories used in the study on two alternative bases: (a) simple averages (following Yu 2009); and (b) weighted averages, using the exporter’s worldwide exports as weights. We use worldwide exports of a country to derive the weights to apply to the tariffs it faces in particular countries, since using the bilateral trade flows as a source of weights biases the effective protection downward (since high tariffs which discourage trade receive a low weight and tariff-free items which often constitute the bulk of imports in a given country receive the largest weights). Domestic Shipments Domestic shipments by trade category, which are required for the model, are not available for Ethiopia and its trading partners; these must be constructed. This is done by using the estimated GDP shares of agriculture and industry from the World Bank’s country profiles, multiplying these by estimates of GDP obtained from the IMF, World Economic Outlook dataset, to obtain agricultural and industrial GDP levels, and using assumed ratios of shipments to GDP to obtain agricultural and industrial shipments (this adjustment is required since shipments are measured on a gross value basis, as is the case with exports and imports, whereas GDP is measured on a value-added basis). For Ethiopia the calculations are given below: Table A4: Estimating domestic shipments GDP in 2009 (USD thousands) 34,762,000 Agriculture share 0.44 Assumed shipment-to-GDP ratio 1.5 Agricultural shipments 22,942,920 Industry share 0.13 Assumed shipment-to-GDP ratio 2.0 Industry sector shipments 9,038,120 Source: GDP from the IMF, World Economic Outlook database; agriculture and industry shares of GDP from the World Bank country profile dataset; calculations by the author. From a practical perspective, the model results are not sensitive at all to the specific estimates of initial shipments; accordingly, the above method which generates a reasonable estimate of the order of magnitude of domestic shipments suffices31
.
Government Revenues To take into account the government revenue impacts of trade liberalization, a government revenue module is added to the trade model. Taxes are divided into income, consumption, trade and other. The impact on revenues derived from income taxes is calculated based on the change
31 While the simulations reported here are for total trade only, the underlying data allow sectoral simulations. This
requires breaking down agricultural and industrial shipments by HS code. This can be done roughly by distributing the shipments data derived as above across the agricultural and industrial trade categories respectively based on the relative size of export and import flows in those sectors, on the presumption that countries that export in a category have an underlying industry producing goods in that category.
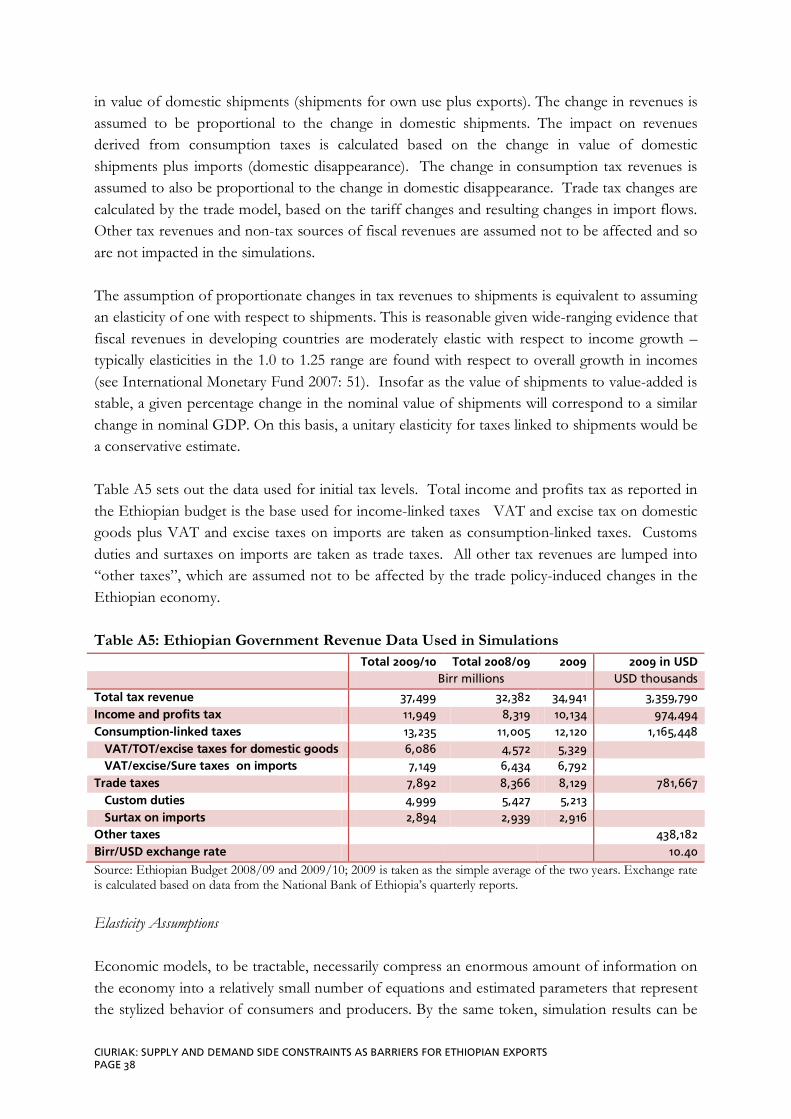
CIURIAK: SUPPLY AND DEMAND SIDE CONSTRAINTS AS BARRIERS FOR ETHIOPIAN EXPORTS PAGE 38
in value of domestic shipments (shipments for own use plus exports). The change in revenues is assumed to be proportional to the change in domestic shipments. The impact on revenues derived from consumption taxes is calculated based on the change in value of domestic shipments plus imports (domestic disappearance). The change in consumption tax revenues is assumed to also be proportional to the change in domestic disappearance. Trade tax changes are calculated by the trade model, based on the tariff changes and resulting changes in import flows. Other tax revenues and non-tax sources of fiscal revenues are assumed not to be affected and so are not impacted in the simulations. The assumption of proportionate changes in tax revenues to shipments is equivalent to assuming an elasticity of one with respect to shipments. This is reasonable given wide-ranging evidence that fiscal revenues in developing countries are moderately elastic with respect to income growth – typically elasticities in the 1.0 to 1.25 range are found with respect to overall growth in incomes (see International Monetary Fund 2007: 51). Insofar as the value of shipments to value-added is stable, a given percentage change in the nominal value of shipments will correspond to a similar change in nominal GDP. On this basis, a unitary elasticity for taxes linked to shipments would be a conservative estimate. Table A5 sets out the data used for initial tax levels. Total income and profits tax as reported in the Ethiopian budget is the base used for income-linked taxes VAT and excise tax on domestic goods plus VAT and excise taxes on imports are taken as consumption-linked taxes. Customs duties and surtaxes on imports are taken as trade taxes. All other tax revenues are lumped into “other taxes”, which are assumed not to be affected by the trade policy-induced changes in the Ethiopian economy. Table A5: Ethiopian Government Revenue Data Used in Simulations Total 2009/10 Total 2008/09 2009 2009 in USD Birr millions USD thousands
Total tax revenue 37,499 32,382 34,941 3,359,790 Income and profits tax 11,949 8,319 10,134 974,494 Consumption-linked taxes 13,235 11,005 12,120 1,165,448 VAT/TOT/excise taxes for domestic goods 6,086 4,572 5,329 VAT/excise/Sure taxes on imports 7,149 6,434 6,792 Trade taxes 7,892 8,366 8,129 781,667 Custom duties 4,999 5,427 5,213 Surtax on imports 2,894 2,939 2,916 Other taxes 438,182 Birr/USD exchange rate 10.40 Source: Ethiopian Budget 2008/09 and 2009/10; 2009 is taken as the simple average of the two years. Exchange rate is calculated based on data from the National Bank of Ethiopia’s quarterly reports. Elasticity Assumptions Economic models, to be tractable, necessarily compress an enormous amount of information on the economy into a relatively small number of equations and estimated parameters that represent the stylized behavior of consumers and producers. By the same token, simulation results can be
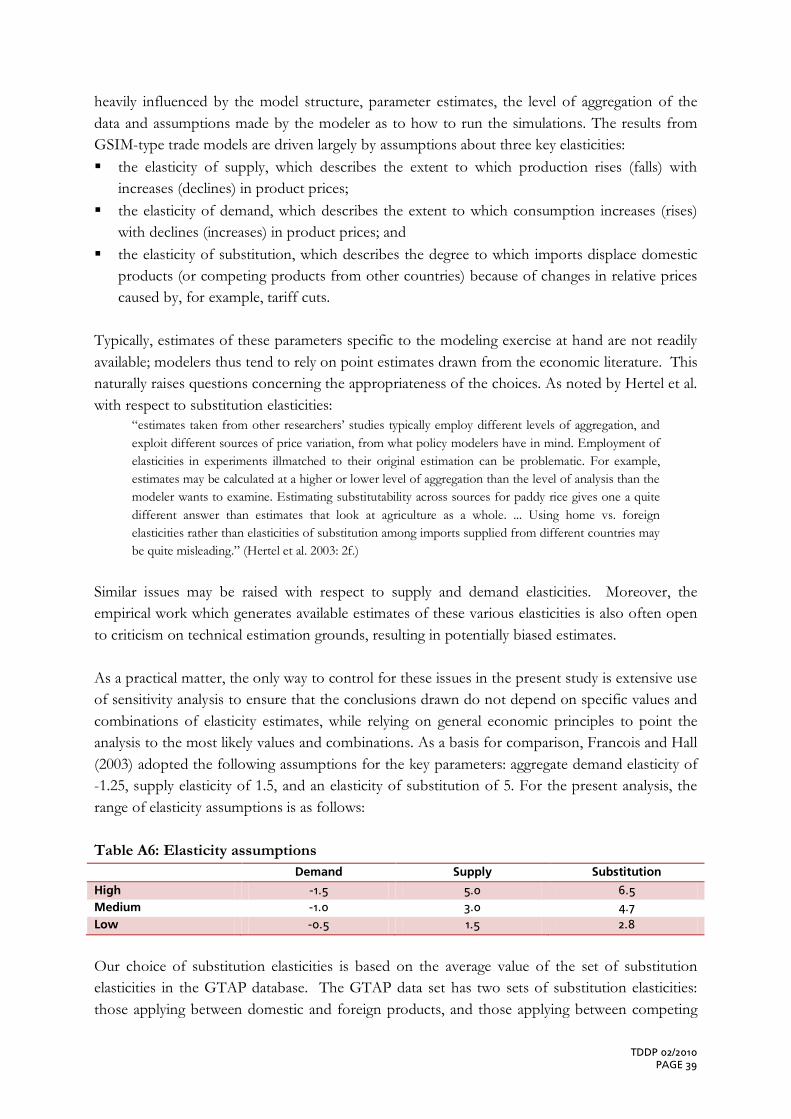
TDDP 02/2010 PAGE 39
heavily influenced by the model structure, parameter estimates, the level of aggregation of the data and assumptions made by the modeler as to how to run the simulations. The results from GSIM-type trade models are driven largely by assumptions about three key elasticities: the elasticity of supply, which describes the extent to which production rises (falls) with
increases (declines) in product prices; the elasticity of demand, which describes the extent to which consumption increases (rises)
with declines (increases) in product prices; and the elasticity of substitution, which describes the degree to which imports displace domestic
products (or competing products from other countries) because of changes in relative prices caused by, for example, tariff cuts.
Typically, estimates of these parameters specific to the modeling exercise at hand are not readily available; modelers thus tend to rely on point estimates drawn from the economic literature. This naturally raises questions concerning the appropriateness of the choices. As noted by Hertel et al. with respect to substitution elasticities:
“estimates taken from other researchers’ studies typically employ different levels of aggregation, and exploit different sources of price variation, from what policy modelers have in mind. Employment of elasticities in experiments illmatched to their original estimation can be problematic. For example, estimates may be calculated at a higher or lower level of aggregation than the level of analysis than the modeler wants to examine. Estimating substitutability across sources for paddy rice gives one a quite different answer than estimates that look at agriculture as a whole. ... Using home vs. foreign elasticities rather than elasticities of substitution among imports supplied from different countries may be quite misleading.” (Hertel et al. 2003: 2f.)
Similar issues may be raised with respect to supply and demand elasticities. Moreover, the empirical work which generates available estimates of these various elasticities is also often open to criticism on technical estimation grounds, resulting in potentially biased estimates. As a practical matter, the only way to control for these issues in the present study is extensive use of sensitivity analysis to ensure that the conclusions drawn do not depend on specific values and combinations of elasticity estimates, while relying on general economic principles to point the analysis to the most likely values and combinations. As a basis for comparison, Francois and Hall (2003) adopted the following assumptions for the key parameters: aggregate demand elasticity of -1.25, supply elasticity of 1.5, and an elasticity of substitution of 5. For the present analysis, the range of elasticity assumptions is as follows: Table A6: Elasticity assumptions Demand Supply Substitution
High -1.5 5.0 6.5 Medium -1.0 3.0 4.7 Low -0.5 1.5 2.8
Our choice of substitution elasticities is based on the average value of the set of substitution elasticities in the GTAP database. The GTAP data set has two sets of substitution elasticities: those applying between domestic and foreign products, and those applying between competing
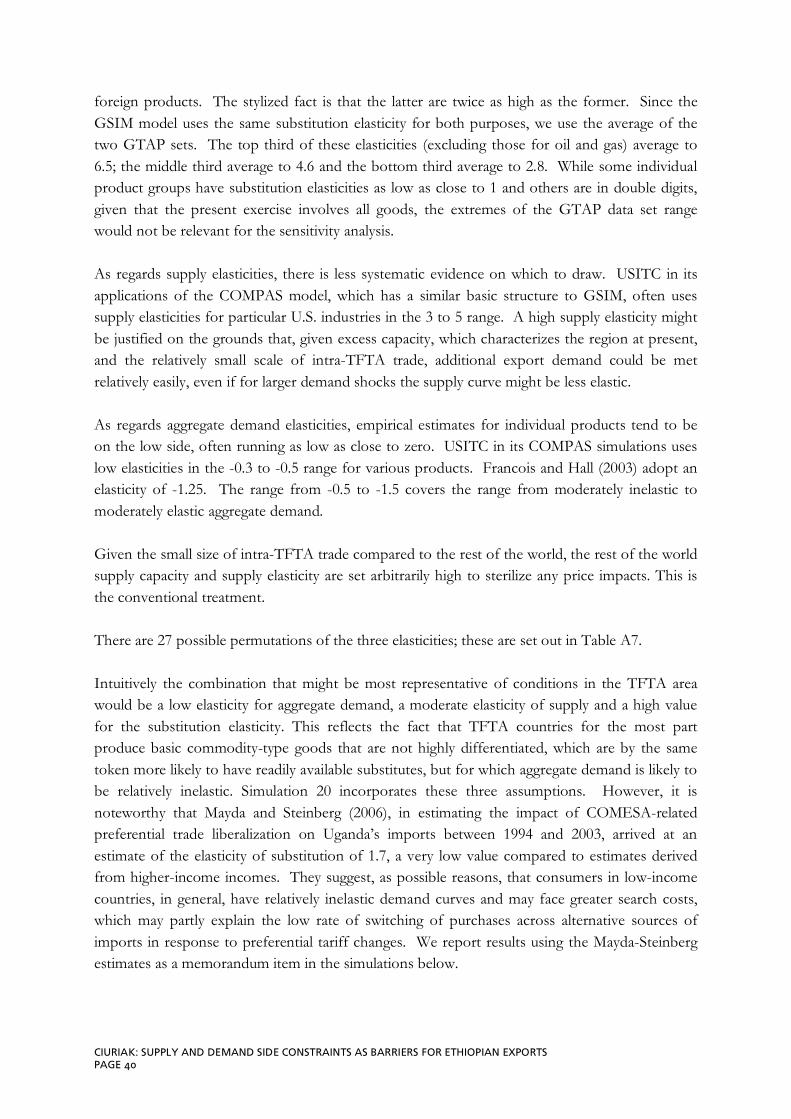
CIURIAK: SUPPLY AND DEMAND SIDE CONSTRAINTS AS BARRIERS FOR ETHIOPIAN EXPORTS PAGE 40
foreign products. The stylized fact is that the latter are twice as high as the former. Since the GSIM model uses the same substitution elasticity for both purposes, we use the average of the two GTAP sets. The top third of these elasticities (excluding those for oil and gas) average to 6.5; the middle third average to 4.6 and the bottom third average to 2.8. While some individual product groups have substitution elasticities as low as close to 1 and others are in double digits, given that the present exercise involves all goods, the extremes of the GTAP data set range would not be relevant for the sensitivity analysis. As regards supply elasticities, there is less systematic evidence on which to draw. USITC in its applications of the COMPAS model, which has a similar basic structure to GSIM, often uses supply elasticities for particular U.S. industries in the 3 to 5 range. A high supply elasticity might be justified on the grounds that, given excess capacity, which characterizes the region at present, and the relatively small scale of intra-TFTA trade, additional export demand could be met relatively easily, even if for larger demand shocks the supply curve might be less elastic. As regards aggregate demand elasticities, empirical estimates for individual products tend to be on the low side, often running as low as close to zero. USITC in its COMPAS simulations uses low elasticities in the -0.3 to -0.5 range for various products. Francois and Hall (2003) adopt an elasticity of -1.25. The range from -0.5 to -1.5 covers the range from moderately inelastic to moderately elastic aggregate demand. Given the small size of intra-TFTA trade compared to the rest of the world, the rest of the world supply capacity and supply elasticity are set arbitrarily high to sterilize any price impacts. This is the conventional treatment. There are 27 possible permutations of the three elasticities; these are set out in Table A7. Intuitively the combination that might be most representative of conditions in the TFTA area would be a low elasticity for aggregate demand, a moderate elasticity of supply and a high value for the substitution elasticity. This reflects the fact that TFTA countries for the most part produce basic commodity-type goods that are not highly differentiated, which are by the same token more likely to have readily available substitutes, but for which aggregate demand is likely to be relatively inelastic. Simulation 20 incorporates these three assumptions. However, it is noteworthy that Mayda and Steinberg (2006), in estimating the impact of COMESA-related preferential trade liberalization on Uganda’s imports between 1994 and 2003, arrived at an estimate of the elasticity of substitution of 1.7, a very low value compared to estimates derived from higher-income incomes. They suggest, as possible reasons, that consumers in low-income countries, in general, have relatively inelastic demand curves and may face greater search costs, which may partly explain the low rate of switching of purchases across alternative sources of imports in response to preferential tariff changes. We report results using the Mayda-Steinberg estimates as a memorandum item in the simulations below.

TDDP 02/2010 PAGE 41
Table A7: Elasticity combinations for sensitivity analysis Simulation Aggregate Demand Supply Substitution
1 -1 3 4.7 2 -0.5 3 4.7 3 -1.5 3 4.7 4 -1 1 4.7 5 -1 5 4.7 6 -0.5 1 4.7 7 -0.5 5 4.7 8 -1.5 1 4.7 9 -1.5 5 4.7 10 -1 3 2.8 11 -0.5 3 2.8 12 -1.5 3 2.8 13 -1 1 2.8 14 -1 5 2.8 15 -0.5 1 2.8 16 -0.5 5 2.8 17 -1.5 1 2.8 18 -1.5 5 2.8 19 -1 3 6.5 20 -0.5 3 6.5 21 -1.5 3 6.5 22 -1 1 6.5 23 -1 5 6.5 24 -0.5 1 6.5 25 -0.5 5 6.5 26 -1.5 1 6.5 27 -1.5 5 6.5
The results Given the crude nature of the data, and given the limitation of the modeling framework, the most that can be hoped from quantitative simulations is put some broad quantitative parameters around the possible range of trade responses and resulting economic impacts. The first round of simulations uses simple averages of tariffs across the 97 HS codes applied to total trade in those categories. All intra-TFTA tariffs are taken down to zero to simulate the effect of full free trade within the group. Table A8 shows the initial balance of trade for Ethiopia within the region and the simple average of tariffs that it faces and that it applies. The basic point is that Ethiopia has a large trade deficit with the region notwithstanding the fact that it applies on average substantially higher tariffs. Table A8: Initial Conditions, 2009 Exports Imports Balance Initial level of exports (USD thousands) 211,374 407,379 -196,005 Simple Average of Tariffs facing Ethiopia’s exports and imports 9.54% 16.79% Source: Calculations by the author based on UN Comtrade trade data and International Trade Centre tariff data.
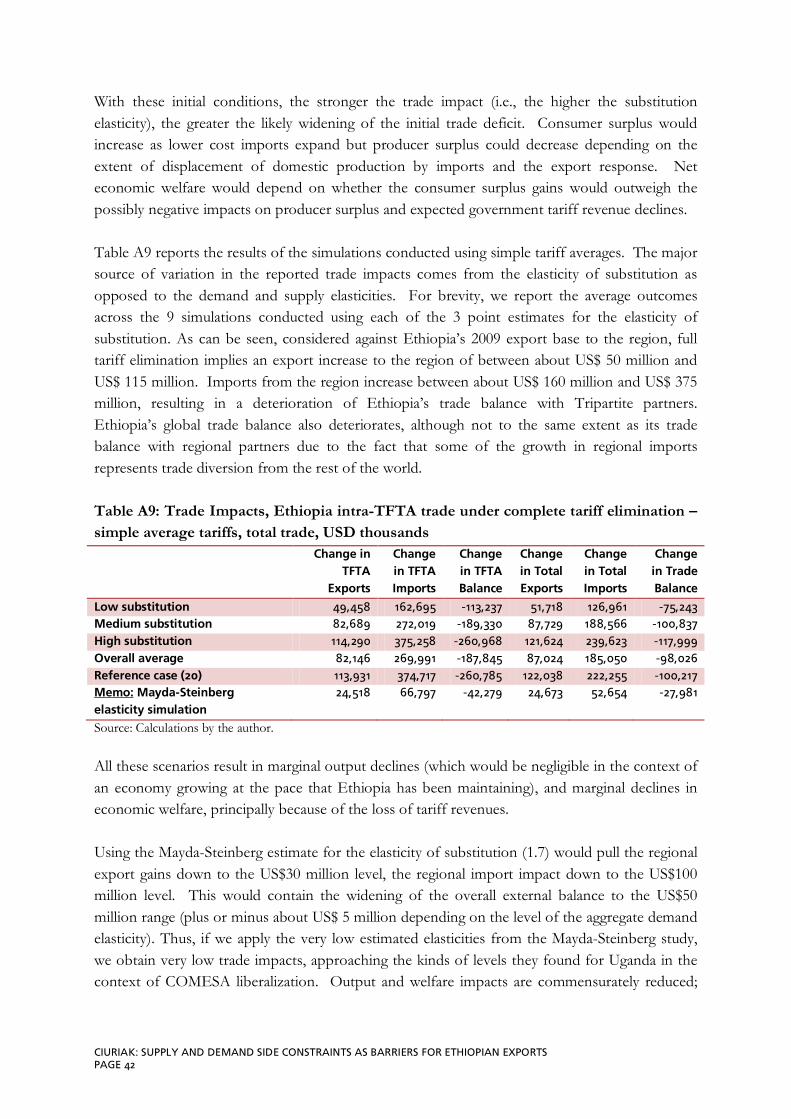
CIURIAK: SUPPLY AND DEMAND SIDE CONSTRAINTS AS BARRIERS FOR ETHIOPIAN EXPORTS PAGE 42
With these initial conditions, the stronger the trade impact (i.e., the higher the substitution elasticity), the greater the likely widening of the initial trade deficit. Consumer surplus would increase as lower cost imports expand but producer surplus could decrease depending on the extent of displacement of domestic production by imports and the export response. Net economic welfare would depend on whether the consumer surplus gains would outweigh the possibly negative impacts on producer surplus and expected government tariff revenue declines. Table A9 reports the results of the simulations conducted using simple tariff averages. The major source of variation in the reported trade impacts comes from the elasticity of substitution as opposed to the demand and supply elasticities. For brevity, we report the average outcomes across the 9 simulations conducted using each of the 3 point estimates for the elasticity of substitution. As can be seen, considered against Ethiopia’s 2009 export base to the region, full tariff elimination implies an export increase to the region of between about US$ 50 million and US$ 115 million. Imports from the region increase between about US$ 160 million and US$ 375 million, resulting in a deterioration of Ethiopia’s trade balance with Tripartite partners. Ethiopia’s global trade balance also deteriorates, although not to the same extent as its trade balance with regional partners due to the fact that some of the growth in regional imports represents trade diversion from the rest of the world. Table A9: Trade Impacts, Ethiopia intra-TFTA trade under complete tariff elimination – simple average tariffs, total trade, USD thousands
Change in TFTA
Exports
Change in TFTA Imports
Change in TFTA Balance
Change in Total Exports
Change in Total Imports
Change in Trade Balance
Low substitution 49,458 162,695 -113,237 51,718 126,961 -75,243 Medium substitution 82,689 272,019 -189,330 87,729 188,566 -100,837 High substitution 114,290 375,258 -260,968 121,624 239,623 -117,999 Overall average 82,146 269,991 -187,845 87,024 185,050 -98,026 Reference case (20) 113,931 374,717 -260,785 122,038 222,255 -100,217 Memo: 24,518 Mayda-Steinberg elasticity simulation
66,797 -42,279 24,673 52,654 -27,981
Source: Calculations by the author. All these scenarios result in marginal output declines (which would be negligible in the context of an economy growing at the pace that Ethiopia has been maintaining), and marginal declines in economic welfare, principally because of the loss of tariff revenues. Using the Mayda-Steinberg estimate for the elasticity of substitution (1.7) would pull the regional export gains down to the US$30 million level, the regional import impact down to the US$100 million level. This would contain the widening of the overall external balance to the US$50 million range (plus or minus about US$ 5 million depending on the level of the aggregate demand elasticity). Thus, if we apply the very low estimated elasticities from the Mayda-Steinberg study, we obtain very low trade impacts, approaching the kinds of levels they found for Uganda in the context of COMESA liberalization. Output and welfare impacts are commensurately reduced;
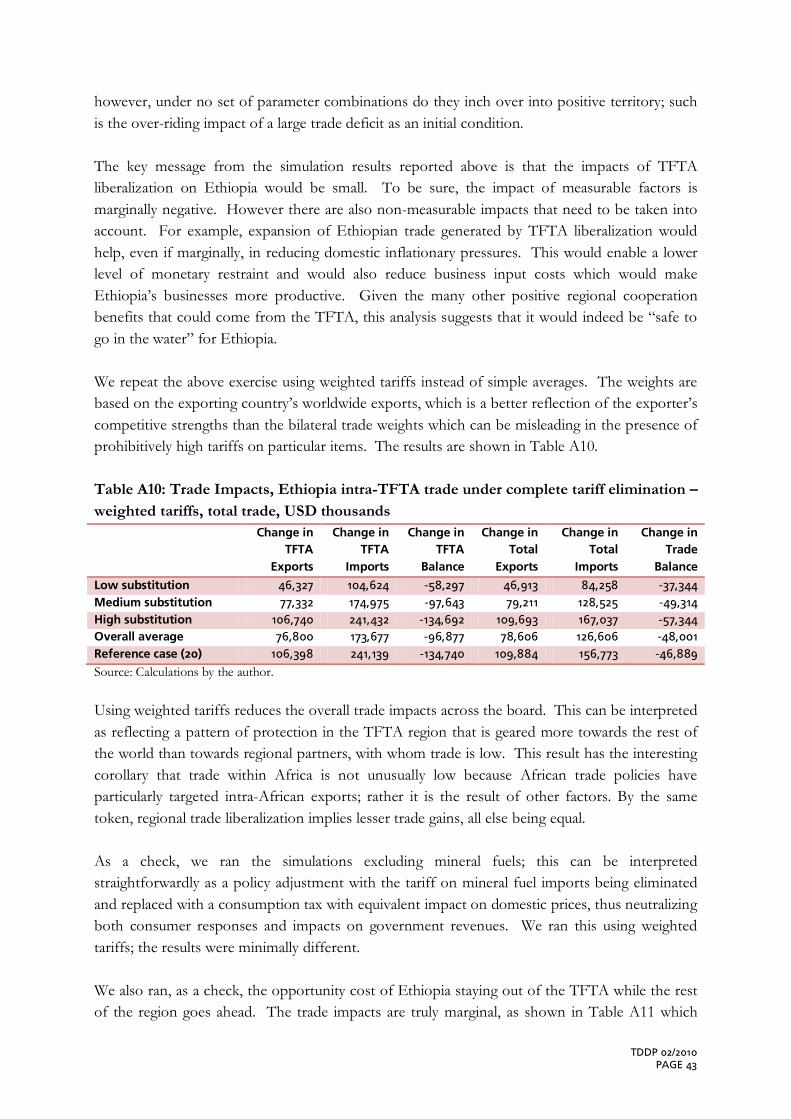
TDDP 02/2010 PAGE 43
however, under no set of parameter combinations do they inch over into positive territory; such is the over-riding impact of a large trade deficit as an initial condition. The key message from the simulation results reported above is that the impacts of TFTA liberalization on Ethiopia would be small. To be sure, the impact of measurable factors is marginally negative. However there are also non-measurable impacts that need to be taken into account. For example, expansion of Ethiopian trade generated by TFTA liberalization would help, even if marginally, in reducing domestic inflationary pressures. This would enable a lower level of monetary restraint and would also reduce business input costs which would make Ethiopia’s businesses more productive. Given the many other positive regional cooperation benefits that could come from the TFTA, this analysis suggests that it would indeed be “safe to go in the water” for Ethiopia. We repeat the above exercise using weighted tariffs instead of simple averages. The weights are based on the exporting country’s worldwide exports, which is a better reflection of the exporter’s competitive strengths than the bilateral trade weights which can be misleading in the presence of prohibitively high tariffs on particular items. The results are shown in Table A10. Table A10: Trade Impacts, Ethiopia intra-TFTA trade under complete tariff elimination – weighted tariffs, total trade, USD thousands Change in
TFTA Exports
Change in TFTA
Imports
Change in TFTA
Balance
Change in Total
Exports
Change in Total
Imports
Change in Trade
Balance
Low substitution 46,327 104,624 -58,297 46,913 84,258 -37,344 Medium substitution 77,332 174,975 -97,643 79,211 128,525 -49,314 High substitution 106,740 241,432 -134,692 109,693 167,037 -57,344 Overall average 76,800 173,677 -96,877 78,606 126,606 -48,001 Reference case (20) 106,398 241,139 -134,740 109,884 156,773 -46,889 Source: Calculations by the author. Using weighted tariffs reduces the overall trade impacts across the board. This can be interpreted as reflecting a pattern of protection in the TFTA region that is geared more towards the rest of the world than towards regional partners, with whom trade is low. This result has the interesting corollary that trade within Africa is not unusually low because African trade policies have particularly targeted intra-African exports; rather it is the result of other factors. By the same token, regional trade liberalization implies lesser trade gains, all else being equal. As a check, we ran the simulations excluding mineral fuels; this can be interpreted straightforwardly as a policy adjustment with the tariff on mineral fuel imports being eliminated and replaced with a consumption tax with equivalent impact on domestic prices, thus neutralizing both consumer responses and impacts on government revenues. We ran this using weighted tariffs; the results were minimally different. We also ran, as a check, the opportunity cost of Ethiopia staying out of the TFTA while the rest of the region goes ahead. The trade impacts are truly marginal, as shown in Table A11 which
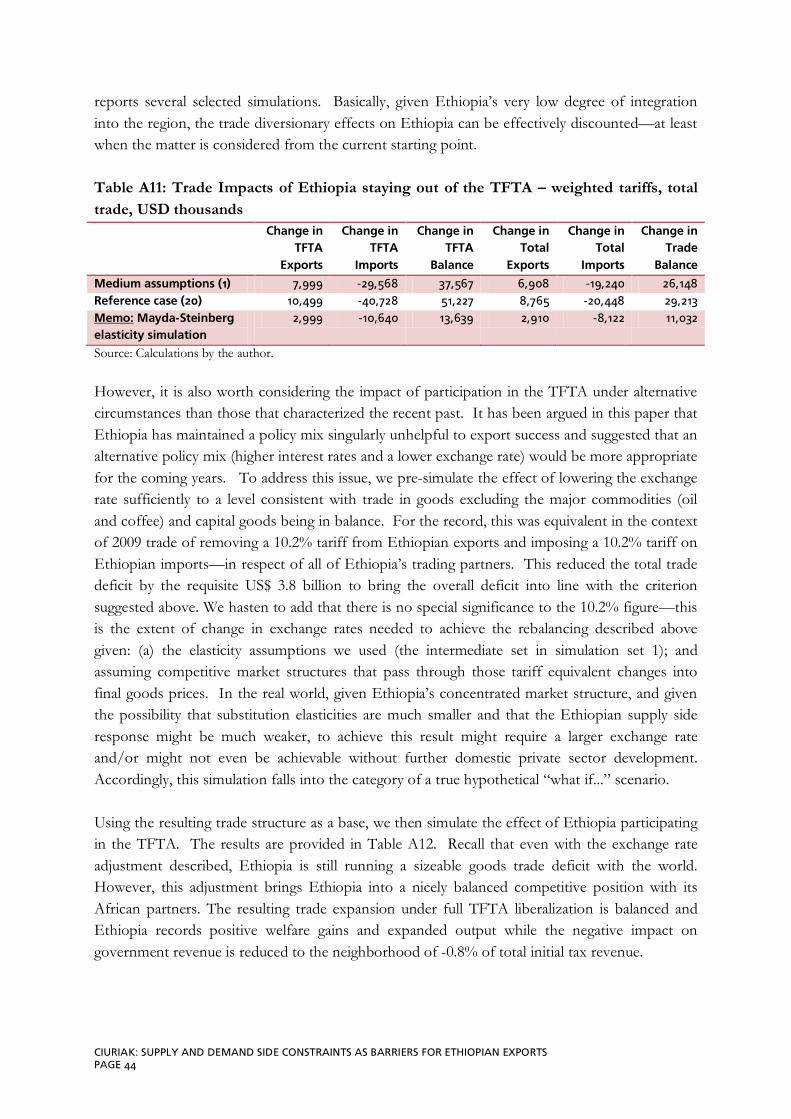
CIURIAK: SUPPLY AND DEMAND SIDE CONSTRAINTS AS BARRIERS FOR ETHIOPIAN EXPORTS PAGE 44
reports several selected simulations. Basically, given Ethiopia’s very low degree of integration into the region, the trade diversionary effects on Ethiopia can be effectively discounted—at least when the matter is considered from the current starting point. Table A11: Trade Impacts of Ethiopia staying out of the TFTA – weighted tariffs, total trade, USD thousands Change in
TFTA Exports
Change in TFTA
Imports
Change in TFTA
Balance
Change in Total
Exports
Change in Total
Imports
Change in Trade
Balance
Medium assumptions (1) 7,999 -29,568 37,567 6,908 -19,240 26,148 Reference case (20) 10,499 -40,728 51,227 8,765 -20,448 29,213 Memo: 2,999 Mayda-Steinberg elasticity simulation
-10,640 13,639 2,910 -8,122 11,032
Source: Calculations by the author. However, it is also worth considering the impact of participation in the TFTA under alternative circumstances than those that characterized the recent past. It has been argued in this paper that Ethiopia has maintained a policy mix singularly unhelpful to export success and suggested that an alternative policy mix (higher interest rates and a lower exchange rate) would be more appropriate for the coming years. To address this issue, we pre-simulate the effect of lowering the exchange rate sufficiently to a level consistent with trade in goods excluding the major commodities (oil and coffee) and capital goods being in balance. For the record, this was equivalent in the context of 2009 trade of removing a 10.2% tariff from Ethiopian exports and imposing a 10.2% tariff on Ethiopian imports—in respect of all of Ethiopia’s trading partners. This reduced the total trade deficit by the requisite US$ 3.8 billion to bring the overall deficit into line with the criterion suggested above. We hasten to add that there is no special significance to the 10.2% figure—this is the extent of change in exchange rates needed to achieve the rebalancing described above given: (a) the elasticity assumptions we used (the intermediate set in simulation set 1); and assuming competitive market structures that pass through those tariff equivalent changes into final goods prices. In the real world, given Ethiopia’s concentrated market structure, and given the possibility that substitution elasticities are much smaller and that the Ethiopian supply side response might be much weaker, to achieve this result might require a larger exchange rate and/or might not even be achievable without further domestic private sector development. Accordingly, this simulation falls into the category of a true hypothetical “what if...” scenario. Using the resulting trade structure as a base, we then simulate the effect of Ethiopia participating in the TFTA. The results are provided in Table A12. Recall that even with the exchange rate adjustment described, Ethiopia is still running a sizeable goods trade deficit with the world. However, this adjustment brings Ethiopia into a nicely balanced competitive position with its African partners. The resulting trade expansion under full TFTA liberalization is balanced and Ethiopia records positive welfare gains and expanded output while the negative impact on government revenue is reduced to the neighborhood of -0.8% of total initial tax revenue.
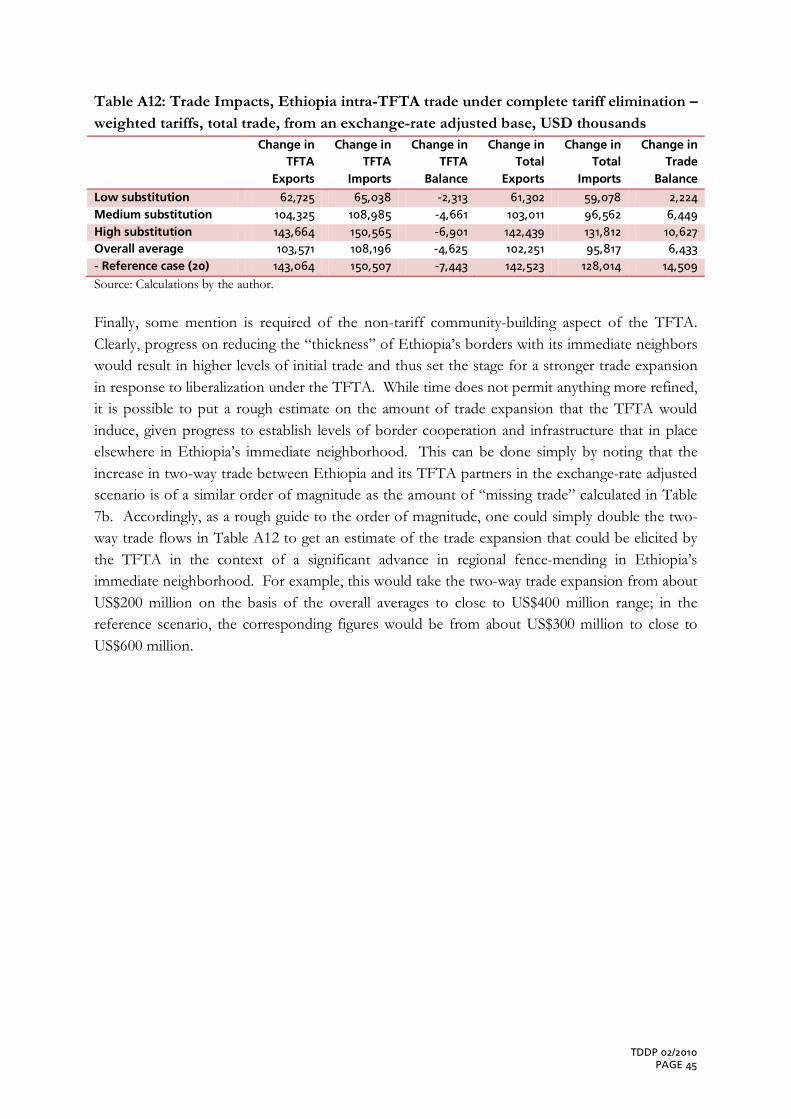
TDDP 02/2010 PAGE 45
Table A12: Trade Impacts, Ethiopia intra-TFTA trade under complete tariff elimination – weighted tariffs, total trade, from an exchange-rate adjusted base, USD thousands Change in
TFTA Exports
Change in TFTA
Imports
Change in TFTA
Balance
Change in Total
Exports
Change in Total
Imports
Change in Trade
Balance
Low substitution 62,725 65,038 -2,313 61,302 59,078 2,224 Medium substitution 104,325 108,985 -4,661 103,011 96,562 6,449 High substitution 143,664 150,565 -6,901 142,439 131,812 10,627 Overall average 103,571 108,196 -4,625 102,251 95,817 6,433 - Reference case (20) 143,064 150,507 -7,443 142,523 128,014 14,509 Source: Calculations by the author. Finally, some mention is required of the non-tariff community-building aspect of the TFTA. Clearly, progress on reducing the “thickness” of Ethiopia’s borders with its immediate neighbors would result in higher levels of initial trade and thus set the stage for a stronger trade expansion in response to liberalization under the TFTA. While time does not permit anything more refined, it is possible to put a rough estimate on the amount of trade expansion that the TFTA would induce, given progress to establish levels of border cooperation and infrastructure that in place elsewhere in Ethiopia’s immediate neighborhood. This can be done simply by noting that the increase in two-way trade between Ethiopia and its TFTA partners in the exchange-rate adjusted scenario is of a similar order of magnitude as the amount of “missing trade” calculated in Table 7b. Accordingly, as a rough guide to the order of magnitude, one could simply double the two-way trade flows in Table A12 to get an estimate of the trade expansion that could be elicited by the TFTA in the context of a significant advance in regional fence-mending in Ethiopia’s immediate neighborhood. For example, this would take the two-way trade expansion from about US$200 million on the basis of the overall averages to close to US$400 million range; in the reference scenario, the corresponding figures would be from about US$300 million to close to US$600 million.
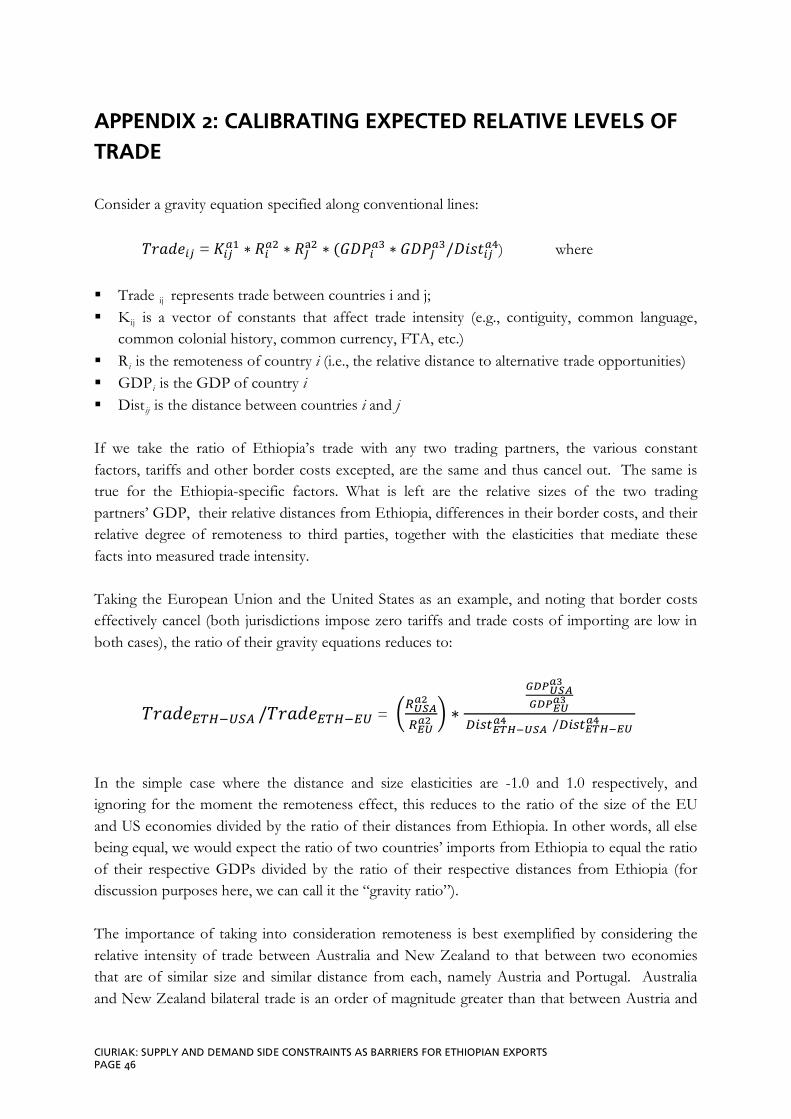
CIURIAK: SUPPLY AND DEMAND SIDE CONSTRAINTS AS BARRIERS FOR ETHIOPIAN EXPORTS PAGE 46
APPENDIX 2: CALIBRATING EXPECTED RELATIVE LEVELS OF TRADE Consider a gravity equation specified along conventional lines:
𝑇𝑟𝑎𝑑𝑒𝑖𝑗 = 𝐾𝑖𝑗𝑎1 ∗ 𝑅𝑖𝑎2 ∗ 𝑅𝐽a2 ∗ (𝐺𝐷𝑃𝑖𝑎3 ∗ 𝐺𝐷𝑃𝐽𝑎3/𝐷𝑖𝑠𝑡𝑖𝑗𝑎4) where
Trade ij
K represents trade between countries i and j;
ij
R
is a vector of constants that affect trade intensity (e.g., contiguity, common language, common colonial history, common currency, FTA, etc.)
i
GDP is the remoteness of country i (i.e., the relative distance to alternative trade opportunities)
i
Dist is the GDP of country i
ij
is the distance between countries i and j
If we take the ratio of Ethiopia’s trade with any two trading partners, the various constant factors, tariffs and other border costs excepted, are the same and thus cancel out. The same is true for the Ethiopia-specific factors. What is left are the relative sizes of the two trading partners’ GDP, their relative distances from Ethiopia, differences in their border costs, and their relative degree of remoteness to third parties, together with the elasticities that mediate these facts into measured trade intensity. Taking the European Union and the United States as an example, and noting that border costs effectively cancel (both jurisdictions impose zero tariffs and trade costs of importing are low in both cases), the ratio of their gravity equations reduces to:
𝑇𝑟𝑎𝑑𝑒𝐸𝑇𝐻−𝑈𝑆𝐴 /𝑇𝑟𝑎𝑑𝑒𝐸𝑇𝐻−𝐸𝑈 = �𝑅𝑈𝑆𝐴𝑎2
𝑅𝐸𝑈𝑎2� ∗
𝐺𝐷𝑃𝑈𝑆𝐴𝑎3
𝐺𝐷𝑃𝐸𝑈𝑎3
𝐷𝑖𝑠𝑡𝐸𝑇𝐻−𝑈𝑆𝐴 𝑎4 /𝐷𝑖𝑠𝑡𝐸𝑇𝐻−𝐸𝑈
𝑎4
In the simple case where the distance and size elasticities are -1.0 and 1.0 respectively, and ignoring for the moment the remoteness effect, this reduces to the ratio of the size of the EU and US economies divided by the ratio of their distances from Ethiopia. In other words, all else being equal, we would expect the ratio of two countries’ imports from Ethiopia to equal the ratio of their respective GDPs divided by the ratio of their respective distances from Ethiopia (for discussion purposes here, we can call it the “gravity ratio”). The importance of taking into consideration remoteness is best exemplified by considering the relative intensity of trade between Australia and New Zealand to that between two economies that are of similar size and similar distance from each, namely Austria and Portugal. Australia and New Zealand bilateral trade is an order of magnitude greater than that between Austria and
TDDP 02/2010 PAGE 47
Portugal, mainly as a reflection of the many intervening trading opportunities that Austrian and Portuguese traders have and the absence of such intervening opportunities between Australia and New Zealand, which are both relatively remote from other major markets. Remoteness in a gravity modeling framework is usually calculated as the inverse of the sum of distance-weighted GDP of other major trading partners32
:
𝑅𝑒𝑚𝑜𝑡𝑒𝑛𝑒𝑠𝑠𝑖 = 1/∑ (𝐷𝑖𝑠𝑡𝑖𝑗
𝐺𝐷𝑃𝑗/𝐺𝐷𝑃𝑊)𝑗
where GDPw is the GDP of the world as a whole. Anderson and van Wincoop (2003), who fitted the gravity model with proper theoretical underpinnings, have persuasively argued that the impact of alternative market opportunities, multilateral resistance in their terminology, cannot be measured simply using distance-based measures along the lines described above, largely because this approach does not take into account border effects. Finally, the gravity modeling literature has for the most part not incorporated the principle of comparative advantage, a key underpinning of international trade theory. Taking into account the forces of comparative advantage is particularly important when the gravity model is used for policy applications such as identifying priority markets for trade promotion programs or for bilateral trade agreements. For example, the potential for trade expansion through reduction of brooder costs that impede trade might be greater with countries that have complementary patterns of comparative advantage. Ciuriak and Kinjo (2006) incorporate the Trade Specialization Index (TSI) into a gravity equation and show that indeed it does help explain the pattern of global trade. The TSI is defined as net exports (exports minus imports) in a given sector divided by total two-way trade in that sector. The range of this variable is from 1 if a country only exports in a given sector to –1 if it only imports in that sector. Ciuriak and Kinjo (2006) calculate a country's TSI for each sector defined at the 2-digit HS code level and then calculate the simple correlation coefficient between two trading partners’ TSIs. This variable can take values from 1 if the TSIs are identically distributed over the various sectors, to –1 if the TSIs are perfectly negatively correlated. Country pairs that have a positive TSI correlation tend to be natural competitors in international trade while those with negative territory would tend to be natural trading partners and thus to trade more intensively. In Ethiopia’s case, the closest of the major global markets is the EU. It is also a highly open market with zero tariffs and low border costs. Moreover, it is a natural trading partner for Ethiopia in terms of comparative advantage (simple correlation of its TSI index with Ethiopia is -0.28 in 2008). Accordingly, it serves as a good benchmark for the level of trade that would be observed in the absence of demand-side constraints globally. Since other major markets in the Americas and Asia have greater trading opportunities with economies similar to Ethiopia, taking 32 Some specifications of the remoteness index do not include world GDP. For the purposes here, the choice of
specification is not an issue since it is the ratio of imports from Ethiopia of various trading partners that is being examined; the constant term for world GDP would cancel out.
CIURIAK: SUPPLY AND DEMAND SIDE CONSTRAINTS AS BARRIERS FOR ETHIOPIAN EXPORTS PAGE 48
in account remoteness suggests that the ratio of their imports from Ethiopia to EU imports from Ethiopia would tend to be somewhat lower than their gravity ratio with respect to the EU. Countries with higher border costs than the EU’s would tend to have still lower import ratios. And countries with more similar degrees of trade specialization still lower. Accordingly, using the EU as a benchmark, the gravity ratios for other major global markets saves as a useful point of reference to calibrate expectations concerning trade potential for Ethiopia, given its current supply-side constraints, if demand-side barriers in these global markets were reduced to the level in the EU.

BKP TRADE AND DEVELOPMENT DISCUSSION PAPERS 02/2010 Dan Ciuriak Supply and Demand Side Constraints as
Barriers for Ethiopian Exports – Policy Options
August 2010
01/2010 Derk Bienen The Tripartite Free Trade Area and its Implications for COMESA, the EAC and SADC
May 2010
02/2009 Derk Bienen Preparedness of the Ethiopian Private Sector to Benefit from WTO Accession
July 2009
01/2009 Yishak Tekaligne Taye Determinants of Ethiopia's Export Performance: A Gravity Model Analysis
June 2009
02/2008 Gebrehiwot Ageba and Derk Bienen
Ethiopia's Accession to the WTO and the Financial Services Sector
October 2008
01/2008 Derk Bienen Procedures for the Procurement of Aid in Europe: A Critical Assessment
June 2008
AVAILABLE ONLINE: HTTP://WWW.BKP-DEVELOPMENT.DE

BKP DEVELOPMENT RESEARCH & CONSULTING GMBH ROMANSTRASSE 74. 80639 MUNICH. GERMANY PHONE +49-89-1787 6047. FAX +49-89-1787 6049 E-MAIL [email protected] WWW.BKP-DEVELOPMENT.DE