Supply and Demand LMI Tables - coeccc.net · Page 1 Supply and Demand LMI Tables OPENING and USING...
8
Page 1 Supply and Demand LMI Tables OPENING and USING the supply and demand tables for researching labor market information by region, economic sub-region or county Click on any of the links below to jump to that section in this file: Links to Short Instructional Videos Opening the Supply and Demand Excel Files How to Navigate the Files: INSTRUCTIONS Tab SUPPLY LMI Tab DEMAND LMI Tab Data Definitions and Interpreting Data Tabs Links to Short Instructional Videos Navigating the Supply and Demand Tables, O*net online guide to Choosing SOC codes for LMI Opening the Supply and Demand Excel Files Macros, Enable Content and Mac Users Macro Warning: The Demand and Supply LMI Excel files are macro enabled. A warning message may display upon opening of the file. Opening this file will NOT affect any other files or the computer that it is stored on. When listed in a file directory, it does have an icon indicating that it does contain macros. Enable Editing: Upon opening the files, you may also encounter this message to Enable Editing Enable Content: After clicking on the “Enable Editing” button, an Enable Content message appears Clicking on both buttons will not affect your computer nor your files. Note for Mac and tablet users: These files were created with Microsoft Office Excel on a PC. While there are Microsoft Office versions for Mac and PC, the interface for the Mac version can be quite different. Mac Users will need to upgrade to Office 2016 for Mac suite (which includes Excel Version 16.28) or Microsoft Office 360. There are
-
Upload
hoangkhuong -
Category
Documents
-
view
216 -
download
0
Transcript of Supply and Demand LMI Tables - coeccc.net · Page 1 Supply and Demand LMI Tables OPENING and USING...

Page 1
Supply and Demand LMI Tables OPENING and USING the supply and demand tables for researching
labor market information by region, economic sub-region or county
Click on any of the links below to jump to that section in this file:
Links to Short Instructional Videos
Opening the Supply and Demand Excel Files
How to Navigate the Files: INSTRUCTIONS Tab
SUPPLY LMI Tab
DEMAND LMI Tab
Data Definitions and Interpreting Data Tabs
Links to Short Instructional Videos Navigating the Supply and Demand Tables, O*net online guide
to Choosing SOC codes for LMI
Opening the Supply and Demand Excel Files Macros, Enable Content and Mac Users
Macro Warning: The Demand and Supply LMI Excel files are macro enabled. A warning message may display
upon opening of the file. Opening this file will NOT affect any other files or the computer that it is stored on.
When listed in a file directory, it does have an icon indicating that it does contain macros.
Enable Editing: Upon opening the files, you may also encounter this message to Enable Editing
Enable Content: After clicking on the “Enable Editing” button, an Enable Content message appears
Clicking on both buttons will not affect your computer nor your files.
Note for Mac and tablet users: These files were created with Microsoft Office Excel on a PC. While there are
Microsoft Office versions for Mac and PC, the interface for the Mac version can be quite different. Mac Users
will need to upgrade to Office 2016 for Mac suite (which includes Excel Version 16.28) or Microsoft Office 360. There are

Page 2
two warnings. One, that there are macros to enable. Two, that the features can only be used in read-only mode. Any
changes made cannot be saved. Once you click through those, the table and pivots should work fine. If you are trying
to open the files on a tablet, you may also encounter problems and will need to use a laptop or desktop. If you
continue to encounter issues, please contact your regional COE Director for assistance.
How to Navigate the files: Guide to tabs in the files and tips for getting desired information
There are two tabs in each of the Demand and Supply Files: “INSTRUCTIONS” and “DEMAND LMI” or “SUPPLY
LMI.” To navigate between the two, just click on either tab with your cursor.
INSTRUCTIONS tab: The Instructions tab in the Supply and Demand files contains overviews of the data
included in the LMI tabs, help with selecting the data that you want to display, and the data sources. The
Supply LMI Instructions tab also contains a resource table that you can scroll through to help with your
selection of a TOP06 code (if you should need it) in TOP06 numerical order.
SOC code(s) need to be selected in order to see annual openings from the Demand LMI table. There are two
options for selecting these codes:
Option 1 – O*NET: Click on the red button to go to O*NET OnLine and search
by job title or keyword and choose from a list. There is a link to a short video
about O*NET and selection of SOC codes at the top of the page.
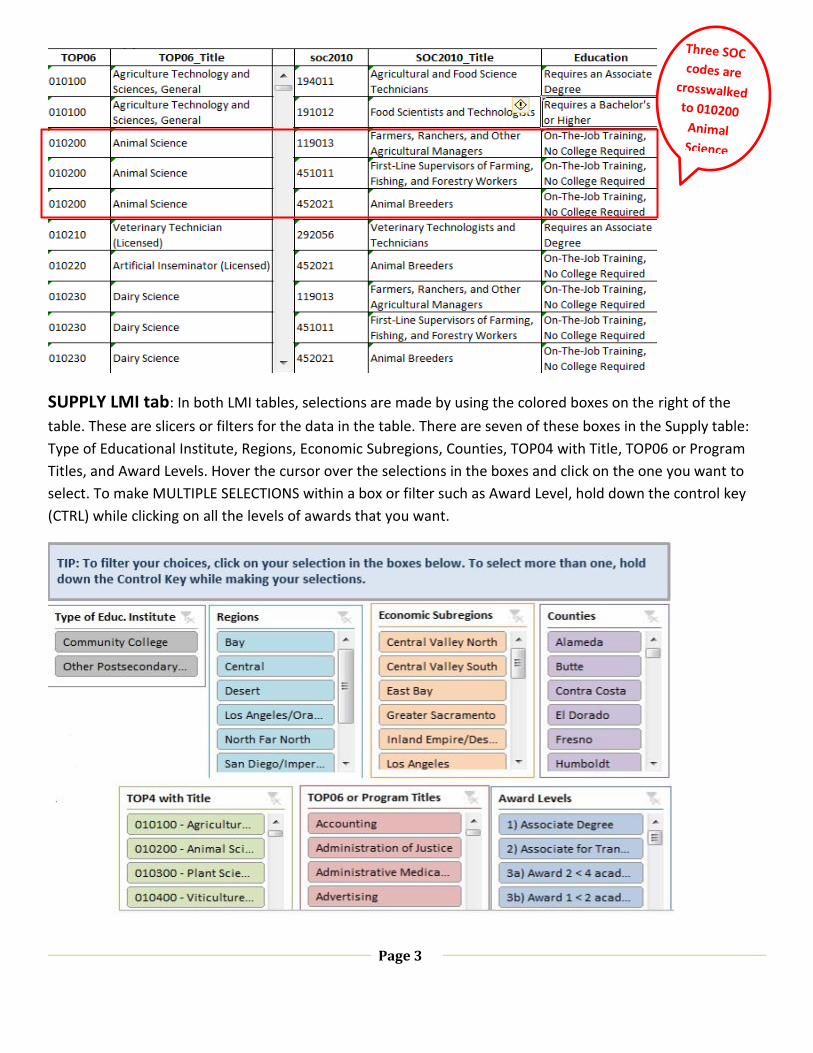
Option 2 – Crosswalk: The other option is to use the crosswalk provided on the Demand LMI
Instructions tab. This crosswalk was developed by the Centers of Excellence to map TOP06 codes to
SOC (Standard Occupational Classification) codes. It can be scrolled through to see which SOC code(s)
are typically associated with a TOP06. However, there may different SOC codes related to a TOP06
depending on the college program. This crosswalk should be considered as a starting point for your
SOC search. Usually three to five SOC codes are chosen as potential occupations upon completion of a
particular program. Of course, this will vary depending on the program.
Scroll Bar
Page 3
SUPPLY LMI tab: In both LMI tables, selections are made by using the colored boxes on the right of the
table. These are slicers or filters for the data in the table. There are seven of these boxes in the Supply table:
Type of Educational Institute, Regions, Economic Subregions, Counties, TOP04 with Title, TOP06 or Program
Titles, and Award Levels. Hover the cursor over the selections in the boxes and click on the one you want to
select. To make MULTIPLE SELECTIONS within a box or filter such as Award Level, hold down the control key
(CTRL) while clicking on all the levels of awards that you want.

Page 4
When a selection is made in any filter box, ALL filter boxes are affected. For instance, if Bay Region and Silicon
Valley sub-region are chosen, then the other regions and sub-regions are grayed out. Only Santa Clara county
is shown with the other counties grayed out since it is the only county in that sub-region. Therefore, only
TOP06s, Program Titles and award levels will be highlighted and displayed for Santa Clara County. If there are
no selections made in any of the boxes, then all data for all state programs is displayed.
The symbol indicates
that you have made a
selection in the Region
and Sub-region boxes.
All other filters or boxes
are affected by your
selection and show the
symbol since a
selection has not been
made directly in that box
(see Counties box above) but have been affected by selections in other boxes.
To see the effects on the data table to the left, let’s continue and choose a TOP06 like 094800 (Automotive
Technology). Either the TOP06 or the TOP06 program title can be chosen. Here is how the table will look
based on your 3 filters for region, sub-region and TOP06.
To see the effects on the data table to the left, let’s continue and choose a TOP06 like 210440 (Alcohol
or Controlled Substances). Either the TOP04 with Title or the TOP06 program title can be chosen. Here is
how the table will look based on your 3 filters for region, sub-region and TOP06.

Page 5
To see the detail of the colleges listed under this program, simply click on the “+” next to the TOP06 and
program title in the table to expand your selection (where the red circle is drawn above). Here is the list of
colleges when you expand to see detail:
Note that three year data available for the Community Colleges is 2013-16. However, the three year data
from IPEDS (Integrated Postsecondary Data System) for other postsecondary institutes is for 2012-15 as noted
in the red circle above to the right. The column to the right for the “Latest Available 3 Yr Avg” is typically the
number that is used for denoting supply of students. The data for the latest year available (2014-15 for Other
Postsecondary Ed. Institutes and 2015-16 for CA Community Colleges) are preliminary and may change.
To further filter the selection, choose award level in the filter box to show only Associate Degrees or only
Certificates above a certain number of units or academic years. To see data for community colleges only in the
geographic area chosen, make the selection in the Type of Educational Institute filter box.

Page 6
DEMAND LMI tab: There are six
slicer or filter boxes in the Demand
table: Regions, Economic Subregions,
Counties, SOC codes, Occupational
Titles and Skill Level. To make
MULTIPLE SELECTIONS within a box or
filter, hold down the control key while
clicking on all of the selected items for
which data is needed.
If a selection is cut off in a box, simply
hover over that selection and the full
name will appear. See selection to the
right in Occupational Titles filer for
Agriculture Equipment Operators.
Like the Supply filters, if you make a selection in one box, it affects all of the others. Let’s choose North Far
North as the region and Greater Sacramento as the sub-region:
There are more than just the five counties displayed in the box initially. Just use the scroll bar on the right in
the Counties box to see the others. Again, the counties not included such as Alameda are greyed out. Also,
the same symbols appear in the slicer boxes where selections have been made. The symbol is not in the
Counties box since no selection was made in that box.
To clear ALL of your filters, there are two options:
(1) Click on all symbols in the boxes,
(2) Select the blue REFRESH button in the middle of the sheet.
To see the effects on the Demand table, let’s continue and choose SOC codes (Standard Occupational
Classification) codes like 29-2011 and 29-2012 for Medical and Clinical Laboratory Technologists and
Scroll bar to see other counties included

Page 7
Technicians. You can select either the SOC code or the Occupational title. Here is how the table will look
based on your 3 filters for region, sub-region and SOC code.
The number of jobs in 2015 and 2018 are listed as well as the change in jobs, representing new jobs or
contraction in jobs (if negative), projected to be created in that three year period. The % change is for 2015-
18. To get annual change, divide by three. In this instance for the two job titles, annual growth is 3.2%. The
number to use for demand is the Annual Openings, which is the 2015-18 Change in jobs (new jobs) +
Replacements. 10th percentile hourly earnings are typically considered entry level wages. To get annual
salaries, simply multiply the hourly wage x 2,080 hours. For these two jobs, the 10th percentile (or entry-level)
annual salary would be $39,762.
Looking at the typical entry level of education, notice that Medical and Clinical Lab Technologists typically
require a Bachelor’s degree for entry. While this is not always the case, it is an indication of the desired level
of education. For a breakdown of education levels of people currently employed in a certain occupation at the
national level, visit and type in the SOC code, job title or keyword (a box with a link is
provided on the Demand LMI Instruction tab for navigating to O*NET). Select the occupation from the list
provided and view the report on Education. For Medical and Clinical Lab Technologists, O*NET shows that
while 59% of those currently employed have a Bachelor’s degree, 30% have an Associate Degree.
To filter for Middle Skill jobs only, use the filter or slicer box on the far right of the bottom row for “Skill Level.” The Centers of Excellence used the following criteria to classify occupations into the Middle Skill category: - All occupations listed as having some college or associate degree = Yes
- All occupations needing an apprenticeship = Yes
- All occupations with a Bachelor's degree with ~>= 33% of workers (CPS) having some college to associate degree = Yes
- All occupations with High school or equivalent or no formal education with long-term OTJ = Yes
- All supervisorial occupations (skills-builder qualified) = Yes
- Exceptions for Bachelor's degree where there is pre-existing CCs level programs

Page 8
- Exceptions were made for occupations with high school or equivalent or no formal education with short or moderate OTJ where multiple CCs have pre-existing programs
Data Definitions and Interpreting Data tabs: The Data Definition tab has more information on data
sources and demand data provided. The Interpreting Data tab provides disclaimers when using the data and
implications for analysis.
For more information, follow the link to the short instructional video at the .