Supplementary Materials for - stm.sciencemag.org file6 Fig. S4. Assays of urinary tract colonization...
17
www.sciencetranslationalmedicine.org/cgi/content/full/5/184/184ra60/DC1 Supplementary Materials for Genomic Diversity and Fitness of E. coli Strains Recovered from the Intestinal and Urinary Tracts of Women with Recurrent Urinary Tract Infection Swaine L. Chen, Meng Wu, Jeffrey P. Henderson, Thomas M. Hooton, Michael E. Hibbing, Scott J. Hultgren, Jeffrey I. Gordon* *Corresponding author. E-mail: [email protected] Published 8 May 2013, Sci. Transl. Med. 5, 184ra60 (2013) DOI: 10.1126/scitranslmed.3005497 This PDF file includes: Fig. S1. Maximum likelihood fimH gene tree incorporating the UPEC strains characterized in the present study. Fig. S2. Hierarchical clustering of 404 E. coli strains including the 26 characterized in the present study. Fig. S3. The episode 3 UTI strain Ec72_E3U1 forms IBCs. Fig. S4. Assays of urinary tract colonization with episode 1 and 3 strains from patient 72. Fig. S5. Parameter testing and validation of FitSeq. Fig. S6. In vitro characterization of Ec72_U1E1 and Ec72_U3E1. Fig. S7. Genes encoding flagellar proteins that are present/absent in the genomes of UTI episode 1 (Ec72_E1U1) and episode 3 (Ec72_E3U1) strains. Fig. S8. UPEC virulence–associated elements present/absent in the genomes of UTI episode 1 (Ec72_E1U1) and episode 3 (Ec72_E3U1) strains recovered from patient 72 compared to UPEC strain UTI89. Fig. S9. PTS pathway components involved in L-sorbose utilization. Fig. S10. Comparison of growth phenotypes of Ec72_E1U1 and Ec72_E3U1 strains from UTI episodes 1 and 3. Legends for Tables S1 to S9 Other Supplementary Material for this manuscript includes the following: (available at www.sciencetranslationalmedicine.org/cgi/content/full/5/184/184ra60/DC1) Table S1. Clinical characteristics and treatment of the four patients with three episodes of recurrent UTI. Table S2. Summary of 45 isolates analyzed for this study, including those subjected to whole-genome sequencing.
Transcript of Supplementary Materials for - stm.sciencemag.org file6 Fig. S4. Assays of urinary tract colonization...

www.sciencetranslationalmedicine.org/cgi/content/full/5/184/184ra60/DC1
Supplementary Materials for
Genomic Diversity and Fitness of E. coli Strains Recovered from the Intestinal and Urinary Tracts of Women with Recurrent Urinary Tract
Infection
Swaine L. Chen, Meng Wu, Jeffrey P. Henderson, Thomas M. Hooton, Michael E. Hibbing, Scott J. Hultgren, Jeffrey I. Gordon*
*Corresponding author. E-mail: [email protected]
Published 8 May 2013, Sci. Transl. Med. 5, 184ra60 (2013)
DOI: 10.1126/scitranslmed.3005497
This PDF file includes:
Fig. S1. Maximum likelihood fimH gene tree incorporating the UPEC strains characterized in the present study. Fig. S2. Hierarchical clustering of 404 E. coli strains including the 26 characterized in the present study. Fig. S3. The episode 3 UTI strain Ec72_E3U1 forms IBCs. Fig. S4. Assays of urinary tract colonization with episode 1 and 3 strains from patient 72. Fig. S5. Parameter testing and validation of FitSeq. Fig. S6. In vitro characterization of Ec72_U1E1 and Ec72_U3E1. Fig. S7. Genes encoding flagellar proteins that are present/absent in the genomes of UTI episode 1 (Ec72_E1U1) and episode 3 (Ec72_E3U1) strains. Fig. S8. UPEC virulence–associated elements present/absent in the genomes of UTI episode 1 (Ec72_E1U1) and episode 3 (Ec72_E3U1) strains recovered from patient 72 compared to UPEC strain UTI89. Fig. S9. PTS pathway components involved in L-sorbose utilization. Fig. S10. Comparison of growth phenotypes of Ec72_E1U1 and Ec72_E3U1 strains from UTI episodes 1 and 3. Legends for Tables S1 to S9
Other Supplementary Material for this manuscript includes the following: (available at www.sciencetranslationalmedicine.org/cgi/content/full/5/184/184ra60/DC1)
Table S1. Clinical characteristics and treatment of the four patients with three episodes of recurrent UTI. Table S2. Summary of 45 isolates analyzed for this study, including those subjected to whole-genome sequencing.
Table S3. Genes targeted for MLST and primers used for generating PCR amplicons for DNA sequencing. Table S4. Genome sequencing and assembly metrics for urine and fecal isolates obtained from patients 13 and 72 during their three episodes of UTI. Table S5. Reference genomes used for OGU- and SNP-based analyses. Table S6. Representation of known virulence factors in the genomes of the 26 isolates from the present study and in 54 other E. coli genomes classified as complete in the NCBI RefSeq database. Table S7. Comparison of YESCA pellicle, Congo Red staining, and swarming phenotypes of strains EC72_E1U1, EC72_E3U1, and UTI89. Table S8. Representation of genes involved in flagellar assembly and PTS-sorbose systems in the 26 clinical isolates from the present study and in the 54 reference complete E. coli genomes. Table S9. Representation of genes (OGUs) assigned to KEGG pathways in the shared and variable components of the EC72_E1U1 and EC72_E3U1 genomes.

1
Genomic diversity and fitness of E. coli strains recovered from the intestinal and
urinary tracts of women with recurrent urinary tract infection
SUPPLEMENTAL MATERIALS
Supplemental Figures
Fig. S1. Maximum likelihood fimH gene tree incorporating the UPEC strains characterized in the present study. fimH sequences analyzed in (33) are included to
876
1 2 3
Patient 72 Fecal
Patient 72 Urine
Patient 13 Fecal
Patient 13 Urine
1 1 2 32 32 3321
3 3 3 33
1 1 11 22

2
provide background fimH variability within E. coli. Squares indicate fecal isolates while circles are urine isolates. The number inside each symbol indicates the UTI episode from which the strain was isolated.
3
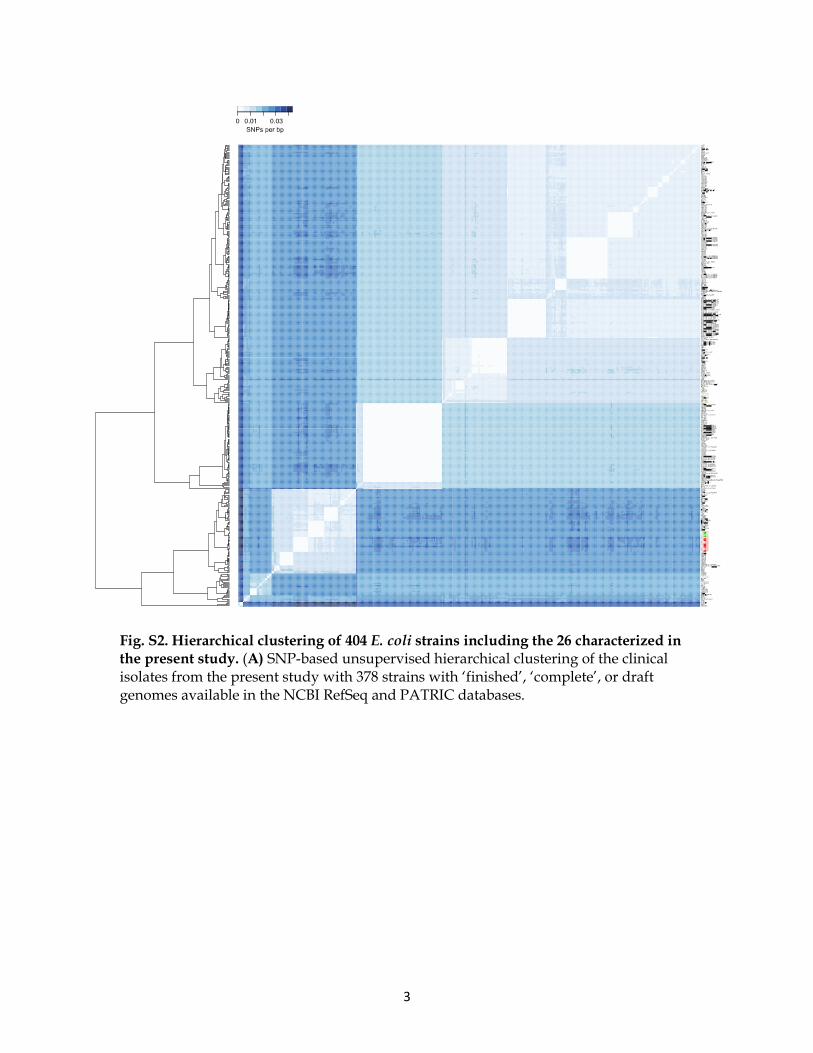
Fig. S2. Hierarchical clustering of 404 E. coli strains including the 26 characterized in the present study. (A) SNP-based unsupervised hierarchical clustering of the clinical isolates from the present study with 378 strains with ‘finished’, ‘complete’, or draft genomes available in the NCBI RefSeq and PATRIC databases.
4
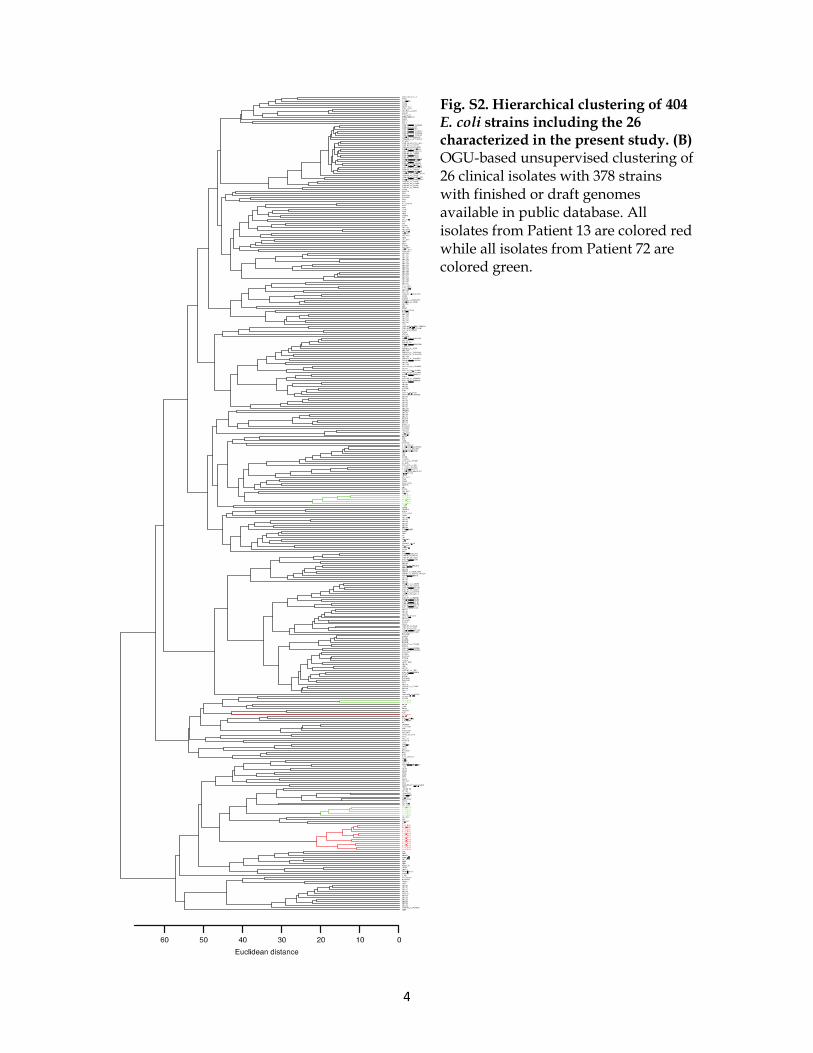
Fig. S2. Hierarchical clustering of 404 E. coli strains including the 26 characterized in the present study. (B) OGU-based unsupervised clustering of 26 clinical isolates with 378 strains with finished or draft genomes available in public database. All isolates from Patient 13 are colored red while all isolates from Patient 72 are colored green.

5
Fig. S3. The episode 3 UTI strain Ec72_E3U1 forms IBCs. Confocal images of IBCs found in infections of the mouse bladder using the reference UPEC strain, UTI89 (A,B) and the episode 3 isolate from patient 72, Ec72_E3U1 (C,D). Bacterial strains express GFP and appear green. Epithelial cells are stained with wheat germ agglutinin (red) to show uroplakin expression. Images are taken 6 h post-infection (A,C) or 12 h post-
infection (B,D). Scale bar in (A), 10µm (same in all panels).
6
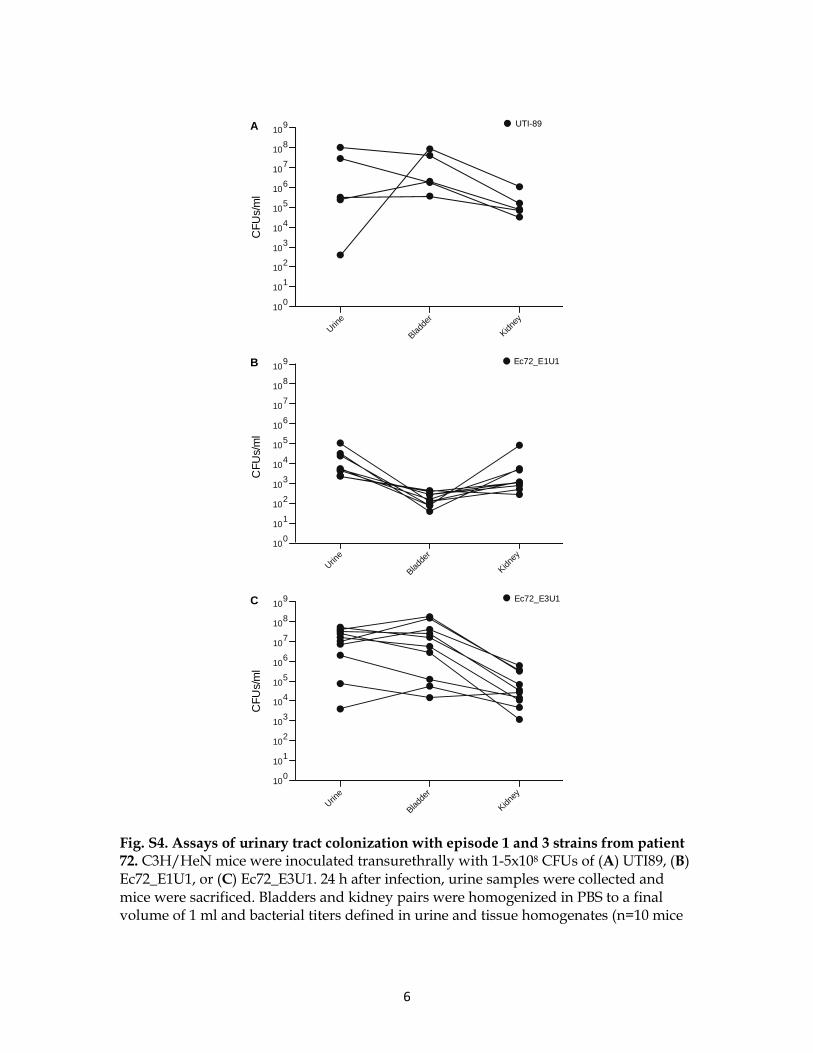
Fig. S4. Assays of urinary tract colonization with episode 1 and 3 strains from patient 72. C3H/HeN mice were inoculated transurethrally with 1-5x10⁸ CFUs of (A) UTI89, (B) Ec72_E1U1, or (C) Ec72_E3U1. 24 h after infection, urine samples were collected and mice were sacrificed. Bladders and kidney pairs were homogenized in PBS to a final volume of 1 ml and bacterial titers defined in urine and tissue homogenates (n=10 mice
Urine
Bladde
r
Kidney
UTI-89
CFU
s/m
lC
FUs/
ml
Ec72_E3U1
100
101
102
103
104
105
106
107
108
109
Urine
Bladde
r
Kidney
Ec72_E1U1
CFU
s/m
l
100
101
102
103
104
105
106
107
108
109
Urine
Bladde
r
Kidney
100
101
102
103
104
105
106
107
108
109A
B
C
7
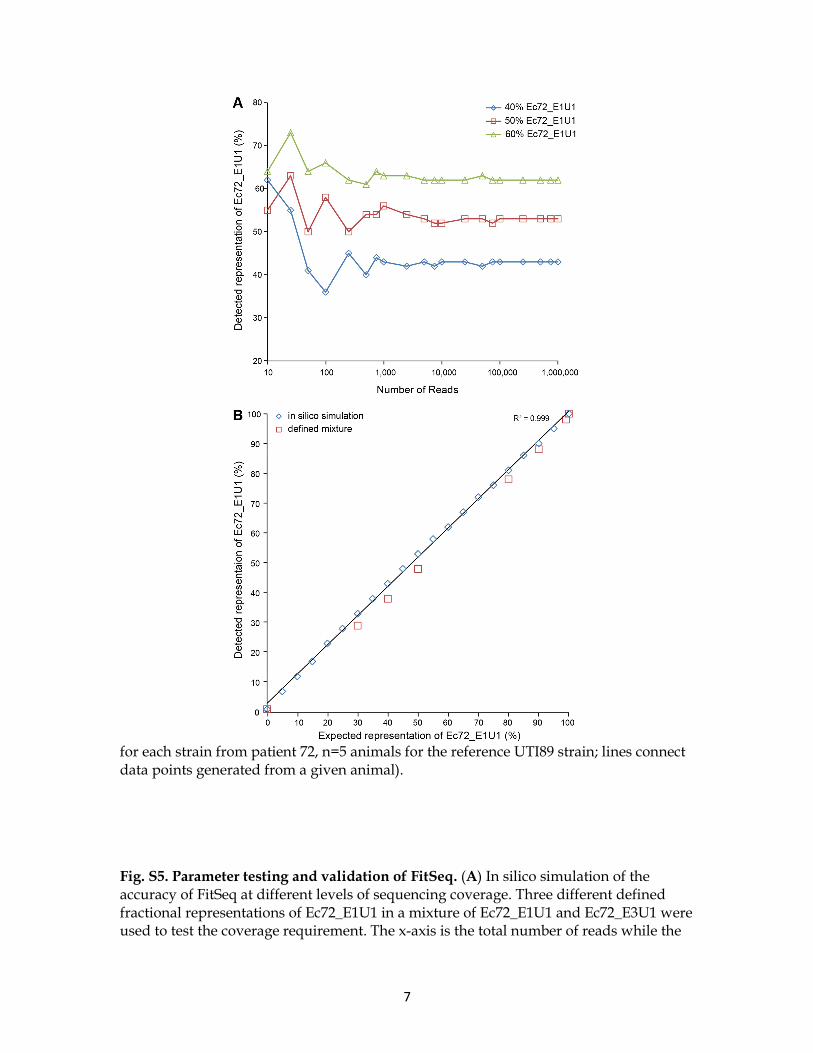
for each strain from patient 72, n=5 animals for the reference UTI89 strain; lines connect data points generated from a given animal). Fig. S5. Parameter testing and validation of FitSeq. (A) In silico simulation of the accuracy of FitSeq at different levels of sequencing coverage. Three different defined fractional representations of Ec72_E1U1 in a mixture of Ec72_E1U1 and Ec72_E3U1 were used to test the coverage requirement. The x-axis is the total number of reads while the

8
y-axis plots the detected representation as calculated by FitSeq. (B) Validation of FitSeq by in silico simulation sequencing of defined mixtures. The expected representation and the detected representation are highly correlated in both the in silico simulation and the defined mixtures at a coverage of 500,000 reads/sample (R2=0.999).

9
Fig. S6. In vitro characterization of Ec72_U1E1 and Ec72_U3E1. (A) Biofilm formation assayed after a 48 h static incubation, at room temperature in LB media, in 96-well polyvinyl chloride assay plates. Adherent biomass was defined by staining the material in each well with crystal violet, solubilizing the crystal violet with acetic acid, and recording A595 values for each well (data normalized to UTI89). (B) Guinea pig red blood cell hemagglutination titers, with and without mannose (determined with cells normalized to OD600 = 1.0, as described previously (76); (C) Swimming motility. Cultures of each strain were incubated statically at 37oC for 24 h, subcultured and incubated again under the same conditions and inoculated into 0.25% LB agar. Swim diameter was assessed 6.5 h after inoculation. Mean values ± SD are plotted
A
B
C
0.0
2.0
4.0
6.0
8.0
10.0
UTI89 Ec72E1U1 Ec72E3U1
HA
Tite
r
Mannose -
Mannose +
-0.2
0
0.2
0.4
0.6
0.8
1
1.2
UTI89 Ec72E1U1 Ec72E3U1
A59
5 R
elat
ive
to U
TI8
9 LB
0.0
0.5
1.0
1.5
2.0
UTI89 Ec72E1U1 Ec72E3U1
Sw
im D
iam
eter
(cm
)
10
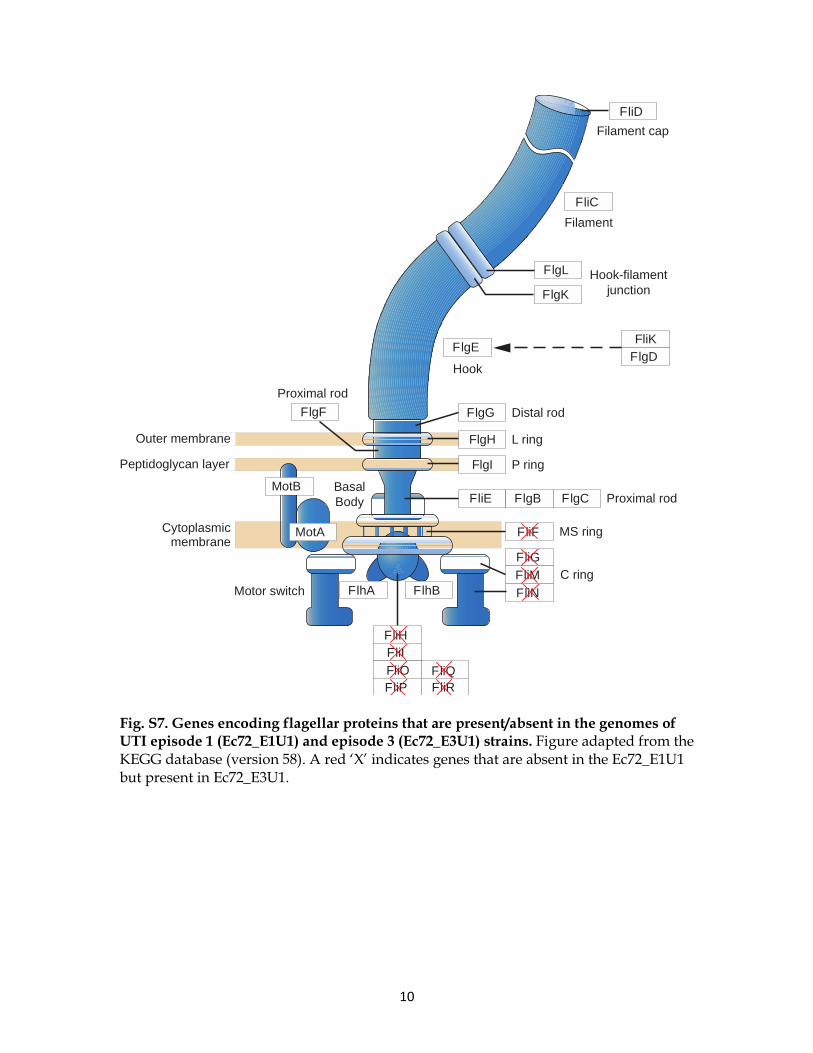
Fig. S7. Genes encoding flagellar proteins that are present/absent in the genomes of UTI episode 1 (Ec72_E1U1) and episode 3 (Ec72_E3U1) strains. Figure adapted from the KEGG database (version 58). A red ‘X’ indicates genes that are absent in the Ec72_E1U1 but present in Ec72_E3U1.
Hook-filamentjunction
Filament cap
FliK
L ring
P ring
Distal rod
FlgH
FlgI
Proximal rod
MS ring
C ring
Proximal rod
Outer membrane
Peptidoglycan layer
Cytoplasmicmembrane
BasalBody
Motor switch
FliD
FliC
FlgL
FlgK
FlgDFlgE
FlgG
FliE FlgB FlgC
FliF
FliGFliMFliN
FlgF
MotB
MotA
FlhA FlhB
FliO
FliHFliI
FliPFliQFliR
Filament
Hook

11
Fig. S8. UPEC virulence–associated elements present/absent in the genomes of UTI episode 1 (Ec72_E1U1) and episode 3 (Ec72_E3U1) strains recovered from patient 72 compared to UPEC strain UTI89. Each gene is represented by a square and is colored red if present, and black if absent, as determined by the OGU-based pan-genome analysis.
yad sfa fml yeh yfc yqi auf pap F17 fim ECP
HeminIron/
Manganese Salmochelin Yersiniabactin
Prophage 43016 Prophage 43020 Prophage 43023
Prophage 43025 Prophage 43027
UTI89 plasmid
PAI-II/leuX
PAI-III/serX PAI-IV/asnT
PAI-V PAI-VI
IAHP/aspV IAHP/metV ibeA
UTI89
Ec72_E1U1
Ec72_E3U1
Pat
hoge
nici
ty is
land
sP
roph
ages
Pili
Iron
Toxi
ns
Pla
smid
foc pixType IV(c2395)
Type IV(hof/ppd)
Aerobactin
cytotoxicnecrotizing
factor 1alpha
hemolysincytolethaldistending Shiga-like

12
Fig. S9. PTS pathway components involved in L-sorbose utilization. The components of L-sorbose-specific enzymes II (EII-A, EII-B, EII-C and EII-D) are absent in the Ec72_E1U1 strain but present in the Ec72_E3U1 strain.
sorbose
periplasmic space
inner membrane
cytosol
sorbose 1-phosphatemetabolism
phosphpenolpyruvate (PEP)
pyruvateEII-AEII-B
EII-CEII-D
13
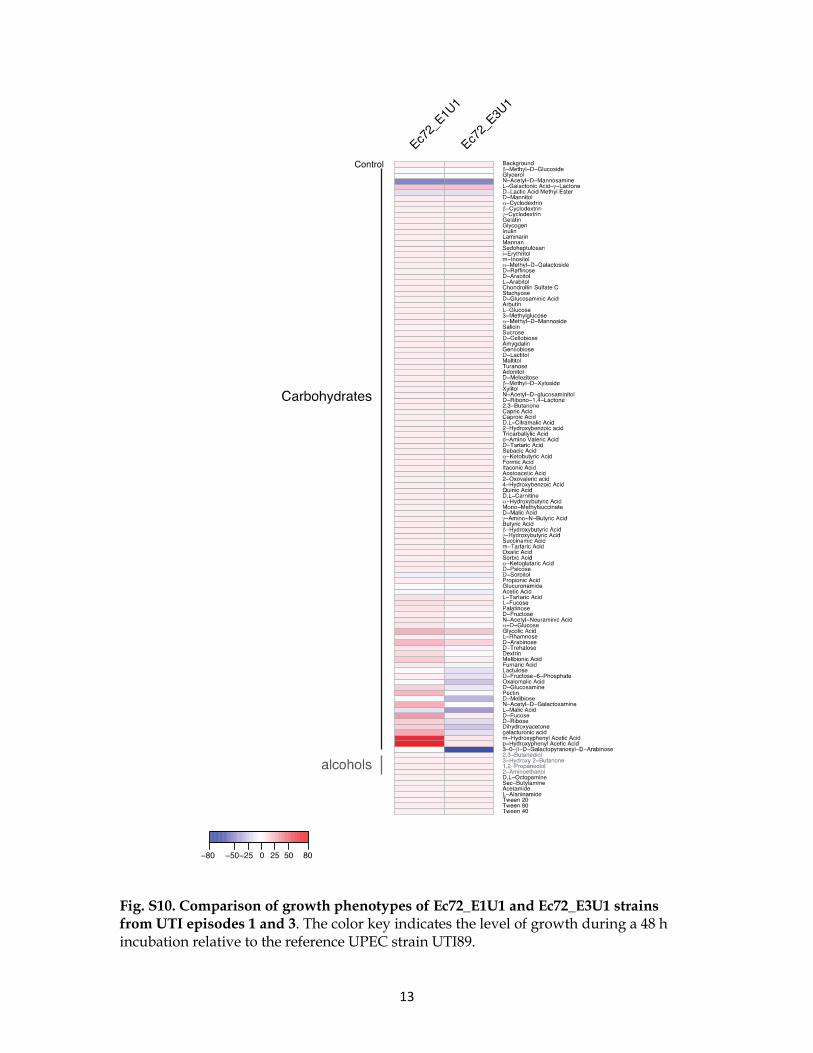
Fig. S10. Comparison of growth phenotypes of Ec72_E1U1 and Ec72_E3U1 strains from UTI episodes 1 and 3. The color key indicates the level of growth during a 48 h incubation relative to the reference UPEC strain UTI89.
14
Supplemental Tables
Table S1. Clinical characteristics and treatment of the four patients with three
episodes of recurrent UTI.
Table S2. Summary of 45 isolates analyzed for this study, including those subjected to
whole-genome sequencing.
Table S3. Genes targeted for MLST and primers employed for generating PCR
amplicons for DNA sequencing.
Table S4. Genome sequencing and assembly metrics for urine and fecal isolates
obtained from patients 13 and 72 during their three episodes of UTI.
Table S5. Reference genomes used for OGU- and SNP-based analyses.
Table S6. Representation of known virulence factors in the genomes of the 26 isolates
from the present study and in 54 other E. coli genomes classified as complete in the
NCBI RefSeq database. (A) Distribution of virulence factors in each strain. “Reference
genome” refers to the sequenced genome whose annotation was used to assign “Gene
name”. (B) The number of virulence factors per virulence system (e.g. adherence, iron
update) represented in each of the 80 genomes.
15
Table S7. Comparison of YESCA pellicle, Congo Red staining, and swarming
phenotypes of strains EC72_E1U1, EC72_E3U1, and UTI89.
Table S8. Representation of genes involved in flagellar assembly and PTS-sorbose
systems in the 26 clinical isolates from the present study and in the 54 reference
complete E. coli genomes. (A) Flagellar assembly system. (B) Phosphotransferase
system (PTS) for L-sorbose.
Table S9. Representation of genes (OGUs) assigned to KEGG pathways in the shared
and variable components of the EC72_E1U1 and EC72_E3U1 genomes.