SUPPLEMENTARY MATERIALS FOR - media.nature.com fileconnected to videorecorder (Sertek Modell...
19
1 | Peleg-Raibstein et al. SUPPLEMENTARY MATERIALS FOR Enhanced sensitivity to drugs of abuse and palatable foods following maternal overnutrition Dr. Daria Peleg-Raibstein 1 *, MSc. Gitalee Sarker 1 , MSc. Kathrin Litwan 1 , Dr. Stefanie D. Krämer 2 , Prof. Simon M. Ametamey 2 , Prof. Roger Schibli 2 and Prof. Christian Wolfrum 1 1 Laboratory of Translational Nutrition Biology, ETH Zurich, Schorenstrasse 16, 8603 Schwerzenbach, Switzerland 2 Center for Radiopharmaceutical Sciences, ETH Zurich, Vladimir-Prelog-Weg 1-5/10, 8093 Zurich, Switzerland *Correspondence: Dr. D Peleg-Raibstein, Laboratory of Translational Nutrition Biology, ETH Zurich, Schorenstrasse 16, 8603 Schwerzenbach, Switzerland. E-mail: [email protected]. Tel. 0041 44 655 73 50. The file includes: Materials and Methods Results with statistics for all figures Tables 1 Figures 10 Supplementary figure ledges References
Transcript of SUPPLEMENTARY MATERIALS FOR - media.nature.com fileconnected to videorecorder (Sertek Modell...

1 | Peleg-Raibstein et al.
SUPPLEMENTARY MATERIALS FOR
Enhanced sensitivity to drugs of abuse and palatable foods following maternal
overnutrition
Dr. Daria Peleg-Raibstein1*, MSc. Gitalee Sarker1, MSc. Kathrin Litwan1, Dr. Stefanie D. Krämer2, Prof.
Simon M. Ametamey2, Prof. Roger Schibli2 and Prof. Christian Wolfrum1
1Laboratory of Translational Nutrition Biology, ETH Zurich, Schorenstrasse 16, 8603 Schwerzenbach, Switzerland
2Center for Radiopharmaceutical Sciences, ETH Zurich, Vladimir-Prelog-Weg 1-5/10, 8093 Zurich, Switzerland
*Correspondence: Dr. D Peleg-Raibstein, Laboratory of Translational Nutrition Biology, ETH Zurich,
Schorenstrasse 16, 8603 Schwerzenbach, Switzerland. E-mail: [email protected]. Tel. 0041 44 655
73 50.
The file includes:
Materials and Methods
Results with statistics for all figures
Tables 1
Figures 10
Supplementary figure ledges
References

2 | Peleg-Raibstein et al.
SUPPLEMENTARY MATERIALS AND METHODS
Phenotypic characterization of offspring
All offspring were weaned and sexed on postnatal day (PND) 21. Littermates of the same sex were
caged separately. Offspring from 28 independent litters (14 HFD, 14 Control) were randomly selected
for the behavioral, neurochemical, immunohistochemical, metabolic and PET tests. Both male and
female offspring were included in most of the tests described below to assess potential sex-
dependent effects 1 of maternal HFD exposure.
Maternal Behavior
Maternal behavior was measured in control and HFD dams in their home cage (5 dams per treatment
group). Observations for each litter began on PND 1 until PND 20, 5 observations per day: 7.30 am,
12.30 am, 16.30 pm, 22.30 pm, 2.30 am (3 observations conducted during the dark phase and 2
observations conducted during the light phase). The observations were conducted using a video
camera installed on the top of each cage (CMOS camera, 380 TVL, 3.6 mm, Conrad, Switzerland)
connected to videorecorder (Sertek Modell SERT16-679Z, Sertek, Switzerland). A score of “0” or “1”
depending whether each behavior category occurred or not. Each observation was scored for a
duration of 5 min 2. For the final analysis the frequency of each behavioral component was taken
across 1 min bins (yielding 5 samples per observation). We have monitored 5 maternal categories
which were described in detail elsewhere 3. (1) Carrying: the dam grasps the pup by its skin and
carries it to where the littermates are located. (2) Licking: the dams performs repetitive licking and
head movements whilst hovering over the pups. (3) Off nest: (4) Blanket nursing: The dam is over the
pups, relatively immobile, bilaterally symmetrical, with the head not depressed, and in a low dorsal
arch posture. (5) Arched back nursing: The dam lies on its side or on its back with some of the pups
attached to the nipples. The number of occurrences of each maternal behavior category was
summed within 5-day blocks (Days 1-5, 6-10, 11-15 and 16-20) 4.
Behavioral Testing
The short- and long-term behavioral effects of maternal HFD exposure were assessed when offspring
reached the prepubertal (PND 35-45) or the adult (PND 70-110) age. Prepubertal and adult stages of
development were defined based on the completion of sexual maturity and behavioral manifestation
5. Independent cohorts of animals were used for the behavioral experiments conducted during
prepuberty and adulthood to avoid potential confounding transfer effects from behavioral testing. A
naïve cohort of animals was used for neurochemical, neurohistochemical, molecular and PET
evaluations. When the analyses did not yield a main effect of sex or significant interaction of sex

3 | Peleg-Raibstein et al.
with maternal nutritional exposure the data of the two sexes were combined for the final analyses.
All testing was conducted during the dark phase of the light-dark cycle.
Conditioned place preference (CPP)
The apparatus used to carry out the conditioned place preference (CPP) consisted of two large
chambers containing explicitly different visual and tactile cues (wall color and floor material) that
were connected by a small shuttle chamber (neutral environment). A digital camera mounted above
the CPP apparatus captured images at a rate of 5 Hz and transmitted them to a personal computer
running the Ethovision tracking system (Noldus Technology), which calculated a mobility score
defined as the distance travelled per bin in successive 5 min bins. Additionally, the total time spent in
the compartment was indicated in seconds. All mice underwent a pre-conditioning test (Pre Test)
allowing them to freely explore the entire apparatus for one 15 min session. The measure for the Pre
Test session was the duration in seconds spent in each compartment. Mice were then randomly
assigned to saline/cocaine conditioning chambers for a total of eight conditioning sessions (cocaine
was paired with the less preferred compartment). On each of the four saline conditioning days (Days
1, 3, 5, 7) animals received an intraperitoneal (i.p.) injection of 0.9% NaCl (saline) and were confined
to the previously assigned saline-paired chamber for 30 min. For each of the four cocaine
conditioning days (Days 2, 4, 6, 8) animals received an i.p. injection of cocaine hydrochloride at a
dose of 20 mg/kg (Sigma–Aldrich, Switzerland) at a volume of 5 ml/kg dissolved in 0.9% NaCl− and
were confined to the cocaine-paired chamber for 30 min. The preference test (Post Test) was
performed 48 hours after the last conditioning day when mice were again permitted free access to all
chambers for 30 min. The total time spent in each chamber during the Pre Test and Post Test was
automatically recorded for subsequent statistical analyses.
Fat composition and distribution (CT-Scan)
Rodent computerized tomography allows to estimate the volumes of adipose tissue, bone, air, and
the remainder, using differences in X-ray density, and distinguishes between visceral and
subcutaneous adipose tissue. Measurements were performed non-invasively using a rodent
computerized tomography (CT) scanner (LaTheta). Before CT scanning, animals were anesthetized
using isoflurane (induction with 4-5% isoflurane in 600 cc O2) and maintained under gas anesthesia
(1.5-2.5 % isoflurane in 300 cc O2) throughout the scan, which lasted about 5 min.
Energy expenditure and activity (Metabolic Cages)
Measurements of food and water intake, O2 consumption/CO2 production, were performed in an
automatic feeding monitoring system coupled to an open-circuit indirect calorimetry system (TSE
Phenomaster System). Mice were single housed under thermoneutral temperature conditions, food
and water were available ad libitum and constantly monitored. Each cage was connected to a fresh
air supply as well as the sample switch unit for drawing air samples from each cage. Cages (n=12)

4 | Peleg-Raibstein et al.
were enclosed in a ventilated cabinet to precisely control ambient temperature and light. (control, f
n=6; control, m n=6; HFD, f n=6, HFD, m n=6).
Insulin tolerance test (ITT)
Mice were food deprived overnight (12h-15h), but not water deprived. In the middle of the dark
phase a 5 µL drop of tail blood was taken for baseline glycemia. Blood glucose was measured with a
blood glucose monitor and the associated glucose test strips for glucose measurement (Accu-Check
Aviva). Mice then received an i.p. injection of insulin (0.75 mU insulin/kg body weight, 10 µL of
insulin solution/g body weight) and subsequent blood sampling (5 µL each time point) were collected
at 15, 30, 60, 90 and 120 min post injection.
PET Scan
[18F]fallypride was synthesized from its precursor tosyl-fallypride (ABX GmbH, Radeberg, Germany)
according to 6. Radiochemical yield was 20 % (decay corrected), radiochemical purity > 96 % and
specific activity at the end of synthesis between 56 and 84 GBq/µmol. PET/CT scans were performed
with an Argus (formerly VISTA eXplore) small-animal scanner (Sedecal, Madrid, Spain). Mice (n=6 for
each group) were immobilized by isoflurane in air/oxygen (4-5 % for induction, 2-3 % to maintain
anesthesia) and 10 min before [18F]fallypride injection and scan start, D-amphetamine (2.5 mg D-
amphetamine sulphate per kg body weight, 0.5 mg/mL in saline) or an equivalent volume of saline
(baseline) was injected i.p. at time zero, 10 to 14 MBq (0.17 to 1.1 nmol) [18F]fallypride was injected
into a tail vein on the scanner bed and a dynamic PET scan of 60 min duration was started
simultaneously. Body temperature was kept at 37°C and respiration rate around 60 per minute. A CT
scan was performed at the end of the PET scan for anatomical orientation. PET data was
reconstructed into twelve 1 min and twelve 4 min frames by a two-dimensional-ordered subset
expectation maximization algorithm (2D-OSEM, 2 iterations, 16 subsets) with scatter and random but
not attenuation correction. The voxel size of the reconstructed images was 0.3875 × 0.3875 × 0.775
mm3.
PET quantitative analysis
PET data were analysed with the image analysis software PMOD (PMOD Inc., Zurich, Switzerland) and
Microsoft excel. PET images were matched to the CT images and brain regions were delineated
according to the mouse brain template implemented in PMOD. The volume of the combined striatum
regions was 149 mm3. Time-activity curves of brain regions were generated and binding potentials
(BPND) were calculated by the Logan reference tissue analysis 7, where t*, the time to reach
equilibration was 18 min and correction for k2 (brain to blood rate constant) was neglected. A sphere
in the cerebellum region of 52 mm3 was used as the reference region 7. Tracer concentrations in the
reference region were calculated from the PET data and the specific radioactivity and scans with >
6.5 nM at 40 min after injection were excluded from the analysis, as receptor saturation with tracer
was observed for these scans (data not shown). For each group, 6 scans were finally included in the
5 | Peleg-Raibstein et al.
statistical analysis. PET images of the binding potentials (BPnd) were generated with the PXMod
module of PMOD. The resulting images of the three scans with lowest tracer concentration per group
were averaged.
Immunohistochemistry
Adult (PND90) offspring were deeply anesthetized with an overdose of Nembutal (Abbott
Laboratories) and perfused transcardially with 0.9% NaCl, followed by 4% phosphate-buffered
paraformaldehyde solution containing 15% picric acid. The dissected brains were post fixed in the
same fixative for 6 h and processed for antigen retrieval involving overnight incubation in citric acid
buffer, pH 4.5, followed by a 90 s microwave treatment at 480. The brains were then cryoprotected
using 30% sucrose in PBS, frozen with powdered dry ice, and stored at −80°C until further processing.
Perfused brain samples were cut coronally at 30 μm thickness from frozen blocks with a sliding
microtome. Six series of sections were collected, rinsed in PBS, and stored at −20°C in antifreeze
solution until further processing. For immunohistochemical staining, the slices were rinsed three
times for 10 min in PBS, and blocking was done in PBS, 0.3% Triton X-100, 5% normal serum for 1 h at
room temperature. The following primary antibodies were used to study dopamine-related markers
in various brain areas according to protocols established previously 8: rabbit anti-TH (Santa Cruz
Biotechnology; diluted 1:500), rat anti-dopamine D1 receptor (D1R) antibody (Sigma-aldrich; diluted
1:1000), rabbit anti-dopamine D2 receptor (D2R) antibody (AB5084P, Millipore Bioscience Research
Reagents; diluted 1:500) and rat anti-dopamine transporter (DAT) antibody (MAB 369,Chemicon;
diluted 1:3000). The tyrosine hydroxylase (TH) antibody (H-196) corresponds to 1-196 amino acids
(with a deletion at 31-61) of human origin and the specificity of this antibody was previously
reported 9.The D1R antibody (D2944) used recognizes 97 amino acids at the C-terminal end of the
human D1R and its specificity was previously reported and validated 10, 11. The D2R antibody was
raised by immunizing rabbit against a peptide corresponding to 28 amino acid peptide sequence
from the human D2R. The D2R antibody has previously been shown to be a specific and reliable
marker to label D2Rs 10, 12, 13. We confirmed it by using the dopamine D2R blocking peptide (AG221;
Millipore Bioscience Research Reagents) which consists of 28 amino acid peptide sequence from the
human D2R and is manufactured to block the staining of D2R antibody (AB5084P, Millipore
Bioscience Research Reagents). Prior to immunostaining, the blocking peptide (50ug/ml) was mixed
with D2R primary antibody (10ug/ml) in PBS containing 0.3% Triton X-100 and 2% normal goat
serum. As control, only D2R primary antibody (10ug/ml) was added in PBS containing 0.3% Triton X-
100 and 2% normal goat serum. Both solutions with or without blocking peptide were then incubated
for 2 hours at room temperature. The staining was performed in two identical groups of brain
sections, using the blocked antibody for one and the control for the other. Our result clearly
demonstrates that the D2R staining observed in the medial prefrontal cortex (mPFC), dorsal striatum
(DSTR) and nucleus accumbens (NAc) of the samples treated with the primary antibody (Suppl Figure
10. a-c) has been disappeared in the samples treated with the blocked antibody (Suppl Figure 10. D-
f). The DAT antibody (MAB369) used recognizes N-terminus of human dopamine transporter fused to

6 | Peleg-Raibstein et al.
Glutathione S-transferase and it is a common and reliable marker to label DAT 14. All antibodies were
diluted in PBS containing 0.3% Triton X-100 and 2% normal serum, and the sections were incubated
free-floating overnight at room temperature. After three washes with PBS (10 min each), the sections
were incubated for 1 h with the biotinylated secondary antibodies diluted 1:500 in PBS containing 2%
NGS and 0.3% Triton X-100. Sections were washed again three times for 10 min in PBS and incubated
with Vectastain kit (Vector Laboratories) diluted in PBS for 1 h. After three rinses in 0.1 m Tris-HCl, pH
7.4, the sections were stained with 1.25% 3,3-diaminobenzidine and 0.08% H2O2 for 10–15 min,
rinsed again four times in PBS, dehydrated, and coverslipped with Eukitt (Kindler).
Stereological estimation of TH-positive dopaminergic midbrain neurons
The numbers of midbrain TH-positive dopamine neurons were quantified in the two relevant
midbrain areas, namely in the ventral tegmental area (VTA) and substantia nigra (SN). For the latter
region, TH-positive cells in both the substantia nigra pars compacta (SNc) and substantia nigra pars
reticulata (SNr) were taken into account. The numbers of midbrain TH-positive dopamine neurons in
either the left or right brain hemisphere were determined by unbiased stereological estimations
using the optical fractionator method 15. With the aid of the image analysis computer software
Stereo Investigator (version 6.50.1; MicroBrightField), every section of a one-in-six series was
measured, resulting in an average of six sections per brain sample. The following sampling
parameters were used: (1) a fixed counting frame with a width of 40 μm and a length of 40 μm; and
(2) a sampling grid size of 150 × 110 μm. The counting frames were placed randomly at the
intersections of the grid within the outlined structure of interest by the software. The cells were
counted following the unbiased sampling rule using the 40× oil lens [numerical aperture (NA), 1.3]
and included in the measurement when they came into focus within the optical dissector 16.
Optical densitometry of dopaminergic markers in prefrontal cortical and striatal regions
Quantification of the immunoreactivity for TH, DAT, D1R, and D2R in striatal regions was achieved by
means of optical densitometry using NIH ImageJ software. Optical densitometry was chosen because
these dopaminergic markers are highly enriched at synaptic sites in the areas of interest. Digital
images were acquired at a magnification of 2.5× (NA 0.075) using a digital camera (Axiocam MRc5;
Zeiss) mounted on a Zeiss Axioplan microscope. Exposure times were set so that pixel brightness was
never saturated. Pixel brightness was measured in the respective areas of one randomly selected
brain hemisphere. In addition, pixel brightness was measured in the corpus callosum (for striatal
measures) as background area. The background-corrected optical densities were averaged per brain
region and animal. Four to six sections per animal were analyzed in the specimens. All
immunohistochemical preparations were quantified in the dorsal striatum [caudate–putamen (CPu)],
nucleus accumbens core (NAc core), and nucleus accumbens shell (NAc shell) (see below).
Delineation of brain regions

7 | Peleg-Raibstein et al.
All brain areas of interest were delineated according to The Mouse Brain in Stereotaxic Coordinates
by Franklin and Paxinos 17. The following brain areas were included in the densitometric and
stereological analyses: CPu (bregma +1.34 to +0.14 mm), NAc core and shell (bregma +1.60 to +0.98
mm), SN (bregma −2.80 to −3.64 mm), and VTA (bregma −2.92 to −3.64 mm). Schematic coronal
brain sections of the brain areas of interest with reference to bregma are provided in corresponding
figure legends.
Post-mortem neurochemistry
Levels of dopamine (DA) and its metabolites (dihydroxyphenylacetic acid, DOPAC; homovanillic acid,
HVA) were determined using high performance liquid chromatography (HPLC) according to
procedures established before 8, 18. Animals assigned to the post-mortem neurochemical
investigations were killed by decapitation on PND 70. HFD and control offspring were killed and
dissected in random order. The brains were extracted from the skull within 1 min after decapitation
and immediately frozen on dry ice and then were stored at -80 °C until dissection of the brain. For
dissection, the frozen brain was placed ventral side up on an ice-chilled plate covered with filter
paper and was cut with a razor blade into 1 mm thick coronal sections. The slices were placed on an
ice cold dissection plate for the removal of discrete brain regions, using a 1 mm micropunch for the
dorsal striatum (dSTR), medial prefrontal cortex (mPFC; including anterior cingulate and prelimbic
cortices), nucleus accumbens (NAc; including core and shell subregions), substantia nigra (SN) and
ventral tegmental area (VTA). Coronal sections were prepared along the following coordinates with
respect to bregma: anterior-posterior +2.3 to+1.3, +1.3 to +0.3, –0.1 to –0.6, –1.2 to –2.2, and –2.8 to
–3.8. Tissue punches from the left and right hemispheres of each brain area of interest were
combined, weighed and placed in 1.5 ml polypropylene microcentrifuge tubes containing ice cold 300
μl 0.4M HClO4 and homogenized using ultrasound. After centrifugation at 10,000×g for 20 min at 4
˚C, the clear supernatant layers were removed into a 1 ml syringe and filtered through a 0.2 μm nylon
filter to separate the insoluble residue. This solution was immediately frozen and stored at −80 ˚C
until injection onto the HPLC system. For all brain regions an aliquot of 20 μl was injected in the HPLC
system.
Chromatographic conditions for detection of monoamines and metabolites
A HPLC system coupled with an amperometric electrochemical detector (Decade II; Antec, Leyden,
The Netherlands) was used to determine concentrations of DA, dihydroxyphenylacetic acid (DOPAC),
and homovanillic acid (HVA). The samples were injected via a refrigerated autoinjector (ASI-100,
Dionex, CA, USA) equipped with a 100 μl injection loop. The samples were separated on a reversed-
phase column (125mm×3mm YMC column, Nucleosil 120-3 C 18, YMC Europe GmbH, Germany). An
HPLC pump (P680, Dionex, CA, USA) connected to a pulse damper and a degasser was used to pump
the mobile phase (see below) throughout the system. The working potential of the electrochemical
glassy carbon flow cell (VT-03; Antec, Leyden, Netherlands) was +0.70V versus an ISAAC reference

8 | Peleg-Raibstein et al.
electrode. A chromatography workstation (Chromeleon, Dionex, Olten, Switzerland) was used for
data acquisition and calculations. The mobile phase consisted of 250 ml of HPLC-grade acetonitrile, 5l
of aqueous solution containing 0.27mM sodium ethylendiammoniumtetraacetate
(C10H14N2O8Na2•2H2O), 0.43mM triethylamine (C6H15N), 8 mM potassium chloride, and 0.925 mM
octanesulphonic acid (C8H17O3SNa) which acted as an ion pairing reagent. The pH was adjusted to
2.95 by adding concentrated phosphoric acid. This was pumped through the system at a flow rate of
0.4 ml/min. The position and height of the peaks of the endogenous components were compared
with samples of external calibrating standard solutions.
Quantification of mRNA for deltaFosB (real-time PCR)
For dissection, fresh brains from both offspring groups (N = 16 per group) were cut with a razor blade
into 1 mm thick coronal sections. The slices were placed on an ice cold dissection plate for the
removal of the dorsal striatum and nucleus accumbens using a 1 mm micropunch. Coronal sections
were prepared along the coordinates mentioned above. For storage the tissue was frozen at −80°C.
RNA from tissue was extracted using the Trizol-chloroform method (Invitrogen), treated with DNase
(Ambion, Austin, Texas) for 30 min at 37°C, then converted to cDNA using High Capacity cDNA
Reverse Transcription Kit [Applied Biosystems (ABI), Foster City, CA)]. 10 ng of cDNA was analyzed by
real-time PCR using SYBR Green master mix (ABI) and the ΔΔCt relative comparison method, where
target gene expression was normalized to expression of the housekeeping gene Gapdh. The forward
primer of deltaFosB was 5’-AGGCAGAGCTGGAGTCGGAGAT-3’ and the reverse primer was 5’-
GCCGAGGACTTGAACTTCACTCG-3’.
RESULTS WITH STATISTICS
Maternal Behavior
A 2 x 5 x 4 repeated measures ANOVA (treatment x observation sessions per day x 5-day blocks) was
employed to assess differences in the 5 categories of maternal behavior.
Nursing behavior: The frequency of occurrence of this posture declined significantly through the
lactation period (F3,24 = 4.43; P < 0.02). Control and HFD mothers showed similar changes in the
total amount of nursing as evident by the lack of significant treatment x 5-day block interaction.
Licking/grooming: licking/grooming behavior generally decreased toward weaning (F3,24 = 4.43; P <
0.02) and was significantly more frequent in the light phase and licking/grooming occurred at the
highest level on block Day 1-5 leading to a significant observations sessions per day x 5-day blocks
interaction (F12,96 = 2.03; P < 0.03). There was no significant between control and HFD dams.

9 | Peleg-Raibstein et al.
Carrying: Carrying decreased constantly across the lactation period as indicated by the significant
main effect of 5-day block (F3,24 = 3.27; P < 0.04). No significant difference was detected between
control and HFD mothers as was evident by a non-significant effect of treatment, either as a main
effect or in interaction with 5-day block.
Mother off pups: out of nest behavior gradually increased during the lactation period leading to a
significant main effect of 5-day block (F3,27 = 4.03; P < 0.02). Changes across days did not differ
between control and HFD mothers. The main effect of treatment or its interaction with 5-day block
did not attain statistical significance. Mothers off pups behavior was significantly more frequent in
the dark phase, supported by a main effect of observations sessions per day (F4,36 = 12.22; P <
0.0001).
Passive nursing: passive nursing increased in the first 5-day block, Days 1-5, and then consistently
declined as supported by a significant main effect of 5-day block (F3,24 = 8.32; P < 0.0007). There was
no significant effect of treatment on passive nursing scores and there was no significant differences
between the observation sessions per day.
Mothers’ metabolic parameters
Mothers’ body weight
Mothers’ body weights prior to gestation and following 3 weeks of HFD exposure did not show any
differences between mothers exposed to HFD and mothers exposed to the control diet (F1,27 = 2.10;
P = n.s.; Supp Fig. 1a-d).
Supp Fig. 1.
Mothers’ plasma metabolic parameters
Mothers’ glucose levels prior to conception, after birth and after weaning did not yield any
differences between mothers exposed to HFD and mothers exposed to the control diet (Supp Fig. 2a-

10 | Peleg-Raibstein et al.
d). Similarly, no differences were detected between HFD and control dams in cholesterol,
triglycerides, free fatty acids and insulin levels in blood after birth (Supp Fig. 3a-e).
Supp Fig. 2.
Supp Fig. 3.
Mothers’ fat composition and distribution (CT-Scan)
In addition, mothers’ CT-scan utilized after birth did not reveal any differences in the lean mass, total
fat, %fat ratio, the subcutaneous and the visceral fat between the HFD and control dams (Supp Fig.
4a-e).

11 | Peleg-Raibstein et al.
Supp Fig. 4.
Prepubertal (PND 35-45)
Amphetamine-induced locomotor activity
An ANOVA revealed no differences in locomotor activity between control and HFD offspring during
the baseline and saline injection phases. Furthermore, following the amphetamine injection both
offspring groups reacted in enhanced locomotor activity in response to the drug as indicated by a
significant main effect of time (F11,66 = 19.46, P < 0.0001; Supp Fig. 5).
Supp Fig. 5.

12 | Peleg-Raibstein et al.
Supp Fig. 6.
Chow food intake (metabolic cages)
Both offspring born to HFD and control exposed mothers did not differ in consumption of chow diet
during the light and dark cycle (F1,20 = 0.04). Animals ate more during the dark cycle than during the
light cycle. This observation was supported by a 2 x 2 x 2 ANOVA (Treatment x Sex x Cycle) which
revealed a significant main effect of Cycle (F1,20 = 159.86; P < 0.0001). There was no significant
difference in food intake between female and male offspring (Supp Fig. 7).
Supp Fig. 7.
Table 1.
13 | Peleg-Raibstein et al.
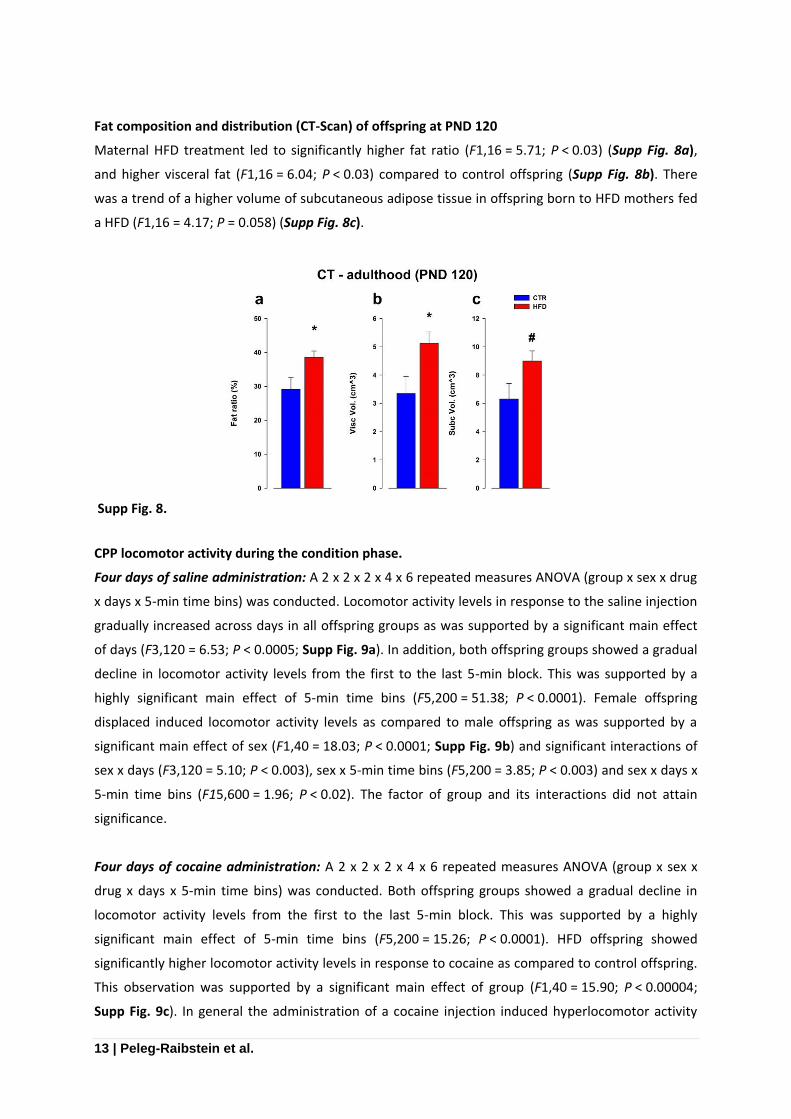
Fat composition and distribution (CT-Scan) of offspring at PND 120
Maternal HFD treatment led to significantly higher fat ratio (F1,16 = 5.71; P < 0.03) (Supp Fig. 8a),
and higher visceral fat (F1,16 = 6.04; P < 0.03) compared to control offspring (Supp Fig. 8b). There
was a trend of a higher volume of subcutaneous adipose tissue in offspring born to HFD mothers fed
a HFD (F1,16 = 4.17; P = 0.058) (Supp Fig. 8c).
Supp Fig. 8.
CPP locomotor activity during the condition phase.
Four days of saline administration: A 2 x 2 x 2 x 4 x 6 repeated measures ANOVA (group x sex x drug
x days x 5-min time bins) was conducted. Locomotor activity levels in response to the saline injection
gradually increased across days in all offspring groups as was supported by a significant main effect
of days (F3,120 = 6.53; P < 0.0005; Supp Fig. 9a). In addition, both offspring groups showed a gradual
decline in locomotor activity levels from the first to the last 5-min block. This was supported by a
highly significant main effect of 5-min time bins (F5,200 = 51.38; P < 0.0001). Female offspring
displaced induced locomotor activity levels as compared to male offspring as was supported by a
significant main effect of sex (F1,40 = 18.03; P < 0.0001; Supp Fig. 9b) and significant interactions of
sex x days (F3,120 = 5.10; P < 0.003), sex x 5-min time bins (F5,200 = 3.85; P < 0.003) and sex x days x
5-min time bins (F15,600 = 1.96; P < 0.02). The factor of group and its interactions did not attain
significance.
Four days of cocaine administration: A 2 x 2 x 2 x 4 x 6 repeated measures ANOVA (group x sex x
drug x days x 5-min time bins) was conducted. Both offspring groups showed a gradual decline in
locomotor activity levels from the first to the last 5-min block. This was supported by a highly
significant main effect of 5-min time bins (F5,200 = 15.26; P < 0.0001). HFD offspring showed
significantly higher locomotor activity levels in response to cocaine as compared to control offspring.
This observation was supported by a significant main effect of group (F1,40 = 15.90; P < 0.00004;
Supp Fig. 9c). In general the administration of a cocaine injection induced hyperlocomotor activity

14 | Peleg-Raibstein et al.
compared to the saline injection in both control and HFD offspring as was supported by a significant
main effect of drug (F1,40 = 108.51; P < 0.0001). Female offspring displaced induced locomotor
activity levels as compared to male offspring as was supported by a significant sex x days interaction
(F3,120 = 5.10; P < 0.003; Supp Fig. 9d) and a significant sex x 5-min time bins interaction
(F5,200 = 3.92; P < 0.003).
Supp Fig. 9

15 | Peleg-Raibstein et al.
Supp Fig. 10

16 | Peleg-Raibstein et al.
SUPPLEMENTARY FIGURE LEGENDS
Supp Fig. 1
The body weights of dams exposed to either control or HFD diets were monitored before mating (a),
during middle of gestation (b), after birth (c) and following weaning (d). No difference in body weight
was detected between dams exposed to either control or HFD during the 4 different time periods.
Supp Fig. 2
Glucose levels of dams either exposed to control or HFD diets were monitored prior to conception
(a), middle of gestation (b), after birth (c) and after weaning (d). There were no significant difference
in glucose levels between mothers exposed to HFD and mothers exposed to the control diet.
Supp Fig. 3
Plasma metabolic parameters of dams exposed to either control or HFD diets were examined
following weaning. No differences were detected between HFD and control dams in cholesterol (a),
triglycerides (b), free fatty acids (FFA, c) and insulin blood levels (d) following birth.
Supp Fig. 4
CT-scan of dams exposed to either control or HFD diet utilized after birth did not reveal any
differences in the lean mass (a), total fat, %fat ratio (b), the subcutaneous (c) and the visceral fat (d)
between the HFD and control dams.
Supp Fig. 5
Locomotor reaction to systemic treatment with amphetamine: Locomotor activity in the open field
expressed as distance traveled (cm) per 10-min bin during the initial baseline phase, following saline
administration and following a systemic injection of amphetamine (2.5 mg/kg, i.p.).
Supp Fig. 6
Metabolic parameters measured from blood samples taken from HFD and control offspring at
postnatal day 45. No significant changes in circulating metabolic parameters such as cholesterol,
insulin, triglyceride and free fatty acid (FFA) levels were detected between control and HFD offspring
(Fig. 7a-d).
Supp Fig. 7
The intake of normal laboratory chow of HFD and control offspring was monitored in the metabolic
chambers. Both offspring born to HFD and control exposed mothers did not differ in consumption of
chow diet during the light and dark cycle.
Table 1.

17 | Peleg-Raibstein et al.
Energy balance monitored in the metabolic cages. Both offspring born to HFD and control exposed
mothers did not differ in any of the parameters observed during the light and dark cycle: food intake,
energy expenditure [VO2 consumption, respiratory exchange ratio (RER)] and physical activity.
Supp Fig. 8
Fat composition and distribution as measured with a computerized tomography (CT-Scan) displayed
changes in fat disruption between HFD and control offspring. Maternal HFD treatment led to
significantly higher fat ratio (a), higher visceral fat (b) compared to control offspring. Additionally, a
trend was detected in subcutaneous adipose tissue in offspring born to HFD mothers compared to
controls (c). *p < 0.05; #p = 0.06.
Supp Fig. 9.
Conditioned place preference (CPP) during each of the eight conditioning days. Offspring from both
control and HFD groups were allocated to either saline or cocaine injections over a period of 8 days.
a. Four saline conditioning days (days 1, day 3, day 5 and day 7). Offspring allocated to saline
treatment received an injection of saline solution (0.9% NaCl). b. Female offspring showed enhanced
locomtor activity levels compared to male offspring across the 4 days of saline injections. c. Four
cocaine conditioning days (days 2, day 4, day 6 and day 8). Offspring allocated to cocaine treatment
received a cocaine hydrochloride injection at a dose of 20 mg/kg and were confined to the cocaine-
paired chamber for a period of 30 min. d. Female offspring showed enhanced locomtor activity levels
compared to male offspring across the 4 days of cocaine injections.
Supp Fig. 10.
Dopamine receptor 2 (D2R) antibody specificity test. Representative images of coronal sections
treated with the primary antibody (D2R) in the brain regions (a) medial prefrontal cortex (mPFC), (b)
dorsal striatum and (c) nucleus accumbens (NAc). Representative images of coronal sections treated
with the blocked antibody in the brain regions (d) medial prefrontal cortex (mPFC), (e) dorsal
striatum and (f) nucleus accumbens (NAc).

18 | Peleg-Raibstein et al.
REFERENCES
1. Clayton JA, Collins FS. Policy: NIH to balance sex in cell and animal studies. Nature 2014; 509(7500): 282-283.
2. Shoji H, Kato K. Maternal behavior of primiparous females in inbred strains of mice: a
detailed descriptive analysis. Physiol Behav 2006; 89(3): 320-328. 3. Pryce CR, Bettschen D, Feldon J. Comparison of the effects of early handling and early
deprivation on maternal care in the rat. Dev Psychobiol 2001; 38(4): 239-251. 4. Myers MM, Brunelli SA, Squire JM, Shindeldecker RD, Hofer MA. Maternal behavior of SHR
rats and its relationship to offspring blood pressures. Dev Psychobiol 1989; 22(1): 29-53. 5. Spear LP. The adolescent brain and age-related behavioral manifestations. Neurosci Biobehav
Rev 2000; 24(4): 417-463. 6. Mukherjee J, Yang ZY, Das MK, Brown T. Fluorinated benzamide neuroleptics--III.
Development of (S)-N-[(1-allyl-2-pyrrolidinyl)methyl]-5-(3-[18F]fluoropropyl)-2, 3-dimethoxybenzamide as an improved dopamine D-2 receptor tracer. Nucl Med Biol 1995; 22(3): 283-296.
7. Muller Herde A, Keller C, Milicevic Sephton S, Mu L, Schibli R, Ametamey SM, et al.
Quantitative positron emission tomography of mGluR5 in rat brain with [(18) F]PSS232 at minimal invasiveness and reduced model complexity. J Neurochem 2015; 133(3): 330-342.
8. Peleg-Raibstein D, Knuesel I, Feldon J. Amphetamine sensitization in rats as an animal model
of schizophrenia. Behav Brain Res 2008; 191(2): 190-201. 9. Collo G, Bono F, Cavalleri L, Plebani L, Merlo Pich E, Millan MJ, et al. Pre-synaptic dopamine
D(3) receptor mediates cocaine-induced structural plasticity in mesencephalic dopaminergic neurons via ERK and Akt pathways. J Neurochem 2012; 120(5): 765-778.
10. Romero-Fernandez W, Borroto-Escuela DO, Vargas-Barroso V, Narvaez M, Di Palma M, Agnati
LF, et al. Dopamine D1 and D2 receptor immunoreactivities in the arcuate-median eminence complex and their link to the tubero-infundibular dopamine neurons. Eur J Histochem 2014; 58(3): 2400.
11. Mitrano DA, Pare JF, Smith Y, Weinshenker D. D1-dopamine and alpha1-adrenergic receptors
co-localize in dendrites of the rat prefrontal cortex. Neuroscience 2014; 258: 90-100. 12. Vuillermot S, Joodmardi E, Perlmann T, Ogren SO, Feldon J, Meyer U. Prenatal immune
activation interacts with genetic Nurr1 deficiency in the development of attentional impairments. J Neurosci 2012; 32(2): 436-451.
13. Willi R, Weinmann O, Winter C, Klein J, Sohr R, Schnell L, et al. Constitutive genetic deletion
of the growth regulator Nogo-A induces schizophrenia-related endophenotypes. J Neurosci 2010; 30(2): 556-567.
14. Meyer U, Nyffeler M, Yee BK, Knuesel I, Feldon J. Adult brain and behavioral pathological
markers of prenatal immune challenge during early/middle and late fetal development in mice. Brain Behav Immun 2008; 22(4): 469-486.

19 | Peleg-Raibstein et al.
15. Gundersen HJ, Bendtsen TF, Korbo L, Marcussen N, Moller A, Nielsen K, et al. Some new,
simple and efficient stereological methods and their use in pathological research and diagnosis. Apmis 1988; 96(5): 379-394.
16. Howard CV, Reed MG. Unbiased stereology: three-dimensional measurement in microscopy,
Second Edition edn. Garland Science/BIOS Scientific, New York, 2004. 17. Franklin KBJ, Paxinos G. The mouse brain in stereotaxic coordinates Elsevier Academic,
Amsterdam, 2008. 18. Peleg-Raibstein D, Pezze MA, Ferger B, Zhang WN, Murphy CA, Feldon J, et al. Activation of
dopaminergic neurotransmission in the medial prefrontal cortex by N-methyl-d-aspartate stimulation of the ventral hippocampus in rats. Neuroscience 2005; 132(1): 219-232.