Supplementary Materials for -...
12
www.sciencemag.org/content/348/6232/336/suppl/DC1 Supplementary Materials for Anthropogenic environmental changes affect ecosystem stability via biodiversity Yann Hautier,* David Tilman, Forest Isbell, Eric W. Seabloom, Elizabeth T. Borer, Peter B. Reich *Corresponding author. E-mail: [email protected] Published 17 April 2015, Science 348, 336 (2015) DOI: 10.1126/science.aaa1788 This PDF file includes: Materials and Methods Figs. S1 and S2 Tables S1 to S4 References
Transcript of Supplementary Materials for -...

www.sciencemag.org/content/348/6232/336/suppl/DC1
Supplementary Materials for
Anthropogenic environmental changes affect ecosystem stability via biodiversity
Yann Hautier,* David Tilman, Forest Isbell, Eric W. Seabloom, Elizabeth T. Borer, Peter
B. Reich
*Corresponding author. E-mail: [email protected]
Published 17 April 2015, Science 348, 336 (2015) DOI: 10.1126/science.aaa1788
This PDF file includes:
Materials and Methods Figs. S1 and S2 Tables S1 to S4 References

2
Materials and Methods
The 12 multi-year field experiments were all performed at Cedar Creek Ecosystem Science Reserve, Bethel, MN. Our experiments manipulated one or more of the following drivers: biodiversity, nitrogen, water, CO2, fire, and herbivory (Table 1). Responses reported here focus on effects of single factors. Responses to treatments were measured over the whole duration for each experiment (“long-term”; 4 to 28 years) and, when possible, over overlapping intervals of three consecutive years (“short-term”).
For all analyses presented here and for each experiment, we first calculated the mean and standard deviation of aboveground biomass production over time within each plot. We then calculated the mean and standard deviation response as the natural logarithm of the ratio of the mean and standard deviation within each treatment plot divided by the average mean and standard deviation across all reference plots for a treatment. Stability response (lrr.S) was then calculated as the difference between the log response ratio of the mean (lrr.mean) and the log response ratio of the standard deviation (lrr.SD). Similarly, richness response was calculated as the natural log of the ratio of the temporal mean of richness within each treatment plot divided by the average temporal mean of richness in the reference plots (lrr.rich). Each variable has one value per treatment plot for each experiment (total of 578 treatment plots across all experiments) that summarizes temporal values derived from > 9,900 biomass measurements across all years of all treatment plots and from >2,400 biomass measurements from the various reference plots (total of 186 reference plots) associated with the various experiments. All analyses were conducted in R 2.15.1 (32).
We used mixed effect models to evaluate the influence on stability of changes in richness resulting from experimental manipulation or in response to other anthropogenic drivers. Experiments and anthropogenic drivers of environmental change grouped in six categories were treated as random effect allowing both the intercepts and slopes of regression versus diversity to vary between drivers if supported by model selection. Our analyses allowed us to test for biodiversity mediated effects on stability. However, in contrast to the experimental manipulation of biodiversity where the direction of the causality between changes in biodiversity and changes in stability is clearly identified, similarly to previous studies (11, 33) we assumed that changes in biodiversity in response to anthropogenic drivers including N, CO2, water, fire and herbivore, caused changes in ecosystem stability, rather than the inverse. Note that testing the effect of productivity on biodiversity would require manipulating productivity independently of abiotic factors, as biodiversity experiments have done. While our mixed effects model approach allows us testing biodiversity-mediated effects on stability, it does not allow us testing effects of anthropogenic drivers on stability independently of their effects on biodiversity. To evaluate the direction and magnitude of effect sizes on mean, SD and stability among drivers, we used ANOVA on the untransformed data from all years that kept the sign (i.e., + or -) of the effect on the response.
To evaluate the influence of shifts in the abundances of functional groups through time on productivity, functional groups were grouped in four categories including C3

3
grasses, C4 grasses, forbs and legumes and calendar years were turned into chronological years after treatment was applied (post treatment year). We conducted an analysis of covariance to test whether aboveground biomass production depended on post treatment year, functional groups, anthropogenic drivers of environmental change, or their interaction. Aboveground biomass production was log transformed to ensure normality.
To test for temporal trends in stability and diversity responses to drivers, we used
data on overlapping intervals of three consecutive years. We turned the three-years intervals into single values representing the chronological year after treatment was applied (post treatment period), such that year 1-3 became post treatment period 1, year 2-4 became post treatment period 2, year 3-5 became post treatment period 3, and so on. We conducted an analysis of covariance to test whether the log response ratio of diversity and stability depended on the post treatment period, anthropogenic drivers of environmental change, or their interaction.
Detailed methods and original data can be found at
http://www.cedarcreek.umn.edu/research/data. Use of data must be in accordance with the conditions agreed to in the Cedar Creek Ecosystem Science Reserve Data Access Policy. Each Cedar Creek research project is assigned an “experiment number”, such as “e001” (see column five in Table S1 for the experiment number of each experiment used in this study). Data for each experiment can be accessed using the dropdown “Experiments” menu in the box “Search Data”. For example to access experiment “e120”, scroll down the “Experiments” menu in the box “Search Data” and click “e120: Biodiversity II: Effects of Plant Biodiversity on Population and Ecosystem Processes”. Then click the box “search” and access the plant aboveground biomass data by clicking on “ple120” in the column “Dataset ID” of the box “Signature research”. This will open a new window where the dataset can be downloaded in “TEXT FORMAT”, “HTML FORMAT” or “EML FORMAT” by clicking on the corresponding link in the box “Download dataset lpe120”. Data for each experiment can also be directly accessed by clicking on the links provided in column six of Table S1. For example to access experiment “e120” click on http://www.cedarcreek.umn.edu/research/data/dataset?ple120 and then choose the format by clicking on the corresponding link in the box “Download dataset lpe120”. The first time you access the data you will have to create an account in order to log in by clicking on the link “Click here to create a new account” and agree with the code of ethics and rules for use.

4
Fig. S1.
Relationship between observed changes in stability of productivity in response to anthropogenic drivers and predicted changes in stability based on biodiversity manipulations. The biodiversity experiments slightly underestimated the effects of realistic biodiversity losses on stability in the anthropogenic change experiments; the slope (slope and 95% confidence intervals: 1.86 (1.37 to 2.34)) is greater than the slope of 1.0 expected for a 1:1 match between observed and predicted values (dashed line). The slopes of the change in biodiversity versus the change in stability in both experiment types were not significantly different (F1,561 = 3.29, P = 0.07; Fig. 1).
5
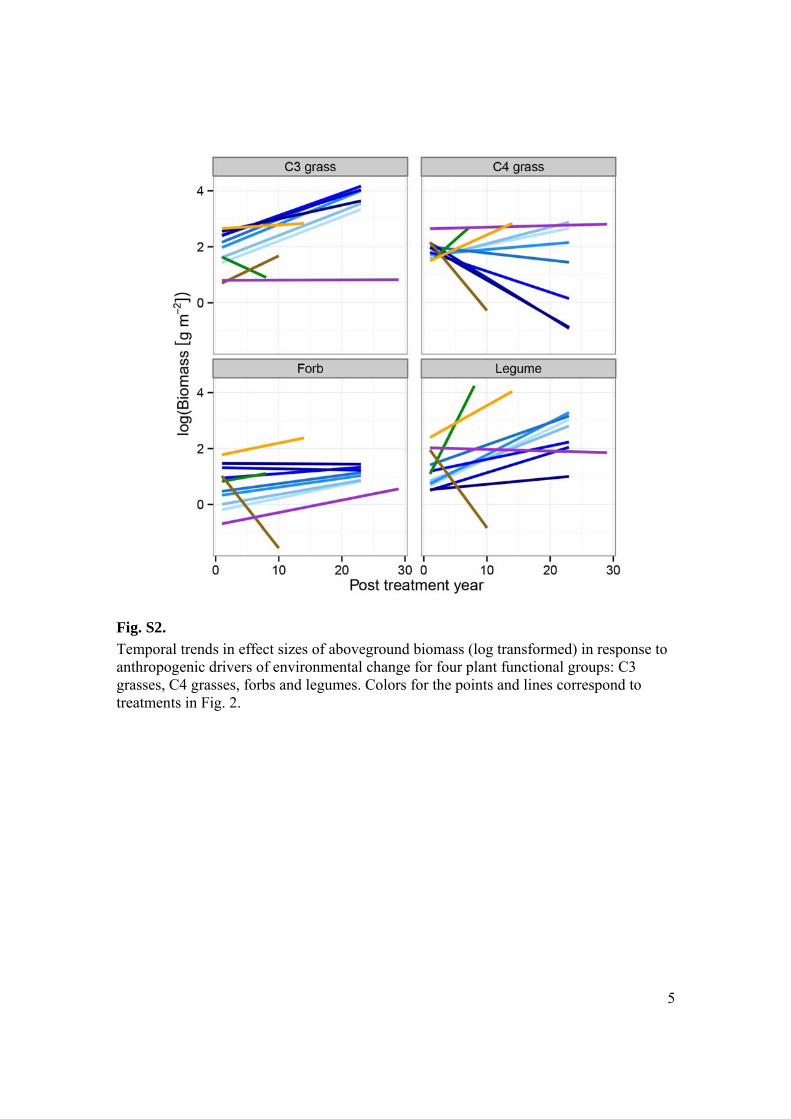
Fig. S2.
Temporal trends in effect sizes of aboveground biomass (log transformed) in response to anthropogenic drivers of environmental change for four plant functional groups: C3 grasses, C4 grasses, forbs and legumes. Colors for the points and lines correspond to treatments in Fig. 2.

6
Table S1. Summary of field experiments (N = 12). Compare with Table 1 in Tilman et al. (5) to identify for the main differences in the data used in the two studies. Detailed methods and original data can be found at http://www.cedarcreek.umn.edu/research/data. Data for each experiment can also be directly accessed by clicking on the links provided in column six.
Experi-mental variable
Variables used in analyses
Experiment period (no. years)
Years with data available
Experi-ment no./name
Website link Field/ring Number of control plots per year
Source
CO2 addition
Ambient CO2 or 560 ppm CO2 via "FACE" (only 9 or 16 species plots that were unfertilized)
1998-2011 (14 y) 1998-2011 e141 "BioCON"
http://www.cedarcreek.umn.edu/research/data/dataset?ple141
1,2,3,4,5,6 27 (34)
Diversity 1,2,4,16 species 1996-2013 (18 y) 1996-2013 e120 "BigBio"
http://www.cedarcreek.umn.edu/research/data/dataset?ple120
35 (17)
Diversity 1,4,16 species (only unfertilized and ambient CO2 plots)
1998-2011 (14 y) 1998-2011 e141 "BioCON"
http://www.cedarcreek.umn.edu/research/data/dataset?ple141
1,2,3,4,5,6 24 (34)
Fire suppression
Unburned or annual fire
1983-2010 (28 y) 1983, 1987, 1991, 2000, 2010
e012 http://www.cedarcreek.umn.edu/research/data/dataset?ple012
B 6 (35)
Fire suppression
Unburned or annual fire (unfertilized plots only)
1992-2011 (20 y) 1992-1994,1996-1997,1999-2000, 2002, 2004, 2008-2009, 2011
e098 http://www.cedarcreek.umn.edu/research/data/dataset?ple098
E002 B 6 (5)
Herbivory exclusion
Unfenced or deer exclosure
2005-2011 (7 y) 2005-2011 e001 http://www.cedarcreek.umn.edu/research/data/dataset?ple001
C 23 (36)
Herbivory exclusion
Unfenced or deer exclosure
2008-2011 (4 y) 2008-2011 e245 http://www.cedarcreek.umn.edu/research/data/dataset?ple245
8 (5)
Herbivory exclusion
Unfenced or deer exclosure
2007-2012 (6 y) 2007-2012 e247 "Nutrient Network"
http://www.cedarcreek.umn.edu/research/data/dataset?acue247
5 (37)
Nitrogen addition
0,10,20,34,54,95,170, 270 kg N ha-1 yr-1
1982-2004 (23 y) 1982-2004 e001 http://www.cedarcreek.umn.edu/research/data/dataset?ple001
B,C,D 23 (36)
Nitrogen addition
0,10,20,34,54,95,170, 270 kg N ha-1 yr-1
1982-2004 (23 y) 1982-1994,1996-2000,2002-2004
e002 http://www.cedarcreek.umn.edu/research/data/dataset?ple002
B,C 15 (36)
Water addition
Ambient rain or ~50% increase via watering
1982-1991 (10 y) 1982, 1984, 1986, 1988-1989, 1991
e003 http://www.cedarcreek.umn.edu/research/data/dataset?ple003
A,B 8 (38)
Water addition
Ambient rain or ~50% increase via watering
2007-2011 (5 y) 2007-2011 e248 http://www.cedarcreek.umn.edu/research/data/dataset?pce248
6 (39)

7
Table S2. Biodiversity-mediated effects on temporal stability of productivity do not depend on the factor that causes the change in biodiversity. The model comparison tests the anthropogenic drivers of environmental change random effect of the mixed effects model of the log response ratio of temporal stability of productivity (lrr.S) as a function of the log response ratio of plant species richness (lrr.rich). The models compare a model with random intercepts only versus a model with random intercepts and slopes. Table shows the degrees of freedom (DF), the Bayesian Information Criteria values (BIC), the difference in the Bayesian Information Criteria values (ΔBIC) and the evidence (E) for each model. For the model with random intercepts only, BIC is much lower, which thus does not support the hypothesis that slopes of regression vary between the different drivers. With a difference in BIC of 12.7, the model with random intercepts only has 572.5 times the weight of evidence, E, in its favor when compared to the model in which the driver-dependent regressions have both different intercepts and different slopes. Model DF BIC ΔBIC EFixed=lrr.rich, Random=1 5 223.0 0.0 1.0Fixed=lrr.rich, Random=1+lrr.rich 7 235.7 12.7 572.5

8
Table S3. Linear model showing that there is no remaining effect of anthropogenic drivers (FacTrt) on the residuals (Residuals) of the mixed effects model of the log response ratio of temporal stability of productivity (lrr.S) as a function of the log response ratio of plant species richness (lrr.rich) in response to anthropogenic environmental changes. Df Sum Sq Mean Sq F value Pr(>F)FacTrt 4 0.0232 0.005810 0.0976 0.9832Residuals 333 19.8319 0.059555

9
Table S4. Effect of anthropogenic drivers of environmental change on the log response ratio of mean (lrr.mean), standard deviation (lrr.SD) and tempoal stability (lrr.S) of productivity, and diversity (lrr.rich). Results are shown as mean effects with their 95% CI. Variables listed in boldface are those with effects significantly greater than zero; variables listed in italic are those with effects significantly lower than zero.
lrr.mean lrr.SD lrr.S lrr.rich
Source Effect 2.5% 97.5% Effect 2.5% 97.5% Effect 2.5% 97.5% Effect 2.5% 97.5%
Diversity 16 vs. 1 -1.017 -1.072 -0.962 -0.604 -0.660 -0.549 -0.413 -0.468 -0.357 -2.773
Diversity 16 vs. 2 -0.700 -0.796 -0.604 -0.480 -0.576 -0.384 -0.220 -0.316 -0.124 -2.079
Diversity 16 vs. 4 -0.462 -0.522 -0.403 -0.240 -0.300 -0.181 -0.222 -0.282 -0.163 -1.386
N addition 270 kg ha-1 0.657 0.565 0.749 0.947 0.855 1.039 -0.290 -0.382 -0.198 -0.804 -0.886 -0.722
N addition 170 kg ha-1 0.599 0.507 0.691 0.752 0.660 0.843 -0.153 -0.245 -0.061 -0.666 -0.748 -0.584
N addition 95 kg ha-1 0.464 0.372 0.556 0.564 0.472 0.656 -0.100 -0.192 -0.008 -0.551 -0.632 -0.469
N addition 54 kg ha-1 0.368 0.276 0.460 0.477 0.385 0.569 -0.109 -0.201 -0.017 -0.395 -0.477 -0.313
N addition 34 kg ha-1 0.241 0.149 0.333 0.280 0.189 0.372 -0.039 -0.131 0.053 -0.317 -0.398 -0.235
N addition 20 kg ha-1 0.148 0.057 0.240 0.140 0.048 0.232 0.008 -0.084 0.100 -0.197 -0.278 -0.115
N addition 10 kg ha-1 0.038 -0.054 0.130 -0.070 -0.162 0.022 0.108 0.017 0.200 -0.130 -0.212 -0.048
CO2 0.111 0.002 0.220 0.046 -0.063 0.155 0.065 -0.044 0.174 -0.041 -0.138 0.056
Fire 0.091 -0.072 0.255 -0.083 -0.246 0.081 0.174 0.011 0.338 0.163 0.017 0.309
Herbivory 0.143 0.013 0.273 0.224 0.094 0.354 -0.081 -0.211 0.049 -0.163 -0.279 -0.048
Water 0.149 -0.003 0.300 -0.107 -0.258 0.045 0.255 0.104 0.407 -0.002 -0.137 0.133

References and Notes 1. P. M. Vitousek, H. A. Mooney, J. Lubchenco, J. M. Melillo, Human Domination of Earth’s
Ecosystems. Science 277, 494–499 (1997). doi:10.1126/science.277.5325.494
2. S. L. Pimm, G. J. Russell, J. L. Gittleman, T. M. Brooks, The future of biodiversity. Science 269, 347–350 (1995). Medline doi:10.1126/science.269.5222.347
3. A. D. Barnosky, N. Matzke, S. Tomiya, G. O. Wogan, B. Swartz, T. B. Quental, C. Marshall, J. L. McGuire, E. L. Lindsey, K. C. Maguire, B. Mersey, E. A. Ferrer, Has the Earth’s sixth mass extinction already arrived? Nature 471, 51–57 (2011). Medline doi:10.1038/nature09678
4. J. Rockström, W. Steffen, K. Noone, A. Persson, F. S. Chapin 3rd, E. F. Lambin, T. M. Lenton, M. Scheffer, C. Folke, H. J. Schellnhuber, B. Nykvist, C. A. de Wit, T. Hughes, S. van der Leeuw, H. Rodhe, S. Sörlin, P. K. Snyder, R. Costanza, U. Svedin, M. Falkenmark, L. Karlberg, R. W. Corell, V. J. Fabry, J. Hansen, B. Walker, D. Liverman, K. Richardson, P. Crutzen, J. A. Foley, A safe operating space for humanity. Nature 461, 472–475 (2009). Medline doi:10.1038/461472a
5. D. Tilman, P. B. Reich, F. Isbell, Biodiversity impacts ecosystem productivity as much as resources, disturbance, or herbivory. Proc. Natl. Acad. Sci. U.S.A. 109, 10394–10397 (2012). Medline doi:10.1073/pnas.1208240109
6. D. U. Hooper, E. C. Adair, B. J. Cardinale, J. E. Byrnes, B. A. Hungate, K. L. Matulich, A. Gonzalez, J. E. Duffy, L. Gamfeldt, M. I. O’Connor, A global synthesis reveals biodiversity loss as a major driver of ecosystem change. Nature 486, 105–108 (2012). Medline
7. Y. Hautier, E. W. Seabloom, E. T. Borer, P. B. Adler, W. S. Harpole, H. Hillebrand, E. M. Lind, A. S. MacDougall, C. J. Stevens, J. D. Bakker, Y. M. Buckley, C. Chu, S. L. Collins, P. Daleo, E. I. Damschen, K. F. Davies, P. A. Fay, J. Firn, D. S. Gruner, V. L. Jin, J. A. Klein, J. M. Knops, K. J. La Pierre, W. Li, R. L. McCulley, B. A. Melbourne, J. L. Moore, L. R. O’Halloran, S. M. Prober, A. C. Risch, M. Sankaran, M. Schuetz, A. Hector, Eutrophication weakens stabilizing effects of diversity in natural grasslands. Nature 508, 521–525 (2014). Medline doi:10.1038/nature13014
8. C. J. Stevens, N. B. Dise, J. O. Mountford, D. J. Gowing, Impact of nitrogen deposition on the species richness of grasslands. Science 303, 1876–1879 (2004). Medline doi:10.1126/science.1094678
9. Z. L. Yang, J. van Ruijven, G. Z. Du, The effects of long-term fertilization on the temporal stability of alpine meadow communities. Plant Soil 345, 315–324 (2011). doi:10.1007/s11104-011-0784-0
10. S. L. Collins, L. B. Calabrese, Effects of fire, grazing and topographic variation on vegetation structure in tallgrass prairie. J. Veg. Sci. 23, 563–575 (2012). doi:10.1111/j.1654-1103.2011.01369.x
11. F. Isbell, P. B. Reich, D. Tilman, S. E. Hobbie, S. Polasky, S. Binder, Nutrient enrichment, biodiversity loss, and consequent declines in ecosystem productivity. Proc. Natl. Acad. Sci. U.S.A. 110, 11911–11916 (2013). Medline doi:10.1073/pnas.1310880110
10

12. B. J. Cardinale, J. E. Duffy, A. Gonzalez, D. U. Hooper, C. Perrings, P. Venail, A. Narwani, G. M. Mace, D. Tilman, D. A.Wardle, A. P. Kinzig, G. C. Daily, M. Loreau, J. B. Grace, A. Larigauderie, D. S. Srivastava, S. Naeem, Corrigendum: Biodiversity loss and its impact on humanity. Nature 489, 326–326 (2012). doi:10.1038/nature11373
13. A. Hector, R. Bagchi, Biodiversity and ecosystem multifunctionality. Nature 448, 188–190 (2007). Medline doi:10.1038/nature05947
14. A. Hector, B. Schmid, C. Beierkuhnlein, M. C. Caldeira, M. Diemer, P. G. Dimitrakopoulos, J. A. Finn, H. Freitas, P. S. Giller, J. Good, R. Harris, P. Hogberg, K. Huss-Danell, J. Joshi, A. Jumpponen, C. Korner, P. W. Leadley, M. Loreau, A. Minns, C. P. Mulder, G. O’Donovan, S. J. Otway, J. S. Pereira, A. Prinz, D. J. Read, et, Plant diversity and productivity experiments in european grasslands. Science 286, 1123–1127 (1999). Medline doi:10.1126/science.286.5442.1123
15. F. Isbell, V. Calcagno, A. Hector, J. Connolly, W. S. Harpole, P. B. Reich, M. Scherer-Lorenzen, B. Schmid, D. Tilman, J. van Ruijven, A. Weigelt, B. J. Wilsey, E. S. Zavaleta, M. Loreau, High plant diversity is needed to maintain ecosystem services. Nature 477, 199–202 (2011). Medline doi:10.1038/nature10282
16. F. I. Isbell, H. W. Polley, B. J. Wilsey, Biodiversity, productivity and the temporal stability of productivity: Patterns and processes. Ecol. Lett. 12, 443–451 (2009). Medline doi:10.1111/j.1461-0248.2009.01299.x
17. D. Tilman et al., The Influence of Functional Diversity and Composition on Ecosystem Processes. Science 277, 1300–1302 (1997). doi:10.1126/science.277.5330.1300
18. Y. Hautier, P. A. Niklaus, A. Hector, Competition for light causes plant biodiversity loss after eutrophication. Science 324, 636–638 (2009). Medline doi:10.1126/science.1169640
19. M. D. Smith, A. K. Knapp, S. L. Collins, A framework for assessing ecosystem dynamics in response to chronic resource alterations induced by global change. Ecology 90, 3279–3289 (2009). Medline doi:10.1890/08-1815.1
20. A. Hector, Y. Hautier, P. Saner, L. Wacker, R. Bagchi, J. Joshi, M. Scherer-Lorenzen, E. M. Spehn, E. Bazeley-White, M. Weilenmann, M. C. Caldeira, P. G. Dimitrakopoulos, J. A. Finn, K. Huss-Danell, A. Jumpponen, C. P. Mulder, C. Palmborg, J. S. Pereira, A. S. Siamantziouras, A. C. Terry, A. Y. Troumbis, B. Schmid, M. Loreau, General stabilizing effects of plant diversity on grassland productivity through population asynchrony and overyielding. Ecology 91, 2213–2220 (2010). Medline doi:10.1890/09-1162.1
21. D. Tilman, P. B. Reich, J. M. H. Knops, Biodiversity and ecosystem stability in a decade-long grassland experiment. Nature 441, 629–632 (2006). Medline doi:10.1038/nature04742
22. H. Yang, L. Jiang, L. Li, A. Li, M. Wu, S. Wan, Diversity-dependent stability under mowing and nutrient addition: Evidence from a 7-year grassland experiment. Ecol. Lett. 15, 619–626 (2012). Medline doi:10.1111/j.1461-0248.2012.01778.x
23. J. Lepš, Variability in population and community biomass in a grassland community affected by environmental productivity and diversity. Oikos 107, 64–71 (2004). doi:10.1111/j.0030-1299.2004.13023.x
11

24. E. Grman, J. A. Lau, D. R. Schoolmaster Jr., K. L. Gross, Mechanisms contributing to stability in ecosystem function depend on the environmental context. Ecol. Lett. 13, 1400–1410 (2010). Medline doi:10.1111/j.1461-0248.2010.01533.x
25. A. S. MacDougall, K. S. McCann, G. Gellner, R. Turkington, Diversity loss with persistent human disturbance increases vulnerability to ecosystem collapse. Nature 494, 86–89 (2013). Medline doi:10.1038/nature11869
26. S. L. Pimm, The complexity and stability of ecosystems. Nature 307, 321–326(1984). doi:10.1038/307321a0
27. A. R. Ives, S. R. Carpenter, Stability and diversity of ecosystems. Science 317, 58–62 (2007). Medline doi:10.1126/science.1133258
28. D. Tilman, Ecology 80, 1455–1474 (1999).
29. K. Gross, B. J. Cardinale, J. W. Fox, A. Gonzalez, M. Loreau, H. W. Polley, P. B. Reich, J. van Ruijven, Species richness and the temporal stability of biomass production: A new analysis of recent biodiversity experiments. Am. Nat. 183, 1–12 (2014). Medline doi:10.1086/673915
30. C. L. Lehman, D. Tilman, Biodiversity, Stability, and Productivity in Competitive Communities. Am. Nat. 156, 534–552 (2000). doi:10.1086/303402
31. Materials and methods are available as supplementary materials on Science Online.
32. R Development Core Team, A Language and Environment for Statistical Computing (R Foundation for Statistical Computing, Vienna, Austria, 2014).
33. B. J. Cardinale, H. Hillebrand, W. S. Harpole, K. Gross, R. Ptacnik, Separating the influence of resource ‘availability’ from resource ‘imbalance’ on productivity-diversity relationships. Ecol. Lett. 12, 475–487 (2009). Medline doi:10.1111/j.1461-0248.2009.01317.x
34. P. B. Reich, J. Knops, D. Tilman, J. Craine, D. Ellsworth, M. Tjoelker, T. Lee, D. Wedin, S. Naeem, D. Bahauddin, G. Hendrey, S. Jose, K. Wrage, J. Goth, W. Bengston, Plant diversity enhances ecosystem responses to elevated CO2 and nitrogen deposition. Nature 410, 809–810 (2001). Medline doi:10.1038/35071062
35. J. M. H. Knops, Fire does not alter vegetation in infertile prairie. Oecologia 150, 477–483 (2006). Medline doi:10.1007/s00442-006-0535-8
36. D. Tilman, Secondary Succession and the Pattern of Plant Dominance Along Experimental Nitrogen Gradients. Ecol. Monogr. 57, 189–214 (1987). doi:10.2307/2937080
37. E. T. Borer et al., Finding generality in ecology: A model for globally distributed experiments. Methods Ecol. Evol. 5, 65–73 (2013).
38. D. Tilman, Constraints and tradeoffs: Toward a predictive theory of competition and succession. Oikos 58, 3–15 (1990). doi:10.2307/3565355
39. D. Tilman, Community invasibility, recruitment limitation, and grassland biodiversity. Ecology 78, 81–92 (1997). doi:10.1890/0012-9658(1997)078[0081:CIRLAG]2.0.CO;2
12