Supplementary Materials for -...
8
www.advances.sciencemag.org/cgi/content/full/1/1/e1400205/DC1 Supplementary Materials for Myosin-binding protein C corrects an intrinsic inhomogeneity in cardiac excitation-contraction coupling Michael J. Previs,* Benjamin L. Prosser,* Ji Young Mun,* Samantha Beck Previs, James Gulick, Kyounghwan Lee, Jeffrey Robbins, Roger Craig, W. J. Lederer, David M. Warshaw *Corresponding author. E-mail: [email protected] (D.M.W.); [email protected] (W.J.L.); [email protected] (R.C.) Published 20 February 2015, Sci. Adv. 1, e1400205 (2015) DOI: 10.1126/sciadv.1400205 This PDF file includes: Fig. S1. Two-color dSTORM super-resolution imaging of MyBP-C and ryanodine receptors (RyR2). Fig. S2. Treatment with the contractile inhibitor blebbistatin does not obscure sarcomeric calcium gradients. Fig. S3. Calcium-dependent regulation of native thin filament motion. Fig. S4. Histograms for thin filaments on λ-phosphatase–treated thick filaments containing dephosphorylated MyBP-C (trajectory length ± SEM and percent trajectories with biphasic velocities versus pCa). Fig. S5. 3D reconstructions of low-Ca 2+ native thin filaments decorated with C0C3 (actin/C0C3,1:3) in which the four phosphorylatable serines have been replaced with alanines (fully dephosphorylated, C0C3-4A) or with aspartic acid residues (phosphomimetic, C0C3-4D). Fig. S6. Transverse sections of the respective low- Ca 2+ reconstructions in fig. S5, in which native thin filaments have been decorated with C0C3-4A and C0C3-4D. Fig. S7. Phosphorylation of MyBP-C N-terminal domains modulates their ability to activate native thin filament motion in the in vitro motility assay on a bed of monomeric myosin.
Transcript of Supplementary Materials for -...

www.advances.sciencemag.org/cgi/content/full/1/1/e1400205/DC1
Supplementary Materials for
Myosin-binding protein C corrects an intrinsic inhomogeneity in
cardiac excitation-contraction coupling
Michael J. Previs,* Benjamin L. Prosser,* Ji Young Mun,* Samantha Beck Previs, James Gulick, Kyounghwan Lee, Jeffrey Robbins, Roger Craig, W. J. Lederer, David M.
Warshaw
*Corresponding author. E-mail: [email protected] (D.M.W.); [email protected] (W.J.L.); [email protected] (R.C.)
Published 20 February 2015, Sci. Adv. 1, e1400205 (2015)
DOI: 10.1126/sciadv.1400205
This PDF file includes: Fig. S1. Two-color dSTORM super-resolution imaging of MyBP-C and ryanodine receptors (RyR2). Fig. S2. Treatment with the contractile inhibitor blebbistatin does not obscure sarcomeric calcium gradients. Fig. S3. Calcium-dependent regulation of native thin filament motion. Fig. S4. Histograms for thin filaments on λ-phosphatase–treated thick filaments containing dephosphorylated MyBP-C (trajectory length ± SEM and percent trajectories with biphasic velocities versus pCa). Fig. S5. 3D reconstructions of low-Ca2+ native thin filaments decorated with C0C3 (actin/C0C3,1:3) in which the four phosphorylatable serines have been replaced with alanines (fully dephosphorylated, C0C3-4A) or with aspartic acid residues (phosphomimetic, C0C3-4D). Fig. S6. Transverse sections of the respective low- Ca2+ reconstructions in fig. S5, in which native thin filaments have been decorated with C0C3-4A and C0C3-4D. Fig. S7. Phosphorylation of MyBP-C N-terminal domains modulates their ability to activate native thin filament motion in the in vitro motility assay on a bed of monomeric myosin.

Manuscript Template
Science Advances Manuscript Template Page 1 of 7
H2: Supplementary Materials
Fig. S1. Two-color dSTORM super-resolution imaging of MyBP-C and ryanodine receptors (RyR2).
(A) Ventricular myocyte labeled with N-terminal MyBP-C antibody conjugated to AlexaFluor-647 (red)
and RyR2 antibody conjugated to AlexaFluor-488 (green). Scale bar is 10 μm. (B) Comparison of
confocal image (identical labeling as in A) with (C) dSTORM image of similar region in two different
ventricular myocytes. Scale bars are 2μm. (D) Zoom in of dSTORM image of RyR2 antibody
conjugated to AlexaFluor-647 to show punctate RyR2 clusters aligned at Z-lines at high resolution.
Scale bar is 500 nm.
Science Advances Manuscript Template Page 2 of 7
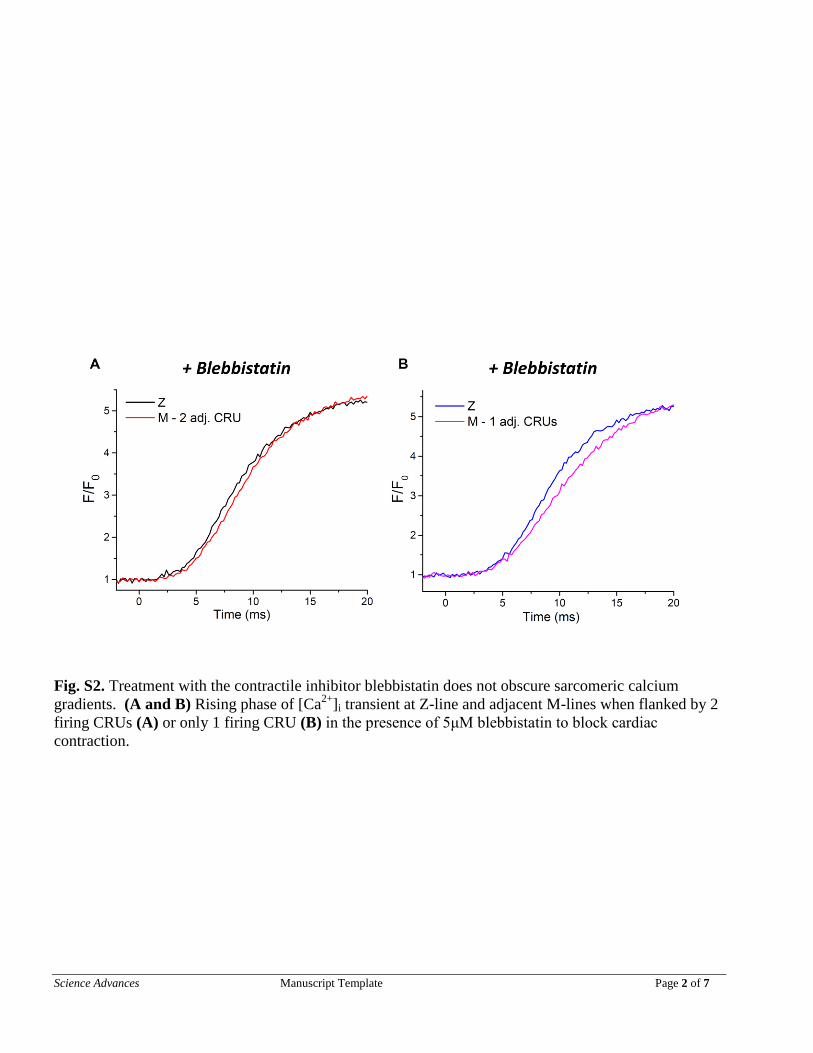
Fig. S2. Treatment with the contractile inhibitor blebbistatin does not obscure sarcomeric calcium
gradients. (A and B) Rising phase of [Ca2+
]i transient at Z-line and adjacent M-lines when flanked by 2
firing CRUs (A) or only 1 firing CRU (B) in the presence of 5μM blebbistatin to block cardiac
contraction.

Science Advances Manuscript Template Page 3 of 7
Fig. S3. Calcium dependent regulation of native thin filament motion. (A) Velocity ± SEM- and (B)
fraction of thin filaments moving ± SEM-pCa plots for native thin filaments on a bed of monomeric
myosin in an in vitro motility assay. Data fitted with sigmoidal-dose response curves with similar pCa50
values (6.3 ± 0.04 and 6.4 ± 0.02 respectively).
Science Advances Manuscript Template Page 4 of 7
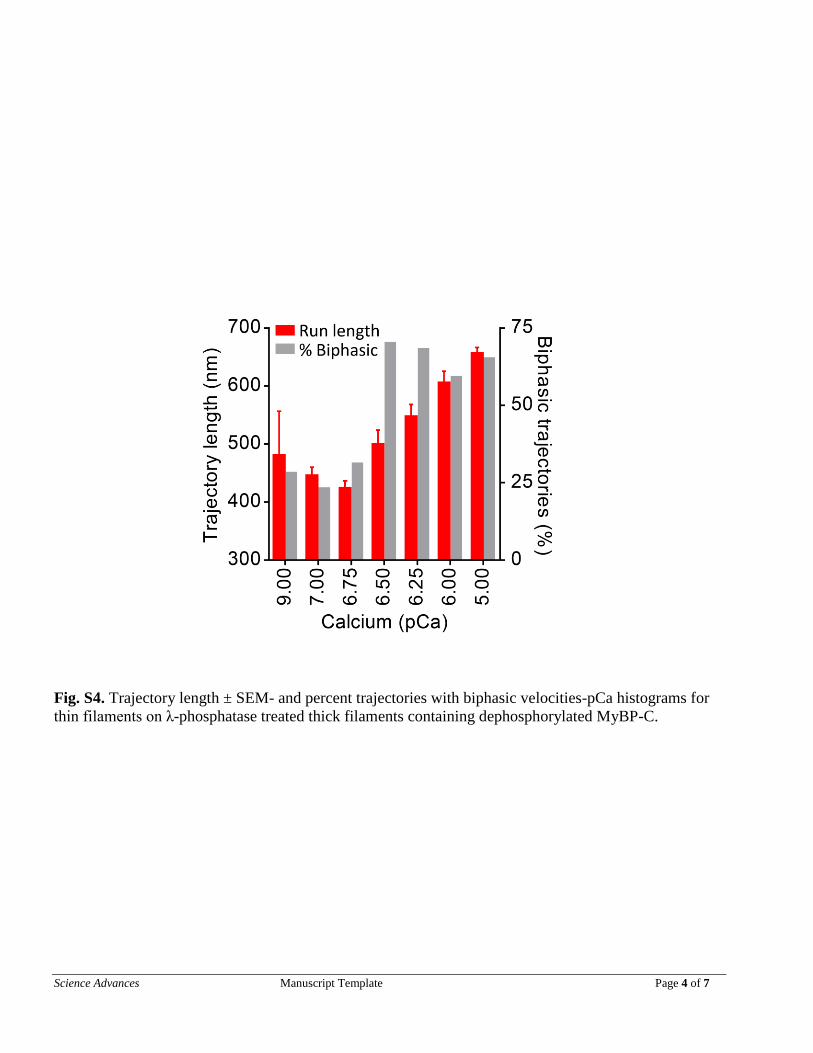
Fig. S4. Trajectory length ± SEM- and percent trajectories with biphasic velocities-pCa histograms for
thin filaments on λ-phosphatase treated thick filaments containing dephosphorylated MyBP-C.

Science Advances Manuscript Template Page 5 of 7
Fig. S5. 3D reconstructions of low Ca2+
native thin filaments decorated with C0C3 (actin:C0C3 = 1:3) in
which the 4 phosphorylatable serines have been replaced with alanines (fully dephosphorylated, C0C3-
4A) or with aspartic acid residues (phosphomimetic, C0C3-4D). (A) Undecorated (control) filament (cf.
Fig. 3F). (B) Decorated with C0C3-4A, showing shift of Tm from “blocked” to “closed” position (Fig.
3H). (C) Decorated with C0C3-4D, showing smaller Tm movement towards the “closed” position (Fig.
3I). (D-F) Superpositions of the reconstructions in A-C highlighting the greater movement of Tm with
C0C3-4A than with C0C3-4D (Fig. 3H, I). Filaments oriented with pointed end up. Scale bar = 5 nm.

Science Advances Manuscript Template Page 6 of 7
Fig. S6. Transverse sections of the respective low-Ca2+
reconstructions in Extended Data Fig. 5, in
which native thin filaments have been decorated with C0C3-4A and C0C3-4D. (A) Control filament
showing positioning of Tm near the junction of actin subdomain 1 (SD1) and SD3 (“blocked”) position.
(B) Decorated with C0C3-4A showing shift of Tm on to SD3 (“closed” position). (C) Decorated with
C0C3-4D, showing smaller Tm movement towards the “closed” position. (D-F) Superpositions of the
reconstructions in A-C highlighting the greater movement of Tm with C0C3-4A than with C0C3-4D.
Arrows represent the “blocked” (red) and “closed” (green) positions of Tm.

Science Advances Manuscript Template Page 7 of 7
Fig. S7. Phosphorylation of MyBP-C N-terminal domains modulates their ability to activate native thin
filament motion in the in vitro motility assay on a bed of monomeric myosin. (A and B) Concentration
dependent effect of (dephosphorylated) C0C3 N-terminal fragments on the fraction of native thin
filaments moving and their sliding velocities. Mean ± SEM (N=4). (A) Addition of C0C3 initiates
filament motion at low calcium levels pCa 6.75 (blue) and 7 (red). (B) Although C0C3 initiates sliding
at low calcium levels its presence in the assay inhibits maximal velocities when the system is fully
calcium activated (pCa 5, green). (C and D) As in A and B upon addition of C0C3 with the four
phosphorylatable serines within the M-domain (Fig 1B) replaced by phosphomimetic aspartic acid
residues (C0C3-4D) to mimic phosphorylation. Mean ± SEM (N=4). (C) Addition of C0C3-4D is still
capable of initiating thin filament sliding but to a lesser degree than C0C3. (D) Despite C0C3-4D
activating thin filament motion, the thin filaments slide at slow velocities, which is indicative of myosin
only having partial access to the thin filament as the thin filament is not completely activated at the
lower calcium concentrations.