SUPPLEMENTARY INFORMATION - Stanford … Nature 2012... | 5 supplementary information research c1c2...
20
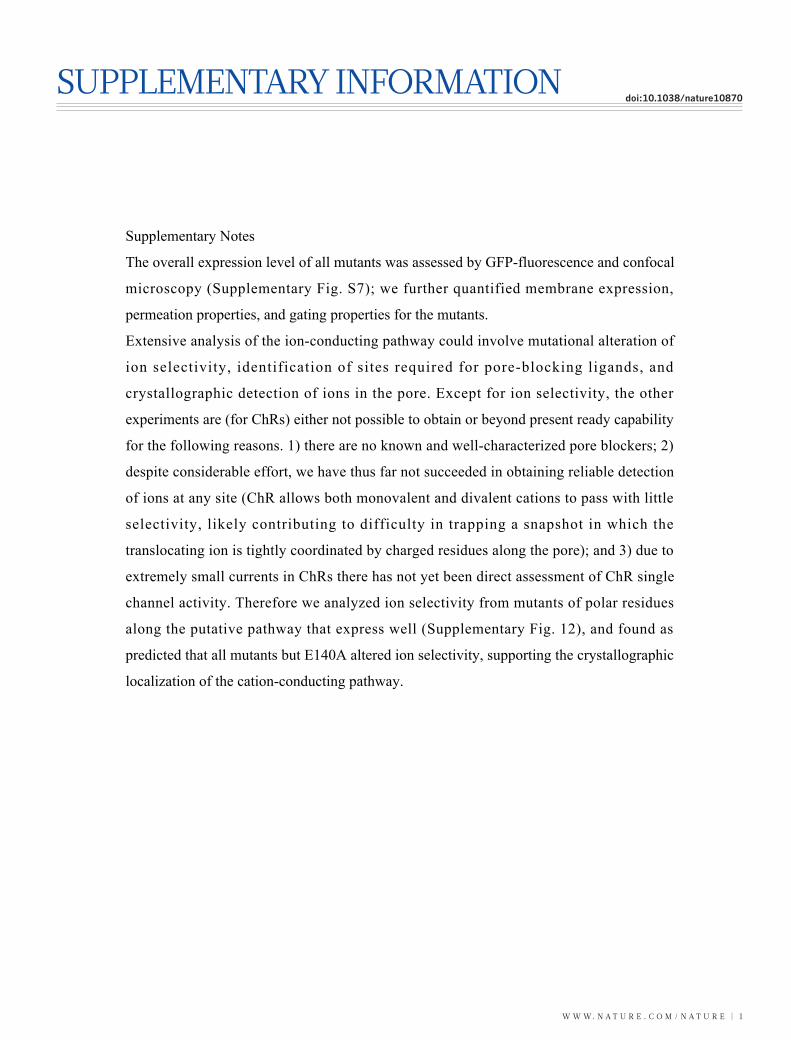
WWW.NATURE.COM/NATURE | 1 SUPPLEMENTARY INFORMATION doi:10.1038/nature10870 Supplementary Notes The overall expression level of all mutants was assessed by GFP-fluorescence and confocal microscopy (Supplementary Fig. S7); we further quantified membrane expression, permeation properties, and gating properties for the mutants. Extensive analysis of the ion-conducting pathway could involve mutational alteration of ion selectivity, identification of sites required for pore-blocking ligands, and crystallographic detection of ions in the pore. Except for ion selectivity, the other experiments are (for ChRs) either not possible to obtain or beyond present ready capability for the following reasons. 1) there are no known and well-characterized pore blockers; 2) despite considerable effort, we have thus far not succeeded in obtaining reliable detection of ions at any site (ChR allows both monovalent and divalent cations to pass with little selectivity, likely contributing to difficulty in trapping a snapshot in which the translocating ion is tightly coordinated by charged residues along the pore); and 3) due to extremely small currents in ChRs there has not yet been direct assessment of ChR single channel activity. Therefore we analyzed ion selectivity from mutants of polar residues along the putative pathway that express well (Supplementary Fig. 12), and found as predicted that all mutants but E140A altered ion selectivity, supporting the crystallographic localization of the cation-conducting pathway.
Transcript of SUPPLEMENTARY INFORMATION - Stanford … Nature 2012... | 5 supplementary information research c1c2...
W W W. N A T U R E . C O M / N A T U R E | 1
SUPPLEMENTARY INFORMATIONdoi:10.1038/nature10870
SUPPLEMENTARY INFORMATION
For Kato et al.
Supplementary Notes
The overall expression level of all mutants was assessed by GFP-fluorescence and confocal
microscopy (Supplementary Fig. S7); we further quantified membrane expression,
permeation properties, and gating properties for the mutants.
Extensive analysis of the ion-conducting pathway could involve mutational alteration of
ion selectivity, identification of sites required for pore-blocking ligands, and
crystallographic detection of ions in the pore. Except for ion selectivity, the other
experiments are (for ChRs) either not possible to obtain or beyond present ready capability
for the following reasons. 1) there are no known and well-characterized pore blockers; 2)
despite considerable effort, we have thus far not succeeded in obtaining reliable detection
of ions at any site (ChR allows both monovalent and divalent cations to pass with little
selectivity, likely contributing to difficulty in trapping a snapshot in which the
translocating ion is tightly coordinated by charged residues along the pore); and 3) due to
extremely small currents in ChRs there has not yet been direct assessment of ChR single
channel activity. Therefore we analyzed ion selectivity from mutants of polar residues
along the putative pathway that express well (Supplementary Fig. 12), and found as
predicted that all mutants but E140A altered ion selectivity, supporting the crystallographic
localization of the cation-conducting pathway.

SUPPLEMENTARY INFORMATION
2 | W W W. N A T U R E . C O M / N A T U R E
RESEARCH
Supplementary Figure 1 | Absorption spectrum of purified C1C2 at different
pH values. Absorption spectrum of recombinant C1C2 (in dodecyl maltoside
solution) in the dark-adapted state at pH 4.0 (pink line), pH 5.0 (red line), pH 6.0
(orange line), pH 7.0 (yellow line), pH 8.0 (green line), pH 9.0 (cyan line), pH 10.0
(blue line), normalized to the absorption at 280 nm.
Kato et al. Sup. Fig. S1
W W W. N A T U R E . C O M / N A T U R E | 3
SUPPLEMENTARY INFORMATION RESEARCH
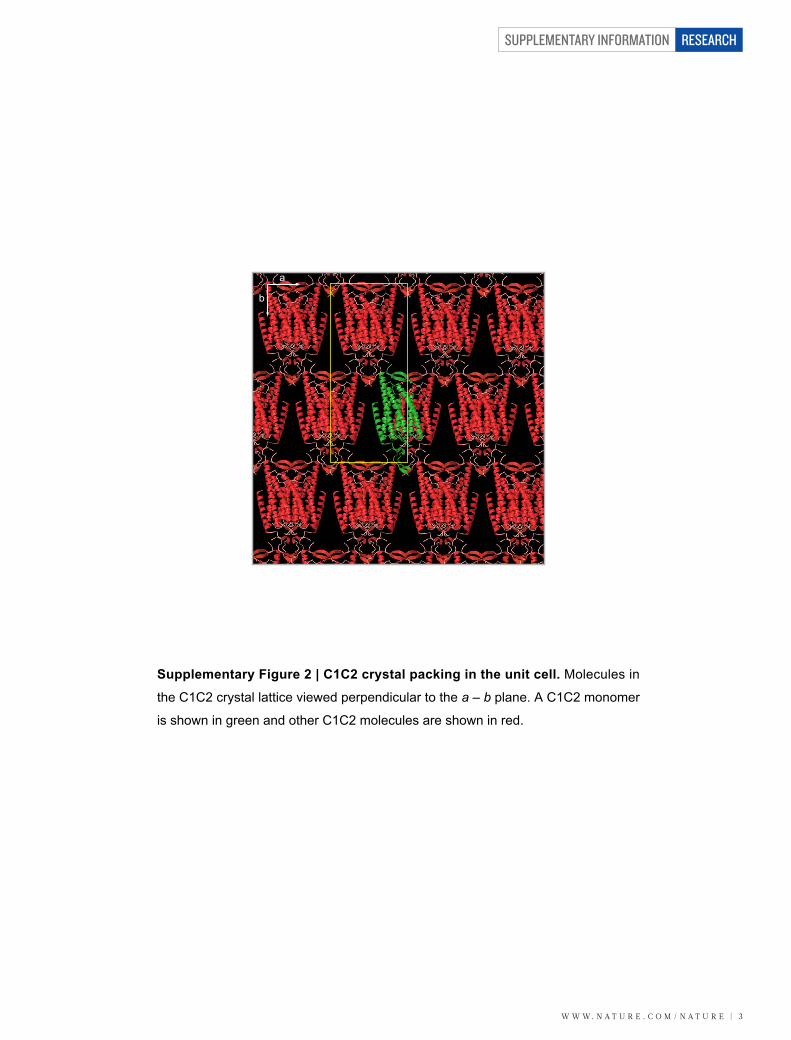
Supplementary Figure 2 | C1C2 crystal packing in the unit cell. Molecules in
the C1C2 crystal lattice viewed perpendicular to the a – b plane. A C1C2 monomer
is shown in green and other C1C2 molecules are shown in red.
a
b
Kato et al. Sup. Fig. S2
SUPPLEMENTARY INFORMATION
4 | W W W. N A T U R E . C O M / N A T U R E
RESEARCH
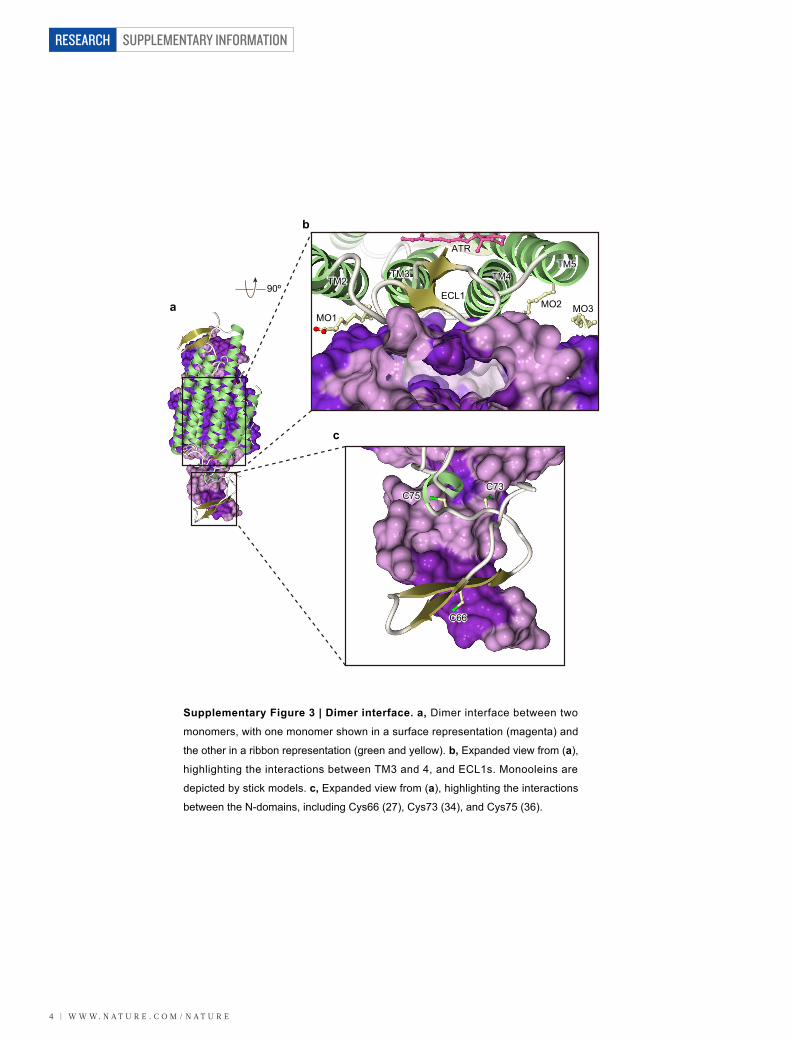
Supplementary Figure 3 | Dimer interface. a, Dimer interface between two
monomers, with one monomer shown in a surface representation (magenta) and
the other in a ribbon representation (green and yellow). b, Expanded view from (a),
highlighting the interactions between TM3 and 4, and ECL1s. Monooleins are
depicted by stick models. c, Expanded view from (a), highlighting the interactions
between the N-domains, including Cys66 (27), Cys73 (34), and Cys75 (36).
90º
a
b
c
MO3
ECL1ECL1
TM4TM4TM3TM3TM5TM5
TM2TM2
ATRATR
MO3MO2MO2MO1MO1
C66C66
C75C75C73C73
Kato et al. Sup. Fig. S3

W W W. N A T U R E . C O M / N A T U R E | 5
SUPPLEMENTARY INFORMATION RESEARCH
C1C2 1 10 20 30 40 50 60 70
C1C2 MSRRPWLLALALAVALAAGSAGASTGSDATVPVATQDGPDYVFHRAHERMLFQTSYTLENNGSVICIPNNChlamyChR1 MSRRPWLLALALAVALAAGSAGASTGSDATVPVATQDGPDYVFHRAHERMLFQTSYTLENNGSVICIPNNChlamyChR2 ...............MDYGGALSAVG.....................RELLFVTNPVVVN.GSVLVPED.VolvoxChR2 ...............MDHPVARSLIG...........................SSYTNLNNGSIVIPSD.VolvoxChR1 ...............MDYPVARSLIVR...........................YPTDLGNGTVCMPRG.MesostigmaChR ...MSPPTSPTPDTGHDTPDTGHDTGG.................HGAVEICFAPCEEDCVTIRYFVENDFSensoryrhodopsinII ......................................................................Bacteriorhodopsin ......................................................................Halorhodopsin ......................................................................Xanthorhodopsin ......................................................................
C1C2 80 90 100 110 120 130
C1C2 E I Q A SA L Q ST EE V IE I GQCFCLAWLKSNGTNA KLAAN L WITF L LC MFYGY TWK.. CGW IY AT MIKF IEYFChlamyChR1 E I Q A SA L Q ST EE V IE I GQCFCLAWLKSNGTNA KLAAN L WITF L LC MFYGY TWK.. CGW IY AT MIKF IEYFChlamyChR2 A V Q G SI L Q ST EE V IE I .QCYCAGWIESRGTNG QTASN L WLAA F LL MFYAY TWK.. CGW IY CA MVKV LEFFVolvoxChR2 A A Q A SV L A TT EE V VE V .ACFCMKWLKSKGSPV LKMAN L WAAF L II IYYAY TWR.. CGW VY CC LTKV IEFFVolvoxChR1 E T Q A SV L Q AT EE V IE I .QCYCEGWLRSRGTSI KTIAI L WVVF L AC GWYAY AWR.. CGW VY AL MMKS IEAFMesostigmaChR L A L V SI I Q KT EV V IE I EGCIPGHFDQYSSHGS HDIVK A YICM I LQ LFYGF WWR.. CGW WF AC TSIY IAITSensoryrhodopsinII L L A V TL A A RR TL I IA V .............MVG TTLFW G IGML G AF WAGRD GS.GE YYV VG SG AVAY VMALBacteriorhodopsin E L T L TL L V KK IT V IA L .......QAQITGRP. WIWLA G ALMG G YF VKGMG SDPDA FYA TL PA FTMY SMLLHalorhodopsin L V V I IL V I RL AT I VS L .........AVRENAL SSSLW N ALAG A VF YMGRT RPGRP IWG LM PL ISSY GLLSXanthorhodopsin V F V A FV V V RI VS V IA F .MLQELPTLTPGQYSL FNMFS T ATMT S FF LARNN AP.KY SMM AL VF GYHY RITS
TT C1C2 140 150 160 170 180
C1C2 RY W P L LLT VILI S LT HEF...................DEPAVIYS.......SNGNKTVWL AE C H N GLANChlamyChR1 RY W P L LLT VILI S LT HEF...................DEPAVIYS.......SNGNKTVWL AE C H N GLANChlamyChR2 RY W P L LLT VILI S LT FEF...................KNPSMLYL.......ATGHRVQWL AE C H N GLSNVolvoxChR2 RY W P L LLT VILI S LT HEF...................DEPGMLYL.......ANGNRVLWL GE C H N GLKDVolvoxChR1 RY W P L LLT VLLI S LT HEF...................DSPATLWL.......SSGNGVVWM GE C H N GLKDMesostigmaChR RY W P L LMT VILI S IT SEA...................DSPFTLYL.......TNGQISPQL ME C A N GMAESensoryrhodopsinII RY W P L ILT LIVY G LA ..G...................VGWVPV..........AERTVFAP ID T F L ..G.Bacteriorhodopsin RY W P L LFT LLLL A LV ..G...................YGLTMVPF......GGEQNPIYWA AD T D L ..D.Halorhodopsin RY W P L ALS MILL G LA ..G...................LTVGMIEMPAGHALAGEMVRSQWG LT T A L ..D.Xanthorhodopsin RY W P L LLT LLTV V VM ..SWEAAYALQNGMYQPTGELFN....................DAY VD V E L G.LP
C1C2 190 200 210 220 230 240
C1C2 G RT LL SDI V AL R I M I T A EA TV ..DYNK MG V GTI W TTA S..K....GYV V FFL GLCYG Y FFN AKVYI YH PKChlamyChR1 G RT LL SDI V AL R I M I T A EA TV ..DYNK MG V GTI W TTA S..K....GYV V FFL GLCYG Y FFN AKVYI YH PKChlamyChR2 G RT LL SDI V AM K I L A T A EG TV ..DYSR MG V GTI W ATS A..T....GYV V FFC GLCYG N FFH AKAYI YH PKVolvoxChR2 G RT LL SDV V AM K I L A T A ES TV ..DYNK MR V GTI W ATA S..T....GYI V FFL GCMYG N FFH AKVYI YH PKVolvoxChR1 G RT LL SDV V AM K L I M T A EA TV ..DYSK MG V GCI W ATS C..T....GWT I FFL SLSYG Y YFH AKVYI FH PKMesostigmaChR G RT LL SDV V AA K I V A T A DA AV ..EYNK MT T CCI L MMS S..K....PRL G LYA GWAFG W YWT LQVYR HK PKSensoryrhodopsinII G EF VI LNT L AM R A M L L L ES QR ..LDSR GI T VVM A FAG VP.G....I.E Y LFG GAVAF G VYY VGPMT AS SSBacteriorhodopsin G TI LV ADG G AL R V I L I L SK SM ..ADQG LA G IMI T LVG TK.VY...S.Y F WWA STAAM Y LYV FFGFT AE RPHalorhodopsin G SL VI ADI V AM R A I V V L AS SA ..VDLG FT A GMC T LAA TTSA....LLF W FYA SCAFF V LSA VTDWA AS G.Xanthorhodopsin G LA LG LAA V EV R L L V I L DT RQ KNERGP AK F LMI L YPG SE.NAALFG.T G WGF STIPF W LYI FTQLG IQ SS
C1C2 250 260 270 280 290 300
C1C2 W P D K R V M L S F IL L ST T I L S G L GRC Q VTG AW FFV GM ILF GPEGF......GV... .SVYG VGH I M NCW L GHChlamyChR1 W P D K R L L L S F LL I SA A L L S S M GIC D VRY AW YFC AM VLF GPEGF......GH... .NQFN IAH I A NAW M GHChlamyChR2 W P D K R V M L S F IL L ST T I L S G L GRC Q VTG AW FFV GM ILF GPEGF......GV... .SVYG VGH I M NCW L GHVolvoxChR2 W P D K R L M L S F LL L ST T I L S G L GLC Q VRA AW FFV GM VLF GPEGF......GH... .SVYG IGH I L NCW L GHVolvoxChR1 W P D K R L M T A F LL I SA S L L A G L GIC E VRV AW FFV GM VLF GTEGF......GH... .SPYG IGH I I NMW V GNMesostigmaChR W P D K A Y M V S F LL V ST A S L S G M P.L W VRA GY FFT LT GWF GPEGL......EV... .TGTV LMH C I NLW F DWSensoryrhodopsinII W P D K K L L L L Y LL L DV V L L T G I .GI S YVR RN TVI AI FIW GPPGV......AL... .TPTV ALI Y V VGF F ALBacteriorhodopsin W P D K A T L V L Y LI V ET M L V A G I .EV S FKV RN TVV SA VVW GSEGA......GI... .PLNI LLF V S VGF L LLHalorhodopsin W P D K A I L L L Y AV V TS S L V A A I ..T E FDT RV TVV LG IVW GVEGL......AL... QSVGA WAY V F YVF F LLXanthorhodopsin W P D K S L A L T Y MI G LQ T A V A G L .RV T LGN RL LLA GF IAY ...PMAFPEAFPSNTP .TIVA VGY I L AGY V IY
.. C1C2 310 320 330 340
C1C2 V I E I YLR ..L H HILIHGD RKTTKLNIGGTEIEVETLVEDEAEAGAV.... ChlamyChR1 V I E I FLR ..K H HILLYGD RKKQKVNVAGQEMEVETMVHEEDDE.TQKVPT ChlamyChR2 V I E I YLR ..L H HILIHGD RKTTKLNIGGTEIEVETLVEDEAEAGAVNKGT VolvoxChR2 L I E I FLR ..K H HILLYGD RKVQKIRVAGEELEVETLMTEEAPD.TVKKST VolvoxChR1 V I E I YLR ..K H HILLYGD RKKQKITIAGQEMEVETLVAEEEDD.TVKQST MesostigmaChR V V R A HLR ..L A HHRKLFK EEEHALKKGQTLEPGMPRSTSFVRG..LGDDV SensoryrhodopsinII A R E V DA. ATL A HGESLAG DTDAPAVAD....................... Bacteriorhodopsin R I G S RS. ..A F EAEAPEP AGDGAAATS....................... Halorhodopsin V E T L RW. ANN R VAVAGQT GTMSSDD......................... Xanthorhodopsin K K E E NIA ..A S EEGFNVS MVEPATASA.......................
β1� β2�
η1� ΤΜ1� ΤΜ2�
β3� β4� ΤΜ3�
ΤΜ4� ΤΜ5�
ΤΜ6� ΤΜ7�
β5� β6�
**
**
**
* *
* * *
*
Kato et al. Sup. Fig. S4Supplementary Figure 4 | Structure-based sequence alignment. Shown are
the C1C2 construct, ChR1 from Chlamydomonas reinhardtii (Chlamy ChR1,
GenBank ID: 15811379), ChR2 from Chlamydomonas reinhardtii (Chlamy ChR2,
GenBank ID: 158280944), ChR2 from Volvox carteri (Volvox ChR2, UniProtKB ID:
B4Y105), ChR1 from Volvox carteri (Volvox ChR1, UniProtKB ID: B4Y103), ChR1
from Mesostigma viride (Mesostigma ChR, GenBank ID: 338176939), sensory
rhodopsin II from Natronomonas pharaonis (Sensory rhodopsin II, PDB ID: 3QAP),
bacteriorhodopsin from Halobacterium salinarium (Bacteriorhodopsin, PDB ID:
1IW6), halorhodopsin from Halobacterium salinarium (Halorhodopsin, PDB ID:
1E12), and xanthorhodopsin from Salinibacter ruber (Xanthorhodopsin, PDB ID:
3DDL). The sequence alignment between C1C2, sensory rhodopsin II,
bacteriorhodopsin, halorhodopsin, and xanthorhodopsin was created based on
secondary structure matching (SSM) superposition, using the PDBeFold server7.
The C-termini of Chlamy ChR1, Chlamy ChR2, Volvox ChR1, Volvox ChR2, and
Mesostigma ChR are truncated. Secondary structure elements for C1C2 are
shown as coils (α: α-helices, η: 310-helices) and arrows (β-strands). “TT”
represents turns. Identical and conservatively substituted residues are highlighted
in red (in blue box). Cysteine residues involved in dimerization are colored
magenta. The three residues that form the internal gate are colored green.
Tyrosine, which is buried in the putative pore exit, is colored yellow. Glutamate, the
possible proton donor, is colored blue. Red and green asterisks under the
al ignment indicate the residues that form the conserved hydrophobic
retinal-binding pocket and the conserved cluster at the extracellular vestibule of
the cation-conducting pathway, respectively. Blue asterisks indicate the possible
proton acceptors from the Schiff base.
Kato et al. Sup. Fig. S4 (continued)
SUPPLEMENTARY INFORMATION
6 | W W W. N A T U R E . C O M / N A T U R E
RESEARCH
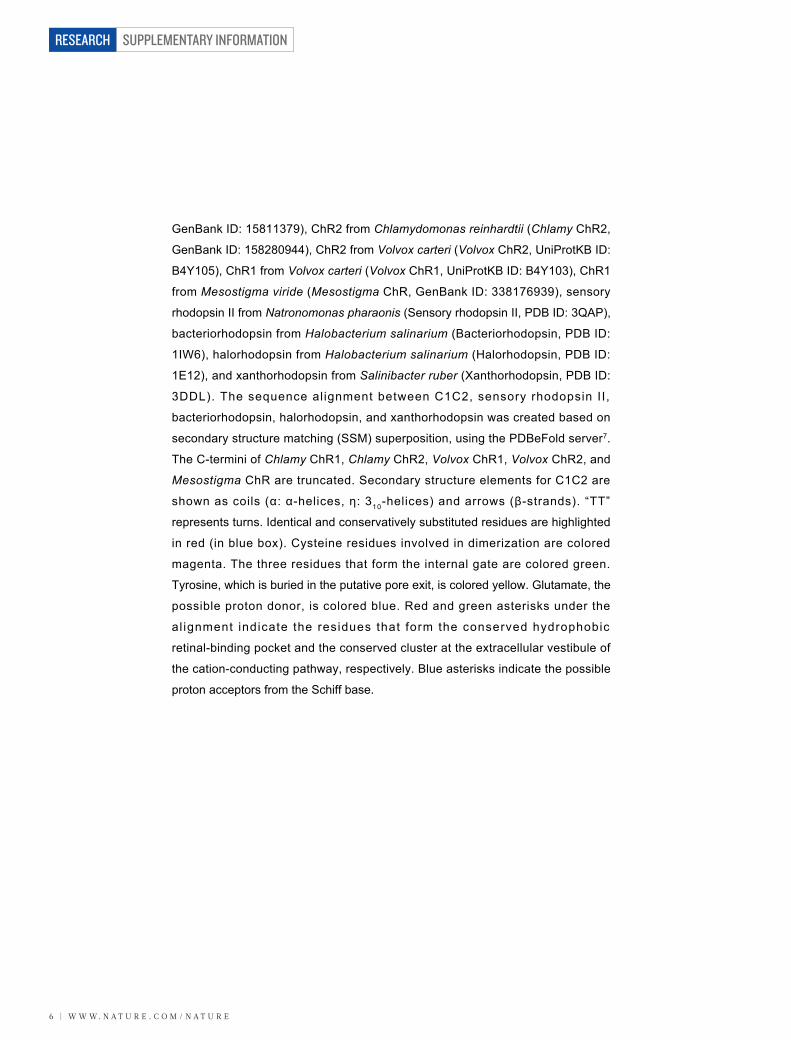
Supplementary Figure 4 | Structure-based sequence alignment. Shown are
the C1C2 construct, ChR1 from Chlamydomonas reinhardtii (Chlamy ChR1,
GenBank ID: 15811379), ChR2 from Chlamydomonas reinhardtii (Chlamy ChR2,
GenBank ID: 158280944), ChR2 from Volvox carteri (Volvox ChR2, UniProtKB ID:
B4Y105), ChR1 from Volvox carteri (Volvox ChR1, UniProtKB ID: B4Y103), ChR1
from Mesostigma viride (Mesostigma ChR, GenBank ID: 338176939), sensory
rhodopsin II from Natronomonas pharaonis (Sensory rhodopsin II, PDB ID: 3QAP),
bacteriorhodopsin from Halobacterium salinarium (Bacteriorhodopsin, PDB ID:
1IW6), halorhodopsin from Halobacterium salinarium (Halorhodopsin, PDB ID:
1E12), and xanthorhodopsin from Salinibacter ruber (Xanthorhodopsin, PDB ID:
3DDL). The sequence alignment between C1C2, sensory rhodopsin II,
bacteriorhodopsin, halorhodopsin, and xanthorhodopsin was created based on
secondary structure matching (SSM) superposition, using the PDBeFold server7.
The C-termini of Chlamy ChR1, Chlamy ChR2, Volvox ChR1, Volvox ChR2, and
Mesostigma ChR are truncated. Secondary structure elements for C1C2 are
shown as coils (α: α-helices, η: 310-helices) and arrows (β-strands). “TT”
represents turns. Identical and conservatively substituted residues are highlighted
in red (in blue box). Cysteine residues involved in dimerization are colored
magenta. The three residues that form the internal gate are colored green.
Tyrosine, which is buried in the putative pore exit, is colored yellow. Glutamate, the
possible proton donor, is colored blue. Red and green asterisks under the
al ignment indicate the residues that form the conserved hydrophobic
retinal-binding pocket and the conserved cluster at the extracellular vestibule of
the cation-conducting pathway, respectively. Blue asterisks indicate the possible
proton acceptors from the Schiff base.
Kato et al. Sup. Fig. S4 (continued)
W W W. N A T U R E . C O M / N A T U R E | 7
SUPPLEMENTARY INFORMATION RESEARCH
TM1
TM7TM6
TM5
TM4 TM3
TM2
bRhC1C2
90º
Kato et al. Sup. Fig. S5
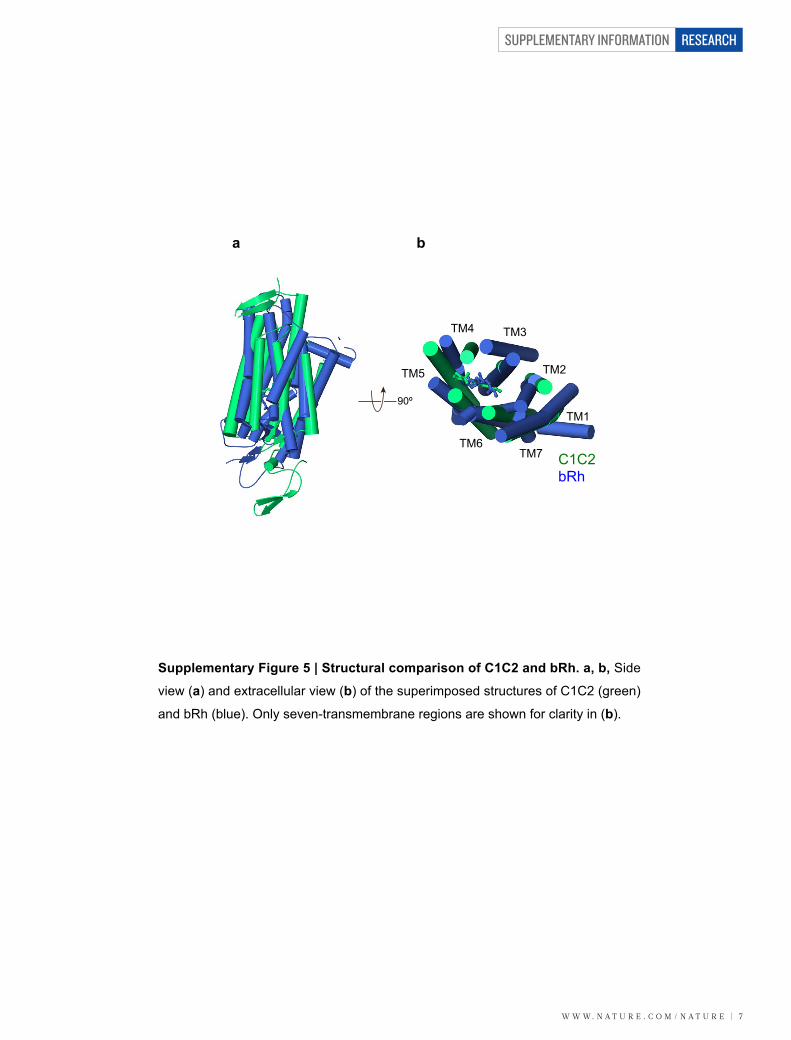
Supplementary Figure 5 | Structural comparison of C1C2 and bRh. a, b, Side
view (a) and extracellular view (b) of the superimposed structures of C1C2 (green)
and bRh (blue). Only seven-transmembrane regions are shown for clarity in (b).
a b

SUPPLEMENTARY INFORMATION
8 | W W W. N A T U R E . C O M / N A T U R E
RESEARCH
Kato et al. Sup. Fig. S6
His317
H313
G318 I320
H317
H313
H2O
E340E340
G318 I320
TM7TM7
TM6TM6
TM5TM5
Supplementary Figure 6 | Interactions between the protruding part of TM7
and the C-domain. a, b, Interface between the protruding part of TM7 and the
C-domain. Hydrogen bonds are shown by dashed lines.

W W W. N A T U R E . C O M / N A T U R E | 9
SUPPLEMENTARY INFORMATION RESEARCH
E129QE140AE136AE162A
a
b
WT R159A K132A
0
1
2
3
4
5
6
7
8
9
10
Mem
bran
e/C
ytos
ol F
luor
esce
nce
Rat
io
D292A Q95A E129AS102D N297D
**
E129QS102D E129A N297D
E136AQ95A K132A E140A
D292AWT E162A R159A
Supplementary Figure 7 | Membrane expression and localization of wild-type
C1C2 and its mutants. a, Confocal images of representative HEK293 cells
expressing the wild-type C1C2 and the its eleven mutants. Scale bar represents
30 μm. b, The expression level of wild-type C1C2 and the mutants quantified by
membrane/cytosol fluorescence ratio. Values are means and SEM of 12-49 cells.
**: p<0.01.
Kato et al. Sup. Fig. S7
SUPPLEMENTARY INFORMATION
1 0 | W W W. N A T U R E . C O M / N A T U R E
RESEARCH
-100 -80 -60 -40 -20 0 20 40 60 80
-25
-20
-15
-10
-5
0
5
E136A
-100 -80 -60 -40 -20 0 20 40 60 80
-20 -15 -10 -5 0 5
-25
E140A
-100 -80 -60 -40 -20 0 20 40 60 80
-25 -20 -15 -10 -5 0 5
-100 -80 -60 -40 -20 0 20 40 60 80
-25 -20 -15 -10 -5 0 5
R159A
-100 -80 -60 -40 -20 0 20 40 60 80
-25 -20 -15 -10 -5 0 5
K132A
-100 -80
-25
-60 -40 -20 0 20 40 60 80
-20
-15
-10
-5 0
5
Q95A
E162A
-100 -80 -60 -40 -20 0 20 40 60 80
-25 -20 -15 -10 -5 0 5
-100 -80 -60 -40 -20 0 20 40 60 80
-25 -20 -15 -10 -5 0 5
Cur
rent
den
sity
(pA
/pF)
Voltage (mV)
WT D292A
-100 -80 -60 -40 -20 0 20 40 60 80
-25 -20 -15 -10 -5 0 5
-100 -80 -60 -40 -20 0 20 40 60 80
-20
-15
-10
-5
0
5
-25
E129A
-100 -80 -60 -40 -20 0 20 40 60 80
-20
-15
-10
-5
0
5
-25
E129Q N297D
-100 -80 -60 -40 -20 0 20 40 60 80
-20
-15
-10
-5
0
5
-25
S102D
Kato et al. Sup. Fig. S8
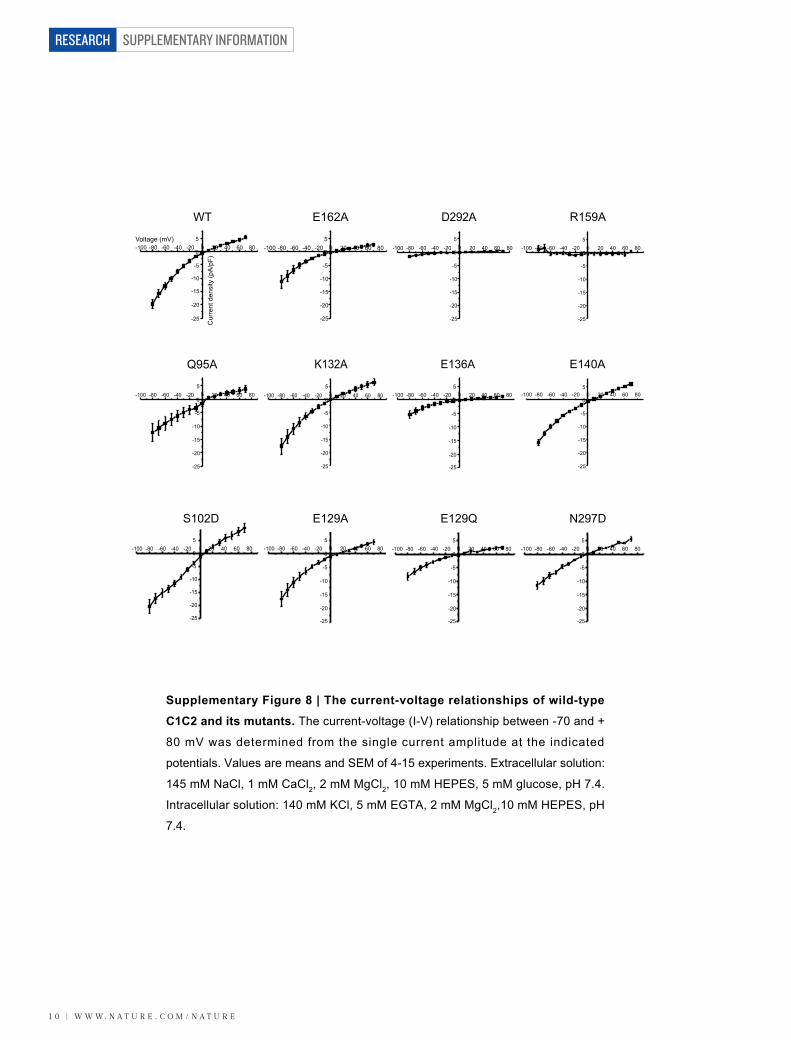
Supplementary Figure 8 | The current-voltage relationships of wild-type
C1C2 and its mutants. The current-voltage (I-V) relationship between -70 and +
80 mV was determined from the single current amplitude at the indicated
potentials. Values are means and SEM of 4-15 experiments. Extracellular solution:
145 mM NaCl, 1 mM CaCl2, 2 mM MgCl2, 10 mM HEPES, 5 mM glucose, pH 7.4.
Intracellular solution: 140 mM KCl, 5 mM EGTA, 2 mM MgCl2,10 mM HEPES, pH
7.4.
W W W. N A T U R E . C O M / N A T U R E | 1 1
SUPPLEMENTARY INFORMATION RESEARCH
Kato et al. Sup. Fig. S9
S102D
**
a
b
0
10
20
30
40
50
60
WT Q95A
o
ff (m
s)
02468
1012141618
on (m
s)
WT D292A E136AQ95A E129AE140A
E162A
*
K132A
*
N297D
**
E129Q
*
D292A
*
E162A
**
E136A
***
E129Q
**
E129A
**
E140A
**
N297D
***
S102D
***
K132A
**
***
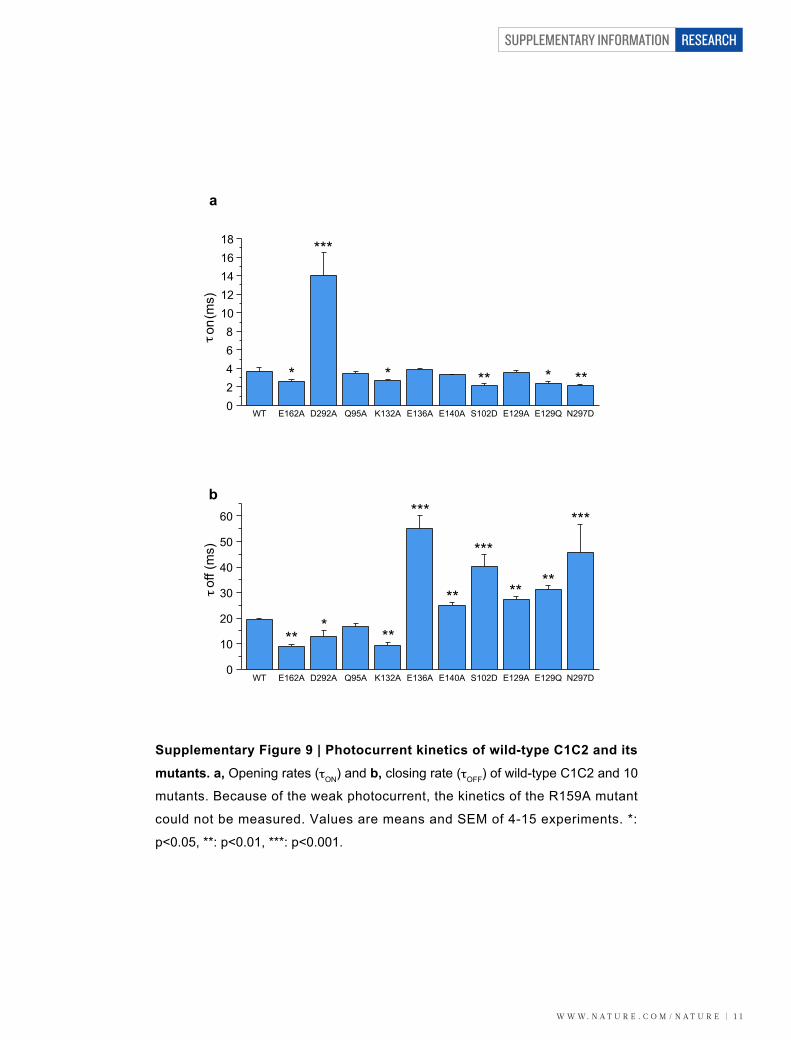
Supplementary Figure 9 | Photocurrent kinetics of wild-type C1C2 and its
mutants. a, Opening rates (τON) and b, closing rate (τOFF) of wild-type C1C2 and 10
mutants. Because of the weak photocurrent, the kinetics of the R159A mutant
could not be measured. Values are means and SEM of 4-15 experiments. *:
p<0.05, **: p<0.01, ***: p<0.001.
SUPPLEMENTARY INFORMATION
1 2 | W W W. N A T U R E . C O M / N A T U R E
RESEARCH
K209K209
K154K154R213R213
Kato et al. Sup. Fig. S10
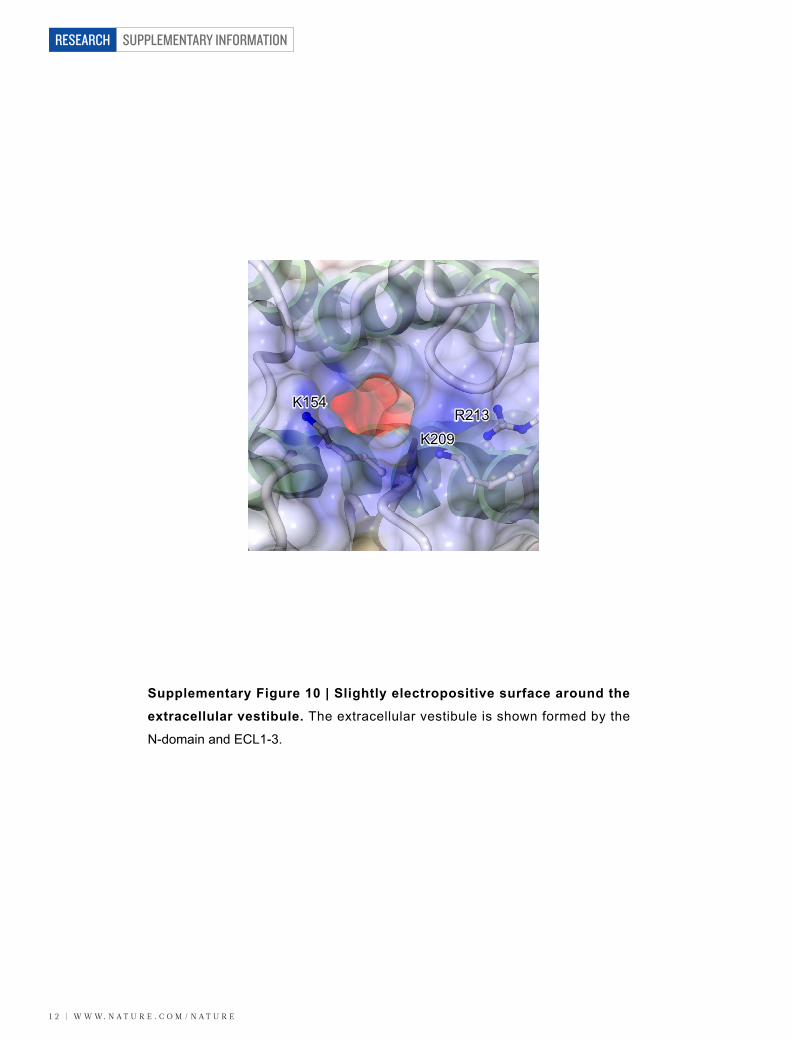
Supplementary Figure 10 | Slightly electropositive surface around the
extracellular vestibule. The extracellular vestibule is shown formed by the
N-domain and ECL1-3.
W W W. N A T U R E . C O M / N A T U R E | 1 3
SUPPLEMENTARY INFORMATION RESEARCH
Kato et al. Sup. Fig. S11
S284S284
R159R159 H2OH2O
E274E274
Y160Y160TM3TM3
TM6TM6
TM7TM7
ATRATR
H2OH2O S284(E204)S284
(E204)
R159(R82)R159(R82)
H2OH2O
E274(E194)E274
(E194)
Y160(Y83)Y160(Y83)
TM3TM3
TM6TM6
TM7TM7
ATRATR
H2OH2O
a b
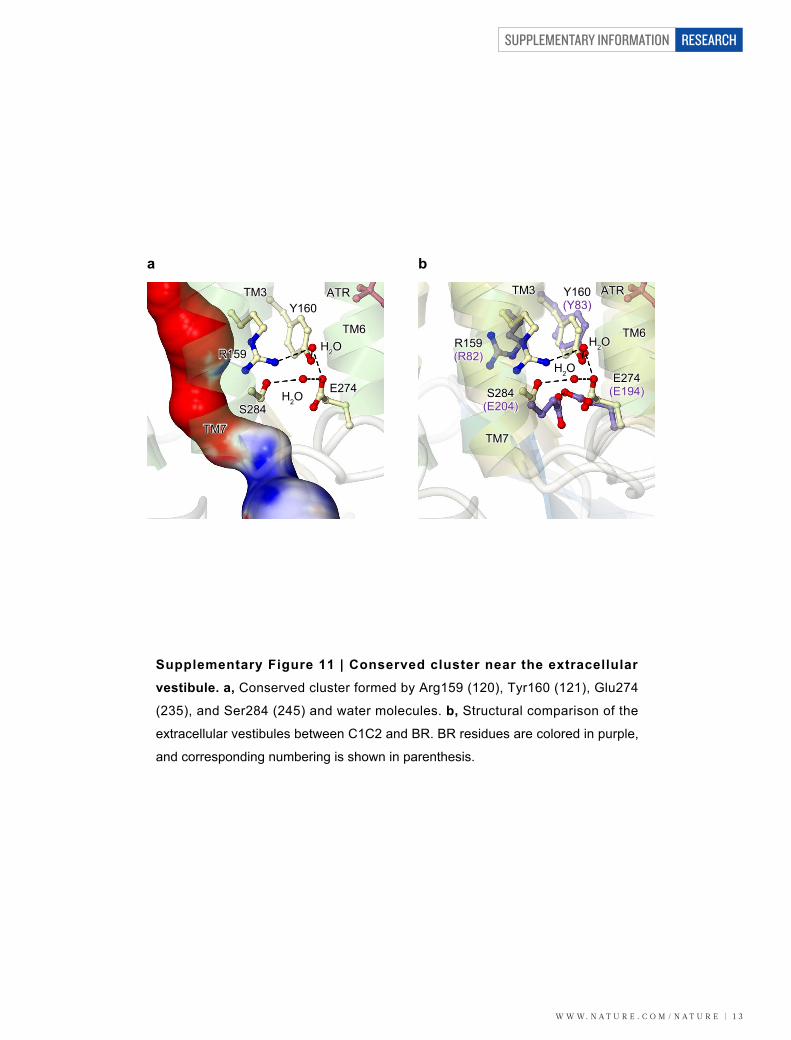
Supplementary Figure 11 | Conserved cluster near the extracellular
vestibule. a, Conserved cluster formed by Arg159 (120), Tyr160 (121), Glu274
(235), and Ser284 (245) and water molecules. b, Structural comparison of the
extracellular vestibules between C1C2 and BR. BR residues are colored in purple,
and corresponding numbering is shown in parenthesis.

SUPPLEMENTARY INFORMATION
1 4 | W W W. N A T U R E . C O M / N A T U R E
RESEARCH
Kato et al. Sup. Fig. S12
a
N297D
***
0.0
0.2
0.4
0.6
0.8
1.0
WT D292A E136AE162A K132AQ95A E140A
I
Ca
/I Na
E129Q
***
E129A
***
S102D
*
S102D
c
0.0
0.5
1.0
1.5
2.0
2.5
3.0
3.5
WT E129AE140A N297D
I
K /I N
a
E129Q
*
E136A
**
E162A
**
D292A
**
K132A
***
Q95A
***
b
0.0
0.5
1.0
1.5
2.0
2.5
I H /I N
a
WT E136A E129QE129AE140A N297DS102D
D292A
***
K132A
**
E162A
***
Q95A
***
Supplementary Figure 12 | The ions selectivity of wild-type C1C2 and its
mutants. The ratio of photocurrents carried by a, Ca2+ and Na+; b, H+ and Na+; and
c, K+ and Na+. Because of the weak photocurrent, ion selectivity of the R159A
mutant could not be measured. Values are means and SEM of 4-15 experiments.
*: p<0.05, **: p<0.01, ***: p<0.001. Similar ion composition as in Supplementary
Figure 8 except NaCl was replaced by KCl (140 mM) or CaCl2 (90 mM) or NMDG
(135 mM + 5 mM NaCl), pH 6.4.

W W W. N A T U R E . C O M / N A T U R E | 1 5
SUPPLEMENTARY INFORMATION RESEARCH
Kato et al. Sup. Fig. S13
a bE129A
N297D0 500 1000 1500 2000
0 500 1000 1500 2000
Time (ms)
E129Q
0 500 1000 1500 2000-1000
-800
-600
-400
-200
0
200
400
Cur
rent
(pA
)
Time (ms)
S102D
0 500 1000 1500 2000
-1000-800-600-400-200
0200400600
Cur
rent
(pA
)
0
5
10
15
20
25
WT E129Q
**
E129A N297D
*
S102D
Cur
rent
den
sity
(pA
/pF)
Supplementary Figure 13 | The photocurrents of wild-type C1C2 and its
gating mutants. a, Effects of the mutations of S102, E129, and N297 on
photocurrent. b, The peak amplitudes of the photocurrents, normalized by cell
capacitance. Values are means and SEM of 4-8 experiments. *: p<0.05, **:
p<0.01.

SUPPLEMENTARY INFORMATION
1 6 | W W W. N A T U R E . C O M / N A T U R E
RESEARCH
ATRATR
Y109
TM1
Kato et al. Sup. Fig. S14
Supplementary Figure 14 | B-factor distribution of C1C2. B-factor distribution
of the C1C2 monomer. The B-factors are colored in a gradient varying from blue
(the lowest values) to red (the highest values). Disordered regions are shown as
dotted lines.
W W W. N A T U R E . C O M / N A T U R E | 1 7
SUPPLEMENTARY INFORMATION RESEARCH
E122E122
H2O
H2O
T98
S102 N297
E129
TM7TM7
H173H173
ATRATR
TM2TM2
K296K296
TM3TM3
TM6TM6
10.010.0
E122E122
H2O
H2O
T98
S102 N297
E1295.95.9
Kato et al. Sup. Fig. S15
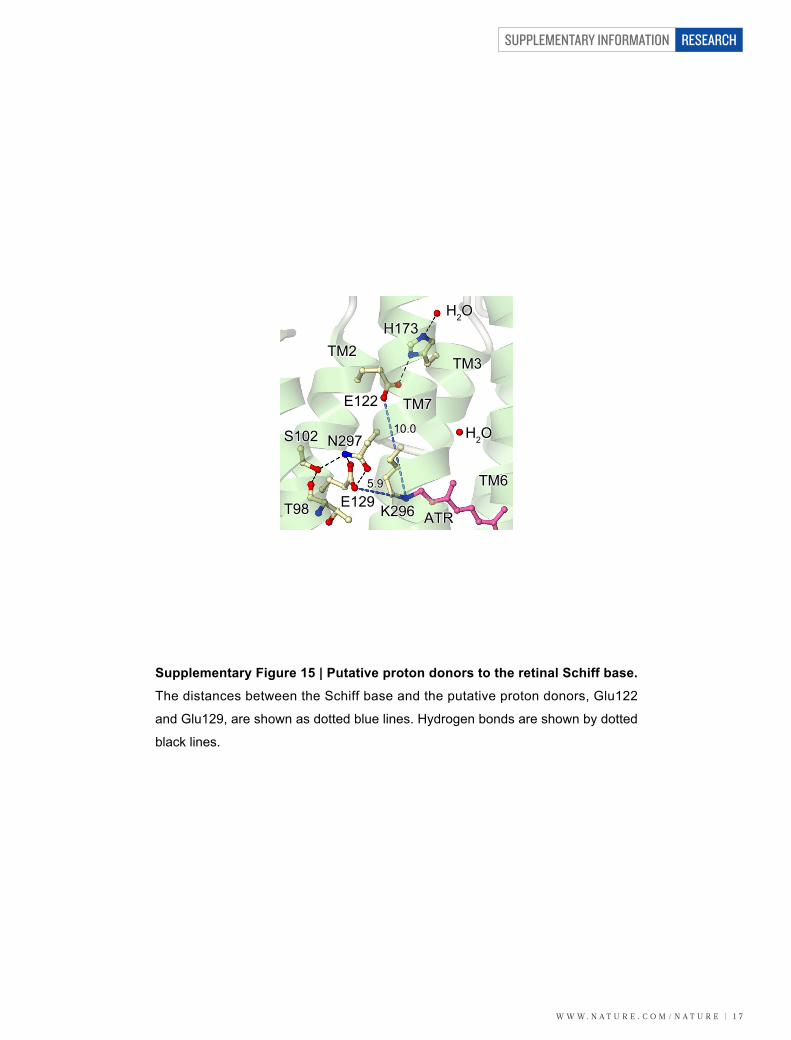
Supplementary Figure 15 | Putative proton donors to the retinal Schiff base.
The distances between the Schiff base and the putative proton donors, Glu122
and Glu129, are shown as dotted blue lines. Hydrogen bonds are shown by dotted
black lines.
SUPPLEMENTARY INFORMATION
1 8 | W W W. N A T U R E . C O M / N A T U R E
RESEARCH
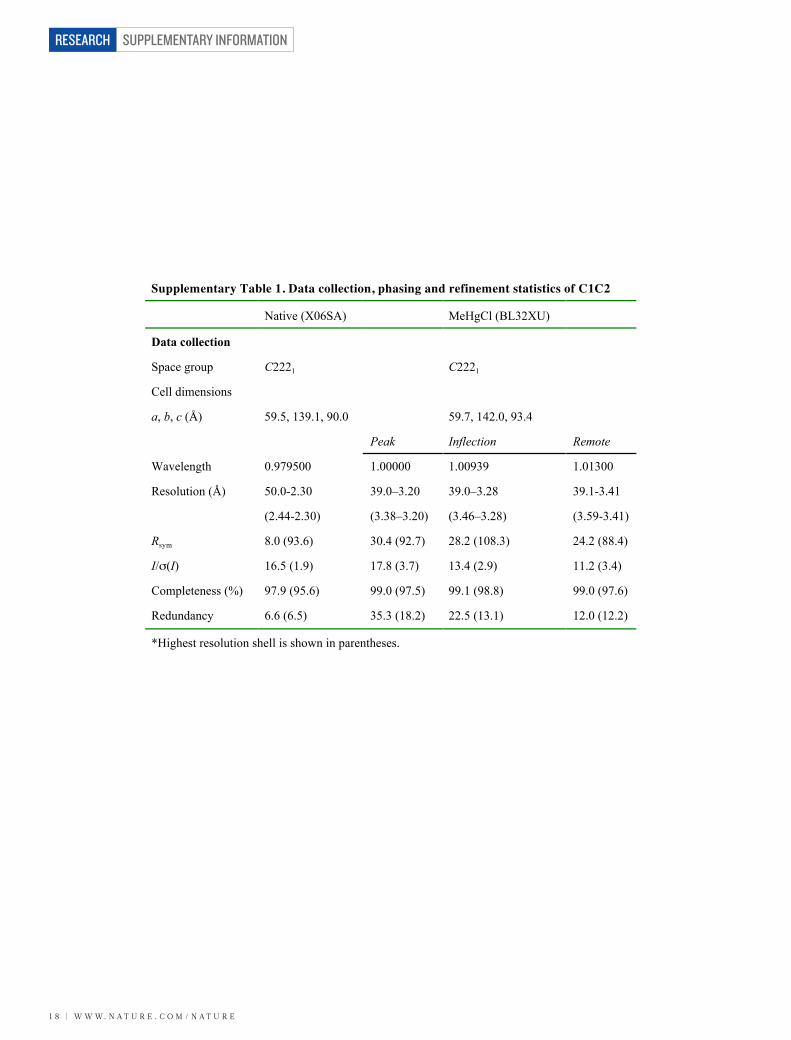
�S�u�p�p�l�e�m�e�n�t�a�r�y� �T�a�b�l�e� �1�.� �D�a�t�a� �c�o�l�l�e�c�t�i�o�n�,� �p�h�a�s�i�n�g� �a�n�d� �r�e�f�i�n�e�m�e�n�t� �s�t�a�t�i�s�t�i�c�s� �o�f� �C�1�C�2�
Native (X06SA) MeHgCl (BL32XU)
Data collection
Space group C2221 C2221
Cell dimensions
a, b, c (Å) 59.5, 139.1, 90.0 59.7, 142.0, 93.4
Peak Inflection Remote
Wavelength 0.979500 1.00000 1.00939 1.01300
Resolution (Å) 50.0-2.30
(2.44-2.30)
39.0–3.20
(3.38–3.20)
39.0–3.28
(3.46–3.28)
39.1-3.41
(3.59-3.41)
Rsym 8.0 (93.6) 30.4 (92.7) 28.2 (108.3) 24.2 (88.4)
I/ (I) 16.5 (1.9) 17.8 (3.7) 13.4 (2.9) 11.2 (3.4)
Completeness (%) 97.9 (95.6) 99.0 (97.5) 99.1 (98.8) 99.0 (97.6)
Redundancy 6.6 (6.5) 35.3 (18.2) 22.5 (13.1) 12.0 (12.2)
*Highest resolution shell is shown in parentheses.
W W W. N A T U R E . C O M / N A T U R E | 1 9
SUPPLEMENTARY INFORMATION RESEARCH
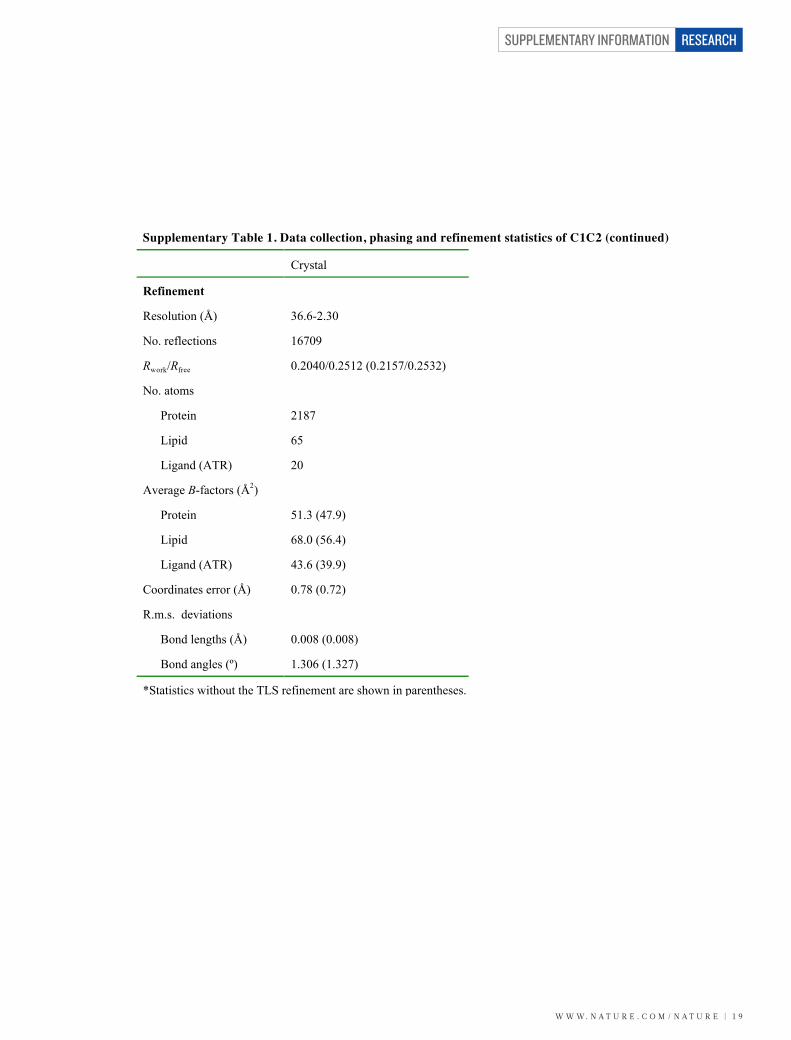
�S�u�p�p�l�e�m�e�n�t�a�r�y� �T�a�b�l�e� �1�.� �D�a�t�a� �c�o�l�l�e�c�t�i�o�n�,� �p�h�a�s�i�n�g� �a�n�d� �r�e�f�i�n�e�m�e�n�t� �s�t�a�t�i�s�t�i�c�s� �o�f� �C�1�C�2� �(�c�o�n�t�i�n�u�e�d�)�
Crystal
Refinement
Resolution (Å) 36.6-2.30
No. reflections 16709
Rwork/Rfree 0.2040/0.2512 (0.2157/0.2532)
No. atoms
Protein 2187
Lipid 65
Ligand (ATR) 20
Average B-factors (Å2)
Protein 51.3 (47.9)
Lipid 68.0 (56.4)
Ligand (ATR) 43.6 (39.9)
Coordinates error (Å) 0.78 (0.72)
R.m.s. deviations
Bond lengths (Å) 0.008 (0.008)
Bond angles (º) 1.306 (1.327)
*Statistics without the TLS refinement are shown in parentheses.

SUPPLEMENTARY INFORMATION
2 0 | W W W. N A T U R E . C O M / N A T U R E
RESEARCH
Supplementary Table 2. pKas calculated using PROPKA
Residue name
Calculated-pKa
Model-pKa
Asp292 3.21 3.80
Glu122 8.33 4.50
Glu129 9.31 4.50
Glu162 5.83 4.50
His173 1.33 6.50