SUPPLEMENTARY INFORMATION SMN2 Splice Modulators Enhance ... · SUPPLEMENTARY INFORMATION SMN2...
20
SUPPLEMENTARY INFORMATION SMN2 Splice Modulators Enhance U1/pre-mRNA Association and Rescue SMA Mice James Palacino 1,3 , Susanne E. Swalley 1,3 * , Cheng Song 1,3 , Atwood K. Cheung 1 , Lei Shu 1 , Xiaolu Zhang 1 , Mailin Van Hoosear 1 , Youngah Shin 1 , Donovan N. Chin 1 , Caroline Gubser Keller 2 , Martin Beibel 2 , Nicole A. Renaud 1 , Thomas M. Smith 1 , Michael Salcius 1 , Xiaoying Shi 1 , Marc Hild 1 , Rebecca Servais 1 , Monish Jain 1 , Lin Deng 1 , Caroline Bullock 1 , Michael McLellan 1 , Sven Schuierer 2 , Leo Murphy 1 , Marcel J.J. Blommers 2 , Cecile Blaustein 1 , Frada Berenshteyn 1 , Arnaud Lacoste 1 , Jason R. Thomas 1 , Guglielmo Roma 2 , Gregory A. Michaud 1 , Brian S. Tseng 1 , Jeffery A. Porter 1 , Vic E. Myer 1 , John A. Tallarico 1 , Lawrence G. Hamann 1 , Daniel Curtis 1 , Mark C. Fishman 1 , William F. Dietrich 1 , Natalie A. Dales 1 & Rajeev Sivasankaran 1 * 1 Novartis Institutes for Biomedical Research, Cambridge, MA, USA and 2 Basel, Switzerland. 3 These authors contributed equally to this work *Correspondence and requests for materials should be addressed to S.E.S. ([email protected]) and R.S. ([email protected]). Nature Chemical Biology: doi:10.1038/nchembio.1837
Transcript of SUPPLEMENTARY INFORMATION SMN2 Splice Modulators Enhance ... · SUPPLEMENTARY INFORMATION SMN2...
SUPPLEMENTARY INFORMATION
SMN2 Splice Modulators Enhance U1/pre-mRNA Association and Rescue SMA Mice
James Palacino1,3, Susanne E. Swalley1,3*, Cheng Song1,3, Atwood K. Cheung1, Lei Shu1, Xiaolu
Zhang1, Mailin Van Hoosear1, Youngah Shin1, Donovan N. Chin1, Caroline Gubser Keller2,
Martin Beibel2, Nicole A. Renaud1, Thomas M. Smith1, Michael Salcius1, Xiaoying Shi1, Marc
Hild1, Rebecca Servais1, Monish Jain1, Lin Deng1, Caroline Bullock1, Michael McLellan1, Sven
Schuierer2, Leo Murphy1, Marcel J.J. Blommers2, Cecile Blaustein1, Frada Berenshteyn1,
Arnaud Lacoste1, Jason R. Thomas1, Guglielmo Roma2, Gregory A. Michaud1, Brian S. Tseng1,
Jeffery A. Porter1, Vic E. Myer1, John A. Tallarico1, Lawrence G. Hamann1, Daniel Curtis1,
Mark C. Fishman1, William F. Dietrich1, Natalie A. Dales1 & Rajeev Sivasankaran1*
1Novartis Institutes for Biomedical Research, Cambridge, MA, USA and 2Basel, Switzerland.
3These authors contributed equally to this work
*Correspondence and requests for materials should be addressed to S.E.S.
([email protected]) and R.S. ([email protected]).
Nature Chemical Biology: doi:10.1038/nchembio.1837
‐ S2 -
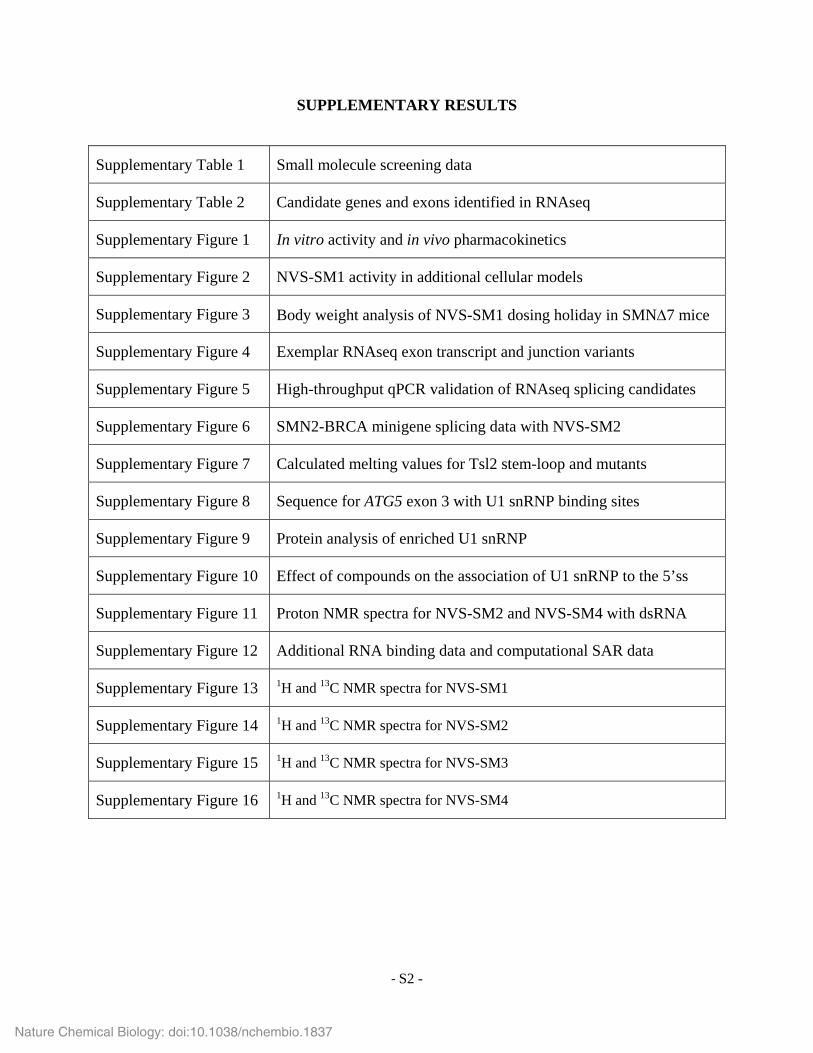
SUPPLEMENTARY RESULTS
Supplementary Table 1 Small molecule screening data
Supplementary Table 2 Candidate genes and exons identified in RNAseq
Supplementary Figure 1 In vitro activity and in vivo pharmacokinetics
Supplementary Figure 2 NVS-SM1 activity in additional cellular models
Supplementary Figure 3 Body weight analysis of NVS-SM1 dosing holiday in SMN7 mice
Supplementary Figure 4 Exemplar RNAseq exon transcript and junction variants
Supplementary Figure 5 High-throughput qPCR validation of RNAseq splicing candidates
Supplementary Figure 6 SMN2-BRCA minigene splicing data with NVS-SM2
Supplementary Figure 7 Calculated melting values for Tsl2 stem-loop and mutants
Supplementary Figure 8 Sequence for ATG5 exon 3 with U1 snRNP binding sites
Supplementary Figure 9 Protein analysis of enriched U1 snRNP
Supplementary Figure 10 Effect of compounds on the association of U1 snRNP to the 5’ss
Supplementary Figure 11 Proton NMR spectra for NVS-SM2 and NVS-SM4 with dsRNA
Supplementary Figure 12 Additional RNA binding data and computational SAR data
Supplementary Figure 13 1H and 13C NMR spectra for NVS-SM1
Supplementary Figure 14 1H and 13C NMR spectra for NVS-SM2
Supplementary Figure 15 1H and 13C NMR spectra for NVS-SM3
Supplementary Figure 16 1H and 13C NMR spectra for NVS-SM4
Nature Chemical Biology: doi:10.1038/nchembio.1837
‐ S3 -
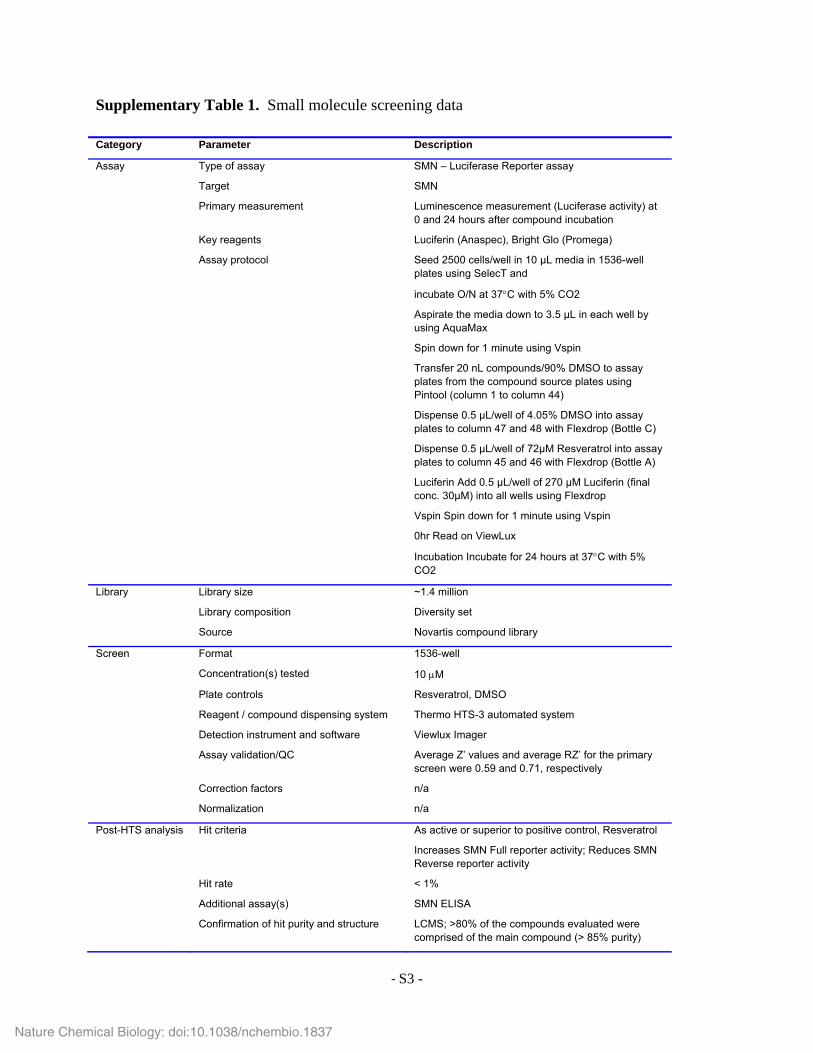
Supplementary Table 1. Small molecule screening data
Category Parameter Description
Assay Type of assay SMN – Luciferase Reporter assay
Target SMN
Primary measurement Luminescence measurement (Luciferase activity) at 0 and 24 hours after compound incubation
Key reagents Luciferin (Anaspec), Bright Glo (Promega)
Assay protocol Seed 2500 cells/well in 10 μL media in 1536-well plates using SelecT and
incubate O/N at 37C with 5% CO2
Aspirate the media down to 3.5 μL in each well by using AquaMax
Spin down for 1 minute using Vspin
Transfer 20 nL compounds/90% DMSO to assay plates from the compound source plates using Pintool (column 1 to column 44)
Dispense 0.5 μL/well of 4.05% DMSO into assay plates to column 47 and 48 with Flexdrop (Bottle C)
Dispense 0.5 μL/well of 72μM Resveratrol into assay plates to column 45 and 46 with Flexdrop (Bottle A)
Luciferin Add 0.5 μL/well of 270 μM Luciferin (final conc. 30μM) into all wells using Flexdrop
Vspin Spin down for 1 minute using Vspin
0hr Read on ViewLux
Incubation Incubate for 24 hours at 37C with 5% CO2
Library Library size ~1.4 million
Library composition Diversity set
Source Novartis compound library
Screen Format 1536-well
Concentration(s) tested 10 M
Plate controls Resveratrol, DMSO
Reagent / compound dispensing system Thermo HTS-3 automated system
Detection instrument and software Viewlux Imager
Assay validation/QC Average Z’ values and average RZ’ for the primary screen were 0.59 and 0.71, respectively
Correction factors n/a
Normalization n/a
Post-HTS analysis Hit criteria As active or superior to positive control, Resveratrol
Increases SMN Full reporter activity; Reduces SMN Reverse reporter activity
Hit rate < 1%
Additional assay(s) SMN ELISA
Confirmation of hit purity and structure LCMS; >80% of the compounds evaluated were comprised of the main compound (> 85% purity)
Nature Chemical Biology: doi:10.1038/nchembio.1837
‐ S4 -
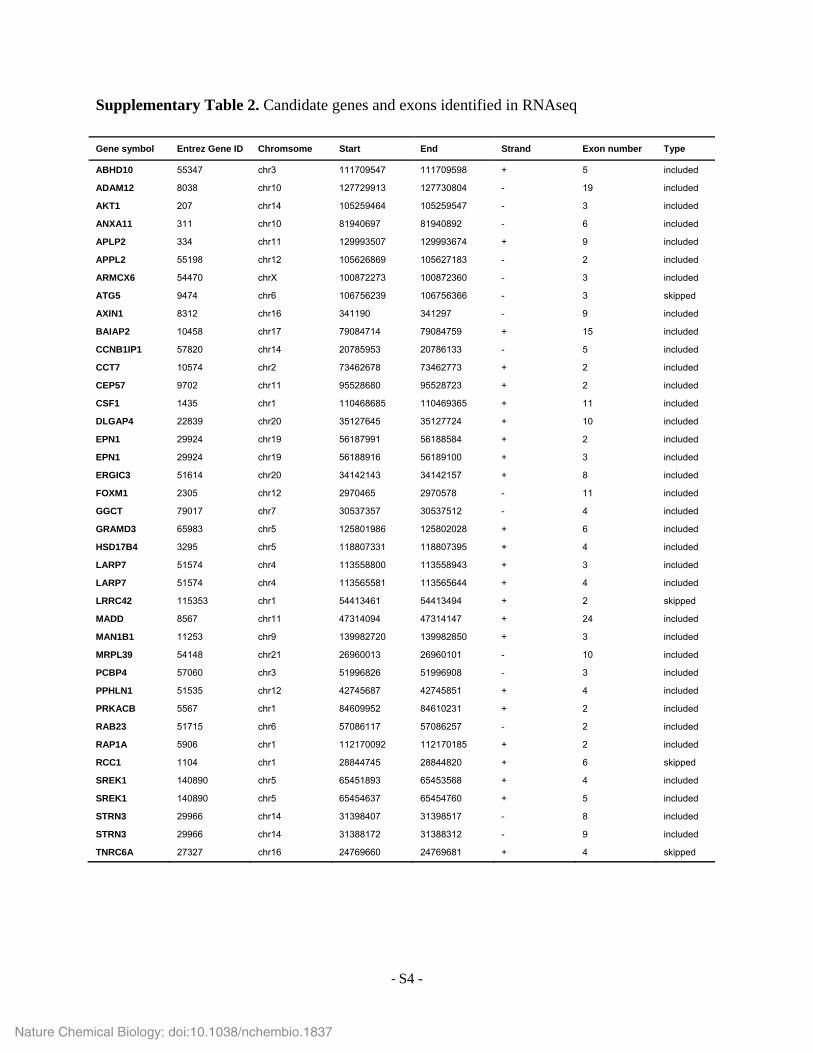
Supplementary Table 2. Candidate genes and exons identified in RNAseq
Gene symbol Entrez Gene ID Chromsome Start End Strand Exon number Type
ABHD10 55347 chr3 111709547 111709598 + 5 included
ADAM12 8038 chr10 127729913 127730804 - 19 included
AKT1 207 chr14 105259464 105259547 - 3 included
ANXA11 311 chr10 81940697 81940892 - 6 included
APLP2 334 chr11 129993507 129993674 + 9 included
APPL2 55198 chr12 105626869 105627183 - 2 included
ARMCX6 54470 chrX 100872273 100872360 - 3 included
ATG5 9474 chr6 106756239 106756366 - 3 skipped
AXIN1 8312 chr16 341190 341297 - 9 included
BAIAP2 10458 chr17 79084714 79084759 + 15 included
CCNB1IP1 57820 chr14 20785953 20786133 - 5 included
CCT7 10574 chr2 73462678 73462773 + 2 included
CEP57 9702 chr11 95528680 95528723 + 2 included
CSF1 1435 chr1 110468685 110469365 + 11 included
DLGAP4 22839 chr20 35127645 35127724 + 10 included
EPN1 29924 chr19 56187991 56188584 + 2 included
EPN1 29924 chr19 56188916 56189100 + 3 included
ERGIC3 51614 chr20 34142143 34142157 + 8 included
FOXM1 2305 chr12 2970465 2970578 - 11 included
GGCT 79017 chr7 30537357 30537512 - 4 included
GRAMD3 65983 chr5 125801986 125802028 + 6 included
HSD17B4 3295 chr5 118807331 118807395 + 4 included
LARP7 51574 chr4 113558800 113558943 + 3 included
LARP7 51574 chr4 113565581 113565644 + 4 included
LRRC42 115353 chr1 54413461 54413494 + 2 skipped
MADD 8567 chr11 47314094 47314147 + 24 included
MAN1B1 11253 chr9 139982720 139982850 + 3 included
MRPL39 54148 chr21 26960013 26960101 - 10 included
PCBP4 57060 chr3 51996826 51996908 - 3 included
PPHLN1 51535 chr12 42745687 42745851 + 4 included
PRKACB 5567 chr1 84609952 84610231 + 2 included
RAB23 51715 chr6 57086117 57086257 - 2 included
RAP1A 5906 chr1 112170092 112170185 + 2 included
RCC1 1104 chr1 28844745 28844820 + 6 skipped
SREK1 140890 chr5 65451893 65453568 + 4 included
SREK1 140890 chr5 65454637 65454760 + 5 included
STRN3 29966 chr14 31398407 31398517 - 8 included
STRN3 29966 chr14 31388172 31388312 - 9 included
TNRC6A 27327 chr16 24769660 24769681 + 4 skipped
Nature Chemical Biology: doi:10.1038/nchembio.1837
a b
c
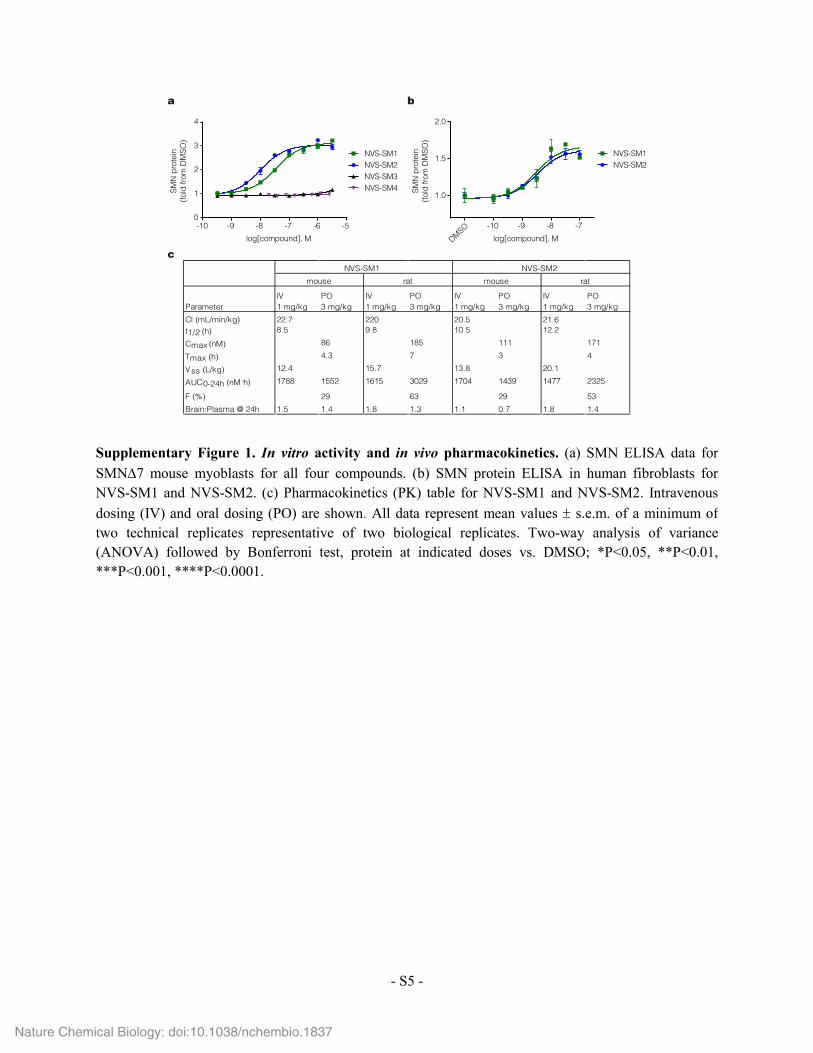
ParameterIV 1 mg/kg
PO 3 mg/kg
IV 1 mg/kg
PO 3 mg/kg
IV 1 mg/kg
PO 3 mg/kg
IV 1 mg/kg
PO 3 mg/kg
Cl (mL/min/kg) 22.7 220 20.5 21.6t1/2 (h) 8.5 9.8 10.5 12.2
Cmax (nM) 86 185 111 171
Tmax (h) 4.3 7 3 4
Vss (L/kg) 12.4 15.7 13.8 20.1
AUC0-24h (nM.h) 1788 1552 1615 3029 1704 1439 1477 2325
F (%) 29 63 29 53
Brain:Plasma @ 24h 1.5 1.4 1.8 1.3 1.1 0.7 1.8 1.4
NVS-SM1 NVS-SM2
mouse rat mouse rat
-10 -9 -8 -7 -6 -50
1
2
3
4
log[compound], M
NVS-SM3
NVS-SM1NVS-SM2
NVS-SM4SMN
pro
tein
(fold
from
DM
SO)
NVS-SM1NVS-SM2
-10 -9 -8 -7
1.0
1.5
2.0
SMN
pro
tein
(fold
from
DM
SO)
DMSOlog[compound], M
- S5 -
Supplementary Figure 1. In vitro activity and in vivo pharmacokinetics. (a) SMN ELISA data for SMN∆7 mouse myoblasts for all four compounds. (b) SMN protein ELISA in human fibroblasts for NVS-SM1 and NVS-SM2. (c) Pharmacokinetics (PK) table for NVS-SM1 and NVS-SM2. Intravenous dosing (IV) and oral dosing (PO) are shown. All data represent mean values ± s.e.m. of a minimum of two technical replicates representative of two biological replicates. Two-way analysis of variance (ANOVA) followed by Bonferroni test, protein at indicated doses vs. DMSO; *P<0.05, **P<0.01, ***P<0.001, ****P<0.0001.
Nature Chemical Biology: doi:10.1038/nchembio.1837
a
4
0
1
2
3
Rel
ativ
e tra
nscr
ipt l
evel
s
SMNd7SMN_fl
0.5
1.5
2.5
3.5
*****
*
00.1
00.3
2 1.0 3.2 10 32 100
320
NVS-SM1 (nM)
0
1
2
0.5
1.5
2.5
**
*** ***
SMN
pro
tein
(fold
from
DM
SO)
00.1
00.3
2 1.0 3.2 10 32 100
320
NVS-SM1 (nM)
b c
NVS-SM1 (nM)
0 5 25 50
2.0
1.5
1.0
0.5
0.0
**
****
****Rel
ativ
e tra
nsci
rpt l
evel
s
SMNd7SMN_fl
- S6 -
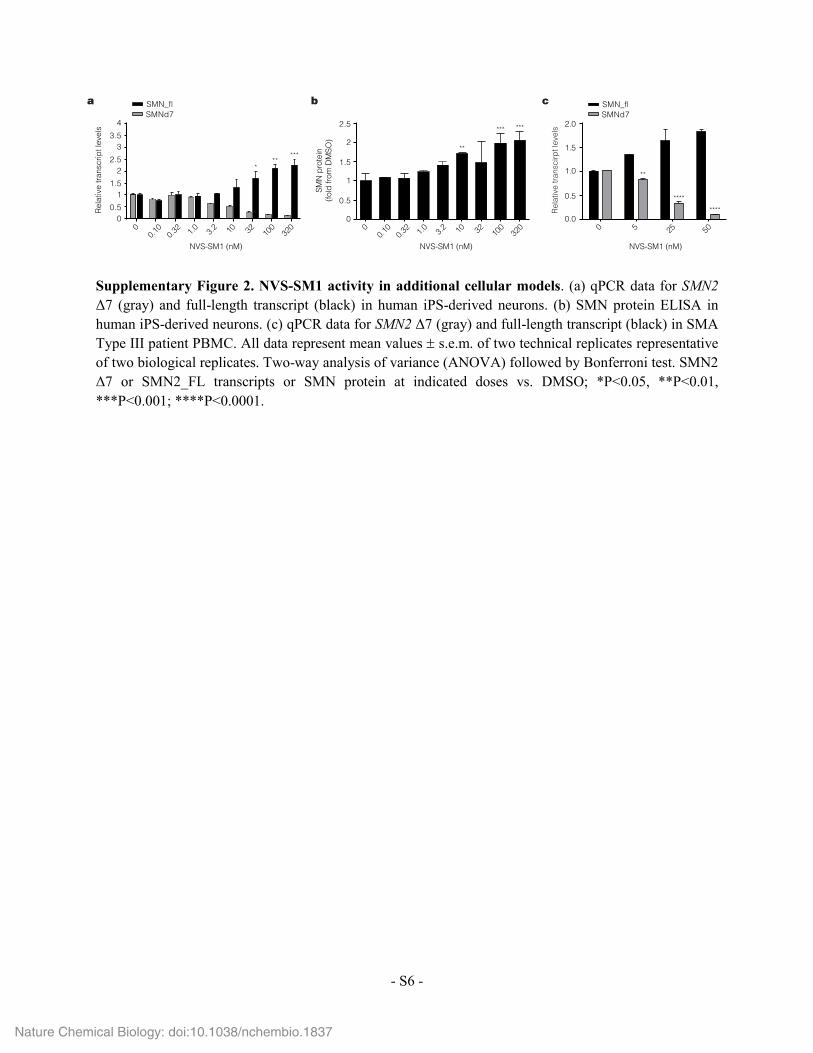
Supplementary Figure 2. NVS-SM1 activity in additional cellular models. (a) qPCR data for SMN2 Δ7 (gray) and full-length transcript (black) in human iPS-derived neurons. (b) SMN protein ELISA in human iPS-derived neurons. (c) qPCR data for SMN2 Δ7 (gray) and full-length transcript (black) in SMA Type III patient PBMC. All data represent mean values ± s.e.m. of two technical replicates representative of two biological replicates. Two-way analysis of variance (ANOVA) followed by Bonferroni test. SMN2 Δ7 or SMN2_FL transcripts or SMN protein at indicated doses vs. DMSO; *P<0.05, **P<0.01, ***P<0.001; ****P<0.0001.
Nature Chemical Biology: doi:10.1038/nchembio.1837
Age (days)
0 10 20 30 40 500
5
10
15
2033 days on-drug, 14 days off47 days on-drug
Treatmentbegins
Wei
ght (
g)
Holidaybegins
- S7 -
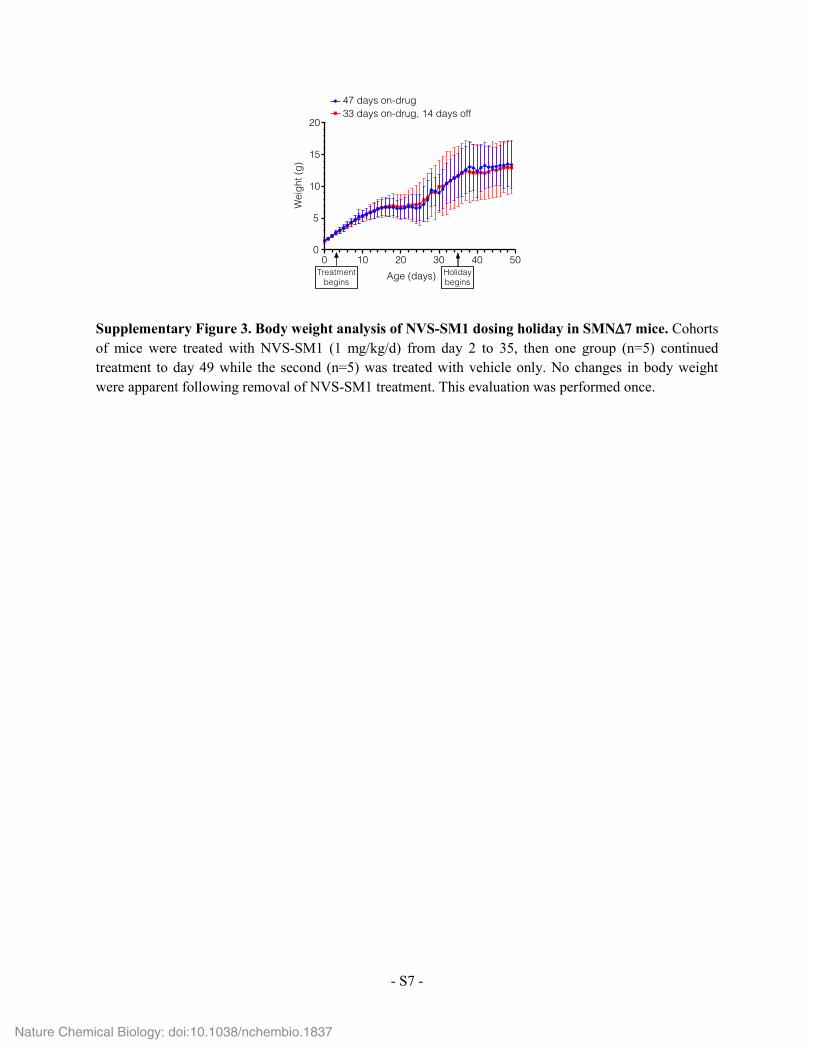
Supplementary Figure 3. Body weight analysis of NVS-SM1 dosing holiday in SMN∆7 mice. Cohorts of mice were treated with NVS-SM1 (1 mg/kg/d) from day 2 to 35, then one group (n=5) continued treatment to day 49 while the second (n=5) was treated with vehicle only. No changes in body weight were apparent following removal of NVS-SM1 treatment. This evaluation was performed once.
Nature Chemical Biology: doi:10.1038/nchembio.1837
Junctions: NVS-SM1
Junctions: NVS-SM3
a b
Junctions: NVS-SM1
Junctions: NVS-SM3
1 2 3 4 5 6 7 8 9 10 11
1 2 3 4 5 6 7 8 9 10 11
log2
rel f
c
-20
2
log2
rel f
c
-20
2
log2
rel f
c
-1.0
0.5
2.0
log2
rel f
c
-1.0
0.5
2.0
1 2 3 4 5 6 7 8
1 2 3 4 5 6 7 8
Isof
orm
NM_004849Is
ofor
m NM_003502
NM_181050
AXIN1 ATG5
- S8 -
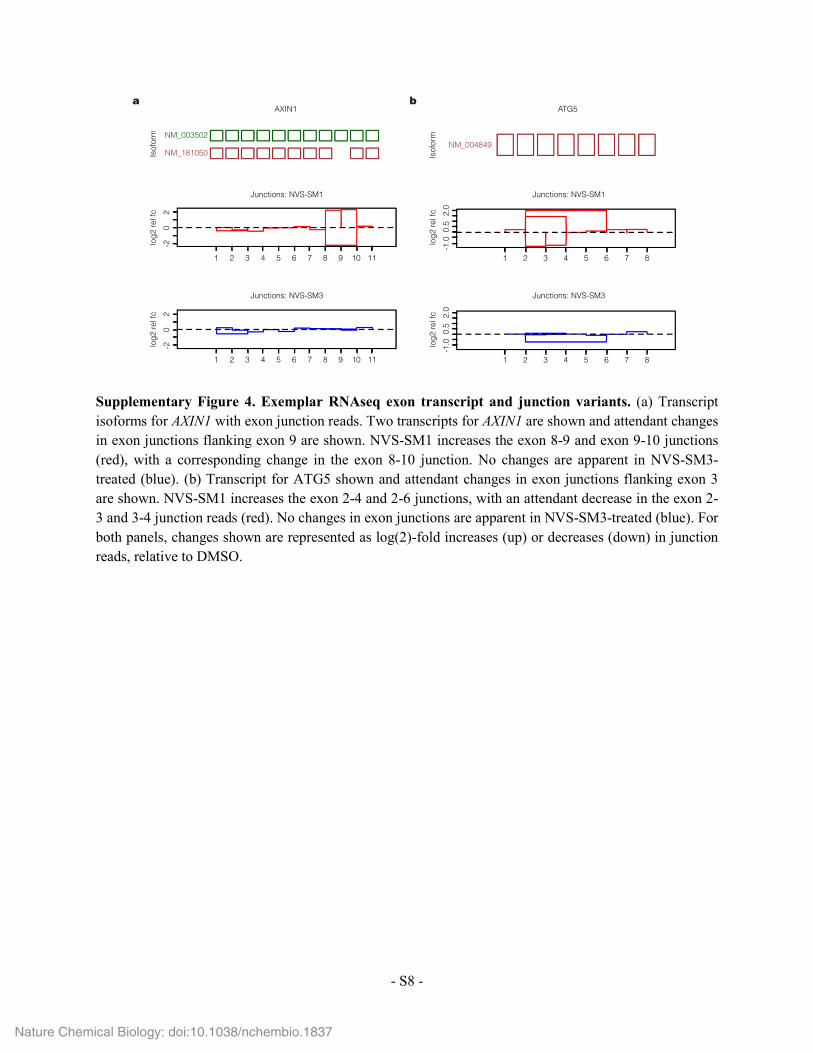
Supplementary Figure 4. Exemplar RNAseq exon transcript and junction variants. (a) Transcript isoforms for AXIN1 with exon junction reads. Two transcripts for AXIN1 are shown and attendant changes in exon junctions flanking exon 9 are shown. NVS-SM1 increases the exon 8-9 and exon 9-10 junctions (red), with a corresponding change in the exon 8-10 junction. No changes are apparent in NVS-SM3-treated (blue). (b) Transcript for ATG5 shown and attendant changes in exon junctions flanking exon 3 are shown. NVS-SM1 increases the exon 2-4 and 2-6 junctions, with an attendant decrease in the exon 2-3 and 3-4 junction reads (red). No changes in exon junctions are apparent in NVS-SM3-treated (blue). For both panels, changes shown are represented as log(2)-fold increases (up) or decreases (down) in junction reads, relative to DMSO.
Nature Chemical Biology: doi:10.1038/nchembio.1837
CCT7
RQ
0
5
10
15
20****
Exclud
ed
Includ
ed
CEP57
0.0
0.5
1.0
1.5
RQ
****
**
Exclud
ed
Includ
ed
CSF1
0.0
0.5
1.0
1.5
2.0
2.5
RQ
**
Exclud
ed
Includ
ed
FOXM1
0
1
2
3
4
5
RQ
****
Exclud
ed
Includ
ed
MADD
0
20
40
60
80
RQ
****
Exclud
ed
Includ
ed
SMN2
0.0
0.5
1.0
1.5
2.0
2.5
RQ
****
****
Exclud
ed
Includ
ed
STRN3
0
5
10
15
RQ
****
*
Exclud
ed
Includ
ed
ADAM12R
Q
0.0
0.5
1.0
1.5
****
Exclud
ed
Includ
ed
APLP2
0
2
4
6
RQ
****
*
Exclud
ed
Includ
ed
ARMCX6
0
2
4
6
RQ
****
Exclud
ed
Includ
ed
BAIAP2
0.0
0.5
1.0
1.5
2.0
RQ
*
***
Exclud
ed
Includ
ed
- S9 -
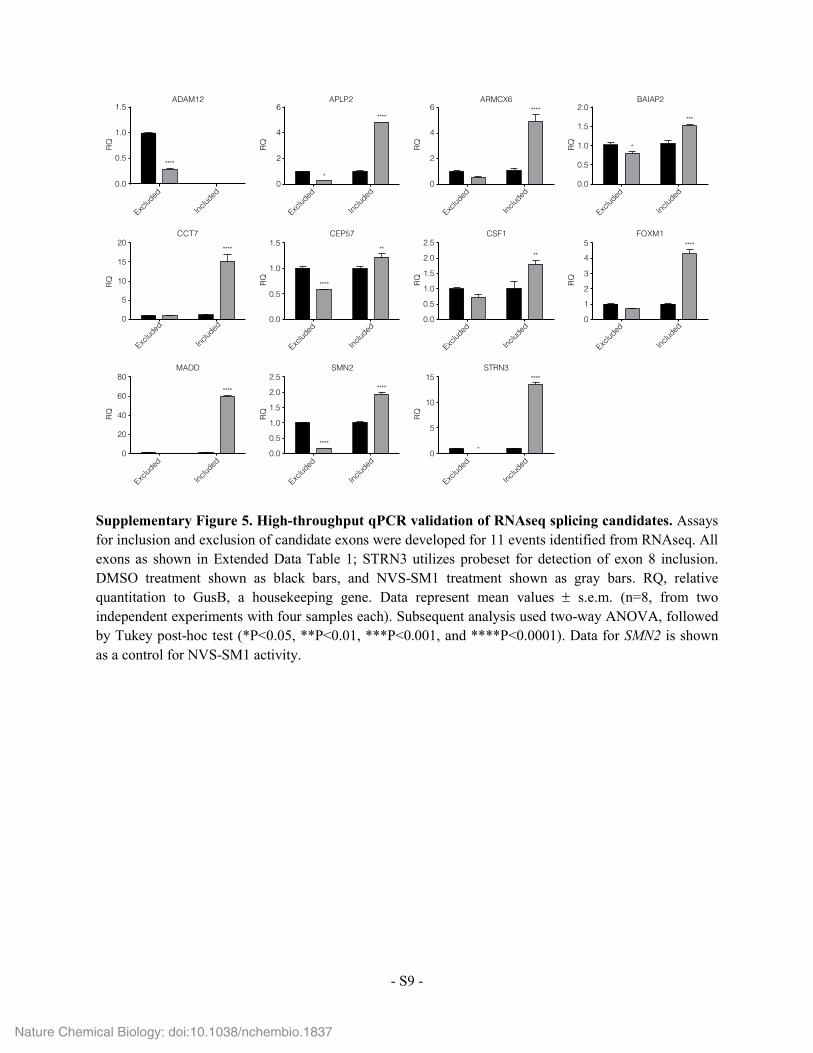
Supplementary Figure 5. High-throughput qPCR validation of RNAseq splicing candidates. Assays for inclusion and exclusion of candidate exons were developed for 11 events identified from RNAseq. All exons as shown in Extended Data Table 1; STRN3 utilizes probeset for detection of exon 8 inclusion. DMSO treatment shown as black bars, and NVS-SM1 treatment shown as gray bars. RQ, relative quantitation to GusB, a housekeeping gene. Data represent mean values ± s.e.m. (n=8, from two independent experiments with four samples each). Subsequent analysis used two-way ANOVA, followed by Tukey post-hoc test (*P<0.05, **P<0.01, ***P<0.001, and ****P<0.0001). Data for SMN2 is shown as a control for NVS-SM1 activity.
Nature Chemical Biology: doi:10.1038/nchembio.1837
a SMN1 E
Exon 6 Exon 7 Exon 8
SMN2E
Exon 6 Exon 7 Exon 8
BRCA - wild type E
Exon 17 Exon 18 Exon 19
BRCA - mutant E
Exon 19Exon 17 Exon 18
C
T
T
G SMN1SMN2
BRCA1 wt
BRCA1 mut
- Included- Skipped
b
0.001 0.01 0.1 10
20
40
60
80
100
NVS-SM2 (µM)
SMN2
BRCA1-MutBRCA1-WT
SMN1
Perc
enta
ge e
xon
incl
usio
n
c d
SMN1
SMN2
BRCA1 wt
BRCA1 mut
- Included- Skipped
- Included- Skipped
- Included
- Skipped
- Included- Skipped
- S10 -
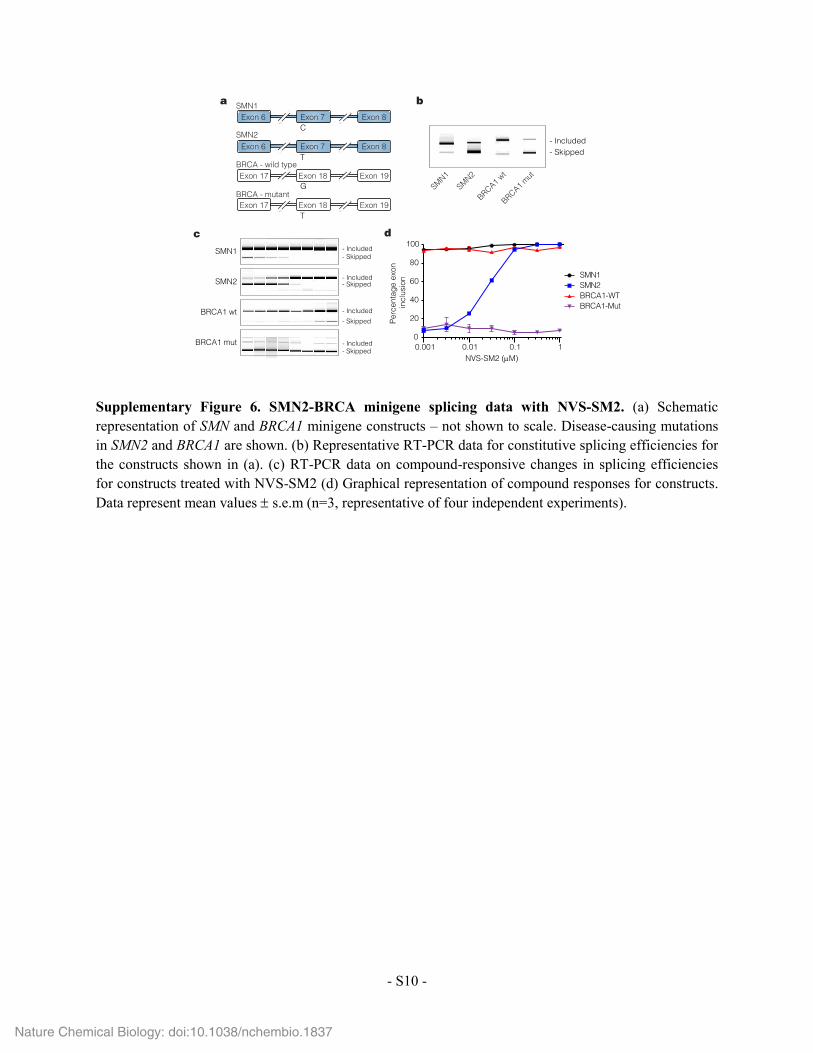
Supplementary Figure 6. SMN2-BRCA minigene splicing data with NVS-SM2. (a) Schematic representation of SMN and BRCA1 minigene constructs – not shown to scale. Disease-causing mutations in SMN2 and BRCA1 are shown. (b) Representative RT-PCR data for constitutive splicing efficiencies for the constructs shown in (a). (c) RT-PCR data on compound-responsive changes in splicing efficiencies for constructs treated with NVS-SM2 (d) Graphical representation of compound responses for constructs. Data represent mean values ± s.e.m (n=3, representative of four independent experiments).
Nature Chemical Biology: doi:10.1038/nchembio.1837
Tsl2 ∆G (kcal/mol)
Wild type
-1C
-2C
-15G
-16A
-5.66
-2.62
0.41
-1.28
-3.20
AA
UU
U
CC
GGAA
A U
AUU
CG
GA
U
U
AA
U
-1C-2C-15G
-16A
5´
3´Tsl2
C
- S11 -
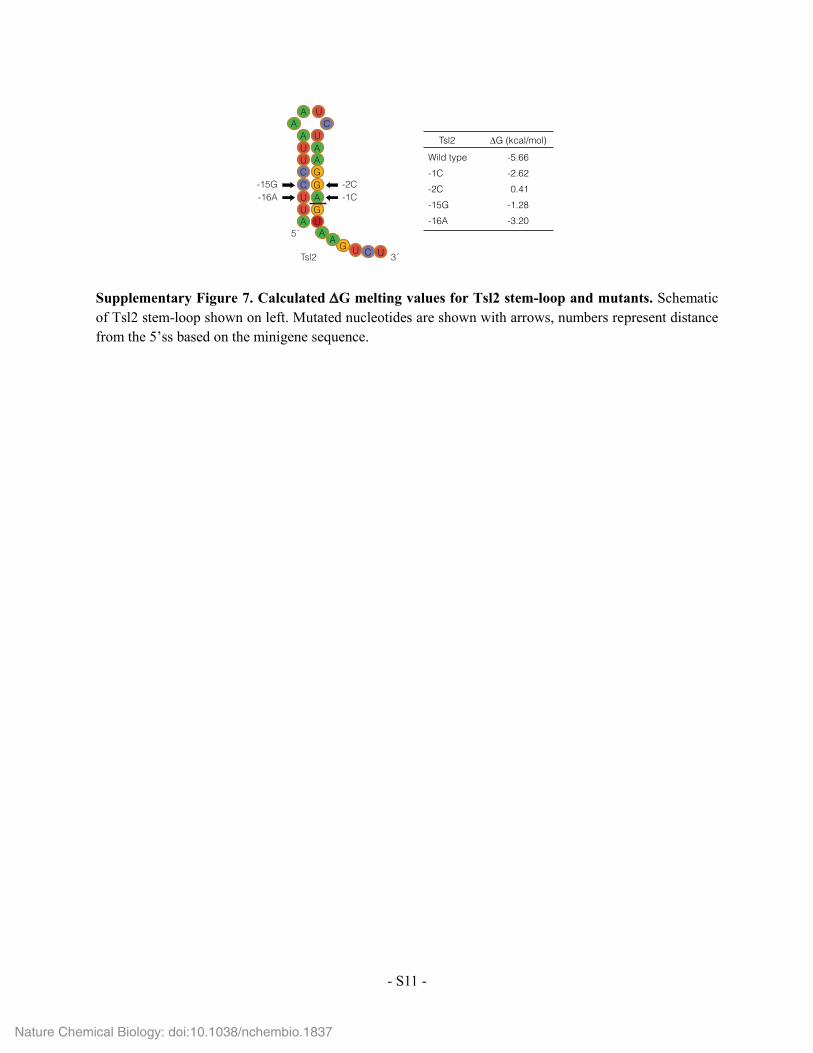
Supplementary Figure 7. Calculated ∆G melting values for Tsl2 stem-loop and mutants. Schematic of Tsl2 stem-loop shown on left. Mutated nucleotides are shown with arrows, numbers represent distance from the 5’ss based on the minigene sequence.
Nature Chemical Biology: doi:10.1038/nchembio.1837
5’UUGCUUUUGCCAAGAGUAAGUUAUUUGACGUUGGUAACUGACAAAGUGAAAAAGCACUUUCAGAAGGU
UAUGAGACAAGAAGACAUUAGUGAGAUAUGGUUUGAAUAUGAAUUCACACCACUGAAAUGgugaguga3’
MaxEnt = 9.35
MaxEnt = 10.13
E
Exon 2 Exon 3 Exon 4
U1 binding site
5´ ss
- S12 -
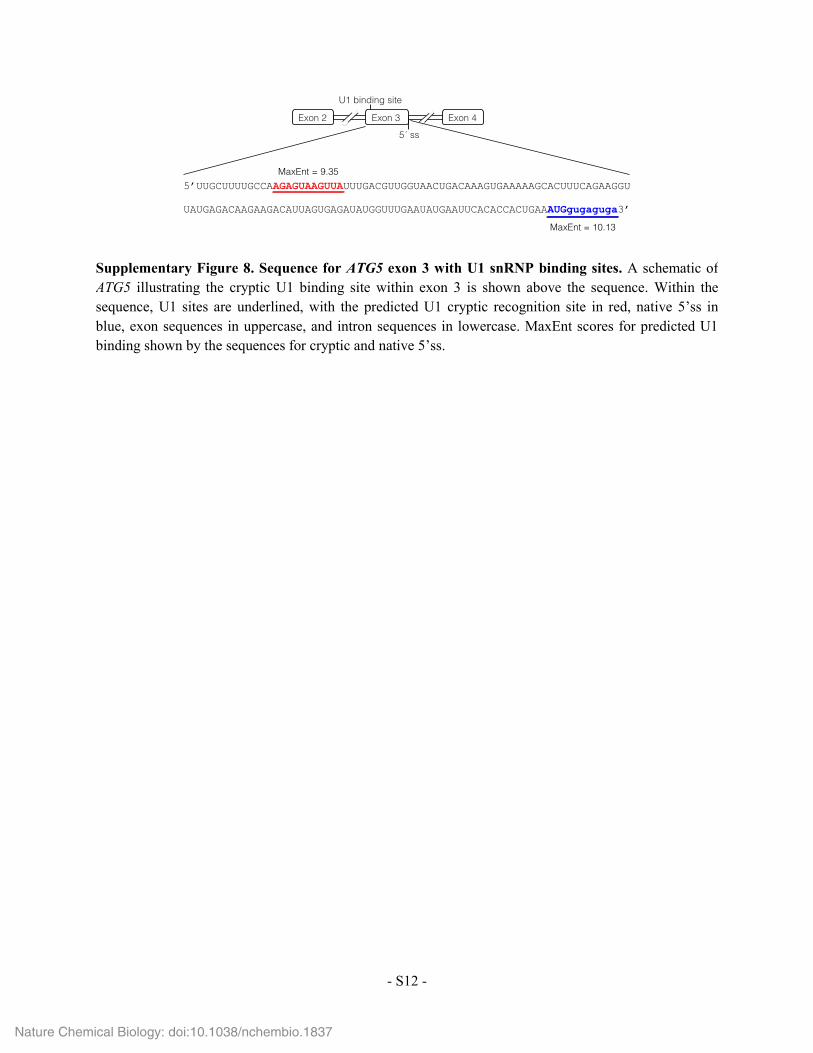
Supplementary Figure 8. Sequence for ATG5 exon 3 with U1 snRNP binding sites. A schematic of ATG5 illustrating the cryptic U1 binding site within exon 3 is shown above the sequence. Within the sequence, U1 sites are underlined, with the predicted U1 cryptic recognition site in red, native 5’ss in blue, exon sequences in uppercase, and intron sequences in lowercase. MaxEnt scores for predicted U1 binding shown by the sequences for cryptic and native 5’ss.
Nature Chemical Biology: doi:10.1038/nchembio.1837
a
U5
U5
U1-70k
U1AB, B´
U1CD1, D2, D3
EF, G
260
16011080
6050
40
30
2015
10
20
15
10
37
50
100
U1A
U1C
150
250
kDa
20
15
10
37
50
100
U1-70k
U1C
150
250
bkDa kDa
- S13 -
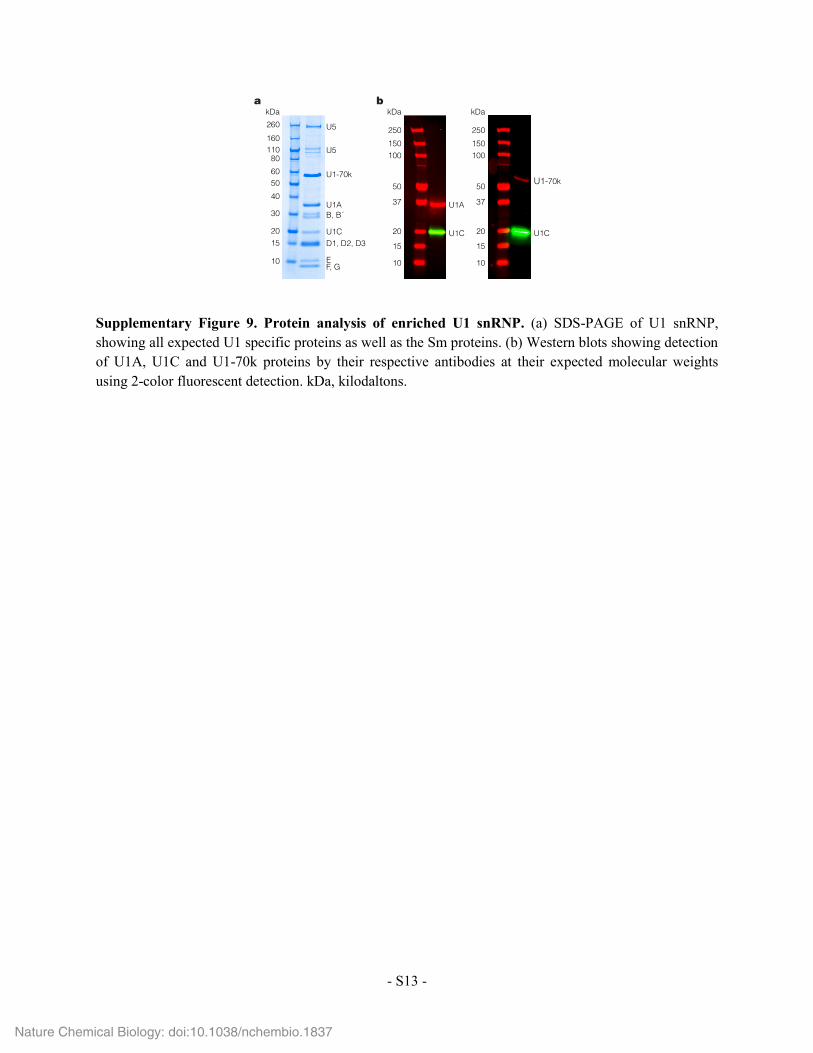
Supplementary Figure 9. Protein analysis of enriched U1 snRNP. (a) SDS-PAGE of U1 snRNP, showing all expected U1 specific proteins as well as the Sm proteins. (b) Western blots showing detection of U1A, U1C and U1-70k proteins by their respective antibodies at their expected molecular weights using 2-color fluorescent detection. kDa, kilodaltons.
Nature Chemical Biology: doi:10.1038/nchembio.1837
400
300
200
100
0
Time (s)
Res
pons
e (R
U)
U1 snRNP with DMSO
NVS-SM2 alone
50 100 150 200
U1 snRNP with NVS-SM2
400
300
200
100
0
400
200
0
600
Time (s) Time (s)
Res
pons
e un
its (R
U)
U1 snRNP with NVS-SM2
U1 snRNP with DMSO
U1 snRNP with NVS-SM4
U1 snRNP with DMSO
NVS-SM2 alone NVS-SM4 alone
50 100 150 200 50 100 150 200
- S14 -
Res
pons
e (R
U)
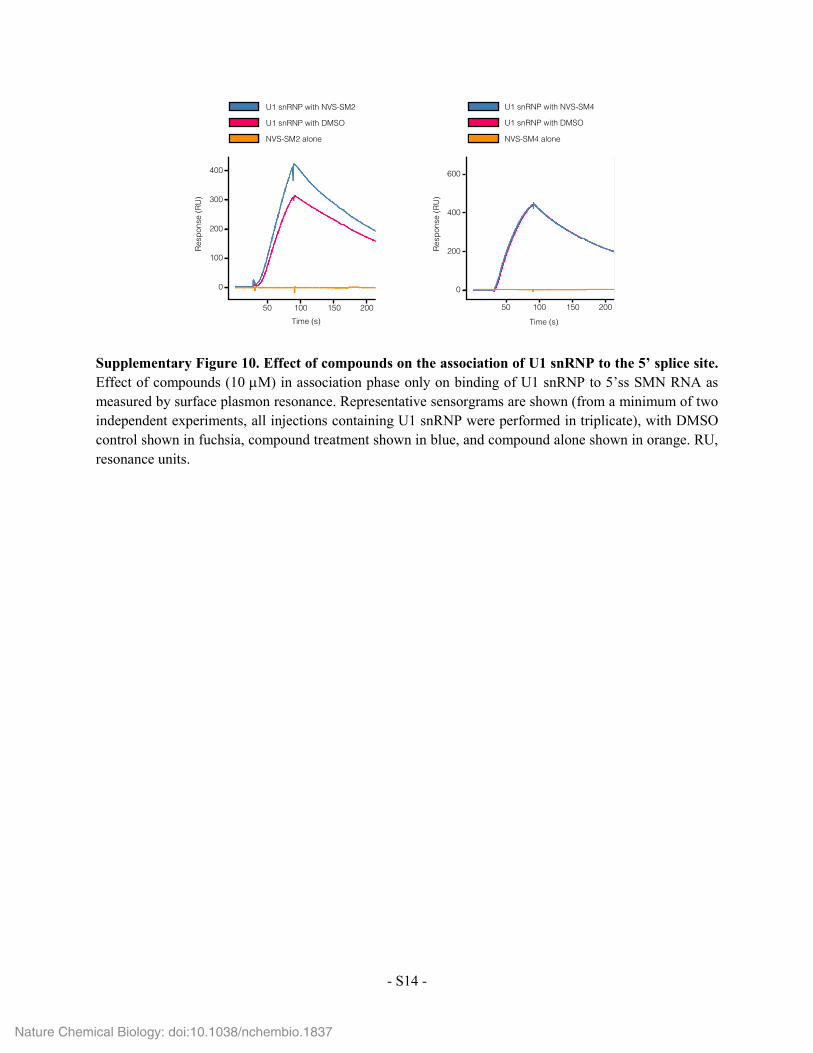
Supplementary Figure 10. Effect of compounds on the association of U1 snRNP to the 5’ splice site. Effect of compounds (10 µM) in association phase only on binding of U1 snRNP to 5’ss SMN RNA as measured by surface plasmon resonance. Representative sensorgrams are shown (from a minimum of two independent experiments, all injections containing U1 snRNP were performed in triplicate), with DMSO control shown in fuchsia, compound treatment shown in blue, and compound alone shown in orange. RU, resonance units.
Nature Chemical Biology: doi:10.1038/nchembio.1837
NVS-SM4 + dsRNANVS-SM4
NVS-SM2 + dsRNANVS-SM2
- S15 -
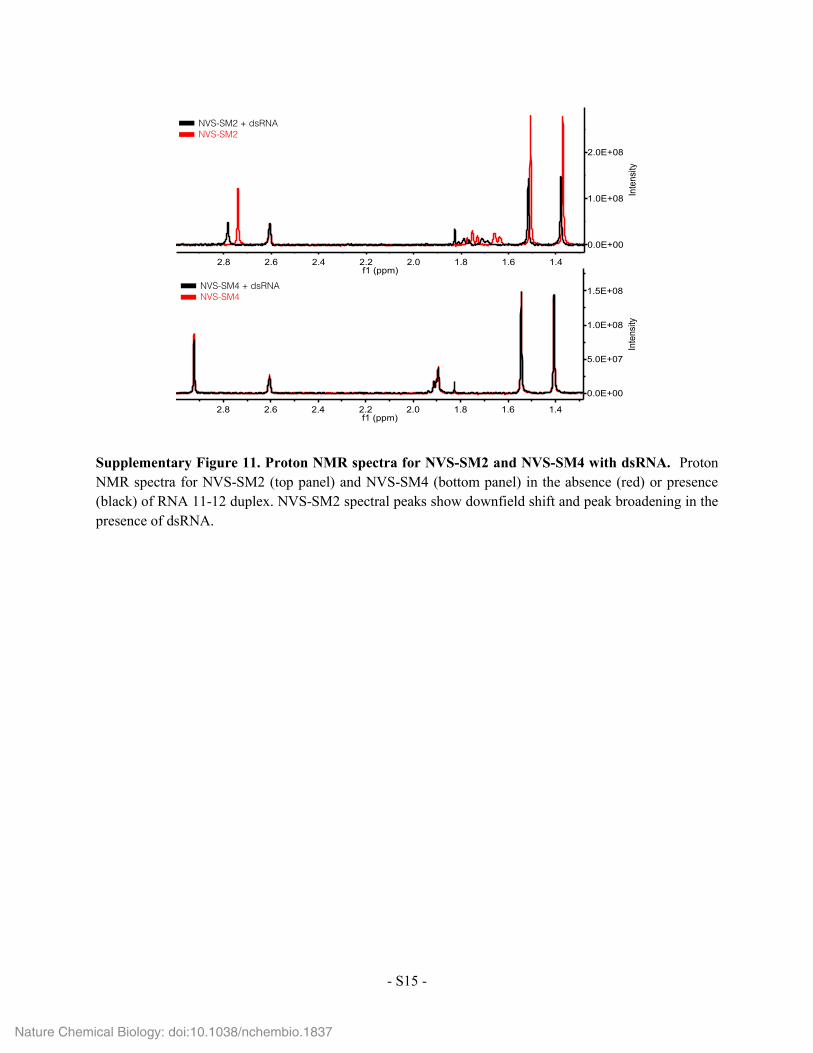
Supplementary Figure 11. Proton NMR spectra for NVS-SM2 and NVS-SM4 with dsRNA. Proton NMR spectra for NVS-SM2 (top panel) and NVS-SM4 (bottom panel) in the absence (red) or presence (black) of RNA 11-12 duplex. NVS-SM2 spectral peaks show downfield shift and peak broadening in the presence of dsRNA.
Nature Chemical Biology: doi:10.1038/nchembio.1837
a
0 100 500400200 300
20
40
60
80
100
120
140
0
Res
pons
e (R
U)
Time (s)
-30
-25
-20
-15
Compound
NVS-SM1
NVS-SM2
NVS-SM3
NVS-SM4
VlsS
core
(kca
l/mol
)
b
Unf
avor
able
Favo
rabl
e
RNA with 10 µM NVS-SM2RNA with 1 µM NVS-SM2RNA only
- S16 -
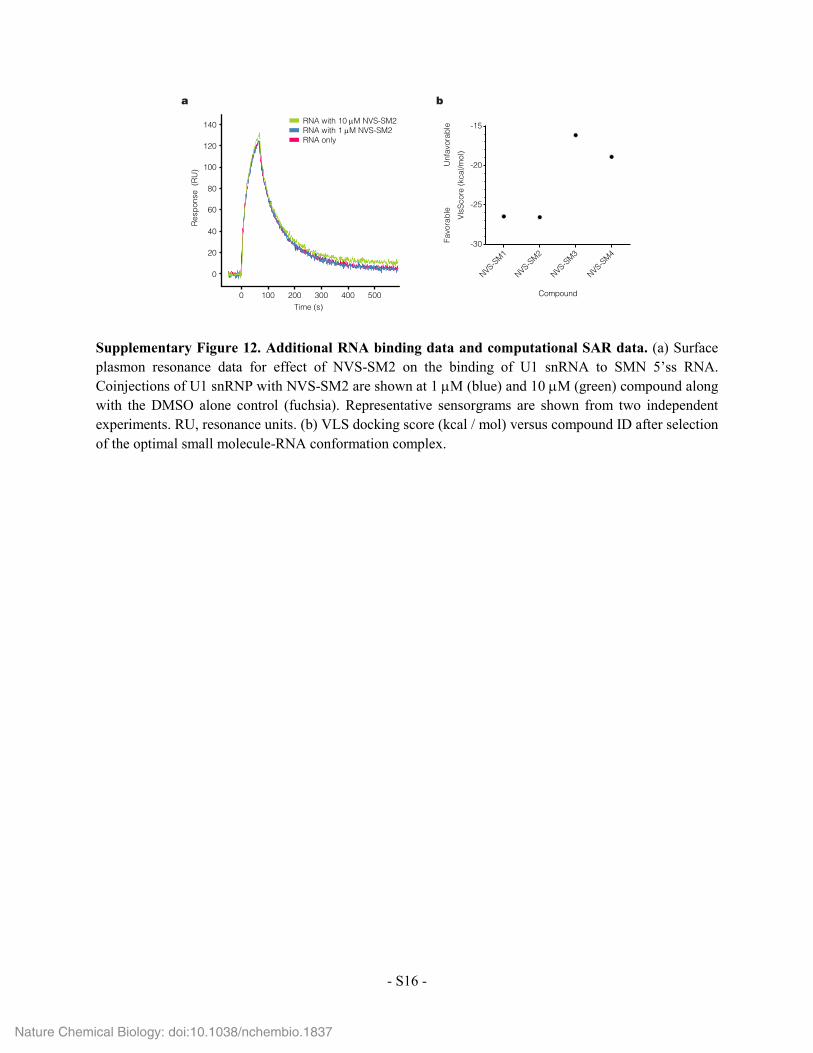
Supplementary Figure 12. Additional RNA binding data and computational SAR data. (a) Surface plasmon resonance data for effect of NVS-SM2 on the binding of U1 snRNA to SMN 5’ss RNA. Coinjections of U1 snRNP with NVS-SM2 are shown at 1 µM (blue) and 10 µM (green) compound along with the DMSO alone control (fuchsia). Representative sensorgrams are shown from two independent experiments. RU, resonance units. (b) VLS docking score (kcal / mol) versus compound ID after selection of the optimal small molecule-RNA conformation complex.
Nature Chemical Biology: doi:10.1038/nchembio.1837
- S17 -
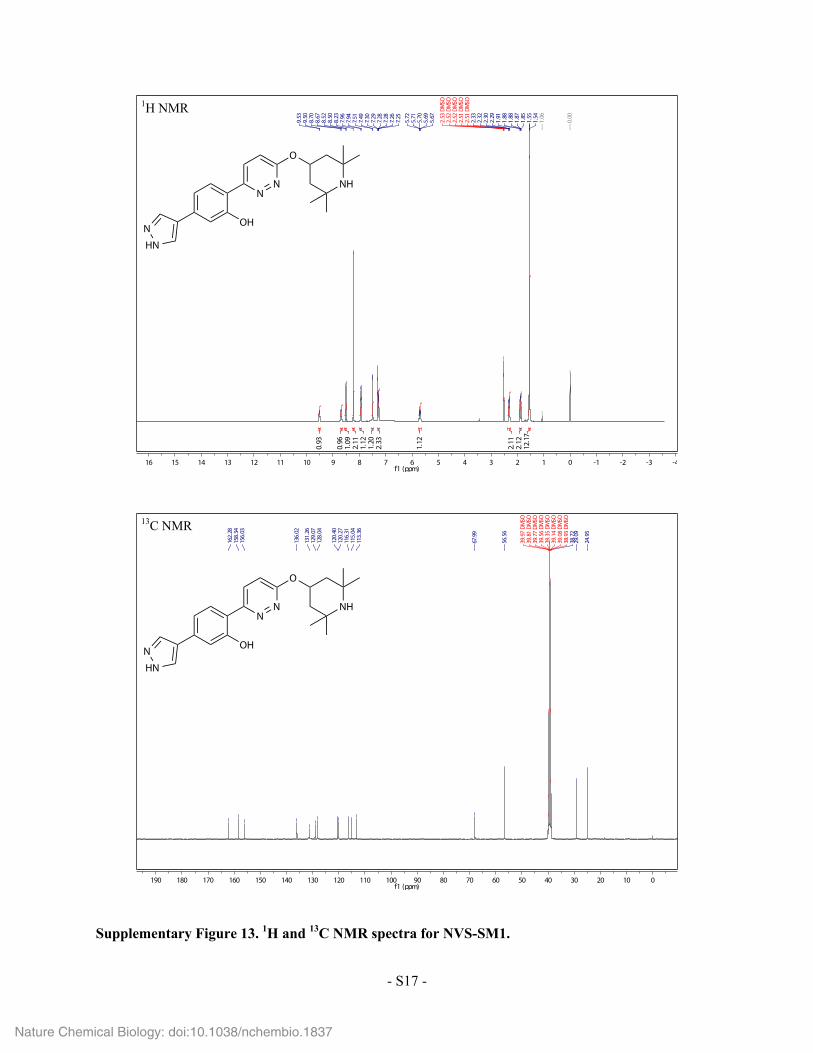
Supplementary Figure 13. 1H and 13C NMR spectra for NVS-SM1.
-4-3-2-1012345678910111213141516f1 (ppm)
12.1
72.
122.
11
1.12
2.33
1.20
1.12
2.11
1.09
0.96
0.93
0.00
1.06
1.54
1.55
1.85
1.87
1.88
1.88
1.91
2.29
2.30
2.32
2.33
2.51
DM
SO2.
51 D
MSO
2.52
DM
SO2.
52 D
MSO
2.53
DM
SO
5.67
5.69
5.70
5.71
5.72
7.25
7.26
7.28
7.28
7.29
7.30
7.49
7.51
7.94
7.96
8.23
8.50
8.52
8.67
8.70
9.50
9.53
0102030405060708090100110120130140150160170180190f1 (ppm)
24.9
5
29.0
938
.72
38.9
3 DM
SO39
.08
DMSO
39.1
4 DM
SO39
.35
DMSO
39.5
6 DM
SO39
.77
DMSO
39.8
1 DM
SO39
.97
DMSO
56.5
6
67.9
9
113.
3611
5.04
116.
3112
0.27
120.
40
128.
0412
9.07
131.
26
136.
02
156.
0315
8.34
162.
28
1H NMR
13C NMR
N
HN
NN
O
NH
OH
N
HN
NN
O
NH
OH
Nature Chemical Biology: doi:10.1038/nchembio.1837
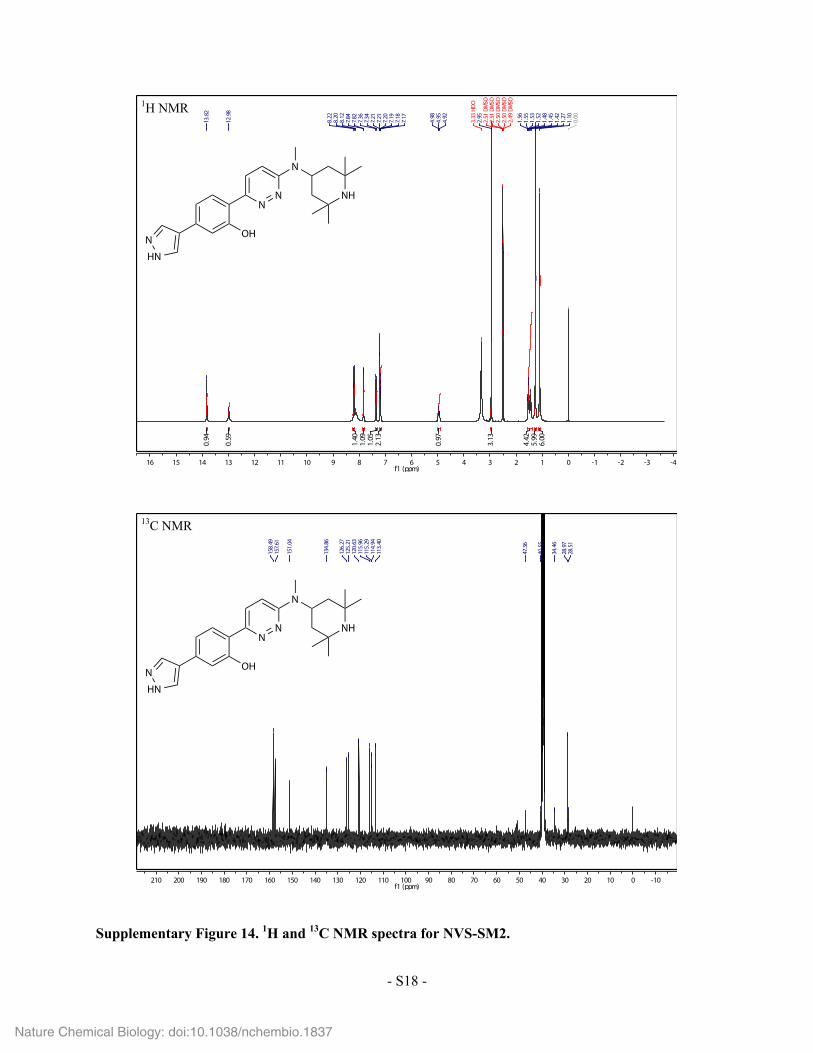
Supplementary Figure 14. 1H and 13C NMR spectra for NVS-SM2.
- S18 -
1H NMR
13C NMR
-4-3-2-1012345678910111213141516f1 (ppm)
1
6.00
5.99
4.42
3.13
0.97
2.13
1.05
1.09
1.40
0.59
0.94
0.00
1.10
1.27
1.42
1.45
1.48
1.52
1.53
1.55
1.56
2.49
DM
SO2.
50 D
MSO
2.50
DM
SO2.
51 D
MSO
2.51
DM
SO2.
953.
33 H
DO
4.92
4.95
4.98
7.17
7.18
7.19
7.20
7.21
7.21
7.34
7.36
7.82
7.84
8.12
8.20
8.22
12.9
8
13.8
2
-100102030405060708090100110120130140150160170180190200210f1 (ppm)
28.5
128
.97
34.4
6
40.5
5
47.3
6
113.
4011
4.94
115.
2911
5.96
120.
6312
5.21
126.
27
134.
86
151.
04
157.
6115
8.49
N
HN
NN
N
NH
OH
N
HN
NN
N
NH
OH
Nature Chemical Biology: doi:10.1038/nchembio.1837
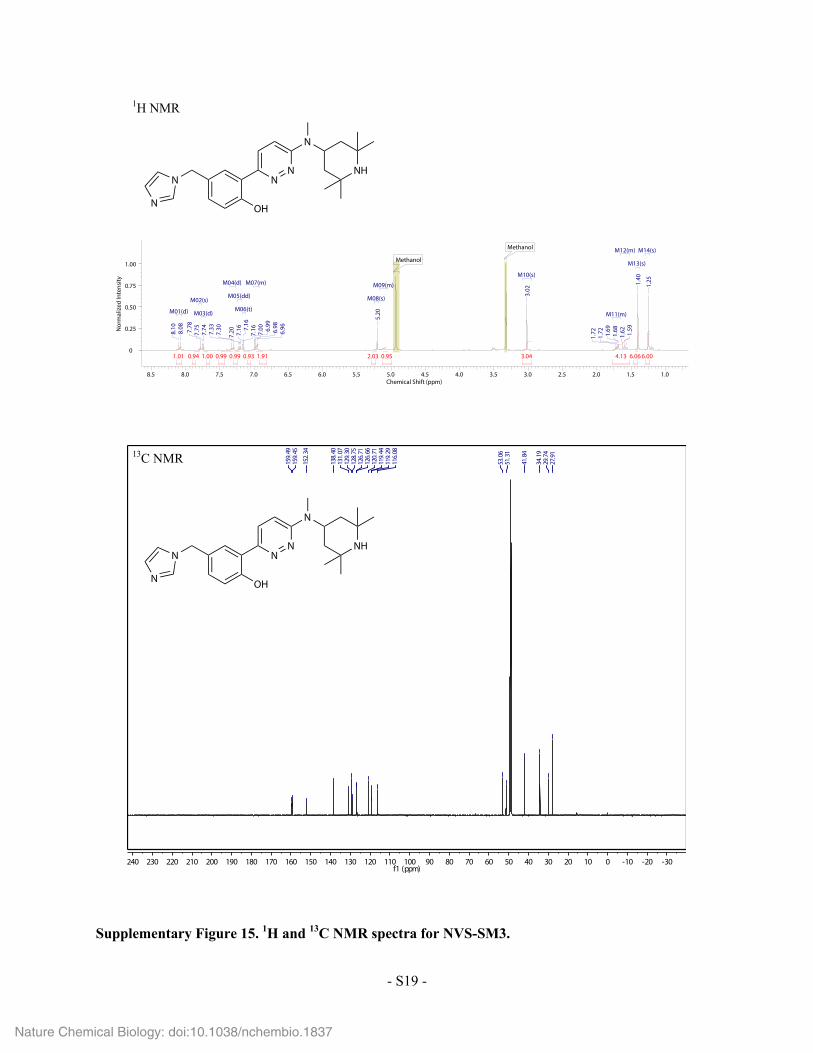
Supplementary Figure 15. 1H and 13C NMR spectra for NVS-SM3.
- S19 -
1H NMR
13C NMR
-30-20-100102030405060708090100110120130140150160170180190200210220230240f1 (ppm)
27.9
129
.74
34.1
9
41.8
4
51.3
153
.06
116.
0811
9.29
119.
4412
0.71
126.
6612
6.71
128.
7512
9.30
131.
0713
8.40
152.
34
159.
4515
9.49
8.5 8.0 7.5 7.0 6.5 6.0 5.5 5.0 4.5 4.0 3.5 3.0 2.5 2.0 1.5 1.0Chemical Shift (ppm)
0
0.25
0.50
0.75
1.00
Nor
mal
ized
Inte
nsity
6.006.064.133.040.952.031.910.930.990.991.000.941.01
Methanol
M06(t)M03(d)
M02(s) M08(s)
M13(s)
M14(s)
M05(dd)
M04(d)
M01(d)
M07(m)
Methanol
M11(m)
M09(m)
M10(s)
M12(m)
1.251.40
1.59
1.621.68
1.69
1.72
1.72
3.02
5.20
6.966.986.99
7.00
7.167.
167.
167.
207.30
7.33
7.74
7.757.78
8.08
8.10
NN
N
NH
OH
N
N
NN
N
NH
OH
N
N
Nature Chemical Biology: doi:10.1038/nchembio.1837
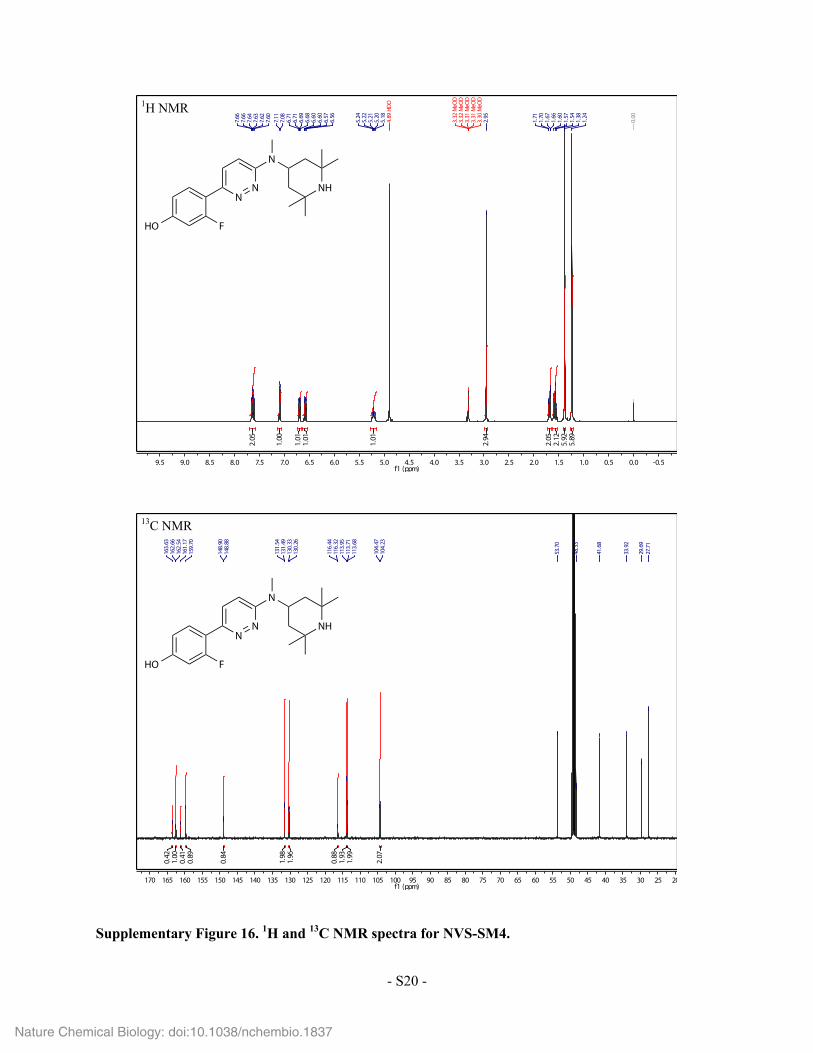
Supplementary Figure 16. 1H and 13C NMR spectra for NVS-SM4.
- S20 -
1H NMR
13C NMR
-0.50.00.51.01.52.02.53.03.54.04.55.05.56.06.57.07.58.08.59.09.5f1 (ppm)
5.89
5.92
2.12
2.05
2.94
1.01
1.01
1.01
1.00
2.05
0.00
1.24
1.38
1.54
1.57
1.60
1.66
1.67
1.70
1.71
2.95
3.30
MeO
D3.
31 M
eOD
3.31
MeO
D3.
32 M
eOD
3.32
MeO
D
4.89
HDO
5.18
5.20
5.21
5.22
5.24
6.56
6.57
6.60
6.60
6.68
6.69
6.71
6.71
7.08
7.11
7.60
7.62
7.63
7.64
7.66
7.66
20253035404550556065707580859095100105110115120125130135140145150155160165170f1 (ppm)
2.07
1.99
1.93
0.88
1.96
1.98
0.84
0.89
0.41
1.00
0.42
27.7
129
.69
33.9
2
41.6
8
48.3
3
53.7
0
104.
2310
4.47
113.
6811
3.71
113.
9511
6.32
116.
44
130.
2613
0.33
131.
4913
1.54
148.
8814
8.90
159.
7016
1.17
162.
5416
2.66
163.
63
NN
N
NH
FHO
NN
N
NH
FHO
Nature Chemical Biology: doi:10.1038/nchembio.1837