Supplementary Information Selenium Substitution Enhances ...
18
S1 Supplementary Information Selenium Substitution Enhances Reverse Intersystem Crossing in a Delayed Fluorescence Emitter Bluebell H. Drummond, 1,2 Gabrielle C. Hoover, 3 Alexander J. Gillett, 1 Naoya Aizawa, 4 William K. Myers, 2 Bryony T. McAllister, 3 Saul T. E. Jones, 1 Yong-Jin Pu, 4 Dan Credgington, 1,* Dwight S. Seferos 3,5,* 1. Department of Physics, Cavendish Laboratory, University of Cambridge, Cambridge CB3 0HF, U.K. 2. Centre for Advanced Electron Spin Resonance (CAESR), Inorganic Chemistry Laboratory, Department of Chemistry, South Parks Road, University of Oxford, Oxford OX1 3QR, U.K. 3. Department of Chemistry, University of Toronto, 80 St. George Street, ON M5S 3H6, Canada 4. RIKEN Center for Emergent Matter Science (CEMS), 2-1 Hirosawa, Wako, Saitama 351-0198, Japan 5. Department of Chemical Engineering and Applied Chemistry, University of Toronto, 200 College Street, Ontario M5S 3E5, Canada
Transcript of Supplementary Information Selenium Substitution Enhances ...

S1
Supplementary Information
Selenium Substitution Enhances Reverse Intersystem Crossing in a
Delayed Fluorescence Emitter
Bluebell H. Drummond,1,2 Gabrielle C. Hoover,3 Alexander J. Gillett,1 Naoya Aizawa,4 William
K. Myers,2 Bryony T. McAllister,3 Saul T. E. Jones,1 Yong-Jin Pu,4 Dan Credgington,1,* Dwight
S. Seferos3,5,*
1. Department of Physics, Cavendish Laboratory, University of Cambridge, Cambridge CB3
0HF, U.K.
2. Centre for Advanced Electron Spin Resonance (CAESR), Inorganic Chemistry Laboratory,
Department of Chemistry, South Parks Road, University of Oxford, Oxford OX1 3QR, U.K.
3. Department of Chemistry, University of Toronto, 80 St. George Street, ON M5S 3H6, Canada
4. RIKEN Center for Emergent Matter Science (CEMS), 2-1 Hirosawa, Wako, Saitama 351-0198,
Japan
5. Department of Chemical Engineering and Applied Chemistry, University of Toronto, 200
College Street, Ontario M5S 3E5, Canada

S2
Contents
Synthesis .....................................................................................................................................2
1H and 13C NMR spectra of new compounds ...............................................................................5
Density functional theory calculations .........................................................................................9
Methods ..................................................................................................................................9
Results ....................................................................................................................................9
Experimental methods ............................................................................................................... 10
Photophysics ............................................................................................................................. 13
Solvatochromism .................................................................................................................. 13
Singlet-triplet energy gap ...................................................................................................... 13
Oxygen quenching ................................................................................................................ 14
Electron spin resonance spectroscopy ........................................................................................ 15
Cyclic Voltammetry .................................................................................................................. 16
References ................................................................................................................................ 17
Synthesis
All reagents were used as received from Sigma-Aldrich. Microwave reactions were conducted in
sealed vials in a Biotage Initiator synthetic microwave.
2-bromo-9H-thioxanthen-9-one (TXO-Br)
14 mL of bromobenzene was added to 200 mL of sulphuric acid, followed portion-wise by 5 g of
thiosalicylic acid. After stirring at room temperature for 24 hours, the solution was heated to 70
˚C for 90 minutes, then cooled and poured over ice. The precipitate was extracted with DCM and
purified using column chromatography (ether) to give 4.08 g of an orange solid (45%). 1H NMR
(400 mHz, CDCl3) 𝛿 8.70 (d, J = 1.9 Hz, 1H), 8.61-8.54 (m, 1H), 7.67 (dd, J = 8.6 Hz, 1H), 7.55
(m, 2 H), 7.49-7.40 (m, 2H).
2-bromo-9H-thioxanthen-9H-one 10-oxide (TXO1-Br)
408 mg of TXO-Br and 266 mg of mCPBA were dissolved in 150 ml DCM at 0 ˚C and stirred
for 12 hours. The solution was washed with saturated Na2SO4 and NaHCO3 solutions then
purified by column chromatography (DCM) to give 166 mg of a white powder (27%).1H NMR
(400 mHz, CDCl3) 𝛿 8.48 (d, J = 2.0, 1H), 8.36 (dd, J = 7.3, 1H), 8.16 (d, J = 7.7 Hz, 1H), 8.03
(d, J = 8.3 Hz, 1H) 7.96 (dd, J = 8.3 Hz, 1H), 7.87 (td, J = 7.8 Hz, 1H), 7.74 (td, J = 7.6, 1H).
TOF- MS (DART +) m/z 308.9 [M + H]+.

S3
2-(4-(diphenylamino)phenyl)-9H-thioxanthen-9-one 10-oxide (TXO1-TPA)
80 mg of bromothioxanthenone, 120 mg of triphenylamine boronic acid, 80 mg of K2CO3, and
32 mg of Pd XPhos were added to a 5 ml microwave vial and put under vacuum for 1 hour. A
mixture of 2 ml of ethanol and 1 ml of water was bubbled with argon for 1 hour before being
added to the solids. The vial was put in the microwave at 105 ˚C for 1 hour then cooled and
opened to air. The organic products were extracted using DCM, and the product was purified
using column chromatography (gradient DCM to EtOAc) to give 120 mg of an orange solid
(98%). 1H NMR (400 mHz, CDCl3) 𝛿 8.57 (d, J = 1.9 Hz, 1H), 8.40 (dd, J = 7.8 Hz, 1H), 8.22-
8.17 (m, 2H), 8.04 (dd, 8.2 Hz, 1H), 7.87 (td, J = 7.8, 1H), 7.74 (td, J = 7.6, 1H), 7.57 (d, J = 7.6
Hz, 2H), 7.32-7.27 (m, 4H), 7.18-7.14 (m, 6H), 7.08 (t, J = 7.2, 2H). TOF- MS (DART +) m/z
472.1 [M + H]+.
4-Chlorobenzeneselenol
70 mL of THF was added to 1.2 g of crushed magnesium turnings under nitrogen. A spatula tip
of catalytic iodine was added followed by 9.5 g of 1-bromo-4-chlorobenzene. The Grignard was
allowed to form under reflux for 30 minutes or until the magnesium turnings were no longer
being consumed then 1.2 g of selenium powder was added. After reacting for 30 minutes, the
mixture was poured over ice. Concentrated HCl was added to remove residual magnesium, and
the precipitated product was extracted with ether. The solvent was removed to give an odorous
yellow solid which was used immediately (5.5 g, 58%). 1H NMR (400 mHz, CDCl3) 𝛿 7.53-7.49
(m, 2H), 7.26-7.22 (m, 2H).
2-((4-chlorophenyl)selanyl)benzoic acid
75 mL of water was added to 6 g of KOH, followed by 300 mg of copper powder and 8.7 g of 2-
iodobenzoic acid. The mixture was stirred at 40 ˚C for 20 minutes then 6.7 g of 4-
chloroselenophenol was added. After refluxing for 7 hours, the mixture was cooled and poured
over ice. The product was precipitated with concentrated HCl and filtered before being
recrystallized in ethanol to give a tan solid (4.8 g, 87%). TOF- MS (DART +) m/z 312.9 [M +
H]+.
2-chloro-9H-selenoxanthen-9-one (SeXO-Cl)
5 mL of sulphuric acid was heated to 95 ˚C and 1 g of Step 2 was added slowly over 20 minutes.
After 90 minutes, the solution was poured over ice to precipitate the product as a yellow solid. It
was then extracted with ether, the solvent was removed, and the product was recrystallized in a
1:1 mixture of ethanol and benzene to give a yellow solid (680 mg, 78%). 1H NMR (400 mHz,
CDCl3) 𝛿 8.62-8.66 (m, 2H), 7.46-7.66 (m, 5H). 77Se NMR (500 mHz, CDCl3) 𝛿 337.7. TOF-
MS (DART +) m/z 294.9 [M + H]+.

S4
2-(4-(diphenylamino)phenyl)-9H-selenoxanthen-9-one (SeXO-TPA)
100 mg of SeXO-Cl, 120 mg of triphenylamine boronic acid, 120 mg of K2CO3, and 36 mg of
Pd XPhos were added to a 5 ml microwave vial and put under vacuum for 1 hour. A mixture of 3
ml of ethanol and 1 ml of water was bubbled with argon for 1 hour before being added to the
solids. The vial was put in the microwave at 105 ˚C for 2 hours then cooled and opened to air.
The organic products were extracted using DCM, and the product was purified using column
chromatography (DCM:hexanes 1:1) to give 166 mg of an orange solid (97%). 1H NMR (400
mHz, CDCl3) 𝛿 8.87 (d, J = 2.2 Hz, 1 H), 8.67 (dd, J = 7.9 Hz, 1H), 7.77 (dd, J = 8.3 Hz, 1H),
7.69 (d, J = 7.7 Hz, 1H), 7.65 (dd, J = 7.7 Hz, 1H), 7.57 (d, J = 7.6 Hz, 2H), 7.54 (t, J = 7.5 Hz,
1H), 7.48 (t, J = 7.9 Hz, 1H), 7.28 (t, J = 7.3 Hz, 4H), 7.16 (t, J = 7.2 Hz, 6H), 7.05 (t, J = 7.0
Hz,. 2H). 77Se NMR (500 mHz, CDCl3) 𝛿 331.8. TOF- MS (DART +) m/z 504.1 [M + H]+.
2-(4-(diphenylamino)phenyl)-9H-selenoxanthen-9-one 10-oxide (SeXO1-TPA)
11.5 mg of SeXO-TPA were dissolved in 10 ml of DCM and cooled in an ice bath. 7 mg of
mCPBA were added and the reaction was stirred overnight at room temperature. The mixture
was washed with aqueous Na2CO3, and the solvent was removed to give 11.8 mg of an orange
solid (99%). 1H NMR (400 mHz, CDCl3) 𝛿 8.58 (d, J = 2.0, 1 H), 8.41 (dd, J = 7.8, 1H), 8.10 (d,
J = 8.1, 2H), 7.98 (dd, J = 8.1, 1H), 7.82 (t, J = 7.6, 1H), 7.74 (t, J = 7.6, 1H), 7.54 (d, J = 8.9,
2H), 7.29 (t, J = 8.5 4H), 7.15 (m, 6H), 7.07 (t, 2H). 77Se NMR (500 mHz, CDCl3) 𝛿 800.1. TOF-
MS (DART +) m/z 520.1 [M + H]+.
S5
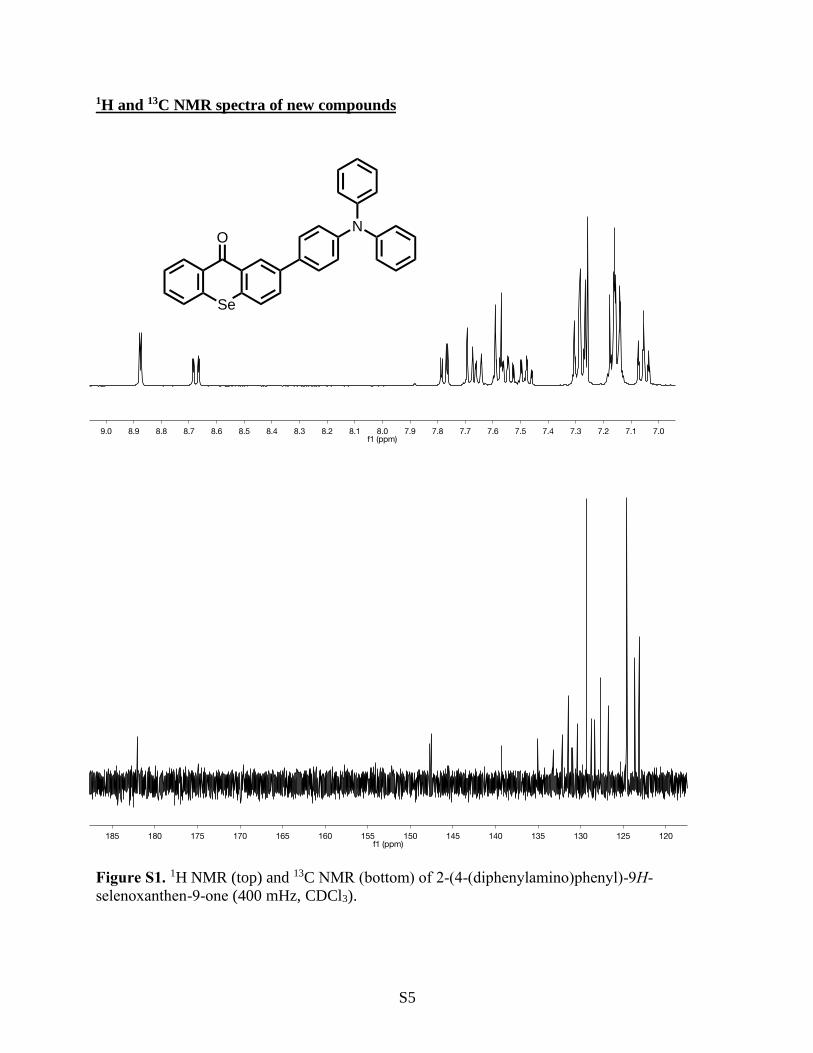
1H and 13C NMR spectra of new compounds
Figure S1. 1H NMR (top) and 13C NMR (bottom) of 2-(4-(diphenylamino)phenyl)-9H-
selenoxanthen-9-one (400 mHz, CDCl3).
Se
ON

S6
Figure S2. 1H NMR (top) and 13C NMR (bottom) of 2-(4-(diphenylamino)phenyl)-9H-
selenoxanthen-9-one 10-oxide (400 mHz, CDCl3).
Se
ON
O

S7
Figure S3. 1H NMR (top) and 13C NMR (bottom) of 2-bromo-9H-thioxanthen-9-one 10-oxide
(400 mHz, CDCl3).
S
O
Br
O

S8
Figure S4. 1H NMR (top) and 13C NMR (bottom) of 2-(4-(diphenylamino)phenyl)-9H-
thioxanthen-9-one 10-oxide (400 mHz, CDCl3).
S
ON
O

S9
Density functional theory calculations
Methods
All quantum-chemistry calculations were performed using the Gaussian 16 suite of programs.
Geometry optimizations for the ground and excited states were performed using density
functional theory (DFT) and time-dependent DFT with the LC- BLYP functional1 and the 6-
31+G(d) basis set within the Tamm–Dancoff approximation.2 The range-separated parameters
for the LC-BLYP functional were optimized for each molecule to incorporate a reasonable
amount of exact exchange (0.170 and 0.175 Bohr–1 for TXO1-TPA and SeXO1-TPA,
respectively).3 The corrected linear response polarizable continuum model for toluene was used
to include the solvation effect on the excited states.4 Spin–orbit coupling (SOC) matrix elements
were calculated by using the Breit–Pauli Hamiltonian with an effective charge approximation
implemented in the PySOC program.5
Results
Table S1. Energetics and oscillator strength from density functional calculations
Compound EHOMO a (eV) ELUMO b (eV) ES1@S0 c (nm, eV) f@S0 d ET1@S0 e (nm, eV)
TXO1-TPA –6.56 –1.38 404, 3.07 0.109 456, 2.72
SeXO1-TPA -6.60 -1.34 394, 3.15 0.113 446, 2.78
aEnergy of the highest occupied molecular orbital. bEnergy of the lowest unoccupied molecular
orbital. cEnergy and doscillator strength of the S0 to S1 vertical transition. eEnergy of the S0 to T1
vertical transition.

S10
Table S2. Spin orbit coupling matrix elements in the S1 and T1 geometries calculated from DFT
S1 geometry T1 geometry
Compound ⟨𝑆1|𝐻𝑆�̂�|𝑇1⟩ ⟨𝑆1|𝐻𝑆�̂�|𝑇2⟩ ⟨𝑆1|𝐻𝑆�̂�|𝑇1⟩ ⟨𝑆1|𝐻𝑆�̂�|𝑇2⟩
TXO1-TPA 0.807 cm-1 4.58 cm-1 0.63 cm-1 0.42 cm-1
SeXO1-TPA 1.28 cm-1 9.12 cm-1 0.80 cm-1 1.44 cm-1
Experimental methods
All solvents were used as received from Sigma-Aldrich, except acetonitrile, which was dried
using an Innovative Technology solvent purification system and stored in an argon-filled
glovebox (mBraun).
Time-resolved PL spectra were recorded using an electrically-gated intensified charge-coupled
device (ICCD) camera (Andor iStar DH740 CCI-010) connected to a calibrated grating
spectrometer (Andor SR303i). Pulsed 400 nm photoexcitation was provided at a repetition rate of
1 kHz. A 425 nm long-pass filter (Thorlabs) was used to prevent scattered laser signal from
entering the camera. Temporal evolution of the PL emission was obtained by stepping the ICCD
gate delay with respect to the excitation pulse. The minimum gate width of the ICCD was 5 ns.
Recorded data was subsequently corrected to account for filter transmission and camera
sensitivity.
Transient absorption (TA) measurements were performed on a home-built TA setup, powered by
a Ti:sapphire amplifier (Spectra Physics Solstice Ace) that generated 100 fs duration pulses
centred at 800 nm, with a repetition rate of 1 kHz. On this setup, sample photoexcitation in the
short-time TA experiments (100 fs – 1.7 ns) was achieved by the second harmonic (400 nm;
S11
fluence = 63.5 μJ/cm2) of the 800 nm output of the Ti:sapphire amplifier, generated using a β-
Barium Borate (BBO) crystal and filtered with a BG39 glass filter to remove the residual
fundamental pulse. For long time measurements (1 ns – 1 μs), the third harmonic (355 nm;
fluence = 4.98 μJ/cm2 for TXO1-TPA and 3.85 μJ/cm2 for SeXO1-TPA) of an electronically
triggered, Q-switched Nd:YVO4 (1 ns pump length, Advanced Optical Technologies Ltd AOT-
YVO-25QSPX) was used. The probe light was generated by home-built broadband visible (500 –
770 nm) and near-infrared (830 – 1025 nm) non-collinear optical parametric amplifiers
(NOPAs), pumped using the 400 nm second harmonic of the Ti:sapphire output. For short-time
measurements, a mechanical delay stage (Thorlabs DDS300-E/M) was used provide the pump-
probe delay. In the long-time measurements, the delay between probe and pump pulses was
varied using a Stanford DG645 delay generator. The transmitted probe pulses were collected
with a silicon dual-line array detector (Hamamatsu S8381-1024Q) which was driven and read
out by a custom-built board from Stresing Entwicklungsbüro.
Measurement of transient CW EPR (trEPR) was done in the Centre for Advanced ESR (CAESR)
in the Department of Chemistry of the University of Oxford, using a Bruker BioSpin EleXSys I
E680 at X-band, 9.7 GHz, with an ER 4118X-MD5W resonator. Temperature was controlled
with an Oxford Instruments CF935O cryostat under liquid helium flow and an ITC-503S
controller. An Opotek Opolete HE355 LASER was used for optical excitation of the samples and
it was synchronised to the spectrometer by a Stanford Research DG645 delay generator. Use of a
Stanford Research SR560 low-noise preamplifier of the CW Mode signal at 3-300 kHz was in
substitute of the video amplifier, following verification against the DC-AFC Transient Mode of
20 MHz bandwidth setting. Data was processed with MatLab (The Mathworks, Natick, N.J.),
and ESR simulations made use of the EasySpin routines.6

S12
All electrochemical measurements were performed in an argon-filled glovebox (mBraun) with
oxygen and moisture levels less than 2 ppm, using a BioLogic SP-200 Potentiostat/Galvanostat/
Frequency Response Analyzer. All reported potentials are referenced to ferrocene. Cyclic
voltammetry measurements were performed in a custom-made Teflon cell using 0.1 M
tetrabutylammonium hexafluorophosphate (TBAPF6)/acetonitrile electrolyte, with a platinum
button working electrode, a platinum mesh counter electrode and a silver wire pseudoreference
electrode. A scan rate of 50 mV/s was used for all measurements. An active material
concentration of ~0.1 mM was used for both TXO1-TPA and SeXO1-TPA.

S13
Photophysics
Solvatochromism
Figure S5. Photoluminescence of (A) SeXO1-TPA and (B) TXO1-TPA at 0.1 mg/ml in
deoxygenated: toluene (blue), chlorobenzene (orange), and tetrahydrofuran (green).
Singlet-triplet energy gap
Figure S6. Fluorescence (blue) and phosphorescence (red) of SeXO1-TPA at 0.1 mg/ml in
deoxygenated toluene. The energetic onset of each reveals the singlet (1CT) and triplet (3CT)
energies. Comparing these energies we find ΔEST = 0.24eV.
1.6 1.8 2.0 2.2 2.4 2.6 2.80.0
0.2
0.4
0.6
0.8
1.0
PL
(n
orm
)
Energy (eV)
3CT = 2.33 eV 1CT = 2.57 eV

S14
Oxygen quenching
500 600 700 8000.0
0.2
0.4
0.6
0.8
1.0
PL
(n
orm
)
Wavelength (nm)
SeXO1-TPA
in toluene
Sealed
Ambient24%
Figure S7. Photoluminescence of SeXO1-TPA at 0.1 mg/ml in deoxygenated toluene (solid line)
and exposed to an ambient environment (dashed). Comparing the integrated counts of each
demonstrates that oxygen quenched emission contributes to 24% of total emission.
Table S3. Photoluminescence quantum efficiency and measured lifetimes
Compound Φ a (%) τISC b (ns) τPF c (ns) τtriplet d (μs) τDF e (μs)
TXO1-TPA 25 21.9 13 2.2 2.5
SeXO1-TPA 1.5 0.085 < 0.14 0.8 0.7
aPhotoluminescence quantum efficiency (±5%) measured in an integrating sphere, bintersystem
crossing lifetime from TA (±4 ns and ±1 ps, respectively). cPrompt fluorescence lifetime from
exponential fit to TCSPC (± 0.6 ns for TXO1-TPA, only upper bound stated for SeXO1-TPA due
to instrument limitation). dTriplet decay lifetime from TA (±100 ns and ±14 ns, respectively).
eDelayed fluorescence lifetime (±100 ns) from exponential fit to ICCD. All measurements were
taken in deoxygenated toluene.

S15
Electron spin resonance spectroscopy
trESR of SeXO1-TPA and TXO1-TPA, was collected at a temperature of 10 K and microwave
power of 0.2 mW, for 12 and 2 hrs of averaging respectively. Data represents time-average of the
initial rise of the EPR signal, 1-2μs. Replacement of the S atom with Se more than doubles the
apparent axial zero-field splitting of the triplet state signals in the trESR data, shown in Fig. S6.
For the overall zero field splitting, eq. S4, there are spin-spin dipolar contributions and spin orbit
contributions, eq. S5.
�̂�𝑍𝐹𝑆 = �̂� ∙ 𝑫 ∙ �̂� (S1)
The zero field splitting tensor, D, is traceless and it may be described in an axial term D and
orthorhombic term E, as in 𝐷 = 𝐷𝑧𝑧 − (𝐷𝑥𝑥 − 𝐷𝑦𝑦) 2⁄ and 𝐸 = (𝐷𝑥𝑥 − 𝐷𝑦𝑦) 2⁄ , respectively.
Simulation of the trESR spectrum of TXO1-TPA gives a |D| value of approximately 2.1 GHz and
simulation of the trESR spectrum from SeXO1-TPA leads to a |D| value of at least 5 GHz.
The consequence of Se substitution is to increase the spin-orbit coupling contribution to the zero-
field splitting, with spin-orbit coupling being proportional to atomic number 𝑍(𝐼𝑛) shown in the
following.
�̂�𝑆𝑂 =𝛼2
2[∑
𝑍(𝐼𝑛)
𝑟𝑖𝑒,𝐼𝑛3 �̂�𝑖𝑒,𝐼𝑛
�̂�𝑖𝑒𝑖𝑒,𝐼𝑛− ∑
1
𝑟𝑖𝑒,𝑗𝑒3 �̂�𝑖𝑒,𝐼𝑛
(�̂�𝑖𝑒+ �̂�𝑗𝑒
)𝑖𝑒,𝑗𝑒] (S2)
Here the fine structure constant is α, �̂� and �̂� are the operators for orbital angular momentum and
spin angular momentum, respectively. These results demonstrate the contribution of Se to the
zero field splitting, while in-depth ESR characterization, including high-field trESR, isotopic
enrichment and ENDOR, is the subject of future studies.

S16
Figure S8. (A) Electron spin resonance spectra of SeXO1-TPA (top, green) and TXO1-TPA
(bottom, grey) at 0.2 mM frozen in toluene at 10 K. ESR data (top) and simulation (bottom) of
(B) SeXO1-TPA and (C) TXO1-TPA. The ESR simulation zero field splitting tensor values D
and E are shown.
Cyclic Voltammetry
Figure S9. Cyclic voltammetry of (A) TXO1-TPA and (B) SeXO1-TPA in 0.1 M
TBAPF6/acetonitrile electrolyte, referenced to the ferrocene/ferrocenium redox couple.

S17
References
(1) Iikura, H.; Tsuneda, T.; Yanai, T.; Hirao, K. A Long-Range Correction Scheme for
Generalized-Gradient-Approximation Exchange Functionals. J. Chem. Phys. 2001, 115
(8), 3540–3544. https://doi.org/10.1063/1.1383587.
(2) Hirata, S.; Head-Gordon, M. Time-Dependent Density Functional Theory within the
Tamm–Dancoff Approximation. Chem. Phys. Lett. 1999, 314 (3–4), 291–299.
https://doi.org/10.1016/S0009-2614(99)01149-5.
(3) Baer, R.; Livshits, E.; Salzner, U. Tuned Range-Separated Hybrids in Density Functional
Theory. Annu. Rev. Phys. Chem. 2010, 61 (1), 85–109.
https://doi.org/10.1146/annurev.physchem.012809.103321.
(4) Caricato, M.; Mennucci, B.; Tomasi, J.; Ingrosso, F.; Cammi, R.; Corni, S.; Scalmani, G.
Formation and Relaxation of Excited States in Solution: A New Time Dependent
Polarizable Continuum Model Based on Time Dependent Density Functional Theory. J.
Chem. Phys. 2006, 124 (12), 124520. https://doi.org/10.1063/1.2183309.
(5) Gao, X.; Bai, S.; Fazzi, D.; Niehaus, T.; Barbatti, M.; Thiel, W. Evaluation of Spin-Orbit
Couplings with Linear-Response Time-Dependent Density Functional Methods. J. Chem.
Theory Comput. 2017, 13 (2), 515–524. https://doi.org/10.1021/acs.jctc.6b00915.
(6) Stoll, S.; Schweiger, A. EasySpin, a Comprehensive Software Package for Spectral
Simulation and Analysis in EPR. J. Magn. Reson. 2006, 178 (1), 42–55.
https://doi.org/10.1016/j.jmr.2005.08.013.
(7) Pan, K.-C.; Li, S.-W.; Ho, Y.-Y.; Shiu, Y.-J.; Tsai, W.-L.; Jiao, M.; Lee, W.-K.; Wu, C.-
C.; Chung, C.-L.; Chatterjee, T.; et al. Efficient and Tunable Thermally Activated Delayed
Fluorescence Emitters Having Orientation-Adjustable CN-Substituted Pyridine and

S18
Pyrimidine Acceptor Units. Adv. Funct. Mater. 2016, 26 (42), 7560–7571.
https://doi.org/10.1002/adfm.201602501.