SUPPLEMENTARY INFORMATION - Nature...(December, January and February) air temperature data...
22
SUPPLEMENTARY INFORMATION DOI: 10.1038/NGEO803 NATURE GEOSCIENCE | www.nature.com/naturegeoscience 1 Zackenberg Zackenberg Supplementary figure 1S: Zackenberg Research Station in Northeast Greenland.
Transcript of SUPPLEMENTARY INFORMATION - Nature...(December, January and February) air temperature data...

SUPPLEMENTARY INFORMATIONdoi: 10.1038/ngeo803
nature geoscience | www.nature.com/naturegeoscience 1
ZackenbergZackenberg
Supplementary figure 1S: Zackenberg Research Station in Northeast Greenland.

2 nature geoscience | www.nature.com/naturegeoscience
SUPPLEMENTARY INFORMATION doi: 10.1038/ngeo803
Photo
BE
Heath site
Supplementary figure 2S: Zackenberg m
eteorological station and the heath site near the ZER
OC
ALM 1 active layer thickness
monitoring grid. The vegetation type is dom
inated by C
assiope.

nature geoscience | www.nature.com/naturegeoscience 3
SUPPLEMENTARY INFORMATIONdoi: 10.1038/ngeo803
Supp
lem
enta
ry fi
gure
3S:
Zac
kenb
erg
ZER
OC
ALM
2 a
ctiv
e la
yer m
onito
ring
grid
. The
pho
to
illust
rate
s th
e co
ntra
stin
g ve
geta
tion
type
s fro
m w
ell-d
rain
ed h
eath
(Cas
siop
e) to
poo
rly
drai
ned
wet
land
veg
etat
ion.
Wet
land
site

4 nature geoscience | www.nature.com/naturegeoscience
SUPPLEMENTARY INFORMATION doi: 10.1038/ngeo803
Heath
Wetland
0
20
40
60
80
1001997 1999 2001 2003 2005 2007
Thaw
dept
h(c
m)
Supplementary figure 4S: Permafrost degradation at CALM 2 over 11 years show thawing of about 0.9 cm per year (selected grid points representing the two vegetation types).

nature geoscience | www.nature.com/naturegeoscience 5
SUPPLEMENTARY INFORMATIONdoi: 10.1038/ngeo803
ObservationsDMI grid data-downscaledCRU grid data-downscaled
Year
Summer (JJA)
Winter (DJF)
Mea
n m
ontly
air t
empe
atur
e(˚C
)
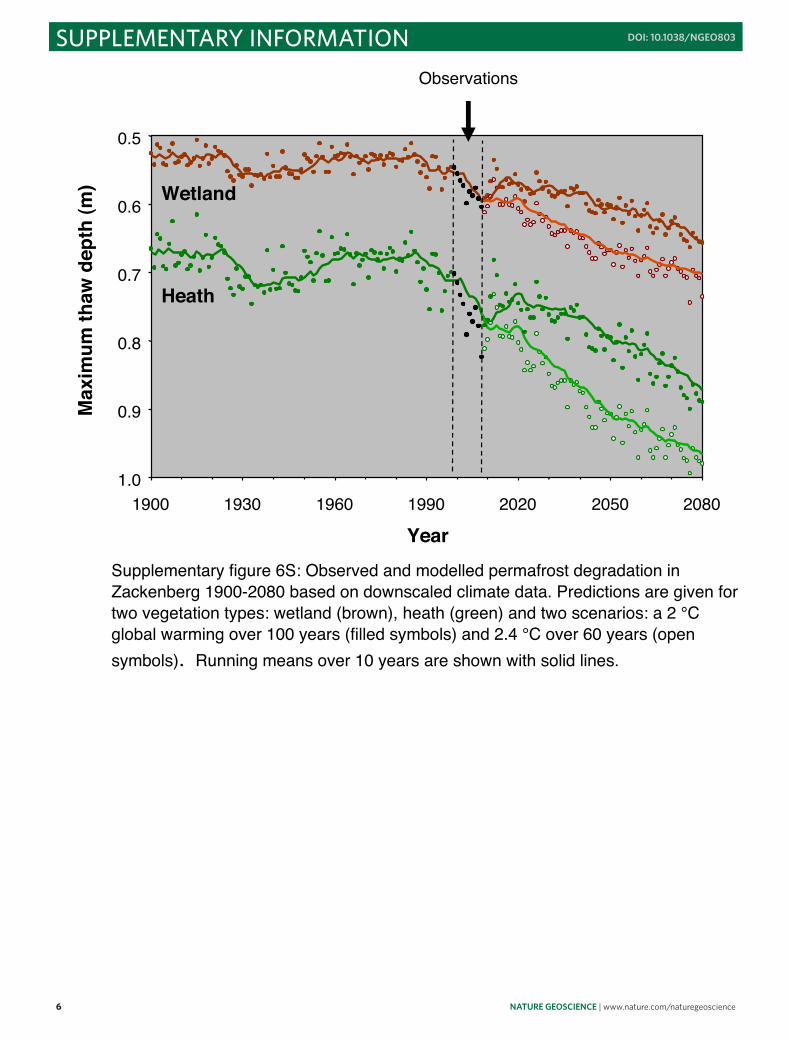
Supplementary figure 5S: Grid summer (June, July and August) and winter (December, January and February) air temperature data downscaled to Zackenberg used in figure 6 to predict permafrost degradation. Predictions for 2009-2080 are based on a 2 °C global warming over a 100 years period and in white 2.4 °C over a 60 years period.
-30
-25
-20
-15
-10
-5
0
5
10
1900 1930 1960 1990 2020 2050 2080
6 nature geoscience | www.nature.com/naturegeoscience
SUPPLEMENTARY INFORMATION doi: 10.1038/ngeo803
YearSupplementary figure 6S: Observed and modelled permafrost degradation in Zackenberg 1900-2080 based on downscaled climate data. Predictions are given fortwo vegetation types: wetland (brown), heath (green) and two scenarios: a 2 °C global warming over 100 years (filled symbols) and 2.4 °C over 60 years (open symbols). Running means over 10 years are shown with solid lines.
0.5
0.6
0.7
0.8
0.9
1.01900 1930 1960 1990 2020 2050 2080
ObservationsM
axim
um th
aw d
epth
(m) Wetland
Heath

nature geoscience | www.nature.com/naturegeoscience 7
SUPPLEMENTARY INFORMATIONdoi: 10.1038/ngeo803
Supp
lem
enta
ry fi
gure
7S:
Per
maf
rost
cor
ing
in s
umm
er 2
008
a: A
com
plet
e 4
m d
rillin
g eq
uipm
ent r
eady
at
the
heat
h si
te, b
: Tw
o pe
rson
s dr
illing
usi
ng th
eir b
ody
wei
ght t
o fo
rce
the
drill
dow
n an
d a
third
per
son
cont
rollin
g th
e dr
illing
dep
th a
t the
wet
land
site
, c: R
ecov
erin
g th
e fro
zen
perm
afro
st c
ores
from
the
drill
head
afte
r dril
ling
by ro
tatin
g an
d d:
A ty
pica
l ice
-rich
dril
l cor
e fro
m th
e to
p pe
rmaf
rost
.
ab
cd

8 nature geoscience | www.nature.com/naturegeoscience
SUPPLEMENTARY INFORMATION doi: 10.1038/ngeo803
Photo
HH
C
Supplementary figure 8S: Ice-rich perm
afrostfrom the top perm
afrost at wetland site.

nature geoscience | www.nature.com/naturegeoscience 9
SUPPLEMENTARY INFORMATIONdoi: 10.1038/ngeo803
0 40 80 120
160
2000
24
6
Org
anic
carb
on(%
) Depth(cm)
0.0
0.2
0.4
0.6
0.8
1.0
N-to
tal (
%)
010
2030
C:N
(by
wei
ght)
020
4060
8010
0
Wat
eran
d ic
e(%
by
Vol
)
Fen
Hea
th
Supp
lem
enta
ry fi
gure
9S:
Act
ive
laye
r and
per
maf
rost
solid
cha
ract
eris
tics.
Hor
izon
tal l
ines
in
dica
te th
e m
ean
max
imum
act
ive
laye
r dep
th (e
nd o
f Aug
ust 1
997-
2007
) at w
etla
nd (s
olid
) and
he
ath
site
s (d
ashe
d).

10 nature geoscience | www.nature.com/naturegeoscience
SUPPLEMENTARY INFORMATION doi: 10.1038/ngeo803
050
100
150
200
250 45
67
89
pH
Depth (cm)
050
100150
200250
DO
C (ppm
)10
02
46
8Total dissolved
N (ppm
)01
23
4N
H4 -N
(ppm)
00.5
11.5
2N
O3 (ppm
)
Heath
Fen
Supplementary figure 10S: Active layer and perm
afrostwater/ice characteristics. H
orizontal lines indicate the m
ean maxim
um active layer depth (end of August 1997-2008) at w
etland (solid) and heath sites (dashed).
Heath
Fen

nature geoscience | www.nature.com/naturegeoscience 11
SUPPLEMENTARY INFORMATIONdoi: 10.1038/ngeo803
050
100
150
200
250 45
67
89
pH
Depth (cm)
050
100150
200250
DO
C (ppm
)10
02
46
8Total dissolved
N (ppm
)01
23
4N
H4 -N
(ppm)
00.5
11.5
2N
O3 (ppm
)
Heath
Fen
Supplementary figure 10S: Active layer and perm
afrostwater/ice characteristics. H
orizontal lines indicate the m
ean maxim
um active layer depth (end of August 1997-2008) at w
etland (solid) and heath sites (dashed).
Heath
Fen
0 1 2 3
00.
050.
10.
15
00.
002
-0.0
02
Depth (cm)
N2O
(µm
ol L
-1)
N2O
pro
duct
ion
(µm
ol c
m-3
s-1)
Pro
du
ctio
n m
easu
red
po
siti
ve
00.
02-0
.06
05
1015
-0.0
2
00.
40.
8
0-0
.02
0.02
01
23
45 -0.1
0.05
0-0
.05
-0.1
ab
cd
Supp
lem
enta
ry fi
gure
11S
: Obs
erve
d an
d m
odel
ed s
tead
y st
ate
mic
ro-N
2O p
rofil
es in
thaw
ed a
nd m
anip
ulat
ed
perm
afro
st c
ores
from
the
wet
land
site
in Z
acke
nber
g, N
E-G
reen
land
. a: D
rain
ed a
nd re
-sat
urat
ed w
ith
deio
nize
d w
ater
, b: D
rain
ed a
nd re
-sat
urat
ed w
ith d
eion
ized
wat
er a
men
ded
with
glu
cose
, c: D
rain
ed a
nd re
-sa
tura
ted
with
bul
k dr
aina
ge w
ater
from
the
sam
e si
te a
nd d
: Dra
ined
and
re-s
atur
ated
with
dei
oniz
ed w
ater
am
ende
d w
ith g
luco
se a
nd a
mm
oniu
m n
itrat
e. O
bser
ved
N2O
con
cent
ratio
ns s
how
n by
fille
d sy
mbo
ls,
calc
ulat
ed g
radi
ent b
ased
on
PRO
FILE
sho
wn
with
a c
urve
d lin
e an
d th
e co
rresp
ondi
ng p
rodu
ctio
n/co
n-su
mpt
ion
prof
ile s
how
n as
blu
e bo
xes.

12 nature geoscience | www.nature.com/naturegeoscience
SUPPLEMENTARY INFORMATION doi: 10.1038/ngeo803
0123
Depth (cm)
N2 O
(µmol L
-1)
01
23
45
c
Supplementary figure 12S: O
bserved non-steady state micro-N
2 O profiles in thaw
ed and manipulated
permafrost cores (open sym
bols) from the w
etland site in Zackenberg, NE-G
reenland. a to c: represent time
steps of 12 hours after samples have been drained and re-saturated w
ith bulk drainage water from
the same
site. d: The same sam
ples after steady state conditions have been obtained. Observed N
2 O concentrations
shown by filled sym
bols, calculated gradient based on PRO
FILE shown by a curved line in d.
01
23
45
b
01
23
45
a
01
23
45
d

nature geoscience | www.nature.com/naturegeoscience 13
SUPPLEMENTARY INFORMATIONdoi: 10.1038/ngeo803
Supp
lem
enta
ry fi
gure
13S
: Obs
erve
d N
2O e
miss
ion
from
one
col
umn
of th
e ac
tive
laye
r and
upp
er 1
0 cm
pe
rmaf
rost
from
the
wet
land
site
in Z
acke
nber
g, N
E-G
reen
land
. Sc
enar
io 1
is th
e em
issi
on fr
om th
e ac
tive
laye
r mea
sure
d at
7 ºC
wat
er a
nd w
ith th
e bo
ttom
per
maf
rost
sec
tion
plac
ed in
sup
er-c
oole
d -7
ºCw
ater
. Sc
enar
io 2
is th
e em
issi
on fr
om th
e ac
tive
laye
r and
the
perm
afro
st la
yer a
t 7 ºC
. Sce
nario
3 is
the
sam
e as
sc
enar
io 2
but
afte
r the
mel
t wat
er h
as b
een
drai
ned
over
24
hour
s an
d in
ject
ed in
the
low
er 1
0 cm
sec
tion
afte
r 7 d
ays
of in
cuba
tion
at 7
ºC. T
he th
ree
scen
ario
s ha
ve b
een
repe
ated
on
the
sam
e co
lum
n th
ree
times
. Th
e fir
st in
itial
one
is s
how
n as
bla
ck b
ars,
the
seco
nd o
ne in
gra
y an
d th
e fin
al e
xper
imen
t in
whi
te. O
ne
stan
dard
dev
iatio
n of
thre
e re
plic
ates
flux
est
imat
es a
re s
how
n as
ver
tical
lines
.
N2O emission (mg N2O m-2d-1)
010203040
12
3Sc
enar
ios

14 nature geoscience | www.nature.com/naturegeoscience
SUPPLEMENTARY INFORMATION doi: 10.1038/ngeo803
Supplementary figure 14S: a: Total m
onthly liquid precipitation from 1996 to 2008 and b:O
bserved accum
ulated precipitation (2007 a dashed blue line and 2008 a solid blue line), water table fluctuations (2007
open squares and 2008 filled squares) and active layer development (2007 open triangles and 2008 filled
triangles ) from a w
etland site in Zackenberg, NE-G
reenland during the growing season 2007 and 2008. N
ote the m
arked water table fluctuations in both the fairly dry 2007 grow
ing season and wet 2008 grow
ing season.
0 20 40 60 80
100
19961997
19981999
20002001
20022003
20042005
20062007
2008
September
AugustJulyJune
60 50 40 30 20 10 021-0601-07
11-0721-07
31-0710-08
20-0830-08
09-09 40 80 120
2007 & 2008
ab2008
2007
Monthly liquid precipitation (mm)Water table and active layer (cm)
Accumulated liquid precipitation (mm)
nature geoscience | www.nature.com/naturegeoscience 15
SUPPLEMENTARY INFORMATIONdoi: 10.1038/ngeo803
1
Supplementary Methods:
High nitrous oxide production from thawing permafrost
Bo Elberling1,2,3*, Hanne H. Christiansen3, Birger U. Hansen1
1Department of Geography and Geology, University of Copenhagen, DK-1350 Copenhagen,
Denmark
2Department of Biology, The University Centre in Svalbard, UNIS, N-9171 Longyearbyen, Norway.
3Department of Geology, The University Centre in Svalbard, UNIS, N-9171 Longyearbyen, Norway.
*Correspondence: [email protected]

16 nature geoscience | www.nature.com/naturegeoscience
SUPPLEMENTARY INFORMATION doi: 10.1038/ngeo803
2
Study sites. Zackenbergdalen is a wide valley lowland dominated by Quaternary non-calcareous
sediments with significant periglacial activity and continuous permafrost (S1-S4). The hilltops are
exposed throughout the year with little or no accumulation of snow and thus devoid of vegetation.
The topography and the winter dominant northern wind direction are the main factors controlling
the snow distribution, which is clearly seen at landscape scale, causing a distinct vegetation
zonation from hilltops to depressions. From the hilltops towards the depressions there is an increase
in soil water content from dry conditions at the hilltops to wet conditions at the foot of the slopes
due to snow melt water (S2, S4). Roughly 1/3 of the lowland area in Zackenberg is poorly drained
with expected marked future water table fluctuation due to changes in snow distribution and
duration, permafrost thawing and evapotranspiration during the growing season (S2). Given the
little summer precipitation, water availability during the growing season is mainly controlled by the
location of larger snow-patches melting through the growing season resulting in the dense
vegetation beneath snow patches.
The two study sites were selected to represent two major contrasting dry and wet landforms,
with different plant communities and hydrological conditions representing large parts of the
Zackenbergdalen sedimentary lowland areas. The dry heath site is located on a well-drained marine-
abraded ground moraine dominated by white arctic bell-heather Cassiope tetragona heath. The
Cassiope plants are 5-10 cm tall and the vascular plant cover is about 80%. The most common
herbs are Luzula arctica and L. confusa. The wetland site is located in a poorly drained wetland area
in the lower part of a nivation site with a seasonal and in some years perennial long-lasting snow
patch. The AL is saturated by melt water during large parts of the growing season due to snow
patch melting and some water from thawing of the AL draining to the site. Common species are
Fischer’s tundra grass Dupontia fisheri, fisher’s tundra grass D. psilosantha and white cottongrass
Eriophorum scheuchzeri.
nature geoscience | www.nature.com/naturegeoscience 17
SUPPLEMENTARY INFORMATIONdoi: 10.1038/ngeo803
3
Meteorology, climate, active layer and permafrost. Based on data from the meteorological
station located in Zackenberg (1996-2007), the mean annual air temperature is -9.5°C with annual
precipitation varying from 150 to 200 mm (S3). Minimum air temperatures during winter are close
to -40°C, and temperatures 2.5 cm below the soil surface are as low as -18°C for about four months
of the year in the heath study site. AL thickness in the two sites has been monitored in the
ZEROCALM1 (heath site) and ZEROCALM2 (wetland site) grids since 1996) with interannual
variations controlled by meteorology and snow patch duration for the wet site (S4). AL thaw
progression since the summer of 1996 in the ZEROCALM grids shows maximum thawing to occur
in end of August, with variation from 43 cm to 70 cm at ZEROCALM2 (up to 63 cm at the wetter
part representing the wetland area), and from 60 to 80 cm for the heath site.
Climate model simulations from 1900-2080 are based on a regional model developed at the
Danish Meteorological Institute (S5). The regional model is driven by an Atmosphere-Ocean
General Circulation Model, which is based on the HIRHAM4, forced with data from a transient
General Circulation Model simulation with ECHAM5/MPI-OM (S6). The model uses a global 2ºC-
stabilization scenario with estimates of the allowable greenhouse gas concentrations and the
associated climate change. Monthly air temperatures with a spatial resolution of 25 km have been
downscaled to the Zackenberg region (S3) to evaluate current versus future thawing rates. The used
scenario causes a 5°C air temperature increase in the summer period (June, July, August) and an
8°C increase in the winter period (December, January, February) over a 100-year period starting
from 1990. A comparison with air temperature measurements at Zackenberg over the last 12 year
shows a much quicker response, and a scenario with a 6°C increase in the summer period and a
10°C increase in the winter period over a 60-year period is much more realistic, so both scenarios
have been used in the modelling.

18 nature geoscience | www.nature.com/naturegeoscience
SUPPLEMENTARY INFORMATION doi: 10.1038/ngeo803
4
Analysis. Samples from the AL and permafrost layers from the two study sites with 5 cm intervals
were analysed for total organic C and N using a LECO TruSpec Carbon Nitrogen Determinator for
water and ice content based on mass differences before and after drying.
Sub-samples were drained and the melt water collected and analysed for NO3, NH4 and total
dissolved N (using a FIAstar 5000 flow Analyzer), total dissolved C (Shimadzu Total Organic
Carbon Analyzer TOC-5000A) after 0.45 um filtration. Values of pH were obtained by using a
Metrohm 691-pH meter.
Four replicate sub-samples (3±0.5 g dry weight) from each depth were thawed and within 48
hours quantified with respect to the production of N2O over 24 and 48 hours at 7 ºC. Two of these
replicates were left for 150 days at 7 ºC and the production of N2O reanalysed. The other replicates
were amended with the original drained water. In all cases, gas samples from incubated samples
were transferred using a 3.0-mL venoject vial (Terumo Europe, Belgium) to a Hewlett-Packard
5890 gas chromatograph with an electron capture detector (EDC) to determine N2O concentrations,
which were converted to net N2O productions rates per unit dry soil per hour, taking into account
N2O dissolution (according to S7).
Detailed experimental work. Consumption and production rates of N2O were quantified at five
specific depths intervals at the wetland site representing different ages of the original C and N
sources (63 - 65.5; 82.5 - 85; 115 - 117.5; 171-173.5 and 207-209.5 cm) from the wetland site,
along with detailed measurements of O2, redox and diffusivity. These intact permafrost cores of 2.5
cm in height and 1 cm in diameter were melted, drained to field capacity using a sand bath and kept
under aerobic conditions for seven days. During drainage, the water content varied between 22-33%
by weight and the oxygen concentration in the air above surface reached above 90% of oxygen
saturation. Subsequently, samples were saturated with either A: deionized water, B: deionized with
the addition of glucose (10 mg glucose per g dry soil), C: bulk melt/drainage water from the

nature geoscience | www.nature.com/naturegeoscience 19
SUPPLEMENTARY INFORMATIONdoi: 10.1038/ngeo803
5
wetland site (with the following concentrations: 110 ppm DOC, 1.4 ppm NH4-N and 0.9 ppm NO3
and pH of 7.2) and D: finally deionized water with glucose (10 mg glucose per g dry soil) and
NH4NO3-N (0.6 mg ammonium nitrate per g of dry soil). Glucose was applied as an electron donor
for denitrification (S8) and ammonium nitrate to ensure non-limitation of N in both denitrification
and nitrification processes in soils (S9). Finally, extra deionized water was in a few cases added to
ensure at least 5 mm water cover, and samples were finally left for 24 hours with free access to
atmospheric oxygen at 7 ºC, before micro-profiles were initiated as described below.
Oxygen concentrations were measured in the standing water and in the saturated thawed
permafrost samples with a miniaturised Clark-type O2 micro-sensor (OX10, Unisense, Science
Park, DK-8000 Aarhus, Denmark) equipped with an internal reference and a guard cathode (S10).
The output current was measured by a picoampere meter (PA2000, Unisense), which
simultaneously kept the cathode polarised against the internal reference. The sensors had a tip
diameter of 30-80 µm, a stirring sensitivity of <1% and a 90% response time of less than 5 s. The
linearity of the sensor response was confirmed by recording the output current in pA in water
sparged with N2, air and pure O2. The sensor was calibrated at the experimental temperature, using
the output current in the overlying water and in strongly reduced water (alkaline 0.1M sodium
ascorbate solution). Calibration before and after profiling revealed that instrument drift over a few
hours was insignificant. Profiling measurements with oxygen sensors were made at 500 µm depth
intervals controlled either automatically or manually by a micromanipulator. The reference depth
for vertical positioning was determined by approaching the soil surface with the sensor tip in small
steps and moving the sensor horizontally after each step. The highest position at which the sensor
was able to make surface particles move was defined as the sediment surface. Subsequently, the
reference depth was confirmed by a change in the slope of the O2 gradient at the sediment surface.
The observation of the change in slope was the only method of identification of the surface position
during in-situ measurements, as the visual detection was not possible due to the light conditions.

20 nature geoscience | www.nature.com/naturegeoscience
SUPPLEMENTARY INFORMATION doi: 10.1038/ngeo803
6
Micro-scale diffusivity sensors (Unisense) with a diameter of 200-400 µm were applied to
measure apparent diffusivity of the medium surrounding the sensor tip by measuring concentrations
of a tracer gas in an internal gas reservoir within the sensor tip (S11). The sensor consists of an
outer glass capillary with parallel sides along a silicone plug that fills the sensor tip. Inserted into
the plug is a hydrogen transducer with a tip of 30 µm. A volume behind the membrane is flushed by
hydrogen (H2) mixed with N2. Hydrogen was used as the tracer gas to avoid interference with the
N2O dynamics. A similar set-up using acetylene has previously been used as an inert tracer in
similar diffusivity sensors (S12).
Standard micro-sensors were used to measure N2O concentrations (S13) on the basis of an
ascorbate oxygen trap that quantifies N2O. Sensors with a diameter of 50 µm were applied and a
similar set-up has previously been used (S13; S14).
One entire column 70 cm long and 10 cm in diameter was brought to the laboratory frozen
and thawed at 7 ºC in steps. First the AL and subsequently also the permafrost layer were thawed.
Afterwards, the column was drained and the melt water collected and injected again in the newly
thawed permafrost zone. After each treatment, the net N2O emission was quantified as an increasing
N2O concentration in a closed headspace above the soil surface over 24 hours and repeated three
times over a week using a Hewlett-Packard 5890 gas chromatograph. The entire thawing and
rewetting procedure was repeated three times and the column kept frozen at -7 ºC for a week before
the procedure was repeated.
Modelling. The numerical model PROFIL (S15) was used to analyse measured N2O concentration
profiles and apparent diffusivity. PROFIL calculates the rate of production and consumption as a
function of depth, assuming that the concentration depth profiles represent steady state conditions.
The procedure involves finding a series of least square fits for the measured concentration profile,
followed by comparisons of these fits through statistical F-testing (S15). This approach leads to an

nature geoscience | www.nature.com/naturegeoscience 21
SUPPLEMENTARY INFORMATIONdoi: 10.1038/ngeo803
7
objective selection of the simplest consumption profile that reproduces the measured concentration
profiles. The model has been successfully tested against analytical solutions describing the transport
and consumption of O2 in sediment pore water (S15). Based on the calculated production/con-
sumption profiles, the integrated N2O production was estimated and compared to the flux across the
near surface diffusive double layer.
References
S1. Christiansen, H.H. Nivation forms and processes in unconsolidated sediments, NE Greenland.
Earth Surface Processes and Landforms 23, 751–760 (1998).
S2. Elberling, B. et al. Soil and Plant Community-Characteristics and Dynamics at Zackenberg.
Advances in Ecological Research 40, 223-248 (2008).
S3. Hansen, B.U. et al. Present-Day Climate at Zackenberg. Advances in Ecological Research 40,
111-149 (2008).
S4. Christiansen, H.H. et al. Permafrost and Periglacial Geomorphology at Zackenberg, Advances
in Ecological Research 40, 151-174 (2008).
S5. Stendel, M., Christensen, J.H. & Petersen, D. Arctic Climate and Climate Change with a
Focus on Greenland. Advances in Ecological Research 40, 13-43 (2008).
S6. May, W. Towards a global “2 degree C-stabilization” scenario: estimates of the allowable
greenhouse gas concentrations and the associated climatic changes. Danish Climate Centre
Report 06-03 (2006).
S7. Weiss R.F. & Price, B.A. Nitrous oxide solubility in water and seawater. Marine Chemistry 8,
347-359 (1980).
S8. Yu, K., Struwe, S., Kjøller, A. & Chen, G. Nitrous oxide production and consumption
potential in an agricultural and a forest soil. Communications in Soil Science and Plant
analysis 39, 2205-2220 (2008).

22 nature geoscience | www.nature.com/naturegeoscience
SUPPLEMENTARY INFORMATION doi: 10.1038/ngeo803
8
S9. S. Ullah, R. Frasier, L. King, N. Picotte-Anderson, T.R. Moore, Soil Biology and
Biochemistry, 40, 986-994 (2008).
S10. Revsbech, N.P. An oxygen microelectrode with a guard cathode. Linmology and
Oceanography 34, 474-478 (1989).
S11. Revsbech, N.P., Nielsen, L.P. & Ramsing, N.B. A novel microsensor for determination of
apparent diffusivity in sediments. Linmology and Oceanography 43, 986-992 (1998).
S12. Elberling, B. & Damgaard, L.R. Micro-scale measurements of oxygen diffusion and
consumption in subaqueous sulfide tailings. Geochimica et Cosmochimica Acta 65, 1897-
1905 (2001).
S13. Andersen, K., Kjær, T. & Revsbech, N.P. An oxygen insensitive microsensor for nitrous
oxide. Sensors and Actuators B81, 42-48 (2001).
S14. Revsbech, N.P., Jacobsen, J.P. & Nielsen, L.P. Nitrogen transformations in
microenvironments of river beds and riparian zones. Ecological Engineering 24, 447-455
(2005)
S15. Berg, P., Risgaard-Petersen, N. & Rysgaard, S. Interpretation of measured concentration
profiles in sediment pore water. Linmology and Oceanography 43, 1500-1510 (1998).