SUPPLEMENTARY INFORMATION · KLS Colonies 0 5 10 15 20 25 30 %/MNC 0.0005 0.001 0.0015 ......
37
SUPPLEMENTARY INFORMATION 1 www.nature.com/nature doi: 10.1038/nature08851 Supplementary figure 1: The effect of Dicer1 deletion on osteoblasts and bone in vivo. a,b frequency of lineage - CD45 - CD31 - GFP + osteolineage cells in bone marrow (a) or collagenased bone fragments (b) (n=4) c-e impaired osteogenic differentiation capacity of OCD fl/fl bone marrow stromal cells as shown by reduced CFU-Alk/CFU-F ratio (c) (n=2, performed in quadruplicate), impaired in vitro osteogenic differentiation upon osteogenic induction ( d) and decreased osteocalcin gene expression in primary osteolineage cells as shown by RT-PCR on CD45 - Lineage - CD31 - GFP+ cells (n=5) (e) f, altered texture of the bone matrix g, normal trabecular bone volume (BV) and h, increased cortical bone volume as assessed by histomorphometric analysis (n=8)(TV=total volume; BA=bone area, TA total area). i,j reduced osteoblasts (Ob) number per bone surface (Bs) in OCD fl/fl mice as indicated by histomorphometric analysis (n=8) k, the number of osteoclasts (OC) was unaltered in OCD fl/fl mice (n=8). Data are mean ± s.e.m. * p≤0.05, **p≤0.01. CFU-F=colony-forming assay –fibroblast, CFU-ALK=colony forming unit alkaline phosphatase, AP=alkaline phosphatas i 0 0.1 0.2 0.3 0.4 0.5 0.6 0.7 0.8 0.9 ** OCD fl/fl OCD fl/+ CFU Alk/CFU-F c g 0 5 10 15 20 BV/TV % OCD fl/fl OCD fl/+ 0 0.2 0.4 0.6 0.8 1 Osteocalcin Copies OCN/copy GAPDH * e OCD fl/fl OCD fl/+ 0 5 10 15 #/mm OCD fl/fl OCD fl/+ h 0 10 20 30 BA/TA % ** OCD fl/fl OCD fl/+ 0 0.01 0.02 0.03 0.04 % of CD45 - cells OCD fl/fl OCD fl/+ 0 0.05 0.1 0.15 0.2 % of CD45 - cells OCD fl/fl OCD fl/+ 0 0.5 1 1.5 2 2.5 Oc/Bs #/mm k OCD fl/fl OCD fl/+ f j OCD fl/+ OCD fl/fl d AP Day 0 Day 7 OCD fl/fl OCD fl/+ Alizarin Red b a 20 um 10 um 10 um CFU-Alk /CFU-F
Transcript of SUPPLEMENTARY INFORMATION · KLS Colonies 0 5 10 15 20 25 30 %/MNC 0.0005 0.001 0.0015 ......

SUPPLEMENTARY INFORMATION
1www.nature.com/nature
doi: 10.1038/nature08851
Supplementary figure 1: The effect of Dicer1 deletion on osteoblasts and bone in vivo. a,b frequency of lineage-CD45-CD31-
GFP+ osteolineage cells in bone marrow (a) or collagenased bone fragments (b) (n=4) c-e impaired osteogenic differentiation
capacity of OCD fl/fl bone marrow stromal cells as shown by reduced CFU-Alk/CFU-F ratio (c) (n=2, performed in quadruplicate),
impaired in vitro osteogenic differentiation upon osteogenic induction (d) and decreased osteocalcin gene expression in primary
osteolineage cells as shown by RT-PCR on CD45-Lineage-CD31-GFP+ cells (n=5) (e) f, altered texture of the bone matrix g, normal
trabecular bone volume (BV) and h, increased cortical bone volume as assessed by histomorphometric analysis (n=8)(TV=total
volume; BA=bone area, TA total area). i,j reduced osteoblasts (Ob) number per bone surface (Bs) in OCD fl/fl mice as indicated by
histomorphometric analysis (n=8) k, the number of osteoclasts (OC) was unaltered in OCD fl/fl mice (n=8). Data are mean ± s.e.m. *
p≤0.05, **p≤0.01. CFU-F=colony-forming assay –fibroblast, CFU-ALK=colony forming unit alkaline phosphatase, AP=alkaline
phosphatas
i
00.10.20.30.40.50.60.70.80.9
* *
OCD fl/flOCD fl/+
CFU
Alk
/CFU
-F
c
g
0
5
10
15
20BV/TV
%
OCD fl/flOCD fl/+0
0.2
0.4
0.6
0.8
1Osteocalcin
Cop
ies
OC
N/c
opy
GA
PD
H
*
e
OCD fl/flOCD fl/+
i
0
5
10
15
20
25
30
35Ob/Bs
#/m
m
**
OCD fl/flOCD fl/+
h
0
10
20
30
BA/TA
%
**
OCD fl/flOCD fl/+
0
0.01
0.02
0.03
0.04
% o
f CD
45- c
ells
OCD fl/flOCD fl/+0
0.05
0.1
0.15
0.2%
of C
D45
-ce
lls
OCD fl/flOCD fl/+
0
0.5
1
1.5
2
2.5Oc/Bs
#/m
m
k
OCD fl/flOCD fl/+
f
j
OCD fl/+
OCD fl/fl
d APDay 0 Day 7
OCD fl/fl
OCD fl/+
AlizarinRedba
20 um
10 um
10 um
CFU
-Alk
/CFU
-F

2www.nature.com/nature
doi: 10.1038/nature08851 SUPPLEMENTARY INFORMATION
Supplementary figure 2: Ineffective hematopoiesis and myelodysplasia in OCD fl/fl mice. a, Leukopenia comprised all leukocyte subsets (n=10). Cytopenias were present despite normal or increased cellularity of the bone marrow (b,c) and normal hematopoietic stem and progenitor cell numbers and function. d,e, frequency of immunophenotypically defined stem (LKS CD150+CD48-) and progenitor (LKS) cells (n=4). f, hematopoietic stem cell function as determined by competitive reconstitution capacity (n=5) g, hematopoietic progenitor cell function as assessed by CFU-C (n=10). h, increased frequency of (CD11b+Gr1+) myeloid cells (n=6) and i, decreased frequency of (CD43+B220+CD19+/-) B-cell progenitors in the bone marrow (n=5) j, increased bone marrow vascularity confirmed by the endothelial cell marker CD31 (PECAM). Inset: CD31 staining of micro-megakaryocytes. Data are mean ± s.e.m. * p≤0.05, **p≤0.01. LY=lymphocytes, BASO=basophils, NE=neuthrophils, MO=monocytes, EO=eosinophils, CFU-C=colony forming unit in culture. LKS= lineage –C-kit+ Sca1+ cells LKS-SLAM= lineage –C-kit+ Sca1+ CD150+ CD48- cells, H&E=hematoxylin/eosin.
05
101520253035404550
CD43+B220+
OCD fl/+
OCD fl/fl
%/M
NC
CD43 B220+-B220+
**
**
**
** * H&E
CD31
100 um
OCD fl/fl
OCD fl/+
H&E
fl/fl
fl/+
0
20
40
60
80
Col
onie
s
CFU-C
OCDfl/+ OCDfl/fl
g
i
010
20
30
40
50
60
70
% C
D11
b+G
r1+
cells
/MN
C
**
OCDfl/+ OCDfl/fl
h
0
0.00005
0.0001
0.00015 LKS/CD150+/CD48-
%/M
NC
OCDfl/flOCDfl/+
d
F
0
0.0005
0.001 LKS
%/M
NC
OCDfl/flOCDfl/+
e
0
2
4
6
8
OCD fl/fl
OCD fl/+
Dic
er (C
D45
.2)/C
ompe
titor
(C
D45
.1)
2 weeks 24 weeks16 weeks8 weeks4 weeks
*
*
****
Competitive reconstitutionf
j
bc
50 um
OCD fl/fl
OCD fl/+10 um
50 um
a
0
1
2
3
4
5
6
7
Leukocytes
NELYMOEOBASO
**
**
**
103 /µ
l OCD fl/+
OCD fl/fl
CD43+B220+
CD19+ CD19
Cellularity
0
0.5
1
OCDfl/flOCDfl/+C
ells
(10
6 )/fe
mur
/gr
(total)

3www.nature.com/nature
SUPPLEMENTARY INFORMATIONdoi: 10.1038/nature08851
Supplementary figure 3: Extramedullary hematopoiesis rescues peripheral cytopenia in a subfraction of OCD fl/fl mice. Extramedullary hematopoiesis (EMH) was observed in a subset of 3/10 animals investigated for its presence as indicated by a,
histology showing increased hematopoiesis with increased numbers of magakaryocytes. Megakaryocytes display normal morphology b,increased CFU-C spleen, spleen cellularity , relative frequency of erythroid progenitor (CD45+ter119+) cells and
primitive hematopoietic (LKS) progenitors (n=3). c,d, significant anemia and thrombocytopenia in OCD fl/fl mice lacking EMH (n=7) in
comparison to Dicer fl/+ littermates. Conversely, the occurrence of EMH (n=3) rescued anemia and thrombocytopenia in these mice.
Data are mean ± s.e.m. * p≤0.05, **p≤0.01.
b
d
0
100
200
300
400
500
600
700 Platelets
EMHNO EMH
OCDfl/+
*
103 /
µl
OCDfl/fl
0
2
4
6
8
10
12
14 RBC
NO EMH EMH
*
106 /
µl
OCDfl/fl
OCDfl/+
a
0
10
20
CFU-C Spleen
30
40
50Spleen Cellularity
CD45+/Ter119+
0
KLS
Col
onie
s
0
5
1015
20
2530
%/M
NC
0.0005
0.001
0.0015
0.002
0.0025
%/M
NC
OCDfl/+
OCDfl/fl
00.20.40.60.81
1.21.4
Cel
ls(
106 )
/gr
b.w
.
OCD fl/+ OCD fl/fl
OCD fl/+ OCD fl/fl c
25 um
100 um 5 um
4www.nature.com/nature
doi: 10.1038/nature08851 SUPPLEMENTARY INFORMATION
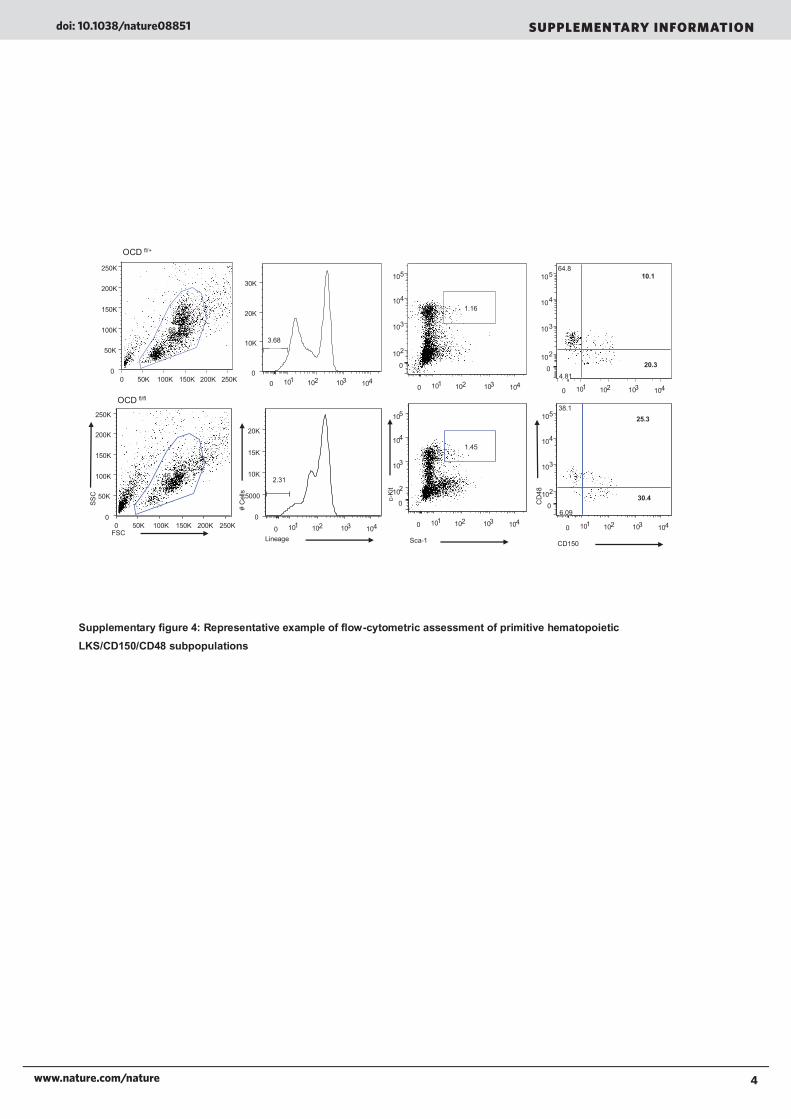
Supplementary figure 4: Representative example of flow-cytometric assessment of primitive hematopoietic LKS/CD150/CD48 subpopulations
CD150
0
102
103
104
105
CD
48
38.125.3
30.4
6.09
Sca-1
0102
103
104
105
c-Ki
t
1.45
Lineage
0
5000
10K
15K
20K
# C
ells
2.31
0 50K 100K 150K 200K 250KFSC
0
50K
100K
150K
200K
250K
SSC
46.5
0
102
103
104
10564.8
10.1
20.34.810
10K
20K
30K
3.68
0
102
103
104
105
1.16
0 50K 100K 150K 200K 250K0
50K
100K
150K
200K
250K
68.2
OCD fl/+
OCD fl/fl0 101 102 103 104
0 101 102 103 1040 101 102 103 104
0 101 102 103 104 0 101 102 103 1040 101 102 103 104

5www.nature.com/nature
SUPPLEMENTARY INFORMATIONdoi: 10.1038/nature08851
Supplementary figure 5: Myelodysplastic features of OCD fl/fl mice. a, neutrophilic dysplasia in peripheral blood. Arrow indicating giant platelet. b, micro-megakaryocytes with hyperchromatic nuclei. c, frequency of dysplastic cells (n=12 mice, ≥ 20 cells counted/sample; average ± sem, range 15.0%-89.5% and 6.5%-92.0% for neutrophils and megakaryocytes respectively)
a b
OCD fl/+
OCD fl/+
OCD fl/fl
OCD fl/fl
c
0
25
50
75
100
%
dysp
last
ic
Neutrophils Megakaryocytes
5 um
5 um

6www.nature.com/nature
doi: 10.1038/nature08851 SUPPLEMENTARY INFORMATION
Supplementary figure 6: Apoptosis in hematopoietic progenitor cells in OCD fl/fl mice: representative FACS plots.
LKS= lineage –C-kit+ Sca1+ cells LKS-SLAM= lineage –C-kit+ Sca1+ CD150+ CD48- cells L-K+= lineage-c-kit+ cells L-K-int=lineage-
Ckit intermediate
OCD fl/+
OCD fl/fl
OCD fl/+
OCD fl/fl
0 102 103 104 105
0102
103
104
105
0 50K 100K150K 200K 250K0
50K
100K
150K
200K
250K
0 102 103 104 105
0102
103
104
105
0 102 103 104 105
0102
103
104
105
FSC
SSC Lineage
Lin -
Sca 1
C-
kit
CD150
CD
48
LKSL - k+
L - kit - int
LKS - SLAMC-
kit
0 50K 100K150K 200K 250K0
50K
100K
150K
200K
250K
0 102 103 104 105
0102
103
104
105
0 102 103 104 105
0102
103
104
105
0 102 103 104 105
0102
103
104
105
2 3 4 5
0102
103
104
105
15.8
0 102 103 104 105
0102
103
104
105
13.113.1
0 102 103 104 105
0102
103
104
105
11.711.7
0 102 103 104 105
0102
103
104
105
14.814.8
Annexin V
7AAD
LKS - SLAM LKS L - k+ L - kit - int
0 102 103 104 105
010
2
103
104
105
34.034.0
0 102 103 104 105
010
2
103
104
105
25.725.7
0 102 103 104 105
0102
103
104
5
24.7
2 3 4 5
2
3
4
10 5
24.7
0 102 103 104 105
0102
103
104
105
25.1
2 3 4 5
2
3
4
5
25.1
10
0 10 10 10 10
7www.nature.com/nature
SUPPLEMENTARY INFORMATIONdoi: 10.1038/nature08851
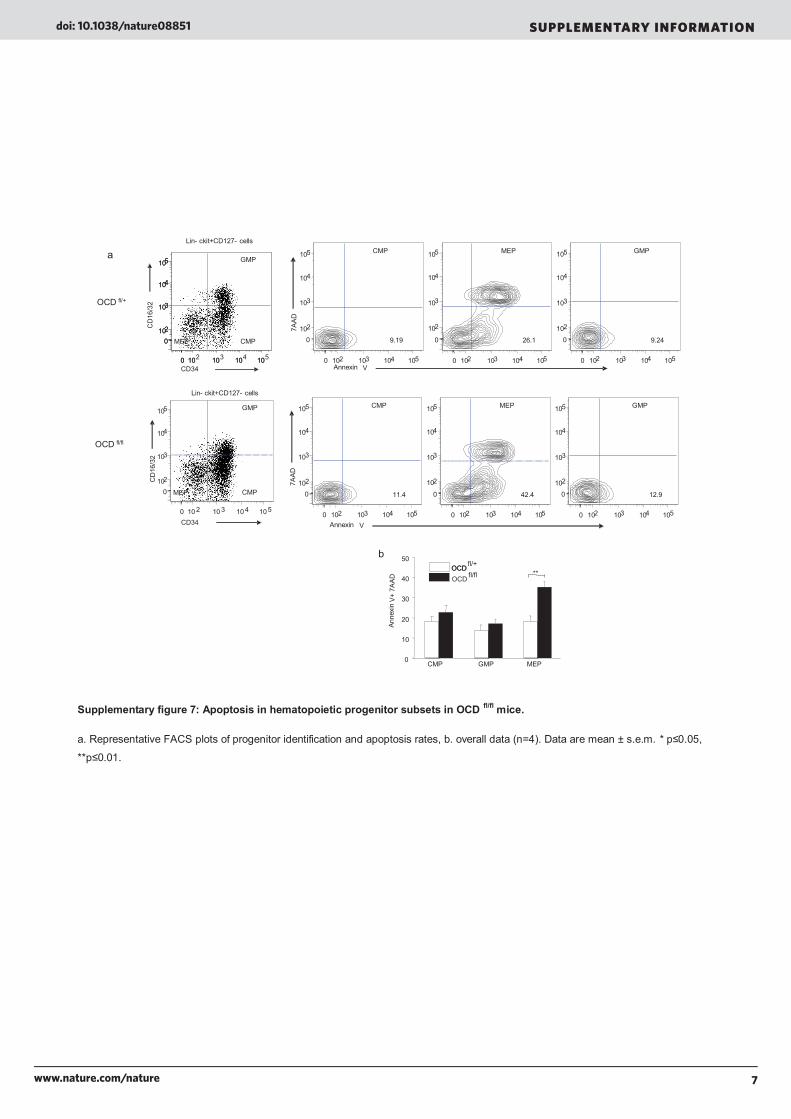
Supplementary figure 7: Apoptosis in hematopoietic progenitor subsets in OCD fl/fl mice.
a. Representative FACS plots of progenitor identification and apoptosis rates, b. overall data (n=4). Data are mean ± s.e.m. * p≤0.05,
**p≤0.01.
OCD fl/+
b
a
0
10
20
30
40
50
Anne
xin
V+ 7
AAD
CMP GMP MEP
OCD fl/flOCD OCD fl/+
**
0 102 103 104 105
0102
103
104
105
MEP CMP
GMP
0 10 10 10 10
0102
103
104
105
MEP CMP
GMP
Lin- ckit+CD127- cells
CD34
CD
16/3
2
OCD fl/fl
0 10 2 10 3 10 4 10 5
0102
103
104
105
MEP CMP
GMP
CD34
CD
16/3
2
0 102 103 104 105
0102
103
104
105
0 102 103 104 105
0102
103
104
105
0 102 103 104 105
0
102
103
104
105CMP GMPMEP
Annexin V
7AAD
9.19 26.1 9.24
0 102 103 104 105
0102
103
104
105
0 102 103 104 105
0102
103
104
105
0 102 103 104 105
0
102
103
104
105CMP GMPMEP
Annexin V
7AAD
11.4 12.942.4
Lin- ckit+CD127- cells

8www.nature.com/nature
doi: 10.1038/nature08851 SUPPLEMENTARY INFORMATION
Supplementary figure 8: Increased proliferation of hematopoietic stem and progenitor cells at the endosteal surface in OCD fl/fl mice. a, representative FACS histogram of BRDU+ cells by in vivo BRDU labeling b, confocal microscopy of transplanted DiD-
labeled LKS cells. (osteoblasts green, vasculature red, LKS cells (arrows) white) c, distance to endosteal surface (n=2, 20±3.6
cells/animal) and d, frequency of cell duplets. Data are mean ± s.e.m. * p≤0.05, **p≤0.01.
OCD fl/+OCD fl/+
OCD fl/flOCD fl/fl
0
10
20
30
40
0/32
17/75
10
20
30
40
0/32
% o
f eve
nts
OCDfl /flOCDfl /+
17/75
0
10
20
30
**
µm
OCD fl/+
OCD fl/fl
b c
d
aLKS/CD150+CD48-
# C
ells
# C
ells
# C
ells
# C
ells
# C
ells
# C
ells
OCD fl/+
OCD fl/fl
2.42.21
21.27.37
BRDU
Cel
ls
BRDU
BRDU
Cel
ls
OCD fl/+
OCD fl/fl
LKS#
Cel
ls#
Cel
ls#
Cel
ls#
Cel
ls#
Cel
ls#
Cel
ls
OCD fl/+
OCD fl/fl
2.42.21
21.27.37
BRDU
Cel
ls
BRDU
BRDU
Cel
ls
OCD fl/+
OCD fl/fl
0 10 2 10 3 10 4 10 5 0 10 2 10 3 10 4 10 5
0 10 2 10 3 10 4 10 50 10 2 10 3 10 4 10 5
Distance to Endosteal Surface

9www.nature.com/nature
SUPPLEMENTARY INFORMATIONdoi: 10.1038/nature08851
Supplementary figure 9: Representative example of flow-cytometric assessment of B-cell subpopulations
0 101 102 103 104B220
0
101
102
103
104
CD
43
76.9 4.01
11.3
0 200 400 600 800 1000FSC
0
200
400
600
800
1000
SSC
37.8
0 101 102 103 104CD19
0
101
102
103
104
CD
43
61.1
0 101 102 103 1040
101
102
103
10439.9
0 101 102 103 1040
101
102
103
10463.9 6.63
23.5
0 200 400 600 800 10000
200
400
600
800
1000
65.9
OCD fl/fl
OCD fl/+

10www.nature.com/nature
doi: 10.1038/nature08851 SUPPLEMENTARY INFORMATION
Supplementary figure 10: Hematological abnormalities in OCD fl/fl mice cannot be propagated in a hematopoietic cells autonomous manner. Bone marrow mononuclear cells of OCD fl/fl or littermate OCD fl/+ mice (n=2) were transplanted into lethally
irradiated WT (B6.SJL) mice (n=4 per OCD mouse). a, near complete donor chimerism 16 weeks post- transplant with normalization
of b, peripheral blood numbers, and c, apoptosis of primitive progenitors. Data are mean ± s.e.m. * p≤0.05, **p≤0.01.
% a
nnex
inV+
/ 7
AAD
-
% a
nnex
inV+
/ 7
AAD
-
c
OCD fl/+ OCD fl/fl0
10
20
30
40
50
60
0
10
20
30
40
50
60
OCD fl/+ OCD fl/fl
OCD fl/fl
a
0
20
40
60
80
100
% C
D45
.2 d
onor
cel
ls in
PB
OCD fl/+
OCD fl/+024681012
106 /
µl
Platelet
010203040506070
RBC
024681012
106 /µ
l10
4 /µl
Platelet
010203040506070
104 /µ
l
Platelets
RBC
OCD fl/+OCD fl/fl
b Platelets
RBC
OCD fl/fl
OCD fl/flOCD fl/flOCD fl/+ OCD fl/+
OCD fl/fl

11www.nature.com/nature
SUPPLEMENTARY INFORMATIONdoi: 10.1038/nature08851
Supplementary figure 11: Hematopoietic cells from OCD fl/fl mice do not confer hematological abnormalities: Data of mutant
into WT transplantation at 12 months post-transplant. a, bone marrow mononuclear cells of OCD fl/fl (n=4) or littermate OCD fl/+ mice
(n=6) were transplanted into lethally irradiated WT (B6.SJL) mice. b, near complete donor chimerism c, peripheral blood numbers, d, granulocyte and megakaryocyte morphology, e, frequency of B cells and B cell progenitors. f, frequency of myeloid cells g,
apoptosis of primitive progenitors. Data are mean ± s.e.m. * p≤0.05, **p≤0.01.
a b
cd
e f
g
OCD fl/flOCD fl/+
0
20
40
60
%An
nexi
nV+
7AA
D - Lineage- c-kit+
0
20
40
60
% G
r1+C
D11
b+ c
ells
/MN
C
OCD fl/+ OCD fl/fl
0
2
4
6
8
10
X106
/ul
OCD fl/+ OCD fl/fl
RBC
0
2
4
6
8 WBC
OCD fl/+ OCD fl/fl
X103
/ul
OCD fl/fl
OCD fl/+
B220 total
CD43+B220+ CD43+B220+ CD19 -
0
5
10
15
20
25
30
%/M
NC
0
20
40
60
80
100
OCD fl/flOCD fl/+
%C
D45
.2 O
CD
OCD fl/+ OCD fl/fl0
200
400
600
800
1000
X103
/ul
platelets
DONORS
B6.SJL (45.1)
OCD fl/+
OCD fl/fl (45.2)
(45.2)
DONORS
OCD fl/fl
f
5 um
5 um

12www.nature.com/nature
doi: 10.1038/nature08851 SUPPLEMENTARY INFORMATION
Supplementary figure 12: Myelodysplasia in OCD fl/fl mice is induced by the bone marrow microenvironment. Wildtype
(CD45.1) B6.SJL cells were transplanted into OCD fl/+ (n=8) or OCD fl/fl (n=8) mice. a,b, hematopoiesis at 8 weeks was predominantly
of WT origin but c, dysplayed prominent dysplastic features (n=4; 40 neutrophils or megakaryocytes were scored per sample) d,e, anemia and thrombopenia f, increased frequency of myeloid cells in the bone marrow with g, reduced frequency of B-cells and B-cell
progenitors and h, increased apoptosis of hematopoietic progenitors. Data are mean ± s.e.m. * p≤0.05, **p≤0.01.
OCD fl/flOCD fl/+
% C
D45
.1 W
T do
nor
cells
in B
M
0
20
40
60
80
100a
d
e
OCD fl/+ OCD fl/fl
1
6
8
0
12
X106 /
ul
P=0.07
P=0.06
0
200
400
600
800
1000
X103 /
ul
OCD fl/+ OCD fl/fl
RBC
Platelets
%C
D11
b+G
r1+
cells
/MN
C
0
20
40
60
80
100 **f
OCD fl/flOCD fl/+
Anne
xin
V /
7AAD
-
0
10
20
30
40**
Lineage-,c-kit+ cells
h0
20
40
% M
NC
* *
* *
B 220 total BCD43+/B220+ BCD43+/B220+CD19-
gOCD fl/flOCD fl/+
b
0
20
40
60
80
100
Megakaryocytes(CD41+)
Neutrophils
CD
45.1
WT
(%/to
tal) c
0Megakaryocytes
(CD41+)Neutrophils
20
40
60
80
100
Dys
plas
ia (
%/to
tal)
OCD fl/flOCD fl/+

13www.nature.com/nature
SUPPLEMENTARY INFORMATIONdoi: 10.1038/nature08851
Supplementary figure 13: Co-culture assays reveal direct effects of OCD fl/fl osteolineage cells on hematopoietic progenitor cell proliferation and megakaryocytic differentiation
Two hundred DS-red LKS or MEP were co-cultured on bone marrow derived stromal cells for 7 days as described in the section
„methods‟ a, osterix and osteocalcin gene expression in stromal cells in A-MEM indicating osteolineage commitment in the absence
of terminally differentiated (osteocalcin+) osteoblasts b, The total number of hematopoietic cells was significantly increased in LKS
co-cultured with OCD fl/fl stroma with c, preferential expansion of ckit+lin- cells in the absence of decreased apoptosis in this fraction
(d) consistent with increased proliferation of primitive hematopoietic subsets on OCD fl/fl stroma. Plating of MEPs on OCD fl/fl stromal
cells resulted in increased numbers of hematopoietic cells (e) but significantly impaired differentiation towards (CD41+)
megakaryocytes (f,g). Apoptosis was not increased in hematopoietic subsets under these conditions (h) i, representative picture of
morphological abnormalities of CD41+ megakaryocytic cells showing small megakaryocytes with condensed, hypolobular nuclei on
OCD fl/fl stroma. (Data show representative experiments with n=2 mice, experiments performed at least in triplicate; data are mean ±
s.e.m. * p≤0.05, **p≤0.01). ND=not detectable, AMEM=minimal essential medium alpha
0
500
1000
1500
2000
2500
3000
Num
ber
of
DSr
edce
lls LKS **
0
0.005
Osx Ocn
Cop
ies/
copy
GAP
DH
ND
Osx Ocn
ND
a b c
02468
1012141618
cKit+
lin-(
% d
sRed
Cel
ls)
*d
0
400
800
1200
1600
Nr.
Of D
S-r
ed c
ells
MEP **e
29.6
3.53
DS -red
CD
41
29.6
3.53
f
0
5
10
15
20
25 LKS
ckit+lin - ckit+lin + ckit - lin +
% A
nnex
inV
+
h
0
10
20
30
40
50
60 MEP
ckit+CD41- ckit+CD41+ ckit -CD41+
OCD fl/+
OCD fl/fl
OCD fl/+
OCD fl/fl
**
%
Anne
xin
V +
dsRed CD41-FITC DAPI
OCD fl/fl
OCD fl/+i
-
g
0
5
10
15
20
25
30
cKit+CD41 -%
of D
Sre
d ce
llscKit+CD41+ cKit -CD41+
**
**
g
OCD fl/flOCD fl/+
OCD fl/flOCD fl/+
OCD fl/flOCD fl/+
25 um
OCD fl/fl
OCD fl/fl
OCD fl/fl
OCD fl/+
OCD fl/+
OCD fl/+

14www.nature.com/nature
doi: 10.1038/nature08851 SUPPLEMENTARY INFORMATION
Supplementary figure 14: Deletion of Dicer1 in terminally differentiated osteoblasts does not confer myelodysplasia. a, deletion of Dicer1 in long bones and calvarium of ocn-cre+Dicer fl/+ and fl/fl animals. b, alteration in texture of bone matrix and, c, increased cortical bone volume (n=2) . Effects on hematopoiesis were examined in 4-6 weeks old animals showing d, no effect on
peripheral blood cell numbers, e, peripheral blood cells morphology, f, bone marrow vasculature or megakaryocyte morphology g, frequency of myeloid cells and h, B-cell progenitors. n=5. Data are mean ± s.e.m.
a
c
b
d
e
f
0
5
10Leukocytes
Ocn-Dfl/+ 0
5
10
15RBC
0
500
1000Platelets
103 /
µl
Ocn-Dfl/+Ocn-Dfl/+ Ocn-Dfl/fl
0
20
40
60
% G
r1+ C
D11
b+ce
lls/M
NC
Ocn-Dfl/+ Ocn-Dfl/fl
Ocn-Dfl/fl
103 /
µl
Ocn-Dfl/fl
0
20
40
B220+ CD43+B220+ CD43+B220+CD19-
%/M
NC
Ocn-Dfl/fl
Ocn-Dfl/+
106 /
µl
OCD fl/+Ocn-Dfl/+
Ocn-Dfl/fl
Ocn-Dfl/+
Ocn-Dfl/+ Ocn-Dfl/+
Ocn-Dfl/flOcn-Dfl/fl
Osteocalcin-cre:Dicer1
Δ Dicer1309 bp
LiverFemur CalvariumOcn-Dfl/+ Ocn-Dfl/+Ocn-Dfl/+ Ocn-Dfl/flOcn-Dfl/flOcn-Dfl/fl
Ocn-Cre-Dicer fl/+Ocn-Cre-Dicer fl/fl
e
f
g h
0
0.1
0.2
0.3
0
0.1
0.2
0.3
Ocn-Cre-Dicer fl/+ Ocn-Cre-Dicer fl/fl
BA
/TA
25 um
25 um
5 um
100 um

15www.nature.com/nature
SUPPLEMENTARY INFORMATIONdoi: 10.1038/nature08851
Supplementary figure 15: Hematopoietic phenotype of OCD fl/fl mice at the age of three weeks. a, anemia, b, dysplasia of
neutrophils and megakaryocytes, c, decreased frequency of B-cell progenitors, d, increased frequency of myeloid cells, e, Increased
apoptosis of hematopoietic progenitor cells. (n=5 for all analyses). Data are mean ± s.e.m. * p≤0.05, **p≤0.01.
OCD fl/fl OCD fl/+a b
c d
e
5
5.5
6
6.5
7
7.5
8 RBC
OCD fl/+ OCD fl/fl
*
x106
/ ul
0
10
20
30
40
50
60
OCD fl/fl
OCD fl/+
B220 total
CD43+B220+ CD43+B220+ CD19 -
**
**
%/M
NC
0
10
20
30
40
50
60
OCD fl/flOCD fl/+
**
% G
r1+C
D11
b+ c
ells
/MN
C
0
24
68
1012
14
OCD fl/flOCD fl/+
*
%An
nexi
nV+
7AA
D-
Lineage- ckit+
5 um
20 um
16www.nature.com/nature
doi: 10.1038/nature08851 SUPPLEMENTARY INFORMATION
a
b
c
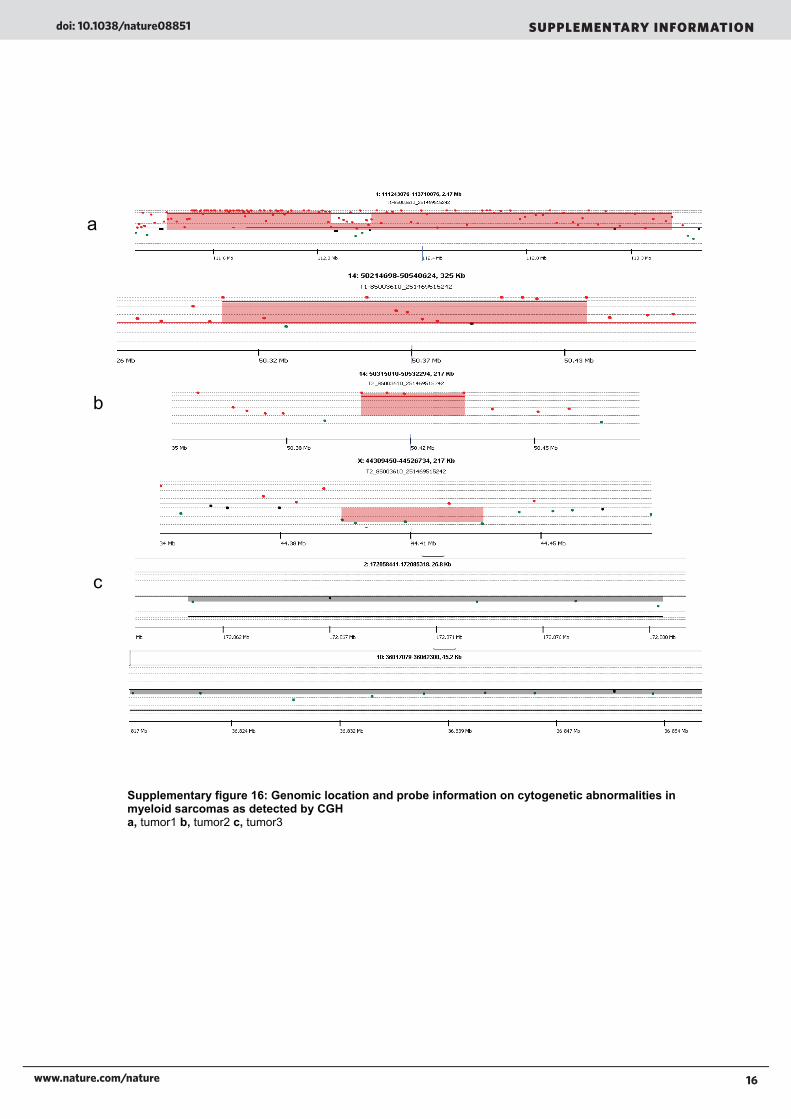
Supplementary figure 16: Genomic location and probe information on cytogenetic abnormalities in myeloid sarcomas as detected by CGH a, tumor1 b, tumor2 c, tumor3
17www.nature.com/nature
SUPPLEMENTARY INFORMATIONdoi: 10.1038/nature08851
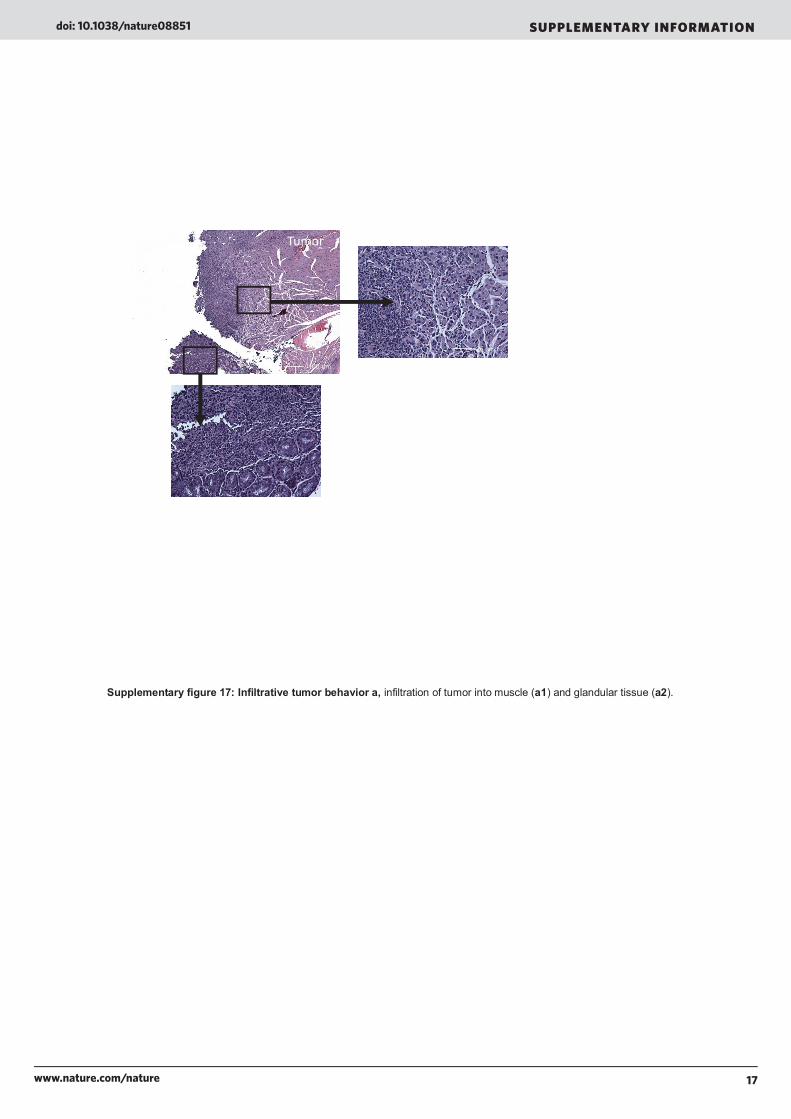
Supplementary figure 17: Infiltrative tumor behavior a, infiltration of tumor into muscle (a1) and glandular tissue (a2).
Tumor
25 um
100 um

18www.nature.com/nature
doi: 10.1038/nature08851 SUPPLEMENTARY INFORMATION
Supplementary figure 18: Targeted deletion of the Sbds gene from osteoprogenitor cells
a, altered texture of the cortical bone similar to OCD fl/fl mice, b, reduced frequency of B cells and pre-B cells in the bone marrow
(n=8) c, increased frequency of myeloid cells in the bone marrow (n=8). Data are mean ± s.e.m. * p≤0.05, **p≤0.01.
c
0
20
40
60
**
OCS fl /+ OCS fl /fl
%C
D11
b+G
r1+
cells
/MN
C
0
20
40
60
80
% M
NC
B220 (total) CD43+B220+ CD43+B220+/CD19-
**
**
OCS fl/+
OCS fl/fl
bOCS fl /fl
aOCS fl /+
19www.nature.com/nature
SUPPLEMENTARY INFORMATIONdoi: 10.1038/nature08851
Supplementary tables
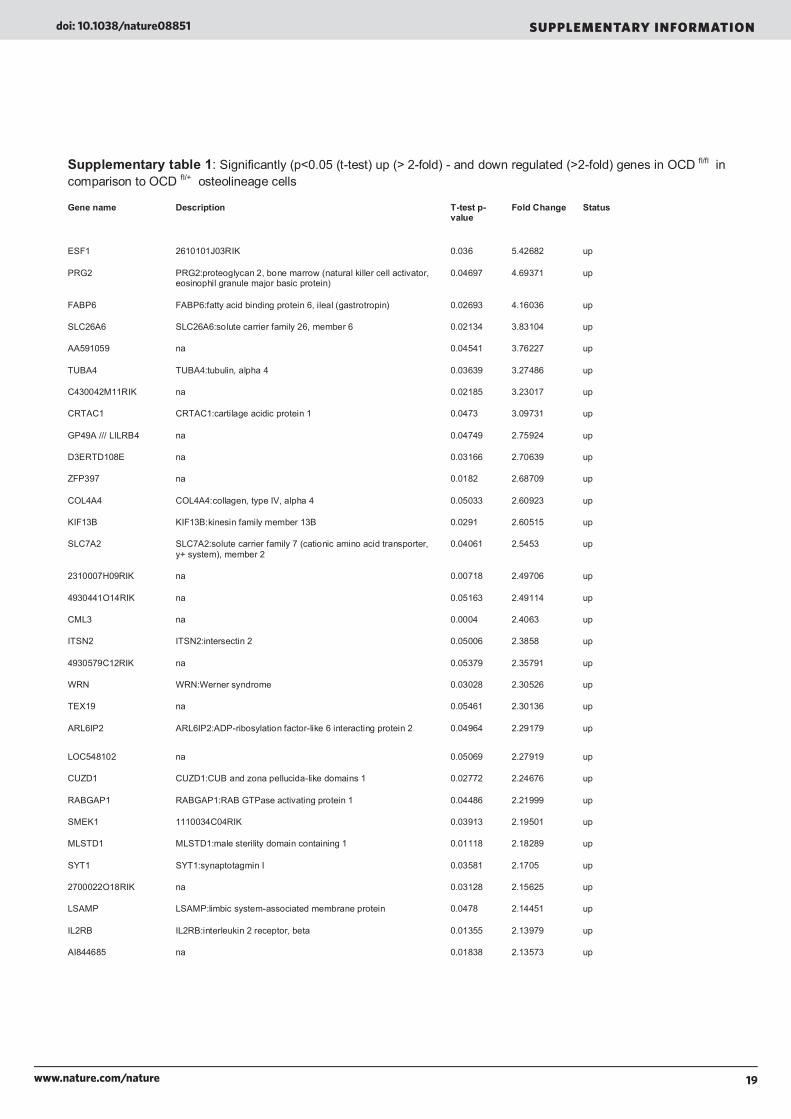
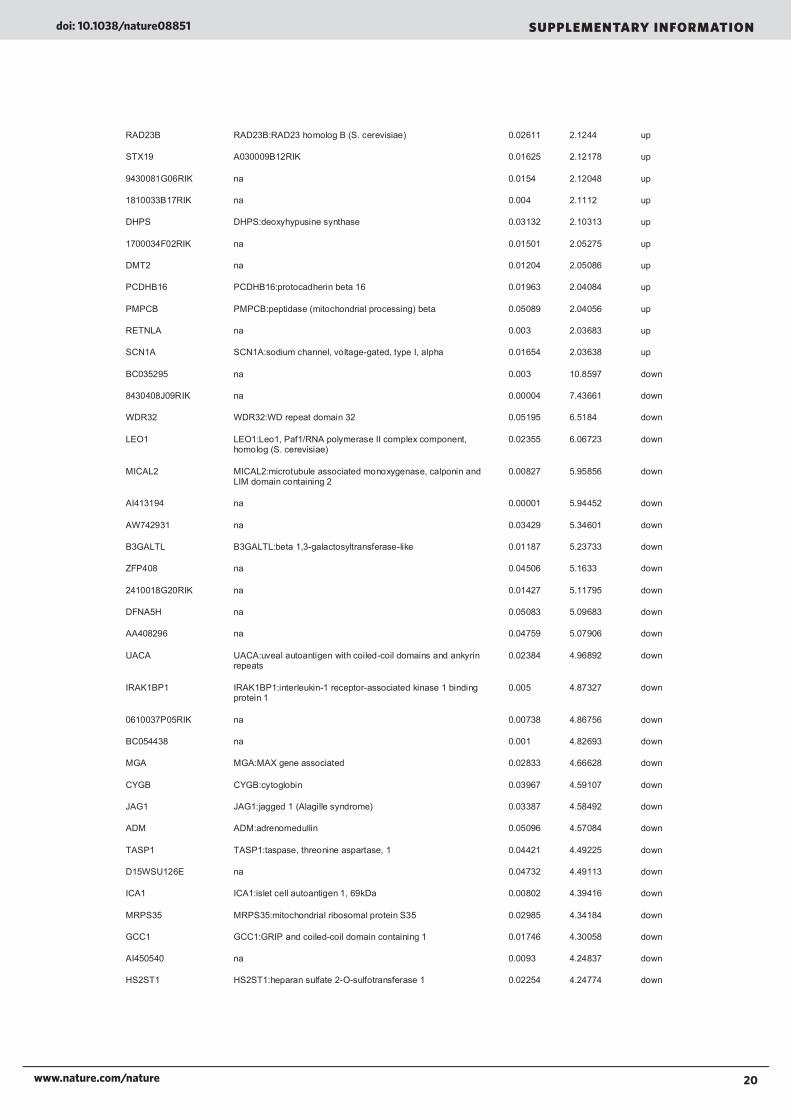
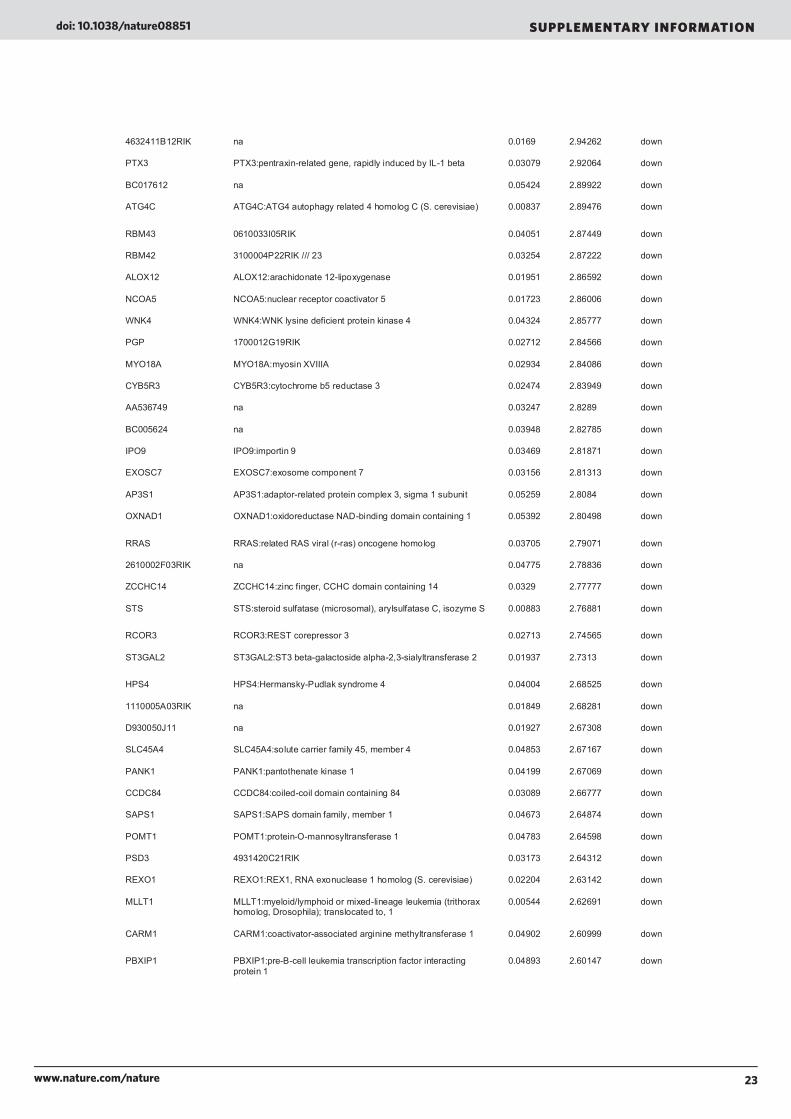
Supplementary table 1: Significantly (p<0.05 (t-test) up (> 2-fold) - and down regulated (>2-fold) genes in OCD fl/fl in comparison to OCD fl/+ osteolineage cells
Gene name Description T-test p-value
Fold Change Status
ESF1 2610101J03RIK 0.036 5.42682 up
PRG2 PRG2:proteoglycan 2, bone marrow (natural killer cell activator, eosinophil granule major basic protein)
0.04697 4.69371 up
FABP6 FABP6:fatty acid binding protein 6, ileal (gastrotropin) 0.02693 4.16036 up
SLC26A6 SLC26A6:solute carrier family 26, member 6 0.02134 3.83104 up
AA591059 na 0.04541 3.76227 up
TUBA4 TUBA4:tubulin, alpha 4 0.03639 3.27486 up
C430042M11RIK na 0.02185 3.23017 up
CRTAC1 CRTAC1:cartilage acidic protein 1 0.0473 3.09731 up
GP49A /// LILRB4 na 0.04749 2.75924 up
D3ERTD108E na 0.03166 2.70639 up
ZFP397 na 0.0182 2.68709 up
COL4A4 COL4A4:collagen, type IV, alpha 4 0.05033 2.60923 up
KIF13B KIF13B:kinesin family member 13B 0.0291 2.60515 up
SLC7A2 SLC7A2:solute carrier family 7 (cationic amino acid transporter, y+ system), member 2
0.04061 2.5453 up
2310007H09RIK na 0.00718 2.49706 up
4930441O14RIK na 0.05163 2.49114 up
CML3 na 0.0004 2.4063 up
ITSN2 ITSN2:intersectin 2 0.05006 2.3858 up
4930579C12RIK na 0.05379 2.35791 up
WRN WRN:Werner syndrome 0.03028 2.30526 up
TEX19 na 0.05461 2.30136 up
ARL6IP2 ARL6IP2:ADP-ribosylation factor-like 6 interacting protein 2 0.04964 2.29179 up
LOC548102 na 0.05069 2.27919 up
CUZD1 CUZD1:CUB and zona pellucida-like domains 1 0.02772 2.24676 up
RABGAP1 RABGAP1:RAB GTPase activating protein 1 0.04486 2.21999 up
SMEK1 1110034C04RIK 0.03913 2.19501 up
MLSTD1 MLSTD1:male sterility domain containing 1 0.01118 2.18289 up
SYT1 SYT1:synaptotagmin I 0.03581 2.1705 up
2700022O18RIK na 0.03128 2.15625 up
LSAMP LSAMP:limbic system-associated membrane protein 0.0478 2.14451 up
IL2RB IL2RB:interleukin 2 receptor, beta 0.01355 2.13979 up
AI844685 na 0.01838 2.13573 up
20www.nature.com/nature
doi: 10.1038/nature08851 SUPPLEMENTARY INFORMATION
RAD23B RAD23B:RAD23 homolog B (S. cerevisiae) 0.02611 2.1244 up
STX19 A030009B12RIK 0.01625 2.12178 up
9430081G06RIK na 0.0154 2.12048 up
1810033B17RIK na 0.004 2.1112 up
DHPS DHPS:deoxyhypusine synthase 0.03132 2.10313 up
1700034F02RIK na 0.01501 2.05275 up
DMT2 na 0.01204 2.05086 up
PCDHB16 PCDHB16:protocadherin beta 16 0.01963 2.04084 up
PMPCB PMPCB:peptidase (mitochondrial processing) beta 0.05089 2.04056 up
RETNLA na 0.003 2.03683 up
SCN1A SCN1A:sodium channel, voltage-gated, type I, alpha 0.01654 2.03638 up
BC035295 na 0.003 10.8597 down
8430408J09RIK na 0.00004 7.43661 down
WDR32 WDR32:WD repeat domain 32 0.05195 6.5184 down
LEO1 LEO1:Leo1, Paf1/RNA polymerase II complex component, homolog (S. cerevisiae)
0.02355 6.06723 down
MICAL2 MICAL2:microtubule associated monoxygenase, calponin and LIM domain containing 2
0.00827 5.95856 down
AI413194 na 0.00001 5.94452 down
AW742931 na 0.03429 5.34601 down
B3GALTL B3GALTL:beta 1,3-galactosyltransferase-like 0.01187 5.23733 down
ZFP408 na 0.04506 5.1633 down
2410018G20RIK na 0.01427 5.11795 down
DFNA5H na 0.05083 5.09683 down
AA408296 na 0.04759 5.07906 down
UACA UACA:uveal autoantigen with coiled-coil domains and ankyrin repeats
0.02384 4.96892 down
IRAK1BP1 IRAK1BP1:interleukin-1 receptor-associated kinase 1 binding protein 1
0.005 4.87327 down
0610037P05RIK na 0.00738 4.86756 down
BC054438 na 0.001 4.82693 down
MGA MGA:MAX gene associated 0.02833 4.66628 down
CYGB CYGB:cytoglobin 0.03967 4.59107 down
JAG1 JAG1:jagged 1 (Alagille syndrome) 0.03387 4.58492 down
ADM ADM:adrenomedullin 0.05096 4.57084 down
TASP1 TASP1:taspase, threonine aspartase, 1 0.04421 4.49225 down
D15WSU126E na 0.04732 4.49113 down
ICA1 ICA1:islet cell autoantigen 1, 69kDa 0.00802 4.39416 down
MRPS35 MRPS35:mitochondrial ribosomal protein S35 0.02985 4.34184 down
GCC1 GCC1:GRIP and coiled-coil domain containing 1 0.01746 4.30058 down
AI450540 na 0.0093 4.24837 down
HS2ST1 HS2ST1:heparan sulfate 2-O-sulfotransferase 1 0.02254 4.24774 down

21www.nature.com/nature
SUPPLEMENTARY INFORMATIONdoi: 10.1038/nature08851
SHF SHF:Src homology 2 domain containing F 0.004 4.09982 down
GLOD4 2700085E05RIK 0.04616 4.06067 down
NR2F6 NR2F6:nuclear receptor subfamily 2, group F, member 6 0.0285 4.03937 down
RUSC2 RUSC2:RUN and SH3 domain containing 2 0.01736 4.03404 down
TIPRL TIPRL:TIP41, TOR signalling pathway regulator-like (S. cerevisiae)
0.0255 4.03344 down
BTBD5 BTBD5:BTB (POZ) domain containing 5 0.0146 4.02652 down
EIF2C2 EIF2C2:eukaryotic translation initiation factor 2C, 2 0.0503 3.89805 down
NFIA NFIA:nuclear factor I/A 0.0445 3.89446 down
PROS1 PROS1:protein S (alpha) 0.02681 3.83777 down
MAP4K3 /// LOC675560
na 0.0438 3.82749 down
LDB2 LDB2:LIM domain binding 2 0.002 3.79608 down
RBM19 RBM19:RNA binding motif protein 19 0.0466 3.78786 down
MCMDC1 MCMDC1:minichromosome maintenance deficient domain containing 1
0.01879 3.74637 down
SMO SMO:smoothened homolog (Drosophila) 0.001 3.72639 down
DDX24 DDX24:DEAD (Asp-Glu-Ala-Asp) box polypeptide 24 0.02098 3.69234 down
PLAC9 PLAC9:placenta-specific 9 0.01527 3.65417 down
2610014I16RIK na 0.04731 3.64898 down
GLT28D2 na 0.04701 3.61421 down
NAGLU NAGLU:N-acetylglucosaminidase, alpha- (Sanfilippo disease IIIB) 0.01324 3.60552 down
SLC10A3 SLC10A3:solute carrier family 10 (sodium/bile acid cotransporter family), member 3
0.02873 3.59452 down
NFATC2IP NFATC2IP:nuclear factor of activated T-cells, cytoplasmic, calcineurin-dependent 2 interacting protein
0.05147 3.59288 down
MCOLN1 MCOLN1:mucolipin 1 0.02559 3.59093 down
FBXO18 FBXO18:F-box protein, helicase, 18 0.05395 3.57977 down
HOXA10 HOXA10:homeobox A10 0.01077 3.57055 down
DNAJA4 DNAJA4:DnaJ (Hsp40) homolog, subfamily A, member 4 0.05295 3.56585 down
9230104K21RIK na 0.04956 3.56259 down
TMEM16K TMEM16K:transmembrane protein 16K 0.04528 3.55635 down
ENOPH1 2310057D15RIK 0.04873 3.54497 down
ABHD14B ABHD14B:abhydrolase domain containing 14B 0.03567 3.52646 down
NINJ1 NINJ1:ninjurin 1 0.004 3.5251 down
SMAD3 SMAD3:SMAD, mothers against DPP homolog 3 (Drosophila) 0.0405 3.50195 down
TRABD 5730502D15RIK 0.03846 3.4988 down
YIPF2 YIPF2:Yip1 domain family, member 2 0.0275 3.48257 down
MTIF2 MTIF2:mitochondrial translational initiation factor 2 0.0486 3.46648 down
METTL7A /// UBIE /// na 0.05451 3.46179 down
ISLR ISLR:immunoglobulin superfamily containing leucine-rich repeat 0.001 3.45555 down

22www.nature.com/nature
doi: 10.1038/nature08851 SUPPLEMENTARY INFORMATION
ACYP1 ACYP1:acylphosphatase 1, erythrocyte (common) type 0.03783 3.43518 down
FBXL3 FBXL3:F-box and leucine-rich repeat protein 3 0.05226 3.40165 down
HNRPH3 /// LOC669773
na 0.02436 3.39531 down
PQLC3 PQLC3:PQ loop repeat containing 3 0.0431 3.3691 down
PALLD PALLD:palladin, cytoskeletal associated protein 0.04649 3.36097 down
5330431N19RIK na 0.03947 3.33596 down
ALCAM ALCAM:activated leukocyte cell adhesion molecule 0.01269 3.33139 down
RG9MTD2 RG9MTD2:RNA (guanine-9-) methyltransferase domain containing 2
0.04216 3.32609 down
LRRC17 LRRC17:leucine rich repeat containing 17 0.02977 3.24375 down
EIF2AK1 EIF2AK1:eukaryotic translation initiation factor 2-alpha kinase 1 0.01791 3.23972 down
EXTL2 EXTL2:exostoses (multiple)-like 2 0.03894 3.22632 down
CRTC3 CRTC3:CREB regulated transcription coactivator 3 0.0159 3.21783 down
PAOX PAOX:polyamine oxidase (exo-N4-amino) 0.00757 3.20999 down
HMBOX1 HMBOX1:homeobox containing 1 0.046 3.19186 down
GTF3C2 GTF3C2:general transcription factor IIIC, polypeptide 2, beta 110kDa
0.02639 3.19022 down
NEK8 NEK8:NIMA (never in mitosis gene a)- related kinase 8 0.02814 3.17498 down
BNIP1 BNIP1:BCL2/adenovirus E1B 19kDa interacting protein 1 0.04001 3.13605 down
RFX5 RFX5:regulatory factor X, 5 (influences HLA class II expression) 0.005 3.13276 down
KNS2 KNS2:kinesin 2 0.01367 3.12315 down
SORBS2 SORBS2:sorbin and SH3 domain containing 2 0.01624 3.12002 down
COL5A3 COL5A3:collagen, type V, alpha 3 0.03875 3.11783 down
EXT1 EXT1:exostoses (multiple) 1 0.04278 3.07762 down
1600002K03RIK na 0.02141 3.0713 down
CLIP3 1500005P14RIK /// AL 0.05159 3.06071 down
POLR3C POLR3C:polymerase (RNA) III (DNA directed) polypeptide C (62kD)
0.0366 3.05909 down
TBCC TBCC:tubulin-specific chaperone c 0.03781 3.04434 down
ERC1 ERC1:ELKS/RAB6-interacting/CAST family member 1 0.04342 3.04195 down
TRIP6 TRIP6:thyroid hormone receptor interactor 6 0.04633 3.04116 down
HSBP1 HSBP1:heat shock factor binding protein 1 0.04248 3.01409 down
PPP2CB PPP2CB:protein phosphatase 2 (formerly 2A), catalytic subunit, beta isoform
0.0088 2.98921 down
PANK3 PANK3:pantothenate kinase 3 0.01014 2.97531 down
TMEM50A TMEM50A:transmembrane protein 50A 0.03696 2.95722 down
AV025504 na 0.00837 2.95663 down
WDFY2 WDFY2:WD repeat and FYVE domain containing 2 0.03629 2.9552 down
DDR2 DDR2:discoidin domain receptor family, member 2 0.03946 2.95262 down
ZFP618 /// LOC667396 na 0.00761 2.94734 down
23www.nature.com/nature
SUPPLEMENTARY INFORMATIONdoi: 10.1038/nature08851
4632411B12RIK na 0.0169 2.94262 down
PTX3 PTX3:pentraxin-related gene, rapidly induced by IL-1 beta 0.03079 2.92064 down
BC017612 na 0.05424 2.89922 down
ATG4C ATG4C:ATG4 autophagy related 4 homolog C (S. cerevisiae) 0.00837 2.89476 down
RBM43 0610033I05RIK 0.04051 2.87449 down
RBM42 3100004P22RIK /// 23 0.03254 2.87222 down
ALOX12 ALOX12:arachidonate 12-lipoxygenase 0.01951 2.86592 down
NCOA5 NCOA5:nuclear receptor coactivator 5 0.01723 2.86006 down
WNK4 WNK4:WNK lysine deficient protein kinase 4 0.04324 2.85777 down
PGP 1700012G19RIK 0.02712 2.84566 down
MYO18A MYO18A:myosin XVIIIA 0.02934 2.84086 down
CYB5R3 CYB5R3:cytochrome b5 reductase 3 0.02474 2.83949 down
AA536749 na 0.03247 2.8289 down
BC005624 na 0.03948 2.82785 down
IPO9 IPO9:importin 9 0.03469 2.81871 down
EXOSC7 EXOSC7:exosome component 7 0.03156 2.81313 down
AP3S1 AP3S1:adaptor-related protein complex 3, sigma 1 subunit 0.05259 2.8084 down
OXNAD1 OXNAD1:oxidoreductase NAD-binding domain containing 1 0.05392 2.80498 down
RRAS RRAS:related RAS viral (r-ras) oncogene homolog 0.03705 2.79071 down
2610002F03RIK na 0.04775 2.78836 down
ZCCHC14 ZCCHC14:zinc finger, CCHC domain containing 14 0.0329 2.77777 down
STS STS:steroid sulfatase (microsomal), arylsulfatase C, isozyme S 0.00883 2.76881 down
RCOR3 RCOR3:REST corepressor 3 0.02713 2.74565 down
ST3GAL2 ST3GAL2:ST3 beta-galactoside alpha-2,3-sialyltransferase 2 0.01937 2.7313 down
HPS4 HPS4:Hermansky-Pudlak syndrome 4 0.04004 2.68525 down
1110005A03RIK na 0.01849 2.68281 down
D930050J11 na 0.01927 2.67308 down
SLC45A4 SLC45A4:solute carrier family 45, member 4 0.04853 2.67167 down
PANK1 PANK1:pantothenate kinase 1 0.04199 2.67069 down
CCDC84 CCDC84:coiled-coil domain containing 84 0.03089 2.66777 down
SAPS1 SAPS1:SAPS domain family, member 1 0.04673 2.64874 down
POMT1 POMT1:protein-O-mannosyltransferase 1 0.04783 2.64598 down
PSD3 4931420C21RIK 0.03173 2.64312 down
REXO1 REXO1:REX1, RNA exonuclease 1 homolog (S. cerevisiae) 0.02204 2.63142 down
MLLT1 MLLT1:myeloid/lymphoid or mixed-lineage leukemia (trithorax homolog, Drosophila); translocated to, 1
0.00544 2.62691 down
CARM1 CARM1:coactivator-associated arginine methyltransferase 1 0.04902 2.60999 down
PBXIP1 PBXIP1:pre-B-cell leukemia transcription factor interacting protein 1
0.04893 2.60147 down

24www.nature.com/nature
doi: 10.1038/nature08851 SUPPLEMENTARY INFORMATION
ANTXR2 ANTXR2:anthrax toxin receptor 2 0.04345 2.59669 down
PARG PARG:poly (ADP-ribose) glycohydrolase 0.004 2.59156 down
3110082I17RIK na 0.03931 2.5905 down
2700097O09RIK na 0.003 2.57518 down
2510003E04RIK na 0.04721 2.57024 down
MED25 MED25:mediator of RNA polymerase II transcription, subunit 25 homolog (S. cerevisiae)
0.0162 2.56425 down
FKBP1B FKBP1B:FK506 binding protein 1B, 12.6 kDa 0.04954 2.5559 down
C030013C21RIK na 0.01692 2.55466 down
METAPL1 na 0.04655 2.53018 down
PDPK1 PDPK1:3-phosphoinositide dependent protein kinase-1 0.05226 2.52208 down
A130038J17RIK na 0.04504 2.50464 down
PXMP3 PXMP3:peroxisomal membrane protein 3, 35kDa (Zellweger syndrome)
0.03348 2.496 down
ZFAND2B ZFAND2B:zinc finger, AN1-type domain 2B 0.045459 2.493982 down
5230400M03RIK na 0.034336 2.483538 down
2410006H16RIK na 0.034442 2.476582 down
B230216N24RIK na 0.008545 2.472954 down
ENO3 ENO3:enolase 3 (beta, muscle) 0.010466 2.472312 down
CNNM2 CNNM2:cyclin M2 0.023387 2.453917 down
WHSC2 WHSC2:Wolf-Hirschhorn syndrome candidate 2 0.052867 2.451304 down
2610507B11RIK na 0.042471 2.451252 down
4930471M23RIK na 0.045363 2.445177 down
PREPL PREPL:prolyl endopeptidase-like 0.040585 2.443074 down
COQ6 COQ6:coenzyme Q6 homolog, monooxygenase (S. cerevisiae) 0.036103 2.430283 down
SBDS SBDS:Shwachman-Bodian-Diamond syndrome 0.027655 2.430248 down
C920006C10RIK na 0.040843 2.429177 down
ZFAND3 ZFAND3:zinc finger, AN1-type domain 3 0.051068 2.411616 down
5830472M02RIK na 0.022833 2.407413 down
ACADVL ACADVL:acyl-Coenzyme A dehydrogenase, very long chain 0.051178 2.377887 down
5330421F07RIK na 0.031995 2.370213 down
TCF7L2 TCF7L2:transcription factor 7-like 2 (T-cell specific, HMG-box) 0.017742 2.366551 down
C1R C1R:complement component 1, r subcomponent 0.034414 2.365563 down
PVRL2 PVRL2:poliovirus receptor-related 2 (herpesvirus entry mediator B) 0.016279 2.364646 down
UBE2G1 UBE2G1:ubiquitin-conjugating enzyme E2G 1 (UBC7 homolog, yeast) 0.052156 2.364552 down
0610037M15RIK na 0.030055 2.359723 down
TOM1L2 TOM1L2:target of myb1-like 2 (chicken) 0.042417 2.357986 down

25www.nature.com/nature
SUPPLEMENTARY INFORMATIONdoi: 10.1038/nature08851
4930453N24RIK na 0.012838 2.333928 down
SKI SKI:v-ski sarcoma viral oncogene homolog (avian) 0.032083 2.333383 down
BC048355 na 0.021395 2.328441 down
PPCDC PPCDC:phosphopantothenoylcysteine decarboxylase 0.002518 2.31653 down
SKAP2 SKAP2:src kinase associated phosphoprotein 2 0.048548 2.316329 down
LOC619719 na 0.031426 2.310286 down
TPD52L1 TPD52L1:tumor protein D52-like 1 0.052966 2.303352 down
1810048P08RIK na 0.038413 2.295201 down
COMMD4 COMMD4:COMM domain containing 4 0.043682 2.292841 down
HEXA HEXA:hexosaminidase A (alpha polypeptide) 0.041359 2.285667 down
SLC44A1 SLC44A1:solute carrier family 44, member 1 0.020211 2.259007 down
3010001K23RIK na 0.038181 2.242436 down
FLI1 FLI1:Friend leukemia virus integration 1 0.006129 2.224242 down
DENND1A DENND1A:DENN/MADD domain containing 1A 0.010247 2.210609 down
TRIP10 TRIP10:thyroid hormone receptor interactor 10 0.022136 2.206315 down
RBL1 RBL1:retinoblastoma-like 1 (p107) 0.029564 2.190662 down
PHF2 PHF2:PHD finger protein 2 0.04758 2.187651 down
FZD1 FZD1:frizzled homolog 1 (Drosophila) 0.035345 2.181633 down
TMEM141 TMEM141:transmembrane protein 141 0.019349 2.166158 down
C030040A22RIK na 0.041693 2.147752 down
2810439F02RIK na 0.041809 2.136875 down
NME7 NME7:non-metastatic cells 7, protein expressed in (nucleoside-diphosphate kinase) 0.037948 2.135189 down
INPP5A INPP5A:inositol polyphosphate-5-phosphatase, 40kDa 0.050672 2.131062 down
IFT172 IFT172:intraflagellar transport 172 homolog (Chlamydomonas) 0.025341 2.111549 down
RNF19 RNF19:ring finger protein 19 0.042536 2.09939 down
E130303B06RIK na 0.034074 2.098219 down
SGTB SGTB:small glutamine-rich tetratricopeptide repeat (TPR)-containing, beta 0.040253 2.09804 down
MUM1 MUM1:melanoma associated antigen (mutated) 1 0.026382 2.092568 down
NCBP2 NCBP2:nuclear cap binding protein subunit 2, 20kDa 0.032454 2.089116 down
ARMCX1 ARMCX1:armadillo repeat containing, X-linked 1 0.037973 2.081989 down
SPHK1 SPHK1:sphingosine kinase 1 0.007448 2.076194 down
MTA3 MTA3:metastasis associated 1 family, member 3 0.005851 2.073348 down
C530028I08RIK na 0.015106 2.062652 down
6330403L08RIK na 0.047894 2.062485 down
IFI47 na 0.030068 2.056686 down
ARHGAP5 ARHGAP5:Rho GTPase activating protein 5 0.02651 2.05092 down

26www.nature.com/nature
doi: 10.1038/nature08851 SUPPLEMENTARY INFORMATION
NUDCD3 NUDCD3:NudC domain containing 3 0.047587 2.048661 down
GAG na 0.040636 2.043669 down
D8BWG1414E na 0.04943 2.03895 down
PPP1R12B PPP1R12B:protein phosphatase 1, regulatory (inhibitor) subunit 12B 0.026326 2.020668 down
D15WSU169E na 0.028883 2.010003 down
ODZ4 ODZ4:odz, odd Oz/ten-m homolog 4 (Drosophila) 0.043972 2.004228 down

27www.nature.com/nature
SUPPLEMENTARY INFORMATIONdoi: 10.1038/nature08851
Supplementary table 2: GSEA: Gene sets significantly enriched in OCDfl/+ osteolineage cells
PATHWAY
NAME SIZE NES NOM p-value
FDR q-value
Osteogenic differentiation1
UP_GENES_OSTEOGENIC 43 1.60 0 0.000
TGF-β TGFBETA_EARLY_UP 45 2.578963 0 0.000
TGF_BETA_SIGNALING_PATHWAY 46 2.433784 0 0.008223
TGFBETA_ALL_UP 75 2.432784 0 0.006167
Wnt/βcatenin AMBROSETTI_UP-WNT ACTIVATION 54 1.797488 0 0.001945
KENNY_WNT_DN 39 1.757821 0 0.032086
ST_WNT_BETA_CATENIN_PATHWAY 30 1.699135 0 0.041116
UV UVC_LOW_ALL_DN 49 2.407943 0 0.004112
UVB_NHEK3_C5 33 2.405828 0 0.003524
UVB_NHEK1_DN 233 2.254912 0 0.005181
UVC_TTD_ALL_DN 319 2.227531 0 0.009852
Gene Sets from:
1 Schilling,T. et al., Microarray analyses of transdifferentiated mesenchymal stem cells, J. Cell Biochem. 103(2), 413 (2008).
2 Ambrosetti, D. et al., Fibroblast Growth Factor Signaling Uses Multiple Mechanisms To Inhibit Wnt-Induced Transcription in Osteoblasts. Molecular and Cellular Biology, 28 (15), 4759 (2008) Details of other gene sets can be found at http://www.broad.mit.edu/gsea/

28www.nature.com/nature
doi: 10.1038/nature08851 SUPPLEMENTARY INFORMATION
Supplementary table 3: Cytokines, interleukins, growth factors and other secreted factors differentially expressed in OCD fl/fl osteolineage cells (>1.5-fold; t-test<0.05)
Symbol Name t-test Fold-difference
PF4 platelet factor 4 0.0006 1.58
NPTX2 neuronal pentraxin II 0.004 1.61
IL31 interleukin 31 0.005 1.78
CCK cholecystokinin 0.039 1.71
OLFM4 olfactomedin 4 0.039 1.94
PRG2 proteoglycan 2, bone marrow 0.046 4.69
CRTAC1 cartilage acidic protein 1 0.047 3.10
STC1 stanniocalcin 1 0.048 1.54
COL4A4 collagen, type IV, alpha 4 0.050 2.61
Symbol Name t-test Fold-difference
PLAC9 placenta-specific 9 0.015 3.65
PROS1 protein S (alpha) 0.027 3.84
JAG1 jagged 1 (Alagille syndrome)
0.034 4.58
COL5A3 collagen, type V, alpha 3 0.039 3.12
BAI1 brain-specific angiogenesis inhibitor 1
0.045 1.61
ADM adrenomedullin 0.050 4.57

29www.nature.com/nature
SUPPLEMENTARY INFORMATIONdoi: 10.1038/nature08851
Supplementary methods and materials
Mice and genotyping
Osx-Cre transgenic mice9, Ocn-Cre transgenic mice20 and floxed Dicer1 mice10,
have been described. B6.SJL-Ptprca Pep3b/BoyJ mice were purchased from the
Jackson Laboratory. Floxed Dicer1 mice were on a mixed C57/B6/J129
background. Other mice strains were on a C57/B6 background. Genotyping of
Cre transgenic mice was performed by PCR using primers detecting the Cre
sequence36. The floxed and wild-type Dicer1 alleles were detected by using
primers, P1: 5′-AGTGTAGCCTTAGCCATTTGC-3′ and P2: 5′-
CTGGTGGCTTGAGGACAAGAC-3′. These primers amplify the region spanning
the downstream loxP sequence. Deletion of the floxed sequence from the Dicer1
gene was demonstrated by using primers: P1: 28290: 5'-
AGTAATGTGAGCAATAGTCCCAG-3' and P2: 32050AS: 5'-
CTGGTGGCTTGAGGACAAGAC-3' OCD fl/fl animals were compared to OCD fl/+
littermates for the studies described in this paper. The Subcommittee on
Research Animal Care of the Massachusetts General Hospital approved all
animal work according to federal and institutional policies and regulations.
RT-PCR
RNA extraction, real-time quantitative RT-PCR and relative gene expression
quantitation was performed on sorted cells (GFP+CD45-CD31-Lineage –) as
described previously37 using the following primers: Dicer1-F, 5′-
AATTGGCTTCCTCCTGGTTAT-3′ and Dicer1-R,
GTCAGGTCCTCCTCCTCCTC-3′; Osteocalcin-F, 5′-
CTGACCTCACAGATCCCAAGC -3′ and Osteocalcin-R, 5′-
TGGTCTGATAGCTCGTCACAAG -3′;. GAPDH-F, 5′-
AGGTCGGTGTGAACGGATTTG -3′ GAPDH-R, 5′-
TGTAGACCATGTAGTTGAGGTCA -3′

30www.nature.com/nature
doi: 10.1038/nature08851 SUPPLEMENTARY INFORMATION
Isolation and osteogenic differentiation of bone marrow derived stromal cells
Mice were sacrificed; tibiae, femurs, and spine were removed and excess soft
tissue was eliminated. Using a pestle and mortar, the bones were crushed and
washed in PBS with 0.5% FBS and passed through a 40-μm filter into a
collection tube. Cells were spun at 1500rpm for 5 minutes; the supernatant was
removed, and cells were resuspended in a minimal volume of ACK lysing buffer
(Cambrex) for 4 minutes on ice and washed once with PBS. After pelleting once
again, the cells were resuspended and plated in αMEM, 20% fetal bovine serum
(HyClone), and penicillin and streptomycin solution (CellGro) - henceforth
referred to as αMEM20%- and incubated at 33°C with 5% CO2. After 3 weeks of
culture and expansion, plastic adherent cells were CD45 depleted by magnetic
isolation (Invitrogen; Dynabeads M-280 Streptavidin, 112-06D) using an anti-
mouse CD45 biotin antibody (BD Bioscience; 550539). The plastic adherent
CD45 negative cells were then maintained in αMEM20% as before. To assess
osteogenic differentiation, bone marrow derived stromal cells (passage 3) were
plated at 10 × 103 cells/well in a 96-well plate (BD Biosciences) at 33° in
osteogenic induction medium: α20% modified with glycerol 2-phosphate (2.16
mg/ml), 2-phospho-L-ascorbic acid (0.05 mg/ml), and dexamethasone (10 nM)
(Sigma-Aldrich, G6251, 49752 and D1756, respectively ). After 7 days of
differentiation, alkaline phosphatase staining was carried out with BCIP/NBT
solution (Sigma-Aldrich) per the manufacturer’s instructions . For the von Kossa
assay and staining, cells were fixed and washed in water, and a 5% silver nitrate
solution was added to the well under incandescent light for 20–45 minutes. After
granules developed, the silver nitrate was removed and wells were washed with
water to stop the reaction.
CFU-F and CFU-ALK
0.5 × 10⁶ primary bone marrow cells were plated in 12-well plates in αMEM20%
for CFU-F assay or osteogenic medium for CFU-Alk assay. Medium was
changed at 24 hours to eliminate nonadherent cells. After 7 days, colonies were

31www.nature.com/nature
SUPPLEMENTARY INFORMATIONdoi: 10.1038/nature08851
assessed by methylene blue staining for the CFU-F assay or BCIP staining
(alkaline phosphatase) for CFU-Alk.
Histomorphometric analysis
Bones were fixed in 4% paraformaldehyde and undecalcified sections embedded
in methyl methacrylate resin. Five-micrometer sections were stained with Masson
Trichrome or coverslipped unstained, and histomorphometric analysis was
performed with the Osteomeasure system (Osteometrics Inc., Atlanta, GA) using
standard procedures. Tibial sections were measured in the proximal metaphysis
beginning 340 µm below the chondro-osseous junction. Osteoblasts were
identified as mononuclear cells directly abutting either mineralized bone or
osteoid and restricted to the endosteal surface.
In Situ Hybridization.
In situ hybridization was carried out as described36. Complementary 35S-labeled
riboprobes were transcribed from the plasmids encoding mouse osteocalcin (OC)
using Riboprobe systems from Promega (Madison, WI). Probes for Osteocalcin
were described36.
Hematological Measurements
Peripheral blood samples were obtained by lateral tail vein bleeding. Peripheral
blood cell counts were performed on a HEMAVET Multispecies Hematology
Analyzer (CDC Technologies).
Methylcellulose colony formation assay
Bone marrow or spleen cells (10X103) were plated into methylcellulose M3434
(StemCell Technologies) in a 6-well plate and grown for 10 days before being
scored.
FACS analysis

32www.nature.com/nature
doi: 10.1038/nature08851 SUPPLEMENTARY INFORMATION
Hematopoietic progenitors were identified based on their expression of lineage
markers as well as c-Kit, Sca-1, CD48 and CD150 expression. Lineage staining
used a cocktail of biotinylated antimouse antibodies to Mac-1α (CD11b), Gr-1(Ly-
6G and Ly-6C), Ter119 (Ly-76), CD3, CD4, CD8a (Ly-2), and B220 (CD45R; BD
Biosciences). For detection we used lineage-streptavidin conjugated with
PERCP, c-Kit-APC (CD117), CD48-pacific blue (CD135), CD150-PE-Cy7 (all
from BD Biosciences) and Sca1-PE-Cy5.5 (Ly 6A/E; Caltag Laboratories). For
congenic strain discrimination, anti-CD45.1-PE and anti-CD45.2 FITC antibodies
(BD Biosciences) were used. For the apoptosis assay we used 7-AAD and
AnnexinV-APC (BD Biosciences) in combination with lineage-streptavidin-PE and
c-kit-FITC (both Biolegend). For the intracellular detection of BRDU-FITC, bone
marrow cells were fixed and permeabilized using BD Cytofix/Cytoperm
Fixation/Permeabilization Solution Kit (BD Biosciences) according to the
manufacturer's recommendations. Compensation and data analysis were
performed using Flowjo 8.5.3
FACS- sorting of osteolineage cells
Whole bone-marrow and bone cells were collected by crushing tibias and femurs
of mice, stained with biotin-conjugated lineage cocktail antibodies and subjected
to lineage depletion using magnetic isolation (Invitrogen; Dynabeads M-280
Streptavidin, 112-06D). The resulting lineage-depleted fraction was stained with
lineage and CD31-biotin-streptavidin APC-Cy7 (BD Biosciences) and CD45-APC
(eBioscience) and sorted using FACS DiVa or FACS ARIA (Becton Dickinson). A
small fraction of the collected cells was re-run through the sorter and over 95%
purity was consistently confirmed.
Collagenase treatment of bone for PCR
Collagenase digestion was preformed on the bone fragments left in the mortar
and 70-μm filter after crushing long bones. A solution of DMEM (Cellgro; 10-013-
CV), 0.2% collagenase (WAKO; 034-10533) and 10mM HEPES (Fisher; BP299-
100) was warmed to 37°C. In a centrifuge tube, bone fragments were added to

33www.nature.com/nature
SUPPLEMENTARY INFORMATIONdoi: 10.1038/nature08851
the collagenase solution and kept at 37°C for 90 minutes, vortexing every 15-30
minutes. Excess PBS was added to the slurry which was then filtered through a
40-μm filter. The flow-through was then pelleted.
Bone marrow histology and peripheral blood morphology
For histological analysis, long bones were dissected, fixed in paraformaldehyde
4%, decalcified in 10% EDTA, paraffin-processed, cut, and subjected to
hematoxylin/eosin staining. Peripheral blood smears were formalin fixed for 5
minutes, stained with May-Grunwald ( Sigma-Aldrich) for 5 minutes, rinsed in
distilled water with PBS and in Giemsa stain (Sigma-Aldrich) for another 30
minutes. Permount (Fisher Scientific) was used to mount the sections. Images
were acquired with a Nikon Eclipse 80i epifluorescence microscope equipped
with a Qimaging Micropublisher digital CCD colour camera. Bone and bone
marrow histology was assessed by two independent investigators blinded to mice
genotypes.
Bone marrow transplantation
All bone marrow transplantations were performed by retro-orbital venous plexus
injection. For competitive transplantation, 5 × 10⁵ whole bone-marrow cells from
6-week-old OCD fl/+ or OCD fl/fl (CD45.2) littermates were mixed with 5 × 10⁵
CD45.1+ (competitor) WT cells and injected into lethally irradiated (9 Gy, split
dose on the day of transplant) recipient BL6-SJL (CD45.1+) mice. Engraftment
efficiency in recipients was monitored by donor contribution of CD45.2+ cells
using FACS analysis. For limiting dilution assays, 2 × 10⁵, 5 × 10⁴ 1 × 10⁴ and
0.5 X 10⁴ OCD fl/+ or OCD fl/fl mononuclear bone marrow cells were mixed with 2
× 105 wild type bone marrow and injected into lethally irradiated recipients (9
mice per cell dose per genotype). Engraftment efficiency in recipients was
monitored by donor contribution of cells using FACS analysis. The frequencies of
competitive repopulating units were calculated using the L-Calc software. Greater
than or equal to 1% donor cells in both myeloid and lymphoid lineages was used
34www.nature.com/nature
doi: 10.1038/nature08851 SUPPLEMENTARY INFORMATION
to determine whether an animal had a positive engraftment. For “ wt into mutant”
experiments, wildtype congenic BL6/SJL (CD45.1+) bone marrow cells (1 x 10⁶
cells/recipient) were transplanted into lethally irradiated 4 week old OCD fl/+ and
OCD fl/fl (CD45.2+) recipients. Complete donor cell engraftment by wildtype
CD45.1+ cells was confirmed by FACS. Conversely, for “mutant into wt”
experiments OCD fl/+ or OCD fl/fl (CD45.2+) were transplanted into lethally
irradiated 4 week old BL6/SJL (CD45.1+) animals. Complete donor cell
engraftment by CD45.1/CD45.2+ cells was confirmed by FACS.
Immunohistochemistry
For immunohistochemistry, antigen retrieval was carried out with proteinase K
(20 mg/ml, Roche), followed by 3% H2O2 treatment to block endogenous
peroxidase. The TSA Biotin system (PerkinElmer) was used according to the
manufacturer's instructions. Specimens were incubated with mouse anti-CD31
antibody (BD Biosciences) or anti-CD13 antibody (Santa Cruz Biotechnology) for
1 hr at room temperature.
BrdU Labeling and Detection.
Mice received 150 l BrdU solution (10 mg ml-1) via intraperitoneal injection. After
15 hrs bone marrow was harvested for flow cytometric detection of BrdU-FITC
uptake according to or the manufacture’s instructions (FITC-BrdU Flow Kit (BD
Biosciences).
In vivo imaging
In vivo imaging has been extensively described elsewhere14. Briefly, 1–5 105
wild-type (Bl6/SJL) LKS cells were stained with 5 M DiD in PBS without serum for
10 min at 37 °C, washed once in PBS and immediately injected into the tail vein
of recipient mice. Mice were anaesthetized and prepared for in vivo imaging as
described. Immediately before imaging 20 l of non-targeted Qdot 800 or 655
(Invitrogen) diluted in 130 l sterile PBS was injected retro-orbitally to allow
vasculature visualization. All mice were imaged with a custom-built confocal two-
35www.nature.com/nature
SUPPLEMENTARY INFORMATIONdoi: 10.1038/nature08851
photon hybrid microscope specifically designed for live animal imaging.
Microscopy and image processing have been described. Images were colored
and merged using Adobe Photoshop and LKS-microenvironment distance
measures were obtained using Adobe Illustrator and Microsoft Excel. A two-tailed
type 2 t-test was applied to all data. P values 0.05 were considered statistically
significant.
Co-culture studies
Bone marrow stromal cells were isolated and CD45 depleted by magnetic
isolation upon confluence and expanded for an additional week. The expanded
cells were then plated at 1750 cells/well in 384-well tissue culture plates coated
with fibronectin (Millipore; FC010) in either αMEM20% or osteogenic induction
media. After four days of culture, 200 LKS or MEP (megakaryocyte-erythroid
progenitor, lineage-, CD 127-, Sca-,kit+, CD34-,CD16/32- cells.) cells from 8-12
week old Actin-DsRed positive mice (Jackson Laboratory; 005441) were added
to each well. Co-culture was performed without any cytokines. After 7 days of co-
culture the number of DS-red cells was assessed by automated microscopy.
Megakaryocytes were quantified morphologically as large cells with prominent
multinucleated megakaryons (the identity of these cells was additionally
confirmed by CD41 staining).
Comparative genomic hybrydization
Direct amplification of DNA from paraformaldehyde fixed paraffin-embedded
(FFPE) tissue samples was performed using a REPLI-g FFPE kit (Qiagen)
following the manufactory instruction. Briefly, FFPE samples were incubated at
95C for 10 min followed by lysis at 60C for 60 min and ligation at 24C for 30 min.
Amplification took place at 30C for 2h. Agilent genomic DNA labeling kit was
used for the amplified FFPE DNA labeling and purification. For each 244K array,
2 ug of FFPE DNA and 2 ug of germline reference DNA were labeled with Cy5
and Cy3 respectively. Labeled FFPE DNA and reference DNA were combined
and mixed with Cot-1 DNA, blocking agent and hybridization buffer. After

36www.nature.com/nature
doi: 10.1038/nature08851 SUPPLEMENTARY INFORMATION
denaturation at 95C for 3 min and incubation at 37C for 30 min, the hybridization
mix was loaded onto a gasket slide in a Agilent Surehyb chamber. Array slide
was placed on top the gasket slide. The SureHyb chamber was covered,
clamped and incubated in a rotator rack in 65C oven for 40 hour. In an ozone-
controlled environment, hybridized arrays were disassembled, and washed in
Agilent Oligo aCGH wash buffer 1 for 5 min, in wash buffer 2 for 1 min at 37C,
and immediately scanned using an Agilent DNA microarray scanner. Data
extraction was conducted using the feature extraction software. Finally FE data
files were analyzed using the Agilent DNA analytics software.
Oligonucleotide microarrays
RNA was isolated from sorted GFP+CD45-CD31-Lineage- cells by Trizol
extraction (Invitrogen) according to the manufacturer’s protocol. Up to 4 mice
were pooled per sample. Linear amplification of 20 ng of total RNA was
performed using the Ovation Biotin RNA Amplification and Labeling System
(Nugen). The biotinylated cRNA was hybridized to the Affymetrix Mouse430 v2
chip. Signal normalization was performed by RMA method. Data of three
samples of OCD fl/fl cells vs. three samples of OCD fl/+ cells was analyzed using
GEPAS package38. A t-test was carried to identify probes differentially expressed
between OCD fl/+ and OCD fl/fl samples. Gene set enrichment analysis was
performed using GSEA39. The signal-to-noise metric and permutation of gene
sets was used to rank the genes and calculate significance and false discovery
rate. Analysis was performed by collapsing probe sets to unique gene symbols
and used to interrogate an established collection of curated gene sets provided
by the Molecular Signatures Database (MsigDB,
http://broad.mit.edu/gsea/msigdb). The osteogenic gene expression signature
was collected from the literature21 and used to interrogate the gene expression
dataset comparing OCD fl/+ and OCD fl/fl samples for gene set enrichment.
Statistical analysis
37www.nature.com/nature
SUPPLEMENTARY INFORMATIONdoi: 10.1038/nature08851
In all cases, analysis was performed by a standard unpaired, 2-tailed Student’s t
test. All data have been plotted as average ± SEM. Statistical significance is
indicated by * (P≤0.05) or ** (p≤0.01). The number of experiments is indicated in
the figure legends.
36 T. Kobayashi,
et
al., "Dicer-dependent
pathways
regulate
chondrocyte
proliferation
and
differentiation,"
Proc.
Natl.
Acad.
Sci.
U.
S.
A 105 ︵6 ︶,
1949
︵2008 ︶.
37 M.
H.
Raaijmakers,
et
al., "Quantitative
assessment
of
gene
expression
in
highly
purified
hematopoietic
cells
using
real-time
reverse
transcriptase
polymerase
chain
reaction,"
Exp.
Hematol.
30 ︵5 ︶,
481 ︵2002 ︶.
38 D.
Montaner,
et
al., "Next
station
in
microarray
data
analysis:
GEPAS,"
Nucleic
Acids
Res.
34 ︵Web
Server
issue ︶,
W486-W491 ︵2006 ︶.
39 A.
Subramanian,
et
al., "Gene
set
enrichment
analysis:
a knowledge-based
approach
for
interpreting
genome-wide
expression
profiles,"
Proc.
Natl.
Acad.
Sci.
U.
S.
A 102 ︵43 ︶,
15545 ︵2005 ︶.
denaturation at 95C for 3 min and incubation at 37C for 30 min, the hybridization
mix was loaded onto a gasket slide in a Agilent Surehyb chamber. Array slide
was placed on top the gasket slide. The SureHyb chamber was covered,
clamped and incubated in a rotator rack in 65C oven for 40 hour. In an ozone-
controlled environment, hybridized arrays were disassembled, and washed in
Agilent Oligo aCGH wash buffer 1 for 5 min, in wash buffer 2 for 1 min at 37C,
and immediately scanned using an Agilent DNA microarray scanner. Data
extraction was conducted using the feature extraction software. Finally FE data
files were analyzed using the Agilent DNA analytics software.
Oligonucleotide microarrays
RNA was isolated from sorted GFP+CD45-CD31-Lineage- cells by Trizol
extraction (Invitrogen) according to the manufacturer’s protocol. Up to 4 mice
were pooled per sample. Linear amplification of 20 ng of total RNA was
performed using the Ovation Biotin RNA Amplification and Labeling System
(Nugen). The biotinylated cRNA was hybridized to the Affymetrix Mouse430 v2
chip. Signal normalization was performed by RMA method. Data of three
samples of OCD fl/fl cells vs. three samples of OCD fl/+ cells was analyzed using
GEPAS package38. A t-test was carried to identify probes differentially expressed
between OCD fl/+ and OCD fl/fl samples. Gene set enrichment analysis was
performed using GSEA39. The signal-to-noise metric and permutation of gene
sets was used to rank the genes and calculate significance and false discovery
rate. Analysis was performed by collapsing probe sets to unique gene symbols
and used to interrogate an established collection of curated gene sets provided
by the Molecular Signatures Database (MsigDB,
http://broad.mit.edu/gsea/msigdb). The osteogenic gene expression signature
was collected from the literature21 and used to interrogate the gene expression
dataset comparing OCD fl/+ and OCD fl/fl samples for gene set enrichment.
Statistical analysis