Supplementary Information for the Realization of the PLTS-2000 · Supplementary Information for the...
25
Supplementary Information for the Realization of the PLTS-2000 ________________________________________________________________________________________ 1 / 25 Bureau International des Poids et Mesures Supplementary Information for the Realization of the PLTS-2000 Consultative Committee for Thermometry under the auspices of the International Committee for Weights and Measures
-
Upload
nguyennguyet -
Category
Documents
-
view
214 -
download
0
Transcript of Supplementary Information for the Realization of the PLTS-2000 · Supplementary Information for the...
Supplementary Information for the Realization of the PLTS-2000 ________________________________________________________________________________________
1 / 25
Bureau International des Poids et Mesures
Supplementary Information
for the Realization of the
PLTS-2000
Consultative Committee for Thermometry
under the auspices of the
International Committee for Weights and Measures

Supplementary Information for the Realization of the PLTS-2000 ________________________________________________________________________________________
2 / 25
Supplementary Information for the Realization of
the PLTS-2000
This document has been prepared by a task group of CCT Working Group 4 to give
general guidance for establishing and measuring melting pressures of 3He in the range
from 0.902 mK to 1 K, i.e. for realizing the PLTS-2000. It draws on published techniques
and designs, and is intended to be suitable for application in national measurement
institutes, as well as more generally in ultra-low temperature laboratories where absolute
pressure standards are not normally available. It is a slightly modified version of the
publication by Rusby et al. [2007].
The document describes methods by which the PLTS-2000 can be realized
successfully. However, it should not be taken as laying down how it must be done. The
description of any particular apparatus is more for illustration than prescription, and
considerable variation can often be effective. Likewise, quoted numerical data and
dimensions are mostly for guidance only.
1 Introduction
The Provisional Low Temperature Scale of 2000, PLTS-2000, was adopted by the CIPM
in October 2000 to provide an extension of the International Temperature Scale of 1990,
ITS-90, to lower temperatures. It ranges from the Néel temperature of solid 3He,
T2000 = 0.902 mK, up to 1 K, thus overlapping the ITS-90 between 0.65 K and 1 K. The
definition and derivation of the PLTS-2000 has been published by Rusby et al. [2002].
The requirements of temperature measurement in the range well below 1 K differ
from those at higher temperatures in nature as well as in degree. There are no longer any
gases whose properties can be used in gas thermometry (for primary measurements or
interpolation) or in vapour pressure thermometers (as used in the ITS-90). Thermal
radiation is virtually extinct, and thermometry must rely mainly on the electrical, magnetic
or nuclear properties of condensed matter, whose characteristic energies lie in the
millikelvin range. Moreover, the rapid increase in thermal resistances on cooling means
that measurements must be almost non-dissipative.
In spite of this, a surprising variety of thermometers have been exploited to meet
needs in various parts of the range and with varying degrees of linkage to thermodynamics
or statistical physics [Hudson et al. 1975, Schuster et al. 1994, Lounasmaa 1974, Betts
1976, Richardson and Smith 1988, Pobell 1996]. Examples are: noise thermometry using
SQUIDs; paramagnetic (Curie law) susceptibility of dilute salts, magnetic alloys or
nuclear spins; NMR; anisotropy of gamma-ray emissions to probe the population of
hyperfine spin-states in radioactive nuclei; second-sound or osmotic pressure in 3He-
4He
mixtures; viscometry using vibrating wires; and I-V characteristics of junctions between
metals, semiconductors and superconductors; and in addition the secondary (e.g.
resistance) thermometers which may be calibrated against them.

Supplementary Information for the Realization of the PLTS-2000 ________________________________________________________________________________________
3 / 25
These thermometers all have their advantages and disadvantages, but none has all the
qualities necessary for defining an International Temperature Scale – sensitivity,
reproducibility, practicality (convenience of realization or calibration), and universality.
Noise thermometers, which may operate in a primary or secondary way over the whole
range, suffer from potential offsets which must be taken into account. The CMN magnetic
thermometer has materials-related difficulties due to purity and poor thermal diffusivity in
single crystals, or ambiguities over the Weiss constant in a powdered sample. Most other
thermometers are only suitable as secondary devices, and the ranges of usefulness of
many are limited, so that more than one would be needed to construct a complete scale.
However, a thermometer using the melting pressure of 3He, which was first proposed
by Scribner and Adams [1970], almost entirely meets the requirements. In 1996, the CCT
called for a 3He melting-pressure equation to be derived to serve as the basis for an
extension of the ITS-90 down to a temperature of about 1 mK, analogous to the use of the
vapour pressures of 3He and
4He in the ITS-90.
3He is a well-defined substance, with
sufficient availability, and the melting pressure, pm, is sensitive to temperature over most
of the range of interest. However, there were differences of opinion regarding the pm-T
relationship at the lowest temperatures, at the level of ± 2 % of T, and as a result the
PLTS-2000 was adopted on a provisional basis only. These differences have not yet been
resolved.
The equation adopted for the melting pressure pm in the PLTS-2000 is
9
3
2000m /K)(MPa/i
i
i Tap , (1)
with the following coefficients:
a3 = 1.385 544 2 · 1012
a2 = 4.555 702 6 · 109
a1 = 6.443 086 9 · 106
a0 = 3.446 743 4 · 100
a1 = 4.417 643 8 · 100
a2 = 1.541 743 7 · 101
a3 = 3.578 985 3 · 101
a4 = 7.149 912 5 · 101
a5 = 1.041 437 9 · 102
a6 = 1.051 853 8 · 102
a7 = 6.944 376 7 · 101
a8 = 2.683 308 7 · 101
a9 = 4.587 570 9 · 100.

Supplementary Information for the Realization of the PLTS-2000 ________________________________________________________________________________________
4 / 25
Figure 1. The 3He melting pressure, pm, (full line) and the absolute value of the derivative
dpm/dT (dashed line, right-hand scale) versus temperature, from [Durieux and Reesink 1999].
TN, TB and TA indicate the temperatures of three phase transitions in solid or liquid 3He.
Figure 1 is a graphical representation of the melting curve below 1 K, which shows
that the pressure range of interest is from 2.93 MPa to 4.0 MPa. Values of pm and
dpm/dT2000 are tabulated at intervals of T2000 in Appendix A.
The melting pressure of 3He was chosen as the property on which the scale should be
based because of the sensitivity and reliability with which it may be measured over a wide
range, covering more than three decades of temperature, apart from a narrow region
around the pressure minimum, at Tmin = 315.24 mK. It is a thermodynamic property with
few complications arising from purity, etc., it provides an unambiguous universal
definition, and it is capable of being realized in laboratories around the world without the
exchange of artifacts.
However, there are also some practical complications. In particular, the melting-
pressure cell must operate at high pressure, with implications for the cell design and gas-
handling system, and it must include a pressure transducer capable of good sensitivity and
reproducibility.
Supplementary Information for the Realization of the PLTS-2000 ________________________________________________________________________________________
5 / 25
2 Requirements and features
Fundamentally the operation of a melting pressure thermometer (MPT) requires that a
sample of pure liquid and solid 3He be brought to equilibrium at the desired temperature,
and that the equilibrium pressure be measured absolutely. Following the original work of
Straty and Adams [1969], several designs of MPT have been described; see for example
[Greywall and Busch 1982, Bremer and Durieux 1992, Schuster et al. 2001]. In what
follows particular use is made of three publications, due to Schuster, Hoffmann and
Hechtfischer [2001]; Colwell, Fogle and Soulen [1992], who used a thermometer provided
by Greywall [1982]; and Adams [2005]. They are here designated SHH, CFS and EDA,
respectively.
A consequence of the inversion in pressure is that for temperatures below Tmin the
cell cannot communicate at constant pressure with an external measuring system: the
sensing capillary is blocked with a plug of solid 3He, and direct contact with the pressure
in the cell is lost. A melting-pressure cell must therefore include a pressure transducer,
and this leads to the particular usefulness of the intrinsic fixed points discussed below.
In the region around the minimum the thermometer cannot be used directly and some
interpolation is required. The method for doing this is not specified in the PLTS-2000, but
it can use any secondary sensor (CMN, resistive, etc.) which can be calibrated in this
range. Although it may be surprising to base a scale on a thermometer where there is a
region of low or zero sensitivity, the minimum has the compensating advantage of
providing an in-built pressure fixed point which can be used for the calibration of the
pressure transducer, as will be seen. SHH show that by stepping carefully through the
minimum, the temperature can also be located, within about 10 μK.
Figure 1 indicates the three other intrinsic fixed points of pressure and temperature,
which may be detected and used as fixed points of pressure and temperature for the in situ
calibration of the pressure transducer. They are the transition to the superfluid ‘A’ phase,
the ‘A to B’ transition in the superfluid and the Néel transition in the solid. The pressure
and temperature values of the four fixed points on the PLTS-2000 are shown in Table 1,
with the estimated thermodynamic uncertainty (at k = 1) in the temperatures, ΔT, and the
uncertainty of the current best practical realization of each point, δTr. For the three low-
temperature features, δTr comes from the pressure resolution with which they can be
observed (about ± 3 Pa for pA and pNéel, ± 10 Pa for pA-B, see Section 5) coupled with the
derivative dpm/dT. For the minimum, the pressure resolution is also about ± 3 Pa; δTr
comes from locating the point of zero derivative in SHH. The uncertainty in the assigned
absolute pressure values was estimated by [Rusby et al. 2002] to be ± 60 Pa.
Supplementary Information for the Realization of the PLTS-2000 ________________________________________________________________________________________
6 / 25
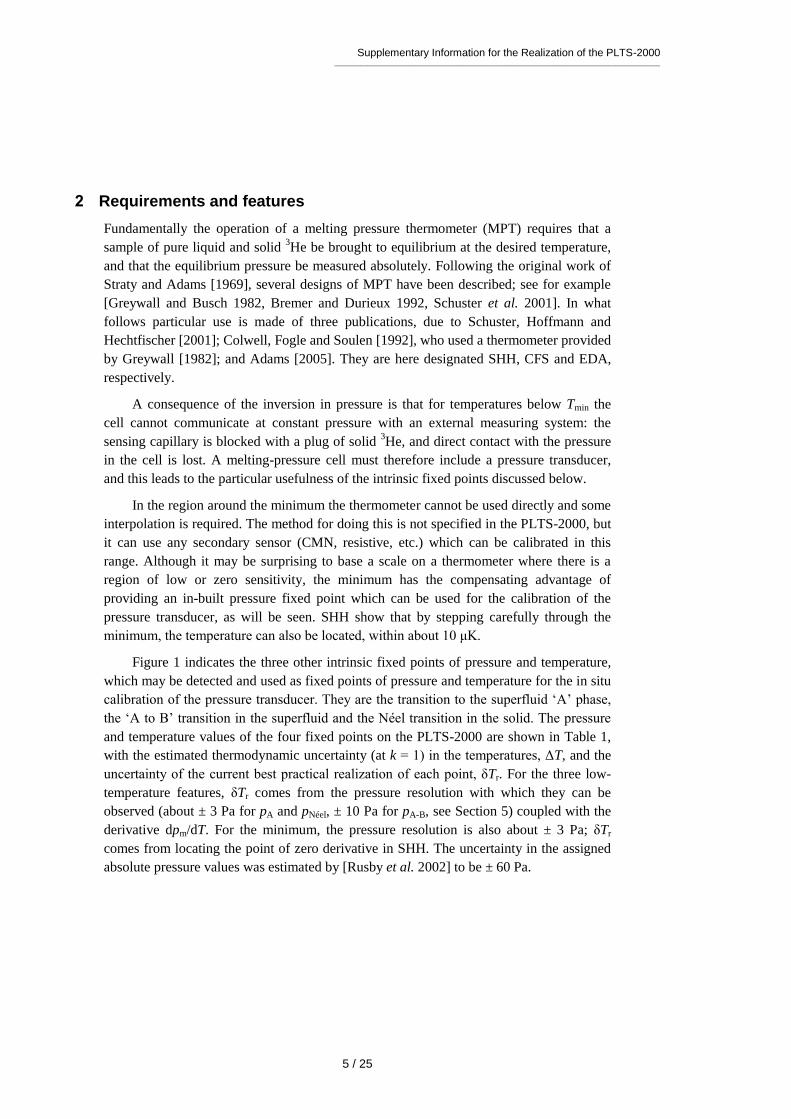
Table 1. Values of pm and T2000 for the 3He melting-pressure features, with estimated standard
uncertainties with respect to thermodynamic temperature, ΔT, and the standard uncertainties of
the current best realizations, δTr.
Point pm/MPa T2000/mK ΔT / μK δTr / μK
Minimum 2.93113 315.24 360 10
A 3.43407 2.444 48 0.7
A-B 3.43609 1.896 38 2.8
Néel 3.43934 0.902 18 1.1
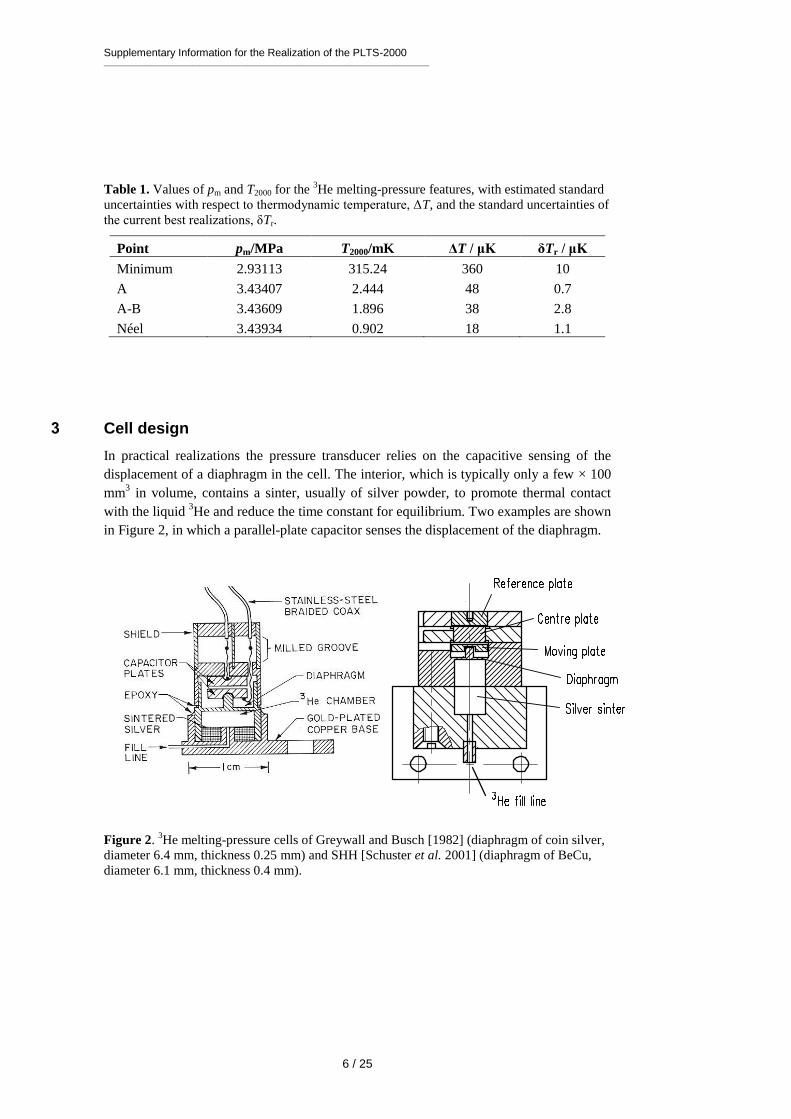
3 Cell design
In practical realizations the pressure transducer relies on the capacitive sensing of the
displacement of a diaphragm in the cell. The interior, which is typically only a few × 100
mm3 in volume, contains a sinter, usually of silver powder, to promote thermal contact
with the liquid 3He and reduce the time constant for equilibrium. Two examples are shown
in Figure 2, in which a parallel-plate capacitor senses the displacement of the diaphragm.
Figure 2. 3He melting-pressure cells of Greywall and Busch [1982] (diaphragm of coin silver,
diameter 6.4 mm, thickness 0.25 mm) and SHH [Schuster et al. 2001] (diaphragm of BeCu,
diameter 6.1 mm, thickness 0.4 mm).
Supplementary Information for the Realization of the PLTS-2000 ________________________________________________________________________________________
7 / 25
The design, construction, methods of measurement, and uses of high-resolution capacitive
pressure gauges in low-temperature applications have been reviewed by Adams [1993].
The most critical design parameters of the transducer are the diameter and thickness of the
diaphragm, which is usually made of coin silver or BeCu, and the parallelism of the
capacitance plates in order to achieve the desired sensitivity, linearity and reproducibility
of the device. Considerable care must be taken to ensure that the capacitance plates are
parallel, and that the gap is small so as to achieve good sensitivity. For example, Greywall
and Busch allowed the epoxy on the lower plate and the top cap to cure while the plates
were in contact and the cell was at 4.4 MPa pressure. When the pressure was relieved,
they estimated that the spacing between the plates was 36 μm. SHH, whose diaphragm
was rather thicker, used 10 μm and 7 μm foils to set the spacings during the curing of the
epoxy on the moving and reference plates, respectively.
An alternative cell uses the distension of the cylinder walls in a co-axial capacitor. This
was first used in measurements with solid 4He [Jarvis et al. 1968], and it has also been
applied to melting-pressure thermometry [Mikheev et al. 1994].
4 Installation and procedure
In operation the cell is bolted to the experimental platform where the temperature is to be
measured. External thermal contact is thus metal-to-metal, ideally gold plated, and within
the cell heat transfer from the cell body to the 3He is mainly between the liquid and the
sinter. The filling and sensing line is generally a copper-nickel capillary of about 0.5 mm
diameter which is soft-soldered to a bush on the cell. It is thermally anchored at several
points in the refrigerator to reduce heat conduction and to permit calculation of the
hydrostatic head correction for absolute pressure calibration (see below). From 4.2 K up to
room temperature the tube may be wider, up to 1 mm diameter, and in a vacuum jacket to
insulate it from the liquid helium and temperature variations during helium fills. It is
advisable to include a second tube to act as an emergency outlet should the first become
blocked with impurity such as solid air. SHH include a filter at 1.5 K to keep the system
free of solid particles, and they describe their method for anchoring the capillary at 1.5 K,
at the still (0.5 K), the base plate (0.06 K), and at the mixing chamber. Finally they
describe how the capillary is connected to the melting-pressure cell.
Since pure 3He is expensive and is only available in small quantities, the sample of
typically 0.5 mol is kept in a small storage cylinder to which it is returned after use. SHH
recommend that the cylinder should be 20 L so that storage is always well below ambient
pressure, to guard against loss. The gas can otherwise be stored at some convenient
elevated pressure.
The cylinder is connected to the gas-handling system through a valve so it can be
removed or replaced. The other essential components of the gas handling are a liquid-
nitrogen-cooled ‘dipstick’ sorption cleaner to remove air and other condensable gases, a 4He-cooled dipstick to absorb the sample and generate the necessary high pressures, low
and high pressure adjustable valves and gauges, as well as connections to the pressure
measuring system and vacuum pumps. Both EDA and SHH give details of their systems,
and that of EDA is illustrated in Figure 3 (see [Adams 2005] for a full description). SHH
describe two versions, one which provides the essential features and another which is
more versatile and allows for external pressure calibration and measurement.

Supplementary Information for the Realization of the PLTS-2000 ________________________________________________________________________________________
8 / 25
Figure 3. The 3He gas-handling system of Adams [2005].
The procedure for condensing the sample in the cell at high pressures is typically as
follows. The gas is passed through a charcoal sorption trap or dipstick at liquid-nitrogen
temperature to ensure that any air or other impurity gases are removed from it. It is then
absorbed in the 4He dipstick at 4.2 K, which is capable of holding the required quantity of
gas and of withstanding the high pressures when it is released into the cell. SHH use a
low-pressure dipstick in both nitrogen and helium to remove impurities, and an additional
high-pressure helium dipstick.
The cell is first evacuated at room temperature using the helium-cooled trap,
allowing sufficient time for gas to migrate along the fine capillaries. The system may also
be flushed with gas to ensure that there are no blockages. The cryostat is then cooled to
4.2 K (SHH), or lower (CFS, EDA), whereupon the cell is ready to receive the gas. This is
admitted by slowly raising the dipstick in the vessel of liquid helium with the valve to one
of the capillaries open, monitoring the pressure on a convenient gauge. It is advisable to
fill to progressively higher pressures in steps of 0.5 MPa (SHH), recharging the dipstick if
necessary and checking the functioning of the pressure transducer at each stage, until the
maximum operating pressure is reached (3.5 MPa for temperatures below 0.8 K, 4 MPa
for measurements up to 1 K).
After condensing the gas at about 1.2 K the transducer should be ‘trained’ and
calibrated. Training consists of cycling the pressure over the intended range of use, so as
to improve its repeatability. SHH recommend 10 cycles for the full range 2.9 MPa to
4 MPa. Subsequently calibration takes place by reading the capacitance bridge at a series
of known pressures. These are generated by a pressure balance (CFS) or they are
measured using a calibrated secondary gauge, such as a quartz oscillator gauge (SHH,

Supplementary Information for the Realization of the PLTS-2000 ________________________________________________________________________________________
9 / 25
EDA). Again it is advisable to check the repeatability of the calibration data in more than
one pressure cycle.
The uncertainty of the reference pressures clearly affects the overall uncertainty
which can be achieved, but another factor is the need to correct for the hydrostatic
pressure head due to the 3He liquid (and vapour) in the capillary: the value of the pressure
head is typically about 650 Pa to 700 Pa (SHH, CFS), and the uncertainties in its
determination are likely to be significant. However, it is possible to reduce the
uncertainties, or avoid the need for external calibration altogether, by using the intrinsic
fixed points of 3He. The various options are discussed later.
The melting-pressure thermometer is now set up and available for use, except that no
solid has yet been formed. This occurs only when the cell is cooled to the melting curve,
whereupon solid preferentially forms in the open volume of the cell, leaving the liquid to
maintain good thermal contact through the silver sinter. The initial condition for the
formation of the solid must be carefully chosen, as there is no single starting point which
allows a complete realization to be achieved; i.e., for liquid and solid to coexist
throughout the range 0.9 mK to 1 K. Thus a sample of 100 % liquid at 1 K and 4 MPa
becomes 100 % solid at 0.55 K. In practice it may take several attempts to achieve the
desired conditions, because the volume and temperature profile of the filling line
influences the pressure at which the melting curve is reached.
Figure 4. Co-existence curves of solid and liquid
3He, expressed as liquid fraction, for four
different initial pressures, SHH (Figure 13). The dotted area shows that about 55 % of the
volume of the SHH cell contains sinter, and hence indicates the temperature ranges over which
this is penetrated by solid 3He.

Supplementary Information for the Realization of the PLTS-2000 ________________________________________________________________________________________
10 / 25
Figure 4, from SHH, shows a family of curves indicating how the range of use varies
with the pressure at which solid is initially formed. For example, a sample initially at
3.7 MPa could in principle be used from 0.88 K to 0.9 mK, but for most of the range solid
would penetrate the sinter, leading to erroneous results, see below. On the other hand, a
sample initially at 3.1 MPa is suitable for observing the minimum, but the range of use is
only 0.56 K to about 0.1 K.
EDA illustrates the requirements for the filling pressure by reference to a plot of the
molar volumes of liquid and solid, Figure 5, the two-phase region being between the two
curves. Once the plug has formed, the sample follows a horizontal path, at constant molar
volume: at any point in the two-phase region, the relative distance from the two curves
indicates the proportion of solid to liquid in the cell. Clearly, too high a starting pressure,
i.e. too low a molar volume, results in too much solid being formed.
Figure 5. Molar volumes of liquid and solid 3He at the melting pressure, with the region of co-
existence lying between the two curves, from Adams [2005]. The horizontal dotted line
indicates the path taken by the sample if the plug is formed at 3.38 MPa.
SHH and EDA both note that a filling pressure of about 3.37 MPa (which generates
solid below 0.73 K) can be used to observe the minimum correctly and also the low
temperature fixed points, but this can only be done if the open volume of the cell is 55 %
or more. In practice they prefer to have more sinter, in order to ensure good contact
between the liquid and the cell, and hence good response at the lowest temperatures. In
this case a lower-pressure filling is needed to observe the minimum, after which the
pressure is reset at the higher value for operation at lower temperatures.
0.0 0.1 0.2 0.3 0.4 0.5 0.6 0.7 0.8 0.9 1.023.5
24.0
24.5
25.0
25.5
26.0
26.5
2.8
3.0
3.2
3.4
3.6
3.8
4.0
vs
vl
Temperature (K)
Supplementary Information for the Realization of the PLTS-2000 ________________________________________________________________________________________
11 / 25
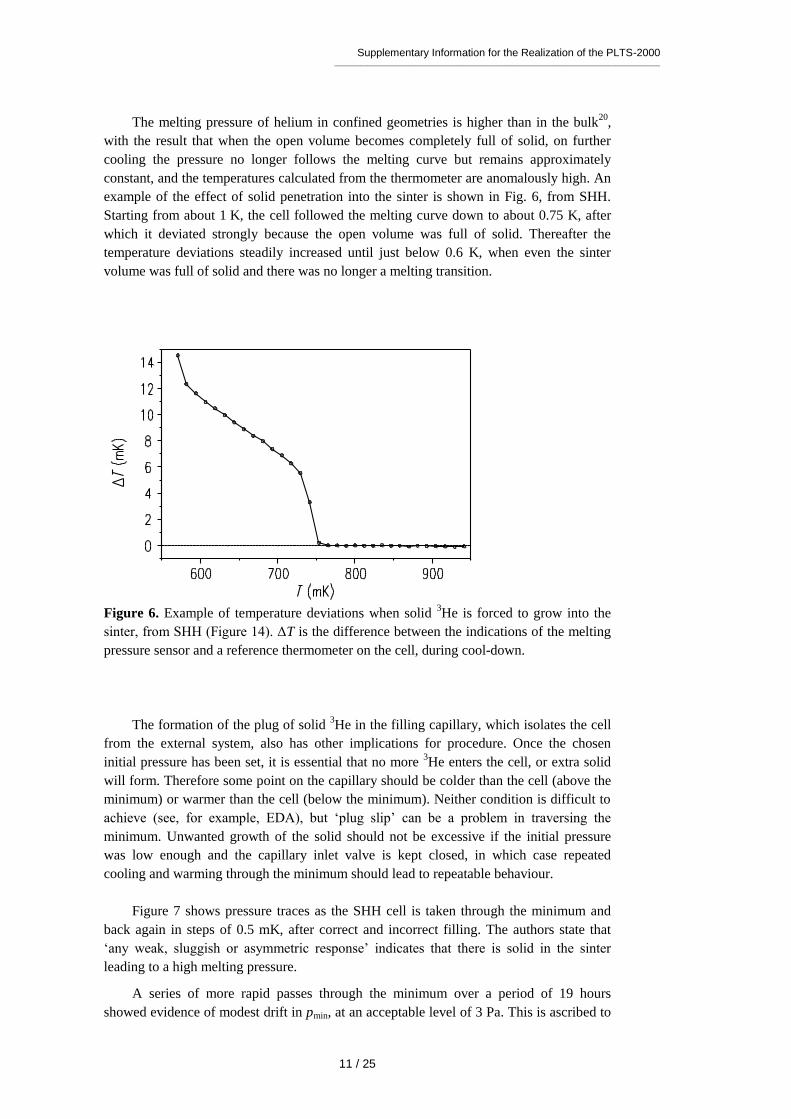
The melting pressure of helium in confined geometries is higher than in the bulk20
,
with the result that when the open volume becomes completely full of solid, on further
cooling the pressure no longer follows the melting curve but remains approximately
constant, and the temperatures calculated from the thermometer are anomalously high. An
example of the effect of solid penetration into the sinter is shown in Fig. 6, from SHH.
Starting from about 1 K, the cell followed the melting curve down to about 0.75 K, after
which it deviated strongly because the open volume was full of solid. Thereafter the
temperature deviations steadily increased until just below 0.6 K, when even the sinter
volume was full of solid and there was no longer a melting transition.
Figure 6. Example of temperature deviations when solid 3He is forced to grow into the
sinter, from SHH (Figure 14). ΔT is the difference between the indications of the melting
pressure sensor and a reference thermometer on the cell, during cool-down.
The formation of the plug of solid 3He in the filling capillary, which isolates the cell
from the external system, also has other implications for procedure. Once the chosen
initial pressure has been set, it is essential that no more 3He enters the cell, or extra solid
will form. Therefore some point on the capillary should be colder than the cell (above the
minimum) or warmer than the cell (below the minimum). Neither condition is difficult to
achieve (see, for example, EDA), but ‘plug slip’ can be a problem in traversing the
minimum. Unwanted growth of the solid should not be excessive if the initial pressure
was low enough and the capillary inlet valve is kept closed, in which case repeated
cooling and warming through the minimum should lead to repeatable behaviour.
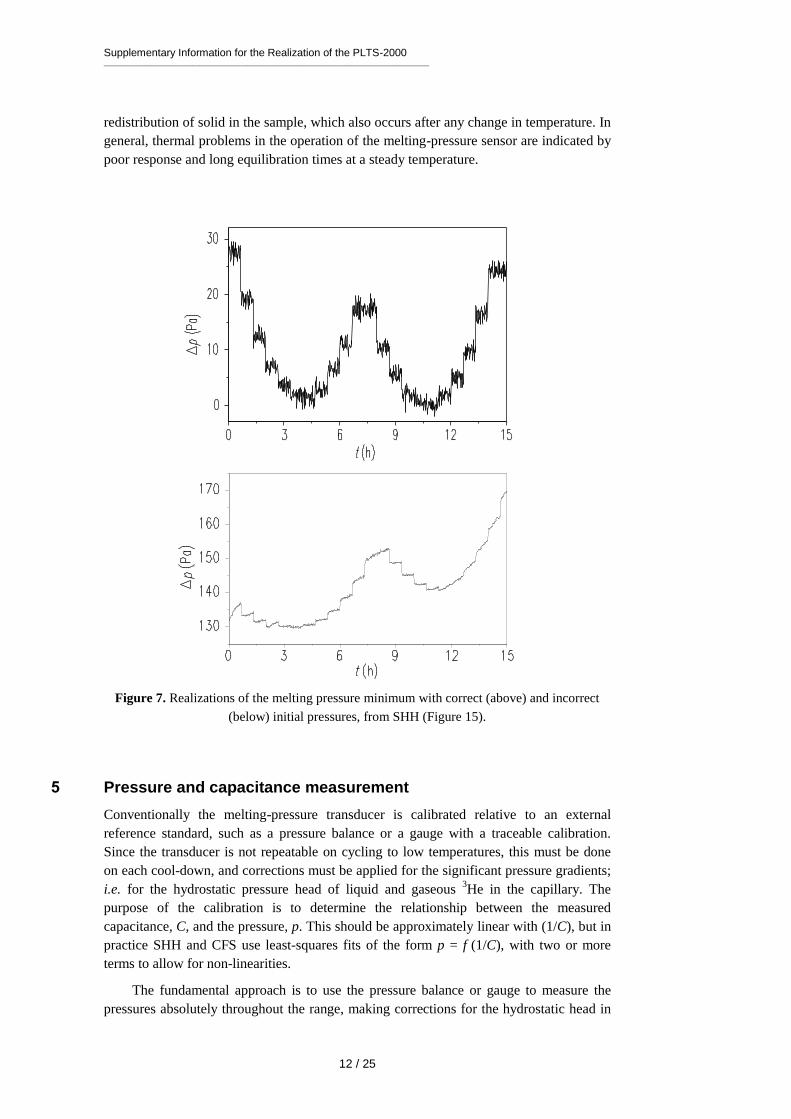
Figure 7 shows pressure traces as the SHH cell is taken through the minimum and
back again in steps of 0.5 mK, after correct and incorrect filling. The authors state that
‘any weak, sluggish or asymmetric response’ indicates that there is solid in the sinter
leading to a high melting pressure.
A series of more rapid passes through the minimum over a period of 19 hours
showed evidence of modest drift in pmin, at an acceptable level of 3 Pa. This is ascribed to
Supplementary Information for the Realization of the PLTS-2000 ________________________________________________________________________________________
12 / 25
redistribution of solid in the sample, which also occurs after any change in temperature. In
general, thermal problems in the operation of the melting-pressure sensor are indicated by
poor response and long equilibration times at a steady temperature.
Figure 7. Realizations of the melting pressure minimum with correct (above) and incorrect
(below) initial pressures, from SHH (Figure 15).
5 Pressure and capacitance measurement
Conventionally the melting-pressure transducer is calibrated relative to an external
reference standard, such as a pressure balance or a gauge with a traceable calibration.
Since the transducer is not repeatable on cycling to low temperatures, this must be done
on each cool-down, and corrections must be applied for the significant pressure gradients;
i.e. for the hydrostatic pressure head of liquid and gaseous 3He in the capillary. The
purpose of the calibration is to determine the relationship between the measured
capacitance, C, and the pressure, p. This should be approximately linear with (1/C), but in
practice SHH and CFS use least-squares fits of the form p = f (1/C), with two or more
terms to allow for non-linearities.
The fundamental approach is to use the pressure balance or gauge to measure the
pressures absolutely throughout the range, making corrections for the hydrostatic head in

Supplementary Information for the Realization of the PLTS-2000 ________________________________________________________________________________________
13 / 25
the capillary. This was done by CFS and SHH, and others, in the experiments which led to
the derivation of the PLTS-2000.
However, for a realization of the PLTS-2000 use is made of the 3He features, as
specified, to simplify the calibration. In particular, normalizing the calibration to the
pressure minimum avoids the need to evaluate the hydrostatic head. If the features at
lower temperatures can also be reached, then the pressure measurement in the range
2.93 MPa to 3.43 MPa is essentially an interpolation, and only non-linearities need be
assessed. The various options are discussed below.
A detailed description of the use of a pressure balance (piston gauge) is beyond the
scope of this document. It suffices to say that the balance is used to generate pressures
according to the ratio of the weight of the loaded piston to its cross-sectional area (the axis
being vertical). The pressures may be constant and repeatable to about 1 part in 106, and
uncertain, with a traceable calibration at the highest level, to about 1 part in 105.
Uncertainties in the weights used should be significantly smaller. The generated pressure
can communicate directly with the sample in the cell, above the minimum, provided that
the 3He is used as the working gas in the balance and the inevitable gradual loss of gas
through the piston-cylinder assembly is accepted. This was the method adopted by CFS.
Otherwise an oil-lubricated pressure balance may be used [Bremer 1992], or a differential
gauge (such as a capacitance diaphragm gauge) can be used to separate the sample and the
balance, but with additional complexities and uncertainties. The calibration process
requires a series of pressures to be generated in the range of interest, by changing the load,
and associating them with the corresponding capacitances of the transducer.
To avoid the possible contamination of the 3He sample, SHH preferred a two-stage
process in which a secondary quartz-oscillator pressure gauge was first calibrated against
a pressure balance, and then used to calibrate the melting-pressure transducer. Pitre et al.
[2003] followed a similar procedure, and EDA also used a calibrated quartz-oscillator
transducer (see below). The pressure must be held steady during the calibration and this
can be done by controlling the temperature of the cell on the melting curve itself, above
the minimum. However, it is usually more convenient to carry out the complete
calibration while the cell is at a steady temperature near 1.2 K, adjusting and regulating
the pressure rather than the temperature.
SHH have used this technique, and describe an additional cryogenic pressure-control
cell which can be connected in the sensing line to act as a small 3He buffer volume. By
varying the temperature of this cell, pressure variations over a range of 50 kPa can be
induced, sufficient for control purposes. With the quartz-oscillator pressure gauge in the
control loop, the residual pressure fluctuations remain below 10 Pa. Ihas and Pobell
[1974] describe a similar system, and EDA suggests observing the output of the quartz
gauge and manually adjusting the external pressure while the readings are taken. Pitre et
al. found that if the flow impedance between the cell and the pressure gauge is small and
the conditions are steady enough, there was no need to actively control the pressure, even
though normal changes occurred along the filling line and at room temperature.
As noted earlier, an ideal transducer would have a linear response to pressure, but in
practice this is only approximately observed. Figure 8 shows the deviations from linearity
which SHH found for five transducers in the range 2.93 MPa to 3.43 MPa (i.e. for the
temperature range up to 0.76 K). In all but one case the maximum effect is equivalent to
less than 0.1 mK, and all were well-fitted by quadratic equations. Bremer [1992] found a

Supplementary Information for the Realization of the PLTS-2000 ________________________________________________________________________________________
14 / 25
similar behaviour, but with a somewhat larger amplitude over this range. Pitre et al., who
used a PTB sensor, preferred a cubic fit but do not state the non-linearity.
Figure 8. Non-linearity of five melting-pressure transducers, from SHH (Figure 21).
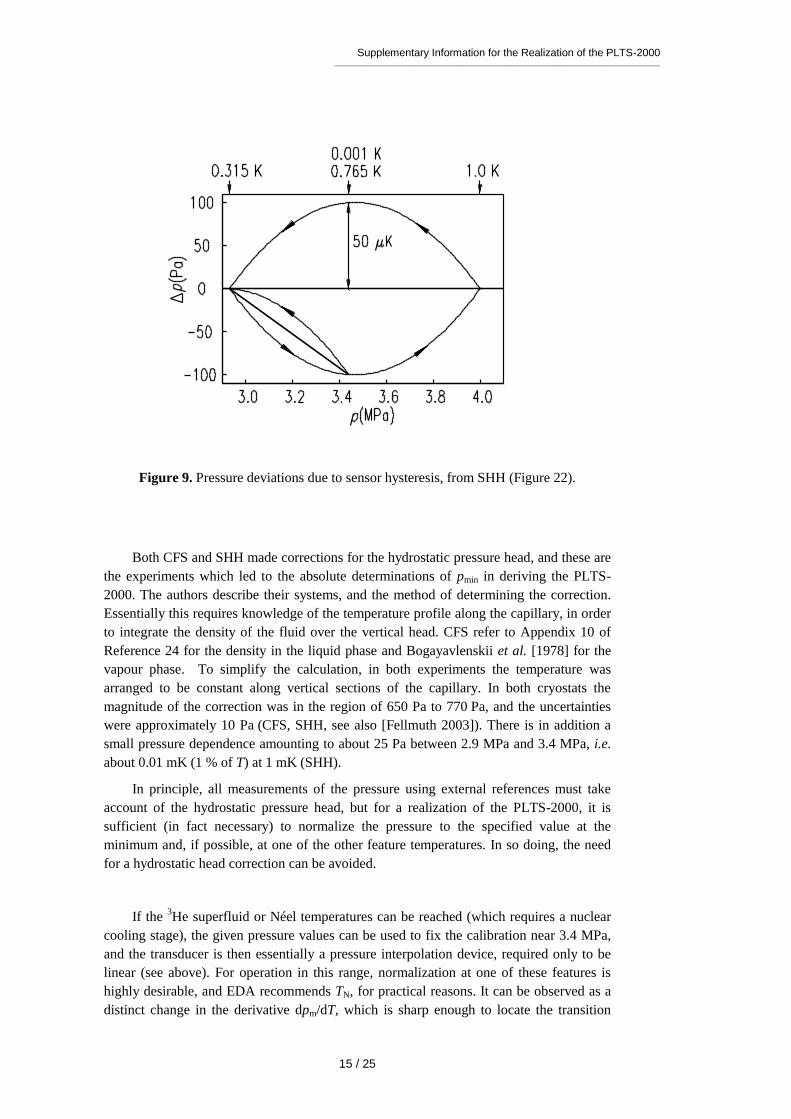
A further effect is hysteresis in the transducer. SHH show this for one of their
sensors, see Figure 9. The effect clearly depends on the pressure range covered, being
± 100 Pa for the full range, 2.93 MPa to 4 MPa, but only about ± 20 Pa for the range up to
3.43 MPa. The latter is hardly significant, but it is desirable to train the transducer in the
range over which it is to be used. If necessary, for the wider range, the effect could be
mitigated by using different calibrations for increasing and decreasing pressures.
SHH note that, in contrast to the calibration itself, the non-linearity and hysteresis of
a transducer are repeatable after cycling to room temperature and back, and therefore that
two points may be sufficient for a recalibration. However, Pitre et al. found a hysteresis in
the first run they report of about 0.16 mK (330 Pa) at 0.78 K, but no hysteresis was
detected in later runs. All new sensors must be fully investigated.
It is also necessary to check that the calibration of the transducer is independent of
temperature. This can be done by cooling the cell at a constant pressure, below pmin, and
observing any changes in output. SHH found that the effect in their transducer was less
than ± 20 Pa.
Supplementary Information for the Realization of the PLTS-2000 ________________________________________________________________________________________
15 / 25
Figure 9. Pressure deviations due to sensor hysteresis, from SHH (Figure 22).
Both CFS and SHH made corrections for the hydrostatic pressure head, and these are
the experiments which led to the absolute determinations of pmin in deriving the PLTS-
2000. The authors describe their systems, and the method of determining the correction.
Essentially this requires knowledge of the temperature profile along the capillary, in order
to integrate the density of the fluid over the vertical head. CFS refer to Appendix 10 of
Reference 24 for the density in the liquid phase and Bogayavlenskii et al. [1978] for the
vapour phase. To simplify the calculation, in both experiments the temperature was
arranged to be constant along vertical sections of the capillary. In both cryostats the
magnitude of the correction was in the region of 650 Pa to 770 Pa, and the uncertainties
were approximately 10 Pa (CFS, SHH, see also [Fellmuth 2003]). There is in addition a
small pressure dependence amounting to about 25 Pa between 2.9 MPa and 3.4 MPa, i.e.
about 0.01 mK (1 % of T) at 1 mK (SHH).
In principle, all measurements of the pressure using external references must take
account of the hydrostatic pressure head, but for a realization of the PLTS-2000, it is
sufficient (in fact necessary) to normalize the pressure to the specified value at the
minimum and, if possible, at one of the other feature temperatures. In so doing, the need
for a hydrostatic head correction can be avoided.
If the 3He superfluid or Néel temperatures can be reached (which requires a nuclear
cooling stage), the given pressure values can be used to fix the calibration near 3.4 MPa,
and the transducer is then essentially a pressure interpolation device, required only to be
linear (see above). For operation in this range, normalization at one of these features is
highly desirable, and EDA recommends TN, for practical reasons. It can be observed as a
distinct change in the derivative dpm/dT, which is sharp enough to locate the transition
Supplementary Information for the Realization of the PLTS-2000 ________________________________________________________________________________________
16 / 25
precisely. A slight difference between the point seen on warming and cooling may limit
the precision to about ± 3 Pa. The A-transition is second-order with a significant step-
increase in heat capacity below TA. It can be detected dynamically as a change in pressure
drift rate as the temperature sweeps through the transition at a constant rate, either
warming or cooling. A compromise has to be made between detectability and the rate of
sweep, but SHH find that a detection uncertainty of this transition can also be ± 3 Pa. By
contrast, the A-B transition is first-order with an undercool such that it can only be
reliably detected on warming, and it is less suitable for use as a fixed point.
If these points are not accessible, a superconductive transition temperature can be
used, for example that of tungsten near 15 mK (where the melting pressure is about 3.38
MPa). Other possibilities are beryllium (23 mK, 3.35 MPa), or iridium (99 mK, 3.13
MPa), though the latter pressure is rather close to the minimum. At higher temperatures
the transitions in cadmium (0.52 K, 3.06 MPa) or, more usefully, zinc (0.85 K, 3.62 MPa)
or molybdenum (0.92 K, 3.79 MPa) can be used, or a calibration can be carried out using
a sensor traceable to the ITS-90 (but see Section 7). Defined transition temperatures have
not been established because of variations between samples, and each sample must
therefore be individually calibrated. Hence this method involves traceability to an external
source.
The capacitance of the transducer is generally measured by ratio to a reference
capacitor which may either be within a bridge, or in an external temperature-stabilized
enclosure (CFS), or in the cryostat (EDA). In the latter case it can be constructed as part
of the cell (SHH), which gives the advantage of similarity of the connections to the
sensing and reference capacitors. An alternative technique is to use resonance detection in
an LC oscillator [Adams 1993, Van Degrift 1975].
The SHH capacitance ranged from 23 pF to 40 pF, with a sensitivity of about
5 pF/MPa, and their three-terminal bridge was operated at 0.5 V and 175 Hz, which gave a
heat load of 0.2 nW. The measurement scatter, integrated over 1 minute, was about
0.3 µK. SHH conducted trials of various voltage and frequency excitations, and
connection options, and selected an arrangement which gave self-heating of less than
0.14 µK at the lowest temperatures. This was then applied throughout the range, to avoid
corrections due to the voltage dependence of the dielectric materials.
CFS balanced the voltage across the capacitor against that of a 100 pF reference
capacitor using a ratio transformer. At 2 Vrms and 1392 Hz excitation the sensitivity was 1
part in 106, and no apparent heating of the melting pressure sensor was detected in their
experiments down to 7 mK. EDA emphasizes the need to use 3-terminal connection to the
cell capacitor because the resolution required is small compared with the capacitance of
the coaxial connecting lines: each plate of the capacitor is connected to a separate coaxial
line, with the third terminal being the ground. If the reference capacitor is mounted on the
cell, the third coax line goes to the common plate.
Further details of the measurement and connection techniques are given in several
references, e.g. [Mikheev et al. 1994, Schuster and Wolber 1986]. Clearly the
performance of the bridge, and the design and pressure sensitivity of the capacitor, both
have a direct bearing on the resolution and accuracy of the measurement. Commercial
bridges are available with high specification, and are likely to be suitable for many
applications. The performance achieved may in practice be limited by the connecting lines
and the use of an internal reference capacitor.

Supplementary Information for the Realization of the PLTS-2000 ________________________________________________________________________________________
17 / 25
6 Uncertainties
The standard uncertainty in the PLTS-2000 in thermodynamic terms was estimated in
[Rusby et al. 2002] to be 0.5 mK down to 0.5 K, decreasing linearly to 0.2 mK at 0.1 K. It
decreases further with falling temperature, but in percentage terms it increases to 0.3 % of
T at 25 mK and about 2 % of T at 0.9 mK.
The components of uncertainty in a realization of the PLTS-2000 are due to the 3He
sample purity, the thermal conditions and the measurement of pressure and capacitance.
Other uncertainties will be associated with measurements of the devices and thermometers
under calibration.
The sample, as supplied, should contain no more than 1 part in 105 of
4He. In that
case, if there is no additional contamination from 4He in the system, the effects on the
melting curve will be very small. Moreover, as Bremer [1992] points out, 4
He is expected
to be preferentially adsorbed on the walls of the cell, or on the sinter, and below 50 mK
the impurity effect should be unobservable as the solubility of 4He in liquid or solid
3He is
less than 1 ppm. On the other hand, investigations of the melting pressure of 3He
contaminated with 2.1 % of 4He [Ganshin et al. 2001] showed that the melting-pressure
minimum was depressed by about 10 kPa and shifted 18 mK to higher temperatures.
There was also a change in the slope of the melting curve above and below the minimum,
and the results obtained on cooling differed appreciably from warming because the
melting pressure in a solution does not coincide with the freezing pressure. The relative
temperature errors are larger at lower temperatures, and were as much as 15 % (~10 mK)
at 60 mK.
At lower concentrations, Schuster et al. [1990] reported no change in the temperature
of the minimum within ± 0.3 mK, for 0.1 % of 4He in
3He, but Bremer estimates, from
considering the entropy of mixing, that for 10 ppm of 4He the melting pressure will
decrease by about 0.03 kPa at 0.4 K (equivalent to about 0.06 mK or 0.015 % of T), and
that the pressure and temperature of the minimum will shift by about –2 kPa and +0.9 mK
for 0.1 % of 4He in
3He. The temperature effect is consistent with the results of Ganshin et
al. [2001], but the pressure effect is larger.
Although 4He impurity in small amounts is expected to be adsorbed at low
temperatures, the impurity effect in the calibration of the transducer at the minimum leads
to measurement uncertainties at lower temperatures. However, calibration of the
transducer at a low-temperature feature pressure, if achievable, will limit this uncertainty.
The thermal contact between the sample and the experimental platform must be
sufficiently good that no significant temperature gradients arise and to ensure that the
thermometer responds fast enough to temperature changes. The use of sintered silver
powder in the cell and metal-to-metal contact with the experimental platform, preferably
gold plated, should ensure that the cell tracks the platform temperature if the measurement
dissipation is not excessive. This can be investigated experimentally.

Supplementary Information for the Realization of the PLTS-2000 ________________________________________________________________________________________
18 / 25
Table 2. Uncertainty budget for the realization of the PLTS-2000 at PTB, with values in mK.
MPS stands for melting-pressure sensor
Temperature / K 0.001 0.015 0.25 0.65 1
Uncertainty
components Type B Source of uncertainty
u (C1) Correction for the nonlinearity of
the MPS 0.001 0.003 0.021 0.006 0.004
u (C2) Mechanical stability of the MPS 0.001 0.004 0.032 0.009 0.006
u (C3) Pressure calibration at the fixed
points 0.001 0.001 0.021 0.010 0.011
u (C4) Calibration against the quartz-
oscillator pressure transducer and
pressure balance 0.001 0.006 0.043 0.014 0.011
u (C5) Instability of pressure control
during calibration 0.001 0.003 0.021 0.006 0.004
u (C6) Change of the head correction by
temperature variation during
calibration 0.001 0.001 0.004 0.001 0.001
u (C7) Heating of the MPS by the
excitation voltage 0.001 0.015 0.015 0.015 0.015
u (C8) Temperature dependence of the
dielectric susceptibility of the
epoxy of the MPS 0.001 0.005 0.042 0.012 0.007
u (C9) Capacitance bridge 0.003 0.003 0.021 0.006 0.004
u (C10) Temperature dependence of the
pressure calibration 0.001 0.005 0.042 0.012 0.011
u (C11) 4He impurities 0.010 0.010 0.010 0.010 0.010
u (T1) Temperature differences between
the experiment platform and the
temperature sensor 0.005 0.005 0.005 0.005 0.005
u (T2) Drift correction 0.005 0.005 0.005 0.005 0.005
u (T3) Temperature differences between
the experiment platform and the
MPS 0.005 0.005 0.005 0.005 0.005
u (T4) Temperature differences in the
experiment platform 0.005 0.005 0.005 0.005 0.005
Type B components 1
to 10 combined 0.005 0.019 0.092 0.032 0.027
Type B components all
combined 0.015 0.023 0.093 0.035 0.030
Type A uncertainty
component 0.005 0.005 0.005 0.005 0.005
Combined standard
uncertainty (k = 1) 0.016 0.024 0.093 0.036 0.031
Expanded uncertainty
(k = 2) 0.031 0.048 0.186 0.071 0.061

Supplementary Information for the Realization of the PLTS-2000 ________________________________________________________________________________________
19 / 25
Many aspects of the pressure measurement have already been covered. With careful
design and a good measuring system, the pressure sensitivity of the transducer can be
about 1 part in 106, and the calibration can give an uncertainty of about ± 50 Pa (SHH,
CFS). To achieve overall uncertainties of this order also requires proper estimation of the
hydrostatic pressure head. The uncertainty of using a secondary gauge depends on the
uncertainty of its calibration and on its stability, and is unlikely to be better than ± 100 Pa.
As was discussed in the previous section, an absolute calibration of the transducer is not
needed if it is normalized against the 3He features, as specified in the PLTS-2000, and
there is also no need to correct for the hydrostatic pressure head effect. Only the linearity,
hysteresis and reproducibility remain, and the resulting pressure uncertainties can be of
the order of ± 10 Pa.
As an example, Table 2 is the complete uncertainty budget for the realization of the
PLTS-2000 over the whole range at PTB [Schuster et al. 1990], with values given at
selected temperatures. It is based on the cell and measurement system described in SHH,
and applies to the case where the transducer is calibrated against a quartz-oscillator
pressure gauge which is traceable to a pressure balance. However, to conform with the
PLTS-2000, the transducer calibration is normalized at the low-temperature features and
at the pressure minimum, to give the required values at these points, and to obviate the
need for absolute accuracy or to correct for the hydrostatic pressure effect, apart from its
small temperature dependence. There are ten Type B components of uncertainty related to
capacitance or pressure measurement, one for 3He purity, and four for thermal effects in
the melting-pressure sensor (MPS) and the experiment platform.
7 Relationship with the ITS-90
In the range 0.65 K to 1 K the PLTS-2000 overlaps the ITS-90 and there is the potential
for non-uniqueness between the two scales; that is, between the equation for 3He vapour
pressures specified in the ITS-90 and that for 3He melting pressures in the PLTS-2000. In
fact it has for some time been suspected that the ITS-90 vapour-pressure equation deviates
from thermodynamic temperature below 1 K [Fogle et al. 1992, Schuster and Hechtfischer
1992, Fellmuth and Schuster 1992]. In this region the PLTS-2000 melting pressure
equation was derived from CMN magnetic thermometry at NIST and PTB, linked to the
ITS-90 in the range above 1.2 K and supported by noise thermometry at both institutes,
and therefore it would not be affected by errors in the ITS-90 at lower temperatures.
Comparisons of 3He vapour pressures and melting pressures have now been
performed at PTB [Engert et al. 2007], and Figure 10 shows that the differences between
the two scales rise from about 0.6 mK at 1 K to 1.5 mK at 0.65 K. The uncertainties,
plotted at k = 1, are those in the comparisons, see Table 5 of Reference 35, and do not
include the thermodynamic uncertainties of the PLTS-2000.
In view of these differences, it is recommended that the melting pressure (PLTS-
2000) should be used for preference, on the grounds both of better thermodynamic
accuracy and the potential for lower uncertainty of realization. Where it is desired to use
vapour pressures, the new more accurate equations of [Engert et al. 2007] are now
available as alternatives to the equation specified in the ITS-90.

Supplementary Information for the Realization of the PLTS-2000 ________________________________________________________________________________________
20 / 25
Figure 10. Differences (T90 – T2000) obtained at PTB from comparisons of 3He vapour
pressures and melting pressures, using rhodium-iron resistance thermometers as
intermediaries [Engert et al. 2007]. Uncertainty bars for the scale comparisons are shown
at k = 1.
Adopted by the CCT in 2011
Editorial update: 29 October 2014
0.0
0.5
1.0
1.5
2.0
0.6 0.7 0.8 0.9 1 1.1
T / K
(T90 -
T2000)
/ m
K

Supplementary Information for the Realization of the PLTS-2000 ________________________________________________________________________________________
21 / 25
8 References
Adams E D 1993 High‐resolution capacitive pressure gauges Rev. Sci. Instrum. 64 601-
611
Adams E D 2005 Progress in Low Temperature Physics Vol. 15, Chapter 4, edited by W
Halperin, Elsevier B. V. See also Temperature, its Measurement and Control in
Science and Industry, 2003 vol. 7 (edited by D C Ripple), AIP Conference
Proceedings, Melville, New York, pp. 107-112
Betts D S 1976 Refrigeration and Thermometry below 1 K, Sussex University Press
Bittner D N and Adams E D 1994 Solidification of helium in confined geometries J. Low
Temp. Phys. 97 519-535
Bogayavlenskii I V, Karnatsevich L V and Konareva V G 1978 Soviet J. Low Temp. Phys.
4(5) 265
Bremer J 1992 Noise Thermometry and the 3He Melting Curve below 1 K, Thesis, Leiden
University
Bremer J and Durieux M 1992 Temperature, its Measurement and Control in Science and
Industry vol. 6 (edited by J. F. Schooley), American Institute of Physics, New York,
pp. 15-20
Colwell J H, Fogle W E and Soulen R J 1992 Temperature, its Measurement and Control
in Science and Industry, vol. 6 (edited by J. F. Schooley), American Institute of
Physics, New York, pp. 101-106
Durieux M and Reesink A L 1999 7th International Symposium on Temperature and
Thermal Measurements in Industry and Science, edited by J. Dubbeldam and M. de
Groot pp. 19-26
Engert J, Fellmuth B and Jousten K 2002 A new 3He vapour-pressure based temperature
scale from 0.65K to 3.2K consistent with the PLTS-2000 Metrologia 44 40-52
Engert J, Fellmuth B and Hoffmann A 2003 2nd
International Symposium on Low
temperature Thermometry, Wrocław, pp. 13-18, and Document CCT/03-09,
www.bipm.org, BIPM
Fellmuth B and Schuster G 1992 Thermodynamic Inconsistency of the ITS-90 Below
1,5 K Metrologia 29 415-423
Fellmuth B, Hechtfischer D and Hoffmann A 2003 Temperature, its Measurement and
Control in Science and Industry, vol. 7 (edited by D C Ripple), AIP Conference
Proceedings, Melville, New York, pp. 71-76
Fogle W E, Soulen R J and Colwell J H 1992 Temperature, its Measurement and Control
in Science and Industry, vol. 6 (edited by J F Schooley), American Institute of Physics,
New York, pp. 85-90
Supplementary Information for the Realization of the PLTS-2000 ________________________________________________________________________________________
22 / 25
Ganshin A N, Grigor’ev V N, Maidanov V A, Penzev A, Rudavskii E, Rybalko A and
Syrnikov E V 2001 On the influence of low 4He impurity content on the melting curve
of 3He Low Temperature Physics (Russia) 27 N6 509-510
Greywall D S and Busch P A 1982 3He-melting-curve thermometry J. Low Temp. Phys.
46 451-465
Hudson R P, Marshak H, Soulen R J and Utton D B 1975 Recent advances in
thermometry below 300 mK J. Low Temp. Phys. 20 1-103
Ihas G G and Pobell F 1974 Correlation length, finite-geometry effects, and universality in
pressurized superfluid helium near Tλ Phys. Rev. A 9 1278-1296
Jarvis J F, Ramm D and Meyer H 1968 Measurement of (𝜕𝑃
𝜕𝑇) 𝑉 and Related Properties in
Solidified Gases. I. Solid He4 Phys. Rev. 170 320-327
Lounasmaa O V 1974 Experimental Principles and Methods below 1 K, Academic Press
Mikheev V A, Masuhara M, Wagner T, Eska G, Mohandas P and Saunders J 1994
Cylindrical pressure gauge Cryogenics 34 167-168.
Pitre L, HermierY and Bonnier G 2003 Temperature, its Measurement and Control in
Science and Industry, vol 7 (edited by D C Ripple), AIP Conference Proceedings,
Melville, New York, pp. 95-100
Pobell F 1996 Matter and Methods at Low Temperatures, Springer Verlag, 2nd Edition.
Richardson R C and Smith E N 1988 Experimental Techniques in Condensed Matter,
Physics at LowTemperatures, Addison-Wesley
Rusby R L, Durieux M, Reesink A L, Hudson R P, Schuster G, Kühne M, Fogle W E,
Soulen R J and Adams E D 2002 The Provisional Low Temperature Scale from 0.9
mK to 1 K, PLTS-2000 J. Low Temp. Physics 126 633-642. See also Temperature, its
Measurement and Control in Science and Industry 2003 vol. 7 (edited by D C Ripple),
AIP Conference Proceedings, Melville, New York, pp. 77-82
Rusby R L, Fellmuth B, Engert J, Fogle W E, Adams E D, Pitre L and Durieux M 2007
Realization of the 3He Melting Pressure Scale, PLTS-2000 J. Low Temp.Physics
149 156-175
Scribner R A and Adams E D 1970 Use of the 3He Melting Curve for Low Temperature
Thermometry Rev. Sci. Instrum. 41 287-288
Schuster G and Wolber L 1986 Automated 3He melting curve thermometer J Phys. E: Sci
Instrum. 19 701-705
Schuster G, Hechtfischer D, Buck W and Hoffmann A 1990 Proceedings of the 19th
International Conference on Low Temperature Physics, Physica B165 & 166 pp. 31-
32
Schuster G and Hechtfischer D 1992 Temperature, its Measurement and Control in
Science and Industry vol. 6 (edited by J F Schooley), American Institute of Physics,
New York, pp. 97-100

Supplementary Information for the Realization of the PLTS-2000 ________________________________________________________________________________________
23 / 25
Schuster G, Hechtfischer D and Fellmuth B 1994 Thermometry below 1 K Rep. Prog.
Phys. 57 187-230
Schuster G, Hoffmann A and Hechtfischer D 2001 Realisation of the temperature scale
PLTS-2000 at PTB, PTB, Braunschweig, PTB-ThEx-21, 29pp, available through
www.ptb.de.
Straty G C and Adams E D 1969 Highly Sensitive Capacitive Pressure Gauge Rev. Sci.
Instrum. 40 1393-1397
Van Degrift C T 1975 Tunnel diode oscillator for 0.001 ppm measurements at low
temperatures Rev. Sci. Instrum. 46 599-607
Wilks J 1967 Liquid and Solid Helium, Clarendon Press, Oxford. See also Sherman R H
and Edeskuty F J 1960 Ann. Phys. 9 522, and Grilly E R and Hammel E F 1961 Prog.
Low Temp. Phys. 3, ed Gorter, North Holland, p. 122
Supplementary Information for the Realization of the PLTS-2000 ________________________________________________________________________________________
24 / 25
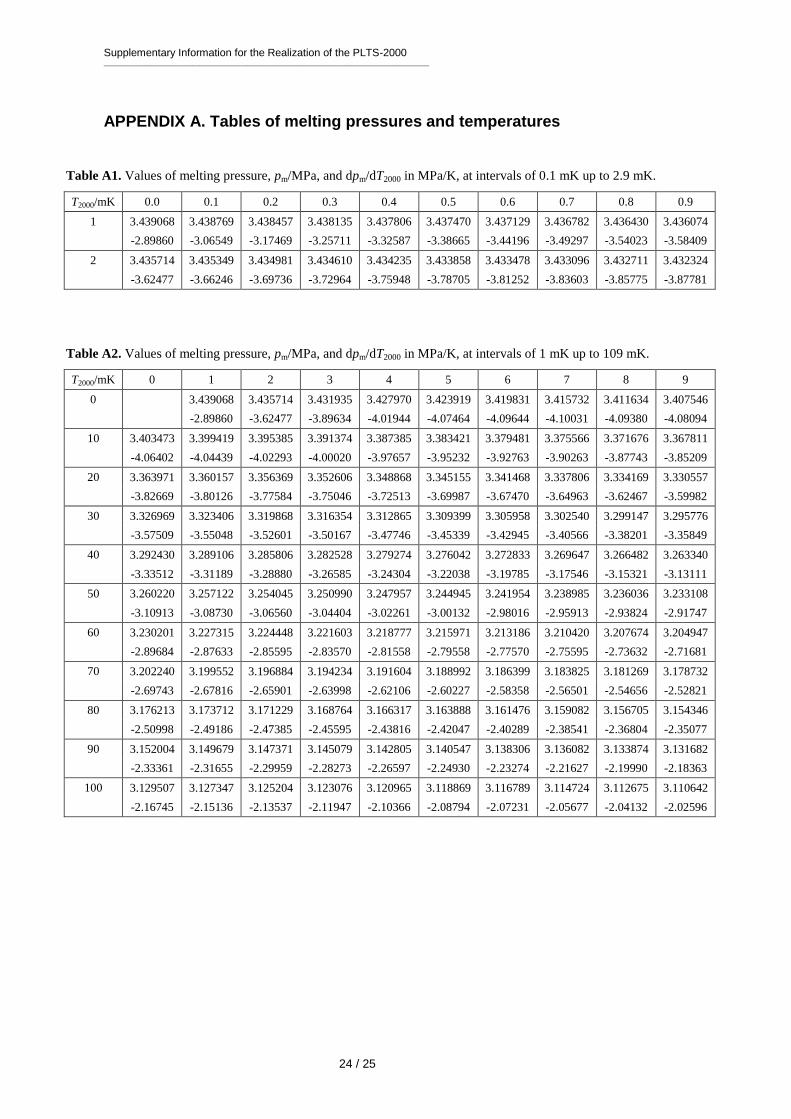
APPENDIX A. Tables of melting pressures and temperatures
Table A1. Values of melting pressure, pm/MPa, and dpm/dT2000 in MPa/K, at intervals of 0.1 mK up to 2.9 mK.
T2000/mK 0.0 0.1 0.2 0.3 0.4 0.5 0.6 0.7 0.8 0.9
1 3.439068 3.438769 3.438457 3.438135 3.437806 3.437470 3.437129 3.436782 3.436430 3.436074
-2.89860 -3.06549 -3.17469 -3.25711 -3.32587 -3.38665 -3.44196 -3.49297 -3.54023 -3.58409
2 3.435714 3.435349 3.434981 3.434610 3.434235 3.433858 3.433478 3.433096 3.432711 3.432324
-3.62477 -3.66246 -3.69736 -3.72964 -3.75948 -3.78705 -3.81252 -3.83603 -3.85775 -3.87781
Table A2. Values of melting pressure, pm/MPa, and dpm/dT2000 in MPa/K, at intervals of 1 mK up to 109 mK.
T2000/mK 0 1 2 3 4 5 6 7 8 9
0 3.439068 3.435714 3.431935 3.427970 3.423919 3.419831 3.415732 3.411634 3.407546
-2.89860 -3.62477 -3.89634 -4.01944 -4.07464 -4.09644 -4.10031 -4.09380 -4.08094
10 3.403473 3.399419 3.395385 3.391374 3.387385 3.383421 3.379481 3.375566 3.371676 3.367811
-4.06402 -4.04439 -4.02293 -4.00020 -3.97657 -3.95232 -3.92763 -3.90263 -3.87743 -3.85209
20 3.363971 3.360157 3.356369 3.352606 3.348868 3.345155 3.341468 3.337806 3.334169 3.330557
-3.82669 -3.80126 -3.77584 -3.75046 -3.72513 -3.69987 -3.67470 -3.64963 -3.62467 -3.59982
30 3.326969 3.323406 3.319868 3.316354 3.312865 3.309399 3.305958 3.302540 3.299147 3.295776
-3.57509 -3.55048 -3.52601 -3.50167 -3.47746 -3.45339 -3.42945 -3.40566 -3.38201 -3.35849
40 3.292430 3.289106 3.285806 3.282528 3.279274 3.276042 3.272833 3.269647 3.266482 3.263340
-3.33512 -3.31189 -3.28880 -3.26585 -3.24304 -3.22038 -3.19785 -3.17546 -3.15321 -3.13111
50 3.260220 3.257122 3.254045 3.250990 3.247957 3.244945 3.241954 3.238985 3.236036 3.233108
-3.10913 -3.08730 -3.06560 -3.04404 -3.02261 -3.00132 -2.98016 -2.95913 -2.93824 -2.91747
60 3.230201 3.227315 3.224448 3.221603 3.218777 3.215971 3.213186 3.210420 3.207674 3.204947
-2.89684 -2.87633 -2.85595 -2.83570 -2.81558 -2.79558 -2.77570 -2.75595 -2.73632 -2.71681
70 3.202240 3.199552 3.196884 3.194234 3.191604 3.188992 3.186399 3.183825 3.181269 3.178732
-2.69743 -2.67816 -2.65901 -2.63998 -2.62106 -2.60227 -2.58358 -2.56501 -2.54656 -2.52821
80 3.176213 3.173712 3.171229 3.168764 3.166317 3.163888 3.161476 3.159082 3.156705 3.154346
-2.50998 -2.49186 -2.47385 -2.45595 -2.43816 -2.42047 -2.40289 -2.38541 -2.36804 -2.35077
90 3.152004 3.149679 3.147371 3.145079 3.142805 3.140547 3.138306 3.136082 3.133874 3.131682
-2.33361 -2.31655 -2.29959 -2.28273 -2.26597 -2.24930 -2.23274 -2.21627 -2.19990 -2.18363
100 3.129507 3.127347 3.125204 3.123076 3.120965 3.118869 3.116789 3.114724 3.112675 3.110642
-2.16745 -2.15136 -2.13537 -2.11947 -2.10366 -2.08794 -2.07231 -2.05677 -2.04132 -2.02596

Supplementary Information for the Realization of the PLTS-2000 ________________________________________________________________________________________
25 / 25
Table A3. Values of melting pressure, pm/MPa, and dpm/dT2000 in MPa/K, at intervals of 10 mK from 0.1 K to 1 K.
T2000/mK 0 1 2 3 4 5 6 7 8 9
100 3.129507 3.108623 3.089264 3.071345 3.054791 3.039530 3.025498 3.012637 3.000890 2.990207
-2.16745 -2.01069 -1.86258 -1.72245 -1.58964 -1.46358 -1.34371 -1.22956 -1.12065 -1.01659
200 2.980543 2.971854 2.964101 2.957247 2.951258 2.946104 2.941756 2.938186 2.935370 2.933285
-0.91698 -0.82149 -0.72979 -0.64159 -0.55663 -0.47467 -0.39549 -0.31889 -0.24468 -0.17271
300 2.931909 2.931222 2.931205 2.931841 2.933114 2.935007 2.937506 2.940597 2.944268 2.948506
-0.10282 -0.03487 0.03126 0.09569 0.15852 0.21985 0.27976 0.33833 0.39564 0.45176
400 2.953300 2.958637 2.964509 2.970904 2.977814 2.985229 2.993140 3.001539 3.010418 3.019770
0.50673 0.56063 0.61351 0.66540 0.71637 0.76644 0.81566 0.86406 0.91168 0.95855
500 3.029587 3.039862 3.050587 3.061758 3.073366 3.085407 3.097874 3.110761 3.124063 3.137774
1.00469 1.05014 1.09492 1.13905 1.18256 1.22546 1.26779 1.30954 1.35075 1.39143
600 3.151890 3.166404 3.181313 3.196611 3.212294 3.228356 3.244794 3.261603 3.278778 3.296316
1.43159 1.47125 1.51042 1.54911 1.58733 1.62509 1.66241 1.69929 1.73574 1.77176
700 3.314212 3.332462 3.351062 3.370008 3.389296 3.408923 3.428883 3.449174 3.469792 3.490733
1.80737 1.84257 1.87737 1.91177 1.94578 1.97940 2.01265 2.04552 2.07802 2.11015
800 3.511994 3.533571 3.555460 3.577658 3.600162 3.622968 3.646073 3.669473 3.693167 3.717149
2.14193 2.17335 2.20442 2.23515 2.26554 2.29560 2.32533 2.35474 2.38383 2.41260
900 3.741418 3.765969 3.790801 3.815909 3.841291 3.866943 3.892863 3.919046 3.945489 3.972189
2.44106 2.46920 2.49704 2.52456 2.55177 2.57865 2.60519 2.63139 2.65723 2.68267
1000 3.999141
2.70770