
Supplementary Fig. S1. Schematic diagram of …...5S rRNA levels served as an internal control. The...
6
3′ 5′ promoter promoter NCR NCR open reading frame 76 101 125 149 173 47 197 221 246 287 (+) (-) 1565 (segment 5) 3′ 5′ promoter promoter NCR NCR open reading frame 172 60 (+) (-) 890 (segment 8) Supplementary Fig. S1. Schematic diagram of minigenome segments. Plasmids expressing short virus-like RNA genome segments were constructed by internal deletions of the non-coding regions and/or the open reading frames of segment 5 and segment 8. Each construct was designed to be approximately 24 nucleotides longer than the previous, representing the number of nucleotides believed to be associated with NP in the RNP structure. Sizes of the vRNAs are shown in nucleotides. Arrows indicate the approximate positions for binding of the primers to negative (above) and positive (below) sense RNAs during primer extension assays (see Supplementary Table S1). NCR = non-coding region.
Transcript of Supplementary Fig. S1. Schematic diagram of …...5S rRNA levels served as an internal control. The...

3′ 5′
promoter promoterNCR NCRopen reading frame
76
101
125
149
173
47
197
221
246
287
(+)
(-)1565 (segment 5)
3′ 5′
promoter promoterNCR NCRopen reading frame
172
60
(+)
(-)890 (segment 8)
Supplementary Fig. S1. Schematic diagram of minigenome segments. Plasmids expressing short virus-like RNA genome segments were constructed by internal deletions of the
non-coding regions and/or the open reading frames of segment 5 and segment 8. Each construct was designed to be approximately 24 nucleotides longer than the previous, representing the number of nucleotides believed to be associated with NP in the RNP structure.
Sizes of the vRNAs are shown in nucleotides. Arrows indicate the approximate positions for binding of the primers to negative (above) and positive (below) sense RNAs during primer
extension assays (see Supplementary Table S1). NCR = non-coding region.

vRNA
mRNA
5S rRNA
pcDNA-Px
pcDNA-NP
0.25 0.5 1
0 0.5 1 20 0.5 1 2 0 0.5 1 2
0
1
Rela
tive R
NA
leve
l (c
f.1µ
g N
P)
pcDNA-NP mRNA
Supplementary Fig. S2. Replication and transcription of short vRNA-like gene segments in vivo is sensitive to the concentration of NP. Primer extension analysis of the accumulation
of vRNA and mRNA following in vivo reconstitution of vRNPs from the 76 nucleotide long vRNA-like template in the presence of varying concentrations of polymerase and NP. The indicated
amount in µg of each of the polymerase subunit-expressing plasmids (pcDNA-Px) and 0.5µg of the plasmid expressing the 76 nucleotide long RNA template were transfected together with the
amount of NP-expressing plasmid (pcDNA-NP) shown in µg (in a total of 6µg). Polymerase was omitted as a negative control. Analysis of the 5S rRNA levels served as an internal control. The level of mRNA derived from the NP-expressing plasmid is also shown. Quantification was
performed by phosphorimage analysis. RNA levels detected in the negative control were set to 0. Graphs depicting the vRNA and mRNA levels accumulating in the presence of varying
concentrations of NP relative to those accumulating in the presence of 1µg NP at the same concentration of polymerase are shown.
αRanBP5
αNP
NP wt
- R41
6A
E339A
G1(
4)
G1(
4)/E
339A
E339A
/R41
6A
G1(
4)/R
416A
-
pcDNA-NP 2 3 1 20 1 2 3 1 2 3 1 3 2 30 1 2 3 1 2 3 1
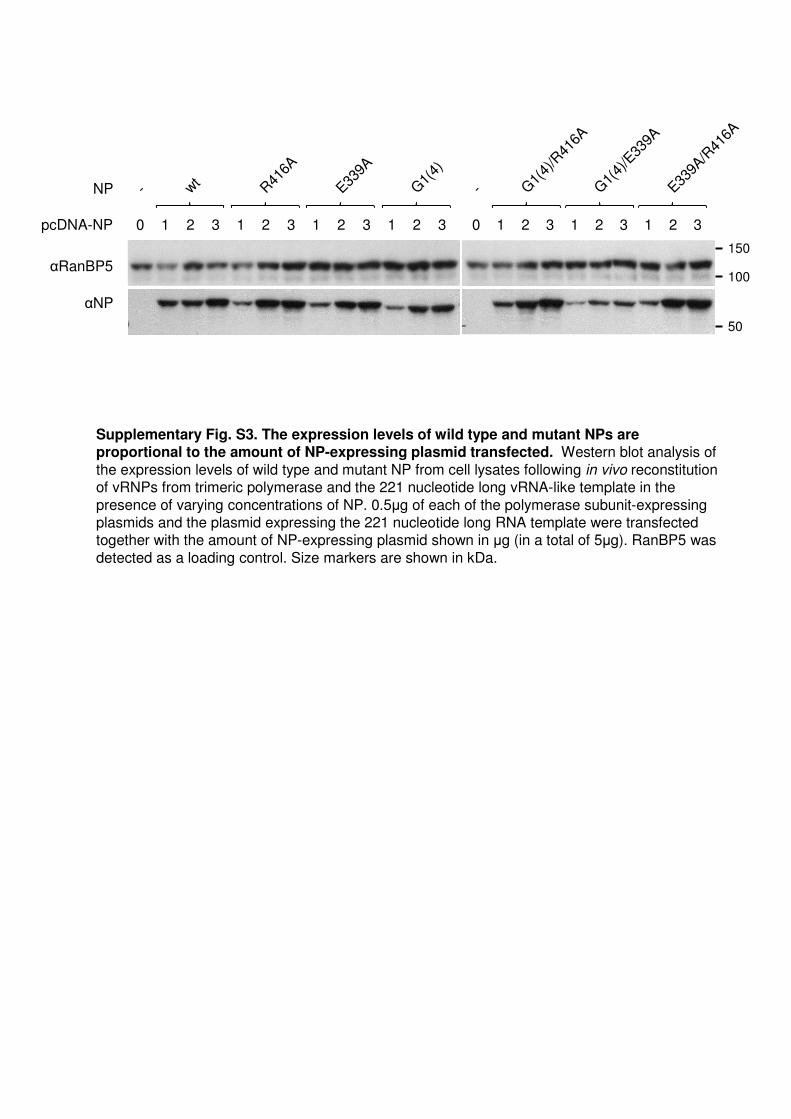
Supplementary Fig. S3. The expression levels of wild type and mutant NPs are proportional to the amount of NP-expressing plasmid transfected. Western blot analysis of
the expression levels of wild type and mutant NP from cell lysates following in vivo reconstitution of vRNPs from trimeric polymerase and the 221 nucleotide long vRNA-like template in the
presence of varying concentrations of NP. 0.5µg of each of the polymerase subunit-expressing plasmids and the plasmid expressing the 221 nucleotide long RNA template were transfected together with the amount of NP-expressing plasmid shown in µg (in a total of 5µg). RanBP5 was
detected as a loading control. Size markers are shown in kDa.
50
100
150

-NP
wild type
R416A
E339A
G1(4)
G1(4)/R416A
G1(4)/E339A
NP DAPI merged
Supplementary Fig. S4. Mutant NPs display similar sub-cellular localisation
patterns to that of wild type NP. Images of cellular distribution of wild type and mutant NPs in transfected Vero cells. Nuclei were stained with DAPI. Scale bar = 20µm.

NP R416A
Rela
tive R
NA
leve
l (c
f.w
t N
P)
0 .25 .5 1 2 3 4 5
wt NP
0 .25 .5 1 2 3 4 5
vRNA
mRNA
5S rRNA
pcDNA-NP
pcDNA-NP mRNA
αNP
α β-actin
Supplementary Fig. S5. Oligomerisation mutant NP is less efficient than wild type NP at
supporting replication and transcription of intermediate length vRNA-like gene segments in vivo. Primer extension analysis of the accumulation of vRNA and mRNA following in vivo
reconstitution of vRNPs from trimeric polymerase and the 221 nucleotide long vRNA-like template in the presence of varying concentrations of wild type or mutant (R416A) NP. 0.5µg of each of the polymerase subunit-expressing plasmids and the plasmid expressing the 221
nucleotide long RNA template were transfected together with the amount of NP-expressing plasmid shown in µg (in a total of 5µg). NP was omitted in the negative control. Analysis of the
5S rRNA levels served as an internal control. The levels of mRNA derived from the NP-expressing plasmid are also shown, as are the NP expression levels with β-actin detected as a
loading control. Size markers are shown in kDa. Quantification of RNA was performed by phosphorimage analysis. RNA levels detected in the negative control were set to 0. A graph depicting the vRNA and mRNA levels accumulating in the presence of varying concentrations of
mutant NP relative to those accumulating in the presence of the same concentration of wild type NP is shown.
50
37
50

Supplementary Table S1: Details of template-specific primers used for detecting different RNA species in primer extension following in vivo RNP reconstitution.
1based on 5′ to 3′ numbering of the template sequence in the positive sense.2mRNA transcribed from pcDNA-NP is detected by primers 76+ and 149+ to yield reverse transcripts of 117 and
145 nucleotides, respectively.
Template length
(nucleotides)
Primer (length in
nucleotides)
Primer binding
site1Viral RNA species2
Reverse transcript
length (nucleotides)
1565 (segment 5)
149- (21) 1505 - 1525 vRNA 61
149+ (21) 74 - 54mRNA 84-87
cRNA 74
47
47- (24) 6 - 29 vRNA 42
47+ (23) 24 - 2mRNA 34-37
cRNA 24
76
76- (24) 8 - 31 vRNA 69
76+ (23) 46 - 24mRNA 56-59
cRNA 46
101
76- (24) 8 - 31 vRNA 94
76+ (23) 46 - 24mRNA 56-59
cRNA 46
125
125- (23) 59 - 81 vRNA 67
76+ (23) 46 - 24mRNA 56-59
cRNA 46
149
149- (21) 89 - 109 vRNA 61
149+ (21) 74 - 54mRNA 84-87
cRNA 74
173
149- (21) 113 - 133 vRNA 61
149+ (21) 74 - 54mRNA 84-87
cRNA 74
197
149- (21) 137 - 157 vRNA 61
149+ (21) 74 - 54mRNA 84-87
cRNA 74
221
149- (21) 161 - 181 vRNA 61
149+ (21) 74 - 54mRNA 84-87
cRNA 74
246
149- (21) 186 - 206 vRNA 61
149+ (21) 74 - 54mRNA 84-87
cRNA 74
287
149- (21) 227 - 247 vRNA 61
149+ (21) 74 - 54mRNA 84-87
cRNA 74
890 (segment 8)
172- (20) 816 - 835 vRNA 75
172+ (20) 51 - 32mRNA 61-64
cRNA 51
60
60- (20) 8 - 27 vRNA 53
60+ (19) 21 - 3mRNA 31-34
cRNA 21
172
172- (20) 98 - 117 vRNA 75
172+ (20) 51 - 32mRNA 61-64
cRNA 51


![static-curis.ku.dk · [Pasteurella ] haemolytica or [ P.] anatis by DNA-DNA hybridization, 16S rRNA and 16S-23S ITS sequencing, AFLP, PFGE, plasmid profiling and phenotypic characterization.](https://static.fdocuments.us/doc/165x107/5ceed30088c99330508cabea/static-curiskudk-pasteurella-haemolytica-or-p-anatis-by-dna-dna-hybridization.jpg)


