Supplementary Fig. 1. Sequence alignment between 14-3-3s from diverse species

Supplementary Fig. 1|Primary sequence of dPPR protein. The variable PPR code amino
acids of repeats 5 and 6 are shaded in yellow and the corresponding nucleotides of RNA are
coloured red. The other residues at positions 2 and 13 that also contribute to RNA binding are
lilac and orange, respectively. The corresponding RNA sequence recognized by the repeats is
listed on the right, 5′ to 3′ from top to bottom.

Supplementary Fig. 2|Specific RNA target binding of dPPR-U10, dPPR-U8C2, dPPR-U8A2,
and dPPR-U8G2. EMSA demonstrates the specific binding of dPPR-U10, dPPR-U8C2,
dPPR-U8A2, and dPPR-U8G2 with variant RNA oligonucleotides. The final concentrations of
dPPR in lanes 1-10 are 0, 0.8, 1.6, 3.2, 6.25, 12.5, 25, 50, 100, and 200 nM, respectively. The
detailed Kd values are shown in Supplementary Table 1.

Supplementary Fig. 3|Specific RNA target binding of dPPR-4. (a) Schematic view of
dPPR-4 and its target RNA sequence. (b) and (c) EMSA demonstrates the specific binding of
dPPR-4 with variant RNA oligonucleotides. The final concentrations of dPPR-4 in lanes 1-10
are 0, 0.8, 1.6, 3.2, 6.25, 12.5, 25, 50, 100, and 200 nM, respectively. Nucleotides that differ
from the ones in the original target RNA are labelled in red. The detailed Kd values are shown
in Supplementary Table 1.

Supplementary Fig. 4|Four RNA-bound dPPRs exhibit highly similar conformations. (a)
Complexes dPPR-U10, dPPR-U8C2, dPPR-U8A2, and dPPR-U8G2 are coloured green, light
blue, gold and cyan, respectively. (b) Superposition of the four dPPR structures shows the
small differences existing between our dPPR molecules: dPPR-U8C2 is superimposed on
dPPR-U10, dPPR-U8A2 and dPPR-U8G2, and the root mean square deviation (RMSD) values
are 0.73 Å, 0.99 Å and 1.00 Å over 348, 367 and 374 C atoms, respectively. Two
perpendicular views are presented, with the ssRNA molecule shown in sticks. All structure
figures were prepared with PyMOL1. (c) Representative portion of the 2Fo-Fc electron
density map for RNA-dPPR-U8C2, contoured at 1.0 and displayed in stereo.
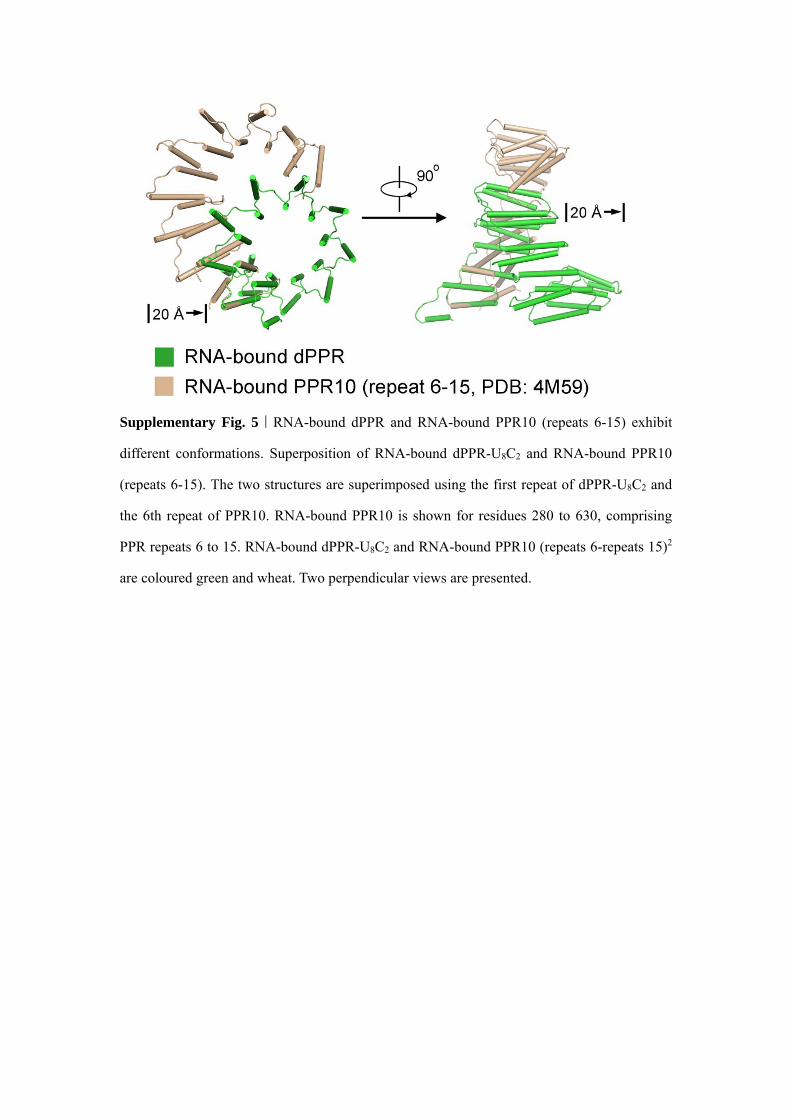
Supplementary Fig. 5|RNA-bound dPPR and RNA-bound PPR10 (repeats 6-15) exhibit
different conformations. Superposition of RNA-bound dPPR-U8C2 and RNA-bound PPR10
(repeats 6-15). The two structures are superimposed using the first repeat of dPPR-U8C2 and
the 6th repeat of PPR10. RNA-bound PPR10 is shown for residues 280 to 630, comprising
PPR repeats 6 to 15. RNA-bound dPPR-U8C2 and RNA-bound PPR10 (repeats 6-repeats 15)2
are coloured green and wheat. Two perpendicular views are presented.
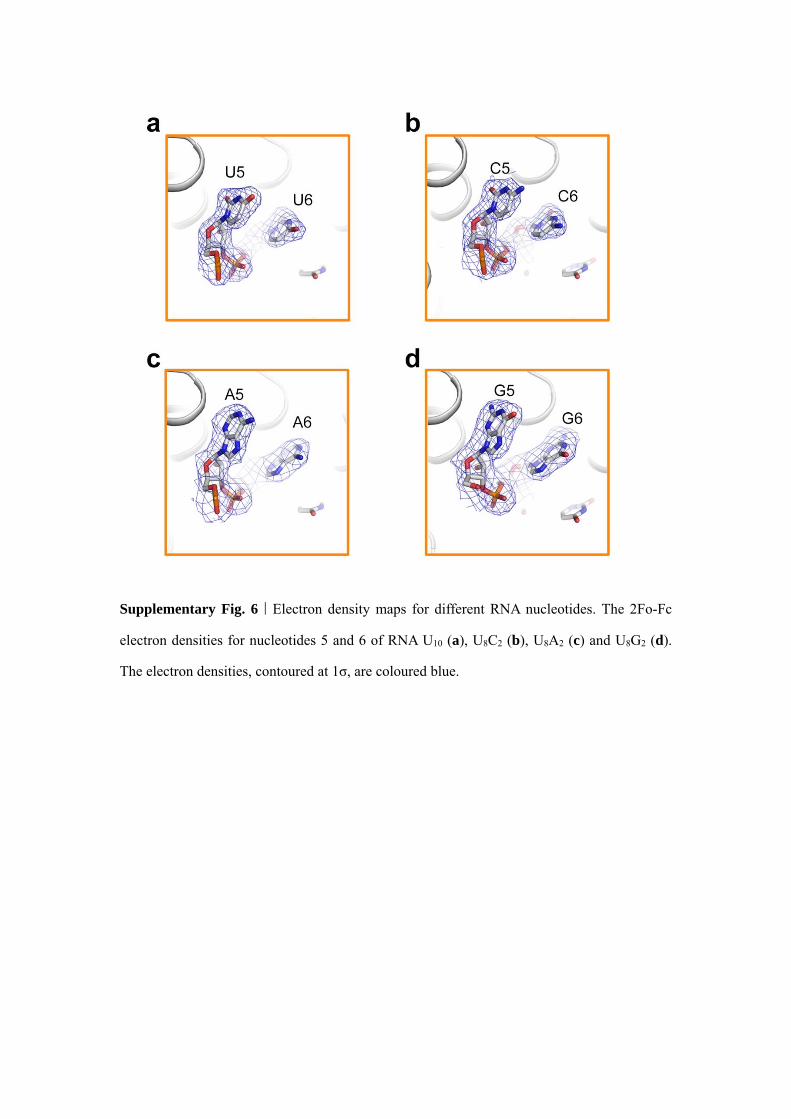
Supplementary Fig. 6|Electron density maps for different RNA nucleotides. The 2Fo-Fc
electron densities for nucleotides 5 and 6 of RNA U10 (a), U8C2 (b), U8A2 (c) and U8G2 (d).
The electron densities, contoured at 1σ, are coloured blue.

Supplementary Fig. 7 | Interaction patterns between Val2 in each repeat and its
corresponding nucleobase. (a) Overview of interaction patterns in RNA-bound dPPR-U8C2.
Two perpendicular views are presented, with the ssRNA molecule shown as a cartoon. (b)
Zoom-in view of the Val2-base interaction. The RNA molecule is coloured green. Helix a and
helix b are coloured wheat and grey, respectively. Val2 in each repeat is shown in magenta.
The NTD helix and CTD helix are coloured purple and mint, respectively.
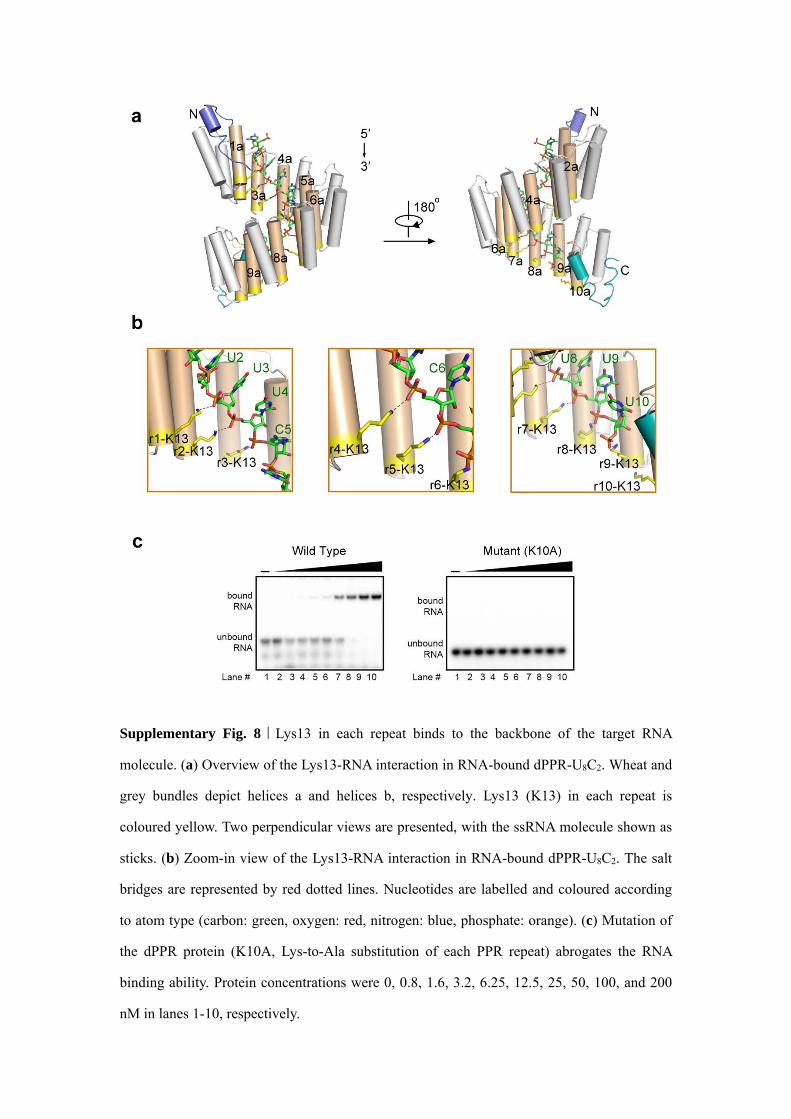
Supplementary Fig. 8|Lys13 in each repeat binds to the backbone of the target RNA
molecule. (a) Overview of the Lys13-RNA interaction in RNA-bound dPPR-U8C2. Wheat and
grey bundles depict helices a and helices b, respectively. Lys13 (K13) in each repeat is
coloured yellow. Two perpendicular views are presented, with the ssRNA molecule shown as
sticks. (b) Zoom-in view of the Lys13-RNA interaction in RNA-bound dPPR-U8C2. The salt
bridges are represented by red dotted lines. Nucleotides are labelled and coloured according
to atom type (carbon: green, oxygen: red, nitrogen: blue, phosphate: orange). (c) Mutation of
the dPPR protein (K10A, Lys-to-Ala substitution of each PPR repeat) abrogates the RNA
binding ability. Protein concentrations were 0, 0.8, 1.6, 3.2, 6.25, 12.5, 25, 50, 100, and 200
nM in lanes 1-10, respectively.

Supplementary Fig. 9|The SDS-PAGE gel of purified dPPR proteins used in this study.

Supplementary Table 1|Apparent Kd values of dPPR-RNA complexes. The apparent Kd
values were calculated using Quantity One V4.6 according to the results shown in Figure 5c,
Supplementary Figure 2 and Supplementary Figure 3b.
Supplementary References
1. DeLano WL. The PyMOL molecular graphics system. (2002).
2. Yin P, et al. Structural basis for the modular recognition of single-stranded RNA by
PPR proteins. Nature 504, 168-171 (2013).
Designed PPRs Target RNA sequences Dissociation constants (nM)
dPPR‐U10 5′‐UUUUUUUUUU‐3′ 74.3 ± 7.9
dPPR‐U8C2 5′‐UUUUCCUUUU‐3′ 18.5 ± 0.6
dPPR‐U8A2 5′‐UUUUAAUUUU‐3′ 23.8 ± 0.4
dPPR‐U8G2 5′‐UUUUGGUUUU‐3′ 29.8 ± 1.1
dPPR‐NN 5′‐UUUUUUUUUU‐3′ 15.9 ± 1.0
dPPR‐NN 5′‐UUUUCCUUUU‐3′ 14.6 ± 0.7
dPPR‐TN 5′‐UUUUAAUUUU‐3′ 58.9 ± 1.1
dPPR‐SD 5′‐UUUUGGUUUU‐3′ 31.1 ± 1.3
dPPR‐4 5′‐UUCCAGAU‐3′ 24.6 ± 1.6
![Supplementary Fig. 1. Plasmids luciferase …...Supplementary Fig. 4. Study flowchart. Study flowchart providing a framework of cases [samples] inclusion from patients series (Initial](https://static.fdocuments.us/doc/165x107/5e30bee5761fd5400c33deb9/supplementary-fig-1-plasmids-luciferase-supplementary-fig-4-study-flowchart.jpg)