Supplementary Fig. 1. p38 alternative activation, IL-21 ... fileSupplementary Fig. 1. p38...
12
Supplementary Fig. 1. p38 alternative activation, IL-21 expression, and T helper cell transcription factors in PDAC tissue. (a) Tissue microarrays of pancreatic tissue from 192 patients with pancreatic ductal adenocarcinoma were stained for CD3, p38 pY323, and TNFα in serial sections. A representative slide is shown, and arrowheads indicate positive cells. (b) The average percentage of CD3 + CD4 + IL21 + cells in patient samples with <10% (n=10) versus ≥10% (n=10) numbers of TIL with alternatively activated p38 (* P < 0.05, nonparametric Mann-Whitney test). (c) Quantitative RT-PCR for the expression of Foxp3, Gata3, and Tbet in in patient samples with <10% versus ≥10% TIL with alternatively activated p38 (n=16 patients per group). (d) Quantitative RT-PCR for the expression of SHH, α-SMA, Vimentin, Desmin, Ck19, Leptin, Ccl20, and Snail in patient samples with <10% (black bar) versus ≥10% (white bar) TIL with alternatively activated p38 (n=16 patients per group). NS=not significant, nonparametric Mann-Whitney test. Results are shown as average ± SEM. Nature Medicine doi:10.1038/nm.3957
Transcript of Supplementary Fig. 1. p38 alternative activation, IL-21 ... fileSupplementary Fig. 1. p38...
Supplementary Fig. 1. p38 alternative activation, IL-21 expression, and T helper cell transcription factors in PDAC tissue. (a) Tissue microarrays of pancreatic tissue from 192 patients with pancreatic ductal adenocarcinoma were stained for CD3, p38 pY323, and TNFα in serial sections. A representative slide is shown, and arrowheads indicate positive cells.(b) The average percentage of CD3+CD4+IL21+ cells in patient samples with <10% (n=10) versus ≥10% (n=10) numbers of TIL with alternatively activated p38 (* P < 0.05, nonparametric Mann-Whitney test). (c) Quantitative RT-PCR for the expression of Foxp3, Gata3, and Tbet in in patient samples with <10% versus ≥10% TIL with alternatively activated p38 (n=16 patients per group). (d) Quantitative RT-PCR for the expression of SHH, α-SMA, Vimentin, Desmin, Ck19, Leptin, Ccl20, and Snail in patient samples with <10% (black bar) versus ≥10% (white bar) TIL with alternatively activated p38 (n=16 patients per group). NS=not significant, nonparametric Mann-Whitney test. Results are shown as average ± SEM.
Nature Medicine doi:10.1038/nm.3957

Supplementary Fig. 2. T cell secreted cytokines controlled by the p38 alternative pathway enhances pancreatic tumor growth. (a, b, c) Panc02 cells were injected into WT and DKI mice and tumors harvested at day 28. (a) TIL subpopulations tumor were analyzed (n=5 mice per group). (b) Activation markers CD44 and CD69 of CD4+ TIL are shown (n=4 mice per group). (c) Expression of Irf4 mRNA in CD4+ TIL was determined as percent of WT by quantitative real-time PCR. (d) TNFα and IFNγ production by infiltrating CD8+ T cells was determined at day 28 after Panc02 cell injection. The bar graphs indicate the average percentages ± SEM (n=6 mice per group; NS = not significant, nonparametric Mann-Whitney test). (e) TNFα secretion of different cell populations in tumor-infiltrating cells was analyzed at day 28 after injection of Panc02 cells. The bar graphs indicate the averages ± SEM (n=5 (11R) Scr and n=4 (11R) 71-85; NS= not significant, nonparametric Mann-Whitney test). (f) CD4+ Panc02 TIL harvested at 28 days from WT and DKI mice were stimulated with anti-CD3/CD28 or PMA and ionomycin for 4 hr in the presence of monensin and analyzed for intracellular TNFα expression. The bar graphs represent the average ± SEM of 10 mice per group (*P < 0.05, NS=not significant, nonparametric Mann-Whitney test).
Nature Medicine doi:10.1038/nm.3957

Supplementary Fig. 3. Equal CD4+ T cell engraftment between WT and TNFα-/- mice and similar pancreatic tumor growth in mice with WT or DKI CD8+ T cells. (a) CD4+ T cells were purified from spleens and lymph nodes of WT or TNFα-/- mice and adoptively transferred into TCRα-/- mice. Successful CD4+ T cell engraftment in the spleen was determined on the day of harvest. The bar graph represent the average percentage of CD4+ T cells ± SEM (n=3 mice per group). (b) Purified CD8+ T cells from WT or DKI mice were adoptively transferred into TCRα-/- mice. Ten days later, Panc02 cells were injected and tumor volume followed over time and weight, expressed as percent of WT, determined at 24 days (n=3 mice per group; one sample t-test). Results are shown as average ± SEM. (c) Areas of healthy pancreatic tissue of KPC mice were stained by immunohistochemistry for CD3 and pY323 p38 to detect T cells with p38 activated by the alternative pathway (d) A T-cell-rich area in a KPC PDAC sample stained with only secondary antibody.
Nature Medicine doi:10.1038/nm.3957

Supplementary Fig. 4. (11R) 71-85 was not toxic for primary cells. Purified splenic T cells were treated or not with (11R) 71-85 or (11R) Scr for 2 h, washed, and cultured for the indicated times at which apoptosis was measured with Annexin V.
Nature Medicine doi:10.1038/nm.3957

Supplementary Fig. 5. Affect of (11R) 71-85 on CTL and Th1 function. (a) Splenocytes from 8-day LCMV infected WT mice (n=3) were treated with medium alone, (11R) Scr, (11R) 71-85, or cyclosporin A (CsA) and stimulated with gp33 or gp276. Cells were analyzed for CD107a and IFNγ expression by flow-cytometry. The data from individual mice and the average ± SEM are shown on the right. (b) Naïve CD4+ T cells were skewed towards Th1 in vitro, treated as in a, and then stimulated with anti-CD3/CD28 or PMA/ionomycin. IFNγ secretion were measured by ELISA. Results are shown as average ± SEM of two independent experiments.
Nature Medicine doi:10.1038/nm.3957

Supplementary Fig. 6. (11R) 71-85 impaired CD4+ T cell functions without affecting tumor cells. (a) Panc02 cells were injected into WT of DKI mice and allowed to grow to an estimated volume of 300 mm3. Intratumor injections were performed 3 times a week with (11R) Scr or (11R) 71-85 for 11 days and tumor volume was monitored (n=3 mice per group). (b) B6 mice were inoculated with Panc02 cells and treated as in a. Tumor infiltrating CD4+ T cells from (11R) 71-85 or (11R) Scr treated mice were analyzed 24 hr after the final injection for intracellular expression of TNFα and IFNγ (histograms). Bar graphs on the right show the average percentage of cytokine-secreting cells (n=5 mice per group; *P < 0.05, NS=not significant, nonparametric Mann-Whitney test). (c) Cell viability of Panc02 cells was determined by MTT-assay after incubation with H20, (11R) Scr, or (11R) 71-85 in a time and dose dependent manner. Data are representative of 4 independent experiments performed in triplicate (Wilcoxon-signed Rank test, hypothetical value of control 100%). (d) Panc02 cells were injected in B6 mice and allowed to grow to an estimated volume of 300 mm3. The mice were treated 3 times a week with H20, (11R) Scr, or (11R) 71-85 for 2 weeks, and paraffin tissue sections were evaluated for apoptosis using an enzymatic TUNEL assay (n=3, NS=not significant, nonparametric Mann-Whitney test). (e) B6 mice were injected with Panc02 cells as in a and the presence of necrosis was determined by examination of H&E sections ((11R) Scr, n=4, and (11R) 71-85, n=8).
Nature Medicine doi:10.1038/nm.3957

Results from a-e are shown as the average ± SEM. (f) Wild type B6 mice were intravenously injected 3 times a week with (11R) Scr, (11R) 71-85 or left uninjected for 3.5 weeks. Twenty-four hours after last injection serum samples were collected and measured for the amount of different enzymes (n=4 mice per group). (g) KPC mice were treated with either (11R) Scr or (11R) 71-85 for 3.5 weeks starting at the age of 9 weeks. Twenty-four hours after the final injection infiltrating CD4+ T cells from mice treated with (11R) 71-85 or (11R) Scr were analyzed for intracellular cytokines (TNFα and IL-10 are shown as an example). (h) KPC mice were treated as in g and 24 hr after the final injection, Rorc (n=3) and Irf4 (n=5) mRNA expression was determined in CD4+ TIL by quantitative real-time PCR. For Rorc, the results are from a pool of 3 mice in each group with qPCR performed in triplicate. For Irf4, three mice were pooled per group, and two groups of (11R) Scr-treated mice and one group of (11R) 71-85 treated mice were analyzed. Expression of Rorc and Irf4 mRNA in (11R) 71-85-treated CD4+ TIL was determined as a percent of (11R) Scr-treated cells by quantitative real-time PCR. The data are an average of the replicate samples ± SEM (*p<0.05, unpaired two-tailed Student’s t-test). (i) KPC mice were treated as in g and 24 hr after the final injection infiltrating CD4+ T cells from mice treated with (11R) 71-85 or (11R) Scr were analyzed for intracellular TNFα, Gata3, and RORγt (n=4 mice per group).
Nature Medicine doi:10.1038/nm.3957
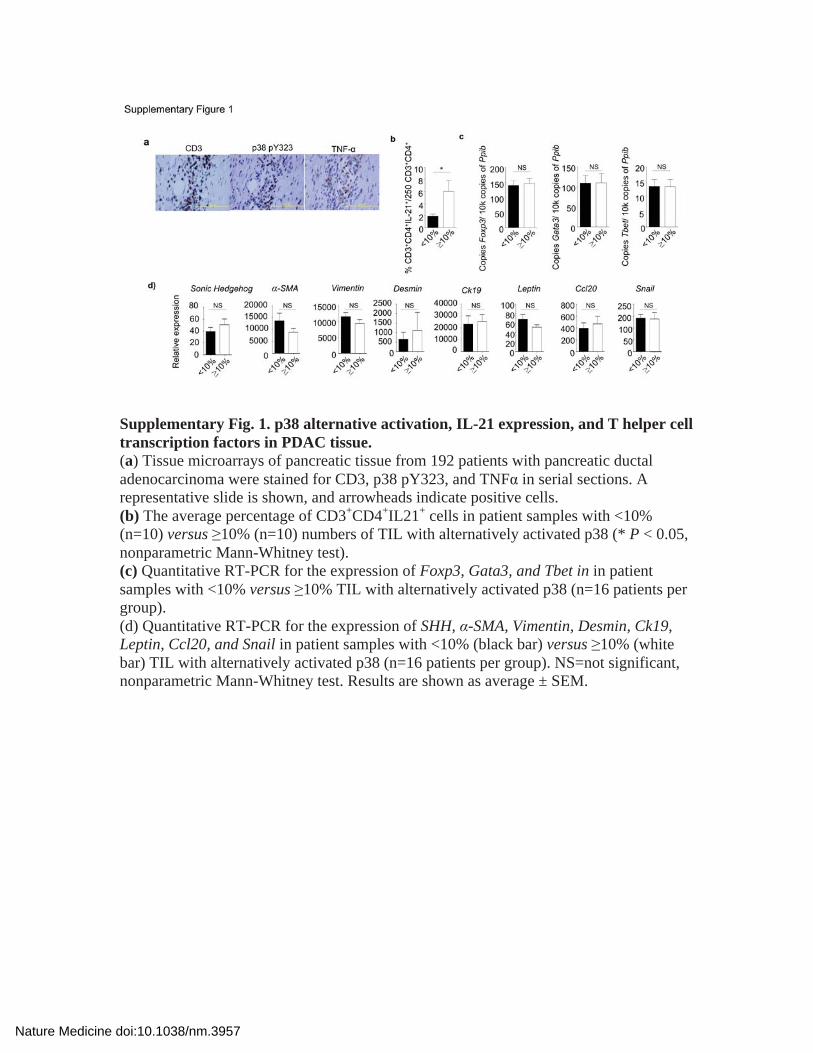
Supplementary Fig. 7. (11R) 71-85 impaired CD4+ T cell inflammatory cytokines and increased CD8+/CD4+ ratio in KPC tumors. (a) Gating strategy for flow cytometric analysis. (a and b) KPC mice were screened by palpation for the presence of pancreatic masses, and mice with tumors of < 150 mm3 as confirmed by ultrasound were used. The animals were treated with either (11R) 71-85 or (11R) Scr i.v. every other day 3 times and analyzed (n=5 mice per group except for CD8+ IFNγ, where n=3 in the (11R) 71-85 group). * P < 0.05, nonparametric Mann-Whitney test. (c) KPC mice were treated as in b and the percentages of CD4+ and CD8+ T cells were calculated. Each symbol represents an individual animal. * P < 0.05, nonparametric Mann-Whitney test.
Nature Medicine doi:10.1038/nm.3957

Supplementary Table 1: Characteristics of 192 PDACs
Parameter Total (N=192)
pY323 <10% (N=153)
pY323 ≥10% (N=39)
P-value
Gender 0.8575 male 103 (53.6%) 83 (54.2%) 20 (51.3%) female 89 (46.4%) 70 (45.8%) 19 (48.7%) Age [years]* 65.5 (58.4 – 71.1) 65.5 (58.1 – 70.8) 66.9 (60.1 – 72.8) 0.4031 T category pT 3 192 (100.0%) 153 (100.0%) 39 (100.0%) N category 0.1885 pN 0 26 (13.5%) 18 (11.8%) 8 (20.5%) pN 1 166 (86.5%) 135 (88.2%) 31 (79.5%) No pos. lymph nodes (N1 tumors)* 5 (2 – 8) 5 (2 – 8) 4 (2 – 9) 0.6068 M category 0.6901 M 0 182 (94.8%) 144 (94.1%) 38 (97.4%) M 1 10 (5.2%) 9 (5.9%) 1 (2.6%) UICC stage 0.3423 UICC IIA 26 (13.5%) 18 (11.8%) 8 (20.5%) UICC IIB 156 (81.3%) 126 (82.4%) 30 (76.9%) UICC IV 10 (5.2%) 9 (5.9%) 1 (2.6%) Grading 0.7629 G 1 4 (2.1%) 4 (2.6%) 0 (0.0%) G 2 120 (62.5%) 94 (61.4%) 26 (66.7%) G 3 68 (35.4%) 55 (36.0%) 13 (33.3%) R-classification 0.7127 R 0 42 (21.9%) 31 (20.3%) 11 (28.2%) R 1 138 (71.9%) 112 (73.2%) 26 (66.7%) R 2 10 (5.2%) 8 (5.2%) 2 (5.1%) R x 2 (1.0%) 2 (1.3%) 0 (0.0%) Tumor size [cm]* 3.0 (2.5 – 3.5) 3.0 (2.5 – 3.5) 3.0 (2.5 – 3.5) 0.1263 *Presented as median with (interquartile range).
Nature Medicine doi:10.1038/nm.3957
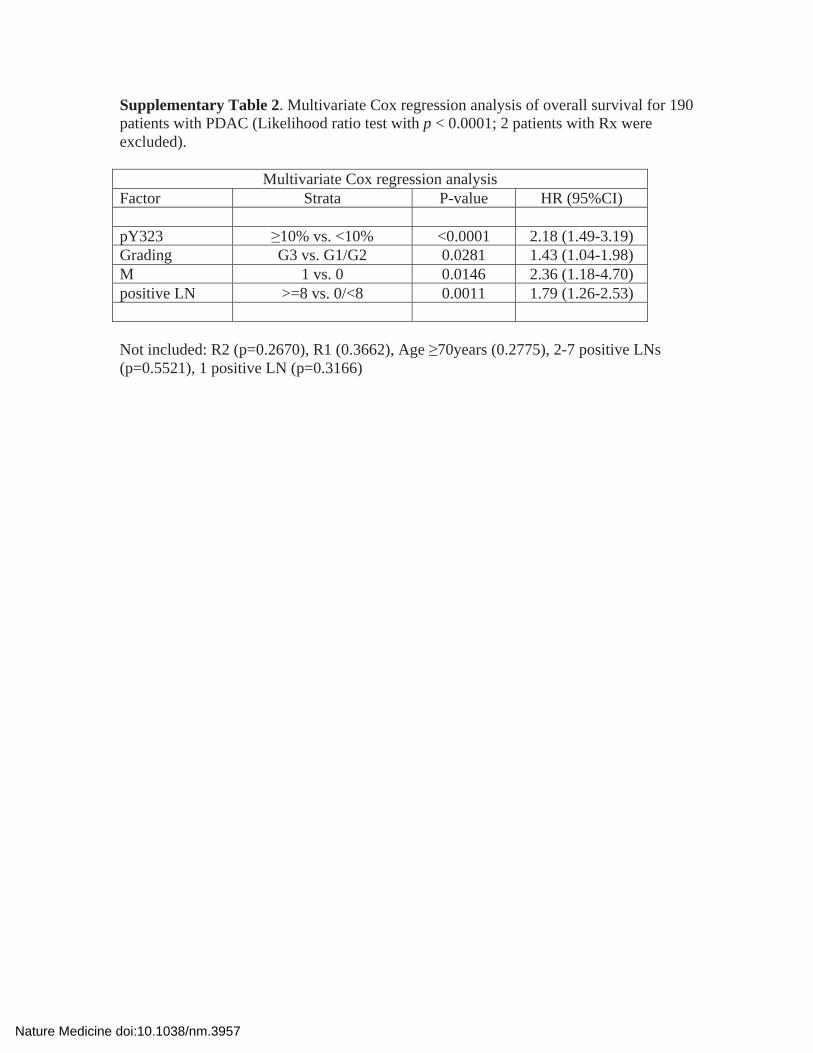
Supplementary Table 2. Multivariate Cox regression analysis of overall survival for 190 patients with PDAC (Likelihood ratio test with p < 0.0001; 2 patients with Rx were excluded).
Multivariate Cox regression analysis Factor Strata P-value HR (95%CI) pY323 ≥10% vs. <10% <0.0001 2.18 (1.49-3.19) Grading G3 vs. G1/G2 0.0281 1.43 (1.04-1.98) M 1 vs. 0 0.0146 2.36 (1.18-4.70) positive LN >=8 vs. 0/<8 0.0011 1.79 (1.26-2.53) Not included: R2 (p=0.2670), R1 (0.3662), Age ≥70years (0.2775), 2-7 positive LNs (p=0.5521), 1 positive LN (p=0.3166)
Nature Medicine doi:10.1038/nm.3957
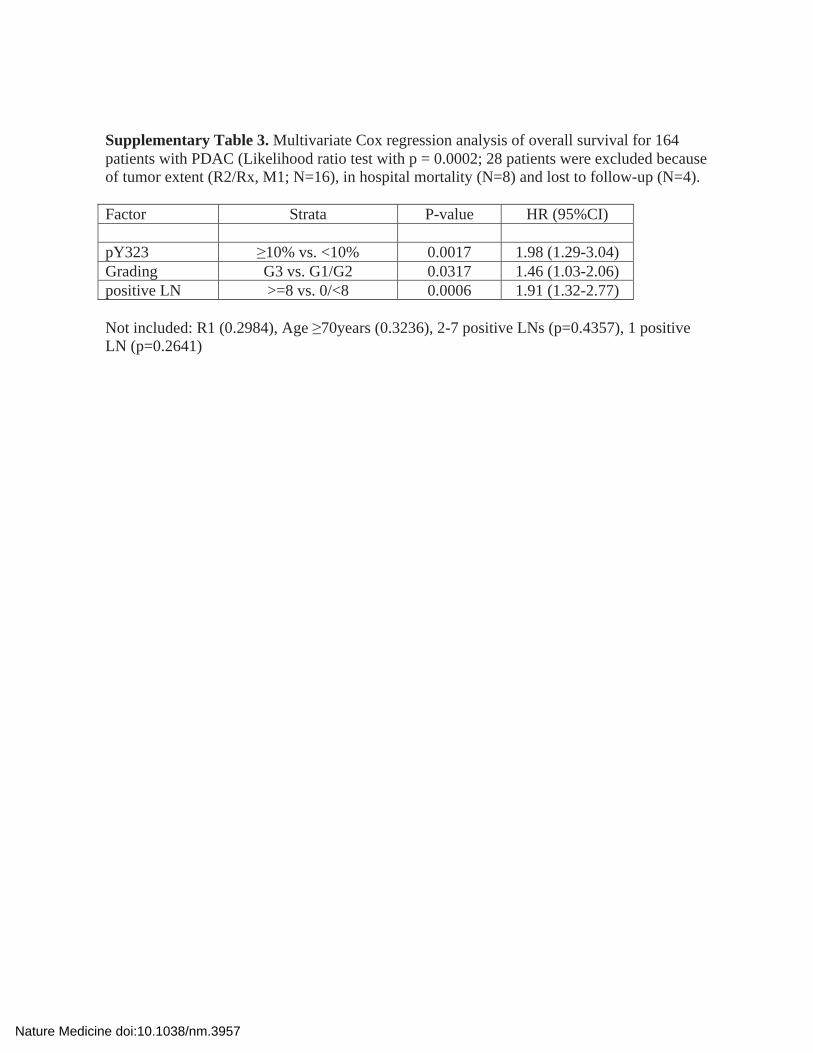
Supplementary Table 3. Multivariate Cox regression analysis of overall survival for 164 patients with PDAC (Likelihood ratio test with p = 0.0002; 28 patients were excluded because of tumor extent (R2/Rx, M1; N=16), in hospital mortality (N=8) and lost to follow-up (N=4). Factor Strata P-value HR (95%CI) pY323 ≥10% vs. <10% 0.0017 1.98 (1.29-3.04) Grading G3 vs. G1/G2 0.0317 1.46 (1.03-2.06) positive LN >=8 vs. 0/<8 0.0006 1.91 (1.32-2.77) Not included: R1 (0.2984), Age ≥70years (0.3236), 2-7 positive LNs (p=0.4357), 1 positive LN (p=0.2641)
Nature Medicine doi:10.1038/nm.3957

Supplementary Table 4. PDAC occurrence in KPC mice after (11R) Scr or (11R) 71-85 treatment
Treatment
(11R) Scr (11R) 71-85
PDAC 8/16 (50%) 2/14 (14.3%) Macroscopic 6 1 Microscopic 2 1
The incidence of PDAC in the KPC mice used in Fig. 4c after 3.5 weeks of treatment.
Nature Medicine doi:10.1038/nm.3957