Supplementary appendix - The Lancet...log(GDP), 1.3 (1.2 to 1.4) for log(GFR) and -0.5 (-0.8 to...
488
Supplementary appendix This appendix formed part of the original submission and has been peer reviewed. We post it as supplied by the authors. Supplement to: Alkema L, Chou D, Hogan D, et al, on behalf of the United Nations Maternal Mortality Estimation Inter-Agency Group collaborators and technical advisory group. Global, regional, and national levels and trends in maternal mortality between 1990 and 2015, with scenario-based projections to 2030: a systematic analysis by the UN Maternal Mortality Estimation Inter-Agency Group. Lancet 2015; published online Nov 12. http://dx.doi.org/10.1016/S0140-6736(15)00838-7.
Transcript of Supplementary appendix - The Lancet...log(GDP), 1.3 (1.2 to 1.4) for log(GFR) and -0.5 (-0.8 to...
Supplementary appendixThis appendix formed part of the original submission and has been peer reviewed. We post it as supplied by the authors.
Supplement to: Alkema L, Chou D, Hogan D, et al, on behalf of the United Nations Maternal Mortality Estimation Inter-Agency Group collaborators and technical advisory group. Global, regional, and national levels and trends in maternal mortality between 1990 and 2015, with scenario-based projections to 2030: a systematic analysis by the UN Maternal Mortality Estimation Inter-Agency Group. Lancet 2015; published online Nov 12. http://dx.doi.org/10.1016/S0140-6736(15)00838-7.

National, regional, and global levels and trends in maternal mortality between 1990 and 2015 with scenario-based projections to 2030: a systematic analysis by the United Nations Maternal Mortality Estimation Inter-Agency Group
Authors: Leontine Alkema*, Doris Chou*, Daniel Hogan, Sanqian Zhang, Ann-Beth Moller, Alison Gemmill, Doris Ma Fat, Ties Boerma, Marleen Temmerman , Colin Mathers and Lale Say; Written on behalf of UN MMEIG collaborators and the UN MMEIG technical advisory group (Saifuddin Ahmed, Mohamed Ali, Agbessi Amouzou, David Braunholtz, Peter Byass, Liliana Carvajal-Velez, Victor Gaigbe-Togbe, Patrick Gerland, Edilberto Loaiza, Samuel Mills, Namuunda Mutombo, Holly Newby, Thomas W. Pullum and Emi Suzuki)
Table of Contents 1. Data base construction and systematic data search .................................................................. 1
2. Country Consultation process ..................................................................................................... 2
3. Covariates ................................................................................................................................... 2
4. Supplementary tables ................................................................................................................. 3
5. References .............................................................................................................................. 120
6. Supplementary figures ............................................................................................................ 120
1. Data base construction and systematic data search Vital registration data on maternal deaths were extracted from the WHO mortality database on 30 July 2015 for the years 1985 and onwards, and supplemented with vital registration data provided during country consultation. For vital registration data coded in ICD-9, deaths from Chapter X “complications of pregnancy, childbirth, and the puerperium” codes 630-676 were included. For data coded in ICD-10, deaths from Chapter XV, “Pregnancy, childbirth, and the puerperium”, codes O00 to O99, excluding late maternal deaths (codes O96 and O97), plus A34 were extracted.
For data from household surveys, censuses and special inquires, the MMEIG updated its existing data base and included pertinent data available as of 30 July 2015. To ensure recent data were considered, the DHS and MICS websites were queried to identify surveys completed in 2014/2015. Additionally, UNFPA identified recent censuses that contained a module on maternal mortality. Specialized inquiries and or country led surveys, apart from the DHS/MICS series, were found by searching national statistical databases on a continuous basis from 2013, and through a systematic search, as summarized in supplementary Table 1. Additionally, during country consultation (described in the next section), nationally nominated Focal Points were requested to advise the MMEIG on the availability of any other nationally representative surveys, studies, or inquiries on maternal mortality measurement to include for consideration.
1

2. Country Consultation process The Country Consultation process for maternal mortality estimates is initiated by official communication sent from WHO to all Member States. The letter sent informed Member States of the ongoing exercise in maternal mortality estimation and requested the nomination of a Focal Point to participate in the consultation with the objective to build a mutual understanding of the strengths and weaknesses of available data to ensure broad ownership of the results.
Focal points received by email, (1) a copy of official communication, (2) draft estimates, (3) a summary of the methodology. The Focal points were asked to review the draft estimates and data sources identified in order to provide advice on any other primary sources of data not previously reported or used. Prior to initiating consultation, it was agreed that when Focal Points supplied additional data or queried the application of adjustment factors to their data, they would be requested to send a description of methodology which could be referenced. Those data sources which met inclusion criteria for the estimation exercise would be assessed for its quality and then added as data inputs in the re-run of the model to generate the final estimates.
Between 26 June and 24 July 2015 members of the MMEIG were in communication with Focal Points, responding to their queries and reviewing additional data as received. Of 183 Member States included in the estimation exercise, 125 Focal Points were nominated. In the circumstance that more than one Focal point was appointed from the country or territory, all were informed such that each Member State would have one response during the consultation.
In summary, new data points, which met inclusion criteria, were received from twenty six countries and consisted primarily of updates to civil registration data. Following revision of the complete data set, the model was re-run, thus revising the estimates for all countries/territories included in the exercise.
3. Covariates Three covariates were used in the statistical analysis: the gross domestic product per capita (GDP), the general fertility rate (GFR), and the proportion of births delivered by a skilled health personnel (SAB). GDP was measured in purchasing power parity equivalent dollars using 2011 as the baseline year. GDP inputs were taken from The World Bank, with estimates from other sources (e.g., IMF, OECD, WHO National Health Accounts and the Institute for Health Metrics and Evaluation) sused to inform trends in instances with missing country-years in the World Bank data set.(1) A five-year moving average was applied to this GDP series to smooth year-to-year GDP fluctuations.
The GFR was computed from data on live births and population size (of women aged 15-49) from the United Nations Population Division World Population Prospects, the 2015 revision.(2) SAB coverage estimates consist of time series derived using data from UNICEF global database 2015(3) (available at http://data.unicef.org/), based on MICS, DHS and other nationally representative sources. Although other sources of SAB data were consulted, only the UNICEF data were used because they adhere strictly to the indicator’s definition.(4) For countries with any value of SAB less than 95% and with four or more observations, annual
2
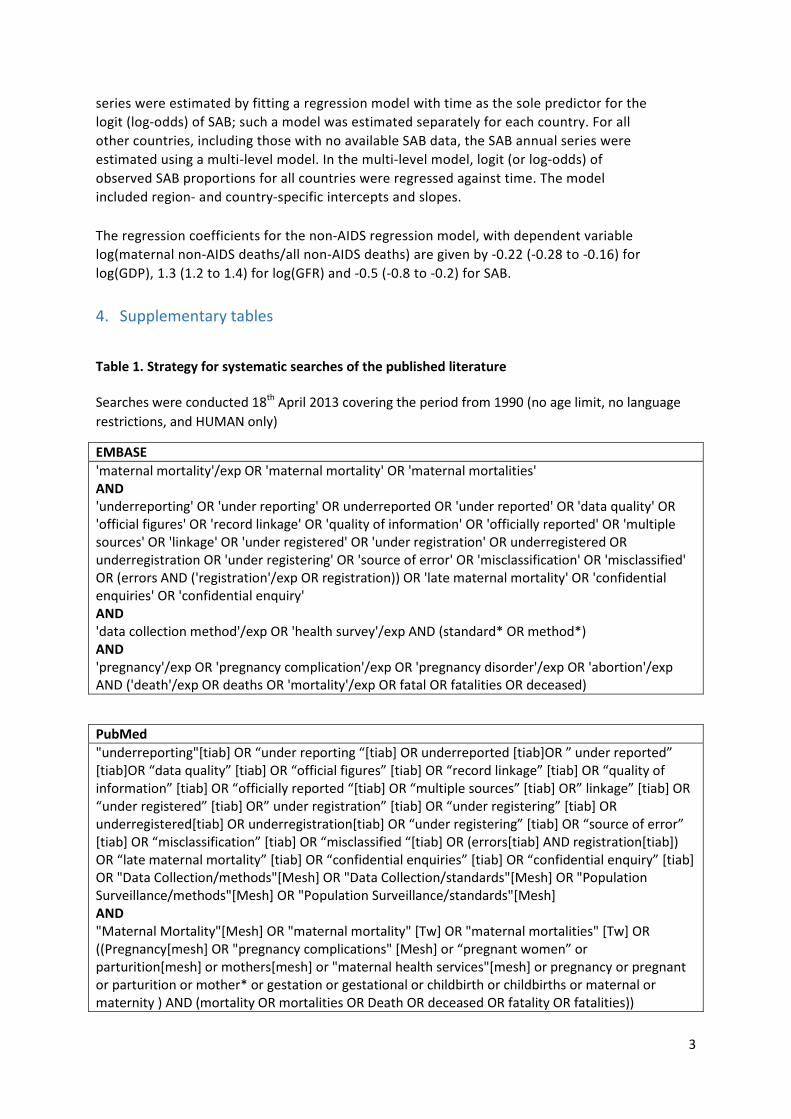
series were estimated by fitting a regression model with time as the sole predictor for the logit (log-odds) of SAB; such a model was estimated separately for each country. For all other countries, including those with no available SAB data, the SAB annual series were estimated using a multi-level model. In the multi-level model, logit (or log-odds) of observed SAB proportions for all countries were regressed against time. The model included region- and country-specific intercepts and slopes. The regression coefficients for the non-AIDS regression model, with dependent variable log(maternal non-AIDS deaths/all non-AIDS deaths) are given by -0.22 (-0.28 to -0.16) for log(GDP), 1.3 (1.2 to 1.4) for log(GFR) and -0.5 (-0.8 to -0.2) for SAB.
4. Supplementary tables
Table 1. Strategy for systematic searches of the published literature Searches were conducted 18th April 2013 covering the period from 1990 (no age limit, no language restrictions, and HUMAN only)
EMBASE 'maternal mortality'/exp OR 'maternal mortality' OR 'maternal mortalities' AND 'underreporting' OR 'under reporting' OR underreported OR 'under reported' OR 'data quality' OR 'official figures' OR 'record linkage' OR 'quality of information' OR 'officially reported' OR 'multiple sources' OR 'linkage' OR 'under registered' OR 'under registration' OR underregistered OR underregistration OR 'under registering' OR 'source of error' OR 'misclassification' OR 'misclassified' OR (errors AND ('registration'/exp OR registration)) OR 'late maternal mortality' OR 'confidential enquiries' OR 'confidential enquiry' AND 'data collection method'/exp OR 'health survey'/exp AND (standard* OR method*) AND 'pregnancy'/exp OR 'pregnancy complication'/exp OR 'pregnancy disorder'/exp OR 'abortion'/exp AND ('death'/exp OR deaths OR 'mortality'/exp OR fatal OR fatalities OR deceased)
PubMed "underreporting"[tiab] OR “under reporting “[tiab] OR underreported [tiab]OR ” under reported” [tiab]OR “data quality” [tiab] OR “official figures” [tiab] OR “record linkage” [tiab] OR “quality of information” [tiab] OR “officially reported “[tiab] OR “multiple sources” [tiab] OR” linkage” [tiab] OR “under registered” [tiab] OR” under registration” [tiab] OR “under registering” [tiab] OR underregistered[tiab] OR underregistration[tiab] OR “under registering” [tiab] OR “source of error” [tiab] OR “misclassification” [tiab] OR “misclassified “[tiab] OR (errors[tiab] AND registration[tiab]) OR “late maternal mortality” [tiab] OR “confidential enquiries” [tiab] OR “confidential enquiry” [tiab] OR "Data Collection/methods"[Mesh] OR "Data Collection/standards"[Mesh] OR "Population Surveillance/methods"[Mesh] OR "Population Surveillance/standards"[Mesh] AND "Maternal Mortality"[Mesh] OR "maternal mortality" [Tw] OR "maternal mortalities" [Tw] OR ((Pregnancy[mesh] OR "pregnancy complications" [Mesh] or “pregnant women” or parturition[mesh] or mothers[mesh] or "maternal health services"[mesh] or pregnancy or pregnant or parturition or mother* or gestation or gestational or childbirth or childbirths or maternal or maternity ) AND (mortality OR mortalities OR Death OR deceased OR fatality OR fatalities))
3

AND "mothers"[MeSH Terms] OR "mothers"[All Fields] OR "mother"[All Fields] OR "mothers"[MeSH Terms] OR "mothers"[All Fields] OR "maternal"[All Fields] OR "pregnancy"[MeSH Terms] OR "pregnancy"[All Fields] OR "parturition"[MeSH Terms] OR "parturition"[All Fields] OR "postpartum period"[MeSH Terms] OR "postpartum"[All Fields] AND "period"[All Fields] OR "postpartum period"[All Fields] OR "postpartum"[All Fields] OR antepartum[All Fields] OR intrapartum[All Fields] OR "parturition"[MeSH Terms] OR "parturition"[All Fields] OR "childbirth"[All Fields] OR "delivery, obstetric"[MeSH Terms] OR ("delivery"[All Fields] AND "obstetric"[All Fields]) OR "obstetric delivery"[All Fields] OR "parturition"[MeSH Terms] OR "parturition"[All Fields] OR "birth"[All Fields] OR termination[All Fields] OR "abortion, induced"[MeSH Terms] OR ( "abortion"[All Fields] AND "induced"[All Fields]) OR "induced abortion"[All Fields] OR "abortion"[All Fields] OR "abortion, spontaneous"[MeSH Terms] OR ("abortion"[All Fields] AND "spontaneous"[All Fields]) OR "spontaneous abortion"[All Fields] OR "miscarriage"[All Fields] AND "death"[MeSH Terms] OR "death"[All Fields] OR fatal[All Fields] OR fatality[All Fields] OR "mortality"[Subheading] OR "mortality"[All Fields] OR "mortality"[MeSH Terms]
Global Index Medicus ((underreporting) OR (under reporting ) OR underreported OR ( under reported) OR (data quality) OR (official figures) OR (record linkage) OR (quality of information) OR (officially reported ) OR (multiple sources) OR ( linkage) OR (under registered) OR ( under registration) OR (under registering) OR underregistered OR underregistration OR (under registering) OR (source of error) OR (misclassification) OR (misclassified ) OR (errors AND registration) OR (late maternal mortality) OR (confidential enquiries) OR (confidential enquiry)) AND ((MOTHERS AND Mortality) OR (Maternal Mortality) OR (Maternal Death) OR (maternal mortality) OR (maternal deaths) OR (pregnancy related deaths) OR (pregnancy related deaths))
EBSCO (underreporting OR under reporting OR underreported OR under reported OR data quality OR official figures OR official national figures OR record linkage OR quality of information OR officially reported OR multiple sources OR linkage OR under registered OR under registration OR under registering OR underregistered OR underregistration OR under registering OR sources of error OR misclassification OR misclassified OR (errors AND registration) OR late maternal mortality OR confidential enquiries OR confidential enquiry OR (data collection AND (methods OR standards)) OR audit OR (population surveillance AND (methods OR standards))) AND (maternal mortality OR pregnancy related deaths OR maternal deaths)
4

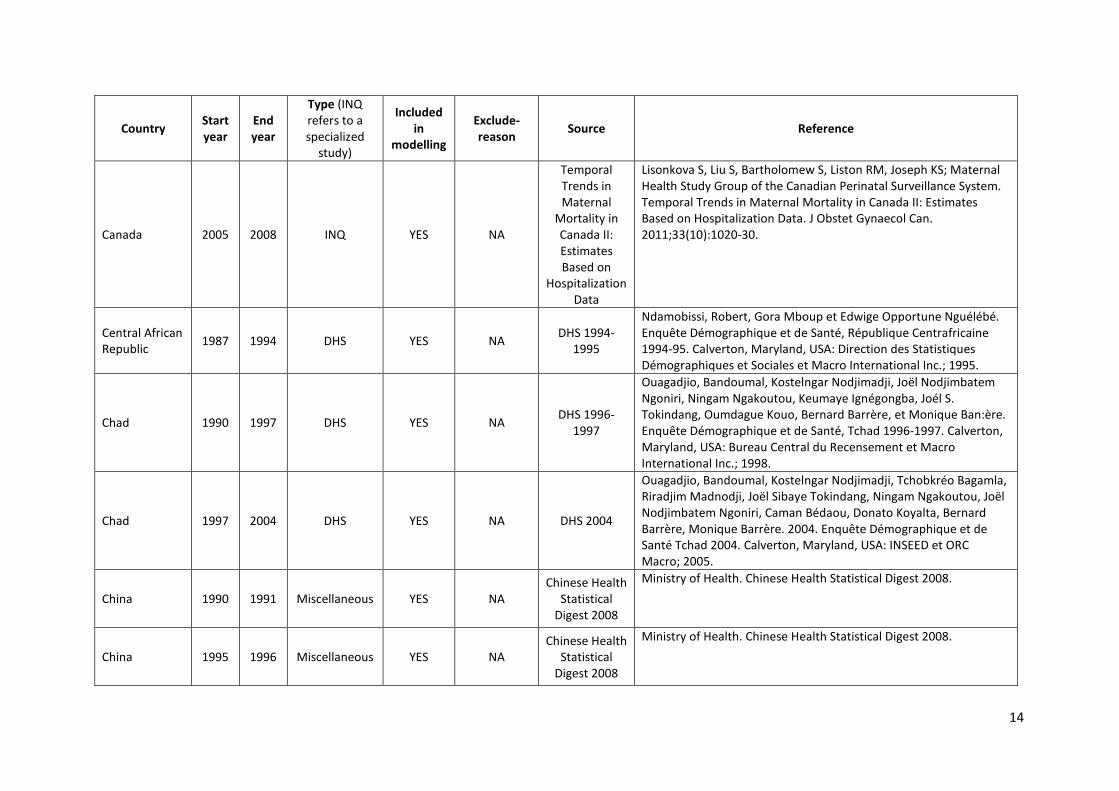
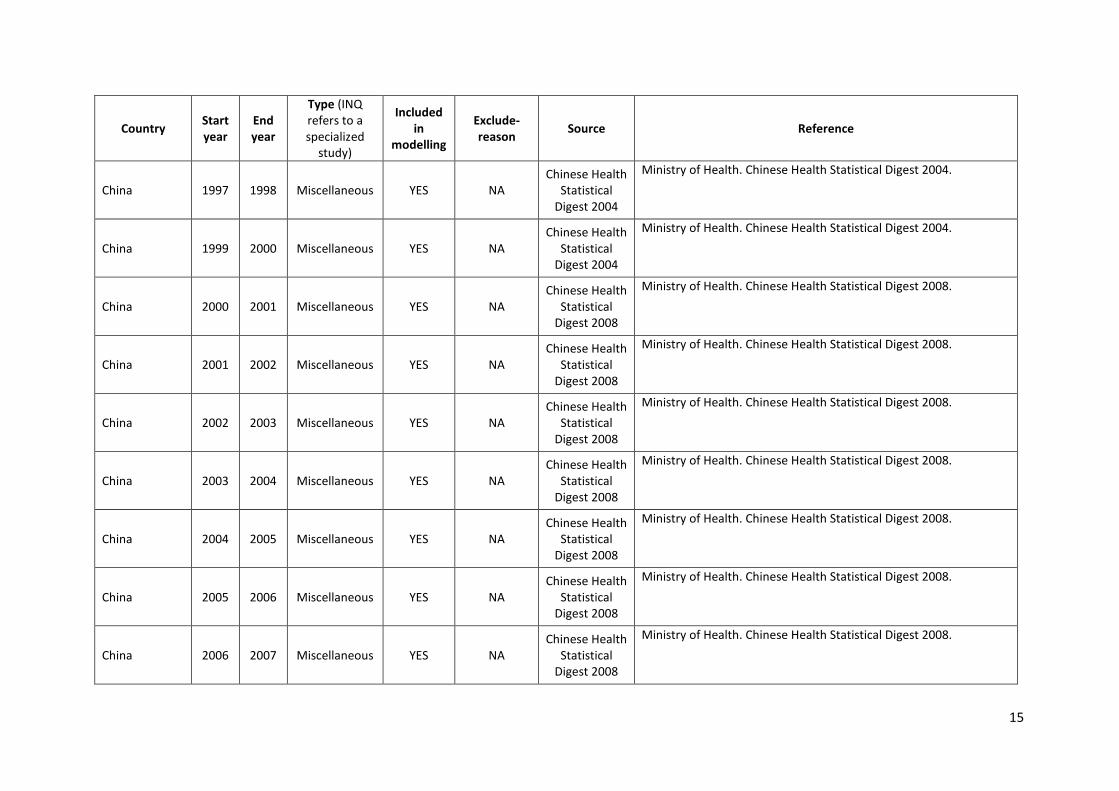
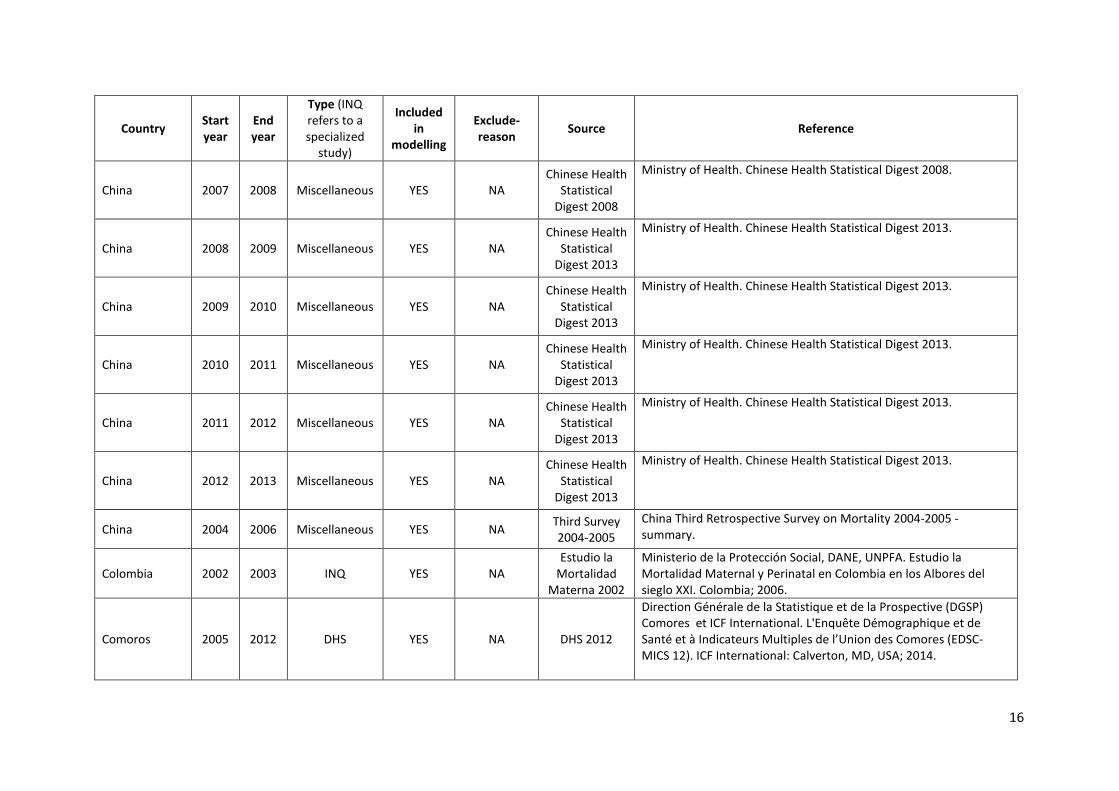
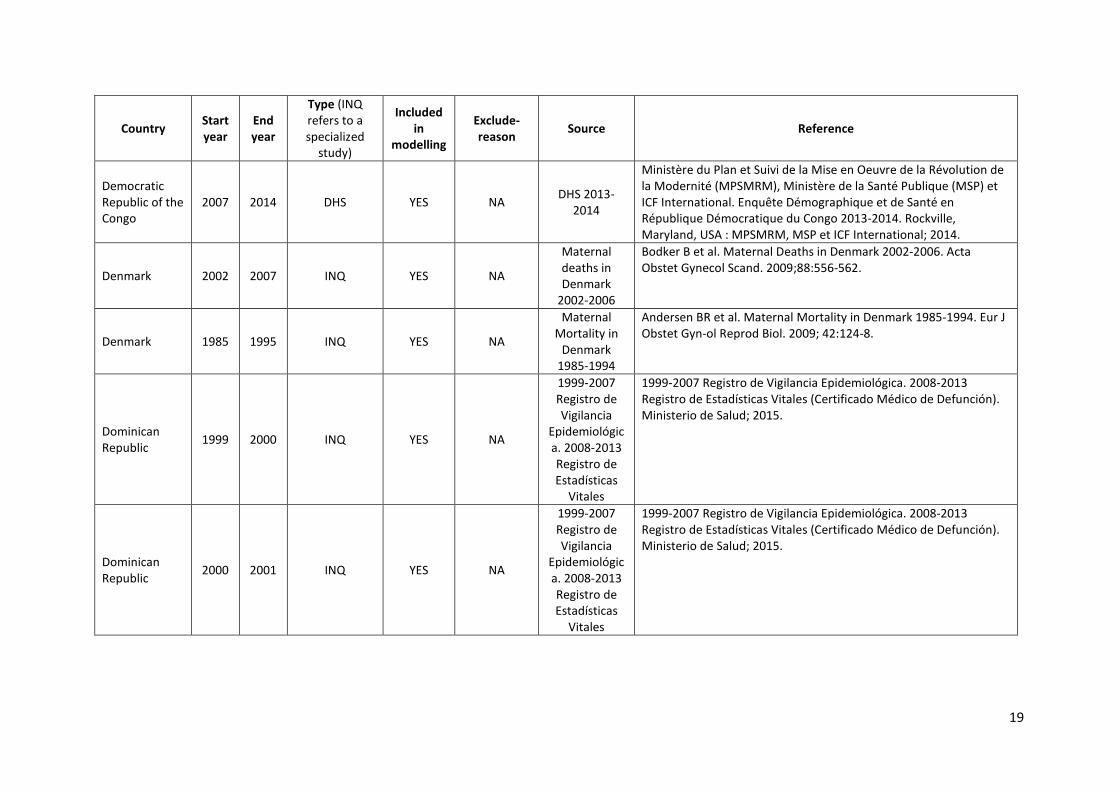
Table 2. Overview of all non-VR data sources
Country Start year
End year
Type (INQ refers to a specialized
study)
Included in
modelling
Exclude-reason Source Reference
Afghanistan 2003 2010 Miscellaneous YES NA AMS 2010
Afghan Public Health Institute, Ministry of Public Health (APHI/MoPH) [Afghanistan], Central Statistics Organization (CSO) [Afghanistan], ICF Macro, Indian Institute of Health Management Research (IIHMR) [India], and World Health Organization Regional Office for the Eastern Mediterranean (WHO/EMRO) [Egypt]. Afghanistan Mortality Survey 2010. Calverton, Maryland, USA: APHI/MoPH, CSO, ICF Macro, IIHMR and WHO/EMRO; 2011.
Afghanistan 1999 2002 RAMOS NO
Sub-national/sub-population
coverage
RAMOS 2002
Bartlett LA et al. Where giving birth is a forecast of death: maternal mortality in four districts of Afghanistan, 1999-2002. Lancet, 365(9462):864-70; 2005.
Algeria 1999 2000 Miscellaneous YES NA ENMM 1999 INSP. Enquête national sur la mortalité maternelle. Algeria; 2001.
Australia 2006 2011 INQ YES NA
Maternal deaths in Australia
2006-2010.
Johnson S, Bonello MR, Li Z, Hilder L, Sullivan EA. Maternal deaths in Australia 2006–2010. Canberra: AIHW; 2014 (Maternal Deaths Series no. 4. Cat. no. PER 61).
Australia 2000 2003 INQ YES NA
Maternal deaths in Australia
2000-2002
Sullivan EA, King JF, editors. Maternal deaths in Australia 2000–2002. Sydney: AIHW National Perinatal Statistics Unit; 2006 (Maternal Deaths Series no. 2. Cat. no. PER 32).
Australia 1994 1997 INQ YES NA
Maternal Deaths in Australia,
1994-1996
AIHW, NHMRC. Report on maternal deaths in Australia 1994-96. Canberra, AIHW; 2001. (Cat. no. PER 17).
Australia 2003 2006 INQ NO
No envelop found for
Confidential Inquery
Maternal deaths in Australia
2003-2005
Sullivan EA, Hall B, King JF. Maternal deaths in Australia 2003–2005. Sydney: AIHW National Perinatal Statistics Unit; 2007 (Maternal Deaths Series no. 3. Cat. no. PER 42).
5

Country Start year
End year
Type (INQ refers to a specialized
study)
Included in
modelling
Exclude-reason Source Reference
Australia 1997 2000 INQ YES NA
Maternal deaths in Australia
1997-1999
Slaytor EK, Sullivan EA, King JF. Maternal deaths in Australia 1997–1999. AIHW Cat. No. PER 24. Sydney: AIHW National Perinatal Statistics Unit;2004. (Maternal Deaths Series No.1).
Australia 2011 2012 INQ YES NA
Maternal deaths in Australia
2008-2013
AIHW: Humphrey MD, Bonello MR, Chughtai A, Macaldowie A, Harris K, Chambers GM. Maternal deaths in Australia 2008–2012. Maternal deaths series no. 5. Cat. no. PER 70. Canberra: AIHW; 2015..
Australia 2012 2013 INQ NO No envelop found for
INQ
Maternal deaths in Australia
2008-2013
AIHW: Humphrey MD, Bonello MR, Chughtai A, Macaldowie A, Harris K, Chambers GM. Maternal deaths in Australia 2008–2012. Maternal deaths series no. 5. Cat. no. PER 70. Canberra: AIHW; 2015
Austria 1980 1998 INQ NO Inquiry started
before 1985
Underreporting of direct and
indirect obstetrical deaths in
Austria, 1980-98
Karimian-Teherani D et al. Underreporting of direct and indirect obstetrical deaths in Austria, 1980–98. Acta Obstet Gynecol Scand. 2002;81(4):323–7.
Bangladesh 1996 2001 Miscellaneous YES NA BMMS 2001
National Institute of Population Research and Training (NIPORT), ORC Macro, Johns Hopkins University and ICDDR,B. Bangladesh Maternal Health Services and Maternal Mortality Survey 2001. Dhaka, Bangladesh and Calverton, Maryland, USA: NIPORT, ORC Macro, Johns Hopkins University, and ICDDR,B; 2003.
Bangladesh 2007 2011 Miscellaneous YES NA BMMS 2010
National Institute of Population Research and Training (NIPORT), MEASURE Evaluation, and ICDDR,B. Bangladesh Maternal Mortality and Health Care Survey 2010. Dhaka, Bangladesh: NIPORT, MEASURE Evaluation, and ICDDR,B; 2012.
6

Country Start year
End year
Type (INQ refers to a specialized
study)
Included in
modelling
Exclude-reason Source Reference
Bangladesh 1998 2002 Miscellaneous YES NA BMMS 2001
National Institute of Population Research and Training (NIPORT), ORC Macro, Johns Hopkins University and ICDDR,B. Bangladesh Maternal Health Services and Maternal Mortality Survey 2001. Dhaka, Bangladesh and Calverton, Maryland (USA): NIPORT, ORC Macro, Johns Hopkins University, and ICDDR,B; 2003.
Bangladesh 1986 1991 Miscellaneous YES NA BMMS 2001
National Institute of Population Research and Training (NIPORT), ORC Macro, Johns Hopkins University and ICDDR,B. Bangladesh Maternal Health Services and Maternal Mortality Survey 2001. Dhaka, Bangladesh and Calverton, Maryland (USA): NIPORT, ORC Macro, Johns Hopkins University, and ICDDR,B; 2003.
Bangladesh 1991 1997 Miscellaneous YES NA BMMS 2001
National Institute of Population Research and Training (NIPORT), ORC Macro, Johns Hopkins University and ICDDR,B. Bangladesh Maternal Health Services and Maternal Mortality Survey 2001. Dhaka, Bangladesh and Calverton, Maryland (USA): NIPORT, ORC Macro, Johns Hopkins University, and ICDDR,B; 2003.
Benin 1989 1996 DHS YES NA DHS 1996
Kodjogbé, Nicalse, Gora Mboup, Justin Tossou, Léopoldine de Souza, Timothée Gandaho, Alphonse Guédémé, Thomas Houedokoho, Rafatou Houndékon, Thomas Tohouegnon, Suzanne Zomahoun, Virgile Capo-Chichi, et Andrée Cossi. Enquête Démographique et de Santé, République de Bénin 1996. Calverton, Maryland USA: Institut National de la Statistique et de l'Analyse Économique et Macro International Inc.; 1997.
Benin 1999 2006 DHS YES NA DHS 2006
Institut National de la Statistique et de l’Analyse Économique (INSAE) [Bénin] et Macro International Inc. Enquête Démographique et de Santé (EDSB-III) - Bénin 2006. Calverton, Maryland, USA : Institut National de la Statistique et de l’Analyse Économique et Macro International Inc.; 2007.
7

Country Start year
End year
Type (INQ refers to a specialized
study)
Included in
modelling
Exclude-reason Source Reference
Benin 1991 1992 Census YES NA Census 1992 National Institute of Statistics and Economic Analysis (INSAE). Benin General Census of Population and Housing 1992. Benin; 1993.
Bhutan 1992 1994 Miscellaneous YES NA NHS 1994 Ministry of Health. Report on National Health Survey, June 1994. Thimphu, Bhutan, 1996.
Bhutan 1999 2000 Miscellaneous YES NA NHS 2000 Ministry of Health. Report on National Health Survey 2000. Thimphu, Bhutan.
Bhutan 2006 2011 Miscellaneous YES NA BMIS 2010-Health
UNFPA, UNICEF, RGOB. BMIS 2010 Thematic Analyses Series Health. Bhutan; 2012.
Bhutan 2004 2005 Census YES NA Census 2005 Office of the Census Commissioner (Bhutan). Bhutan Population and Housing Census 2005. Thimphu, Bhutan: Office of the Census Commissioner. Bhutan; 2006.
Bolivia 1996 2003 DHS YES NA DHS 2003
Ministerio de Salud y Deportes (MSD), Programa Reforma de Salud (PRS), Instituto Nacional de Estadística (INE), ORC Macro. Encuesta Nacional de Demografía y Salud ENDSA 2003. Calverton, Maryland, USA: ORC Macro; 2004.
Bolivia 2001 2008 DHS YES NA DHS 2008
Ministerio de Salud y Deportes (MSD), Programa Reforma de Salud (PRS), Instituto Nacional de Estadística (INE), Macro International. Encuesta Nacional de Demografía y Salud ENDSA 2008. Calverton, Maryland, USA: Macro International; 2009.
Bolivia 1985 1986 DHS YES NA DHS 1989 Instituto Nacional de Estadística, Ministerio de Hacienda, Macro International Inc. Encuesta Nacional de Demografía y Salud 1998. Calverton, Maryland, USA: Macro International Inc.; 1998.
Bolivia 1986 1987 DHS YES NA DHS 1994
Instituto Nacional de Estadística, Ministerio de Desarrollo Sostenible, Medio Ambiente Secretaría Nacional de Planificación, Macro International Inc. Encuesta Nacional de Demografía y Salud 1994. Calverton, Maryland, USA: Macro International Inc.; 1994.
Bolivia 1989 1994 DHS YES NA DHS 1994
Instituto Nacional de Estadística, Ministerio de Desarrollo Sostenible, Medio Ambiente Secretaría Nacional de Planificación, Macro International Inc. Encuesta Nacional de Demografía y Salud 1994. Calverton, Maryland, USA: Macro International Inc.; 1994.
8

Country Start year
End year
Type (INQ refers to a specialized
study)
Included in
modelling
Exclude-reason Source Reference
Bolivia 2000 2001 Census YES NA Census post enumeration survey 2001
National Institute of Statistics. Bolivia Census. Bolivia; 2001.
Botswana 2013 2014 Miscellaneous YES NA SCO Stats Brief 2014/1
Statistics Botswana. Botswana Maternal Mortality Ratio (MMR) 2009-2013. Stats Brief No. 2014/1. Botswana; 2014.
Botswana 2012 2013 Miscellaneous YES NA SCO Stats Brief 2014/2
Statistics Botswana. Botswana Maternal Mortality Ratio (MMR) 2008-2012. Stats Brief No. 2014/2. Botswana; 2014.
Botswana 2011 2012 Miscellaneous YES NA SCO Stats Brief 2014/2
Statistics Botswana. Botswana Maternal Mortality Ratio (MMR) 2008-2012. Stats Brief No. 2014/2. Botswana; 2014.
Botswana 2010 2011 Miscellaneous YES NA SCO Stats Brief 2014/2
Statistics Botswana. Botswana Maternal Mortality Ratio (MMR) 2008-2012. Stats Brief No. 2014/2. Botswana; 2014.
Botswana 2009 2010 Miscellaneous YES NA SCO Stats Brief 2014/2
Statistics Botswana. Botswana Maternal Mortality Ratio (MMR) 2008-2012. Stats Brief No. 2014/2. Botswana; 2014.
Botswana 2008 2009 Miscellaneous YES NA SCO Stats Brief 2014/2
Statistics Botswana. Botswana Maternal Mortality Ratio (MMR) 2008-2012. Stats Brief No. 2014/2. Botswana; 2014.
Botswana 2007 2008 Miscellaneous YES NA SCO Stats Brief 2010
Statistics Botswana. Botswana Maternal Mortality Ratio (MMR) 2008. Stats Brief No. 2009/17. Botswana; 2009.
Botswana 2006 2007 Miscellaneous YES NA SCO Stats Brief 2010
Statistics Botswana. Botswana maternal Mortality Ratio (MMR) 2008. Stats Brief No. 2009/17. Botswana; 2009.
Botswana 2005 2006 Miscellaneous YES NA SCO Stats Brief 2010
Statistics Botswana. Botswana maternal Mortality Ratio (MMR) 2008. Stats Brief No. 2009/17. Botswana; 2009.
Brazil 2002 2002 RAMOS YES NA RAMOS 2002
Brasil Ministério da Saúde, Secretaria de Atenção à Saúde, Departamento de Ações Programáticas Estratégicas. Estudo da mortalidade de mulheres de 10 a 49 anos, com ênfase na mortalidade materna: relatório final. Brasilia, Ministério da Saúde, Secretaria de Atenção à Saúde, Departamento de Ações Programáticas Estratégicas, Editora do Ministério da Saúde; 2006.
9

Country Start year
End year
Type (INQ refers to a specialized
study)
Included in
modelling
Exclude-reason Source Reference
Brazil 1996 1997 INQ YES NA MoH 2015 MoH 2015.
Brazil 1997 1998 INQ YES NA MoH 2015 MoH 2015.
Brazil 1998 1999 INQ YES NA MoH 2015 MoH 2015.
Brazil 1999 2000 INQ YES NA MoH 2015 MoH 2015.
Brazil 2000 2001 INQ YES NA MoH 2015 MoH 2015.
Brazil 2001 2002 INQ YES NA MoH 2015 MoH 2015.
Brazil 2002 2003 INQ YES NA MoH 2015 MoH 2015.
Brazil 2003 2004 INQ YES NA MoH 2015 MoH 2015.
Brazil 2004 2005 INQ YES NA MoH 2015 MoH 2015.
Brazil 2005 2006 INQ YES NA MoH 2015 MoH 2015.
Brazil 2006 2007 INQ YES NA MoH 2015 MoH 2015.
Brazil 2007 2008 INQ YES NA MoH 2015 MoH 2015.
Brazil 2008 2009 INQ YES NA MoH 2015 MoH 2015.
Brazil 2009 2010 INQ YES NA MoH 2015 MoH 2015.
Brazil 2010 2011 INQ YES NA MoH 2015 MoH 2015.
Brazil 2011 2012 INQ YES NA MoH 2015 MoH 2015.
Brazil 2012 2013 INQ YES NA MoH 2015 MoH 2015.
Brazil 1989 1996 DHS YES NA DHS 1996
Sociedade Civil Bem-Estar Familiar no Brasil, BEMFAM, Programa de Pesquisas de Demografia e Saúde (DHS) Macro International Inc. Brasil Pesquisa Nacional Sobre Demografia e Saúde 1996. Calverton, Maryland, USA: Macro International Inc.; 1997.
Burkina Faso 1992 1999 DHS YES NA DHS 1998-1999
Institut National de la Statistique et de la Démographie, et Macro International Inc. Enquête Démographique et de Santé, Burkina Faso 1998-1999. Calverton, Maryland, USA: Macro International Inc.; 2000.
10

Country Start year
End year
Type (INQ refers to a specialized
study)
Included in
modelling
Exclude-reason Source Reference
Burkina Faso 2003 2010 DHS YES NA DHS 2010
Institut National de la Statistique et de la Démographie (INSD) et ICF International. Enquête Démographique et de Santé et à Indicateurs Multiples du Burkina Faso 2010. Calverton, Maryland, USA : INSD et ICF International; 2012.
Burkina Faso 2005 2006 Census YES NA Census 2006 National Institute of Statistics and Demography (INSD).Burkina Faso Population and Housing Census 2006. Burkian Faso; 2007.
Burundi 2003 2010 DHS YES NA DHS 2010
Institut de Statistiques et d’Études Économiques du Burundi (ISTEEBU), Ministère de la Santé Publique et de la Lutte contre le Sida [Burundi] (MSPLS), et ICF International. Enquête Démographique et de Santé Burundi 2010. Bujumbura, Burundi: ISTEEBU, MSPLS, et ICF International; 2012.
Cambodia 1993 2000 DHS YES NA DHS 2000
National Institute of Statistics, Directorate General for Health [Cambodia], and ORC Macro. Cambodia Demographic and Health Survey 2000. Phnom Penh, Cambodia, and Calverton, Maryland USA: National Institute of Statistics, Directorate General for Health, and ORC Macro;2001.
Cambodia 1998 2005 DHS YES NA DHS 2005
National Institute of Public Health, National Institute of Statistics [Cambodia] and ORC Macro. Cambodia Demographic and Health Survey 2005. Phnom Penh, Cambodia and Calverton, Maryland, USA: National Institute of Public Health, National Institute of Statistics and ORC Macro; 2006.
Cambodia 2003 2010 DHS YES NA DHS 2010
National Institute of Statistics, Directorate General for Health, and ICF Macro. Cambodia Demographic and Health Survey 2010. Phnom Penh, Cambodia and Calverton, Maryland, USA: National Institute of Statistics, Directorate General for Health, and ICF Macro; 2011.
Cambodia 2008 2015 DHS 2014 YES NA DHS 2014
National Institute of Statistics, Directorate General for Health, and ICF International. Cambodia Demographic and Health Survey 2014. Key Indicators Report. ICF International: Rockville, Maryland, USA; 2015.
11

Country Start year
End year
Type (INQ refers to a specialized
study)
Included in
modelling
Exclude-reason Source Reference
Cambodia 2007 2008 Census YES NA Census 2008 National Institute of Statistics, Ministry of Planning. General Population Census of Cambodia 2008. Cambodia; 2011.
Cameroon 1991 1998 DHS YES NA DHS 1998-1999
Fotso, Médard, René Ndonou, Paul Roger Libité, Martin Tsafack, Roger Wakou, Aboubakar Ghapoutsa, Samuel Kamga, Pierre Kemgo, Michel Kwekem Fankam, Antoine Kamdoum, Bernard Barrère. Enquête Démographique et de Santé, Cameroun 1998. Calverton, Maryland, USA: Bureau Central des Recensements et des Études de Population et Macro International Inc.; 1999.
Cameroon 1997 2004 DHS YES NA DHS 2004 Institut National de la Statistique (INS) et ORC Macro. Enquête Démographique et de Santé du Cameroun 2004. Calverton, Maryland, USA: INS et ORC Macro; 2005
Cameroon 2004 2011 DHS YES NA DHS 2011 Institut National de la Statistique (INS) et ICF. International. Enquête Démographique et de Santé et à Indicateurs Multiples du Cameroun 2011. Calverton, Maryland, USA: INS et ICF International; 2012.
Cameroon 2010 2011 Miscellaneous NO
Sub-national/sub-population
coverage
Rapport d'expertise sur
les donnés relatives a la
mortalité maternelle,
2010.
Ministère de la Santé Publique. Rapport d'expertise sur les données relatives a la mortalité maternelle et la prématurité des naissances au Cameroun au cours de l'année 2010. Cameroun; 2012.
Cameroon 1990 1997 DHS YES NA DHS 2004 Institut National de la Statistique (INS) et ORC Macro. Enquête Démographique et de Santé du Cameroun 2004. Calverton, Maryland, USA: INS et ORC Macro; 2005.
Canada 1997 2001 INQ NO
Sub-national/sub-population
coverage
Special report on maternal
mortality and severe
morbidity in Canada 1997-
2000
Health Canada. Special Report on Maternal Mortality and Severe Morbidity in Canada - Enhanced Surveillance: The Path to Prevention. Ottawa: Minister of Public Works and Government Services Canada; 2004.
12

Country Start year
End year
Type (INQ refers to a specialized
study)
Included in
modelling
Exclude-reason Source Reference
Canada 1988 1993 INQ YES NA
Maternal mortality in
Canada 1988-1992
Turner LA, et al. Underreporting of maternal mortality in Canada: A question of definition. Chronic diseases in Canada. 2002;23(1):22-30.
Canada 1996 1999 INQ YES NA
Temporal Trends in Maternal
Mortality in Canada II: Estimates Based on
Hospitalization Data
Lisonkova S, Liu S, Bartholomew S, Liston RM, Joseph KS; Maternal Health Study Group of the Canadian Perinatal Surveillance System. Temporal Trends in Maternal Mortality in Canada II: Estimates Based on Hospitalization Data. J Obstet Gynaecol Can. 2011;33(10):1020-30.
Canada 1999 2002 INQ YES NA
Temporal Trends in Maternal
Mortality in Canada II: Estimates Based on
Hospitalization Data
Lisonkova S, Liu S, Bartholomew S, Liston RM, Joseph KS; Maternal Health Study Group of the Canadian Perinatal Surveillance System. Temporal Trends in Maternal Mortality in Canada II: Estimates Based on Hospitalization Data. J Obstet Gynaecol Can. 2011;33(10):1020-30.
Canada 2002 2005 INQ YES NA
Temporal Trends in Maternal
Mortality in Canada II: Estimates Based on
Hospitalization Data
Lisonkova S, Liu S, Bartholomew S, Liston RM, Joseph KS; Maternal Health Study Group of the Canadian Perinatal Surveillance System. Temporal Trends in Maternal Mortality in Canada II: Estimates Based on Hospitalization Data. J Obstet Gynaecol Can. 2011;33(10):1020-30.
13
Country Start year
End year
Type (INQ refers to a specialized
study)
Included in
modelling
Exclude-reason Source Reference
Canada 2005 2008 INQ YES NA
Temporal Trends in Maternal
Mortality in Canada II: Estimates Based on
Hospitalization Data
Lisonkova S, Liu S, Bartholomew S, Liston RM, Joseph KS; Maternal Health Study Group of the Canadian Perinatal Surveillance System. Temporal Trends in Maternal Mortality in Canada II: Estimates Based on Hospitalization Data. J Obstet Gynaecol Can. 2011;33(10):1020-30.
Central African Republic 1987 1994 DHS YES NA DHS 1994-
1995
Ndamobissi, Robert, Gora Mboup et Edwige Opportune Nguélébé. Enquête Démographique et de Santé, République Centrafricaine 1994-95. Calverton, Maryland, USA: Direction des Statistiques Démographiques et Sociales et Macro International Inc.; 1995.
Chad 1990 1997 DHS YES NA DHS 1996-1997
Ouagadjio, Bandoumal, Kostelngar Nodjimadji, Joël Nodjimbatem Ngoniri, Ningam Ngakoutou, Keumaye Ignégongba, Joél S. Tokindang, Oumdague Kouo, Bernard Barrère, et Monique Ban:ère. Enquête Démographique et de Santé, Tchad 1996-1997. Calverton, Maryland, USA: Bureau Central du Recensement et Macro International Inc.; 1998.
Chad 1997 2004 DHS YES NA DHS 2004
Ouagadjio, Bandoumal, Kostelngar Nodjimadji, Tchobkréo Bagamla, Riradjim Madnodji, Joël Sibaye Tokindang, Ningam Ngakoutou, Joël Nodjimbatem Ngoniri, Caman Bédaou, Donato Koyalta, Bernard Barrère, Monique Barrère. 2004. Enquête Démographique et de Santé Tchad 2004. Calverton, Maryland, USA: INSEED et ORC Macro; 2005.
China 1990 1991 Miscellaneous YES NA Chinese Health
Statistical Digest 2008
Ministry of Health. Chinese Health Statistical Digest 2008.
China 1995 1996 Miscellaneous YES NA Chinese Health
Statistical Digest 2008
Ministry of Health. Chinese Health Statistical Digest 2008.
14
Country Start year
End year
Type (INQ refers to a specialized
study)
Included in
modelling
Exclude-reason Source Reference
China 1997 1998 Miscellaneous YES NA Chinese Health
Statistical Digest 2004
Ministry of Health. Chinese Health Statistical Digest 2004.
China 1999 2000 Miscellaneous YES NA Chinese Health
Statistical Digest 2004
Ministry of Health. Chinese Health Statistical Digest 2004.
China 2000 2001 Miscellaneous YES NA Chinese Health
Statistical Digest 2008
Ministry of Health. Chinese Health Statistical Digest 2008.
China 2001 2002 Miscellaneous YES NA Chinese Health
Statistical Digest 2008
Ministry of Health. Chinese Health Statistical Digest 2008.
China 2002 2003 Miscellaneous YES NA Chinese Health
Statistical Digest 2008
Ministry of Health. Chinese Health Statistical Digest 2008.
China 2003 2004 Miscellaneous YES NA Chinese Health
Statistical Digest 2008
Ministry of Health. Chinese Health Statistical Digest 2008.
China 2004 2005 Miscellaneous YES NA Chinese Health
Statistical Digest 2008
Ministry of Health. Chinese Health Statistical Digest 2008.
China 2005 2006 Miscellaneous YES NA Chinese Health
Statistical Digest 2008
Ministry of Health. Chinese Health Statistical Digest 2008.
China 2006 2007 Miscellaneous YES NA Chinese Health
Statistical Digest 2008
Ministry of Health. Chinese Health Statistical Digest 2008.
15
Country Start year
End year
Type (INQ refers to a specialized
study)
Included in
modelling
Exclude-reason Source Reference
China 2007 2008 Miscellaneous YES NA Chinese Health
Statistical Digest 2008
Ministry of Health. Chinese Health Statistical Digest 2008.
China 2008 2009 Miscellaneous YES NA Chinese Health
Statistical Digest 2013
Ministry of Health. Chinese Health Statistical Digest 2013.
China 2009 2010 Miscellaneous YES NA Chinese Health
Statistical Digest 2013
Ministry of Health. Chinese Health Statistical Digest 2013.
China 2010 2011 Miscellaneous YES NA Chinese Health
Statistical Digest 2013
Ministry of Health. Chinese Health Statistical Digest 2013.
China 2011 2012 Miscellaneous YES NA Chinese Health
Statistical Digest 2013
Ministry of Health. Chinese Health Statistical Digest 2013.
China 2012 2013 Miscellaneous YES NA Chinese Health
Statistical Digest 2013
Ministry of Health. Chinese Health Statistical Digest 2013.
China 2004 2006 Miscellaneous YES NA Third Survey 2004-2005
China Third Retrospective Survey on Mortality 2004-2005 - summary.
Colombia 2002 2003 INQ YES NA Estudio la
Mortalidad Materna 2002
Ministerio de la Protección Social, DANE, UNPFA. Estudio la Mortalidad Maternal y Perinatal en Colombia en los Albores del sieglo XXI. Colombia; 2006.
Comoros 2005 2012 DHS YES NA DHS 2012
Direction Générale de la Statistique et de la Prospective (DGSP) Comores et ICF International. L'Enquête Démographique et de Santé et à Indicateurs Multiples de l’Union des Comores (EDSC-MICS 12). ICF International: Calverton, MD, USA; 2014.
16

Country Start year
End year
Type (INQ refers to a specialized
study)
Included in
modelling
Exclude-reason Source Reference
Congo 1998 2005 DHS YES NA DHS 2005 Centre Nationale de la Statistique et des Études Économiques (CNSEE) et ORC Macro. Enquête Démographique et de Santé du Congo 2005. Calverton, Maryland, USA: CNSEE et ORC Macro; 2006.
Congo 2004 2011 DHS YES NA DHS 2011-2012
Centre Nationale de la Statistique et des Études Économiques (CNSEE) [Congo] et ICF International. Enquête Démographique et de Santé du Congo (EDSC-II) 2011-2012. Calverton, Maryland, USA: CNSEE et ICF International; 2013.
Costa Rica 2003 2004 INQ YES NA BIRMM 2014 Ministerio de Salud, Instituto National de Estadística y Censos. Proceso de Busqueda Intencional y Reclasificación de Mortalidad Materna. Costa Rica; 2014.
Costa Rica 2004 2005 INQ YES NA BIRMM 2014 Ministerio de Salud, Instituto National de Estadística y Censos. Proceso de Busqueda Intencional y Reclasificación de Mortalidad Materna. Costa Rica; 2014.
Costa Rica 2005 2006 INQ YES NA BIRMM 2014 Ministerio de Salud, Instituto National de Estadística y Censos. Proceso de Busqueda Intencional y Reclasificación de Mortalidad Materna. Costa Rica; 2014.
Costa Rica 2006 2007 INQ YES NA BIRMM 2014 Ministerio de Salud, Instituto National de Estadística y Censos. Proceso de Busqueda Intencional y Reclasificación de Mortalidad Materna. Costa Rica; 2014.
Costa Rica 2007 2008 INQ YES NA BIRMM 2014 Ministerio de Salud, Instituto National de Estadística y Censos. Proceso de Busqueda Intencional y Reclasificación de Mortalidad Materna. Costa Rica; 2014.
Costa Rica 2008 2009 INQ YES NA BIRMM 2014 Ministerio de Salud, Instituto National de Estadística y Censos. Proceso de Busqueda Intencional y Reclasificación de Mortalidad Materna. Costa Rica; 2014.
Costa Rica 2009 2010 INQ YES NA BIRMM 2014 Ministerio de Salud, Instituto National de Estadística y Censos. Proceso de Busqueda Intencional y Reclasificación de Mortalidad Materna. Costa Rica; 2014.
17

Country Start year
End year
Type (INQ refers to a specialized
study)
Included in
modelling
Exclude-reason Source Reference
Costa Rica 2010 2011 INQ YES NA BIRMM 2014 Ministerio de Salud, Instituto National de Estadística y Censos. Proceso de Busqueda Intencional y Reclasificación de Mortalidad Materna. Costa Rica; 2014.
Costa Rica 2011 2012 INQ YES NA BIRMM 2014 Ministerio de Salud, Instituto National de Estadística y Censos. Proceso de Busqueda Intencional y Reclasificación de Mortalidad Materna. Costa Rica; 2014.
Costa Rica 2012 2013 INQ YES NA BIRMM 2014 Ministerio de Salud, Instituto National de Estadística y Censos. Proceso de Busqueda Intencional y Reclasificación de Mortalidad Materna. Costa Rica; 2014.
Côte d'Ivoire 1998 2005 AIS YES NA AIS 2005
Institut National de la Statistique (INS) et Ministère de la Lutte contre le Sida [Côte d’Ivoire] et ORC Macro. Enquête sur les Indicateurs du Sida, Côte d’Ivoire 2005. Calverton, Maryland, USA: INS et ORC Macro; 2006.
Côte d'Ivoire 1987 1994 DHS YES NA DHS 1994
Institut National de la Statistique, Ministère Délégué Auprès du Premier Ministre, Chargé de l'Economie, des Finances et du Plan, Macro International Inc. Enquête Démographique et de Santé 1994. Calverton, Maryland, USA: Macro International Inc.; 1995.
Côte d'Ivoire 2005 2012 DHS YES NA DHS 2011-2012
Institut National de la Statistique (INS) et ICF International. Enquête Démographique et de Santé et à Indicateurs Multiples de Côte d’Ivoire 2011-2012. Calverton, Maryland, USA: INS et ICF International; 2012.
Cuba 2012 2013 INQ YES NA MoH Ministry of Health; 2015.
Democratic People's Republic of Korea
2007 2008 Census NO MMEIG data assessment Census 2008
Democratic People's Republic of Korea. Korea Central Bureau of Statistics (2009); Country Consultation 2010.
Democratic Republic of the Congo
2000 2007 DHS YES NA DHS 2007 Ministère du Plan et Macro International. Enquête Démographique et de Santé, République Démocratique du Congo 2007. Calverton, Maryland, USA.: Ministère du Plan et Macro International; 2008.
18
Country Start year
End year
Type (INQ refers to a specialized
study)
Included in
modelling
Exclude-reason Source Reference
Democratic Republic of the Congo
2007 2014 DHS YES NA DHS 2013-2014
Ministère du Plan et Suivi de la Mise en Oeuvre de la Révolution de la Modernité (MPSMRM), Ministère de la Santé Publique (MSP) et ICF International. Enquête Démographique et de Santé en République Démocratique du Congo 2013-2014. Rockville, Maryland, USA : MPSMRM, MSP et ICF International; 2014.
Denmark 2002 2007 INQ YES NA
Maternal deaths in Denmark
2002-2006
Bodker B et al. Maternal Deaths in Denmark 2002-2006. Acta Obstet Gynecol Scand. 2009;88:556-562.
Denmark 1985 1995 INQ YES NA
Maternal Mortality in
Denmark 1985-1994
Andersen BR et al. Maternal Mortality in Denmark 1985-1994. Eur J Obstet Gyn-ol Reprod Biol. 2009; 42:124-8.
Dominican Republic 1999 2000 INQ YES NA
1999-2007 Registro de Vigilancia
Epidemiológica. 2008-2013 Registro de Estadísticas
Vitales
1999-2007 Registro de Vigilancia Epidemiológica. 2008-2013 Registro de Estadísticas Vitales (Certificado Médico de Defunción). Ministerio de Salud; 2015.
Dominican Republic 2000 2001 INQ YES NA
1999-2007 Registro de Vigilancia
Epidemiológica. 2008-2013 Registro de Estadísticas
Vitales
1999-2007 Registro de Vigilancia Epidemiológica. 2008-2013 Registro de Estadísticas Vitales (Certificado Médico de Defunción). Ministerio de Salud; 2015.
19

Country Start year
End year
Type (INQ refers to a specialized
study)
Included in
modelling
Exclude-reason Source Reference
Dominican Republic 2001 2002 INQ YES NA
1999-2007 Registro de Vigilancia
Epidemiológica. 2008-2013 Registro de Estadísticas
Vitales
1999-2007 Registro de Vigilancia Epidemiológica. 2008-2013 Registro de Estadísticas Vitales (Certificado Médico de Defunción). Ministerio de Salud; 2015.
Dominican Republic 2002 2003 INQ YES NA
1999-2007 Registro de Vigilancia
Epidemiológica. 2008-2013 Registro de Estadísticas
Vitales
1999-2007 Registro de Vigilancia Epidemiológica. 2008-2013 Registro de Estadísticas Vitales (Certificado Médico de Defunción). Ministerio de Salud; 2015.
Dominican Republic 2003 2004 INQ YES NA
1999-2007 Registro de Vigilancia
Epidemiológica. 2008-2013 Registro de Estadísticas
Vitales
1999-2007 Registro de Vigilancia Epidemiológica. 2008-2013 Registro de Estadísticas Vitales (Certificado Médico de Defunción). Ministerio de Salud; 2015.
Dominican Republic 2004 2005 INQ YES NA
1999-2007 Registro de Vigilancia
Epidemiológica. 2008-2013 Registro de Estadísticas
Vitales
1999-2007 Registro de Vigilancia Epidemiológica. 2008-2013 Registro de Estadísticas Vitales (Certificado Médico de Defunción). Ministerio de Salud; 2015.
20

Country Start year
End year
Type (INQ refers to a specialized
study)
Included in
modelling
Exclude-reason Source Reference
Dominican Republic 2005 2006 INQ YES NA
1999-2007 Registro de Vigilancia
Epidemiológica. 2008-2013 Registro de Estadísticas
Vitales
1999-2007 Registro de Vigilancia Epidemiológica. 2008-2013 Registro de Estadísticas Vitales (Certificado Médico de Defunción). Ministerio de Salud; 2015.
Dominican Republic 2006 2007 INQ YES NA
1999-2007 Registro de Vigilancia
Epidemiológica. 2008-2013 Registro de Estadísticas
Vitales
1999-2007 Registro de Vigilancia Epidemiológica. 2008-2013 Registro de Estadísticas Vitales (Certificado Médico de Defunción). Ministerio de Salud; 2015.
Dominican Republic 2007 2008 INQ YES NA
1999-2007 Registro de Vigilancia
Epidemiológica. 2008-2013 Registro de Estadísticas
Vitales
1999-2007 Registro de Vigilancia Epidemiológica. 2008-2013 Registro de Estadísticas Vitales (Certificado Médico de Defunción). Ministerio de Salud; 2015.
Dominican Republic 2008 2009 INQ YES NA
1999-2007 Registro de Vigilancia
Epidemiológica. 2008-2013 Registro de Estadísticas
Vitales
1999-2007 Registro de Vigilancia Epidemiológica. 2008-2013 Registro de Estadísticas Vitales (Certificado Médico de Defunción). Ministerio de Salud; 2015.
21

Country Start year
End year
Type (INQ refers to a specialized
study)
Included in
modelling
Exclude-reason Source Reference
Dominican Republic 2009 2010 INQ YES NA
1999-2007 Registro de Vigilancia
Epidemiológica. 2008-2013 Registro de Estadísticas
Vitales
1999-2007 Registro de Vigilancia Epidemiológica. 2008-2013 Registro de Estadísticas Vitales (Certificado Médico de Defunción). Ministerio de Salud; 2015.
Dominican Republic 2010 2011 INQ YES NA
1999-2007 Registro de Vigilancia
Epidemiológica. 2008-2013 Registro de Estadísticas
Vitales
1999-2007 Registro de Vigilancia Epidemiológica. 2008-2013 Registro de Estadísticas Vitales (Certificado Médico de Defunción). Ministerio de Salud; 2015.
Dominican Republic 2011 2012 INQ YES NA
1999-2007 Registro de Vigilancia
Epidemiológica. 2008-2013 Registro de Estadísticas
Vitales
1999-2007 Registro de Vigilancia Epidemiológica. 2008-2013 Registro de Estadísticas Vitales (Certificado Médico de Defunción). Ministerio de Salud; 2015.
Dominican Republic 2012 2013 INQ YES NA
1999-2007 Registro de Vigilancia
Epidemiológica. 2008-2013 Registro de Estadísticas
Vitales
1999-2007 Registro de Vigilancia Epidemiológica. 2008-2013 Registro de Estadísticas Vitales (Certificado Médico de Defunción). Ministerio de Salud; 2015.
22

Country Start year
End year
Type (INQ refers to a specialized
study)
Included in
modelling
Exclude-reason Source Reference
Dominican Republic 2013 2014 INQ YES NA
1999-2007 Registro de Vigilancia
Epidemiológica. 2008-2013 Registro de Estadísticas
Vitales
1999-2007 Registro de Vigilancia Epidemiológica. 2008-2013 Registro de Estadísticas Vitales (Certificado Médico de Defunción). Ministerio de Salud; 2015.
Dominican Republic 1995 2002 DHS YES NA DHS 2002
Centro de Estudios Sociales y Demográficos (CESDEM), Secretaría de Estado de Salud, Pública y Asistencia Social (SESPAS), ORC Macro. Encuesta Demográfica y de Salud 2002 (ENDESA 2002). Calverton, Maryland, USA: ORC Macro; 2003.
Dominican Republic 2000 2007 DHS YES NA DHS 2007
Centro de Estudios Sociales y Demográficos (CESDEM) y Macro International Inc. Encuesta Demográfica y de Salud 2007. Santo Domingo, República Dominicana: CESDEM y Macro International Inc.; 2008.
Ecuador 2008 2009 INQ YES NA
La vigilancia epidemiológic
a de la mortalidad
materna en el Ecuador años 2002 al 2011
Dirección Nacional de Vigilancia Epidemiológica. La vigilancia epidemiológica de la mortalidad materna en el Ecuador años 2002 al 2011. Ecuador; 2013.
Ecuador 2009 2010 INQ YES NA
La vigilancia epidemiológic
a de la mortalidad
materna en el Ecuador años 2002 al 2011
Dirección Nacional de Vigilancia Epidemiológica. La vigilancia epidemiológica de la mortalidad materna en el Ecuador años 2002 al 2011. Ecuador; 2013.
23

Country Start year
End year
Type (INQ refers to a specialized
study)
Included in
modelling
Exclude-reason Source Reference
Ecuador 2010 2011 INQ YES NA
La vigilancia epidemiológic
a de la mortalidad
materna en el Ecuador años 2002 al 2011
Dirección Nacional de Vigilancia Epidemiológica. La vigilancia epidemiológica de la mortalidad materna en el Ecuador años 2002 al 2011. Ecuador; 2013.
Ecuador 2011 2012 INQ YES NA
La vigilancia epidemiológic
a de la mortalidad
materna en el Ecuador años 2002 al 2011
Dirección Nacional de Vigilancia Epidemiológica. La vigilancia epidemiológica de la mortalidad materna en el Ecuador años 2002 al 2011. Ecuador; 2013.
Ecuador 2012 2013 INQ YES NA
La vigilancia epidemiológic
a de la mortalidad
materna en el Ecuador 2012-
2013
Dirección Nacional de Vigilancia Epidemiológica. La vigilancia epidemiológica de la mortalidad materna en el Ecuador 2012-2013. Ecuador; 2015.
Ecuador 2013 2014 INQ YES NA
La vigilancia epidemiológic
a de la mortalidad
materna en el Ecuador 2012-
2013
Dirección Nacional de Vigilancia Epidemiológica. La vigilancia epidemiológica de la mortalidad materna en el Ecuador 2012-2013. Ecuador; 2015.
Ecuador 1987 1994 RHS+ YES NA RHS 1994
Centro de Estudios de Población y Paternidad Responsable (CEPAR), División de Salud Reproductiva de los Centros para el Control de Enfermedades (CDC). Encuesta de Salud Materna e Infantil (ENDEMAIN-94). Quito, Ecuador; 1995.
24
Country Start year
End year
Type (INQ refers to a specialized
study)
Included in
modelling
Exclude-reason Source Reference
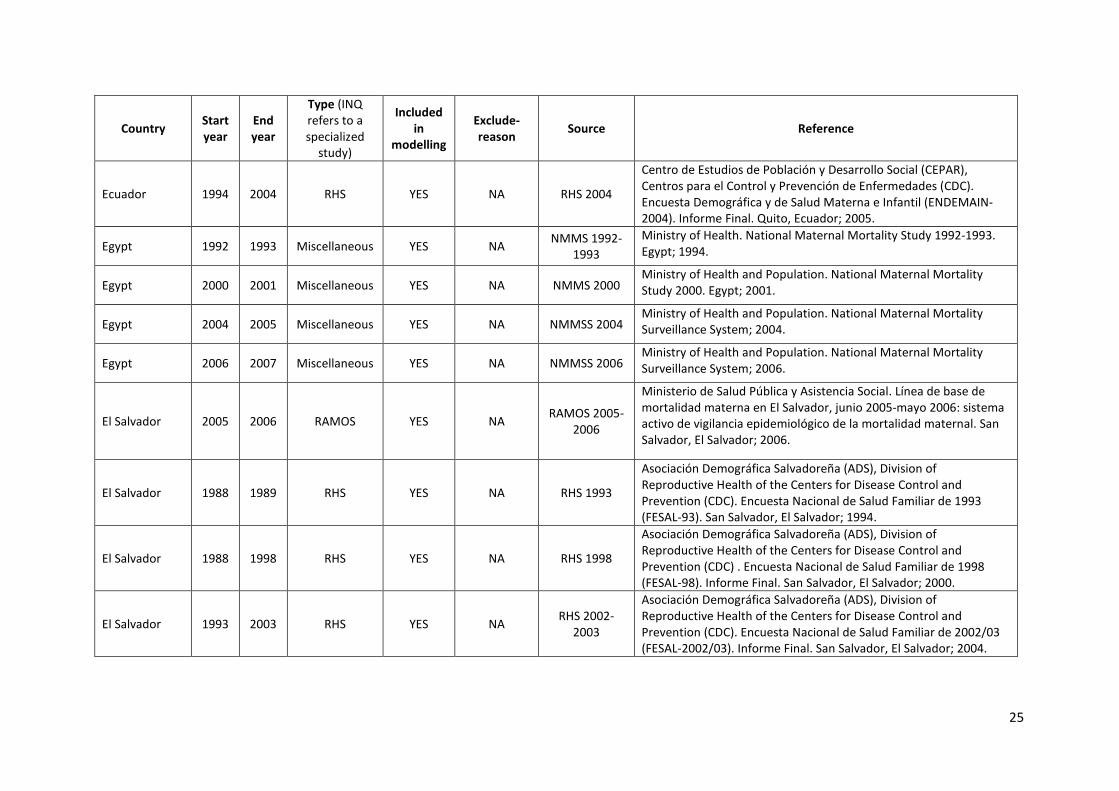
Ecuador 1994 2004 RHS YES NA RHS 2004
Centro de Estudios de Población y Desarrollo Social (CEPAR), Centros para el Control y Prevención de Enfermedades (CDC). Encuesta Demográfica y de Salud Materna e Infantil (ENDEMAIN-2004). Informe Final. Quito, Ecuador; 2005.
Egypt 1992 1993 Miscellaneous YES NA NMMS 1992-1993
Ministry of Health. National Maternal Mortality Study 1992-1993. Egypt; 1994.
Egypt 2000 2001 Miscellaneous YES NA NMMS 2000 Ministry of Health and Population. National Maternal Mortality Study 2000. Egypt; 2001.
Egypt 2004 2005 Miscellaneous YES NA NMMSS 2004 Ministry of Health and Population. National Maternal Mortality Surveillance System; 2004.
Egypt 2006 2007 Miscellaneous YES NA NMMSS 2006 Ministry of Health and Population. National Maternal Mortality Surveillance System; 2006.
El Salvador 2005 2006 RAMOS YES NA RAMOS 2005-2006
Ministerio de Salud Pública y Asistencia Social. Línea de base de mortalidad materna en El Salvador, junio 2005-mayo 2006: sistema activo de vigilancia epidemiológico de la mortalidad maternal. San Salvador, El Salvador; 2006.
El Salvador 1988 1989 RHS YES NA RHS 1993
Asociación Demográfica Salvadoreña (ADS), Division of Reproductive Health of the Centers for Disease Control and Prevention (CDC). Encuesta Nacional de Salud Familiar de 1993 (FESAL-93). San Salvador, El Salvador; 1994.
El Salvador 1988 1998 RHS YES NA RHS 1998
Asociación Demográfica Salvadoreña (ADS), Division of Reproductive Health of the Centers for Disease Control and Prevention (CDC) . Encuesta Nacional de Salud Familiar de 1998 (FESAL-98). Informe Final. San Salvador, El Salvador; 2000.
El Salvador 1993 2003 RHS YES NA RHS 2002-2003
Asociación Demográfica Salvadoreña (ADS), Division of Reproductive Health of the Centers for Disease Control and Prevention (CDC). Encuesta Nacional de Salud Familiar de 2002/03 (FESAL-2002/03). Informe Final. San Salvador, El Salvador; 2004.
25

Country Start year
End year
Type (INQ refers to a specialized
study)
Included in
modelling
Exclude-reason Source Reference
El Salvador 2008 2009 Miscellaneous YES NA MoH 2009 Ministry of Health. Surveillance (Programa Nacional sobre Maternidad Segura). 2009.
El Salvador 2007 2008 Miscellaneous YES NA MoH 2009 Ministry of Health. Surveillance (Programa Nacional sobre Maternidad Segura). 2009.
El Salvador 2006 2007 Census YES NA Census 2007 Presentation slides by El Salvador National Statistics Office Census and Health.
Equatorial Guinea 2001 2011 DHS YES NA DHS 2011
Ministerio de Sanidad y Bienestar Social, Ministerio de Economía, Planificación e Inversiones Públicas, e ICF International. Encuesta Demográfica y de Salud (EDSGE-I) 2011. Calverton, Maryland, USA; 2012.
Eritrea 1985 1995 DHS YES NA DHS 1995 National Statistics Office [Eritrea] and Macro International Inc. Eritrea Demographic and Health Survey, 1995. Calverton, Maryland: National Statistics Office and Macro International Inc.; 1997.
Eritrea 2005 2010 PHS YES NA PHS 2010
National Statistics Office (NSO) [Eritrea] and Fafo AIS. Eritrea Population and Health Survey 2010. Asmara, Eritrea: National Statistics Office and Fafo Institute for Appled International Studies; 2013.
Ethiopia 1993 2000 DHS YES NA DHS 2000
Central Statistical Authority [Ethiopia] and ORC Macro. Ethiopia Demographic and Health Survey 2000. Addis Ababa, Ethiopia and Calverton, Maryland, USA: Central Statistical Authority and ORC Macro; 2001.
Ethiopia 1998 2005 DHS YES NA DHS 2005 Central Statistical Agency, and ORC Macro. Ethiopia Demographic and Health Survey 2005. Addis Ababa, Ethiopia and Calverton, Maryland, USA: Central Statistical Agency and ORC Macro; 2006.
Ethiopia 2004 2011 DHS YES NA DHS 2011
Central Statistical Agency [Ethiopia] and ICF International. Ethiopia Demographic and Health Survey 2011. Addis Ababa, Ethiopia and Calverton, Maryland, USA: Central Statistical Agency and ICF International; 2012.
26
Country Start year
End year
Type (INQ refers to a specialized
study)
Included in
modelling
Exclude-reason Source Reference
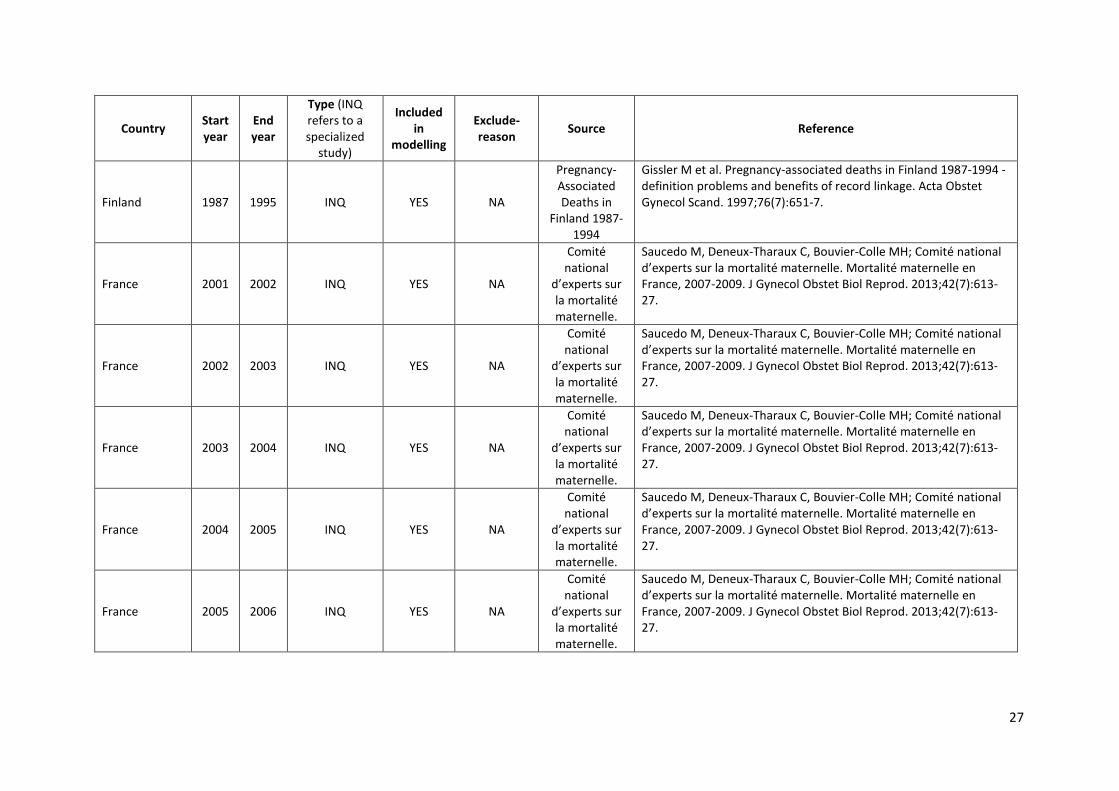
Finland 1987 1995 INQ YES NA
Pregnancy-Associated Deaths in
Finland 1987-1994
Gissler M et al. Pregnancy-associated deaths in Finland 1987-1994 - definition problems and benefits of record linkage. Acta Obstet Gynecol Scand. 1997;76(7):651-7.
France 2001 2002 INQ YES NA
Comité national
d’experts sur la mortalité maternelle.
Saucedo M, Deneux-Tharaux C, Bouvier-Colle MH; Comité national d’experts sur la mortalité maternelle. Mortalité maternelle en France, 2007-2009. J Gynecol Obstet Biol Reprod. 2013;42(7):613-27.
France 2002 2003 INQ YES NA
Comité national
d’experts sur la mortalité maternelle.
Saucedo M, Deneux-Tharaux C, Bouvier-Colle MH; Comité national d’experts sur la mortalité maternelle. Mortalité maternelle en France, 2007-2009. J Gynecol Obstet Biol Reprod. 2013;42(7):613-27.
France 2003 2004 INQ YES NA
Comité national
d’experts sur la mortalité maternelle.
Saucedo M, Deneux-Tharaux C, Bouvier-Colle MH; Comité national d’experts sur la mortalité maternelle. Mortalité maternelle en France, 2007-2009. J Gynecol Obstet Biol Reprod. 2013;42(7):613-27.
France 2004 2005 INQ YES NA
Comité national
d’experts sur la mortalité maternelle.
Saucedo M, Deneux-Tharaux C, Bouvier-Colle MH; Comité national d’experts sur la mortalité maternelle. Mortalité maternelle en France, 2007-2009. J Gynecol Obstet Biol Reprod. 2013;42(7):613-27.
France 2005 2006 INQ YES NA
Comité national
d’experts sur la mortalité maternelle.
Saucedo M, Deneux-Tharaux C, Bouvier-Colle MH; Comité national d’experts sur la mortalité maternelle. Mortalité maternelle en France, 2007-2009. J Gynecol Obstet Biol Reprod. 2013;42(7):613-27.
27

Country Start year
End year
Type (INQ refers to a specialized
study)
Included in
modelling
Exclude-reason Source Reference
France 2006 2007 INQ YES NA
Comité national
d’experts sur la mortalité maternelle.
Saucedo M, Deneux-Tharaux C, Bouvier-Colle MH; Comité national d’experts sur la mortalité maternelle. Mortalité maternelle en France, 2007-2009. J Gynecol Obstet Biol Reprod. 2013;42(7):613-27
France 2007 2008 INQ YES NA
Comité national
d’experts sur la mortalité maternelle.
Saucedo M, Deneux-Tharaux C, Bouvier-Colle MH; Comité national d’experts sur la mortalité maternelle. Mortalité maternelle en France, 2007-2009. J Gynecol Obstet Biol Reprod. 2013;42(7):613-27.
France 2008 2009 INQ YES NA
Comité national
d’experts sur la mortalité maternelle.
Saucedo M, Deneux-Tharaux C, Bouvier-Colle MH; Comité national d’experts sur la mortalité maternelle. Mortalité maternelle en France, 2007-2009. J Gynecol Obstet Biol Reprod. 2013;42(7):613-27.
France 2009 2010 INQ YES NA
Comité national
d’experts sur la mortalité maternelle.
Saucedo M, Deneux-Tharaux C, Bouvier-Colle MH; Comité national d’experts sur la mortalité maternelle. Mortalité maternelle en France, 2007-2009. J Gynecol Obstet Biol Reprod. 2013;42(7):613-27.
Gabon 1993 2000 DHS YES NA DHS 2000
Direction Générale de la Statistique et des Études Économiques (DGSEE) [Gabon] et ORC Macro. Enquête Démographique et de Santé Gabon 2000. Calverton, Maryland: Direction Générale de la Statistique et des Études Économiques, et Fonds des Nations Unies pour la Populations, et ORC Macro; 2001.
Gabon 2005 2012 DHS YES NA DHS 2012 Direction Générale de la Statistique (DGS) et ICF International. Enquête Démographique et de Santé du Gabon 2012. Calverton, Maryland, et Libreville, Gabon: DGS et ICF International; 2013.
Gambia 2006 2013 DHS YES NA DHS 2013 The Gambia Bureau of Statistics (GBOS) and ICF International. The Gambia Demographic and HealthSurvey 2013. Banjul, The Gambia, and Rockville, Maryland, USA: GBOS and ICF International; 2014.
28

Country Start year
End year
Type (INQ refers to a specialized
study)
Included in
modelling
Exclude-reason Source Reference
Georgia 2006 2007 RAMOS YES NA RAMOS 2008
Serbanescu F, Tefft M, Shakhnazarova M, Williams D, Berdzuli N, Berg C. Reproductive Age Mortality Study, Georgia, 2008 - Part II: Maternal Mortality, Atlanta, GA, USA: Georgian National Center for Disease Control, JSI Research, Training Institute, Inc (JSI) and CDC; 2009.
Georgia 2012 2013 RAMOS YES NA RAMOS 2014 Georgia Reproductive Age Mortality Study (RAMOS) 2014. Executive Summary; 2014.
Ghana 2000 2007 MHS YES NA MHS 2007
Ghana Statistical Service (GSS), Ghana Health Service (GHS), and Macro International. Ghana Maternal Health Survey 2007. Calverton, Maryland, USA: GSS, GHS, and Macro International; 2009.
Ghana 2009 2010 Census YES NA Census 2010 Population and Housing Census Summary Report of Final Results (2012).
Guatemala 1989 1990 INQ YES NA Maternal mortality
1996-1998
Schieber B, Stanton C. Estimación de la Mortalidad Materna en Guatemala Período 1996 -1998. Guatemala; 2000.
Guatemala 1996 1997 INQ YES NA Maternal mortality
1996-1998
Schieber B, Stanton C. Estimación de la Mortalidad Materna en Guatemala Período 1996 -1998. Guatemala; 2000.
Guatemala 1997 1998 INQ YES NA Maternal mortality
1996-1998
Schieber B, Stanton C. Estimación de la Mortalidad Materna en Guatemala Período 1996 -1998. Guatemala; 2000.
Guatemala 1998 1999 INQ YES NA Maternal mortality
1996-1998
Schieber B, Stanton C. Estimación de la Mortalidad Materna en Guatemala Período 1996 -1998. Guatemala; 2000.
Guatemala 2000 2001 INQ YES NA Maternal mortality 2000
Ministerio de Salud Pública y Asistencia Social. Línea Basal de Mortalidad Materna para el Año 2000. Informe Final. Guatemala; 2003.
29

Country Start year
End year
Type (INQ refers to a specialized
study)
Included in
modelling
Exclude-reason Source Reference
Guatemala 2007 2008 INQ YES NA Maternal mortality 2007
Secretaría de Planificación y Programación de la Presidencia, Ministerio de Salud Pública y Asistencia Social. Estudio Nacional de Mortalidad Materna. Informe Final. Guatemala; 2011.
Guatemala 2013 2014 INQ YES NA Maternal mortality 2013
Ministerio de Salud Pública y Asistencia Social. Situación de la Mortalidad Materna. Informe de País 2013. Guatemala; 2014.
Guatemala 1985 1990 DHS YES NA DHS 1995 Instituto Nacional de Estadística (INE), Macro International Inc. Guatemala Encuesta Nacional de Salud Materno Infantil 1995. Calverton, Maryland, USA: Macro International Inc.; 1996.
Guatemala 1990 1995 DHS YES NA DHS 1995
Instituto Nacional de Estadística (INE), Macro International Inc. Guatemala Encuesta Nacional de Salud Materno Infantil 1995. Calverton, Maryland, USA: Macro International Inc.; 1996.
Guinea 1992 1999 DHS YES NA DHS 1999
Direction Nationale de la Statistique [Guinée] et Macro International Inc. Enquête Démographique et de Santé, Guinée 1999. Calverton, Maryland USA: Direction Nationale de la Statistique et Macro International Inc.; 2000.
Guinea 1998 2005 DHS YES NA DHS 2005 Direction Nationale de la Statistique (DNS) (Guinée) et ORC Macro. Enquête Démographique et de Santé, Guinée 2005. Calverton, Maryland, USA: DNS et ORC Macro; 2006.
Guinea 2005 2012 DHS YES NA DHS 2012
Institut National de la Statistique, Ministère du Plan Ministère d’Etat de la Santé et de l’Hygiène Publique Conakry, Guinée Measure DHS. Enquête Démographique et de Santé et à Indicateurs Multiples (EDS-MICS-IV) Guinée 2012. ICF International Calverton, Maryland, U.S.A; 2013.
Guinea-Bissau 2008 2009 Census NO MMEIG data assessment Census 2009
Guinea-Bissau National Statistics Office.Tema Mortalidade III RGPH/2009.
30
Country Start year
End year
Type (INQ refers to a specialized
study)
Included in
modelling
Exclude-reason Source Reference
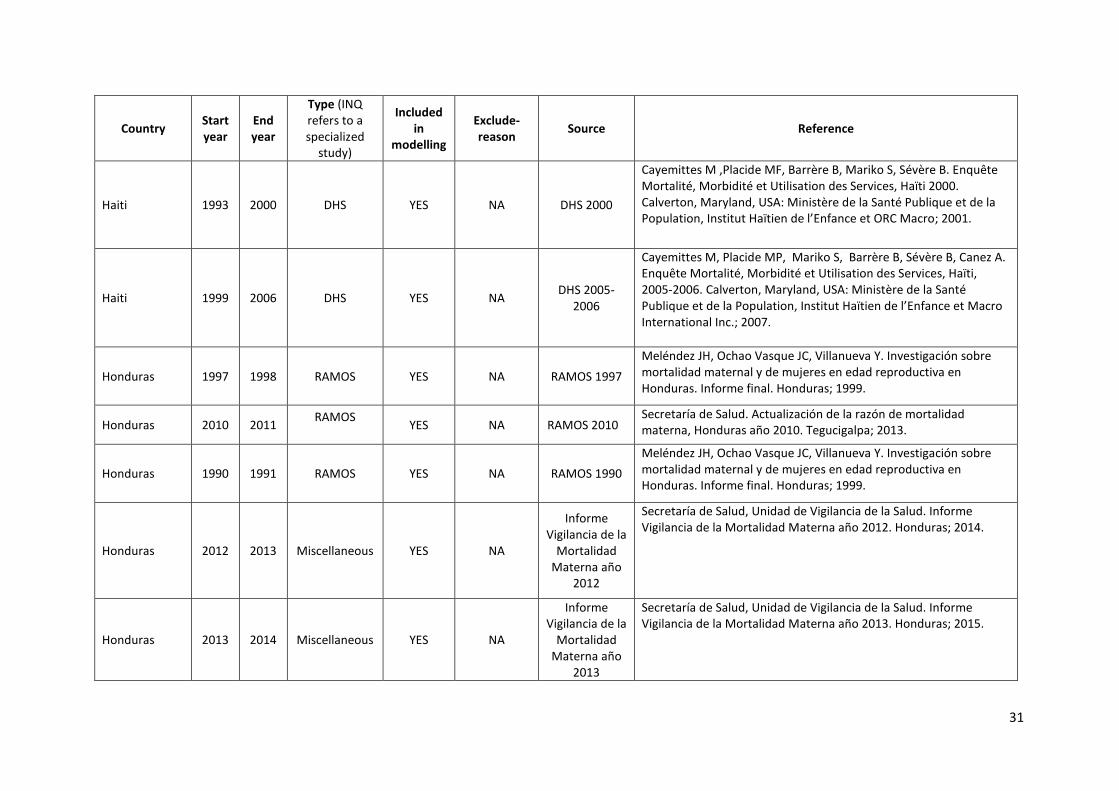
Haiti 1993 2000 DHS YES NA DHS 2000
Cayemittes M ,Placide MF, Barrère B, Mariko S, Sévère B. Enquête Mortalité, Morbidité et Utilisation des Services, Haïti 2000. Calverton, Maryland, USA: Ministère de la Santé Publique et de la Population, Institut Haïtien de l’Enfance et ORC Macro; 2001.
Haiti 1999 2006 DHS YES NA DHS 2005-2006
Cayemittes M, Placide MP, Mariko S, Barrère B, Sévère B, Canez A. Enquête Mortalité, Morbidité et Utilisation des Services, Haïti, 2005-2006. Calverton, Maryland, USA: Ministère de la Santé Publique et de la Population, Institut Haïtien de l’Enfance et Macro International Inc.; 2007.
Honduras 1997 1998 RAMOS YES NA RAMOS 1997 Meléndez JH, Ochao Vasque JC, Villanueva Y. Investigación sobre mortalidad maternal y de mujeres en edad reproductiva en Honduras. Informe final. Honduras; 1999.
Honduras 2010 2011 RAMOS YES NA RAMOS 2010
Secretaría de Salud. Actualización de la razón de mortalidad materna, Honduras año 2010. Tegucigalpa; 2013.
Honduras 1990 1991 RAMOS YES NA RAMOS 1990 Meléndez JH, Ochao Vasque JC, Villanueva Y. Investigación sobre mortalidad maternal y de mujeres en edad reproductiva en Honduras. Informe final. Honduras; 1999.
Honduras 2012 2013 Miscellaneous YES NA
Informe Vigilancia de la
Mortalidad Materna año
2012
Secretaría de Salud, Unidad de Vigilancia de la Salud. Informe Vigilancia de la Mortalidad Materna año 2012. Honduras; 2014.
Honduras 2013 2014 Miscellaneous YES NA
Informe Vigilancia de la
Mortalidad Materna año
2013
Secretaría de Salud, Unidad de Vigilancia de la Salud. Informe Vigilancia de la Mortalidad Materna año 2013. Honduras; 2015.
31

Country Start year
End year
Type (INQ refers to a specialized
study)
Included in
modelling
Exclude-reason Source Reference
Honduras 2000 2001 Census YES NA Census 2001 National Institute of Statistics. Honduras Population and Housing Census 2001. Honduras: 2002.
India 2011 2014 Miscellaneous YES NA Maternal Mortality
2011-2013
Office of Register General. Maternal Mortality Ratio Bulletin 2011-13. India; 2015.
India 2010 2013 Miscellaneous YES NA Maternal Mortality
2010-2012
Office of Register General. Special Bulletin on Maternal Mortality in India 2010-2012. India; 2013.
India 2007 2010 Miscellaneous YES NA Maternal Mortality
2007-2009
Office of Register General. Special Bulletin on Maternal Mortality in India 2007-2009. India; 2011.
India 2004 2007 Miscellaneous YES NA Maternal Mortality
2004-2006
Office of Register General. Special Bulletin on Maternal Mortality in India 2004-2006. India; 2009.
India 1997 1999 Miscellaneous YES NA Maternal Mortality
1997-1998
Register General of India. Maternal Mortality in India: 1997-2003. Trends, Causes and Risk Factors. New Delhi; 2006.
India 1999 2002 Miscellaneous YES NA Maternal Mortality
1999-2001
Register General of India. Maternal Mortality in India: 1997-2003. Trends, Causes and Risk Factors. New Delhi; 2006.
India 1998 2000 NFHS YES NA NFHS-2: 1998-99
International Institute for Population Sciences (IIPS) and ORC Macro. National Family Health Survey (NFHS-2), 1998-99: India. Mumbai: IIPS; 2000.
India 2001 2004 Miscellaneous YES NA Million Death Study 2001-
2003
Register General of India. Maternal Mortality in India: 1997-2003. Trends, Causes and Risk Factors. New Delhi; 2006.
India 1991 1993 NFHS YES NA NFHS-1: 1992-93
International Institute for Population Sciences (IIPS). National Family Health Survey (MCH and Family Planning), India 1992-93. Mumbai: IIPS; 1995.
32

Country Start year
End year
Type (INQ refers to a specialized
study)
Included in
modelling
Exclude-reason Source Reference
Indonesia 1987 1994 DHS YES NA DHS 1994
Central Bureau of Statistics (CBS) [Indonesia] and State Ministry of Population/National Family Planning Coordinating Board (NFPCB) and Ministry of Health (MOH) and Macro International Inc. (MI). Indonesia Demographic and Health Survey 1994. Calverton, Maryland: CBS and MI; 1995.
Indonesia 1996 2003 DHS YES NA DHS 2002-2003
Badan Pusat Statistik-Statistics Indonesia (BPS) and ORC Macro. Indonesia Demographic and Health Survey 2002-2003. Calverton, Maryland, USA: BPS and ORC Macro; 2003.
Indonesia 2000 2007 DHS YES NA DHS 2007 Statistics Indonesia (Badan Pusat Statistik-BPS) and Macro International. Indonesia Demographic and Health Survey 2007. Calverton, Maryland, USA: BPS and Macro International; 2008.
Indonesia 2005 2012 DHS YES NA DHS 2012
Statistics Indonesia (Badan Pusat Statistik—BPS), National Population and Family Planning Board (BKKBN), and Kementerian Kesehatan (Kemenkes—MOH), and ICF International. Indonesia Demographic and Health Survey 2012. Jakarta, Indonesia: BPS, BKKBN, Kemenkes, and ICF International; 2013.
Iran 2002 2003 Miscellaneous YES NA Surveillance System
Ministry of Health. Maternal Mortality Surveillance System. Iran; 2015.
Iran 2003 2004 Miscellaneous YES NA Surveillance System
Ministry of Health. Maternal Mortality Surveillance System. Iran; 2015.
Iran 2004 2005 Miscellaneous YES NA Surveillance System
Ministry of Health. Maternal Mortality Surveillance System. Iran; 2015.
Iran 2005 2006 Miscellaneous YES NA Surveillance System
Ministry of Health. Maternal Mortality Surveillance System. Iran; 2015.
Iran 2006 2007 Miscellaneous YES NA Surveillance System
Ministry of Health. Maternal Mortality Surveillance System. Iran; 2015.
Iran 2007 2008 Miscellaneous YES NA Surveillance System
Ministry of Health. Maternal Mortality Surveillance System. Iran; 2015.
33

Country Start year
End year
Type (INQ refers to a specialized
study)
Included in
modelling
Exclude-reason Source Reference
Iran 2008 2009 Miscellaneous YES NA Surveillance System
Ministry of Health. Maternal Mortality Surveillance System. Iran; 2015.
Iran 2009 2010 Miscellaneous YES NA Surveillance System
Ministry of Health. Maternal Mortality Surveillance System. Iran; 2015.
Iran 2010 2011 Miscellaneous YES NA Surveillance System
Ministry of Health. Maternal Mortality Surveillance System. Iran; 2015.
Iran 2011 2012 Miscellaneous YES NA Surveillance System
Ministry of Health. Maternal Mortality Surveillance System. Iran; 2015.
Iran 2012 2013 Miscellaneous YES NA Surveillance System
Ministry of Health. Maternal Mortality Surveillance System. Iran; 2015.
Iran 2013 2014 Miscellaneous YES NA Surveillance System
Ministry of Health. Maternal Mortality Surveillance System. Iran; 2015.
Iran 1995 1996 Census YES NA Census 1996 Statistical Centre of Iran. Iran Population and Housing Census 1996.
Iran; 1997.
Iraq 2001 2006 FHS YES NA FHS 2006-2007
Ministry of Health, Ministry of Planning and Development Cooperation, WHO. Iraq Family Health Survey 2006-2007. Iraq; 2008.
Iraq 2011 2013 Miscellaneous YES NA IPMM-Iraq 2011-2012
CSO Iraq. Povery Map Maternal Mortality 2011-2012. Iraq; 2014.
Iraq 1992 2007 FHS YES NA IFHS 2006-2007
Ministry of Health, Ministry of Planning and Development Cooperation, WHO. Iraq Family Health Survey 2006-2007. Iraq; 2008.
Iraq 1990 1999 ICMMS YES NA ICMMS 1999 Ministry of Health. Iraq Child and Maternal Mortality Survey 1999. Iraq; 2000.
Iraq 2002 2007 FHS YES NA IFHS 2006-2007
Ministry of Health, Ministry of Planning and Development Cooperation, WHO. Iraq Family Health Survey 2006-2007. Iraq; 2008.
Ireland 2009 2011 INQ YES NA MDE 2009-2011
Confidential Maternal Death Enquiry in Ireland, Report for Triennium 2009-2011, Cork: MDE; 2012.
34
Country Start year
End year
Type (INQ refers to a specialized
study)
Included in
modelling
Exclude-reason Source Reference
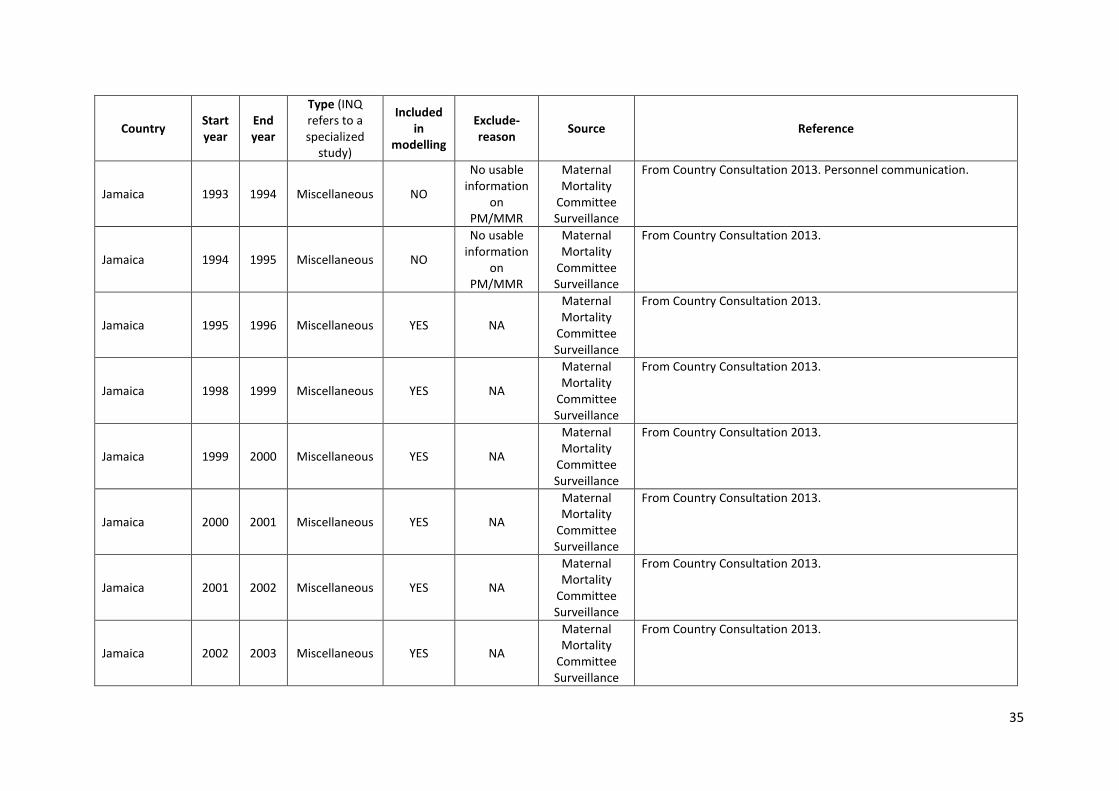
Jamaica 1993 1994 Miscellaneous NO
No usable information
on PM/MMR
Maternal Mortality
Committee Surveillance
From Country Consultation 2013. Personnel communication.
Jamaica 1994 1995 Miscellaneous NO
No usable information
on PM/MMR
Maternal Mortality
Committee Surveillance
From Country Consultation 2013.
Jamaica 1995 1996 Miscellaneous YES NA
Maternal Mortality
Committee Surveillance
From Country Consultation 2013.
Jamaica 1998 1999 Miscellaneous YES NA
Maternal Mortality
Committee Surveillance
From Country Consultation 2013.
Jamaica 1999 2000 Miscellaneous YES NA
Maternal Mortality
Committee Surveillance
From Country Consultation 2013.
Jamaica 2000 2001 Miscellaneous YES NA
Maternal Mortality
Committee Surveillance
From Country Consultation 2013.
Jamaica 2001 2002 Miscellaneous YES NA
Maternal Mortality
Committee Surveillance
From Country Consultation 2013.
Jamaica 2002 2003 Miscellaneous YES NA
Maternal Mortality
Committee Surveillance
From Country Consultation 2013.
35

Country Start year
End year
Type (INQ refers to a specialized
study)
Included in
modelling
Exclude-reason Source Reference
Jamaica 2003 2004 Miscellaneous YES NA
Maternal Mortality
Committee Surveillance
From Country Consultation 2013.
Jamaica 2004 2005 Miscellaneous YES NA
Maternal Mortality
Committee Surveillance
From Country Consultation 2013.
Jamaica 2005 2006 Miscellaneous YES NA
Maternal Mortality
Committee Surveillance
From Country Consultation 2013.
Jamaica 2006 2007 Miscellaneous YES NA
Maternal Mortality
Committee Surveillance
From Country Consultation 2013.
Jamaica 2007 2008 Miscellaneous YES NA
Maternal Mortality
Committee Surveillance
From Country Consultation 2013.
Jamaica 2008 2009 Miscellaneous YES NA
Maternal Mortality
Committee Surveillance
From Country Consultation 2013.
Jamaica 2009 2010 Miscellaneous YES NA
Maternal Mortality
Committee Surveillance
From Country Consultation 2013.
Jamaica 2010 2011 Miscellaneous YES NA
Maternal Mortality
Committee Surveillance
From Country Consultation 2013.
36

Country Start year
End year
Type (INQ refers to a specialized
study)
Included in
modelling
Exclude-reason Source Reference
Jamaica 2011 2012 Miscellaneous YES NA
Maternal Mortality
Committee Surveillance
From Country Consultation 2013.
Jamaica 2012 2013 Miscellaneous YES NA
Maternal Mortality
Committee Surveillance
From Country Consultation 2013.
Jamaica 1986 1987 Miscellaneous NO
No usable information
on PM/MMR
Maternal Mortality
Committee Surveillance
From Country Consultation 2013.
Japan 2005 2006 INQ YES NA
Causes and ratio of
maternal mortality, and its reliability,
2005.
Hidaka A. et al. [Causes and ratio of maternal mortality, and its reliability]. Sanfujinkachiryou [Treatment in Obstetrics and Gynecology]. 2009;99(1):85-C95. [In Japanese].
Jordan 2007 2009 INQ YES NA NMMS 2007-2008
The Higher Population Council. The National Maternal Mortality Study Jordan (2007-2008). Jordan; 2009.
Jordan 1995 1996 INQ YES NA NMMS 1995-1996
National Maternal Mortality Study Jordan 1995-1996. Jordan; 1997.
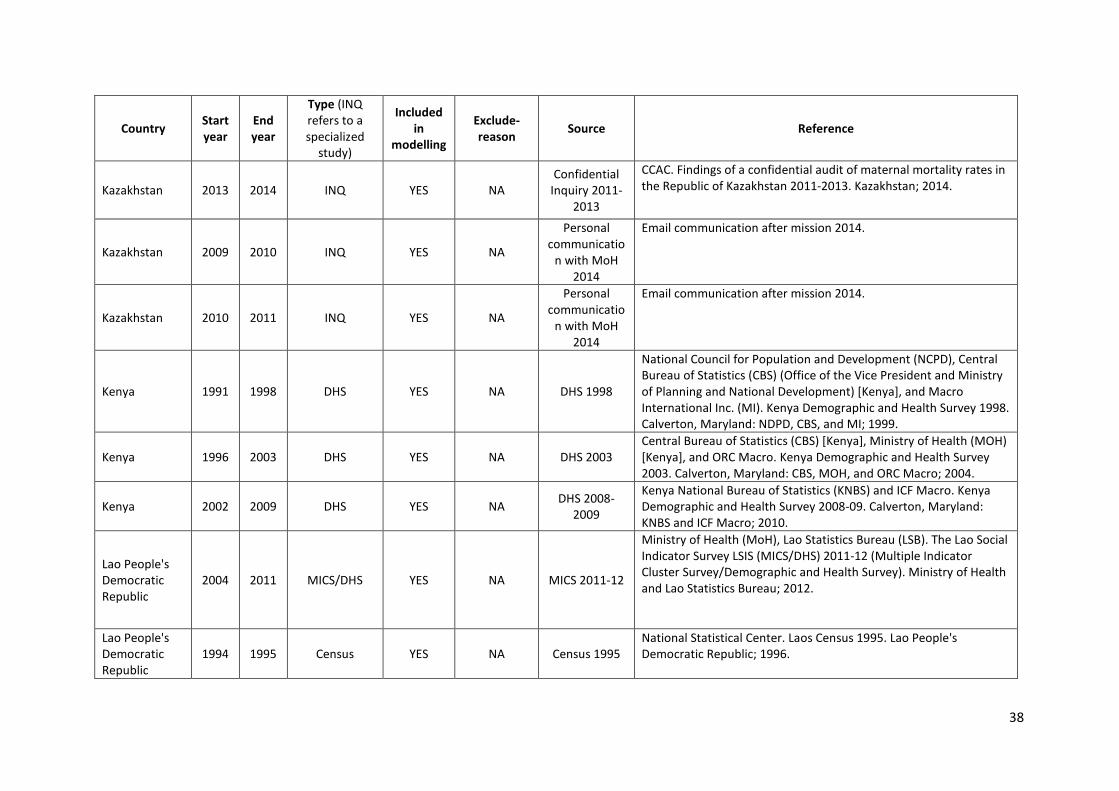
Kazakhstan 2011 2012 INQ YES NA Confidential
Inquiry 2011-2013
CCAC. Findings of a confidential audit of maternal mortality rates in the Republic of Kazakhstan 2011-2013. Kazakhstan; 2014.
Kazakhstan 2012 2013 INQ YES NA Confidential
Inquiry 2011-2013
CCAC. Findings of a confidential audit of maternal mortality rates in the Republic of Kazakhstan 2011-2013. Kazakhstan; 2014.
37
Country Start year
End year
Type (INQ refers to a specialized
study)
Included in
modelling
Exclude-reason Source Reference
Kazakhstan 2013 2014 INQ YES NA Confidential
Inquiry 2011-2013
CCAC. Findings of a confidential audit of maternal mortality rates in the Republic of Kazakhstan 2011-2013. Kazakhstan; 2014.
Kazakhstan 2009 2010 INQ YES NA
Personal communicatio
n with MoH 2014
Email communication after mission 2014.
Kazakhstan 2010 2011 INQ YES NA
Personal communicatio
n with MoH 2014
Email communication after mission 2014.
Kenya 1991 1998 DHS YES NA DHS 1998
National Council for Population and Development (NCPD), Central Bureau of Statistics (CBS) (Office of the Vice President and Ministry of Planning and National Development) [Kenya], and Macro International Inc. (MI). Kenya Demographic and Health Survey 1998. Calverton, Maryland: NDPD, CBS, and MI; 1999.
Kenya 1996 2003 DHS YES NA DHS 2003 Central Bureau of Statistics (CBS) [Kenya], Ministry of Health (MOH) [Kenya], and ORC Macro. Kenya Demographic and Health Survey 2003. Calverton, Maryland: CBS, MOH, and ORC Macro; 2004.
Kenya 2002 2009 DHS YES NA DHS 2008-2009
Kenya National Bureau of Statistics (KNBS) and ICF Macro. Kenya Demographic and Health Survey 2008-09. Calverton, Maryland: KNBS and ICF Macro; 2010.
Lao People's Democratic Republic
2004 2011 MICS/DHS YES NA MICS 2011-12
Ministry of Health (MoH), Lao Statistics Bureau (LSB). The Lao Social Indicator Survey LSIS (MICS/DHS) 2011-12 (Multiple Indicator Cluster Survey/Demographic and Health Survey). Ministry of Health and Lao Statistics Bureau; 2012.
Lao People's Democratic Republic
1994 1995 Census YES NA Census 1995 National Statistical Center. Laos Census 1995. Lao People's Democratic Republic; 1996.
38
Country Start year
End year
Type (INQ refers to a specialized
study)
Included in
modelling
Exclude-reason Source Reference
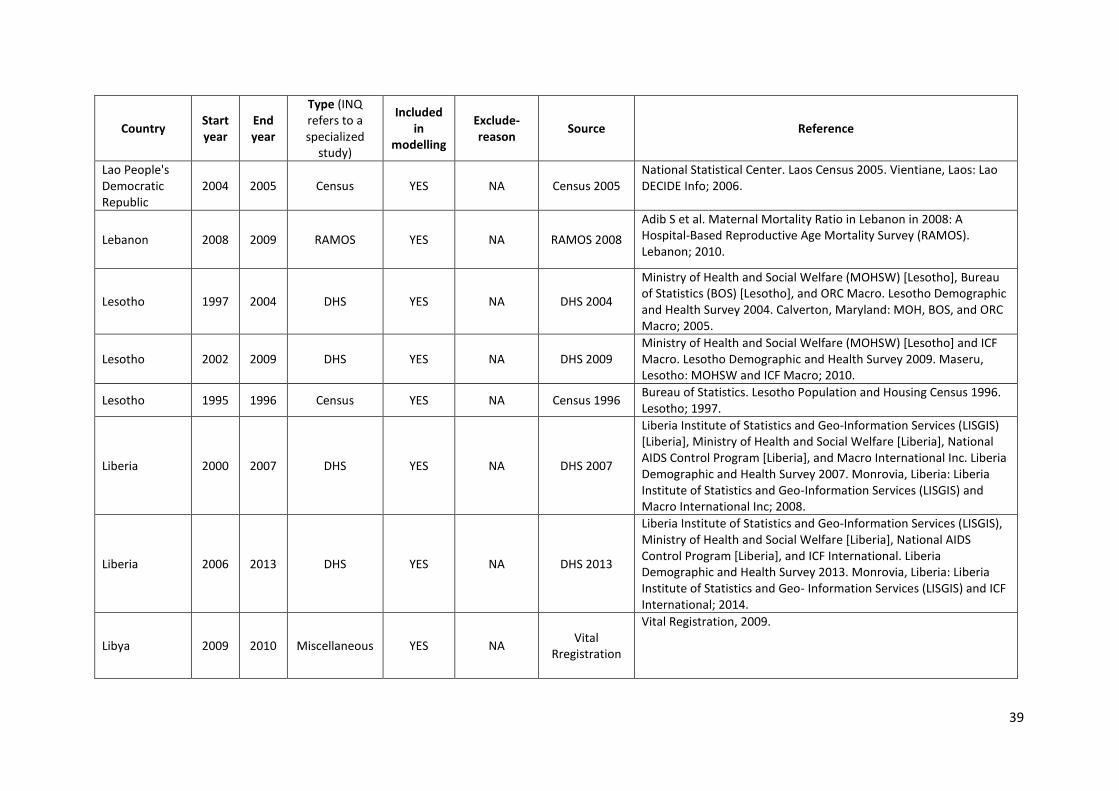
Lao People's Democratic Republic
2004 2005 Census YES NA Census 2005 National Statistical Center. Laos Census 2005. Vientiane, Laos: Lao DECIDE Info; 2006.
Lebanon 2008 2009 RAMOS YES NA RAMOS 2008 Adib S et al. Maternal Mortality Ratio in Lebanon in 2008: A Hospital-Based Reproductive Age Mortality Survey (RAMOS). Lebanon; 2010.
Lesotho 1997 2004 DHS YES NA DHS 2004
Ministry of Health and Social Welfare (MOHSW) [Lesotho], Bureau of Statistics (BOS) [Lesotho], and ORC Macro. Lesotho Demographic and Health Survey 2004. Calverton, Maryland: MOH, BOS, and ORC Macro; 2005.
Lesotho 2002 2009 DHS YES NA DHS 2009 Ministry of Health and Social Welfare (MOHSW) [Lesotho] and ICF Macro. Lesotho Demographic and Health Survey 2009. Maseru, Lesotho: MOHSW and ICF Macro; 2010.
Lesotho 1995 1996 Census YES NA Census 1996 Bureau of Statistics. Lesotho Population and Housing Census 1996. Lesotho; 1997.
Liberia 2000 2007 DHS YES NA DHS 2007
Liberia Institute of Statistics and Geo-Information Services (LISGIS) [Liberia], Ministry of Health and Social Welfare [Liberia], National AIDS Control Program [Liberia], and Macro International Inc. Liberia Demographic and Health Survey 2007. Monrovia, Liberia: Liberia Institute of Statistics and Geo-Information Services (LISGIS) and Macro International Inc; 2008.
Liberia 2006 2013 DHS YES NA DHS 2013
Liberia Institute of Statistics and Geo-Information Services (LISGIS), Ministry of Health and Social Welfare [Liberia], National AIDS Control Program [Liberia], and ICF International. Liberia Demographic and Health Survey 2013. Monrovia, Liberia: Liberia Institute of Statistics and Geo- Information Services (LISGIS) and ICF International; 2014.
Libya 2009 2010 Miscellaneous YES NA Vital Rregistration
Vital Registration, 2009.
39

Country Start year
End year
Type (INQ refers to a specialized
study)
Included in
modelling
Exclude-reason Source Reference
Libya 2010 2011 Miscellaneous YES NA Vital Rregistration
Vital Registration, 2010.
Madagascar 1985 1986 DHS YES NA DHS 1992
Centre National de Recherches sur l'Environnement, Macro International Inc. Enquête Nationale Dêmographique et Sanitaire Madagascar en 1992. Calverton, Maryland USA: Macro International Inc.; 1994.
Madagascar 1990 1997 DHS YES NA DHS 1997
Direction de la Démographie et des Statistiques Sociales, Institut National de la Statistique (INSTAT) [Madagascar] et Macro International Inc. Enquête Démographique et de Santé, Madagascar 1997. Calverton, Maryland, USA: INSTAT et Macro International Inc.; 1998.
Madagascar 1997 2004 DHS YES NA DHS 2003-2004
Institut National de la Statistique (INSTAT) et ORC Macro. Enquête Démographique et de Santé de Madagascar 2003-2004. Calverton, Maryland, USA: INSTAT et ORC Macro; 2005.
Madagascar 2002 2009 DHS YES NA DHS 2008-2009
Institut National de la Statistique (INSTAT) et ICF Macro. Enquête Démographique et de Santé de Madagascar 2008-2009. Antananarivo, Madagascar: INSTAT et ICF Macro; 2010.
Malawi 1985 1992 DHS YES NA DHS 1992 National Statistical Office and Macro International Inc. Malawi Demographic and Health Survey 1992. Calverton, Maryland USA: Macro International Inc.; 1994.
Malawi 1993 2000 DHS YES NA DHS 2000
National Statistical Office [Malawi] and ORC Macro. Malawi Demographic and Health Survey 2000. Zomba, Malawi and Calverton, Maryland, USA: National Statistical Office and ORC Macro; 2001.
Malawi 1997 2004 DHS YES NA DHS 2004 National Statistical Office (NSO) [Malawi], and ORC Macro. Malawi Demographic and Health Survey 2004. Calverton, Maryland, USA: NSO and ORC Macro; 2005.
Malawi 2003 2010 DHS YES NA DHS 2010 National Statistical Office (NSO), and ICF Macro. Malawi Demographic and Health Survey 2010. Zomba, Malawi, and Calverton, Maryland, USA: NSO and ICF Macro; 2011.
40
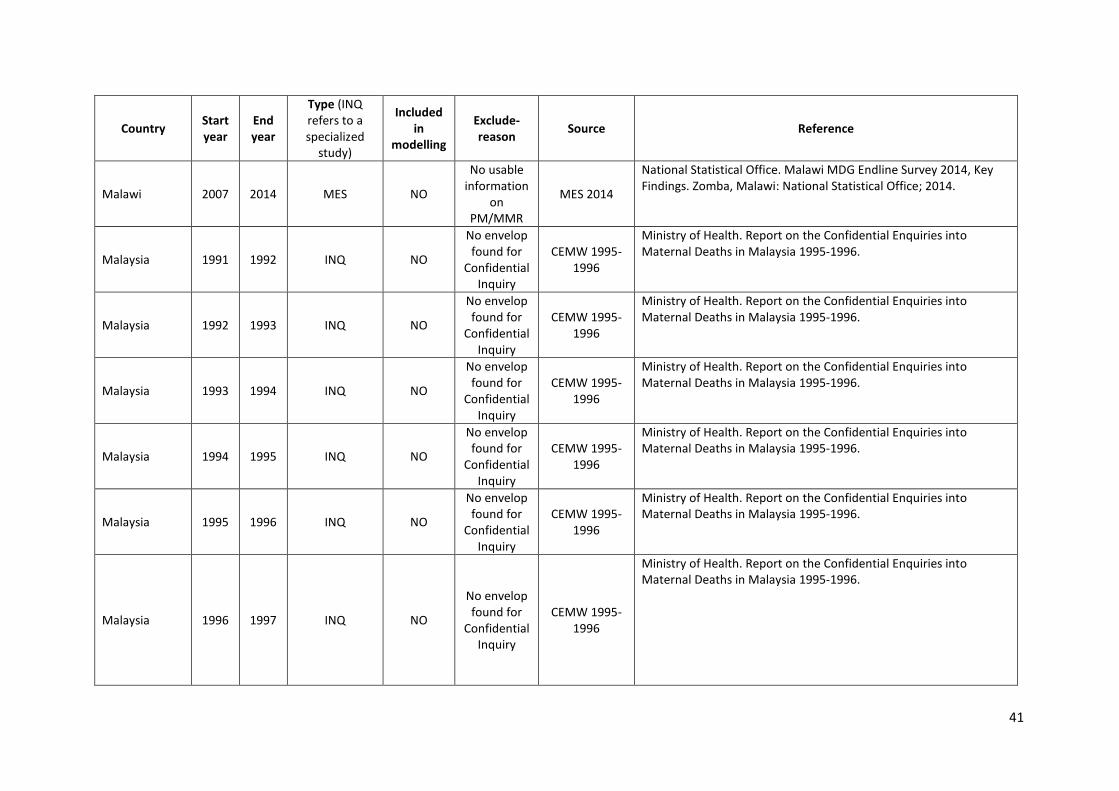
Country Start year
End year
Type (INQ refers to a specialized
study)
Included in
modelling
Exclude-reason Source Reference
Malawi 2007 2014 MES NO
No usable information
on PM/MMR
MES 2014
National Statistical Office. Malawi MDG Endline Survey 2014, Key Findings. Zomba, Malawi: National Statistical Office; 2014.
Malaysia 1991 1992 INQ NO
No envelop found for
Confidential Inquiry
CEMW 1995-1996
Ministry of Health. Report on the Confidential Enquiries into Maternal Deaths in Malaysia 1995-1996.
Malaysia 1992 1993 INQ NO
No envelop found for
Confidential Inquiry
CEMW 1995-1996
Ministry of Health. Report on the Confidential Enquiries into Maternal Deaths in Malaysia 1995-1996.
Malaysia 1993 1994 INQ NO
No envelop found for
Confidential Inquiry
CEMW 1995-1996
Ministry of Health. Report on the Confidential Enquiries into Maternal Deaths in Malaysia 1995-1996.
Malaysia 1994 1995 INQ NO
No envelop found for
Confidential Inquiry
CEMW 1995-1996
Ministry of Health. Report on the Confidential Enquiries into Maternal Deaths in Malaysia 1995-1996.
Malaysia 1995 1996 INQ NO
No envelop found for
Confidential Inquiry
CEMW 1995-1996
Ministry of Health. Report on the Confidential Enquiries into Maternal Deaths in Malaysia 1995-1996.
Malaysia 1996 1997 INQ NO
No envelop found for
Confidential Inquiry
CEMW 1995-1996
Ministry of Health. Report on the Confidential Enquiries into Maternal Deaths in Malaysia 1995-1996.
41

Country Start year
End year
Type (INQ refers to a specialized
study)
Included in
modelling
Exclude-reason Source Reference
Mali 1989 1996 DHS YES NA DHS 1995-1996
Salif C, Dicko F, Traoré SM, Sidibé O, Seroussi M, Barrère B. Enquête Démographique et de Santé, Mali 1995-1996. Calverton, Maryland, USA: Cellule de Planification et de Statistique du Ministère de la Santé, Direction Nationale de la Statistique et de l'Informatique et Macro International Inc.; 1996.
Mali 1994 2001 DHS YES NA DHS 2001
Cellule de Planification et de Statistique du Ministère de la Santé (CPS/MS), Direction Nationale de la Statistique et de l'Informatique (DNSI) et ORC Macro. Enquête Démographique et de Santé au Mali 2001. Calverton, Maryland, USA: CPS/MS, DNSI et ORC Macro; 2002.
Mali 1999 2006 DHS YES NA DHS 2006
Cellule de Planification et de Statistique du Ministère de la Santé (CPS/MS), Direction Nationale de la Statistique et de l’Informatique du Ministère de l’Économie, de l’Industrie et du Commerce (DNSI/MEIC) et Macro International Inc. Enquête Démographique et de Santé du Mali 2006. Calverton, Maryland, USA: CPS/DNSI et Macro International Inc.; 2007.
Mali 2005 2012 DHS YES NA DHS 2012-2013
Cellule de Planification et de Statistique (CPS/SSDSPF), Institut National de la Statistique (INSTAT/MPATP), INFO-STAT et ICF International. Enquête Démographique et de Santé au Mali 2012-2013. Rockville, Maryland, USA : CPS, INSTAT, INFO-STAT et ICF International; 2014.
Mali 2008 2009 Census YES NA Census 2009 Central Census Bureau, National Institute of Statistics (INSTAT). Mali Population and Housing Census 2009. Mali; 2010.
Mauritania 1993 2000 DHS YES NA DHS 2000-2001
Office National de la Statistique (ONS) [Mauritanie] et ORC Macro. Enquête Démographique et de Santé Mauritanie 2000-2001. Calverton, Maryland, USA: ONS et ORC Macro; 2001.
Mauritania 2004 2011 MICS YES NA MICS 2011
Office National de la Statistique, UNICEF. Mauritanie Enquête par grappes d' indicateurs multiples 2011. Rapport Final. Mauritanie; 2014.
42

Country Start year
End year
Type (INQ refers to a specialized
study)
Included in
modelling
Exclude-reason Source Reference
Mexico 1990 1991 INQ YES NA BIRMM 2011 Secretaría de Salud México. Búsqueda Intencionada de Muertes Maternas en México. Informe 2011. Mexico; 2013.
Mexico 1991 1992 INQ YES NA BIRMM 2011 Secretaría de Salud México. Búsqueda Intencionada de Muertes Maternas en México. Informe 2011. Mexico; 2013.
Mexico 1992 1993 INQ YES NA BIRMM 2011 Secretaría de Salud México. Búsqueda Intencionada de Muertes Maternas en México. Informe 2011. Mexico; 2013.
Mexico 1993 1994 INQ YES NA BIRMM 2011 Secretaría de Salud México. Búsqueda Intencionada de Muertes Maternas en México. Informe 2011. Mexico; 2013.
Mexico 1994 1995 INQ YES NA BIRMM 2011 Secretaría de Salud México. Búsqueda Intencionada de Muertes Maternas en México. Informe 2011. Mexico; 2013.
Mexico 1995 1996 INQ YES NA BIRMM 2011 Secretaría de Salud México. Búsqueda Intencionada de Muertes Maternas en México. Informe 2011. Mexico; 2013.
Mexico 1996 1997 INQ YES NA BIRMM 2011 Secretaría de Salud México. Búsqueda Intencionada de Muertes Maternas en México. Informe 2011. Mexico; 2013.
Mexico 1997 1998 INQ YES NA BIRMM 2011 Secretaría de Salud México. Búsqueda Intencionada de Muertes Maternas en México. Informe 2011. Mexico; 2013.
Mexico 1998 1999 INQ YES NA BIRMM 2011 Secretaría de Salud México. Búsqueda Intencionada de Muertes Maternas en México. Informe 2011. Mexico; 2013.
Mexico 1999 2000 INQ YES NA BIRMM 2011 Secretaría de Salud México. Búsqueda Intencionada de Muertes Maternas en México. Informe 2011. Mexico; 2013.
Mexico 2000 2001 INQ YES NA BIRMM 2011 Secretaría de Salud México. Búsqueda Intencionada de Muertes Maternas en México. Informe 2011. Mexico; 2013.
Mexico 2001 2002 INQ YES NA BIRMM 2011 Secretaría de Salud México. Búsqueda Intencionada de Muertes Maternas en México. Informe 2011. Mexico; 2013.
Mexico 2002 2003 INQ YES NA BIRMM 2014 Secretaría de Salud México. Búsqueda Intencionada de Muertes Maternas en México. Informe. Mexico; 2014.
43

Country Start year
End year
Type (INQ refers to a specialized
study)
Included in
modelling
Exclude-reason Source Reference
Mexico 2003 2004 INQ YES NA BIRMM 2014 Secretaría de Salud México. Búsqueda Intencionada de Muertes Maternas en México. Informe. Mexico; 2014.
Mexico 2004 2005 INQ YES NA BIRMM 2014 Secretaría de Salud México. Búsqueda Intencionada de Muertes Maternas en México. Informe. Mexico; 2014.
Mexico 2005 2006 INQ YES NA BIRMM 2014 Secretaría de Salud México. Búsqueda Intencionada de Muertes Maternas en México. Informe. Mexico; 2014.
Mexico 2006 2007 INQ YES NA BIRMM 2014 Secretaría de Salud México. Búsqueda Intencionada de Muertes Maternas en México. Informe. Mexico; 2014.
Mexico 2007 2008 INQ YES NA BIRMM 2014 Secretaría de Salud México. Búsqueda Intencionada de Muertes Maternas en México. Informe. Mexico; 2014.
Mexico 2008 2009 INQ YES NA BIRMM 2014 Secretaría de Salud México. Búsqueda Intencionada de Muertes Maternas en México. Informe. Mexico; 2014.
Mexico 2009 2010 INQ YES NA BIRMM 2014 Secretaría de Salud México. Búsqueda Intencionada de Muertes Maternas en México. Informe. Mexico; 2014.
Mexico 2010 2011 INQ YES NA BIRMM 2014 Secretaría de Salud México. Búsqueda Intencionada de Muertes Maternas en México. Informe. México; 2014.
Mexico 2011 2012 INQ YES NA BIRMM 2014 Secretaría de Salud México. Búsqueda Intencionada de Muertes Maternas en México. Informe. Mexico; 2014.
Mexico 2012 2013 INQ YES NA BIRMM 2014 Secretaría de Salud México. Búsqueda Intencionada de Muertes Maternas en México. Informe. Mexico; 2014.
Mexico 2013 2014 INQ YES NA BIRMM 2014 Mexico, Secretaría de Salud. Búsqueda Intencionada de Muertes Maternas en México. Informe. Mexico; 2014.
Mongolia 1992 1993 Miscellaneous YES NA MoHS 2015 MoHS 2015. Country Consulation 2015.
Mongolia 1993 1994 Miscellaneous YES NA MoHS 2015 MoHS 2015. Country Consulation 2015.
Mongolia 1994 1995 Miscellaneous YES NA MoHS 2015 MoHS 2015. Country Consulation 2015.
Mongolia 1995 1996 Miscellaneous YES NA MoHS 2015 MoHS 2015. Country Consulation 2015.
Mongolia 1996 1997 Miscellaneous YES NA MoHS 2015 MoHS 2015. Country Consulation 2015.
44

Country Start year
End year
Type (INQ refers to a specialized
study)
Included in
modelling
Exclude-reason Source Reference
Mongolia 1997 1998 Miscellaneous YES NA MoHS 2015 MoHS 2015. Country Consulation 2015.
Mongolia 1998 1999 Miscellaneous YES NA MoHS 2015 MoHS 2015. Country Consulation 2015.
Mongolia 1999 2000 Miscellaneous YES NA MoHS 2015 MoHS 2015. Country Consulation 2015.
Mongolia 2000 2001 Miscellaneous YES NA MoHS 2015 MoHS 2015. Country Consulation 2015.
Mongolia 2001 2002 Miscellaneous YES NA MoHS 2015 MoHS 2015. Country Consulation 2015.
Mongolia 2002 2003 Miscellaneous YES NA MoHS 2015 MoHS 2015. Country Consulation 2015.
Mongolia 2003 2004 Miscellaneous YES NA MoHS 2015 MoHS 2015. Country Consulation 2015.
Mongolia 2004 2005 Miscellaneous YES NA MoHS 2015 MoHS 2015. Country Consulation 2015.
Mongolia 2005 2006 Miscellaneous YES NA MoHS 2015 MoHS 2015. Country Consulation 2015.
Mongolia 2006 2007 Miscellaneous YES NA MoHS 2015 MoHS 2015. Country Consulation 2015.
Mongolia 2007 2008 Miscellaneous YES NA MoHS 2015 MoHS 2015. Country Consulation 2015.
Mongolia 2008 2009 Miscellaneous YES NA MoHS 2015 MoHS 2015. Country Consulation 2015.
Mongolia 2009 2010 Miscellaneous YES NA MoHS 2015 MoHS 2015. Country Consulation 2015.
Mongolia 2010 2011 Miscellaneous YES NA MoHS 2015 MoHS 2015. Country Consulation 2015.
Mongolia 2011 2012 Miscellaneous YES NA MoHS 2015 MoHS 2015. Country Consulation 2015.
Mongolia 2012 2013 Miscellaneous YES NA MoHS 2015 MoHS 2015. Country Consulation 2015.
Mongolia 2013 2014 Miscellaneous YES NA MoHS 2015 MoHS 2015. Country Consulation 2015.
Mongolia 2014 2015 Miscellaneous YES NA MoHS 2015 MoHS 2015. Country Consulation 2015.
Morocco 2009 2010 INQ YES NA Confidential Inquiry 2009
Abouchadi S, Belghiti Alaoui A, Meski FZ, De Brouwere V. Implementing a maternal mortality surveillance system in Morocco -challenges and opportunities. Trop Med Int Health. 2013;18(3):357-365.
Morocco 2010 2011 INQ YES NA Confidential Inquiry 2010
Ministère de la Santé. Enquête confidentielle sur les des décès maternels de 2010 au Maroc. Deuxième rapport du Comité National d'Experts sur l'Audit Confidentiel des décès Maternels. Maroc; 2013.
45

Country Start year
End year
Type (INQ refers to a specialized
study)
Included in
modelling
Exclude-reason Source Reference
Morocco 1993 2003 DHS YES NA DHS 2003-2004
Ministère de la Santé [Maroc], ORC Macro, et Ligue des États Arabes. Enquête sur la Population et la Santé Familiale (EPSF) 2003-2004. Calverton, Maryland, USA: Ministère de la Santé et ORC Macro; 2005.
Morocco 2009 2010 National
Demographic Survey
YES NA
National Demographic Survey 2009-
2010
Haut-Commisariat au Plan du Royaume du Maroc. Enquête nationale démographique à passages répétés 2009-2010. Principaux résultats. Haut-Commissariat au Plan, Rabat; 2011.
Morocco 1992 1997 ENSME YES NA ENSME 1997
Ministère de la Santé (MS), Service des études et de l’information sanitaire (SEIS), PAPCHILD (Projet arabe pour la promotion de l’enfance). Enquête Nationale sur la Santé de la Mère et de l ’Enfant (ENSME) 1997. MC, SEIS: Maroc; 1999.
Morocco 1985 1992 DHS YES NA DHS 1992
Ministère de la Santé Publique, Macro International Inc. Enquête Nationale sur la Population et la Santé (ENPS-II) 1992. Columbia, Maryland, USA: Macro International Inc.; 1993.
Mozambique 1997 2004 DHS YES NA DHS 2003
Moçambique Inquérito Demográfico e de Saúde 2003. Instituto Nacional de Estatística, Ministério da Saúde. ORC Macro. Calverton MD, USA: ORC Macro. 2005. Ministério da Saúde. ORC Macro. Calverton MD, USA: ORC Macro; 2005.
Mozambique 2004 2011 DHS YES NA DHS 2011 Instituto Nacional de Estatística, Ministério da Saúde, ICF International/Measure DHS. Moçambique Inquérito Demográfico e de Saúde 2011 - relatório preliminar. Calverton, MD USA; 2012.
Mozambique 2006 2007 Census YES Census 2007 National Statistics Institute (Mozambique). Mozambique Census 2007.
Myanmar 1998 1999 Miscellaneous YES NA NMS 1999 Central Statistical Organization. National Mortality Survey 1999. Myanmar; 2000.
Myanmar 2004 2005 Miscellaneous YES NA NMMS 2004-2005
Ministry of Health. Nationwide specific maternal mortality survey 2004-2005. Myanmar.
46

Country Start year
End year
Type (INQ refers to a specialized
study)
Included in
modelling
Exclude-reason Source Reference
Namibia 1985 1992 DHS YES NA DHS 1992 Ministry of Health and Social Services, Macro International Inc. Namibia Demographic and Health Survey 1992. Columbia, Maryland, USA: Macro International Inc.; 1993.
Namibia 1993 2000 DHS YES NA DHS 2000 Ministry of Health and Social Services (MOHSS) [Namibia]. Namibia Demographic and Health Survey 2000. Windhoek, Namibia: MOHSS; 2003.
Namibia 1999 2006 DHS YES NA DHS 2006-2007
Ministry of Health and Social Services (MoHSS) [Namibia] and Macro International Inc. Namibia Demographic and Health Survey 2006-07. Windhoek, Namibia and Calverton, Maryland, USA: MoHSS and Macro International Inc.; 2008.
Namibia 2006 2013 DHS YES NA DHS 2013
The Nambia Ministry of Health and Social Services (MoHSS) and ICF International. The Namibia Demographic and Health Survey 2013. Windhoek, Namibia, and Rockville, Maryland, USA: MoHSS and ICF International; 2014.
Namibia 2010 2011 Census YES NA Census 2011 Namibia Statistics Agency, Statistics South Africa. Namibia Population and Housing Census 2011. Windhoek, Namibia: Namibia Statistics Agency2012.
Nepal 1989 1996 DHS YES NA DHS 1996 Family Health Division, Ministry of Health, New ERA, Macro International Inc. Nepal Family Health Survey 1996. Calverton, Maryland, USA: Macro International Inc.; 1997.
Nepal 1999 2006 DHS YES NA DHS 2006
Ministry of Health and Population (MOHP) [Nepal], New ERA, and Macro International Inc. Nepal Demographic and Health Survey 2006. Kathmandu, Nepal: Ministry of Health and Population, New ERA, and Macro International Inc.; 2007.
Nepal 2008 2009 Miscellaneous NO
Sub-national/sub-population
coverage
NMMS 2008-2009
Suvedi B K et al. Nepal Maternal Mortality and Morbidity Study 2008-2009: Summary of Preliminary Findings. Kathmandu, Nepal. Family Health Division, Department of Health Services, Ministry of Health, Government of Nepal; 2009.
47
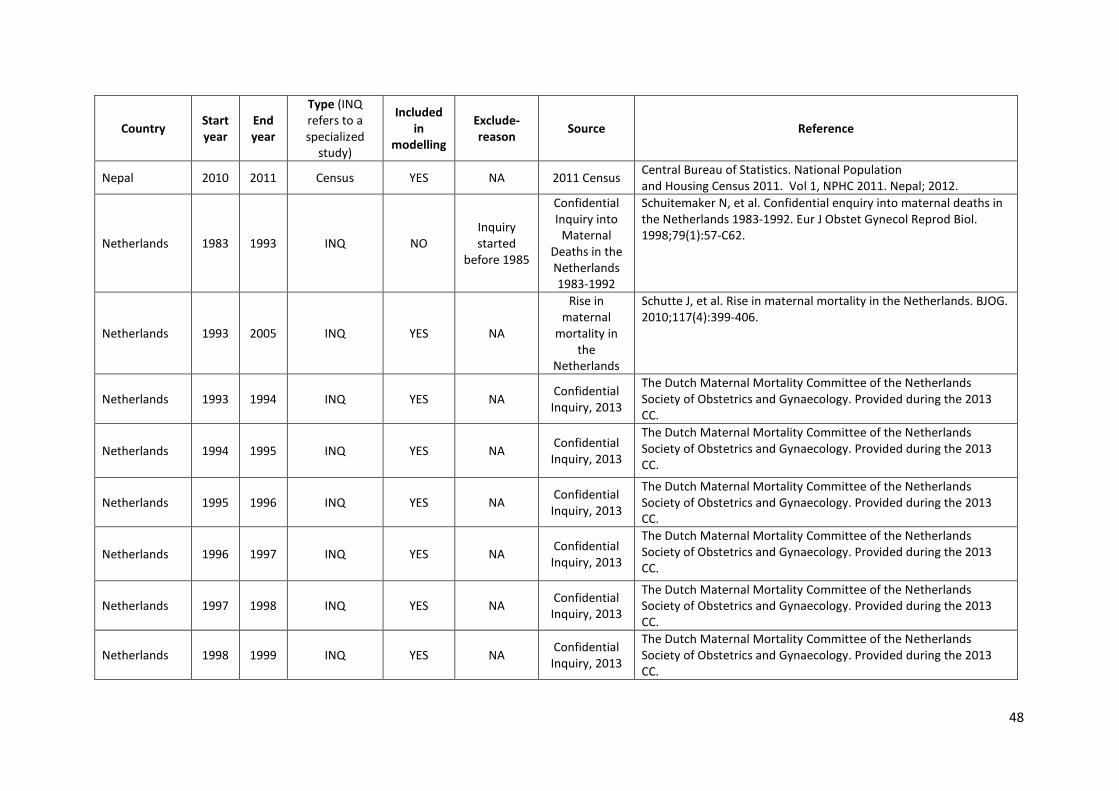
Country Start year
End year
Type (INQ refers to a specialized
study)
Included in
modelling
Exclude-reason Source Reference
Nepal 2010 2011 Census YES NA 2011 Census Central Bureau of Statistics. National Population and Housing Census 2011. Vol 1, NPHC 2011. Nepal; 2012.
Netherlands 1983 1993 INQ NO Inquiry started
before 1985
Confidential Inquiry into
Maternal Deaths in the Netherlands 1983-1992
Schuitemaker N, et al. Confidential enquiry into maternal deaths in the Netherlands 1983-1992. Eur J Obstet Gynecol Reprod Biol. 1998;79(1):57-C62.
Netherlands 1993 2005 INQ YES NA
Rise in maternal
mortality in the
Netherlands
Schutte J, et al. Rise in maternal mortality in the Netherlands. BJOG. 2010;117(4):399-406.
Netherlands 1993 1994 INQ YES NA Confidential Inquiry, 2013
The Dutch Maternal Mortality Committee of the Netherlands Society of Obstetrics and Gynaecology. Provided during the 2013 CC.
Netherlands 1994 1995 INQ YES NA Confidential Inquiry, 2013
The Dutch Maternal Mortality Committee of the Netherlands Society of Obstetrics and Gynaecology. Provided during the 2013 CC.
Netherlands 1995 1996 INQ YES NA Confidential Inquiry, 2013
The Dutch Maternal Mortality Committee of the Netherlands Society of Obstetrics and Gynaecology. Provided during the 2013 CC.
Netherlands 1996 1997 INQ YES NA Confidential Inquiry, 2013
The Dutch Maternal Mortality Committee of the Netherlands Society of Obstetrics and Gynaecology. Provided during the 2013 CC.
Netherlands 1997 1998 INQ YES NA Confidential Inquiry, 2013
The Dutch Maternal Mortality Committee of the Netherlands Society of Obstetrics and Gynaecology. Provided during the 2013 CC.
Netherlands 1998 1999 INQ YES NA Confidential Inquiry, 2013
The Dutch Maternal Mortality Committee of the Netherlands Society of Obstetrics and Gynaecology. Provided during the 2013 CC.
48

Country Start year
End year
Type (INQ refers to a specialized
study)
Included in
modelling
Exclude-reason Source Reference
Netherlands 1999 2000 INQ YES NA Confidential Inquiry, 2013
The Dutch Maternal Mortality Committee of the Netherlands Society of Obstetrics and Gynaecology. Provided during the 2013 CC.
Netherlands 2000 2001 INQ YES NA Confidential Inquiry, 2013
The Dutch Maternal Mortality Committee of the Netherlands Society of Obstetrics and Gynaecology. Provided during the 2013 CC.
Netherlands 2001 2002 INQ YES NA Confidential Inquiry, 2013
The Dutch Maternal Mortality Committee of the Netherlands Society of Obstetrics and Gynaecology. Provided during the 2013 CC.
Netherlands 2002 2003 INQ YES NA Confidential Inquiry, 2013
The Dutch Maternal Mortality Committee of the Netherlands Society of Obstetrics and Gynaecology. Provided during the 2013 CC.
Netherlands 2003 2004 INQ YES NA Confidential Inquiry, 2013
The Dutch Maternal Mortality Committee of the Netherlands Society of Obstetrics and Gynaecology. Provided during the 2013 CC.
Netherlands 2004 2005 INQ YES NA Confidential Inquiry, 2013
The Dutch Maternal Mortality Committee of the Netherlands Society of Obstetrics and Gynaecology. Provided during the 2013 CC.
Netherlands 2005 2006 INQ YES NA Confidential Inquiry, 2013
The Dutch Maternal Mortality Committee of the Netherlands Society of Obstetrics and Gynaecology. Provided during the 2013 CC.
Netherlands 2006 2007 INQ YES NA Confidential Inquiry, 2013
The Dutch Maternal Mortality Committee of the Netherlands Society of Obstetrics and Gynaecology. Provided during the 2013 CC.
Netherlands 2007 2008 INQ YES NA Confidential Inquiry, 2013
The Dutch Maternal Mortality Committee of the Netherlands Society of Obstetrics and Gynaecology. Provided during the 2013 CC.
Netherlands 2008 2009 INQ YES NA Confidential Inquiry, 2013
The Dutch Maternal Mortality Committee of the Netherlands Society of Obstetrics and Gynaecology. Provided during the 2013 CC.
49

Country Start year
End year
Type (INQ refers to a specialized
study)
Included in
modelling
Exclude-reason Source Reference
Netherlands 2009 2010 INQ YES NA Confidential Inquiry, 2013
The Dutch Maternal Mortality Committee of the Netherlands Society of Obstetrics and Gynaecology. Provided during the 2013 CC.
Netherlands 2010 2011 INQ YES NA Confidential Inquiry, 2013
The Dutch Maternal Mortality Committee of the Netherlands Society of Obstetrics and Gynaecology. Provided during the 2013 CC.
New Zealand 2006 2007 INQ YES NA Confidential Inquiry, 2013
PMMRC. Eighth Annual Report of the Perinatal and Maternal Mortality Review Committee: Reporting mortality 2012. Wellington: Health Quality and Safety Commission; 2014.
New Zealand 2007 2008 INQ YES NA Confidential Inquiry, 2013
PMMRC. Eighth Annual Report of the Perinatal and Maternal Mortality Review Committee: Reporting Mortality 2012. Wellington: Health Quality and Safety Commission; 2014.
New Zealand 2008 2009 INQ YES NA Confidential Inquiry, 2013
PMMRC. Eighth Annual Report of the Perinatal and Maternal Mortality Review Committee: Reporting Mortality 2012. Wellington: Health Quality and Safety Commission; 2014.
New Zealand 2009 2010 INQ YES NA Confidential Inquiry, 2013
PMMRC. Eighth Annual Report of the Perinatal and Maternal Mortality Review Committee: Reporting Mortality 2012. Wellington: Health Quality and Safety Commission; 2014.
New Zealand 2010 2011 INQ YES NA Confidential Inquiry, 2013
PMMRC. Eighth Annual Report of the Perinatal and Maternal Mortality Review Committee: Reporting Mortality 2012. Wellington: Health Quality and Safety Commission; 2014.
New Zealand 2011 2012 INQ YES NA Confidential Inquiry, 2013
PMMRC. Eighth Annual Report of the Perinatal and Maternal Mortality Review Committee: Reporting Mortality 2012. Wellington: Health Quality and Safety Commission; 2014.
New Zealand 2012 2013 INQ YES NA Confidential Inquiry, 2013
PMMRC. Eighth Annual Report of the Perinatal and Maternal Mortality Review Committee: Reporting Mortality 2012. Wellington: Health Quality and Safety Commission; 2014.
Nicaragua 2004 2005 Census YES NA Census 2005 National Institute of Statistics and Censuses. Nicaragua Population and Housing Census 2005 - IPUMS. Nicaragua; 2012.
50
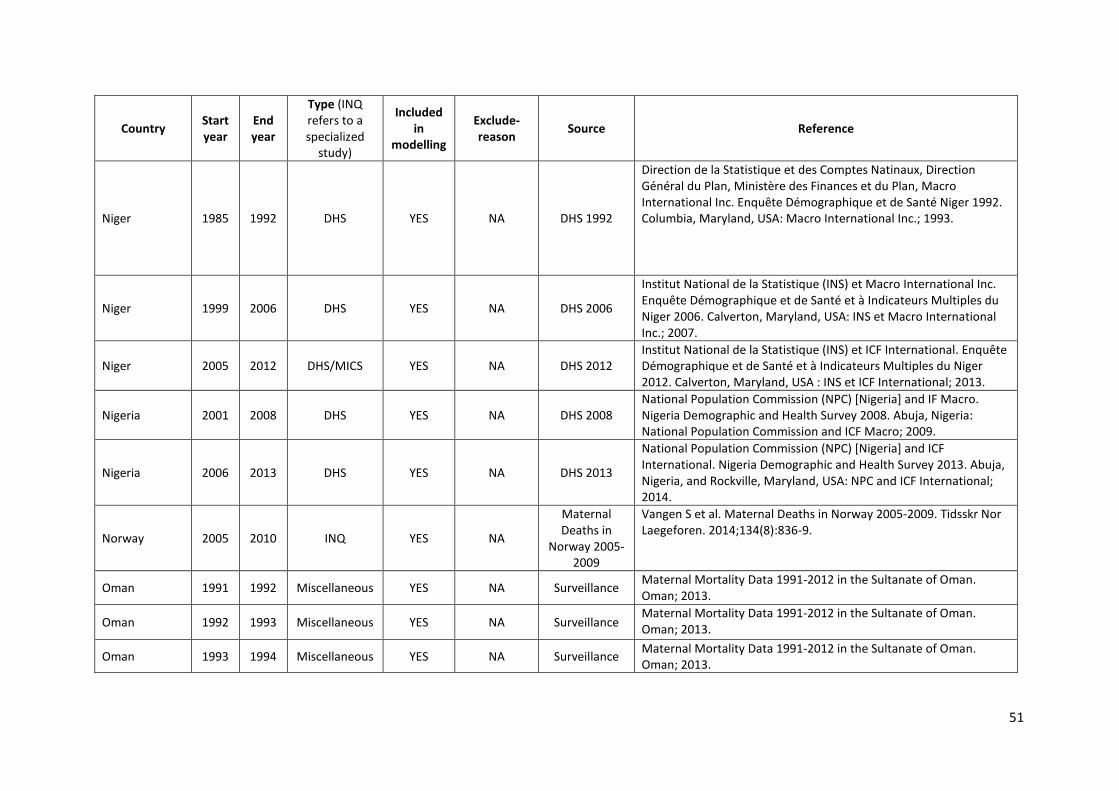
Country Start year
End year
Type (INQ refers to a specialized
study)
Included in
modelling
Exclude-reason Source Reference
Niger 1985 1992 DHS YES NA DHS 1992
Direction de la Statistique et des Comptes Natinaux, Direction Général du Plan, Ministère des Finances et du Plan, Macro International Inc. Enquête Démographique et de Santé Niger 1992. Columbia, Maryland, USA: Macro International Inc.; 1993.
Niger 1999 2006 DHS YES NA DHS 2006
Institut National de la Statistique (INS) et Macro International Inc. Enquête Démographique et de Santé et à Indicateurs Multiples du Niger 2006. Calverton, Maryland, USA: INS et Macro International Inc.; 2007.
Niger 2005 2012 DHS/MICS YES NA DHS 2012 Institut National de la Statistique (INS) et ICF International. Enquête Démographique et de Santé et à Indicateurs Multiples du Niger 2012. Calverton, Maryland, USA : INS et ICF International; 2013.
Nigeria 2001 2008 DHS YES NA DHS 2008 National Population Commission (NPC) [Nigeria] and IF Macro. Nigeria Demographic and Health Survey 2008. Abuja, Nigeria: National Population Commission and ICF Macro; 2009.
Nigeria 2006 2013 DHS YES NA DHS 2013
National Population Commission (NPC) [Nigeria] and ICF International. Nigeria Demographic and Health Survey 2013. Abuja, Nigeria, and Rockville, Maryland, USA: NPC and ICF International; 2014.
Norway 2005 2010 INQ YES NA
Maternal Deaths in
Norway 2005-2009
Vangen S et al. Maternal Deaths in Norway 2005-2009. Tidsskr Nor Laegeforen. 2014;134(8):836-9.
Oman 1991 1992 Miscellaneous YES NA Surveillance Maternal Mortality Data 1991-2012 in the Sultanate of Oman. Oman; 2013.
Oman 1992 1993 Miscellaneous YES NA Surveillance Maternal Mortality Data 1991-2012 in the Sultanate of Oman. Oman; 2013.
Oman 1993 1994 Miscellaneous YES NA Surveillance Maternal Mortality Data 1991-2012 in the Sultanate of Oman. Oman; 2013.
51

Country Start year
End year
Type (INQ refers to a specialized
study)
Included in
modelling
Exclude-reason Source Reference
Oman 1994 1995 Miscellaneous YES NA Surveillance Maternal Mortality Data 1991-2012 in the Sultanate of Oman. Oman; 2013.
Oman 1995 1996 Miscellaneous YES NA Surveillance Maternal Mortality Data 1991-2012 in the Sultanate of Oman. Oman; 2013.
Oman 1996 1997 Miscellaneous YES NA Surveillance Maternal Mortality Data 1991-2012 in the Sultanate of Oman. Oman; 2013.
Oman 1997 1998 Miscellaneous YES NA Surveillance Maternal Mortality Data 1991-2012 in the Sultanate of Oman. Oman; 2013.
Oman 1998 1999 Miscellaneous YES NA Surveillance Maternal Mortality Data 1991-2012 in the Sultanate of Oman. Oman; 2013.
Oman 1999 2000 Miscellaneous YES NA Surveillance Maternal Mortality Data 1991-2012 in the Sultanate of Oman. Oman; 2013.
Oman 2000 2001 Miscellaneous YES NA Surveillance Maternal Mortality Data 1991-2012 in the Sultanate of Oman. Oman; 2013.
Oman 2001 2002 Miscellaneous YES NA Surveillance Maternal Mortality Data 1991-2012 in the Sultanate of Oman. Oman; 2013.
Oman 2002 2003 Miscellaneous YES NA Surveillance Maternal Mortality Data 1991-2012 in the Sultanate of Oman. Oman; 2013.
Oman 2003 2004 Miscellaneous YES NA Surveillance Maternal Mortality Data 1991-2012 in the Sultanate of Oman. Oman; 2013.
Oman 2004 2005 Miscellaneous YES NA Surveillance Maternal Mortality Data 1991-2012 in the Sultanate of Oman. Oman; 2013.
Oman 2005 2006 Miscellaneous YES NA Surveillance Maternal Mortality Data 1991-2012 in the Sultanate of Oman. Oman; 2013.
Oman 2006 2007 Miscellaneous YES NA
Vital Registration
and Surveillance
Maternal Mortality Data 1991-2012 in the Sultanate of Oman. Oman; 2013.
Oman 2007 2008 Miscellaneous YES NA
Vital Registration
and Surveillance
Maternal Mortality Data 1991-2012 in the Sultanate of Oman. Oman; 2013.
52

Country Start year
End year
Type (INQ refers to a specialized
study)
Included in
modelling
Exclude-reason Source Reference
Oman 2008 2009 Miscellaneous YES NA
Vital Registration
and Surveillance
Maternal Mortality Data 1991-2012 in the Sultanate of Oman. Oman; 2013.
Oman 2009 2010 Miscellaneous YES NA
Vital Registration
and Surveillance
Maternal Mortality Data 1991-2012 in the Sultanate of Oman. Oman; 2013.
Oman 2010 2011 Miscellaneous YES NA
Vital Registration
and Surveillance
Maternal Mortality Data 1991-2012 in the Sultanate of Oman. Oman; 2013.
Oman 2011 2012 Miscellaneous YES NA
Vital Registration
and Surveillance
Maternal Mortality Data 1991-2012 in the Sultanate of Oman. Oman; 2013.
Oman 2012 2013 Miscellaneous YES NA
Vital Registration
and Surveillance
Maternal Mortality Data 1991-2012 in the Sultanate of Oman. Oman; 2013.
Pakistan 2003 2006 DHS YES NA DHS 2006-2007
National Institute of Population Studies (NIPS) [Pakistan], and Macro International Inc. Pakistan Demographic and Health Survey 2006-07. Islamabad, Pakistan: National Institute of Population Studies and Macro International Inc.; 2008.
Paraguay 1988 1995 RHS YES NA RHS 1995
Centro Paraguay de Estudios de Poblacíon (CEPEP), Centers fro Diease Control and Prevention (CDC), United States Agency for International Development (USAID). Encuesta Nacional de Demografía y Salud Reproductiva 1995-1996, ENDSR-95/96. Asunción, Paraguay; 1997.
Paraguay 1989 1990 ENDSR YES NA ENDSR 1995-1996
Centro Paraguayo de Estudios de Población (CEPEP). Encuesta Nacional de Demografía y Salud Reproductiva 1995-1996. CEPEP, Paraguay; 1997.
53
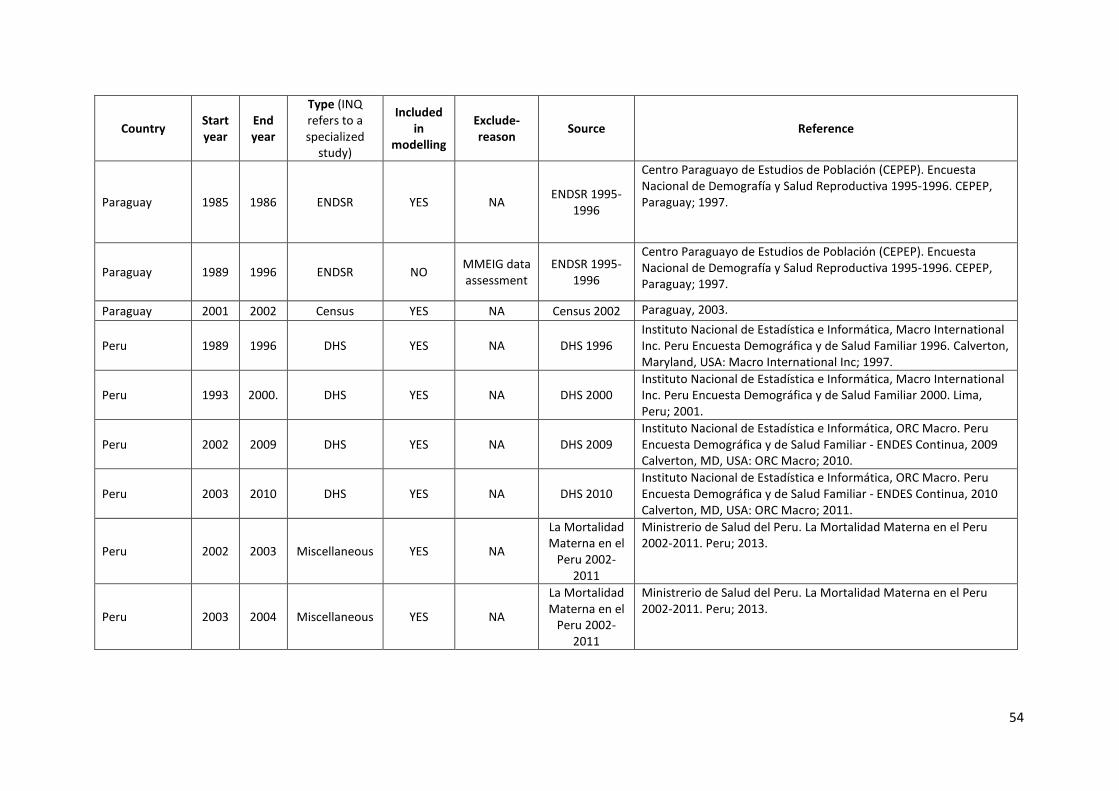
Country Start year
End year
Type (INQ refers to a specialized
study)
Included in
modelling
Exclude-reason Source Reference
Paraguay 1985 1986 ENDSR YES NA ENDSR 1995-1996
Centro Paraguayo de Estudios de Población (CEPEP). Encuesta Nacional de Demografía y Salud Reproductiva 1995-1996. CEPEP, Paraguay; 1997.
Paraguay 1989 1996 ENDSR NO MMEIG data assessment
ENDSR 1995-1996
Centro Paraguayo de Estudios de Población (CEPEP). Encuesta Nacional de Demografía y Salud Reproductiva 1995-1996. CEPEP, Paraguay; 1997.
Paraguay 2001 2002 Census YES NA Census 2002 Paraguay, 2003.
Peru 1989 1996 DHS YES NA DHS 1996 Instituto Nacional de Estadística e Informática, Macro International Inc. Peru Encuesta Demográfica y de Salud Familiar 1996. Calverton, Maryland, USA: Macro International Inc; 1997.
Peru 1993 2000. DHS YES NA DHS 2000 Instituto Nacional de Estadística e Informática, Macro International Inc. Peru Encuesta Demográfica y de Salud Familiar 2000. Lima, Peru; 2001.
Peru 2002 2009 DHS YES NA DHS 2009 Instituto Nacional de Estadística e Informática, ORC Macro. Peru Encuesta Demográfica y de Salud Familiar - ENDES Continua, 2009 Calverton, MD, USA: ORC Macro; 2010.
Peru 2003 2010 DHS YES NA DHS 2010 Instituto Nacional de Estadística e Informática, ORC Macro. Peru Encuesta Demográfica y de Salud Familiar - ENDES Continua, 2010 Calverton, MD, USA: ORC Macro; 2011.
Peru 2002 2003 Miscellaneous YES NA
La Mortalidad Materna en el
Peru 2002-2011
Ministrerio de Salud del Peru. La Mortalidad Materna en el Peru 2002-2011. Peru; 2013.
Peru 2003 2004 Miscellaneous YES NA
La Mortalidad Materna en el
Peru 2002-2011
Ministrerio de Salud del Peru. La Mortalidad Materna en el Peru 2002-2011. Peru; 2013.
54

Country Start year
End year
Type (INQ refers to a specialized
study)
Included in
modelling
Exclude-reason Source Reference
Peru 2004 2005 Miscellaneous YES NA
La Mortalidad Materna en el
Peru 2002-2011
Ministrerio de Salud del Peru. La Mortalidad Materna en el Peru 2002-2011. Peru; 2013.
Peru 2005 2006 Miscellaneous YES NA
La Mortalidad Materna en el
Peru 2002-2011
Ministrerio de Salud del Peru. La Mortalidad Materna en el Peru 2002-2011. Peru; 2013.
Peru 2006 2007 Miscellaneous YES NA
La Mortalidad Materna en el
Peru 2002-2011
Ministrerio de Salud del Peru. La Mortalidad Materna en el Peru 2002-2011. Peru; 2013.
Peru 2007 2008 Miscellaneous YES NA
La Mortalidad Materna en el
Peru 2002-2011
Ministrerio de Salud del Peru. La Mortalidad Materna en el Peru 2002-2011. Peru; 2013.
Peru 2008 2009 Miscellaneous YES NA
La Mortalidad Materna en el
Peru 2002-2011
Ministrerio de Salud del Peru. La Mortalidad Materna en el Peru 2002-2011. Peru; 2013.
Peru 2009 2010 Miscellaneous YES NA
La Mortalidad Materna en el
Peru 2002-2011
Ministrerio de Salud del Peru. La Mortalidad Materna en el Peru 2002-2011. Peru; 2013.
Peru 2010 2011 Miscellaneous YES NA
La Mortalidad Materna en el
Peru 2002-2011
Ministrerio de Salud del Peru. La Mortalidad Materna en el Peru 2002-2011. Peru; 2013.
55
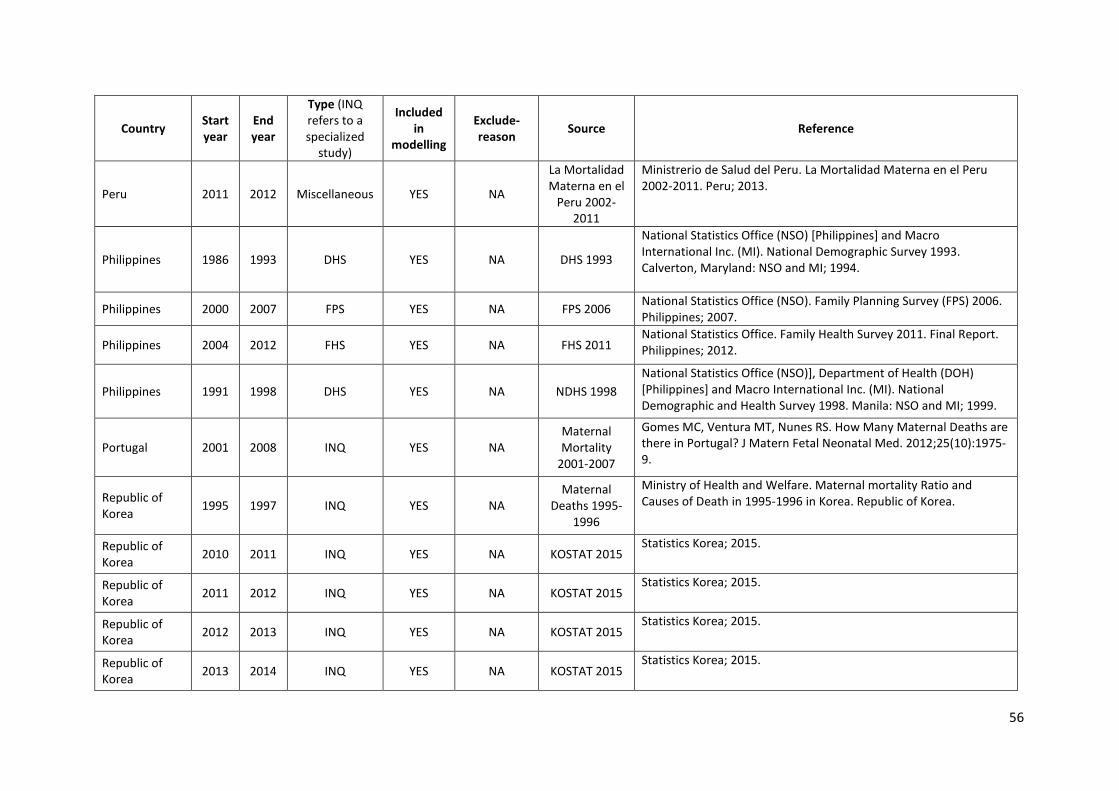
Country Start year
End year
Type (INQ refers to a specialized
study)
Included in
modelling
Exclude-reason Source Reference
Peru 2011 2012 Miscellaneous YES NA
La Mortalidad Materna en el
Peru 2002-2011
Ministrerio de Salud del Peru. La Mortalidad Materna en el Peru 2002-2011. Peru; 2013.
Philippines 1986 1993 DHS YES NA DHS 1993
National Statistics Office (NSO) [Philippines] and Macro International Inc. (MI). National Demographic Survey 1993. Calverton, Maryland: NSO and MI; 1994.
Philippines 2000 2007 FPS YES NA FPS 2006 National Statistics Office (NSO). Family Planning Survey (FPS) 2006. Philippines; 2007.
Philippines 2004 2012 FHS YES NA FHS 2011 National Statistics Office. Family Health Survey 2011. Final Report. Philippines; 2012.
Philippines 1991 1998 DHS YES NA NDHS 1998 National Statistics Office (NSO)], Department of Health (DOH) [Philippines] and Macro International Inc. (MI). National Demographic and Health Survey 1998. Manila: NSO and MI; 1999.
Portugal 2001 2008 INQ YES NA Maternal Mortality
2001-2007
Gomes MC, Ventura MT, Nunes RS. How Many Maternal Deaths are there in Portugal? J Matern Fetal Neonatal Med. 2012;25(10):1975-9.
Republic of Korea 1995 1997 INQ YES NA
Maternal Deaths 1995-
1996
Ministry of Health and Welfare. Maternal mortality Ratio and Causes of Death in 1995-1996 in Korea. Republic of Korea.
Republic of Korea 2010 2011 INQ YES NA KOSTAT 2015
Statistics Korea; 2015.
Republic of Korea 2011 2012 INQ YES NA KOSTAT 2015
Statistics Korea; 2015.
Republic of Korea 2012 2013 INQ YES NA KOSTAT 2015
Statistics Korea; 2015.
Republic of Korea 2013 2014 INQ YES NA KOSTAT 2015
Statistics Korea; 2015.
56
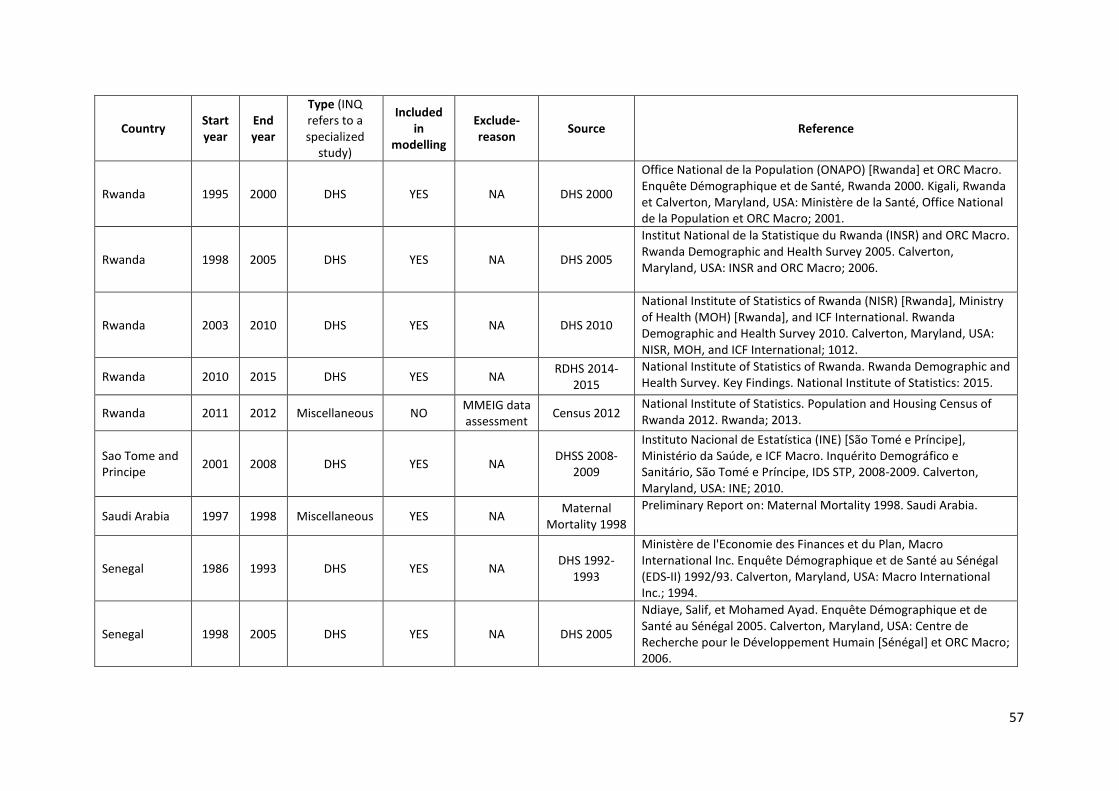
Country Start year
End year
Type (INQ refers to a specialized
study)
Included in
modelling
Exclude-reason Source Reference
Rwanda 1995 2000 DHS YES NA DHS 2000
Office National de la Population (ONAPO) [Rwanda] et ORC Macro. Enquête Démographique et de Santé, Rwanda 2000. Kigali, Rwanda et Calverton, Maryland, USA: Ministère de la Santé, Office National de la Population et ORC Macro; 2001.
Rwanda 1998 2005 DHS YES NA DHS 2005
Institut National de la Statistique du Rwanda (INSR) and ORC Macro. Rwanda Demographic and Health Survey 2005. Calverton, Maryland, USA: INSR and ORC Macro; 2006.
Rwanda 2003 2010 DHS YES NA DHS 2010
National Institute of Statistics of Rwanda (NISR) [Rwanda], Ministry of Health (MOH) [Rwanda], and ICF International. Rwanda Demographic and Health Survey 2010. Calverton, Maryland, USA: NISR, MOH, and ICF International; 1012.
Rwanda 2010 2015 DHS YES NA RDHS 2014-2015
National Institute of Statistics of Rwanda. Rwanda Demographic and Health Survey. Key Findings. National Institute of Statistics: 2015.
Rwanda 2011 2012 Miscellaneous NO MMEIG data assessment Census 2012
National Institute of Statistics. Population and Housing Census of Rwanda 2012. Rwanda; 2013.
Sao Tome and Principe 2001 2008 DHS YES NA DHSS 2008-
2009
Instituto Nacional de Estatística (INE) [São Tomé e Príncipe], Ministério da Saúde, e ICF Macro. Inquérito Demográfico e Sanitário, São Tomé e Príncipe, IDS STP, 2008-2009. Calverton, Maryland, USA: INE; 2010.
Saudi Arabia 1997 1998 Miscellaneous YES NA Maternal Mortality 1998
Preliminary Report on: Maternal Mortality 1998. Saudi Arabia.
Senegal 1986 1993 DHS YES NA DHS 1992-1993
Ministère de l'Economie des Finances et du Plan, Macro International Inc. Enquête Démographique et de Santé au Sénégal (EDS-II) 1992/93. Calverton, Maryland, USA: Macro International Inc.; 1994.
Senegal 1998 2005 DHS YES NA DHS 2005
Ndiaye, Salif, et Mohamed Ayad. Enquête Démographique et de Santé au Sénégal 2005. Calverton, Maryland, USA: Centre de Recherche pour le Développement Humain [Sénégal] et ORC Macro; 2006.
57
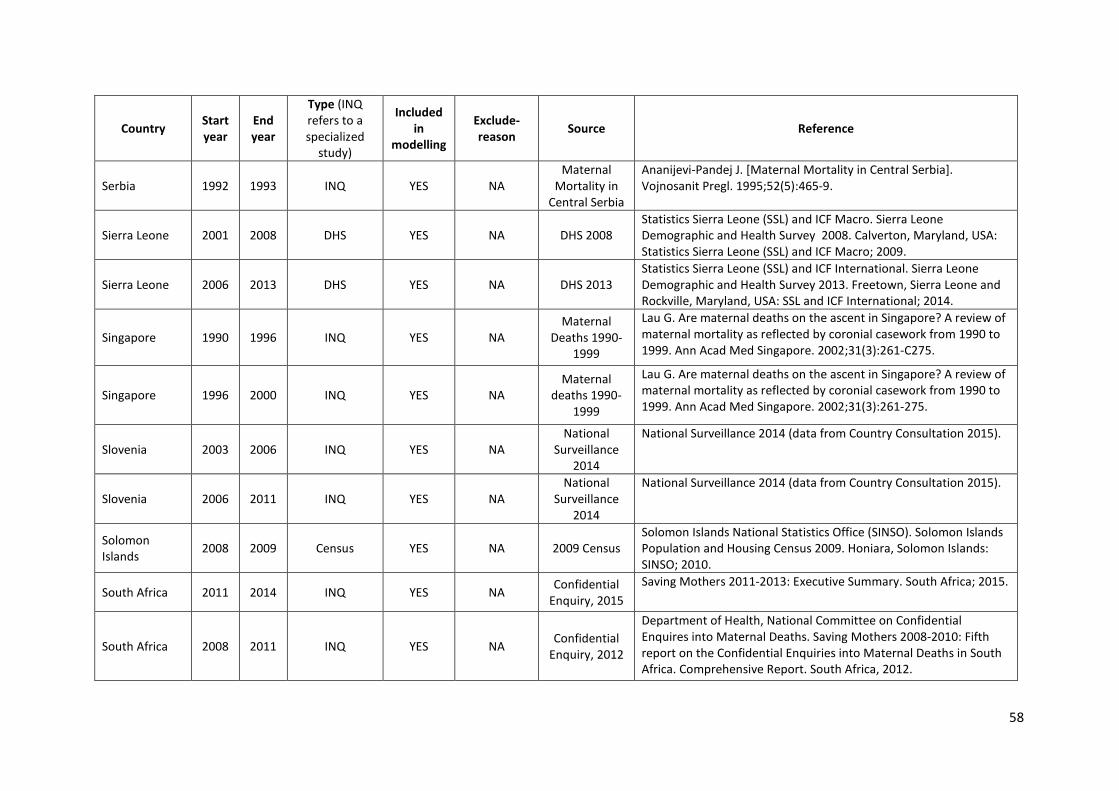
Country Start year
End year
Type (INQ refers to a specialized
study)
Included in
modelling
Exclude-reason Source Reference
Serbia 1992 1993 INQ YES NA Maternal
Mortality in Central Serbia
Ananijevi-Pandej J. [Maternal Mortality in Central Serbia]. Vojnosanit Pregl. 1995;52(5):465-9.
Sierra Leone 2001 2008 DHS YES NA DHS 2008 Statistics Sierra Leone (SSL) and ICF Macro. Sierra Leone Demographic and Health Survey 2008. Calverton, Maryland, USA: Statistics Sierra Leone (SSL) and ICF Macro; 2009.
Sierra Leone 2006 2013 DHS YES NA DHS 2013 Statistics Sierra Leone (SSL) and ICF International. Sierra Leone Demographic and Health Survey 2013. Freetown, Sierra Leone and Rockville, Maryland, USA: SSL and ICF International; 2014.
Singapore 1990 1996 INQ YES NA Maternal
Deaths 1990-1999
Lau G. Are maternal deaths on the ascent in Singapore? A review of maternal mortality as reflected by coronial casework from 1990 to 1999. Ann Acad Med Singapore. 2002;31(3):261-C275.
Singapore 1996 2000 INQ YES NA Maternal
deaths 1990-1999
Lau G. Are maternal deaths on the ascent in Singapore? A review of maternal mortality as reflected by coronial casework from 1990 to 1999. Ann Acad Med Singapore. 2002;31(3):261-275.
Slovenia 2003 2006 INQ YES NA National
Surveillance 2014
National Surveillance 2014 (data from Country Consultation 2015).
Slovenia 2006 2011 INQ YES NA National
Surveillance 2014
National Surveillance 2014 (data from Country Consultation 2015).
Solomon Islands 2008 2009 Census YES NA 2009 Census
Solomon Islands National Statistics Office (SINSO). Solomon Islands Population and Housing Census 2009. Honiara, Solomon Islands: SINSO; 2010.
South Africa 2011 2014 INQ YES NA Confidential Enquiry, 2015
Saving Mothers 2011-2013: Executive Summary. South Africa; 2015.
South Africa 2008 2011 INQ YES NA Confidential Enquiry, 2012
Department of Health, National Committee on Confidential Enquires into Maternal Deaths. Saving Mothers 2008-2010: Fifth report on the Confidential Enquiries into Maternal Deaths in South Africa. Comprehensive Report. South Africa, 2012.
58

Country Start year
End year
Type (INQ refers to a specialized
study)
Included in
modelling
Exclude-reason Source Reference
South Africa 2005 2008 INQ YES NA Confidential Enquiry, 2012
Department of Health, National Committee on Confidential Enquires into Maternal Deaths. Saving Mothers 2008-2010: Fifth report on the Confidential Enquiries into Maternal Deaths in South Africa. Comprehensive Report. South Africa, 2012.
South Africa 2002 2005 INQ YES NA Confidential Enquiry, 2012
Department of Health, National Committee on Confidential Enquires into Maternal Deaths. Saving Mothers 2008-2010: Fifth report on the Confidential Enquiries into Maternal Deaths in South Africa. Comprehensive Report. South Africa, 2012.
South Africa 1998 1999 INQ YES NA
Rapid Mortality
Surveillance Report 2013
Dorrington RE, Bradshaw D, Laubscher R, Nannan N. Rapid Mortality Surveillance Report 2013. Cape Town: South African Medical Research Council; 2014.
South Africa 1999 2000 INQ YES NA
Rapid Mortality
Surveillance Report 2013
Dorrington RE, Bradshaw D, Laubscher R, Nannan N. Rapid Mortality Surveillance Report 2013. Cape Town: South African Medical Research Council; 2014.
South Africa 2000 2001 INQ YES NA
Rapid Mortality
Surveillance Report 2013
Dorrington RE, Bradshaw D, Laubscher R, Nannan N. (2014). Rapid Mmortality Ssurveillance Rreport 2013. Cape Town: South African Medical Research Council; 2014.
South Africa 2001 2002 INQ YES NA
Rapid Mortality
Surveillance Rreport 2013
Dorrington RE, Bradshaw D, Laubscher R, Nannan N. (2014). Rapid Mmortality Ssurveillance Rreport 2013. Cape Town: South African Medical Research Council; 2014.
South Africa 2002 2003 INQ YES NA
Rapid Mortality
Surveillance Rreport 2013
Dorrington RE, Bradshaw D, Laubscher R, Nannan N. (2014). Rapid Mmortality Ssurveillance Rreport 2013. Cape Town: South African Medical Research Council; 2014.
South Africa 2003 2004 INQ YES NA
Rapid Mortality
Surveillance Rreport 2013
Dorrington RE, Bradshaw D, Laubscher R, Nannan N. (2014). Rapid Mmortality Ssurveillance Rreport 2013. Cape Town: South African Medical Research Council; 2014.
59

Country Start year
End year
Type (INQ refers to a specialized
study)
Included in
modelling
Exclude-reason Source Reference
South Africa 2004 2005 INQ YES NA
Rapid Mortality
Surveillance Rreport 2013
Dorrington RE, Bradshaw D, Laubscher R, Nannan N. (2014). Rapid Mmortality Ssurveillance Rreport 2013. Cape Town: South African Medical Research Council; 2014.
South Africa 2005 2006 INQ YES NA
Rapid Mortality
Surveillance Rreport 2013
Dorrington RE, Bradshaw D, Laubscher R, Nannan N. (2014). Rapid Mmortality Ssurveillance Rreport 2013. Cape Town: South African Medical Research Council; 2014.
South Africa 2006 2007 INQ YES NA
Rapid Mortality
Surveillance Rreport 2013
Dorrington RE, Bradshaw D, Laubscher R, Nannan N. (2014). Rapid Mmortality Ssurveillance Rreport 2013. Cape Town: South African Medical Research Council; 2014.
South Africa 2007 2008 INQ YES NA
Rapid Mortality
Suurveillance Rreport 2013
Dorrington RE, Bradshaw D, Laubscher R, Nannan N. (2014). Rapid Mmortality Ssurveillance Rreport 2013. Cape Town: South African Medical Research Council; 2014.
South Africa 2008 2009 INQ YES NA
Rapid Mortality
Surveillance Rreport 2013
Dorrington RE, Bradshaw D, Laubscher R, Nannan N. (2014). Rapid Mmortality Ssurveillance Rreport 2013. Cape Town: South African Medical Research Council; 2014.
South Africa 2009 2010 INQ YES NA
Rapid Mortality
Suveillance Rreport 2013
Dorrington RE, Bradshaw D, Laubscher R, Nannan N. (2014). Rapid Mmortality Ssurveillance Rreport 2013. Cape Town: South African Medical Research Council; 2014.
South Africa 2010 2011 INQ YES NA
Rapid Mortality
Surveillance Rreport 2013
Dorrington RE, Bradshaw D, Laubscher R, Nannan N. (2014). Rapid Mmortality Ssurveillance Rreport 2013. Cape Town: South African Medical Research Council; 2014.
South Africa 2011 2012 INQ YES NA
Rapid Mortality
Surveillance Rreport 2013
Dorrington RE, Bradshaw D, Laubscher R, Nannan N. (2014). Rapid Mmortality Ssurveillance Rreport 2013. Cape Town: South African Medical Research Council; 2014.
60

Country Start year
End year
Type (INQ refers to a specialized
study)
Included in
modelling
Exclude-reason Source Reference
South Africa 2012 2013 INQ YES NA
Rapid Mortality
Surveillance Rreport 2013
Dorrington RE, Bradshaw D, Laubscher R, Nannan N. (2014). Rapid Mmortality Ssurveillance Rreport 2013. Cape Town: South African Medical Research Council; 2014.
South Africa 2013 2014 INQ YES NA
Rapid Mortality
Surveillance Rreport 2013
Dorrington RE, Bradshaw D, Laubscher R, Nannan N. (2014). Rapid Mmortality Ssurveillance Rreport 2013. Cape Town: South African Medical Research Council; 2014.
South Africa 1991 1998 DHS YES NA DHS 1998
Department of Health, Medical Research Council, Macro-International. South Africa Demographic and Health Survey 1998. Full Report. Pretoria, South Africa: Department of Health; 2000.
South Africa 2000 2001 Census YES NA Census 2001 Statistics South Africa. South Africa Census 2001. South Africa; 2002.
South Africa 2006 2007 Miscellaneous YES NA 2007
Community Survey
Statistics South Africa. South Africa Community Survey 2007. Pretoria, South Africa: Statistics South Africa; 2008..
South Africa 2010 2011 Census YES NA Census 2011 Statistics South Africa. South Africa Census 2011. South Africa; 2012.
South Sudan 2004 2006 SHHS YES NA SHHS 2006
Federal Ministry of Health, Government of National Unity, Ministry of Health, Government of Southern Sudan, Central Bureau of Statistics, and Southern Sudan Commission for Census. Sudan Household Health Survey 2006. National Report, Sudan; 2007.
South Sudan 2007 2008 Census YES NA Census 2008
National Population Census Council, Central Bureau of Statistics, Southern Sudan Centre for Census, Statistics and Evaluation (SSCCSE). Sudan Population and Housing Census 2008. Sudan; 2009.
Sri Lanka 1995 1996 Miscellaneous YES NA Family Health Bureau 2009
Ministry of Health. Annual Report on Family Health Sri Lanka 2006-2007. Family Health Bureau. Sri Lanka; 2009.
Sri Lanka 1996 1997 Miscellaneous YES NA Family Health Bureau 2009
Ministry of Health. Annual Report on Family Health Sri Lanka 2006-2007. Family Health Bureau. Sri Lanka; 2009.
61
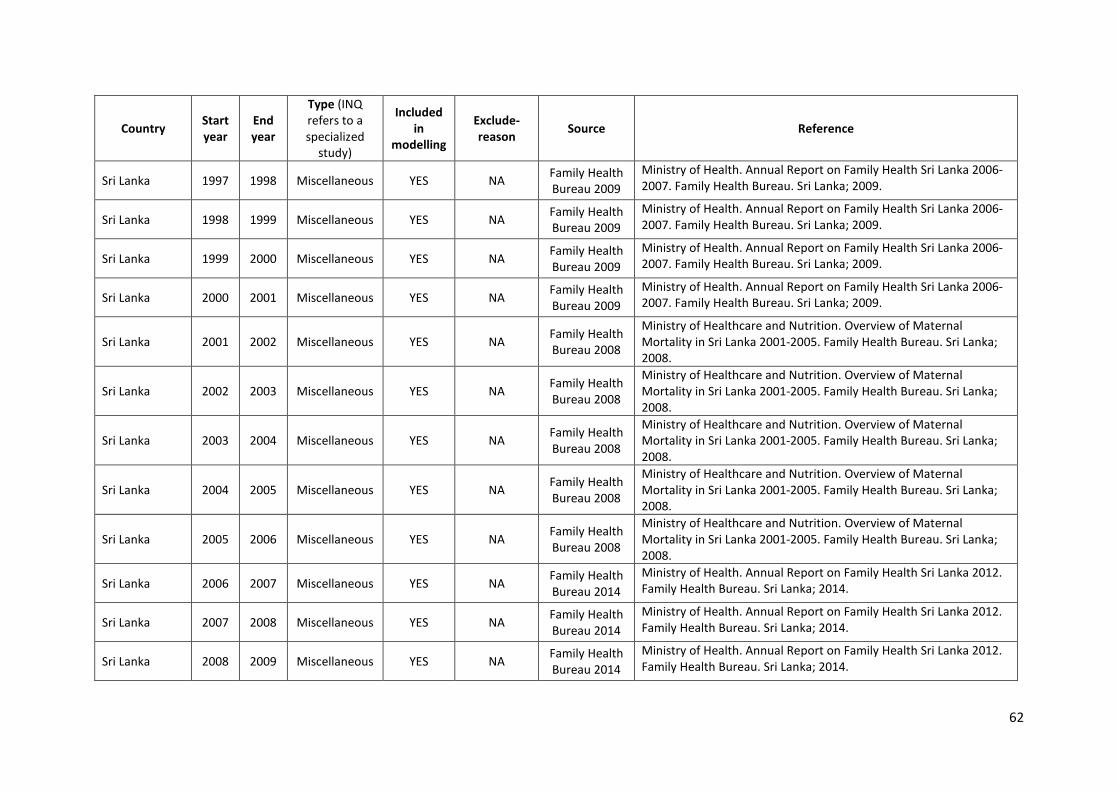
Country Start year
End year
Type (INQ refers to a specialized
study)
Included in
modelling
Exclude-reason Source Reference
Sri Lanka 1997 1998 Miscellaneous YES NA Family Health Bureau 2009
Ministry of Health. Annual Report on Family Health Sri Lanka 2006-2007. Family Health Bureau. Sri Lanka; 2009.
Sri Lanka 1998 1999 Miscellaneous YES NA Family Health Bureau 2009
Ministry of Health. Annual Report on Family Health Sri Lanka 2006-2007. Family Health Bureau. Sri Lanka; 2009.
Sri Lanka 1999 2000 Miscellaneous YES NA Family Health Bureau 2009
Ministry of Health. Annual Report on Family Health Sri Lanka 2006-2007. Family Health Bureau. Sri Lanka; 2009.
Sri Lanka 2000 2001 Miscellaneous YES NA Family Health Bureau 2009
Ministry of Health. Annual Report on Family Health Sri Lanka 2006-2007. Family Health Bureau. Sri Lanka; 2009.
Sri Lanka 2001 2002 Miscellaneous YES NA Family Health Bureau 2008
Ministry of Healthcare and Nutrition. Overview of Maternal Mortality in Sri Lanka 2001-2005. Family Health Bureau. Sri Lanka; 2008.
Sri Lanka 2002 2003 Miscellaneous YES NA Family Health Bureau 2008
Ministry of Healthcare and Nutrition. Overview of Maternal Mortality in Sri Lanka 2001-2005. Family Health Bureau. Sri Lanka; 2008.
Sri Lanka 2003 2004 Miscellaneous YES NA Family Health Bureau 2008
Ministry of Healthcare and Nutrition. Overview of Maternal Mortality in Sri Lanka 2001-2005. Family Health Bureau. Sri Lanka; 2008.
Sri Lanka 2004 2005 Miscellaneous YES NA Family Health Bureau 2008
Ministry of Healthcare and Nutrition. Overview of Maternal Mortality in Sri Lanka 2001-2005. Family Health Bureau. Sri Lanka; 2008.
Sri Lanka 2005 2006 Miscellaneous YES NA Family Health Bureau 2008
Ministry of Healthcare and Nutrition. Overview of Maternal Mortality in Sri Lanka 2001-2005. Family Health Bureau. Sri Lanka; 2008.
Sri Lanka 2006 2007 Miscellaneous YES NA Family Health Bureau 2014
Ministry of Health. Annual Report on Family Health Sri Lanka 2012. Family Health Bureau. Sri Lanka; 2014.
Sri Lanka 2007 2008 Miscellaneous YES NA Family Health Bureau 2014
Ministry of Health. Annual Report on Family Health Sri Lanka 2012. Family Health Bureau. Sri Lanka; 2014.
Sri Lanka 2008 2009 Miscellaneous YES NA Family Health Bureau 2014
Ministry of Health. Annual Report on Family Health Sri Lanka 2012. Family Health Bureau. Sri Lanka; 2014.
62

Country Start year
End year
Type (INQ refers to a specialized
study)
Included in
modelling
Exclude-reason Source Reference
Sri Lanka 2009 2010 Miscellaneous YES NA Family Health Bureau 2014
Ministry of Health. Annual Report on Family Health Sri Lanka 2012. Family Health Bureau. Sri Lanka; 2014.
Sri Lanka 2010 2011 Miscellaneous YES NA Family Health Bureau 2014
Ministry of Health. Annual Report on Family Health Sri Lanka 2012. Family Health Bureau. Sri Lanka; 2014.
Sri Lanka 2011 2012 Miscellaneous YES NA Family Health Bureau 2014
Ministry of Health. Annual Report on Family Health Sri Lanka 2012. Family Health Bureau. Sri Lanka; 2014.
Sri Lanka 2012 2013 Miscellaneous YES NA Family Health Bureau 2014
Ministry of Health. Annual Report on Family Health Sri Lanka 2012. Family Health Bureau. Sri Lanka; 2014.
Sudan 1983 1984 DHS NO Reference Period is
Before 1985
DHS 1989-1990
Department of Statistics, Ministry of Economic and National Planning, Macro International. Sudan Demographic and Health Survey 1989/1990. Columbia, Maryland, USA; 1991.
Sudan 2004 2006 SHHS YES NA SHHS 2006
Federal Ministry of Health, Government of National Unity, Ministry of Health, Government of Southern Sudan, Central Bureau of Statistics, and Southern Sudan Commission for Census. Sudan Household Health Survey 2006. National Report, Sudan; 2007.
Sudan 2008 2010 SHHS YES NA SHHS 2010
Federal Ministry of Health, Central Bureau of Statistics. Sudan Household and Health Survey -2, 2010, National report. Khartoum, Republic of Sudan: Federal Ministry of Health and Central Bureau of Statistics; 2012.
Sudan 2007 2008 Census YES NA Census 2008 National Population Census Council, Central Bureau of Statistics, Southern Sudan Centre for Census, Statistics and Evaluation (SSCCSE). Sudan Population and Housing Census 2008. Sudan; 2009.
Suriname 1991 1994 INQ YES NA
Nationwide maternal
mortality in Surinam, 1991-93
Mungra A, van Kanten RW, Kanhai HH, van Roosmalen J. Nationwide maternal mortality in Surinam. Br J Obstet Gynaecol. 1999;106(1):55-9.
63

Country Start year
End year
Type (INQ refers to a specialized
study)
Included in
modelling
Exclude-reason Source Reference
Swaziland 1999 2006 DHSDHS YES NA DHS 2006-2007
Central Statistical Office (CSO) [Swaziland], and Macro International Inc. Swaziland Demographic and Health Survey 2006-07. Mbabane, Swaziland: Central Statistical Office and Macro International Inc.; 2008.
Swaziland 2006 2007 Census YES NA 2007 Census Central Statistical Office. Swaziland Population and Housing Census 2007. Swaziland; 2008.
Sweden 1988 2008 INQ YES NA
Maternal Mortality in
Sweden 1988-2007
Esscher A, Hogberg U, Haglund B, Essen B. Maternal mortality in Sweden 1988–2007: more deaths than officially reported. Acta Obstet Gynecol Scand 2013,92(1):40-C6.
Sweden 1997 2006 INQ YES NA
Maternal mortality in
Sweden 1997-2005
Grunewald C, et al. Modradodligheten underskattad i Sverige. Lakartidningen. 2008;34(105):2250-C53.
Syrian Arab Republic 2008 2010 FHS YES NA FHS 2009
Central Bureau of Statistics. Family Health Survey 2009. Syrian Arab Republic; 2010.
Syrian Arab Republic 2008 2009 Miscellaneous YES NA CBS 2008
Central Bureau of Statistics. 2012.
United Republic of Tanzania
1989 1996 DHS YES NA DHS 1996 Bureau of Statistics [Tanzania] and Macro International Inc. Tanzania Demographic and Health Survey 1996. Calverton, Maryland: Bureau of Statistics and Macro International; 1997.
United Republic of Tanzania
1997 2004 DHS YES NA DHS 2004-2005
National Bureau of Statistics (NBS) [Tanzania] and ORC Macro. Tanzania Demographic and Health Survey 2004-05. Dar es Salaam, Tanzania: National Bureau of Statistics and ORC Macro; 2005.
United Republic of Tanzania
2003 2010 DHS YES NA DHS 2010
National Bureau of Statistics (NBS) [Tanzania] and ICF Macro. Tanzania Demographic and Health Survey 2010. Dar es Salaam, Tanzania: NBS and ICF Macro; 2011.
64
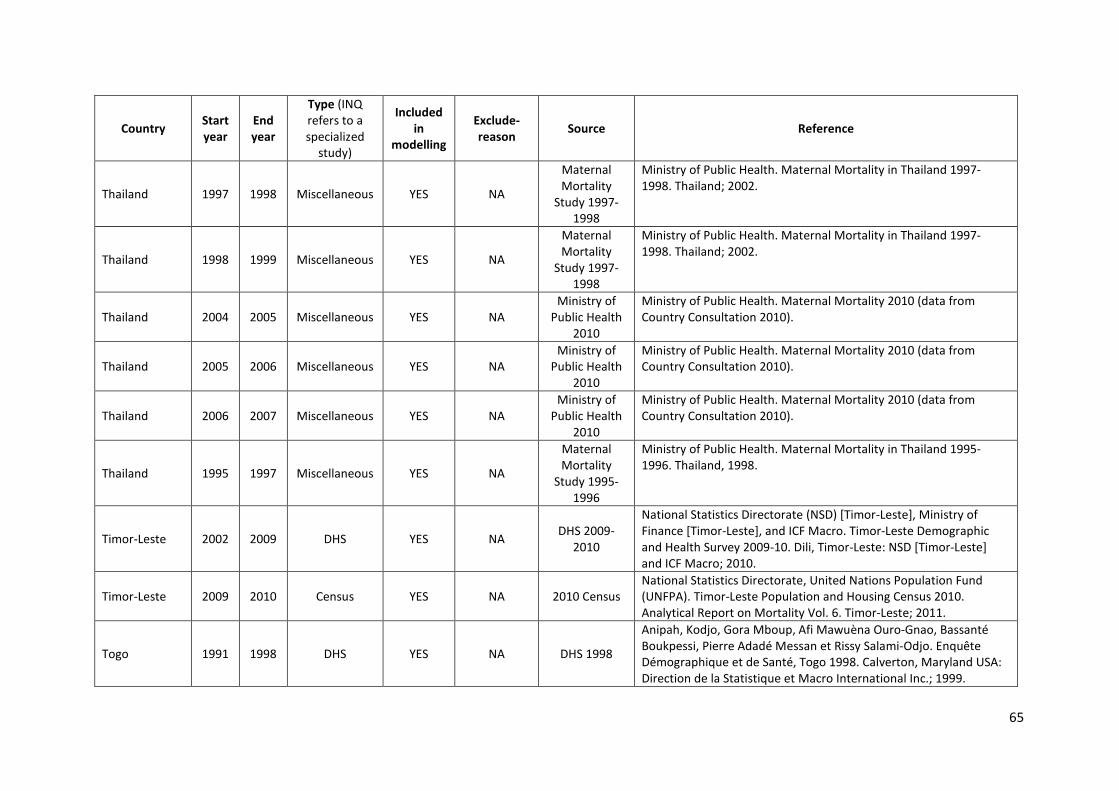
Country Start year
End year
Type (INQ refers to a specialized
study)
Included in
modelling
Exclude-reason Source Reference
Thailand 1997 1998 Miscellaneous YES NA
Maternal Mortality
Study 1997-1998
Ministry of Public Health. Maternal Mortality in Thailand 1997-1998. Thailand; 2002.
Thailand 1998 1999 Miscellaneous YES NA
Maternal Mortality
Study 1997-1998
Ministry of Public Health. Maternal Mortality in Thailand 1997-1998. Thailand; 2002.
Thailand 2004 2005 Miscellaneous YES NA Ministry of
Public Health 2010
Ministry of Public Health. Maternal Mortality 2010 (data from Country Consultation 2010).
Thailand 2005 2006 Miscellaneous YES NA Ministry of
Public Health 2010
Ministry of Public Health. Maternal Mortality 2010 (data from Country Consultation 2010).
Thailand 2006 2007 Miscellaneous YES NA Ministry of
Public Health 2010
Ministry of Public Health. Maternal Mortality 2010 (data from Country Consultation 2010).
Thailand 1995 1997 Miscellaneous YES NA
Maternal Mortality
Study 1995-1996
Ministry of Public Health. Maternal Mortality in Thailand 1995-1996. Thailand, 1998.
Timor-Leste 2002 2009 DHS YES NA DHS 2009-2010
National Statistics Directorate (NSD) [Timor-Leste], Ministry of Finance [Timor-Leste], and ICF Macro. Timor-Leste Demographic and Health Survey 2009-10. Dili, Timor-Leste: NSD [Timor-Leste] and ICF Macro; 2010.
Timor-Leste 2009 2010 Census YES NA 2010 Census National Statistics Directorate, United Nations Population Fund (UNFPA). Timor-Leste Population and Housing Census 2010. Analytical Report on Mortality Vol. 6. Timor-Leste; 2011.
Togo 1991 1998 DHS YES NA DHS 1998
Anipah, Kodjo, Gora Mboup, Afi Mawuèna Ouro-Gnao, Bassanté Boukpessi, Pierre Adadé Messan et Rissy Salami-Odjo. Enquête Démographique et de Santé, Togo 1998. Calverton, Maryland USA: Direction de la Statistique et Macro International Inc.; 1999.
65

Country Start year
End year
Type (INQ refers to a specialized
study)
Included in
modelling
Exclude-reason Source Reference
Togo 2008 2014 Miscellaneous YES NA DHS 2013 Ministère de la Planification, Maesure DSH, ICF International. Enquete Démoraphic et de Santé Togo 2013. Rapport Préliminaire. ICF International, Rockville, Maryland, USA; 2014.
Tunisia 1993 1994 Miscellaneous YES NA MMS 1993-1994
Ministère de la Santé. Résultats de l'Enquête Nutritionale sur la Mortalité Maternelle en Tunisie 1993-1994. Tunisie; 1995.
Tunisia 2008 2009 Miscellaneous YES NA MMS 2008 Ministère de la Santé. Résultats de l'Enquête Nationale sur la Mortalité Maternelle en Tunisie 2008. Rapport Préliminaire. Tunis; 2010.
Turkey 2005 2006 INQ YES NA NMMS 2005
Hacettepe University Institute of Population Studies, ICON-INSTITUT Public Sector GmbH and BNB Consulting. National Maternal Mortality Study, 2005. Ministry of Health, General Directorate of Mother and Child Health and Family Planning and Delegation of European Commission to Turkey, Ankara; 2006.
Turkey 2007 2008 Miscellaneous YES NA Maternal
Mortality Data System 2013
Ministry of Health. Maternal Mortality Data System 2013 (Data from Country Consultation 2013).
Turkey 2008 2009 Miscellaneous YES NA Maternal
Mortality Data System 2013
Ministry of Health. Maternal Mortality Data System 2013 (Data from Country Consultation 2013).
Turkey 2009 2010 Miscellaneous YES NA Maternal
Mortality Data System 2013
Ministry of Health. Maternal Mortality Data System 2013 (Data from Country Consultation 2013).
Turkey 2010 2011 Miscellaneous YES NA Maternal
Mortality Data System 2013
Ministry of Health. Maternal Mortality Data System 2013 (Data from Country Consultation 2013).
Turkey 2011 2012 Miscellaneous YES NA Maternal
Mortality Data System 2013
Ministry of Health. Maternal Mortality Data System 2013 (Data from Country Consultation 2013).
Turkey 2012 2013 Miscellaneous YES NA Maternal
Mortality Data System 2013
Ministry of Health. Maternal Mortality Data System 2013 (Data from Country Consultation 2013).
66
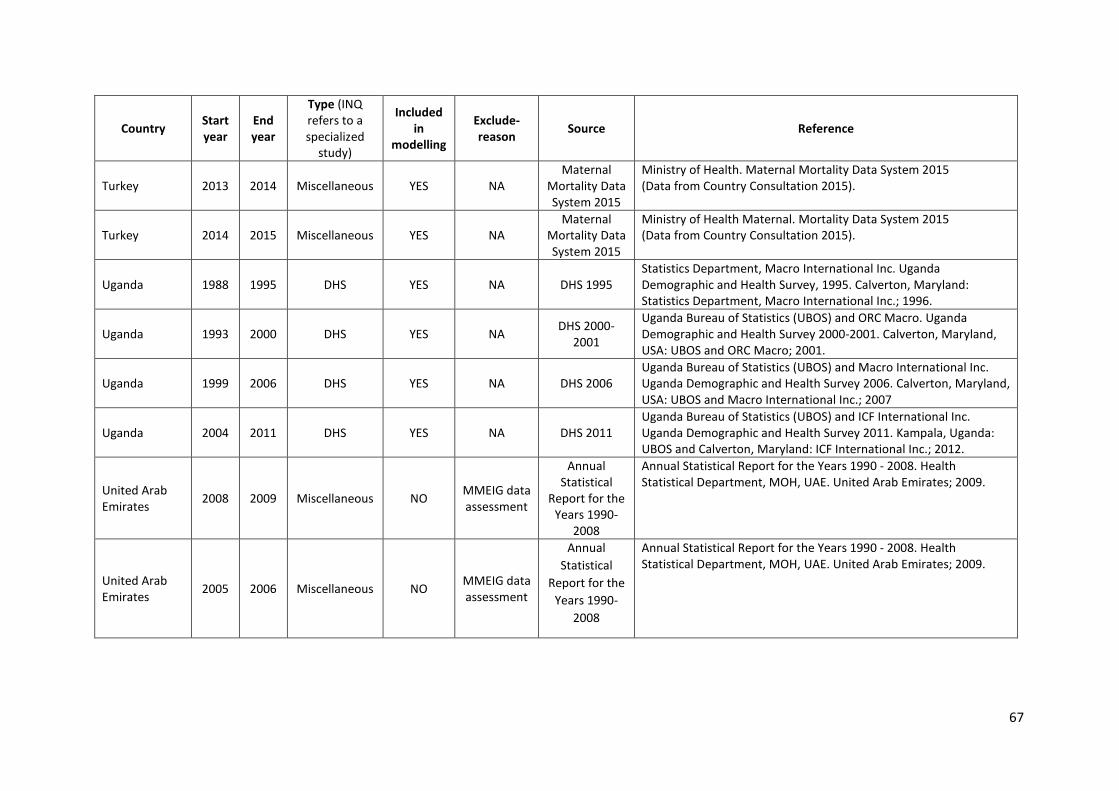
Country Start year
End year
Type (INQ refers to a specialized
study)
Included in
modelling
Exclude-reason Source Reference
Turkey 2013 2014 Miscellaneous YES NA Maternal
Mortality Data System 2015
Ministry of Health. Maternal Mortality Data System 2015 (Data from Country Consultation 2015).
Turkey 2014 2015 Miscellaneous YES NA Maternal
Mortality Data System 2015
Ministry of Health Maternal. Mortality Data System 2015 (Data from Country Consultation 2015).
Uganda 1988 1995 DHS YES NA DHS 1995 Statistics Department, Macro International Inc. Uganda Demographic and Health Survey, 1995. Calverton, Maryland: Statistics Department, Macro International Inc.; 1996.
Uganda 1993 2000 DHS YES NA DHS 2000-2001
Uganda Bureau of Statistics (UBOS) and ORC Macro. Uganda Demographic and Health Survey 2000-2001. Calverton, Maryland, USA: UBOS and ORC Macro; 2001.
Uganda 1999 2006 DHS YES NA DHS 2006 Uganda Bureau of Statistics (UBOS) and Macro International Inc. Uganda Demographic and Health Survey 2006. Calverton, Maryland, USA: UBOS and Macro International Inc.; 2007
Uganda 2004 2011 DHS YES NA DHS 2011 Uganda Bureau of Statistics (UBOS) and ICF International Inc. Uganda Demographic and Health Survey 2011. Kampala, Uganda: UBOS and Calverton, Maryland: ICF International Inc.; 2012.
United Arab Emirates 2008 2009 Miscellaneous NO MMEIG data
assessment
Annual Statistical
Report for the Years 1990-
2008
Annual Statistical Report for the Years 1990 - 2008. Health Statistical Department, MOH, UAE. United Arab Emirates; 2009.
United Arab Emirates 2005 2006 Miscellaneous NO MMEIG data
assessment
Annual Statistical
Report for the Years 1990-
2008
Annual Statistical Report for the Years 1990 - 2008. Health Statistical Department, MOH, UAE. United Arab Emirates; 2009.
67

Country Start year
End year
Type (INQ refers to a specialized
study)
Included in
modelling
Exclude-reason Source Reference
United Arab Emirates 2000 2001 Miscellaneous NO MMEIG data
assessment
Annual Statistical
Report for the Years 1990-
2008
Annual Statistical Report for the Years 1990 - 2008. Health Statistical Department, MOH, UAE. United Arab Emirates; 2009.
United Arab Emirates 1995 1996 Miscellaneous NO MMEIG data
assessment
Annual Statistical
Report for the Years 1990-
2008
Annual Statistical Report for the Years 1990 - 2008. Health Statistical Department, MOH, UAE. United Arab Emirates; 2009.
United Arab Emirates 1990 1991 Miscellaneous NO MMEIG data
assessment
Annual Statistical
Report for the Years 1990-
2008
Annual Statistical Report for the Years 1990 - 2008. Health Statistical Department, MOH, UAE. United Arab Emirates; 2009.
United Kingdom 1985 1988 INQ YES NA CMACE, 2011
Centre for Maternal and Child Enquiries (CMACE). Saving Mothers’ Lives: Reviewing maternal deaths to make motherhood safer: 2006-2008. The eighth report on Confidential Enquiries into Maternal Deaths in the United Kingdom. BJOG. 2011;118(Suppl.1):1-C203.
United Kingdom 1988 1991 INQ YES NA CMACE, 2011
Centre for Maternal and Child Enquiries (CMACE). Saving Mothers’ Lives: Reviewing maternal deaths to make motherhood safer: 2006-2008. The eighth report on Confidential Enquiries into Maternal Deaths in the United Kingdom. BJOG. 2011;118(Suppl.1):1-C203.
United Kingdom 1991 1994 INQ YES NA CMACE, 2011
Centre for Maternal and Child Enquiries (CMACE). Saving Mothers’ Lives: Reviewing maternal deaths to make motherhood safer: 2006-2008. The eighth report on Confidential Enquiries into Maternal Deaths in the United Kingdom. BJOG. 2011;118(Suppl.1):1-C203.
68

Country Start year
End year
Type (INQ refers to a specialized
study)
Included in
modelling
Exclude-reason Source Reference
United Kingdom 1994 1997 INQ YES NA CMACE, 2011
Centre for Maternal and Child Enquiries (CMACE). Saving Mothers’ Lives: Reviewing maternal deaths to make motherhood safer: 2006-2008. The eighth report on Confidential Enquiries into Maternal Deaths in the United Kingdom. BJOG. 2011;118(Suppl.1):1-C203.
United Kingdom 1997 2000 INQ YES NA CMACE, 2011
Centre for Maternal and Child Enquiries (CMACE). Saving Mothers’ Lives: Reviewing maternal deaths to make motherhood safer: 2006-2008. The eighth report on Confidential Enquiries into Maternal Deaths in the United Kingdom. BJOG. 2011;118(Suppl.1):1-C203.
United Kingdom 2000 2003 INQ YES NA CMACE, 2011
Centre for Maternal and Child Enquiries (CMACE). Saving Mothers’ Lives: Reviewing maternal deaths to make motherhood safer: 2006-2008. The eighth report on Confidential Enquiries into Maternal Deaths in the United Kingdom. BJOG. 2011;118(Suppl.1):1-203.
United Kingdom 2003 2006 INQ YES NA CMACE, 2011
Centre for Maternal and Child Enquiries (CMACE). Saving Mothers’ Lives: Reviewing maternal deaths to make motherhood safer: 2006-2008. The eighth report on Confidential Enquiries into Maternal Deaths in the United Kingdom. BJOG. 2011;118(Suppl.1):1-203.
United Kingdom 2006 2009 INQ YES NA CMACE, 2011
Centre for Maternal and Child Enquiries (CMACE). Saving Mothers’ Lives: Reviewing maternal deaths to make motherhood safer: 2006-2008. The eighth report on Confidential Enquiries into Maternal Deaths in the United Kingdom. BJOG. 2011;118(Suppl.1):1-203.
United Kingdom 2009 2012 INQ YES NA MBRRACE-UK
2014
Knight M, Kenyon S, Br-klehurst P, Neilson J, Shakespeare J, Kuri-zuk JJ (Eds.) on behalf of MBRRACE-UK. Saving Lives, Improving Mothers’ Care - Lessons learned to inform future maternity care from the UK and Ireland Confidential Enquiries into Maternal Deaths and Morbidity 2009-12. Oxford: National Perinatal Epidemiology Unit, University of Oxford; 2014.
69

Country Start year
End year
Type (INQ refers to a specialized
study)
Included in
modelling
Exclude-reason Source Reference
United Kingdom 2010 2013 INQ YES NA MBRRACE-UK
2014
Knight M, Kenyon S, Br-klehurst P, Neilson J, Shakespeare J, Kuri-zuk JJ (Eds.) on behalf of MBRRACE-UK. Saving Lives, Improving Mothers’ Care - Lessons learned to inform future maternity care from the UK and Ireland Confidential Enquiries into Maternal Deaths and Morbidity 2009-12. Oxford: National Perinatal Epidemiology Unit, University of Oxford; 2014.
United States of America 1991 1998 INQ YES NA
Pregnancy-related
mortality in the United
States, 1991-1997
Berg CJ, Chang J, Callaghan WM, Whitehead SJ. Pregnancy-related mortality in the United States, 1991-1997. Obstet Gynecol. 2003,101(2):289-96.
United States of America 1995 1998 INQ YES NA
An assessment of pregnancy-
related mortality in the United
States 1995-1997
MacKay AP, Berg CJ, Duran C, Chang J, Rosenberg H. An assessment of pregnancy-related mortality in the United States. Paediatric and Perinatal Epidemiology. 2005, 19(3):206-214.
United States of America 1998 1999 INQ YES NA
Pregnancy-related
mortality in the United
States, 1998 to 2005
Berg CJ, Callaghan WM, Syverson C, Henderson Z. Pregnancy-related mortality in the United States, 1998 to 2005. Obstet Gynecol. 2010 Dec;116(6):1302-9.
United States of America 1999 2000 INQ YES NA
Pregnancy-related
mortality in the United
States, 1998 to 2005
Berg CJ, Callaghan WM, Syverson C, Henderson Z. Pregnancy-related mortality in the United States, 1998 to 2005. Obstet Gynecol. 2010 Dec;116(6):1302-9.
70

Country Start year
End year
Type (INQ refers to a specialized
study)
Included in
modelling
Exclude-reason Source Reference
United States of America 2000 2001 INQ YES NA
Pregnancy-related
mortality in the United
States, 1998 to 2005
Berg CJ, Callaghan WM, Syverson C, Henderson Z. Pregnancy-related mortality in the United States, 1998 to 2005. Obstet Gynecol. 2010 Dec;116(6):1302-9.
United States of America 2001 2002 INQ YES NA
Pregnancy-related
mortality in the United
States, 1998 to 2005
Berg CJ, Callaghan WM, Syverson C, Henderson Z. Pregnancy-related mortality in the United States, 1998 to 2005. Obstet Gynecol. 2010 Dec;116(6):1302-9.
United States of America 2002 2003 INQ YES NA
Pregnancy-related
mortality in the United
States, 1998 to 2005
Berg CJ, Callaghan WM, Syverson C, Henderson Z. Pregnancy-related mortality in the United States, 1998 to 2005. Obstet Gynecol. 2010 Dec;116(6):1302-9
United States of America 2003 2004 INQ YES NA
Pregnancy-related
mortality in the United
States, 1998 to 2005
Berg CJ, Callaghan WM, Syverson C, Henderson Z. Pregnancy-related mortality in the United States, 1998 to 2005. Obstet Gynecol. 2010 Dec;116(6):1302-9
United States of America 2004 2005 INQ YES NA
Pregnancy-related
mortality in the United
States, 1998 to 2005
Berg CJ, Callaghan WM, Syverson C, Henderson Z. Pregnancy-related mortality in the United States, 1998 to 2005. Obstet Gynecol. 2010 Dec;116(6):1302-9
71

Country Start year
End year
Type (INQ refers to a specialized
study)
Included in
modelling
Exclude-reason Source Reference
United States of America 2005 2006 INQ YES NA
Pregnancy-related
mortality in the United
States, 1998 to 2005
Berg CJ, Callaghan WM, Syverson C, Henderson Z. Pregnancy-related mortality in the United States, 1998 to 2005. Obstet Gynecol. 2010 Dec;116(6):1302-9
United States of America 2006 2011 INQ YES NA
Pregnancy-related
mortality in the United
States, 2006-2010.
Creanga AA, Berg CJ, Syverson C, Seed K, Bruce FC, Callaghan WM. Pregnancy-related mortality in the United States, 2006-2010. Obstet Gynecol. 2015 Jan;125(1):5-12.
Uruguay 2011 2012 INQ YES NA
Unidad de Información Nacional en Salud, MSP;
2014.
Unidad de información Nacional en Salud, MSP; 2014.
Uruguay 2012 2013 INQ YES NA
Unidad de Información Nacional en Salud, MSP;
2014.
Unidad de información Nacional en Salud, MSP; 2014.
Uruguay 2013 2014 INQ YES NA
Unidad de Información Nacional en Salud, MSP;
2014.
Unidad de información Nacional en Salud, MSP; 2014.
Uruguay 2014 2015 INQ YES NA
Unidad de Información Nacional en Salud, MSP;
2014.
Unidad de información Nacional en Salud, MSP; 2014.
72
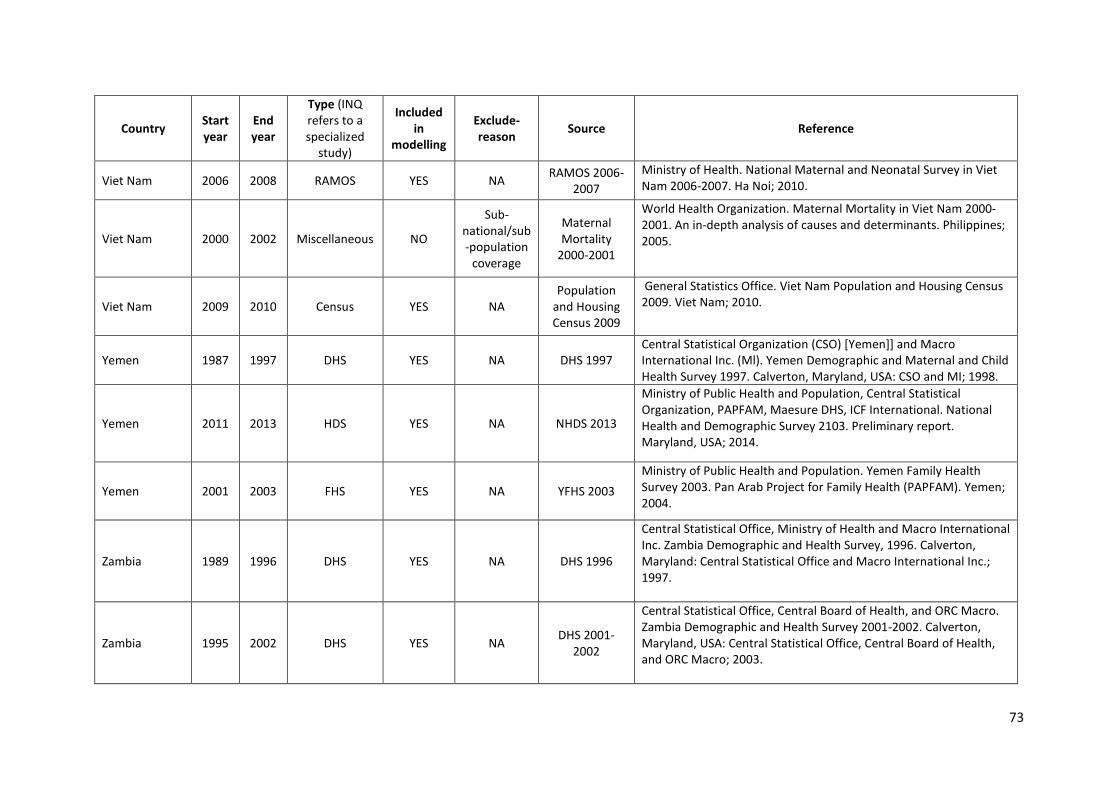
Country Start year
End year
Type (INQ refers to a specialized
study)
Included in
modelling
Exclude-reason Source Reference
Viet Nam 2006 2008 RAMOS YES NA RAMOS 2006-2007
Ministry of Health. National Maternal and Neonatal Survey in Viet Nam 2006-2007. Ha Noi; 2010.
Viet Nam 2000 2002 Miscellaneous NO
Sub-national/sub-population
coverage
Maternal Mortality
2000-2001
World Health Organization. Maternal Mortality in Viet Nam 2000-2001. An in-depth analysis of causes and determinants. Philippines; 2005.
Viet Nam 2009 2010 Census YES NA Population
and Housing Census 2009
General Statistics Office. Viet Nam Population and Housing Census 2009. Viet Nam; 2010.
Yemen 1987 1997 DHS YES NA DHS 1997 Central Statistical Organization (CSO) [Yemen]] and Macro International Inc. (Ml). Yemen Demographic and Maternal and Child Health Survey 1997. Calverton, Maryland, USA: CSO and MI; 1998.
Yemen 2011 2013 HDS YES NA NHDS 2013
Ministry of Public Health and Population, Central Statistical Organization, PAPFAM, Maesure DHS, ICF International. National Health and Demographic Survey 2103. Preliminary report. Maryland, USA; 2014.
Yemen 2001 2003 FHS YES NA YFHS 2003 Ministry of Public Health and Population. Yemen Family Health Survey 2003. Pan Arab Project for Family Health (PAPFAM). Yemen; 2004.
Zambia 1989 1996 DHS YES NA DHS 1996
Central Statistical Office, Ministry of Health and Macro International Inc. Zambia Demographic and Health Survey, 1996. Calverton, Maryland: Central Statistical Office and Macro International Inc.; 1997.
Zambia 1995 2002 DHS YES NA DHS 2001-2002
Central Statistical Office, Central Board of Health, and ORC Macro. Zambia Demographic and Health Survey 2001-2002. Calverton, Maryland, USA: Central Statistical Office, Central Board of Health, and ORC Macro; 2003.
73

Country Start year
End year
Type (INQ refers to a specialized
study)
Included in
modelling
Exclude-reason Source Reference
Zambia 2000 2007 DHS YES NA DHS 2007
Central Statistical Office (CSO), Ministry of Health (MOH), Tropical Diseases Research Centre (TDRC), University of Zambia, and Macro International Inc. Zambia Demographic and Health Survey 2007. Calverton, Maryland, USA: CSO and Macro International Inc.; 2009.
Zambia 2006 2013 DHS YES NA DHS 2013-2014
Central Statistical Office, Ministry of Health, the DHSDHS Program, ICF International. Zambia Demographic and Health Survey 2013-14. Preliminary Report. ICF International: Rockville, Maryland, USA; 2014.
Zambia 2009 2010 Census YES NA Census 2010 Central Statistical Office. Zambia Census of Population and Housing 2010. Zambia; 2011.
Zimbabwe 2006 2007 INQ YES NA Maternal Mortality
Study 2007
Ministry of Health and Child Welfare. Maternal and perinatal Mortality Study 2007. Zimbabwe; 2008.
Zimbabwe 1987 1994 DHS YES NA DHS 1994
Central Statistical Office [Zimbabwe] and Macro International Inc. Zimbabwe Demographic and Health Survey, 1994. Calverton, Maryland, USA: Central Statistical Office and Macro International Inc.; 1995.
Zimbabwe 1992 1999 DHS YES NA DHS 1999
Central Statistical Office [Zimbabwe] and Macro International Inc. Zimbabwe Demographic and Health Survey 1999. Calverton, Maryland, USA: Central Statistical Office and Macro International Inc.; 2000.
Zimbabwe 1998 2005 DHS YES NA DHS 2005-2006
Central Statistical Office (CSO) [Zimbabwe] and Macro International Inc. Zimbabwe Demographic and Health Survey 2005-06. Calverton, Maryland, USA: CSO and Macro International Inc.; 2007.
Zimbabwe 2003 2010 DHS YES NA DHS 2010-2011
Zimbabwe National Statistics Agency (ZIMSTAT) and ICF International. Zimbabwe Demographic and Health Survey 2010-11. Calverton, Maryland: ZIMSTAT and ICF International Inc.; 2012.
Zimbabwe 2007 2014 DHS YES NA MICS 2014 Zimbabwe National Statistics Agency (ZIMSTAT), Zimbabwe Multiple Indicator Cluster Survey 2014, Final Report. Harare, Zimbabwe; 2015.
Zimbabwe 1991 1992 Census YES NA Census 1992 Central Statistical Office. Zimbabwe Population and Housing Census 1992. Zaimbabwe; 1993.
74

Country Start year
End year
Type (INQ refers to a specialized
study)
Included in
modelling
Exclude-reason Source Reference
Zimbabwe 2001 2002 Census YES NA Census 2002 Central Statistical Office. Zimbabwe Population and Housing Census 2002. Zimbabwe; 2003.
Zimbabwe 2011 2012 Census YES NA Census 2012 Zimbabwe National Statistics Agency. Zimbabwe Population and Housing Census 2012. Zimbabwe; 2013.
75

Table 3. Maternal mortality ratio and maternal deaths for 1990, 2000, and 2015, and the annualized rates of reduction for 1990-2000, 2000-2015, and 1990-2015 for MDG regions and 183 countries. Numbers in parentheses refer to 80% UIs.
Note: Reported estimates have been rounded. The MMR (per 100,000 live births) has been rounded according to the following scheme: <1000, rounded to the nearest 1; >= 1000, rounded to nearest 10. The number of maternal deaths has been rounded as follows: <100, rounded to the nearest 1; 100–999, rounded to nearest 10; 1000–9999, rounded to nearest 100; and >10 000, rounded to nearest 1000. ARRs have been rounded to one decimal.
MMR (per 100,000 live births) Number of maternal deaths ARR (%)
Region 1990 2000 2015 1990 2000 2015 1990-2000 2000-2015 1990-2015
World 385 (359 to 427)
341 (325 to 370)
216 (207 to 249)
532000 (496000 to 590000)
442000 (422000 to 479000)
303000 (291000 to 349000) 1.2 (0.5 to 2) 3 (2.1 to 3.4) 2.3 (1.7 to 2.7)
Developed regions
23 (22 to 25)
17 (16 to 18)
12 (11 to 14)
3500 (3400 to 3700)
2200 (2100 to 2300)
1700 (1500 to 1900)
3.3 (2.6 to 3.9)
2.2 (1.4 to 2.8) 2.6 (2.1 to 3)
Northern Africa 171 (145 to 204)
113 (101 to 133)
70 (56 to 92)
6400 (5500 to 7700)
3600 (3300 to 4300)
3100 (2500 to 4100)
4.1 (2.4 to 5.5)
3.2 (1.7 to 4.6) 3.6 (2.4 to 4.5)
Sub-Saharan Africa
987 (898 to 1120)
846 (787 to 941)
546 (511 to 652)
223000 (203000 to 254000)
236000 (220000 to 263000)
201000 (188000 to 240000)
1.5 (0.7 to 2.4)
2.9 (1.7 to 3.5) 2.4 (1.6 to 2.8)
Caucasus and Central Asia
69 (65 to 73)
50 (48 to 54)
33 (27 to 45)
1300 (1300 to 1400) 720 (680 to 780) 610 (500 to 830) 3.1 (2.2 to 4) 2.9 (0.8 to
4.2) 3 (1.7 to 3.8)
Eastern Asia 95 (79 to 114)
59 (53 to 67)
27 (23 to 33)
26000 (22000 to 31000)
9700 (8700 to 11000)
4800 (4000 to 5800) 4.8 (3 to 6.3) 5 (3.9 to 6.5) 5 (4 to 6)
South-eastern Asia
320 (277 to 376)
201 (179 to 228)
110 (95 to 142)
39000 (33000 to 45000)
23000 (21000 to 26000)
13000 (11000 to 17000)
4.7 (3.3 to 5.9) 4 (2.4 to 4.9) 4.3 (3.1 to 5)
Southern Asia 538 (457 to 641)
377 (340 to 429)
176 (153 to 216)
210000 (179000 to 251000)
148000 (133000 to 169000)
66000 (58000 to 81000) 3.6 (2 to 4.9) 5.1 (3.9 to
6.2) 4.5 (3.5 to 5.2)
Western Asia 160 (132 to 199)
122 (105 to 147)
91 (73 to 125)
6700 (5600 to 8400)
5400 (4700 to 6600)
4700 (3800 to 6500) 2.7 (1 to 4.4) 1.9 (-0.2 to
3.5) 2.2 (0.8 to 3.4)
Caribbean 276 (213 to 353)
214 (174 to 269)
175 (130 to 265)
2300 (1800 to 2900)
1700 (1300 to 2100)
1300 (930 to 1900) 2.5 (0 to 4.5) 1.4 (-0.9 to
3) 1.8 (0 to 3.1)
Latin America 124 (118 to 132)
91 (89 to 94)
60 (57 to 66)
14000 (13000 to 15000)
10000 (9800 to 10000)
6000 (5700 to 6700)
3.1 (2.6 to 3.7)
2.8 (2.1 to 3.2) 2.9 (2.5 to 3.3)
Oceania 391 (242 to 673)
292 (166 to 559)
187 (95 to 381) 780 (480 to 1300) 710 (400 to
1400) 500 (260 to
1000) 2.9 (0.1 to
5.6) 3 (0.7 to 5.3) 3 (1.1 to 4.9)
76
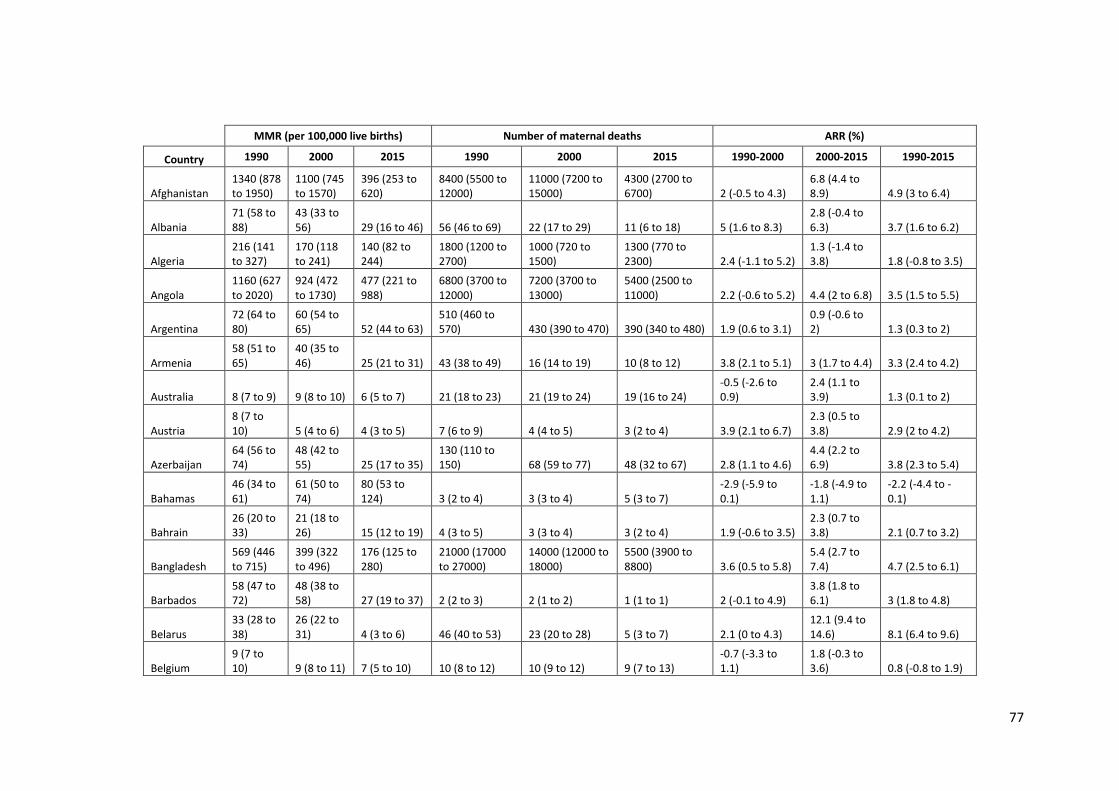
MMR (per 100,000 live births) Number of maternal deaths ARR (%)
Country 1990 2000 2015 1990 2000 2015 1990-2000 2000-2015 1990-2015
Afghanistan 1340 (878 to 1950)
1100 (745 to 1570)
396 (253 to 620)
8400 (5500 to 12000)
11000 (7200 to 15000)
4300 (2700 to 6700) 2 (-0.5 to 4.3)
6.8 (4.4 to 8.9) 4.9 (3 to 6.4)
Albania 71 (58 to 88)
43 (33 to 56) 29 (16 to 46) 56 (46 to 69) 22 (17 to 29) 11 (6 to 18) 5 (1.6 to 8.3)
2.8 (-0.4 to 6.3) 3.7 (1.6 to 6.2)
Algeria 216 (141 to 327)
170 (118 to 241)
140 (82 to 244)
1800 (1200 to 2700)
1000 (720 to 1500)
1300 (770 to 2300) 2.4 (-1.1 to 5.2)
1.3 (-1.4 to 3.8) 1.8 (-0.8 to 3.5)
Angola 1160 (627 to 2020)
924 (472 to 1730)
477 (221 to 988)
6800 (3700 to 12000)
7200 (3700 to 13000)
5400 (2500 to 11000) 2.2 (-0.6 to 5.2) 4.4 (2 to 6.8) 3.5 (1.5 to 5.5)
Argentina 72 (64 to 80)
60 (54 to 65) 52 (44 to 63)
510 (460 to 570) 430 (390 to 470) 390 (340 to 480) 1.9 (0.6 to 3.1)
0.9 (-0.6 to 2) 1.3 (0.3 to 2)
Armenia 58 (51 to 65)
40 (35 to 46) 25 (21 to 31) 43 (38 to 49) 16 (14 to 19) 10 (8 to 12) 3.8 (2.1 to 5.1) 3 (1.7 to 4.4) 3.3 (2.4 to 4.2)
Australia 8 (7 to 9) 9 (8 to 10) 6 (5 to 7) 21 (18 to 23) 21 (19 to 24) 19 (16 to 24) -0.5 (-2.6 to 0.9)
2.4 (1.1 to 3.9) 1.3 (0.1 to 2)
Austria 8 (7 to 10) 5 (4 to 6) 4 (3 to 5) 7 (6 to 9) 4 (4 to 5) 3 (2 to 4) 3.9 (2.1 to 6.7)
2.3 (0.5 to 3.8) 2.9 (2 to 4.2)
Azerbaijan 64 (56 to 74)
48 (42 to 55) 25 (17 to 35)
130 (110 to 150) 68 (59 to 77) 48 (32 to 67) 2.8 (1.1 to 4.6)
4.4 (2.2 to 6.9) 3.8 (2.3 to 5.4)
Bahamas 46 (34 to 61)
61 (50 to 74)
80 (53 to 124) 3 (2 to 4) 3 (3 to 4) 5 (3 to 7)
-2.9 (-5.9 to 0.1)
-1.8 (-4.9 to 1.1)
-2.2 (-4.4 to -0.1)
Bahrain 26 (20 to 33)
21 (18 to 26) 15 (12 to 19) 4 (3 to 5) 3 (3 to 4) 3 (2 to 4) 1.9 (-0.6 to 3.5)
2.3 (0.7 to 3.8) 2.1 (0.7 to 3.2)
Bangladesh 569 (446 to 715)
399 (322 to 496)
176 (125 to 280)
21000 (17000 to 27000)
14000 (12000 to 18000)
5500 (3900 to 8800) 3.6 (0.5 to 5.8)
5.4 (2.7 to 7.4) 4.7 (2.5 to 6.1)
Barbados 58 (47 to 72)
48 (38 to 58) 27 (19 to 37) 2 (2 to 3) 2 (1 to 2) 1 (1 to 1) 2 (-0.1 to 4.9)
3.8 (1.8 to 6.1) 3 (1.8 to 4.8)
Belarus 33 (28 to 38)
26 (22 to 31) 4 (3 to 6) 46 (40 to 53) 23 (20 to 28) 5 (3 to 7) 2.1 (0 to 4.3)
12.1 (9.4 to 14.6) 8.1 (6.4 to 9.6)
Belgium 9 (7 to 10) 9 (8 to 11) 7 (5 to 10) 10 (8 to 12) 10 (9 to 12) 9 (7 to 13)
-0.7 (-3.3 to 1.1)
1.8 (-0.3 to 3.6) 0.8 (-0.8 to 1.9)
77

MMR (per 100,000 live births) Number of maternal deaths ARR (%)
Country 1990 2000 2015 1990 2000 2015 1990-2000 2000-2015 1990-2015
Belize 54 (45 to 65)
53 (45 to 62) 28 (20 to 36) 4 (3 to 4) 4 (3 to 5) 2 (2 to 3) 0.3 (-1.8 to 1.9)
4.3 (2.7 to 6.5) 2.7 (1.6 to 4)
Benin 576 (453 to 726)
572 (448 to 732)
405 (279 to 633)
1300 (1100 to 1700)
1700 (1300 to 2200)
1600 (1100 to 2500) 0.1 (-2.8 to 2.1)
2.3 (-0.2 to 4.4) 1.4 (-0.6 to 2.8)
Bhutan 945 (697 to 1260)
423 (328 to 538)
148 (101 to 241)
180 (140 to 250) 66 (51 to 84) 20 (14 to 32) 8 (5.2 to 10.8) 7 (3.5 to 9.4) 7.4 (5 to 9.1)
Bolivia 425 (340 to 527)
334 (272 to 416)
206 (140 to 351)
1000 (830 to 1300)
860 (700 to 1100) 520 (360 to 890) 2.4 (-0.4 to 4.8) 3.2 (0 to 5.6) 2.9 (0.5 to 4.5)
Bosnia and Herzegovina
28 (23 to 33)
17 (12 to 24) 11 (7 to 17) 18 (15 to 21) 7 (5 to 9) 4 (2 to 6) 4.6 (2.1 to 7.5) 2.9 (0.8 to 5) 3.6 (2.1 to 5.4)
Botswana 243 (149 to 352)
311 (261 to 361)
129 (102 to 172) 120 (71 to 170) 150 (120 to 170) 72 (57 to 95)
-2.5 (-6.3 to 0.3)
5.9 (3.5 to 7.6) 2.5 (0.1 to 4.2)
Brazil 104 (91 to 119)
66 (64 to 67) 44 (36 to 54)
3800 (3300 to 4400)
2400 (2400 to 2500)
1300 (1100 to 1600) 4.6 (3.2 to 6) 2.7 (1.3 to 4) 3.5 (2.5 to 4.5)
Brunei Darussalam
35 (25 to 48)
31 (25 to 39) 23 (15 to 30) 3 (2 to 4) 2 (2 to 3) 2 (1 to 2) 1.3 (-2.4 to 3.9)
2.1 (0.1 to 5.3) 1.8 (0.3 to 3.7)
Bulgaria 25 (21 to 29)
21 (18 to 25) 11 (8 to 14) 26 (22 to 30) 14 (12 to 16) 7 (5 to 10) 1.6 (-0.6 to 3.5)
4.4 (2.2 to 6.8) 3.3 (2 to 4.6)
Burkina Faso 727 (549 to 978)
547 (432 to 686)
371 (257 to 509)
3000 (2300 to 4100)
2900 (2300 to 3700)
2700 (1800 to 3600) 2.8 (0.8 to 5.6)
2.6 (0.7 to 4.9) 2.7 (1.3 to 4.4)
Burundi 1220 (848 to 1760)
954 (682 to 1310)
712 (471 to 1050)
3400 (2400 to 4900)
2800 (2000 to 3800)
3500 (2300 to 5100) 2.5 (0.1 to 4.9)
2 (-0.1 to 4.1) 2.2 (0.6 to 3.7)
Cabo Verde 256 (141 to 460)
83 (45 to 162) 42 (20 to 95) 35 (20 to 64) 10 (6 to 20) 5 (2 to 10)
11.2 (8.2 to 13.7) 4.5 (2.2 to 7) 7.2 (5.2 to 9.2)
Cambodia 1020 (727 to 1350)
484 (396 to 596)
161 (117 to 213)
3900 (2800 to 5200)
1700 (1400 to 2000) 590 (440 to 790) 7.5 (4.2 to 9.6)
7.4 (5.4 to 9.5) 7.4 (5.6 to 8.9)
Cameroon 728 (566 to 926)
750 (615 to 918)
596 (440 to 881)
3900 (3100 to 5000)
4900 (4000 to 6000)
5100 (3700 to 7500)
-0.3 (-2.8 to 1.8)
1.5 (-0.9 to 3.3) 0.8 (-1 to 2)
Canada 7 (7 to 8) 9 (9 to 10) 7 (5 to 9) 29 (26 to 32) 31 (28 to 34) 27 (20 to 36) -2.2 (-3.7 to -0.8) 1.9 (0 to 4.2) 0.3 (-0.9 to 1.6)
Central African Republic
1290 (979 to 1720)
1200 (836 to 1750)
882 (508 to 1500)
1600 (1200 to 2100)
1800 (1200 to 2600)
1400 (830 to 2500) 0.7 (-2 to 3.4)
2.1 (-0.2 to 4.5) 1.5 (-0.4 to 3.4)
78

MMR (per 100,000 live births) Number of maternal deaths ARR (%)
Country 1990 2000 2015 1990 2000 2015 1990-2000 2000-2015 1990-2015
Chad
1450 (1100 to 1900)
1370 (1070 to 1790)
856 (560 to 1350)
4400 (3300 to 5800)
5900 (4600 to 7600)
5400 (3500 to 8500) 0.5 (-2.1 to 2.6)
3.1 (0.8 to 5.5) 2.1 (0.2 to 3.7)
Chile 57 (51 to 64)
31 (27 to 34) 22 (18 to 26)
160 (150 to 180) 78 (69 to 86) 52 (43 to 62) 6.1 (4.7 to 7.9)
2.2 (0.8 to 3.5) 3.8 (3 to 4.7)
China 97 (80 to 117)
58 (52 to 65) 27 (22 to 32)
25000 (21000 to 30000)
9000 (8100 to 10000)
4400 (3600 to 5300) 5.1 (3.4 to 6.7) 5.2 (4 to 6.8) 5.2 (4.2 to 6.3)
Colombia 118 (94 to 142)
97 (90 to 104) 64 (56 to 81)
1100 (850 to 1300) 820 (770 to 880) 480 (420 to 600) 2 (-0.2 to 3.7)
2.7 (1.1 to 3.7) 2.4 (1 to 3.3)
Comoros 635 (414 to 961)
499 (324 to 765)
335 (207 to 536) 110 (73 to 170) 100 (67 to 160) 88 (55 to 140) 2.4 (0 to 4.9)
2.6 (0.6 to 4.9) 2.6 (1 to 4.2)
Congo 603 (421 to 857)
653 (492 to 864)
442 (300 to 638)
550 (380 to 780)
790 (590 to 1000)
740 (500 to 1100)
-0.8 (-3.7 to 1.3)
2.6 (0.7 to 4.9) 1.2 (-0.3 to 2.7)
Costa Rica 43 (38 to 48)
38 (35 to 43) 25 (20 to 29) 36 (32 to 40) 29 (26 to 33) 18 (14 to 20) 1.3 (-0.3 to 2.4)
2.7 (1.8 to 4.5) 2.2 (1.5 to 3.1)
Cote d'Ivoire 745 (577 to 964)
671 (522 to 856)
645 (458 to 909)
3900 (3000 to 5100)
4500 (3500 to 5700)
5400 (3800 to 7600) 1 (-0.8 to 3)
0.3 (-1.7 to 2.1) 0.6 (-0.7 to 1.9)
Croatia 10 (8 to 12)
11 (9 to 13) 8 (6 to 11) 5 (4 to 6) 5 (4 to 6) 3 (3 to 4)
-1.2 (-3.7 to 1.1)
1.7 (-0.4 to 4.1) 0.6 (-0.8 to 1.9)
Cuba 58 (51 to 65)
43 (39 to 47) 39 (33 to 47) 100 (91 to 120) 62 (57 to 68) 45 (37 to 54) 3.1 (1.6 to 4.7)
0.6 (-0.9 to 2) 1.6 (0.7 to 2.5)
Cyprus 16 (10 to 26)
15 (9 to 25) 7 (4 to 12) 2 (1 to 4) 2 (1 to 3) 1 (0 to 2) 0.3 (-2.2 to 3.4) 5.4 (3.2 to 8) 3.3 (1.7 to 5.4)
Czech Republic
14 (12 to 17) 7 (6 to 8) 4 (3 to 6) 18 (16 to 22) 6 (5 to 7) 5 (3 to 6) 7.1 (4.8 to 9.7) 3.2 (1 to 5.7) 4.8 (3.3 to 6.4)
Democratic People's Republic of Korea
75 (40 to 144)
128 (63 to 262)
82 (37 to 190)
320 (170 to 610)
520 (260 to 1100) 300 (130 to 680)
-5.3 (-8.2 to -2.4)
2.9 (0.5 to 5.4) -0.4 (-2.3 to 1.6)
Democratic Republic of the Congo
879 (610 to 1250)
874 (639 to 1160)
693 (509 to 1010)
15000 (10000 to 21000)
20000 (15000 to 26000)
22000 (16000 to 33000) 0.1 (-2.4 to 3.1)
1.5 (-1.7 to 3.6) 1 (-1.1 to 2.4)
Denmark 11 (9 to 12) 9 (8 to 10) 6 (5 to 9) 7 (6 to 8) 6 (5 to 7) 4 (3 to 5) 1.6 (0 to 3.1) 2.2 (0 to 3.6) 2 (0.6 to 2.9)
79
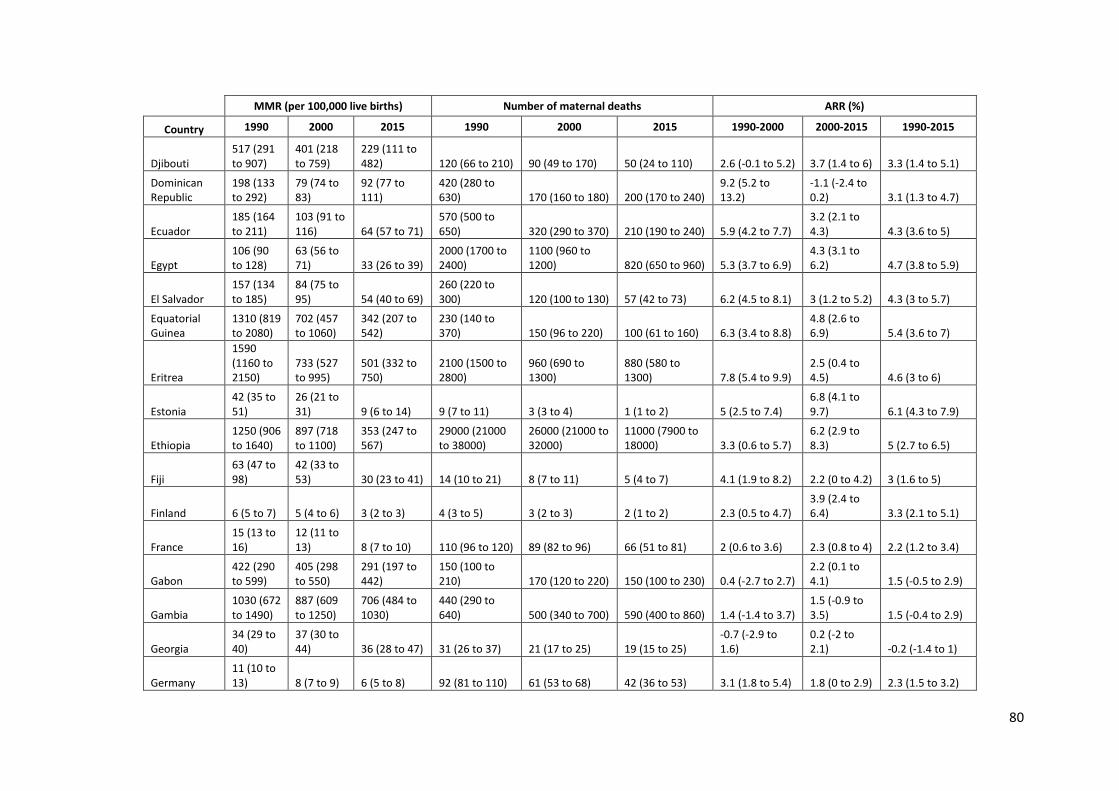
MMR (per 100,000 live births) Number of maternal deaths ARR (%)
Country 1990 2000 2015 1990 2000 2015 1990-2000 2000-2015 1990-2015
Djibouti 517 (291 to 907)
401 (218 to 759)
229 (111 to 482) 120 (66 to 210) 90 (49 to 170) 50 (24 to 110) 2.6 (-0.1 to 5.2) 3.7 (1.4 to 6) 3.3 (1.4 to 5.1)
Dominican Republic
198 (133 to 292)
79 (74 to 83)
92 (77 to 111)
420 (280 to 630) 170 (160 to 180) 200 (170 to 240)
9.2 (5.2 to 13.2)
-1.1 (-2.4 to 0.2) 3.1 (1.3 to 4.7)
Ecuador 185 (164 to 211)
103 (91 to 116) 64 (57 to 71)
570 (500 to 650) 320 (290 to 370) 210 (190 to 240) 5.9 (4.2 to 7.7)
3.2 (2.1 to 4.3) 4.3 (3.6 to 5)
Egypt 106 (90 to 128)
63 (56 to 71) 33 (26 to 39)
2000 (1700 to 2400)
1100 (960 to 1200) 820 (650 to 960) 5.3 (3.7 to 6.9)
4.3 (3.1 to 6.2) 4.7 (3.8 to 5.9)
El Salvador 157 (134 to 185)
84 (75 to 95) 54 (40 to 69)
260 (220 to 300) 120 (100 to 130) 57 (42 to 73) 6.2 (4.5 to 8.1) 3 (1.2 to 5.2) 4.3 (3 to 5.7)
Equatorial Guinea
1310 (819 to 2080)
702 (457 to 1060)
342 (207 to 542)
230 (140 to 370) 150 (96 to 220) 100 (61 to 160) 6.3 (3.4 to 8.8)
4.8 (2.6 to 6.9) 5.4 (3.6 to 7)
Eritrea
1590 (1160 to 2150)
733 (527 to 995)
501 (332 to 750)
2100 (1500 to 2800)
960 (690 to 1300)
880 (580 to 1300) 7.8 (5.4 to 9.9)
2.5 (0.4 to 4.5) 4.6 (3 to 6)
Estonia 42 (35 to 51)
26 (21 to 31) 9 (6 to 14) 9 (7 to 11) 3 (3 to 4) 1 (1 to 2) 5 (2.5 to 7.4)
6.8 (4.1 to 9.7) 6.1 (4.3 to 7.9)
Ethiopia 1250 (906 to 1640)
897 (718 to 1100)
353 (247 to 567)
29000 (21000 to 38000)
26000 (21000 to 32000)
11000 (7900 to 18000) 3.3 (0.6 to 5.7)
6.2 (2.9 to 8.3) 5 (2.7 to 6.5)
Fiji 63 (47 to 98)
42 (33 to 53) 30 (23 to 41) 14 (10 to 21) 8 (7 to 11) 5 (4 to 7) 4.1 (1.9 to 8.2) 2.2 (0 to 4.2) 3 (1.6 to 5)
Finland 6 (5 to 7) 5 (4 to 6) 3 (2 to 3) 4 (3 to 5) 3 (2 to 3) 2 (1 to 2) 2.3 (0.5 to 4.7) 3.9 (2.4 to 6.4) 3.3 (2.1 to 5.1)
France 15 (13 to 16)
12 (11 to 13) 8 (7 to 10) 110 (96 to 120) 89 (82 to 96) 66 (51 to 81) 2 (0.6 to 3.6) 2.3 (0.8 to 4) 2.2 (1.2 to 3.4)
Gabon 422 (290 to 599)
405 (298 to 550)
291 (197 to 442)
150 (100 to 210) 170 (120 to 220) 150 (100 to 230) 0.4 (-2.7 to 2.7)
2.2 (0.1 to 4.1) 1.5 (-0.5 to 2.9)
Gambia 1030 (672 to 1490)
887 (609 to 1250)
706 (484 to 1030)
440 (290 to 640) 500 (340 to 700) 590 (400 to 860) 1.4 (-1.4 to 3.7)
1.5 (-0.9 to 3.5) 1.5 (-0.4 to 2.9)
Georgia 34 (29 to 40)
37 (30 to 44) 36 (28 to 47) 31 (26 to 37) 21 (17 to 25) 19 (15 to 25)
-0.7 (-2.9 to 1.6)
0.2 (-2 to 2.1) -0.2 (-1.4 to 1)
Germany 11 (10 to 13) 8 (7 to 9) 6 (5 to 8) 92 (81 to 110) 61 (53 to 68) 42 (36 to 53) 3.1 (1.8 to 5.4) 1.8 (0 to 2.9) 2.3 (1.5 to 3.2)
80

MMR (per 100,000 live births) Number of maternal deaths ARR (%)
Country 1990 2000 2015 1990 2000 2015 1990-2000 2000-2015 1990-2015
Ghana 634 (436 to 911)
467 (342 to 645)
319 (216 to 458)
3600 (2500 to 5200)
3100 (2200 to 4200)
2800 (1900 to 4000) 3.1 (0.6 to 5.4)
2.5 (0.7 to 4.8) 2.7 (1.3 to 4.4)
Greece 5 (4 to 6) 4 (3 to 4) 3 (2 to 4) 5 (4 to 6) 4 (3 to 4) 3 (2 to 4) 3.5 (1.5 to 5.9) 0.7 (-1.5 to 2.9) 1.8 (0.6 to 3.3)
Grenada 41 (30 to 53)
29 (21 to 38) 27 (19 to 42) 1 (1 to 1) 1 (0 to 1) 1 (0 to 1) 3.4 (1.1 to 6.4)
0.5 (-3.1 to 2.5) 1.7 (-0.4 to 3)
Guatemala 205 (194 to 217)
178 (170 to 186)
88 (77 to 100)
720 (680 to 770) 730 (690 to 760) 380 (340 to 440) 1.4 (0.7 to 2.2)
4.7 (3.8 to 5.7) 3.4 (2.8 to 4)
Guinea 1040 (782 to 1360)
976 (787 to 1200)
679 (504 to 927)
3000 (2300 to 3900)
3700 (3000 to 4500)
3100 (2300 to 4300) 0.7 (-1.9 to 2.6)
2.4 (0.5 to 4.1) 1.7 (0.2 to 2.9)
Guinea-Bissau
907 (512 to 1540)
800 (417 to 1450)
549 (273 to 1090)
440 (250 to 740) 430 (220 to 780) 370 (180 to 740) 1.3 (-1.6 to 4)
2.5 (0.2 to 4.7) 2 (0.2 to 3.8)
Guyana 171 (141 to 197)
210 (185 to 241)
229 (184 to 301) 41 (34 to 47) 40 (35 to 46) 34 (27 to 45)
-2.1 (-4.4 to -0.6)
-0.6 (-2.3 to 0.9)
-1.2 (-2.6 to -0.3)
Haiti 625 (434 to 842)
505 (386 to 664)
359 (236 to 601)
1700 (1100 to 2200)
1300 (1000 to 1800)
950 (620 to 1600) 2.1 (-1.2 to 4.4)
2.3 (-0.6 to 4.5) 2.2 (-0.2 to 3.8)
Honduras 272 (256 to 290)
133 (115 to 154)
129 (99 to 166)
510 (480 to 550) 260 (230 to 300) 220 (170 to 280) 7.2 (5.6 to 8.8)
0.2 (-1.7 to 2.2) 3 (2 to 4.1)
Hungary 24 (21 to 28)
15 (12 to 18) 17 (12 to 22) 30 (26 to 35) 14 (11 to 17) 15 (11 to 21) 5 (2.7 to 7.5)
-0.8 (-3.3 to 1.5) 1.5 (0.2 to 2.7)
Iceland 7 (5 to 9) 5 (3 to 7) 3 (2 to 6) 0 (0 to 0) 0 (0 to 0) 0 (0 to 0) 3.6 (1.4 to 6.9) 1.9 (-0.4 to 4.7) 2.6 (1.1 to 4.8)
India 556 (445 to 685)
374 (324 to 437)
174 (139 to 217)
152000 (122000 to 188000)
104000 (90000 to 122000)
45000 (36000 to 56000) 4 (1.8 to 5.6)
5.1 (3.7 to 6.7) 4.6 (3.5 to 5.7)
Indonesia 446 (347 to 564)
265 (213 to 324)
126 (93 to 179)
21000 (16000 to 26000)
12000 (9700 to 15000)
6400 (4700 to 9000) 5.2 (2.9 to 7.1)
4.9 (2.7 to 6.7) 5 (3.4 to 6.3)
Iran 123 (98 to 171)
51 (43 to 60) 25 (21 to 31)
2300 (1800 to 3100) 620 (530 to 730) 340 (280 to 410) 8.9 (7 to 12)
4.7 (3.1 to 6.1) 6.4 (5.3 to 7.8)
Iraq 107 (79 to 151)
63 (50 to 79) 50 (35 to 69)
710 (530 to 1000) 520 (420 to 660) 620 (430 to 850) 5.3 (2.8 to 8.7)
1.5 (-0.6 to 4.2) 3.1 (1.5 to 5.2)
81

MMR (per 100,000 live births) Number of maternal deaths ARR (%)
Country 1990 2000 2015 1990 2000 2015 1990-2000 2000-2015 1990-2015
Ireland 11 (9 to 13) 9 (8 to 11) 8 (6 to 11) 6 (5 to 7) 5 (5 to 6) 5 (4 to 7) 1.7 (0 to 3.5)
1.4 (-1.3 to 2.8) 1.5 (-0.1 to 2.4)
Israel 11 (10 to 13) 8 (7 to 9) 5 (4 to 6) 11 (10 to 13) 10 (9 to 12) 9 (7 to 11) 2.9 (1.4 to 4.4) 3 (1.7 to 4.4) 3 (2.1 to 3.9)
Italy 8 (7 to 9) 5 (4 to 6) 4 (3 to 5) 44 (39 to 51) 27 (23 to 31) 18 (14 to 24) 4.6 (2.6 to 6.8) 2 (0.2 to 4) 3 (1.8 to 4.4)
Jamaica 79 (64 to 97)
89 (79 to 100)
89 (70 to 115) 49 (39 to 59) 50 (44 to 56) 43 (34 to 55)
-1.2 (-3.4 to 0.9)
0.1 (-1.9 to 1.7) -0.4 (-1.9 to 0.8)
Japan 14 (12 to 15)
10 (9 to 11) 5 (4 to 7)
170 (150 to 200) 110 (99 to 130) 56 (43 to 71) 3.4 (1.7 to 5) 3.8 (2 to 5.8) 3.6 (2.6 to 4.8)
Jordan 110 (88 to 140)
77 (66 to 92) 58 (44 to 75)
130 (100 to 170) 110 (98 to 140) 110 (89 to 150) 3.6 (1 to 6.1) 1.9 (0 to 3.9) 2.6 (1.2 to 4.1)
Kazakhstan 78 (69 to 88)
65 (57 to 75) 12 (10 to 15)
300 (260 to 340) 160 (140 to 180) 45 (36 to 56) 1.8 (-0.1 to 3.6)
11.3 (9.7 to 13) 7.5 (6.5 to 8.5)
Kenya 687 (518 to 899)
759 (615 to 947)
510 (344 to 754)
6800 (5100 to 8900)
9100 (7400 to 11000)
8000 (5400 to 12000) -1 (-3.5 to 1.1)
2.7 (0.5 to 4.9) 1.2 (-0.5 to 2.8)
Kiribati 234 (169 to 330)
166 (113 to 241)
90 (51 to 152) 6 (4 to 9) 4 (3 to 6) 3 (2 to 5) 3.4 (0.9 to 6.7)
4.1 (1.7 to 6.8) 3.8 (2 to 6)
Kuwait 7 (5 to 8) 7 (6 to 8) 4 (3 to 6) 3 (2 to 3) 3 (3 to 4) 3 (2 to 4) -0.4 (-2.6 to 1.5)
3.6 (1.4 to 5.1) 2 (0.4 to 3)
Kyrgyzstan 80 (71 to 90)
74 (64 to 84) 76 (59 to 96) 110 (96 to 120) 79 (69 to 91) 120 (91 to 150) 0.8 (-0.9 to 2.7)
-0.2 (-2 to 1.6) 0.2 (-0.9 to 1.3)
Lao 905 (638 to 1230)
546 (417 to 720)
197 (136 to 307)
1700 (1200 to 2300)
930 (710 to 1200) 350 (240 to 550) 5.1 (1.5 to 7.6)
6.8 (3.9 to 9.1) 6.1 (3.9 to 7.7)
Latvia 48 (41 to 57)
30 (25 to 35) 18 (13 to 26) 17 (15 to 20) 6 (5 to 7) 4 (3 to 5) 4.8 (2.7 to 7.1)
3.2 (0.8 to 5.7) 3.9 (2.3 to 5.4)
Lebanon 74 (50 to 109)
42 (30 to 59) 15 (10 to 22) 50 (34 to 74) 26 (18 to 37) 13 (9 to 19) 5.7 (3.1 to 8)
6.9 (4.4 to 8.8) 6.4 (4.6 to 7.8)
Lesotho 629 (422 to 908)
649 (492 to 861)
487 (310 to 871)
360 (240 to 510) 380 (290 to 500) 300 (190 to 530)
-0.3 (-4.3 to 2.6)
1.9 (-1.5 to 4.1) 1 (-1.9 to 2.9)
Liberia
1500 (1030 to 1980)
1270 (972 to 1620)
725 (527 to 1030)
1400 (990 to 1900)
1500 (1200 to 1900)
1100 (820 to 1600) 1.7 (-1.3 to 3.6)
3.7 (1.2 to 5.5) 2.9 (0.8 to 4.2)
82
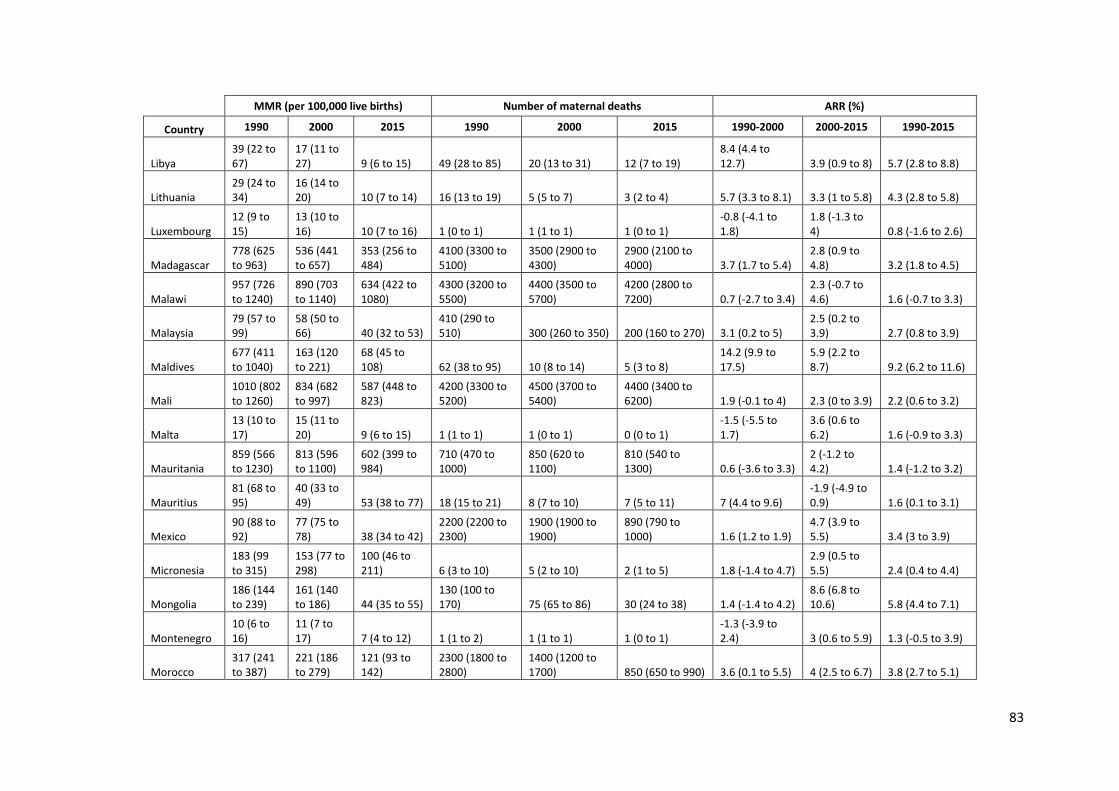
MMR (per 100,000 live births) Number of maternal deaths ARR (%)
Country 1990 2000 2015 1990 2000 2015 1990-2000 2000-2015 1990-2015
Libya 39 (22 to 67)
17 (11 to 27) 9 (6 to 15) 49 (28 to 85) 20 (13 to 31) 12 (7 to 19)
8.4 (4.4 to 12.7) 3.9 (0.9 to 8) 5.7 (2.8 to 8.8)
Lithuania 29 (24 to 34)
16 (14 to 20) 10 (7 to 14) 16 (13 to 19) 5 (5 to 7) 3 (2 to 4) 5.7 (3.3 to 8.1) 3.3 (1 to 5.8) 4.3 (2.8 to 5.8)
Luxembourg 12 (9 to 15)
13 (10 to 16) 10 (7 to 16) 1 (0 to 1) 1 (1 to 1) 1 (0 to 1)
-0.8 (-4.1 to 1.8)
1.8 (-1.3 to 4) 0.8 (-1.6 to 2.6)
Madagascar 778 (625 to 963)
536 (441 to 657)
353 (256 to 484)
4100 (3300 to 5100)
3500 (2900 to 4300)
2900 (2100 to 4000) 3.7 (1.7 to 5.4)
2.8 (0.9 to 4.8) 3.2 (1.8 to 4.5)
Malawi 957 (726 to 1240)
890 (703 to 1140)
634 (422 to 1080)
4300 (3200 to 5500)
4400 (3500 to 5700)
4200 (2800 to 7200) 0.7 (-2.7 to 3.4)
2.3 (-0.7 to 4.6) 1.6 (-0.7 to 3.3)
Malaysia 79 (57 to 99)
58 (50 to 66) 40 (32 to 53)
410 (290 to 510) 300 (260 to 350) 200 (160 to 270) 3.1 (0.2 to 5)
2.5 (0.2 to 3.9) 2.7 (0.8 to 3.9)
Maldives 677 (411 to 1040)
163 (120 to 221)
68 (45 to 108) 62 (38 to 95) 10 (8 to 14) 5 (3 to 8)
14.2 (9.9 to 17.5)
5.9 (2.2 to 8.7) 9.2 (6.2 to 11.6)
Mali 1010 (802 to 1260)
834 (682 to 997)
587 (448 to 823)
4200 (3300 to 5200)
4500 (3700 to 5400)
4400 (3400 to 6200) 1.9 (-0.1 to 4) 2.3 (0 to 3.9) 2.2 (0.6 to 3.2)
Malta 13 (10 to 17)
15 (11 to 20) 9 (6 to 15) 1 (1 to 1) 1 (0 to 1) 0 (0 to 1)
-1.5 (-5.5 to 1.7)
3.6 (0.6 to 6.2) 1.6 (-0.9 to 3.3)
Mauritania 859 (566 to 1230)
813 (596 to 1100)
602 (399 to 984)
710 (470 to 1000)
850 (620 to 1100)
810 (540 to 1300) 0.6 (-3.6 to 3.3)
2 (-1.2 to 4.2) 1.4 (-1.2 to 3.2)
Mauritius 81 (68 to 95)
40 (33 to 49) 53 (38 to 77) 18 (15 to 21) 8 (7 to 10) 7 (5 to 11) 7 (4.4 to 9.6)
-1.9 (-4.9 to 0.9) 1.6 (0.1 to 3.1)
Mexico 90 (88 to 92)
77 (75 to 78) 38 (34 to 42)
2200 (2200 to 2300)
1900 (1900 to 1900)
890 (790 to 1000) 1.6 (1.2 to 1.9)
4.7 (3.9 to 5.5) 3.4 (3 to 3.9)
Micronesia 183 (99 to 315)
153 (77 to 298)
100 (46 to 211) 6 (3 to 10) 5 (2 to 10) 2 (1 to 5) 1.8 (-1.4 to 4.7)
2.9 (0.5 to 5.5) 2.4 (0.4 to 4.4)
Mongolia 186 (144 to 239)
161 (140 to 186) 44 (35 to 55)
130 (100 to 170) 75 (65 to 86) 30 (24 to 38) 1.4 (-1.4 to 4.2)
8.6 (6.8 to 10.6) 5.8 (4.4 to 7.1)
Montenegro 10 (6 to 16)
11 (7 to 17) 7 (4 to 12) 1 (1 to 2) 1 (1 to 1) 1 (0 to 1)
-1.3 (-3.9 to 2.4) 3 (0.6 to 5.9) 1.3 (-0.5 to 3.9)
Morocco 317 (241 to 387)
221 (186 to 279)
121 (93 to 142)
2300 (1800 to 2800)
1400 (1200 to 1700) 850 (650 to 990) 3.6 (0.1 to 5.5) 4 (2.5 to 6.7) 3.8 (2.7 to 5.1)
83
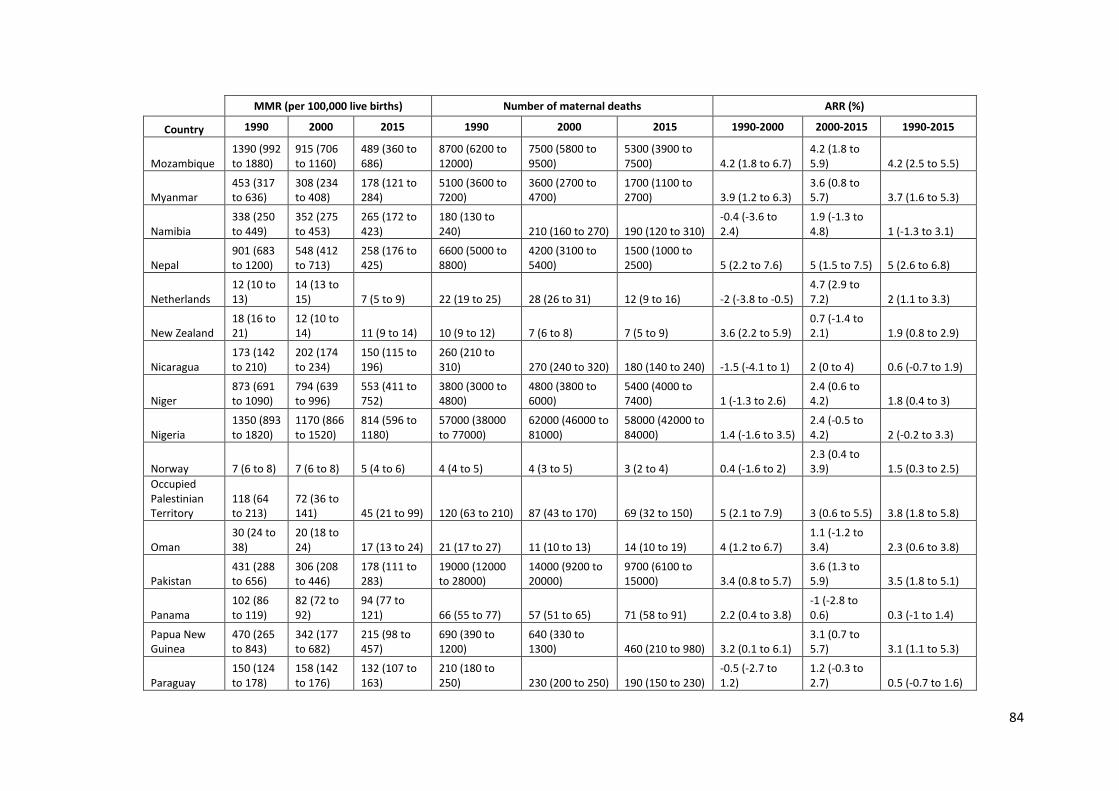
MMR (per 100,000 live births) Number of maternal deaths ARR (%)
Country 1990 2000 2015 1990 2000 2015 1990-2000 2000-2015 1990-2015
Mozambique 1390 (992 to 1880)
915 (706 to 1160)
489 (360 to 686)
8700 (6200 to 12000)
7500 (5800 to 9500)
5300 (3900 to 7500) 4.2 (1.8 to 6.7)
4.2 (1.8 to 5.9) 4.2 (2.5 to 5.5)
Myanmar 453 (317 to 636)
308 (234 to 408)
178 (121 to 284)
5100 (3600 to 7200)
3600 (2700 to 4700)
1700 (1100 to 2700) 3.9 (1.2 to 6.3)
3.6 (0.8 to 5.7) 3.7 (1.6 to 5.3)
Namibia 338 (250 to 449)
352 (275 to 453)
265 (172 to 423)
180 (130 to 240) 210 (160 to 270) 190 (120 to 310)
-0.4 (-3.6 to 2.4)
1.9 (-1.3 to 4.8) 1 (-1.3 to 3.1)
Nepal 901 (683 to 1200)
548 (412 to 713)
258 (176 to 425)
6600 (5000 to 8800)
4200 (3100 to 5400)
1500 (1000 to 2500) 5 (2.2 to 7.6) 5 (1.5 to 7.5) 5 (2.6 to 6.8)
Netherlands 12 (10 to 13)
14 (13 to 15) 7 (5 to 9) 22 (19 to 25) 28 (26 to 31) 12 (9 to 16) -2 (-3.8 to -0.5)
4.7 (2.9 to 7.2) 2 (1.1 to 3.3)
New Zealand 18 (16 to 21)
12 (10 to 14) 11 (9 to 14) 10 (9 to 12) 7 (6 to 8) 7 (5 to 9) 3.6 (2.2 to 5.9)
0.7 (-1.4 to 2.1) 1.9 (0.8 to 2.9)
Nicaragua 173 (142 to 210)
202 (174 to 234)
150 (115 to 196)
260 (210 to 310) 270 (240 to 320) 180 (140 to 240) -1.5 (-4.1 to 1) 2 (0 to 4) 0.6 (-0.7 to 1.9)
Niger 873 (691 to 1090)
794 (639 to 996)
553 (411 to 752)
3800 (3000 to 4800)
4800 (3800 to 6000)
5400 (4000 to 7400) 1 (-1.3 to 2.6)
2.4 (0.6 to 4.2) 1.8 (0.4 to 3)
Nigeria 1350 (893 to 1820)
1170 (866 to 1520)
814 (596 to 1180)
57000 (38000 to 77000)
62000 (46000 to 81000)
58000 (42000 to 84000) 1.4 (-1.6 to 3.5)
2.4 (-0.5 to 4.2) 2 (-0.2 to 3.3)
Norway 7 (6 to 8) 7 (6 to 8) 5 (4 to 6) 4 (4 to 5) 4 (3 to 5) 3 (2 to 4) 0.4 (-1.6 to 2) 2.3 (0.4 to 3.9) 1.5 (0.3 to 2.5)
Occupied Palestinian Territory
118 (64 to 213)
72 (36 to 141) 45 (21 to 99) 120 (63 to 210) 87 (43 to 170) 69 (32 to 150) 5 (2.1 to 7.9) 3 (0.6 to 5.5) 3.8 (1.8 to 5.8)
Oman 30 (24 to 38)
20 (18 to 24) 17 (13 to 24) 21 (17 to 27) 11 (10 to 13) 14 (10 to 19) 4 (1.2 to 6.7)
1.1 (-1.2 to 3.4) 2.3 (0.6 to 3.8)
Pakistan 431 (288 to 656)
306 (208 to 446)
178 (111 to 283)
19000 (12000 to 28000)
14000 (9200 to 20000)
9700 (6100 to 15000) 3.4 (0.8 to 5.7)
3.6 (1.3 to 5.9) 3.5 (1.8 to 5.1)
Panama 102 (86 to 119)
82 (72 to 92)
94 (77 to 121) 66 (55 to 77) 57 (51 to 65) 71 (58 to 91) 2.2 (0.4 to 3.8)
-1 (-2.8 to 0.6) 0.3 (-1 to 1.4)
Papua New Guinea
470 (265 to 843)
342 (177 to 682)
215 (98 to 457)
690 (390 to 1200)
640 (330 to 1300) 460 (210 to 980) 3.2 (0.1 to 6.1)
3.1 (0.7 to 5.7) 3.1 (1.1 to 5.3)
Paraguay 150 (124 to 178)
158 (142 to 176)
132 (107 to 163)
210 (180 to 250) 230 (200 to 250) 190 (150 to 230)
-0.5 (-2.7 to 1.2)
1.2 (-0.3 to 2.7) 0.5 (-0.7 to 1.6)
84

MMR (per 100,000 live births) Number of maternal deaths ARR (%)
Country 1990 2000 2015 1990 2000 2015 1990-2000 2000-2015 1990-2015
Peru 251 (207 to 325)
140 (124 to 164) 68 (54 to 80)
1700 (1400 to 2100)
880 (780 to 1000) 420 (330 to 490) 5.8 (4 to 8)
4.8 (3.6 to 6.9) 5.2 (4.2 to 6.7)
Philippines 152 (126 to 175)
124 (110 to 138)
114 (87 to 175)
3100 (2600 to 3600)
2900 (2600 to 3200)
2700 (2000 to 4100) 2 (0 to 3.6)
0.5 (-2.3 to 2.3) 1.1 (-0.8 to 2.4)
Poland 17 (15 to 19) 8 (7 to 10) 3 (2 to 4) 97 (85 to 110) 31 (26 to 36) 12 (9 to 16) 7.2 (5.3 to 9.3)
6.5 (4.2 to 8.8) 6.8 (5.4 to 8.2)
Portugal 17 (15 to 20)
13 (12 to 15) 10 (9 to 13) 20 (17 to 22) 15 (13 to 17) 8 (7 to 11) 2.6 (1.5 to 4.4)
1.8 (-0.2 to 2.9) 2.1 (1.1 to 2.9)
Puerto Rico 26 (23 to 30)
22 (19 to 25) 14 (10 to 18) 17 (15 to 19) 12 (11 to 14) 6 (4 to 8) 1.9 (0.2 to 3.3)
2.8 (1.5 to 5.3) 2.4 (1.5 to 3.9)
Qatar 29 (18 to 43)
24 (17 to 33) 13 (9 to 19) 3 (2 to 4) 3 (2 to 4) 3 (2 to 5) 1.9 (-1.8 to 4.2)
4.3 (1.4 to 6.6) 3.3 (0.8 to 4.9)
Republic of Korea
21 (19 to 24)
16 (14 to 18) 11 (9 to 13)
140 (130 to 160) 85 (76 to 95) 50 (42 to 60) 3.2 (1.5 to 4.8) 2.3 (1 to 3.8) 2.6 (1.8 to 3.5)
Republic of Moldova
51 (45 to 58)
49 (43 to 56) 23 (19 to 28) 41 (37 to 47) 24 (20 to 27) 10 (8 to 12) 0.4 (-1.1 to 2.3)
5.1 (3.3 to 6.4) 3.2 (2.3 to 4.2)
Romania 124 (108 to 141)
51 (44 to 58) 31 (22 to 44)
390 (340 to 450) 110 (98 to 130) 56 (40 to 79) 8.9 (7 to 10.8)
3.2 (0.7 to 5.7) 5.5 (4 to 6.9)
Russian Federation
63 (56 to 72)
57 (50 to 64) 25 (18 to 33)
1300 (1100 to 1400) 750 (670 to 850) 450 (330 to 600) 1.1 (-0.7 to 2.8)
5.6 (3.5 to 7.8) 3.8 (2.5 to 5.1)
Rwanda 1300 (943 to 1690)
1020 (825 to 1230)
290 (208 to 389)
4200 (3000 to 5400)
3200 (2600 to 3800)
1100 (750 to 1400) 2.4 (-0.4 to 4.5)
8.4 (6.5 to 10.6) 6 (4.5 to 7.5)
Saint Lucia 45 (36 to 57)
54 (43 to 68) 48 (32 to 72) 2 (1 to 2) 2 (1 to 2) 1 (1 to 2)
-1.8 (-4.7 to 1.1)
0.8 (-2.2 to 3.8) -0.2 (-2.1 to 1.6)
Samoa 156 (84 to 279)
93 (48 to 181)
51 (24 to 115) 8 (5 to 15) 5 (3 to 10) 2 (1 to 6) 5.2 (2.2 to 7.9)
3.9 (1.2 to 6.5) 4.4 (2.4 to 6.3)
Sao Tome and Principe
330 (202 to 527)
222 (138 to 357)
156 (83 to 268) 15 (9 to 24) 12 (7 to 19) 10 (5 to 17) 3.9 (1.3 to 7.3)
2.4 (0.2 to 5.1) 3 (1.2 to 5.4)
Saudi Arabia 46 (32 to 67)
23 (16 to 34) 12 (7 to 20)
270 (190 to 390) 130 (92 to 190) 72 (42 to 120) 6.8 (4.2 to 9.6)
4.7 (2.3 to 7.1) 5.5 (3.7 to 7.5)
Senegal 540 (425 to 688)
488 (382 to 626)
315 (214 to 468)
1800 (1400 to 2300)
1900 (1500 to 2500)
1800 (1200 to 2700) 1 (-1 to 3) 2.9 (0.7 to 5) 2.2 (0.7 to 3.6)
85
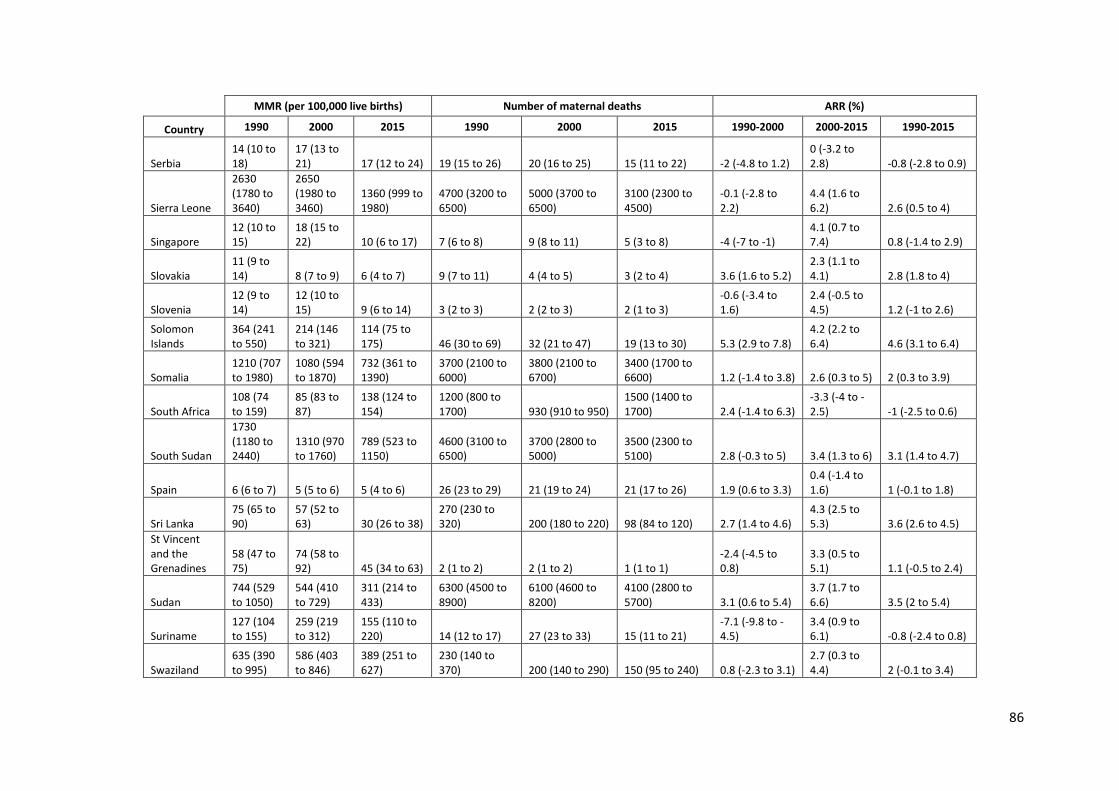
MMR (per 100,000 live births) Number of maternal deaths ARR (%)
Country 1990 2000 2015 1990 2000 2015 1990-2000 2000-2015 1990-2015
Serbia 14 (10 to 18)
17 (13 to 21) 17 (12 to 24) 19 (15 to 26) 20 (16 to 25) 15 (11 to 22) -2 (-4.8 to 1.2)
0 (-3.2 to 2.8) -0.8 (-2.8 to 0.9)
Sierra Leone
2630 (1780 to 3640)
2650 (1980 to 3460)
1360 (999 to 1980)
4700 (3200 to 6500)
5000 (3700 to 6500)
3100 (2300 to 4500)
-0.1 (-2.8 to 2.2)
4.4 (1.6 to 6.2) 2.6 (0.5 to 4)
Singapore 12 (10 to 15)
18 (15 to 22) 10 (6 to 17) 7 (6 to 8) 9 (8 to 11) 5 (3 to 8) -4 (-7 to -1)
4.1 (0.7 to 7.4) 0.8 (-1.4 to 2.9)
Slovakia 11 (9 to 14) 8 (7 to 9) 6 (4 to 7) 9 (7 to 11) 4 (4 to 5) 3 (2 to 4) 3.6 (1.6 to 5.2)
2.3 (1.1 to 4.1) 2.8 (1.8 to 4)
Slovenia 12 (9 to 14)
12 (10 to 15) 9 (6 to 14) 3 (2 to 3) 2 (2 to 3) 2 (1 to 3)
-0.6 (-3.4 to 1.6)
2.4 (-0.5 to 4.5) 1.2 (-1 to 2.6)
Solomon Islands
364 (241 to 550)
214 (146 to 321)
114 (75 to 175) 46 (30 to 69) 32 (21 to 47) 19 (13 to 30) 5.3 (2.9 to 7.8)
4.2 (2.2 to 6.4) 4.6 (3.1 to 6.4)
Somalia 1210 (707 to 1980)
1080 (594 to 1870)
732 (361 to 1390)
3700 (2100 to 6000)
3800 (2100 to 6700)
3400 (1700 to 6600) 1.2 (-1.4 to 3.8) 2.6 (0.3 to 5) 2 (0.3 to 3.9)
South Africa 108 (74 to 159)
85 (83 to 87)
138 (124 to 154)
1200 (800 to 1700) 930 (910 to 950)
1500 (1400 to 1700) 2.4 (-1.4 to 6.3)
-3.3 (-4 to -2.5) -1 (-2.5 to 0.6)
South Sudan
1730 (1180 to 2440)
1310 (970 to 1760)
789 (523 to 1150)
4600 (3100 to 6500)
3700 (2800 to 5000)
3500 (2300 to 5100) 2.8 (-0.3 to 5) 3.4 (1.3 to 6) 3.1 (1.4 to 4.7)
Spain 6 (6 to 7) 5 (5 to 6) 5 (4 to 6) 26 (23 to 29) 21 (19 to 24) 21 (17 to 26) 1.9 (0.6 to 3.3) 0.4 (-1.4 to 1.6) 1 (-0.1 to 1.8)
Sri Lanka 75 (65 to 90)
57 (52 to 63) 30 (26 to 38)
270 (230 to 320) 200 (180 to 220) 98 (84 to 120) 2.7 (1.4 to 4.6)
4.3 (2.5 to 5.3) 3.6 (2.6 to 4.5)
St Vincent and the Grenadines
58 (47 to 75)
74 (58 to 92) 45 (34 to 63) 2 (1 to 2) 2 (1 to 2) 1 (1 to 1)
-2.4 (-4.5 to 0.8)
3.3 (0.5 to 5.1) 1.1 (-0.5 to 2.4)
Sudan 744 (529 to 1050)
544 (410 to 729)
311 (214 to 433)
6300 (4500 to 8900)
6100 (4600 to 8200)
4100 (2800 to 5700) 3.1 (0.6 to 5.4)
3.7 (1.7 to 6.6) 3.5 (2 to 5.4)
Suriname 127 (104 to 155)
259 (219 to 312)
155 (110 to 220) 14 (12 to 17) 27 (23 to 33) 15 (11 to 21)
-7.1 (-9.8 to -4.5)
3.4 (0.9 to 6.1) -0.8 (-2.4 to 0.8)
Swaziland 635 (390 to 995)
586 (403 to 846)
389 (251 to 627)
230 (140 to 370) 200 (140 to 290) 150 (95 to 240) 0.8 (-2.3 to 3.1)
2.7 (0.3 to 4.4) 2 (-0.1 to 3.4)
86

MMR (per 100,000 live births) Number of maternal deaths ARR (%)
Country 1990 2000 2015 1990 2000 2015 1990-2000 2000-2015 1990-2015
Sweden 8 (7 to 9) 5 (5 to 6) 4 (3 to 5) 9 (8 to 10) 5 (4 to 6) 5 (4 to 6) 3.4 (1.6 to 4.8) 1.9 (0 to 3) 2.5 (1.2 to 3.3)
Switzerland 8 (7 to 10) 7 (6 to 8) 5 (4 to 7) 7 (5 to 8) 5 (4 to 6) 4 (4 to 6) 2 (0.2 to 3.6)
1.7 (-0.5 to 3) 1.8 (0.3 to 2.8)
Syrian Arab Republic
123 (81 to 177)
73 (52 to 102) 68 (48 to 97)
550 (360 to 790) 360 (260 to 510) 300 (210 to 430) 5.2 (2 to 7.4)
0.5 (-2.1 to 2.7) 2.4 (0.3 to 3.9)
Tajikistan 107 (93 to 126)
68 (58 to 80) 32 (19 to 51)
230 (200 to 270) 130 (110 to 150) 82 (50 to 130) 4.5 (2.3 to 6.8)
5.1 (1.8 to 8.3) 4.8 (2.9 to 7)
Tanzania 997 (775 to 1280)
842 (671 to 1050)
398 (281 to 570)
11000 (8700 to 14000)
12000 (9600 to 15000)
8200 (5800 to 12000) 1.7 (-0.4 to 3.6) 5 (3 to 7) 3.7 (2.2 to 5)
TFYR Macedonia
14 (11 to 18)
12 (10 to 14) 8 (5 to 10) 5 (4 to 6) 3 (3 to 4) 2 (1 to 2) 1.6 (-0.3 to 4.1) 3 (1.1 to 5.1) 2.4 (1.2 to 4.1)
Thailand 40 (34 to 48)
25 (22 to 28) 20 (14 to 32)
430 (360 to 520) 220 (200 to 250) 140 (100 to 230) 4.7 (2.6 to 7)
1.3 (-1.7 to 3.9) 2.7 (0.8 to 4.3)
Timor-Leste 1080 (741 to 1510)
694 (517 to 925)
215 (150 to 300)
350 (240 to 490) 260 (190 to 350) 94 (66 to 130) 4.4 (1.6 to 6.7)
7.8 (5.7 to 10.2) 6.5 (4.8 to 8)
Togo 568 (430 to 759)
491 (367 to 649)
368 (255 to 518)
910 (690 to 1200)
950 (710 to 1300)
940 (650 to 1300) 1.5 (-0.7 to 4) 1.9 (0.2 to 4) 1.7 (0.5 to 3.2)
Tonga 75 (41 to 132)
97 (50 to 190)
124 (57 to 270) 2 (1 to 4) 3 (1 to 5) 3 (1 to 7)
-2.6 (-5.6 to 0.3)
-1.6 (-4 to 0.8) -2 (-4 to 0)
Trinidad and Tobago
90 (80 to 103)
62 (54 to 70) 63 (49 to 80) 23 (20 to 26) 12 (10 to 13) 12 (9 to 15) 3.8 (2.5 to 5.4)
-0.1 (-1.7 to 1.4) 1.5 (0.5 to 2.5)
Tunisia 131 (96 to 175)
84 (62 to 115) 62 (42 to 92)
280 (210 to 370) 140 (100 to 190) 130 (86 to 190) 4.4 (1.7 to 6.6) 2 (-0.1 to 4) 3 (1.4 to 4.3)
Turkey 97 (63 to 149)
79 (59 to 108) 16 (12 to 21)
1400 (890 to 2100)
1100 (810 to 1500) 210 (160 to 270) 2.1 (-1.9 to 5.8)
10.7 (8.1 to 13.4) 7.2 (5.2 to 9.1)
Turkmenistan 82 (72 to 95)
59 (41 to 80) 42 (20 to 73) 110 (94 to 120) 63 (44 to 86) 47 (22 to 82) 3.4 (-0.2 to 7.3)
2.2 (-1 to 6.1) 2.7 (0.4 to 5.8)
Uganda 687 (544 to 877)
620 (503 to 766)
343 (247 to 493)
5900 (4700 to 7600)
7200 (5800 to 8800)
5700 (4100 to 8200) 1 (-0.8 to 3)
3.9 (1.7 to 5.8) 2.8 (1.3 to 4.1)
Ukraine 46 (41 to 52)
34 (30 to 39) 24 (19 to 32)
290 (260 to 330) 140 (120 to 160) 120 (91 to 160) 3.1 (1.4 to 4.9)
2.2 (0.2 to 4.1) 2.6 (1.4 to 3.7)
87

MMR (per 100,000 live births) Number of maternal deaths ARR (%)
Country 1990 2000 2015 1990 2000 2015 1990-2000 2000-2015 1990-2015
United Arab Emirates
17 (10 to 29) 8 (5 to 14) 6 (3 to 11) 8 (5 to 13) 4 (2 to 7) 6 (3 to 11)
7.2 (4.3 to 10.8)
2.1 (-0.2 to 5.2) 4.1 (2.2 to 6.8)
United Kingdom
10 (9 to 11)
12 (11 to 12) 9 (8 to 11) 78 (73 to 83) 80 (76 to 86) 74 (62 to 87)
-1.4 (-2.3 to -0.5)
1.6 (0.5 to 2.8) 0.4 (-0.3 to 1.2)
United States of America
12 (11 to 13)
12 (12 to 12) 14 (12 to 16)
470 (420 to 520) 480 (460 to 490) 550 (480 to 650)
-0.2 (-1.3 to 0.9)
-0.9 (-2.1 to 0.1) -0.6 (-1.4 to 0.1)
Uruguay 37 (32 to 44)
31 (26 to 36) 15 (11 to 19) 21 (18 to 25) 17 (14 to 20) 7 (5 to 9) 1.9 (-0.1 to 4)
4.9 (2.8 to 7.2) 3.7 (2.4 to 5.1)
Uzbekistan 54 (48 to 62)
34 (30 to 39) 36 (20 to 65)
380 (330 to 430) 190 (170 to 220) 240 (130 to 430) 4.5 (2.6 to 6.4)
-0.3 (-4.3 to 3.7) 1.6 (-0.8 to 4)
Vanuatu 225 (126 to 406)
144 (73 to 276)
78 (36 to 169) 12 (7 to 22) 9 (4 to 17) 5 (2 to 12) 4.5 (1.6 to 7.5) 4 (1.5 to 6.5) 4.2 (2.3 to 6.2)
Venezuela 94 (83 to 105)
90 (80 to 100)
95 (77 to 124)
540 (480 to 610) 520 (470 to 580) 570 (460 to 740) 0.4 (-1.1 to 1.9)
-0.4 (-2.3 to 1.2) -0.1 (-1.3 to 0.9)
Viet Nam 139 (92 to 186)
81 (61 to 102) 54 (41 to 74)
2700 (1800 to 3700)
1100 (860 to 1400)
860 (650 to 1200) 5.5 (2.3 to 7.6) 2.7 (0 to 4.6) 3.8 (1.6 to 5.2)
Yemen 547 (389 to 736)
440 (337 to 573)
385 (274 to 582)
3500 (2500 to 4700)
3100 (2400 to 4000)
3300 (2300 to 5000) 2.2 (-0.8 to 4.5)
0.9 (-2.1 to 3) 1.4 (-0.8 to 3)
Zambia 577 (449 to 757)
541 (441 to 666)
224 (162 to 306)
2200 (1700 to 2900)
2500 (2100 to 3100)
1400 (1000 to 2000) 0.6 (-1.1 to 2.8)
5.9 (4.3 to 7.6) 3.8 (2.6 to 5.2)
Zimbabwe 440 (351 to 523)
590 (534 to 664)
443 (363 to 563)
1700 (1400 to 2000)
2400 (2200 to 2700)
2400 (2000 to 3000)
-2.9 (-5.2 to -1.6)
1.9 (0.3 to 3.4) 0 (-1.4 to 0.9)
88

Table 4. Life time risk and maternal mortality rate in 1990, 2000 and 2015 for MDG regions and 183 countries. Numbers in parentheses refer to 80% UIs. Note: Reported estimates have been rounded. Lifetime risk (expressed as 1 maternal death per X lifetimes) has been rounded according to the following scheme: <100, rounded to the nearest 1; 100–999, rounded to nearest 10; and >1000, rounded to nearest 100. The MMrate (* 1,000) has been rounded to three decimals.
Region Life time risk of maternal death; 1 in: MMrate (*1,000)
1990 2000 2015 1990 2000 2015
World 73 (78 to 66) 100 (110 to 96) 180 (190 to 160) 0.406 (0.378 to 0.45)
0.282 (0.269 to 0.306)
0.164 (0.157 to 0.189)
Developed regions 2400 (2500 to 2200)
3900 (4100 to 3700)
4900 (5300 to 4300)
0.012 (0.012 to 0.013)
0.007 (0.007 to 0.008)
0.006 (0.005 to 0.007)
Northern Africa 130 (150 to 110) 300 (330 to 250) 450 (550 to 340) 0.233 (0.199 to 0.279)
0.099 (0.088 to 0.116)
0.065 (0.052 to 0.085)
Sub-Saharan Africa 16 (18 to 14) 21 (23 to 19) 36 (39 to 30) 1.942 (1.768 to 2.211)
1.533 (1.426 to 1.705)
0.853 (0.798 to 1.018)
Caucasus and Central Asia 360 (380 to 330) 760 (810 to 710) 1100 (1300 to 790) 0.082 (0.078 to
0.087) 0.038 (0.036 to
0.041) 0.027 (0.022 to
0.037)
Eastern Asia 370 (450 to 310) 1100 (1200 to 970) 2300 (2800 to 1900)
0.078 (0.065 to 0.094)
0.026 (0.023 to 0.03)
0.013 (0.01 to 0.015)
South-eastern Asia 87 (100 to 74) 180 (200 to 160) 380 (440 to 300) 0.342 (0.296 to 0.403)
0.161 (0.143 to 0.182)
0.076 (0.066 to 0.098)
Southern Asia 40 (47 to 34) 72 (80 to 63) 210 (240 to 170) 0.758 (0.644 to 0.903)
0.413 (0.373 to 0.471)
0.14 (0.122 to 0.172)
Western Asia 130 (150 to 100) 210 (250 to 180) 360 (440 to 260) 0.23 (0.191 to 0.288)
0.136 (0.117 to 0.164)
0.082 (0.065 to 0.112)
Caribbean 110 (140 to 85) 170 (210 to 140) 250 (330 to 160) 0.271 (0.209 to 0.346)
0.173 (0.14 to 0.217)
0.118 (0.088 to 0.179)
Latin America 220 (230 to 210) 380 (390 to 370) 760 (800 to 690) 0.131 (0.125 to 0.14)
0.077 (0.075 to 0.079)
0.038 (0.036 to 0.042)
Oceania 54 (87 to 31) 76 (130 to 40) 150 (290 to 72) 0.569 (0.351 to 0.978)
0.395 (0.225 to 0.757)
0.203 (0.104 to 0.415)
89
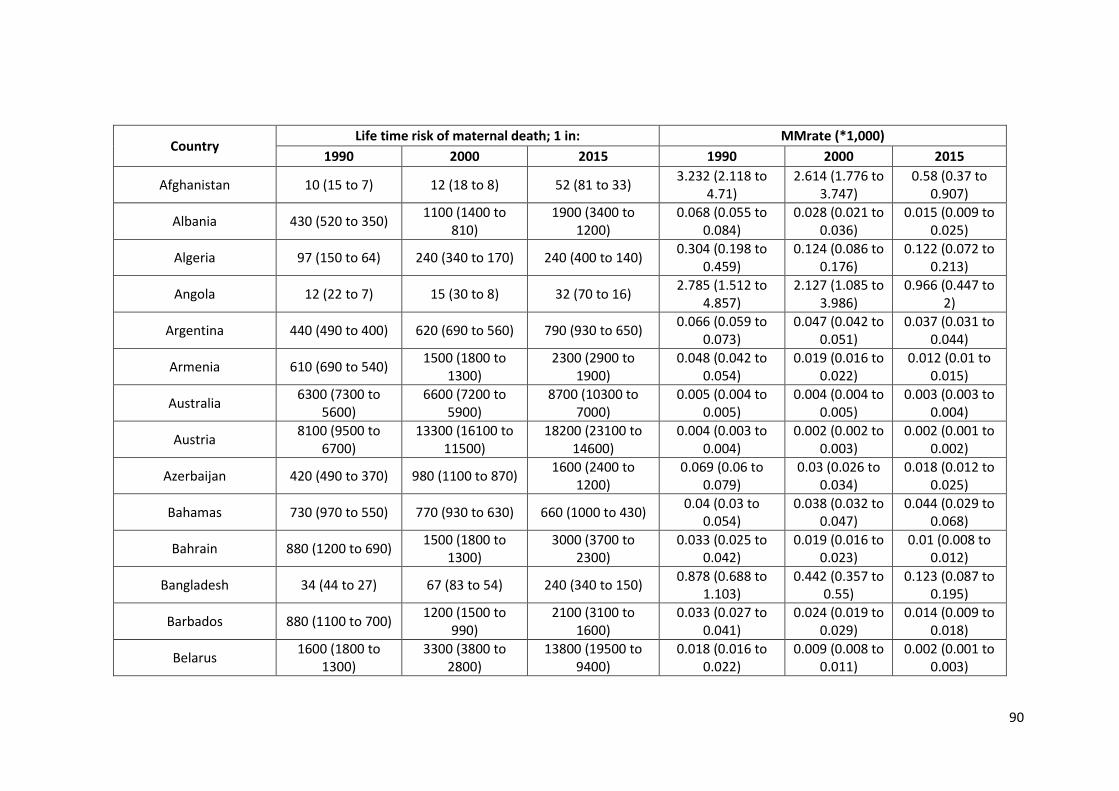
Country Life time risk of maternal death; 1 in: MMrate (*1,000)
1990 2000 2015 1990 2000 2015
Afghanistan 10 (15 to 7) 12 (18 to 8) 52 (81 to 33) 3.232 (2.118 to 4.71)
2.614 (1.776 to 3.747)
0.58 (0.37 to 0.907)
Albania 430 (520 to 350) 1100 (1400 to 810)
1900 (3400 to 1200)
0.068 (0.055 to 0.084)
0.028 (0.021 to 0.036)
0.015 (0.009 to 0.025)
Algeria 97 (150 to 64) 240 (340 to 170) 240 (400 to 140) 0.304 (0.198 to 0.459)
0.124 (0.086 to 0.176)
0.122 (0.072 to 0.213)
Angola 12 (22 to 7) 15 (30 to 8) 32 (70 to 16) 2.785 (1.512 to 4.857)
2.127 (1.085 to 3.986)
0.966 (0.447 to 2)
Argentina 440 (490 to 400) 620 (690 to 560) 790 (930 to 650) 0.066 (0.059 to 0.073)
0.047 (0.042 to 0.051)
0.037 (0.031 to 0.044)
Armenia 610 (690 to 540) 1500 (1800 to 1300)
2300 (2900 to 1900)
0.048 (0.042 to 0.054)
0.019 (0.016 to 0.022)
0.012 (0.01 to 0.015)
Australia 6300 (7300 to 5600)
6600 (7200 to 5900)
8700 (10300 to 7000)
0.005 (0.004 to 0.005)
0.004 (0.004 to 0.005)
0.003 (0.003 to 0.004)
Austria 8100 (9500 to 6700)
13300 (16100 to 11500)
18200 (23100 to 14600)
0.004 (0.003 to 0.004)
0.002 (0.002 to 0.003)
0.002 (0.001 to 0.002)
Azerbaijan 420 (490 to 370) 980 (1100 to 870) 1600 (2400 to 1200)
0.069 (0.06 to 0.079)
0.03 (0.026 to 0.034)
0.018 (0.012 to 0.025)
Bahamas 730 (970 to 550) 770 (930 to 630) 660 (1000 to 430) 0.04 (0.03 to 0.054)
0.038 (0.032 to 0.047)
0.044 (0.029 to 0.068)
Bahrain 880 (1200 to 690) 1500 (1800 to 1300)
3000 (3700 to 2300)
0.033 (0.025 to 0.042)
0.019 (0.016 to 0.023)
0.01 (0.008 to 0.012)
Bangladesh 34 (44 to 27) 67 (83 to 54) 240 (340 to 150) 0.878 (0.688 to 1.103)
0.442 (0.357 to 0.55)
0.123 (0.087 to 0.195)
Barbados 880 (1100 to 700) 1200 (1500 to 990)
2100 (3100 to 1600)
0.033 (0.027 to 0.041)
0.024 (0.019 to 0.029)
0.014 (0.009 to 0.018)
Belarus 1600 (1800 to 1300)
3300 (3800 to 2800)
13800 (19500 to 9400)
0.018 (0.016 to 0.022)
0.009 (0.008 to 0.011)
0.002 (0.001 to 0.003)
90

Country Life time risk of maternal death; 1 in: MMrate (*1,000)
1990 2000 2015 1990 2000 2015
Belgium 6900 (8400 to 5900)
6800 (7900 to 5800)
8000 (10200 to 5800)
0.004 (0.003 to 0.005)
0.004 (0.004 to 0.005)
0.004 (0.003 to 0.005)
Belize 340 (410 to 280) 460 (530 to 390) 1300 (1700 to 980) 0.085 (0.071 to 0.102)
0.064 (0.055 to 0.075)
0.023 (0.017 to 0.03)
Benin 26 (33 to 21) 29 (37 to 23) 51 (74 to 32) 1.185 (0.932 to 1.495)
1.08 (0.846 to 1.38)
0.602 (0.414 to 0.94)
Bhutan 20 (27 to 15) 62 (80 to 49) 310 (450 to 190) 1.594 (1.175 to 2.122)
0.5 (0.388 to 0.637)
0.096 (0.066 to 0.157)
Bolivia 47 (58 to 38) 70 (87 to 56) 160 (230 to 91) 0.651 (0.521 to 0.807)
0.426 (0.346 to 0.53)
0.19 (0.129 to 0.323)
Bosnia and Herzegovina 1900 (2300 to 1600)
4200 (6100 to 3100)
6800 (10900 to 4500)
0.015 (0.013 to 0.018)
0.007 (0.005 to 0.009)
0.004 (0.003 to 0.006)
Botswana 84 (140 to 58) 110 (130 to 97) 270 (340 to 200) 0.36 (0.22 to 0.52) 0.327 (0.275 to 0.379)
0.114 (0.09 to 0.152)
Brazil 300 (350 to 260) 590 (600 to 580) 1200 (1500 to 1000)
0.097 (0.084 to 0.111)
0.049 (0.048 to 0.05)
0.023 (0.019 to 0.029)
Brunei Darussalam 680 (950 to 510) 1300 (1600 to 1000)
2300 (3400 to 1700)
0.043 (0.03 to 0.057)
0.023 (0.018 to 0.028)
0.012 (0.008 to 0.017)
Bulgaria 2300 (2700 to 2000)
4100 (4800 to 3400)
6200 (8400 to 4600)
0.012 (0.011 to 0.014)
0.007 (0.006 to 0.008)
0.005 (0.003 to 0.006)
Burkina Faso 20 (27 to 15) 29 (36 to 23) 48 (70 to 35) 1.553 (1.172 to 2.09)
1.114 (0.881 to 1.397)
0.636 (0.441 to 0.873)
Burundi 12 (17 to 8) 17 (24 to 13) 23 (35 to 16) 2.749 (1.906 to 3.956)
1.894 (1.355 to 2.592)
1.323 (0.876 to 1.949)
Cabo Verde 64 (120 to 36) 300 (550 to 150) 900 (1900 to 400) 0.459 (0.253 to 0.824)
0.097 (0.053 to 0.189)
0.032 (0.015 to 0.072)
Cambodia 18 (25 to 13) 57 (70 to 46) 210 (290 to 160) 1.795 (1.277 to 2.38)
0.534 (0.437 to 0.658)
0.139 (0.102 to 0.185)
Cameroon 21 (27 to 16) 23 (28 to 19) 35 (47 to 23) 1.506 (1.17 to 1.915)
1.383 (1.135 to 1.694)
0.904 (0.666 to 1.335)
91
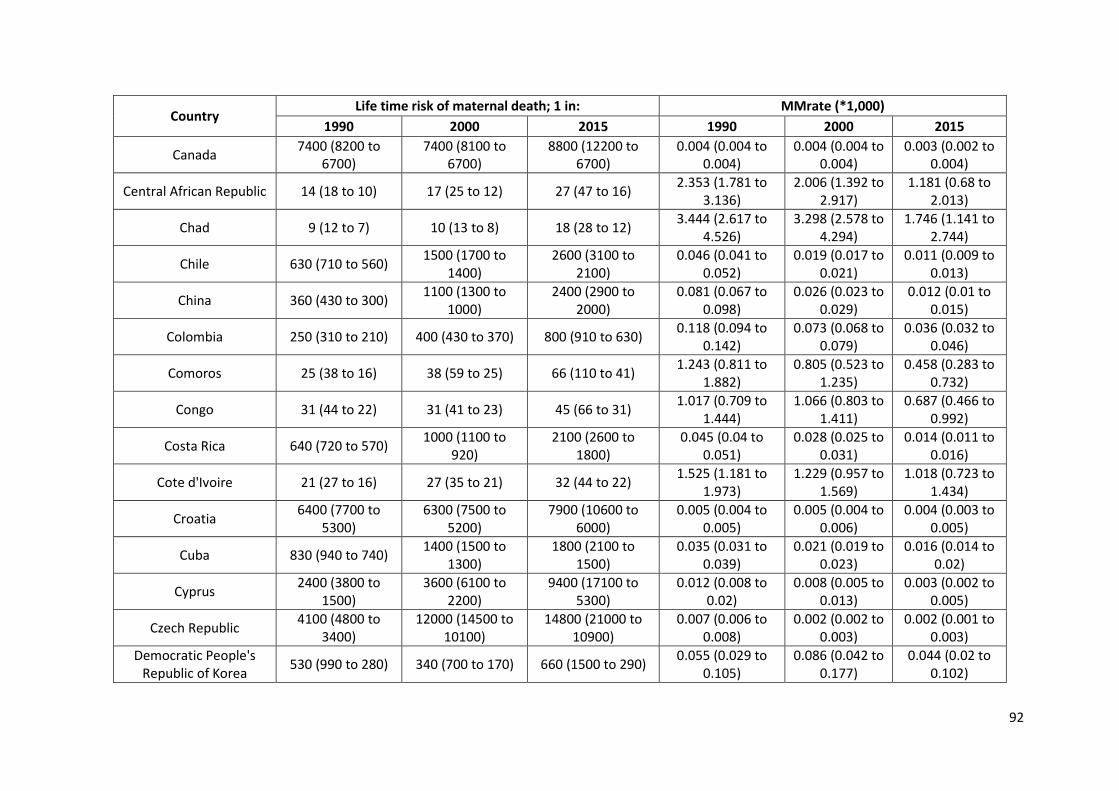
Country Life time risk of maternal death; 1 in: MMrate (*1,000)
1990 2000 2015 1990 2000 2015
Canada 7400 (8200 to 6700)
7400 (8100 to 6700)
8800 (12200 to 6700)
0.004 (0.004 to 0.004)
0.004 (0.004 to 0.004)
0.003 (0.002 to 0.004)
Central African Republic 14 (18 to 10) 17 (25 to 12) 27 (47 to 16) 2.353 (1.781 to 3.136)
2.006 (1.392 to 2.917)
1.181 (0.68 to 2.013)
Chad 9 (12 to 7) 10 (13 to 8) 18 (28 to 12) 3.444 (2.617 to 4.526)
3.298 (2.578 to 4.294)
1.746 (1.141 to 2.744)
Chile 630 (710 to 560) 1500 (1700 to 1400)
2600 (3100 to 2100)
0.046 (0.041 to 0.052)
0.019 (0.017 to 0.021)
0.011 (0.009 to 0.013)
China 360 (430 to 300) 1100 (1300 to 1000)
2400 (2900 to 2000)
0.081 (0.067 to 0.098)
0.026 (0.023 to 0.029)
0.012 (0.01 to 0.015)
Colombia 250 (310 to 210) 400 (430 to 370) 800 (910 to 630) 0.118 (0.094 to 0.142)
0.073 (0.068 to 0.079)
0.036 (0.032 to 0.046)
Comoros 25 (38 to 16) 38 (59 to 25) 66 (110 to 41) 1.243 (0.811 to 1.882)
0.805 (0.523 to 1.235)
0.458 (0.283 to 0.732)
Congo 31 (44 to 22) 31 (41 to 23) 45 (66 to 31) 1.017 (0.709 to 1.444)
1.066 (0.803 to 1.411)
0.687 (0.466 to 0.992)
Costa Rica 640 (720 to 570) 1000 (1100 to 920)
2100 (2600 to 1800)
0.045 (0.04 to 0.051)
0.028 (0.025 to 0.031)
0.014 (0.011 to 0.016)
Cote d'Ivoire 21 (27 to 16) 27 (35 to 21) 32 (44 to 22) 1.525 (1.181 to 1.973)
1.229 (0.957 to 1.569)
1.018 (0.723 to 1.434)
Croatia 6400 (7700 to 5300)
6300 (7500 to 5200)
7900 (10600 to 6000)
0.005 (0.004 to 0.005)
0.005 (0.004 to 0.006)
0.004 (0.003 to 0.005)
Cuba 830 (940 to 740) 1400 (1500 to 1300)
1800 (2100 to 1500)
0.035 (0.031 to 0.039)
0.021 (0.019 to 0.023)
0.016 (0.014 to 0.02)
Cyprus 2400 (3800 to 1500)
3600 (6100 to 2200)
9400 (17100 to 5300)
0.012 (0.008 to 0.02)
0.008 (0.005 to 0.013)
0.003 (0.002 to 0.005)
Czech Republic 4100 (4800 to 3400)
12000 (14500 to 10100)
14800 (21000 to 10900)
0.007 (0.006 to 0.008)
0.002 (0.002 to 0.003)
0.002 (0.001 to 0.003)
Democratic People's Republic of Korea 530 (990 to 280) 340 (700 to 170) 660 (1500 to 290) 0.055 (0.029 to
0.105) 0.086 (0.042 to
0.177) 0.044 (0.02 to
0.102)
92

Country Life time risk of maternal death; 1 in: MMrate (*1,000)
1990 2000 2015 1990 2000 2015 Democratic Republic of
the Congo 17 (24 to 12) 17 (23 to 13) 24 (33 to 17) 1.891 (1.311 to 2.693)
1.888 (1.379 to 2.498)
1.288 (0.946 to 1.883)
Denmark 5700 (6600 to 5000)
6100 (7100 to 5300)
9500 (12000 to 6900)
0.005 (0.004 to 0.006)
0.005 (0.004 to 0.005)
0.003 (0.002 to 0.004)
Djibouti 35 (62 to 20) 59 (110 to 31) 140 (300 to 68) 0.879 (0.494 to 1.542)
0.522 (0.284 to 0.988)
0.211 (0.102 to 0.444)
Dominican Republic 120 (180 to 83) 380 (410 to 360) 400 (490 to 330) 0.239 (0.16 to 0.353)
0.077 (0.072 to 0.081)
0.073 (0.06 to 0.088)
Ecuador 130 (150 to 110) 300 (330 to 260) 580 (660 to 520) 0.225 (0.198 to 0.255)
0.099 (0.088 to 0.112)
0.05 (0.044 to 0.056)
Egypt 190 (220 to 160) 450 (510 to 400) 810 (1000 to 700) 0.156 (0.132 to 0.187)
0.064 (0.057 to 0.073)
0.036 (0.028 to 0.042)
El Salvador 150 (180 to 130) 380 (420 to 330) 890 (1200 to 700) 0.197 (0.168 to 0.232)
0.078 (0.069 to 0.088)
0.033 (0.024 to 0.042)
Equatorial Guinea 12 (20 to 8) 27 (41 to 18) 61 (100 to 38) 2.581 (1.608 to 4.093)
1.212 (0.789 to 1.838)
0.515 (0.312 to 0.818)
Eritrea 11 (15 to 8) 27 (38 to 20) 43 (65 to 29) 2.9 (2.121 to 3.914)
1.188 (0.855 to 1.613)
0.691 (0.459 to 1.035)
Estonia 1200 (1500 to 1000)
3100 (3700 to 2500)
6300 (9500 to 4300)
0.023 (0.019 to 0.028)
0.009 (0.008 to 0.011)
0.005 (0.003 to 0.007)
Ethiopia 12 (16 to 9) 18 (23 to 15) 64 (92 to 40) 2.699 (1.961 to 3.556)
1.78 (1.425 to 2.192)
0.465 (0.326 to 0.748)
Fiji 400 (550 to 260) 730 (920 to 580) 1200 (1600 to 920) 0.073 (0.054 to 0.113)
0.04 (0.032 to 0.051)
0.024 (0.018 to 0.032)
Finland 9600 (11400 to 7900)
13000 (15300 to 11000)
21700 (31100 to 17000)
0.003 (0.003 to 0.004)
0.002 (0.002 to 0.003)
0.001 (0.001 to 0.002)
France 3800 (4300 to 3300)
4700 (5100 to 4300)
6100 (7900 to 5000)
0.008 (0.007 to 0.009)
0.006 (0.006 to 0.007)
0.005 (0.004 to 0.006)
Gabon 41 (60 to 29) 52 (71 to 38) 85 (130 to 56) 0.732 (0.502 to 1.039)
0.599 (0.441 to 0.814)
0.356 (0.241 to 0.541)
93

Country Life time risk of maternal death; 1 in: MMrate (*1,000)
1990 2000 2015 1990 2000 2015
Gambia 15 (23 to 10) 18 (27 to 13) 24 (35 to 17) 2.094 (1.372 to 3.048)
1.691 (1.162 to 2.377)
1.252 (0.859 to 1.828)
Georgia 1200 (1500 to 1100)
1700 (2100 to 1400)
1500 (1900 to 1100)
0.023 (0.02 to 0.027)
0.017 (0.014 to 0.02)
0.02 (0.015 to 0.025)
Germany 6100 (6900 to 5100)
9300 (10600 to 8400)
11700 (13800 to 9400)
0.005 (0.004 to 0.006)
0.003 (0.003 to 0.003)
0.002 (0.002 to 0.003)
Ghana 28 (41 to 20) 46 (62 to 33) 74 (110 to 52) 1.09 (0.749 to 1.565)
0.679 (0.497 to 0.937)
0.406 (0.275 to 0.582)
Greece 13100 (15700 to 11000)
21400 (26200 to 17800)
23700 (32800 to 18000)
0.002 (0.002 to 0.003)
0.001 (0.001 to 0.002)
0.001 (0.001 to 0.002)
Grenada 540 (720 to 410) 1300 (1800 to 950) 1500 (2200 to 960) 0.054 (0.04 to
0.071) 0.023 (0.017 to
0.031) 0.019 (0.013 to
0.03)
Guatemala 86 (91 to 81) 110 (120 to 110) 330 (370 to 290) 0.349 (0.329 to 0.37)
0.257 (0.246 to 0.269)
0.09 (0.079 to 0.102)
Guinea 14 (19 to 11) 17 (21 to 14) 29 (39 to 21) 2.206 (1.655 to 2.869)
1.849 (1.491 to 2.282)
1.064 (0.79 to 1.453)
Guinea-Bissau 17 (30 to 10) 22 (43 to 12) 38 (77 to 19) 1.85 (1.044 to 3.138)
1.417 (0.738 to 2.564)
0.829 (0.413 to 1.643)
Guyana 140 (170 to 120) 150 (170 to 130) 170 (210 to 130) 0.207 (0.171 to 0.239)
0.205 (0.18 to 0.234)
0.175 (0.141 to 0.23)
Haiti 31 (44 to 23) 49 (64 to 37) 90 (140 to 54) 1.008 (0.699 to 1.357)
0.642 (0.49 to 0.843)
0.332 (0.218 to 0.554)
Honduras 64 (68 to 60) 170 (200 to 150) 300 (390 to 230) 0.464 (0.436 to 0.495)
0.175 (0.151 to 0.203)
0.099 (0.076 to 0.127)
Hungary 2400 (2800 to 2100)
5300 (6500 to 4400)
4400 (5800 to 3300)
0.012 (0.01 to 0.014)
0.005 (0.004 to 0.007)
0.007 (0.005 to 0.009)
Iceland 6400 (8700 to 4600)
10700 (15800 to 7400)
14600 (26200 to 9000)
0.005 (0.003 to 0.006)
0.003 (0.002 to 0.004)
0.002 (0.001 to 0.003)
India 41 (51 to 33) 75 (87 to 64) 220 (280 to 180) 0.741 (0.592 to 0.912)
0.4 (0.346 to 0.467)
0.134 (0.107 to 0.166)
94

Country Life time risk of maternal death; 1 in: MMrate (*1,000)
1990 2000 2015 1990 2000 2015
Indonesia 65 (84 to 52) 140 (180 to 120) 320 (430 to 220) 0.456 (0.355 to 0.577)
0.208 (0.167 to 0.255)
0.091 (0.068 to 0.13)
Iran 160 (200 to 120) 820 (970 to 700) 2000 (2400 to 1600)
0.186 (0.148 to 0.258)
0.036 (0.03 to 0.042)
0.014 (0.012 to 0.018)
Iraq 160 (210 to 110) 310 (390 to 250) 420 (600 to 300) 0.184 (0.137 to 0.261)
0.093 (0.074 to 0.118)
0.07 (0.049 to 0.096)
Ireland 4400 (5300 to 3800)
5400 (6400 to 4600)
6100 (7700 to 4300)
0.006 (0.005 to 0.008)
0.005 (0.005 to 0.006)
0.005 (0.004 to 0.007)
Israel 2900 (3300 to 2500)
4100 (4700 to 3600)
6200 (7600 to 5100)
0.01 (0.009 to 0.012)
0.007 (0.006 to 0.008)
0.005 (0.004 to 0.006)
Italy 9400 (10700 to 8100)
15000 (17500 to 13000)
19700 (26500 to 15100)
0.003 (0.003 to 0.004)
0.002 (0.002 to 0.002)
0.001 (0.001 to 0.002)
Jamaica 360 (440 to 290) 400 (450 to 350) 520 (650 to 400) 0.082 (0.066 to 0.1)
0.074 (0.066 to 0.084)
0.057 (0.045 to 0.073)
Japan 5200 (5800 to 4600)
7600 (8500 to 6600)
13400 (17300 to 10500)
0.006 (0.005 to 0.006)
0.004 (0.003 to 0.004)
0.002 (0.002 to 0.003)
Jordan 150 (190 to 120) 290 (340 to 240) 490 (640 to 380) 0.19 (0.152 to 0.243)
0.1 (0.085 to 0.12)
0.059 (0.045 to 0.077)
Kazakhstan 410 (460 to 360) 780 (900 to 680) 3000 (3700 to 2400)
0.072 (0.064 to 0.082)
0.038 (0.033 to 0.043)
0.01 (0.008 to 0.012)
Kenya 23 (30 to 17) 28 (34 to 22) 42 (63 to 29) 1.336 (1.007 to 1.749)
1.221 (0.989 to 1.524)
0.716 (0.484 to 1.059)
Kiribati 88 (120 to 62) 150 (220 to 100) 300 (520 to 180) 0.344 (0.249 to 0.484)
0.202 (0.137 to 0.292)
0.098 (0.056 to 0.166)
Kuwait 5600 (7100 to 4600)
4500 (5300 to 3900)
10300 (13000 to 7600)
0.005 (0.004 to 0.006)
0.006 (0.005 to 0.007)
0.003 (0.002 to 0.004)
Kyrgyzstan 280 (320 to 250) 480 (550 to 420) 390 (500 to 310) 0.105 (0.093 to 0.119)
0.061 (0.053 to 0.07)
0.075 (0.059 to 0.095)
Lao 18 (25 to 13) 41 (53 to 31) 150 (220 to 97) 1.739 (1.225 to 2.367)
0.744 (0.568 to 0.982)
0.195 (0.134 to 0.304)
95
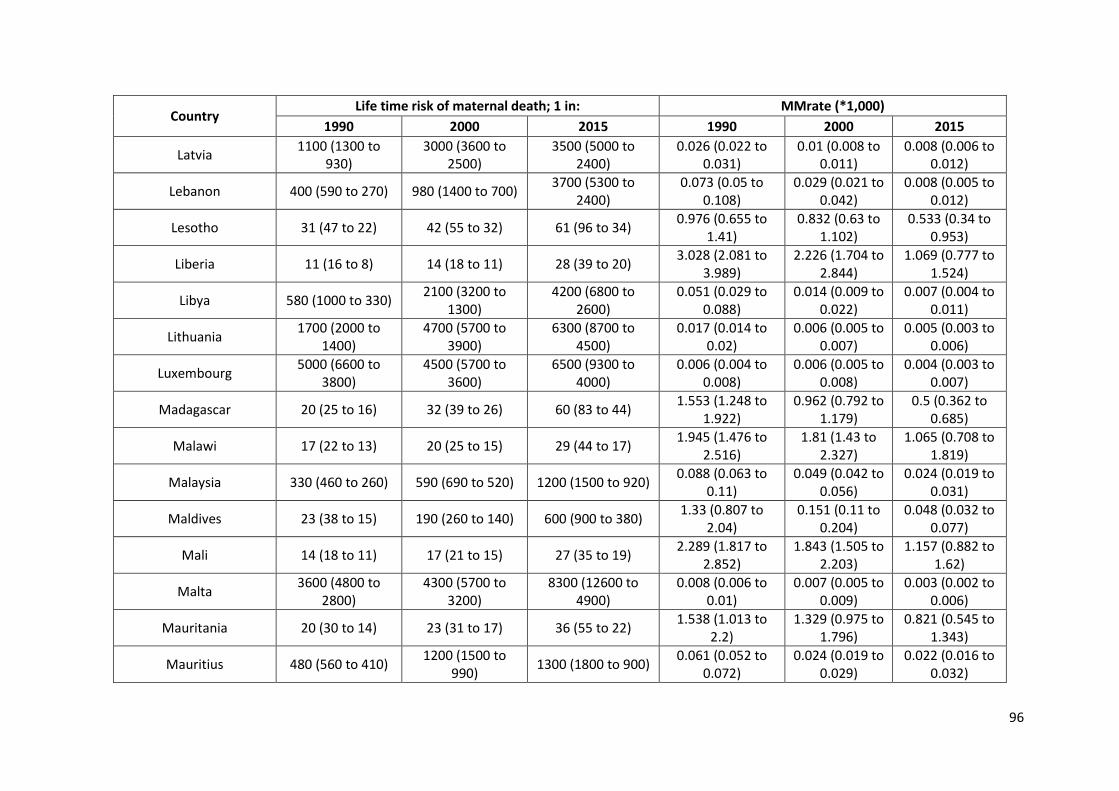
Country Life time risk of maternal death; 1 in: MMrate (*1,000)
1990 2000 2015 1990 2000 2015
Latvia 1100 (1300 to 930)
3000 (3600 to 2500)
3500 (5000 to 2400)
0.026 (0.022 to 0.031)
0.01 (0.008 to 0.011)
0.008 (0.006 to 0.012)
Lebanon 400 (590 to 270) 980 (1400 to 700) 3700 (5300 to 2400)
0.073 (0.05 to 0.108)
0.029 (0.021 to 0.042)
0.008 (0.005 to 0.012)
Lesotho 31 (47 to 22) 42 (55 to 32) 61 (96 to 34) 0.976 (0.655 to 1.41)
0.832 (0.63 to 1.102)
0.533 (0.34 to 0.953)
Liberia 11 (16 to 8) 14 (18 to 11) 28 (39 to 20) 3.028 (2.081 to 3.989)
2.226 (1.704 to 2.844)
1.069 (0.777 to 1.524)
Libya 580 (1000 to 330) 2100 (3200 to 1300)
4200 (6800 to 2600)
0.051 (0.029 to 0.088)
0.014 (0.009 to 0.022)
0.007 (0.004 to 0.011)
Lithuania 1700 (2000 to 1400)
4700 (5700 to 3900)
6300 (8700 to 4500)
0.017 (0.014 to 0.02)
0.006 (0.005 to 0.007)
0.005 (0.003 to 0.006)
Luxembourg 5000 (6600 to 3800)
4500 (5700 to 3600)
6500 (9300 to 4000)
0.006 (0.004 to 0.008)
0.006 (0.005 to 0.008)
0.004 (0.003 to 0.007)
Madagascar 20 (25 to 16) 32 (39 to 26) 60 (83 to 44) 1.553 (1.248 to 1.922)
0.962 (0.792 to 1.179)
0.5 (0.362 to 0.685)
Malawi 17 (22 to 13) 20 (25 to 15) 29 (44 to 17) 1.945 (1.476 to 2.516)
1.81 (1.43 to 2.327)
1.065 (0.708 to 1.819)
Malaysia 330 (460 to 260) 590 (690 to 520) 1200 (1500 to 920) 0.088 (0.063 to 0.11)
0.049 (0.042 to 0.056)
0.024 (0.019 to 0.031)
Maldives 23 (38 to 15) 190 (260 to 140) 600 (900 to 380) 1.33 (0.807 to 2.04)
0.151 (0.11 to 0.204)
0.048 (0.032 to 0.077)
Mali 14 (18 to 11) 17 (21 to 15) 27 (35 to 19) 2.289 (1.817 to 2.852)
1.843 (1.505 to 2.203)
1.157 (0.882 to 1.62)
Malta 3600 (4800 to 2800)
4300 (5700 to 3200)
8300 (12600 to 4900)
0.008 (0.006 to 0.01)
0.007 (0.005 to 0.009)
0.003 (0.002 to 0.006)
Mauritania 20 (30 to 14) 23 (31 to 17) 36 (55 to 22) 1.538 (1.013 to 2.2)
1.329 (0.975 to 1.796)
0.821 (0.545 to 1.343)
Mauritius 480 (560 to 410) 1200 (1500 to 990) 1300 (1800 to 900) 0.061 (0.052 to
0.072) 0.024 (0.019 to
0.029) 0.022 (0.016 to
0.032)
96
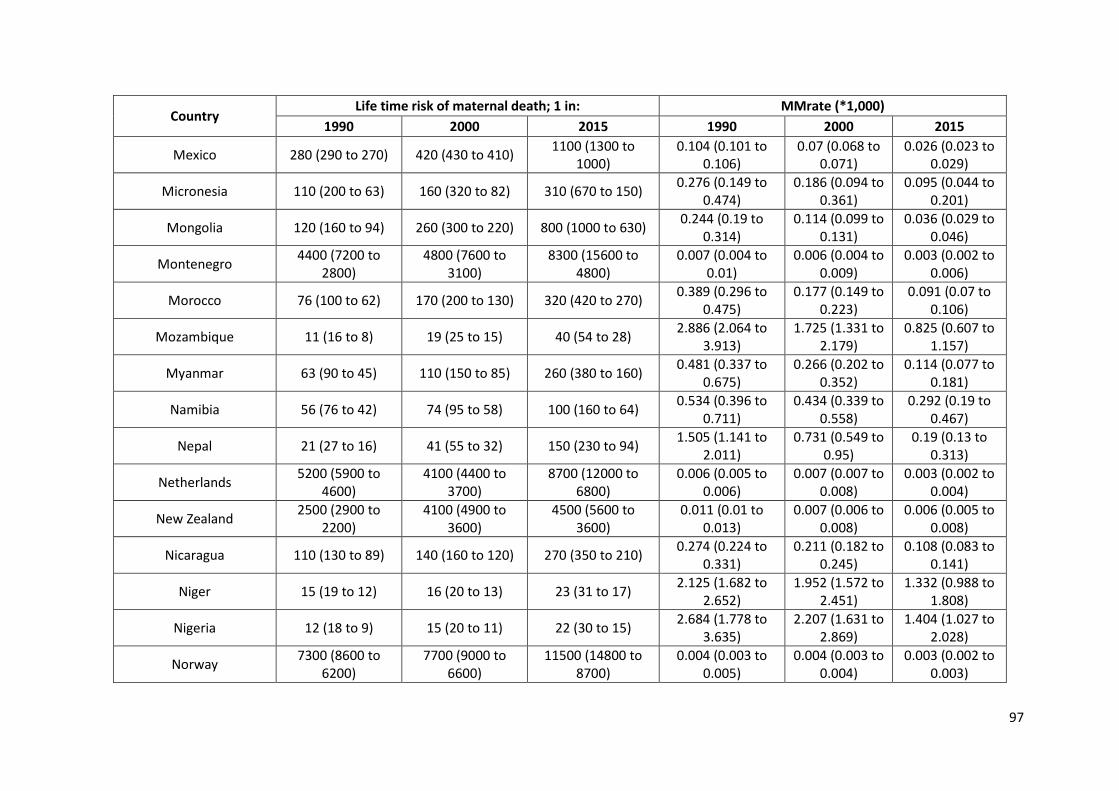
Country Life time risk of maternal death; 1 in: MMrate (*1,000)
1990 2000 2015 1990 2000 2015
Mexico 280 (290 to 270) 420 (430 to 410) 1100 (1300 to 1000)
0.104 (0.101 to 0.106)
0.07 (0.068 to 0.071)
0.026 (0.023 to 0.029)
Micronesia 110 (200 to 63) 160 (320 to 82) 310 (670 to 150) 0.276 (0.149 to 0.474)
0.186 (0.094 to 0.361)
0.095 (0.044 to 0.201)
Mongolia 120 (160 to 94) 260 (300 to 220) 800 (1000 to 630) 0.244 (0.19 to 0.314)
0.114 (0.099 to 0.131)
0.036 (0.029 to 0.046)
Montenegro 4400 (7200 to 2800)
4800 (7600 to 3100)
8300 (15600 to 4800)
0.007 (0.004 to 0.01)
0.006 (0.004 to 0.009)
0.003 (0.002 to 0.006)
Morocco 76 (100 to 62) 170 (200 to 130) 320 (420 to 270) 0.389 (0.296 to 0.475)
0.177 (0.149 to 0.223)
0.091 (0.07 to 0.106)
Mozambique 11 (16 to 8) 19 (25 to 15) 40 (54 to 28) 2.886 (2.064 to 3.913)
1.725 (1.331 to 2.179)
0.825 (0.607 to 1.157)
Myanmar 63 (90 to 45) 110 (150 to 85) 260 (380 to 160) 0.481 (0.337 to 0.675)
0.266 (0.202 to 0.352)
0.114 (0.077 to 0.181)
Namibia 56 (76 to 42) 74 (95 to 58) 100 (160 to 64) 0.534 (0.396 to 0.711)
0.434 (0.339 to 0.558)
0.292 (0.19 to 0.467)
Nepal 21 (27 to 16) 41 (55 to 32) 150 (230 to 94) 1.505 (1.141 to 2.011)
0.731 (0.549 to 0.95)
0.19 (0.13 to 0.313)
Netherlands 5200 (5900 to 4600)
4100 (4400 to 3700)
8700 (12000 to 6800)
0.006 (0.005 to 0.006)
0.007 (0.007 to 0.008)
0.003 (0.002 to 0.004)
New Zealand 2500 (2900 to 2200)
4100 (4900 to 3600)
4500 (5600 to 3600)
0.011 (0.01 to 0.013)
0.007 (0.006 to 0.008)
0.006 (0.005 to 0.008)
Nicaragua 110 (130 to 89) 140 (160 to 120) 270 (350 to 210) 0.274 (0.224 to 0.331)
0.211 (0.182 to 0.245)
0.108 (0.083 to 0.141)
Niger 15 (19 to 12) 16 (20 to 13) 23 (31 to 17) 2.125 (1.682 to 2.652)
1.952 (1.572 to 2.451)
1.332 (0.988 to 1.808)
Nigeria 12 (18 to 9) 15 (20 to 11) 22 (30 to 15) 2.684 (1.778 to 3.635)
2.207 (1.631 to 2.869)
1.404 (1.027 to 2.028)
Norway 7300 (8600 to 6200)
7700 (9000 to 6600)
11500 (14800 to 8700)
0.004 (0.003 to 0.005)
0.004 (0.003 to 0.004)
0.003 (0.002 to 0.003)
97

Country Life time risk of maternal death; 1 in: MMrate (*1,000)
1990 2000 2015 1990 2000 2015 Occupied Palestinian
Territory 120 (210 to 64) 240 (470 to 120) 490 (1100 to 220) 0.254 (0.138 to 0.459)
0.123 (0.062 to 0.243)
0.06 (0.027 to 0.13)
Oman 460 (570 to 360) 1300 (1500 to 1100)
1900 (2500 to 1300)
0.065 (0.051 to 0.082)
0.023 (0.02 to 0.027)
0.016 (0.011 to 0.022)
Pakistan 38 (56 to 25) 69 (100 to 47) 140 (230 to 91) 0.795 (0.531 to 1.208)
0.428 (0.291 to 0.624)
0.203 (0.127 to 0.324)
Panama 280 (330 to 240) 400 (460 to 360) 420 (510 to 330) 0.105 (0.088 to 0.123)
0.072 (0.063 to 0.081)
0.069 (0.057 to 0.089)
Papua New Guinea 44 (79 to 25) 63 (120 to 32) 120 (270 to 58) 0.697 (0.392 to 1.248)
0.483 (0.251 to 0.964)
0.241 (0.11 to 0.512)
Paraguay 130 (160 to 110) 160 (180 to 150) 270 (330 to 220) 0.216 (0.179 to 0.256)
0.176 (0.158 to 0.197)
0.107 (0.087 to 0.132)
Peru 96 (120 to 74) 230 (250 to 190) 570 (730 to 490) 0.306 (0.252 to 0.395)
0.13 (0.115 to 0.151)
0.051 (0.04 to 0.06)
Philippines 140 (170 to 120) 200 (220 to 180) 280 (370 to 190) 0.206 (0.172 to 0.239)
0.146 (0.13 to 0.163)
0.103 (0.078 to 0.158)
Poland 2800 (3200 to 2500)
9500 (11200 to 8200)
22100 (30200 to 16300)
0.01 (0.009 to 0.012)
0.003 (0.003 to 0.004)
0.001 (0.001 to 0.002)
Portugal 3600 (4100 to 3200)
5000 (5800 to 4500)
8200 (9700 to 6400)
0.008 (0.007 to 0.009)
0.006 (0.005 to 0.006)
0.004 (0.003 to 0.004)
Puerto Rico 1600 (1800 to 1400)
2400 (2700 to 2000)
4300 (5900 to 3500)
0.018 (0.016 to 0.021)
0.012 (0.011 to 0.014)
0.007 (0.005 to 0.008)
Qatar 780 (1300 to 530) 1200 (1700 to 880)
3500 (5100 to 2400)
0.037 (0.023 to 0.054)
0.024 (0.017 to 0.033)
0.008 (0.006 to 0.012)
Republic of Korea 2500 (2800 to 2200)
4500 (5000 to 4000)
7200 (8800 to 6100)
0.012 (0.01 to 0.013)
0.006 (0.006 to 0.007)
0.004 (0.003 to 0.005)
Republic of Moldova 780 (880 to 690) 1400 (1700 to 1300)
3200 (3900 to 2600)
0.037 (0.033 to 0.042)
0.02 (0.018 to 0.023)
0.009 (0.007 to 0.011)
Romania 420 (480 to 370) 1400 (1700 to 1300)
2300 (3300 to 1700)
0.07 (0.061 to 0.08)
0.02 (0.017 to 0.023)
0.012 (0.009 to 0.017)
98

Country Life time risk of maternal death; 1 in: MMrate (*1,000)
1990 2000 2015 1990 2000 2015
Russian Federation 820 (930 to 730) 1500 (1700 to 1400)
2300 (3100 to 1700)
0.035 (0.031 to 0.04)
0.019 (0.017 to 0.022)
0.013 (0.009 to 0.017)
Rwanda 12 (17 to 9) 21 (26 to 17) 85 (120 to 63) 2.659 (1.925 to 3.447)
1.606 (1.3 to 1.941)
0.353 (0.253 to 0.473)
Saint Lucia 550 (700 to 440) 720 (910 to 580) 1100 (1600 to 720) 0.053 (0.042 to 0.067)
0.04 (0.032 to 0.05)
0.026 (0.018 to 0.04)
Samoa 130 (240 to 73) 230 (450 to 120) 500 (1100 to 220) 0.225 (0.122 to 0.403)
0.127 (0.065 to 0.248)
0.058 (0.027 to 0.129)
Sao Tome and Principe 47 (76 to 29) 79 (130 to 49) 140 (260 to 79) 0.643 (0.395 to 1.03)
0.38 (0.235 to 0.609)
0.219 (0.116 to 0.375)
Saudi Arabia 350 (500 to 240) 1000 (1500 to 730)
3100 (5200 to 1800)
0.084 (0.058 to 0.122)
0.028 (0.019 to 0.04)
0.009 (0.006 to 0.016)
Senegal 28 (35 to 22) 36 (46 to 28) 61 (90 to 41) 1.088 (0.857 to 1.387)
0.84 (0.656 to 1.076)
0.489 (0.333 to 0.727)
Serbia 3400 (4600 to 2600)
3300 (4200 to 2600)
3900 (5300 to 2700)
0.008 (0.006 to 0.011)
0.009 (0.007 to 0.011)
0.007 (0.005 to 0.011)
Sierra Leone 7 (10 to 5) 7 (9 to 5) 17 (23 to 12) 5.241 (3.556 to 7.27)
5.264 (3.925 to 6.873)
1.977 (1.453 to 2.875)
Singapore 4000 (4900 to 3300)
3500 (4300 to 2900)
8200 (13100 to 5000)
0.007 (0.006 to 0.009)
0.008 (0.007 to 0.01)
0.003 (0.002 to 0.006)
Slovakia 4200 (5100 to 3400)
9800 (11400 to 8200)
12100 (15600 to 9800)
0.007 (0.006 to 0.008)
0.003 (0.003 to 0.004)
0.002 (0.002 to 0.003)
Slovenia 5700 (7000 to 4700)
6900 (8400 to 5600)
7000 (9900 to 4400)
0.005 (0.004 to 0.006)
0.004 (0.003 to 0.005)
0.004 (0.003 to 0.007)
Solomon Islands 47 (72 to 31) 93 (140 to 62) 220 (330 to 140) 0.651 (0.431 to 0.985)
0.325 (0.221 to 0.486)
0.135 (0.089 to 0.207)
Somalia 13 (22 to 8) 13 (24 to 8) 22 (44 to 11) 2.551 (1.49 to 4.183)
2.381 (1.316 to 4.138)
1.438 (0.71 to 2.738)
South Africa 240 (340 to 160) 410 (420 to 400) 300 (330 to 270) 0.126 (0.087 to 0.186)
0.077 (0.075 to 0.079)
0.104 (0.094 to 0.116)
99

Country Life time risk of maternal death; 1 in: MMrate (*1,000)
1990 2000 2015 1990 2000 2015
South Sudan 9 (14 to 7) 13 (17 to 10) 26 (39 to 18) 3.491 (2.382 to 4.911)
2.488 (1.84 to 3.341)
1.199 (0.795 to 1.745)
Spain 10900 (12300 to 9700)
14300 (16300 to 12700)
14700 (17600 to 11600)
0.003 (0.002 to 0.003)
0.002 (0.002 to 0.002)
0.002 (0.002 to 0.002)
Sri Lanka 500 (570 to 420) 760 (840 to 690) 1600 (1800 to 1300)
0.059 (0.051 to 0.071)
0.039 (0.035 to 0.042)
0.018 (0.016 to 0.023)
St Vincent and the Grenadines 480 (600 to 370) 520 (660 to 420) 1100 (1400 to 760) 0.061 (0.049 to
0.078) 0.057 (0.044 to
0.071) 0.027 (0.02 to
0.038)
Sudan 22 (31 to 16) 33 (43 to 24) 72 (100 to 52) 1.406 (1 to 1.987) 0.931 (0.703 to 1.249)
0.418 (0.288 to 0.583)
Suriname 210 (260 to 170) 130 (150 to 110) 270 (380 to 190) 0.139 (0.114 to 0.169)
0.227 (0.191 to 0.273)
0.108 (0.077 to 0.154)
Swaziland 27 (45 to 18) 46 (67 to 32) 76 (120 to 47) 1.128 (0.692 to 1.767)
0.775 (0.533 to 1.119)
0.439 (0.284 to 0.707)
Sweden 6700 (7800 to 5900)
11600 (13100 to 10300)
12900 (15400 to 9900)
0.004 (0.004 to 0.005)
0.002 (0.002 to 0.003)
0.002 (0.002 to 0.003)
Switzerland 7600 (9000 to 6400)
10000 (11700 to 8700)
12400 (15500 to 9300)
0.004 (0.003 to 0.005)
0.003 (0.002 to 0.003)
0.002 (0.002 to 0.003)
Syrian Arab Republic 150 (220 to 100) 330 (460 to 230) 440 (620 to 310) 0.201 (0.133 to 0.291)
0.089 (0.064 to 0.125)
0.066 (0.046 to 0.094)
Tajikistan 150 (180 to 130) 340 (400 to 290) 790 (1300 to 490) 0.194 (0.168 to 0.226)
0.087 (0.074 to 0.102)
0.037 (0.022 to 0.059)
Tanzania 16 (21 to 13) 22 (28 to 18) 45 (64 to 32) 1.947 (1.514 to 2.499)
1.541 (1.228 to 1.925)
0.668 (0.472 to 0.956)
TFYR Macedonia 3000 (3800 to 2400)
4900 (5800 to 4100)
8500 (11700 to 6400)
0.01 (0.008 to 0.012)
0.006 (0.005 to 0.007)
0.003 (0.002 to 0.005)
Thailand 1100 (1300 to 890)
2400 (2700 to 2100)
3600 (5200 to 2300)
0.027 (0.023 to 0.033)
0.012 (0.011 to 0.014)
0.008 (0.006 to 0.013)
Timor-Leste 17 (25 to 12) 20 (26 to 15) 82 (120 to 59) 1.845 (1.265 to 2.578)
1.549 (1.154 to 2.064)
0.359 (0.252 to 0.502)
100

Country Life time risk of maternal death; 1 in: MMrate (*1,000)
1990 2000 2015 1990 2000 2015
Togo 28 (38 to 21) 38 (51 to 29) 58 (84 to 41) 1.082 (0.818 to 1.445)
0.82 (0.614 to 1.085)
0.529 (0.366 to 0.744)
Tonga 290 (540 to 170) 250 (480 to 130) 230 (510 to 110) 0.099 (0.054 to 0.174)
0.119 (0.06 to 0.231)
0.128 (0.058 to 0.278)
Trinidad and Tobago 400 (460 to 350) 890 (1000 to 780) 860 (1100 to 680) 0.073 (0.064 to 0.083)
0.033 (0.029 to 0.037)
0.034 (0.026 to 0.043)
Tunisia 210 (280 to 150) 540 (740 to 400) 710 (1000 to 480) 0.141 (0.103 to 0.189)
0.053 (0.039 to 0.072)
0.041 (0.028 to 0.06)
Turkey 290 (450 to 190) 470 (620 to 340) 3000 (3900 to 2300)
0.1 (0.065 to 0.153)
0.063 (0.047 to 0.086)
0.01 (0.008 to 0.013)
Turkmenistan 240 (270 to 210) 560 (800 to 410) 940 (2000 to 540) 0.123 (0.107 to 0.142)
0.053 (0.037 to 0.072)
0.031 (0.015 to 0.055)
Uganda 21 (26 to 16) 25 (30 to 20) 47 (65 to 33) 1.567 (1.242 to 2.002)
1.408 (1.143 to 1.74)
0.657 (0.473 to 0.945)
Ukraine 1200 (1400 to 1100)
2700 (3100 to 2400)
2600 (3400 to 2000)
0.024 (0.021 to 0.027)
0.011 (0.01 to 0.012)
0.011 (0.008 to 0.014)
United Arab Emirates 1200 (2000 to 690)
3800 (6800 to 2200)
7900 (16400 to 4200)
0.025 (0.015 to 0.042)
0.008 (0.004 to 0.013)
0.004 (0.002 to 0.007)
United Kingdom 5200 (5500 to 4900)
5100 (5400 to 4800)
5800 (6900 to 4900)
0.006 (0.005 to 0.006)
0.006 (0.005 to 0.006)
0.005 (0.004 to 0.006)
United States of America 4100 (4600 to 3700)
4300 (4500 to 4200)
3800 (4400 to 3200)
0.007 (0.006 to 0.008)
0.007 (0.006 to 0.007)
0.008 (0.006 to 0.009)
Uruguay 1000 (1200 to 850)
1400 (1600 to 1200)
3300 (4400 to 2500)
0.029 (0.025 to 0.034)
0.021 (0.018 to 0.025)
0.009 (0.007 to 0.011)
Uzbekistan 370 (420 to 320) 980 (1100 to 860) 1000 (1800 to 560) 0.078 (0.069 to 0.09)
0.03 (0.026 to 0.034)
0.029 (0.016 to 0.052)
Vanuatu 85 (150 to 47) 150 (300 to 79) 360 (780 to 160) 0.354 (0.198 to 0.639)
0.195 (0.099 to 0.374)
0.082 (0.037 to 0.177)
Venezuela 270 (300 to 240) 360 (400 to 320) 420 (520 to 320) 0.108 (0.096 to 0.121)
0.082 (0.073 to 0.09)
0.07 (0.056 to 0.09)
101
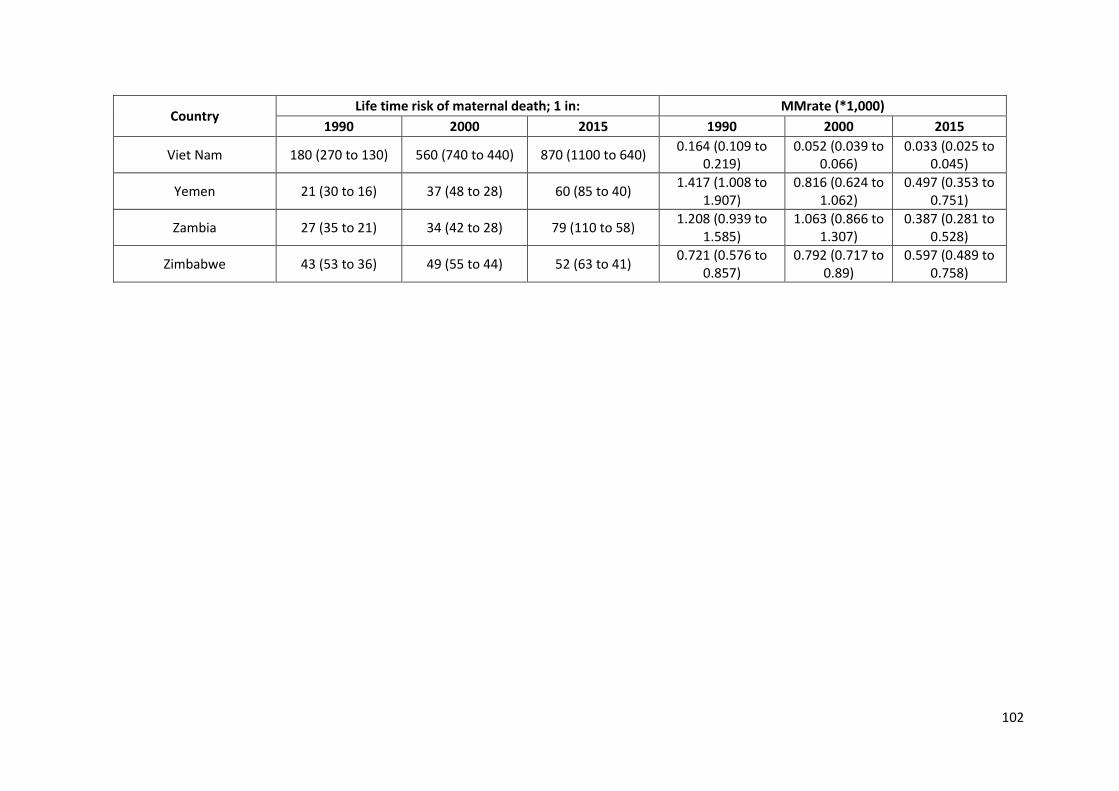
Country Life time risk of maternal death; 1 in: MMrate (*1,000)
1990 2000 2015 1990 2000 2015
Viet Nam 180 (270 to 130) 560 (740 to 440) 870 (1100 to 640) 0.164 (0.109 to 0.219)
0.052 (0.039 to 0.066)
0.033 (0.025 to 0.045)
Yemen 21 (30 to 16) 37 (48 to 28) 60 (85 to 40) 1.417 (1.008 to 1.907)
0.816 (0.624 to 1.062)
0.497 (0.353 to 0.751)
Zambia 27 (35 to 21) 34 (42 to 28) 79 (110 to 58) 1.208 (0.939 to 1.585)
1.063 (0.866 to 1.307)
0.387 (0.281 to 0.528)
Zimbabwe 43 (53 to 36) 49 (55 to 44) 52 (63 to 41) 0.721 (0.576 to 0.857)
0.792 (0.717 to 0.89)
0.597 (0.489 to 0.758)
102
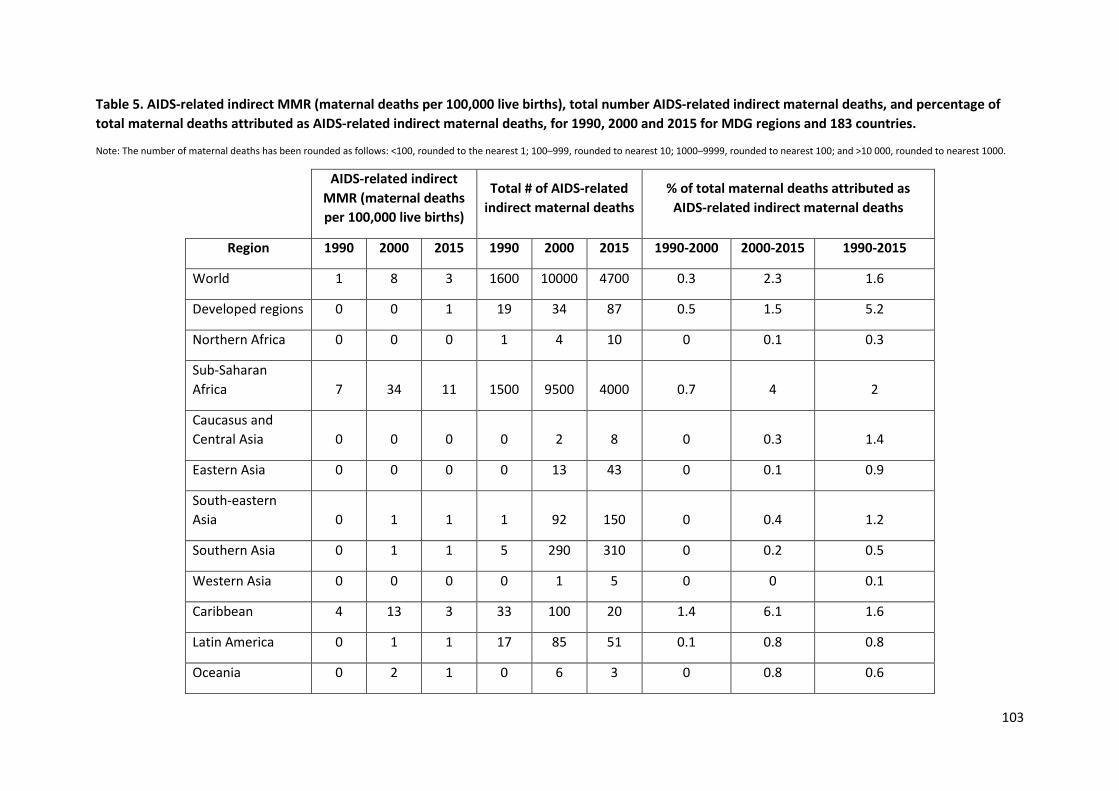
Table 5. AIDS-related indirect MMR (maternal deaths per 100,000 live births), total number AIDS-related indirect maternal deaths, and percentage of total maternal deaths attributed as AIDS-related indirect maternal deaths, for 1990, 2000 and 2015 for MDG regions and 183 countries.
Note: The number of maternal deaths has been rounded as follows: <100, rounded to the nearest 1; 100–999, rounded to nearest 10; 1000–9999, rounded to nearest 100; and >10 000, rounded to nearest 1000.
AIDS-related indirect MMR (maternal deaths per 100,000 live births)
Total # of AIDS-related indirect maternal deaths
% of total maternal deaths attributed as AIDS-related indirect maternal deaths
Region 1990 2000 2015 1990 2000 2015 1990-2000 2000-2015 1990-2015
World 1 8 3 1600 10000 4700 0.3 2.3 1.6
Developed regions 0 0 1 19 34 87 0.5 1.5 5.2
Northern Africa 0 0 0 1 4 10 0 0.1 0.3
Sub-Saharan Africa 7 34 11 1500 9500 4000 0.7 4 2
Caucasus and Central Asia 0 0 0 0 2 8 0 0.3 1.4
Eastern Asia 0 0 0 0 13 43 0 0.1 0.9
South-eastern Asia 0 1 1 1 92 150 0 0.4 1.2
Southern Asia 0 1 1 5 290 310 0 0.2 0.5
Western Asia 0 0 0 0 1 5 0 0 0.1
Caribbean 4 13 3 33 100 20 1.4 6.1 1.6
Latin America 0 1 1 17 85 51 0.1 0.8 0.8
Oceania 0 2 1 0 6 3 0 0.8 0.6
103

AIDS-related indirect MMR (maternal deaths per 100,000 live births)
Total # of AIDS-related indirect maternal deaths
% of total maternal deaths attributed as AIDS-related indirect maternal deaths
Country 1990 2000 2015 1990 2000 2015 1990-2000 2000-2015 1990-2015
Afghanistan 0 0 0 0 1 1 0 0 0
Albania 0 0 0 0 0 0 0 0 0
Algeria 0 0 1 1 2 6 0 0.2 0.4
Angola 2 10 5 10 79 61 0.1 1.1 1.1
Argentina 0 1 1 1 5 4 0.2 1.1 1.1
Armenia 0 0 0 0 0 0 0 0.1 0.9
Australia 0 0 0 0 0 0 0.3 0.1 0
Austria 0 0 0 0 0 0 0.2 0.7 1.3
Azerbaijan 0 0 0 0 0 0 0 0.1 0.7
Bahamas 6 19 4 0 1 0 13.8 31.5 4.6
Bahrain 0 0 0 0 0 0 0.3 0.6 0.3
Bangladesh 0 0 0 0 0 0 0 0 0
Barbados 0 1 0 0 0 0 0.1 2.3 0.9
104

AIDS-related indirect MMR (maternal deaths per 100,000 live births)
Total # of AIDS-related indirect maternal deaths
% of total maternal deaths attributed as AIDS-related indirect maternal deaths
Country 1990 2000 2015 1990 2000 2015 1990-2000 2000-2015 1990-2015
Belarus 0 0 1 0 0 1 0 0.2 30.1
Belgium 0 0 0 0 0 0 0.1 0.5 0.5
Belize 0 1 1 0 0 0 0.1 2.1 2.5
Benin 0 9 4 1 27 16 0.1 1.6 1
Bhutan 0 0 1 0 0 0 0 0 0.7
Bolivia 0 1 0 0 2 1 0 0.3 0.2
Bosnia and Herzegovina
0 0 0 0 0 0 0 0 0
Botswana 5 163 23 3 78 13 2.2 52.5 18
Brazil 0 1 1 7 26 18 0.2 1.1 1.4
Brunei Darussalam
0 0 0 0 0 0 0.2 0.5 0.3
Bulgaria 0 0 0 0 0 0 0 0.3 2.6
Burkina Faso 11 31 4 45 170 26 1.5 5.6 1
Burundi 4 37 2 11 110 11 0.3 3.8 0.3
105
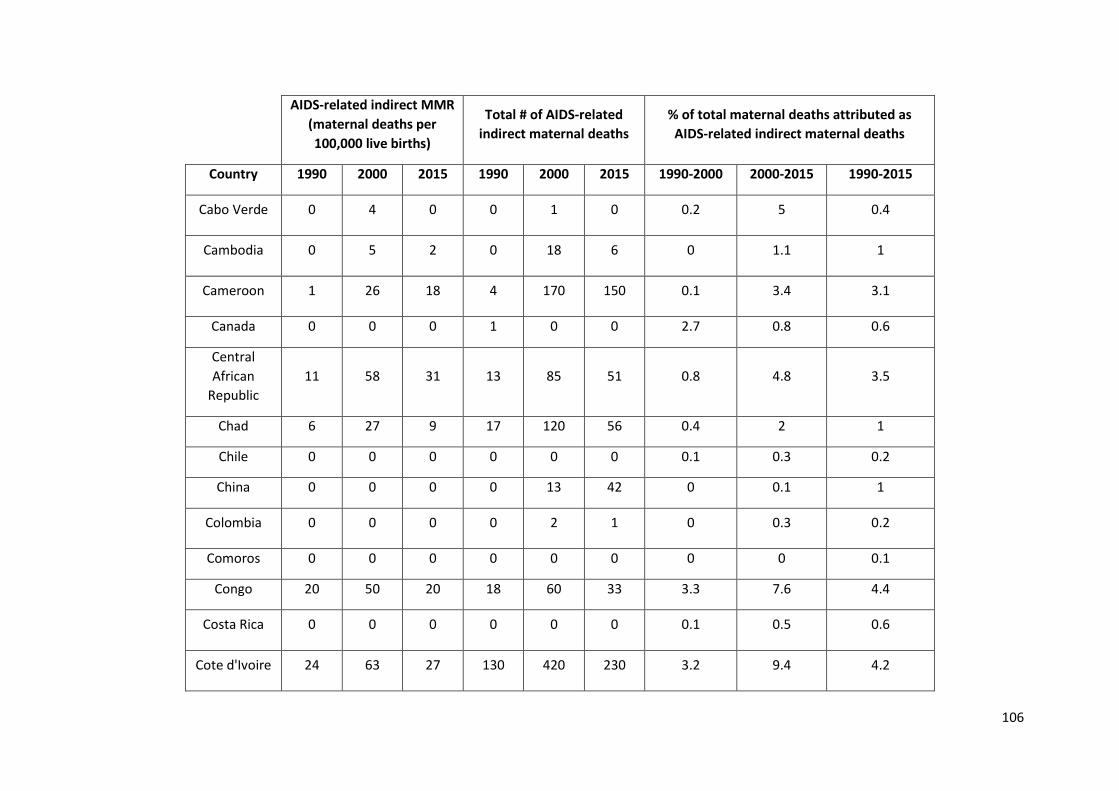
AIDS-related indirect MMR (maternal deaths per 100,000 live births)
Total # of AIDS-related indirect maternal deaths
% of total maternal deaths attributed as AIDS-related indirect maternal deaths
Country 1990 2000 2015 1990 2000 2015 1990-2000 2000-2015 1990-2015
Cabo Verde 0 4 0 0 1 0 0.2 5 0.4
Cambodia 0 5 2 0 18 6 0 1.1 1
Cameroon 1 26 18 4 170 150 0.1 3.4 3.1
Canada 0 0 0 1 0 0 2.7 0.8 0.6
Central African
Republic 11 58 31 13 85 51 0.8 4.8 3.5
Chad 6 27 9 17 120 56 0.4 2 1
Chile 0 0 0 0 0 0 0.1 0.3 0.2
China 0 0 0 0 13 42 0 0.1 1
Colombia 0 0 0 0 2 1 0 0.3 0.2
Comoros 0 0 0 0 0 0 0 0 0.1
Congo 20 50 20 18 60 33 3.3 7.6 4.4
Costa Rica 0 0 0 0 0 0 0.1 0.5 0.6
Cote d'Ivoire 24 63 27 130 420 230 3.2 9.4 4.2
106

AIDS-related indirect MMR (maternal deaths per 100,000 live births)
Total # of AIDS-related indirect maternal deaths
% of total maternal deaths attributed as AIDS-related indirect maternal deaths
Country 1990 2000 2015 1990 2000 2015 1990-2000 2000-2015 1990-2015
Croatia 0 0 0 0 0 0 0 0 0.1
Cuba 0 0 0 0 0 0 0 0.2 0.2
Cyprus 0 0 0 0 0 0 0 0 0
Czech Republic
0 0 0 0 0 0 0 0 0.1
Democratic People's
Republic of Korea
0 0 0 0 0 0 0 0 0.1
Democratic Republic of the Congo
6
11
7
110
250
240
0.7
1.3
1.1
Denmark 0 0 0 0 0 0 0.7 0.3 0.4
Djibouti 0 14 12 0 3 3 0.1 3.5 5.1
Dominican Republic
1 7 1 1 16 2 0.3 9.4 0.9
Ecuador 0 1 0 1 4 1 0.1 1.2 0.6
Egypt 0 0 0 0 0 1 0 0 0.1
107

AIDS-related indirect MMR (maternal deaths per 100,000 live births)
Total # of AIDS-related indirect maternal deaths
% of total maternal deaths attributed as AIDS-related indirect maternal deaths
Country 1990 2000 2015 1990 2000 2015 1990-2000 2000-2015 1990-2015
El Salvador 1 3 2 1 4 2 0.4 3.2 3.1
Equatorial Guinea
2 17 19 0 4 6 0.2 2.5 5.6
Eritrea 4 21 2 5 27 3 0.2 2.8 0.3
Estonia 0 0 0 0 0 0 0 0 2.6
Ethiopia 4 28 5 90 810 160 0.3 3.1 1.4
Fiji 0 0 0 0 0 0 0.1 0.4 0.8
Finland 0 0 0 0 0 0 0.2 0.3 0.1
France 0 0 0 4 1 0 3.3 1 0.4
Gabon 3 29 16 1 12 8 0.7 7.1 5.5
Gambia 0 3 2 0 2 1 0 0.3 0.2
Georgia 0 0 1 0 0 0 0 0.1 1.4
Germany 0 0 0 0 0 0 0.2 0.5 0.1
Ghana 2 15 1 10 98 10 0.3 3.2 0.4
Greece 0 0 0 0 0 0 2.5 3.6 4.6
Grenada 0 0 0 0 0 0 0.4 1.3 0.8
108
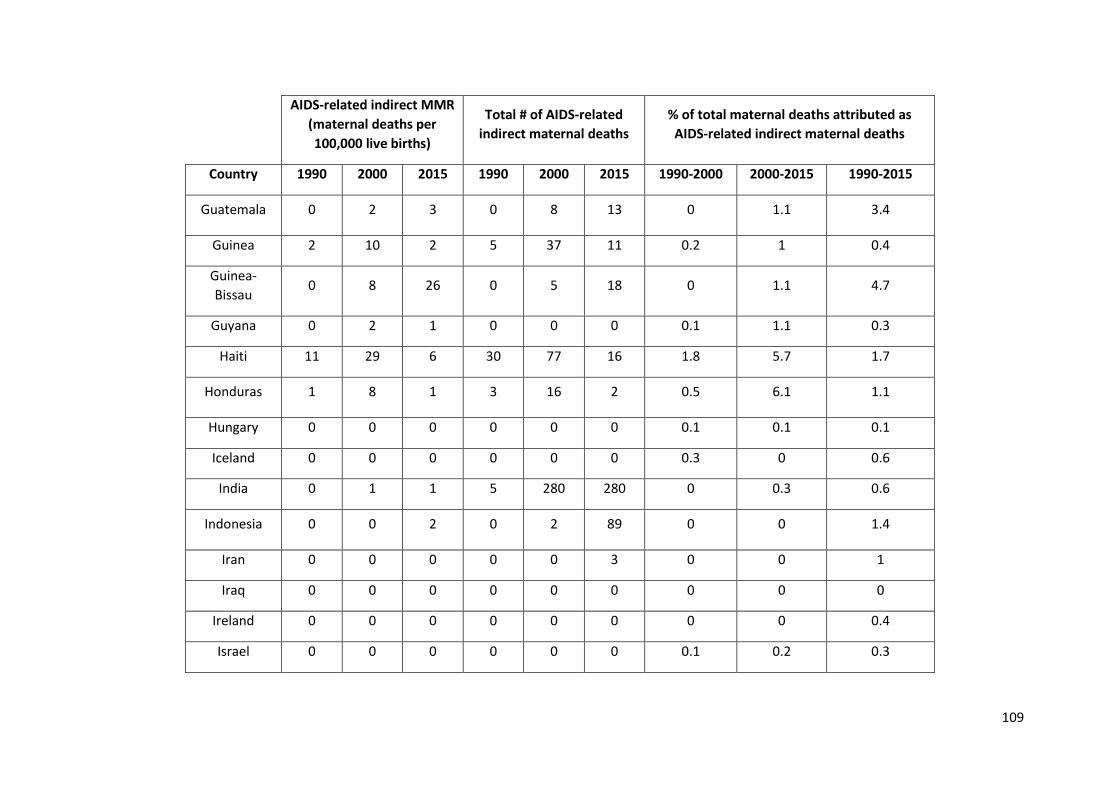
AIDS-related indirect MMR (maternal deaths per 100,000 live births)
Total # of AIDS-related indirect maternal deaths
% of total maternal deaths attributed as AIDS-related indirect maternal deaths
Country 1990 2000 2015 1990 2000 2015 1990-2000 2000-2015 1990-2015
Guatemala 0 2 3 0 8 13 0 1.1 3.4
Guinea 2 10 2 5 37 11 0.2 1 0.4
Guinea-Bissau
0 8 26 0 5 18 0 1.1 4.7
Guyana 0 2 1 0 0 0 0.1 1.1 0.3
Haiti 11 29 6 30 77 16 1.8 5.7 1.7
Honduras 1 8 1 3 16 2 0.5 6.1 1.1
Hungary 0 0 0 0 0 0 0.1 0.1 0.1
Iceland 0 0 0 0 0 0 0.3 0 0.6
India 0 1 1 5 280 280 0 0.3 0.6
Indonesia 0 0 2 0 2 89 0 0 1.4
Iran 0 0 0 0 0 3 0 0 1
Iraq 0 0 0 0 0 0 0 0 0
Ireland 0 0 0 0 0 0 0 0 0.4
Israel 0 0 0 0 0 0 0.1 0.2 0.3
109

AIDS-related indirect MMR (maternal deaths per 100,000 live births)
Total # of AIDS-related indirect maternal deaths
% of total maternal deaths attributed as AIDS-related indirect maternal deaths
Country 1990 2000 2015 1990 2000 2015 1990-2000 2000-2015 1990-2015
Italy 0 0 0 1 1 0 2.7 3.8 2.6
Jamaica 2 12 3 1 7 1 2.3 13.5 3
Japan 0 0 0 0 0 0 0 0 0
Jordan 0 0 0 0 0 0 0 0 0
Kazakhstan 0 0 0 0 0 1 0 0 1.5
Kenya 4 72 12 39 870 190 0.6 9.5 2.3
Kiribati 0 0 0 0 0 0 0 0 0
Kuwait 0 0 0 0 0 0 0.1 0 0.1
Kyrgyzstan 0 0 0 0 0 0 0 0 0.1
Lao 0 0 1 0 0 2 0 0 0.6
Latvia 0 0 0 0 0 0 0 0.1 2.1
Lebanon 0 0 0 0 0 0 0.1 0.4 1.7
Lesotho 0 102 62 0 60 38 0.1 15.8 12.8
Liberia 0 13 3 0 16 5 0 1.1 0.5
Libya 0 0 0 0 0 0 0 0 0
110

AIDS-related indirect MMR (maternal deaths per 100,000 live births)
Total # of AIDS-related indirect maternal deaths
% of total maternal deaths attributed as AIDS-related indirect maternal deaths
Country 1990 2000 2015 1990 2000 2015 1990-2000 2000-2015 1990-2015
Lithuania 0 0 0 0 0 0 0 0.1 1.7
Luxembourg 0 0 0 0 0 0 0 0.3 0.1
Madagascar 0 5 4 1 30 30 0 0.9 1
Malawi 46 137 19 210 680 120 4.8 15.4 2.9
Malaysia 0 0 0 1 2 1 0.2 0.7 0.7
Maldives 0 0 0 0 0 0 0 0 0.1
Mali 1 12 3 4 65 23 0.1 1.5 0.5
Malta 0 0 0 0 0 0 0 0.2 0
Mauritania 0 2 5 0 2 7 0 0.3 0.9
Mauritius 0 0 0 0 0 0 0 0.2 0.6
Mexico 0 0 0 2 5 2 0.1 0.3 0.3
Micronesia 0 0 0 0 0 0 0 0 0
Mongolia 0 0 0 0 0 0 0 0 0.8
Montenegro 0 0 0 0 0 0 0 0 0
111

AIDS-related indirect MMR (maternal deaths per 100,000 live births)
Total # of AIDS-related indirect maternal deaths
% of total maternal deaths attributed as AIDS-related indirect maternal deaths
Country 1990 2000 2015 1990 2000 2015 1990-2000 2000-2015 1990-2015
Morocco 0 0 0 0 1 3 0 0.1 0.3
Mozambique 0 40 52 2 330 570 0 4.4 10.7
Myanmar 0 1 1 0 10 10 0 0.3 0.6
Namibia 2 63 11 1 37 8 0.5 17.9 4.3
Nepal 0 0 1 0 3 3 0 0.1 0.2
Netherlands 0 0 0 0 0 0 0.2 0.4 0.3
New Zealand 0 0 0 0 0 0 0.3 0 0.1
Nicaragua 0 0 0 0 0 0 0 0 0.2
Niger 0 4 3 1 23 32 0 0.5 0.6
Nigeria 2 17 8 89 920 570 0.2 1.5 1
Norway 0 0 0 0 0 0 0.2 0.5 0.2
Occupied Palestinian Territory
0 0 0 0 0 0 0 0 0
112

AIDS-related indirect MMR (maternal deaths per 100,000 live births)
Total # of AIDS-related indirect maternal deaths
% of total maternal deaths attributed as AIDS-related indirect maternal deaths
Country 1990 2000 2015 1990 2000 2015 1990-2000 2000-2015 1990-2015
Oman 0 0 1 0 0 0 0.1 0.3 3.2
Pakistan 0 0 0 0 1 17 0 0 0.2
Panama 0 1 0 0 1 0 0.3 1.8 0.4
Papua New Guinea
0 3 1 0 5 3 0 0.9 0.7
Paraguay 0 0 1 0 0 1 0.1 0.2 0.4
Peru 0 1 0 1 8 1 0.1 0.9 0.3
Philippines 0 0 0 0 0 0 0 0 0
Poland 0 0 0 0 0 0 0.1 0.3 0.7
Portugal 0 1 1 0 1 0 0.4 3.9 4.9
Puerto Rico 0 0 0 0 0 0 0 0 0
Qatar 0 0 0 0 0 0 0 0 0.2
Republic of Korea
0 0 0 0 0 0 0 0 0
Republic of Moldova
0 0 0 0 0 0 0 0.1 0.5
113

AIDS-related indirect MMR (maternal deaths per 100,000 live births)
Total # of AIDS-related indirect maternal deaths
% of total maternal deaths attributed as AIDS-related indirect maternal deaths
Country 1990 2000 2015 1990 2000 2015 1990-2000 2000-2015 1990-2015
Romania 0 0 0 0 0 0 0 0.1 0.3
Russian Federation
0 0 3 1 6 62 0.1 0.9 13.7
Rwanda 19 47 4 62 150 16 1.5 4.6 1.5
Saint Lucia 0 1 0 0 0 0 0.8 1.5 0.9
Samoa 0 0 0 0 0 0 0 0 0
Sao Tome and Principe
1 3 2 0 0 0 0.2 1.5 1
Saudi Arabia 0 0 0 0 0 0 0 0 0
Senegal 0 2 5 2 9 27 0.1 0.4 1.5
Serbia 0 0 0 0 0 0 0.4 0.4 0.3
Sierra Leone 0 3 6 0 6 15 0 0.1 0.5
Singapore 0 0 0 0 0 0 0 0 0
Slovakia 0 0 0 0 0 0 0 0 0
114
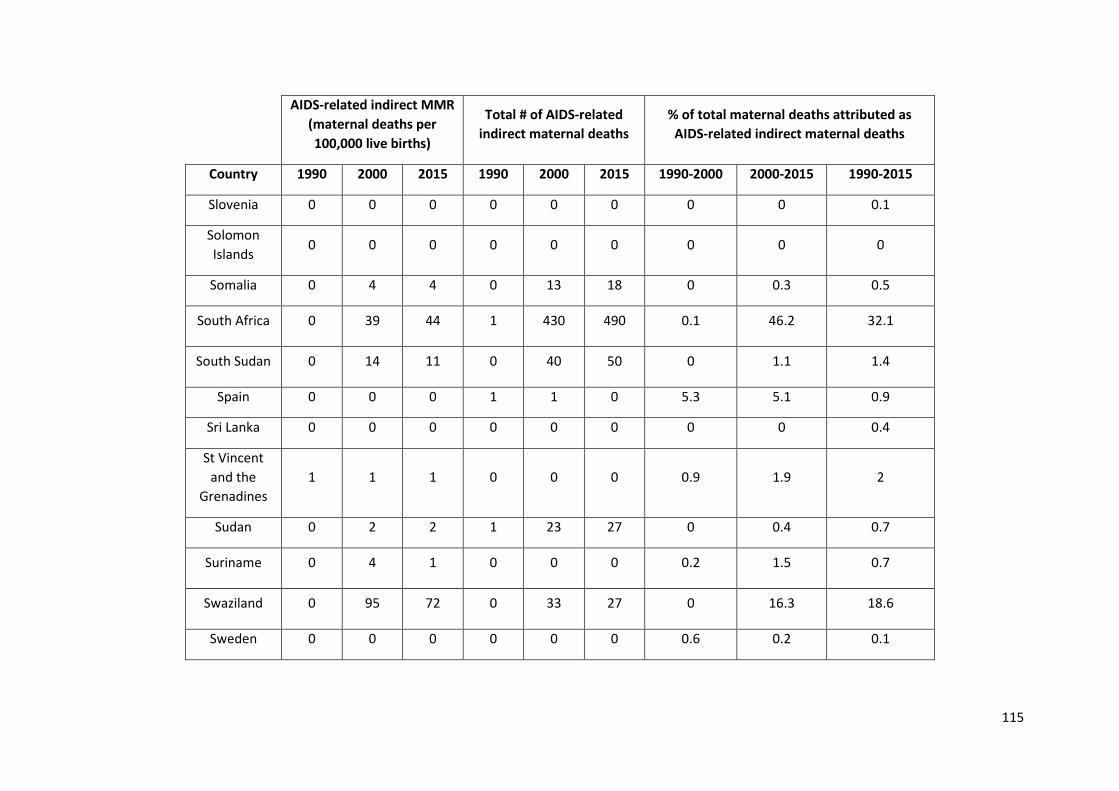
AIDS-related indirect MMR (maternal deaths per 100,000 live births)
Total # of AIDS-related indirect maternal deaths
% of total maternal deaths attributed as AIDS-related indirect maternal deaths
Country 1990 2000 2015 1990 2000 2015 1990-2000 2000-2015 1990-2015
Slovenia 0 0 0 0 0 0 0 0 0.1
Solomon Islands
0 0 0 0 0 0 0 0 0
Somalia 0 4 4 0 13 18 0 0.3 0.5
South Africa 0 39 44 1 430 490 0.1 46.2 32.1
South Sudan 0 14 11 0 40 50 0 1.1 1.4
Spain 0 0 0 1 1 0 5.3 5.1 0.9
Sri Lanka 0 0 0 0 0 0 0 0 0.4
St Vincent and the
Grenadines 1 1 1 0 0 0 0.9 1.9 2
Sudan 0 2 2 1 23 27 0 0.4 0.7
Suriname 0 4 1 0 0 0 0.2 1.5 0.7
Swaziland 0 95 72 0 33 27 0 16.3 18.6
Sweden 0 0 0 0 0 0 0.6 0.2 0.1
115

AIDS-related indirect MMR (maternal deaths per 100,000 live births)
Total # of AIDS-related indirect maternal deaths
% of total maternal deaths attributed as AIDS-related indirect maternal deaths
Country 1990 2000 2015 1990 2000 2015 1990-2000 2000-2015 1990-2015
Switzerland 0 0 0 0 0 0 2.2 3.6 0.5
Syrian Arab Republic
0 0 0 0 0 0 0 0 0
Tajikistan 0 0 1 0 0 2 0 0.1 2.2
Tanzania 12 60 10 140 860 200 1.2 7.1 2.4
TFYR Macedonia
0 0 0 0 0 0 0 0 0
Thailand 0 6 4 1 55 28 0.1 24.3 19.3
Timor-Leste 0 0 0 0 0 0 0 0 0
Togo 2 23 13 3 45 34 0.3 4.7 3.6
Tonga 0 0 0 0 0 0 0 0 0
Trinidad and Tobago
1 4 0 0 1 0 0.7 5.9 0.6
Tunisia 0 0 0 0 0 0 0 0.1 0.1
Turkey 0 0 0 0 0 0 0 0 0
116

AIDS-related indirect MMR (maternal deaths per 100,000 live births)
Total # of AIDS-related indirect maternal deaths
% of total maternal deaths attributed as AIDS-related indirect maternal deaths
Country 1990 2000 2015 1990 2000 2015 1990-2000 2000-2015 1990-2015
Turkmenistan 0 0 0 0 0 0 0 0 0
Uganda 33 86 11 290 990 180 4.8 13.9 3.1
Ukraine 0 1 3 0 6 16 0 4.3 13.5
United Arab Emirates
0 0 0 0 0 0 0 0 0
United Kingdom
0 0 0 1 0 0 0.7 0.2 0.5
United States of America
0 0 0 9 16 5 2 3.4 1
Uruguay 0 0 0 0 0 0 0.1 1.1 2.4
Uzbekistan 0 0 1 0 2 5 0 1 2.1
Vanuatu 0 0 0 0 0 0 0 0 0
Venezuela 0 0 0 1 2 2 0.1 0.3 0.4
Viet Nam 0 0 1 0 6 15 0 0.5 1.8
Yemen 0 0 0 0 1 4 0 0 0.1
117
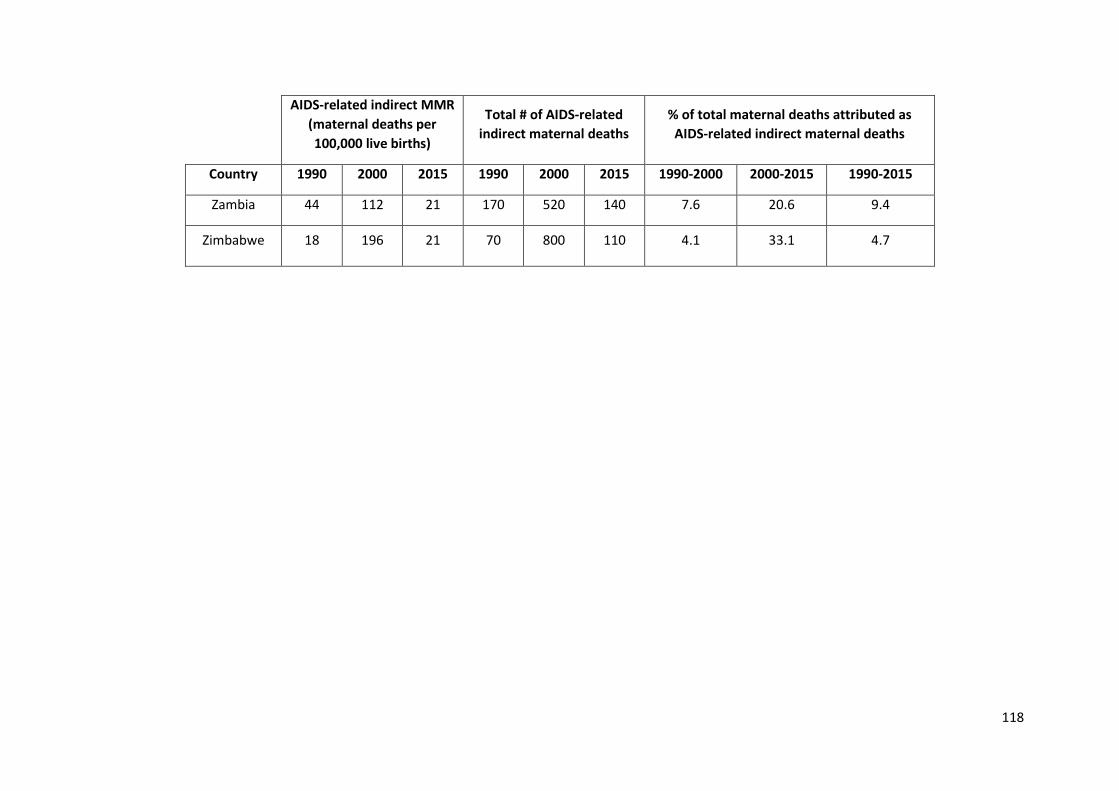
AIDS-related indirect MMR (maternal deaths per 100,000 live births)
Total # of AIDS-related indirect maternal deaths
% of total maternal deaths attributed as AIDS-related indirect maternal deaths
Country 1990 2000 2015 1990 2000 2015 1990-2000 2000-2015 1990-2015
Zambia 44 112 21 170 520 140 7.6 20.6 9.4
Zimbabwe 18 196 21 70 800 110 4.1 33.1 4.7
118
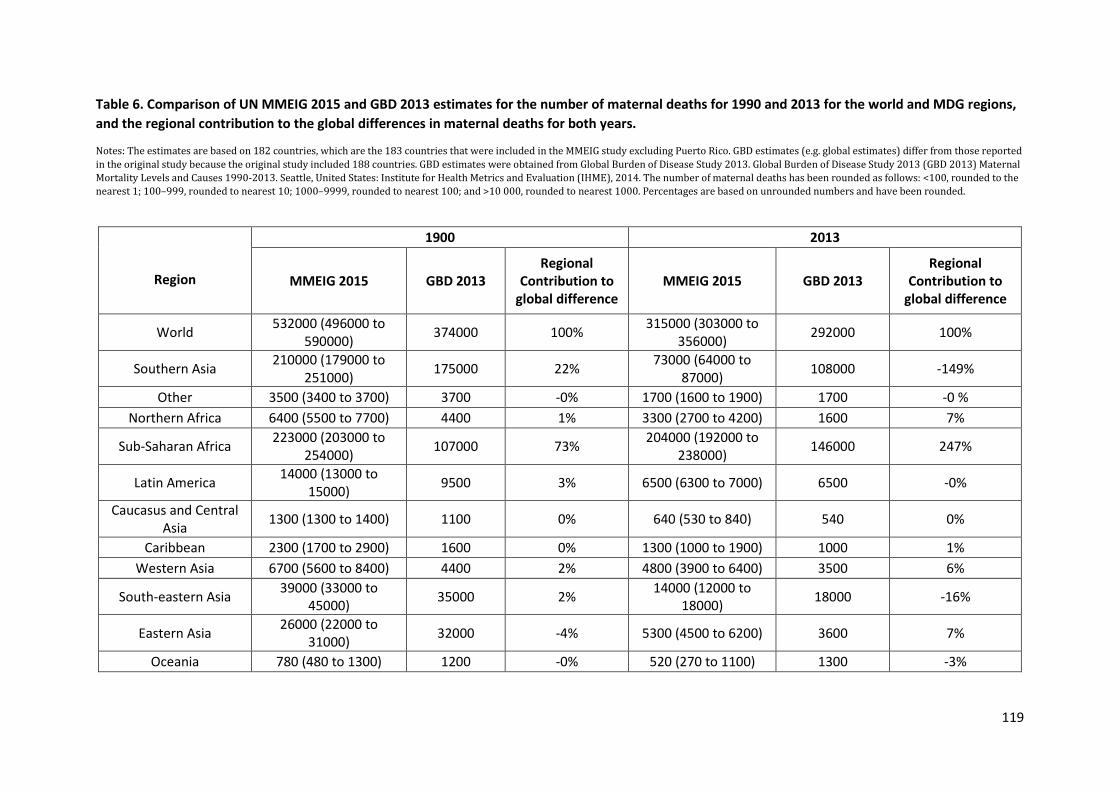
Table 6. Comparison of UN MMEIG 2015 and GBD 2013 estimates for the number of maternal deaths for 1990 and 2013 for the world and MDG regions, and the regional contribution to the global differences in maternal deaths for both years.
Notes: The estimates are based on 182 countries, which are the 183 countries that were included in the MMEIG study excluding Puerto Rico. GBD estimates (e.g. global estimates) differ from those reported in the original study because the original study included 188 countries. GBD estimates were obtained from Global Burden of Disease Study 2013. Global Burden of Disease Study 2013 (GBD 2013) Maternal Mortality Levels and Causes 1990-2013. Seattle, United States: Institute for Health Metrics and Evaluation (IHME), 2014. The number of maternal deaths has been rounded as follows: <100, rounded to the nearest 1; 100–999, rounded to nearest 10; 1000–9999, rounded to nearest 100; and >10 000, rounded to nearest 1000. Percentages are based on unrounded numbers and have been rounded.
Region
1900 2013
MMEIG 2015 GBD 2013 Regional
Contribution to global difference
MMEIG 2015 GBD 2013 Regional
Contribution to global difference
World 532000 (496000 to 590000) 374000 100% 315000 (303000 to
356000) 292000 100%
Southern Asia 210000 (179000 to 251000) 175000 22% 73000 (64000 to
87000) 108000 -149%
Other 3500 (3400 to 3700) 3700 -0% 1700 (1600 to 1900) 1700 -0 % Northern Africa 6400 (5500 to 7700) 4400 1% 3300 (2700 to 4200) 1600 7%
Sub-Saharan Africa 223000 (203000 to 254000) 107000 73% 204000 (192000 to
238000) 146000 247%
Latin America 14000 (13000 to 15000) 9500 3% 6500 (6300 to 7000) 6500 -0%
Caucasus and Central Asia 1300 (1300 to 1400) 1100 0% 640 (530 to 840) 540 0%
Caribbean 2300 (1700 to 2900) 1600 0% 1300 (1000 to 1900) 1000 1% Western Asia 6700 (5600 to 8400) 4400 2% 4800 (3900 to 6400) 3500 6%
South-eastern Asia 39000 (33000 to 45000) 35000 2% 14000 (12000 to
18000) 18000 -16%
Eastern Asia 26000 (22000 to 31000) 32000 -4% 5300 (4500 to 6200) 3600 7%
Oceania 780 (480 to 1300) 1200 -0% 520 (270 to 1100) 1300 -3%
119
5. References 1. International Comparison Program database. The World Bank; 2014. (http://data.worldbank.org/indicator/NY.GDP.PCAP.PP.KD). Accessed 10 Nov 2014.
2. World population prospects: The 2015 Revision. New York: United Nations Population Division; 2015.
3. UNICEF global databases 2015, based on MICS, DHSDHS and other nationally representative sources. (http://data.unicef.org/).
4. Making pregnancy safer : the critical role of the skilled attendant: a joint statement by WHO, ICM and FIGO. Geneva; World Health Organization; 2014.
6. Supplementary figures Figure 1. Comparison of UN MMEIG 2015 and 2014 estimates for the MMR (left) and a decomposition of differences into differences that are due to changes in inputs and differences due to changes in modelling approach (right) for 1990 (top row) and 2013 (bottom row). Countries for which the absolute relative difference in MMR is greater than 20% and corresponds to an absolute difference of at least 10 deaths per 100,000 live births are highlighted in the left column and differences are decomposed for this set of selected countries in the right column.
Figure 2. UN MMEIG country estimates. Top row: Data series and estimates of the PM (proportion of all-cause deaths that are maternal) and the MMR (number of maternal deaths per 100,000 live births) for all countries. MMEIG 2015 estimates are illustrated by the solid red lines and 80% uncertainty intervals are shown by the red shaded areas. Reported (unadjusted) and adjusted observations are displayed. The vertical line with each adjusted observation indicates the approximate 80% confidence interval for the PM or MMR associated with that observation, based on point estimates for reporting adjustments and total error variance. Bottom row: Covariates GDP, GFR and SAB, the ratio of all-cause mortality (the envelope) to the number of births (black) and ratio of non-AIDS mortality to the number of births (red), the non-AIDS MMR and the AIDS MMR.
Figure 3. Comparison of UN MMEIG and GBD 2013 MMR estimates (country plots). MMEIG 2015 estimates are illustrated by the solid red lines and 80% uncertainty intervals are shown by the red shaded areas. GBD 2013 estimates are added in green. Data displayed are from the UN MMEIG database. Reported (unadjusted) and adjusted observations are displayed. The vertical line with each adjusted observation indicates the approximate 80% confidence interval for the MMR associated with that observation, based on point estimates for reporting adjustments and total error variance.
120

5 10 20 50 100 200 500 1000 2000
510
2050
100
200
500
1000
2000
MMR in 1990
UN MMEIG 2014 (log−scale)
UN
MM
EIG
201
5 (lo
g−sc
ale)
●
●
●
● ●
●
●
●
●
●
●
●
●
●
●
●
●
●
●
●
●
●
●
●
●
●
●
●
●●
●
●
●
●
●
●
●
●
●
●
●
●
●
●
●
●
●
●
●
●
●
●
●
●
●
●
●
●
●
●
●
● ●
●
●
●
●
●
●
●
●
●
●
●
●
●
●
●●
●
●
●
●
●
●
●
●
●
●
●
●
●
●
●
●
●
●
●
●
●
●●
●
●
●
●
●
●
●
●
●
●
●●●
●
●
●
●
●
●
●
●
●
●
●
●
●
●
●
●
●
●
●
●
●
●
●
●
●
●
●●
●
●
●
●
●●
●
●
●
●
●
●
●
●
●
●
●
●
●
●
●
●
●
●
●
●
●
●
●
●
●
●
●
●
●
●
●
●
●
●
ALB
DZA
AGO
BRBBLZ
BOL
BWA
DJI
DOM
SLV
FJI
GMB
GEO
GTMGUY
IRN
JAM
JOR
KEN
LAO
MYS
MDV
MRT
MNG
MMR
OMN
PHL
QAT
ROU
LCA
STP
ZAF
LKA
SURTJK
TUN
TUR
UZB
VUT
−200 0 200 400
−20
00
200
400
MMR in 1990
Difference due to model change
Diff
eren
ce d
ue to
inpu
ts
●
●
●
●
●●
●
●●●
●● ●
●
● ●
●
●
● ●●
●
●●
●
AGO
BRBBOLBWA
DJI
DOM
GMB
GTM
KEN
LAO
MDV
MRT
MNG
MMR
2 5 10 20 50 100 200 500 1000
25
1020
5010
020
050
010
00
MMR in 2013
UN MMEIG 2014 (log−scale)
UN
MM
EIG
201
5 (lo
g−sc
ale)
●
●
●
●
●
●
●
●
●
●
●
●
●
●
●
●
●
●
●
●
●
●
● ●
●
●
●
●
●
●
●
●
●
●
●
●
●
●
●
●
●
●
●
●
●
●
●
●
●
●
●
●
●
●
●
●
●
●
●
●
●
●
●
●
●
●
●●
●
●
●●●
●
●●
●
●
●
●
●
●
●
●
●
●
●
●
●
●
●
●
●
●
●
●
●
●
●
●
●
●
●
●
●
●
●
●
●
●
●
●
●
●
●
●
●
●
●
●
●
●
●
●
●
●
●
●
●
●
●
●
●
●
●
●
●
●
●
●●
●
●
●
●
●
●
●
●
●
●
●
●
●
●
●
●
●
●
●
●
●
●●
● ●
●
●
●
●
●
●
●
●
●
●
●
●●
●
●
●
●
DZA
ARG
BHS
BRBBLZ
BTNBWA
BRA
COL
CRI
CUB
ECUSLV
ERI
FJI
GAB
GMB
GTM
IDN
IRQ
KAZ
KEN
KIR
MYS
MDV
MRT
MUSMNG
NAMNPL
NIC
NGA
PRY
PER
KOR
LCA
STP
SLE
SUR
SWZ
TJK
TTOTUN
TKM
USA
YEM ZWE
−200 −100 0 100 200 300 400
−20
0−
100
010
020
030
040
0MMR in 2013
Difference due to model change
Diff
eren
ce d
ue to
inpu
ts
●
●
●
●
●
●
●●
●
●
●
●
●●
●
●
●●
●●●
●
●●
●●
●
●
●●
●
●
●
BWA
ERI
GAB
GMB
KEN
MRT
NAMNPL
NGA
SLE
SUR
SWZYEM
ZWE

1985 1990 1995 2000 2005 2010 2015
Afghanistan [AFG] (Southern Asia)
Year
0
0.1
0.2
0.3
0.4
0.5
0.6
0.7
PM
1985 1990 1995 2000 2005 2010 2015
Afghanistan [AFG] (Southern Asia)
Year
0
500
1000
1500
2000
2500
MM
R
− Estimates −Mlate− MMR Database 2015 −Observed DataAdjusted Data− Data type −DHSExcluded misc. studies
1985 1990 1995 2000 2005 2010 2015
050
010
0015
0020
00
Gross Domestic Product
Time
GD
P
1985 1990 1995 2000 2005 2010 2015
0.00
0.05
0.10
0.15
0.20
0.25
General Fertility Rate
Time
GF
R
1985 1990 1995 2000 2005 2010 2015
0.0
0.2
0.4
0.6
0.8
1.0
Skilled Attendance to Birth
Time
SA
B
1985 1990 1995 2000 2005 2010 2015
0.00
00.
005
0.01
00.
015
0.02
00.
025
0.03
00.
035
Envelope/Births
Time
Env
elop
e/B
irth
s
non−aids
1985 1990 1995 2000 2005 2010 2015
Non−aids MMR
Year
0
500
1000
1500
2000
2500
NO
NA
IDS
MM
R
1985 1990 1995 2000 2005 2010 2015
Aids MMR
Year
0
0.05
0.1
AID
SM
MR

1985 1990 1995 2000 2005 2010 2015
Albania [ALB] (Transition countries of South−Eastern Europe)
Year
0
0.05
0.1
PM
● ●
●
●
1985 1990 1995 2000 2005 2010 2015
Albania [ALB] (Transition countries of South−Eastern Europe)
Year
0
50
100
150
MM
R
●●
●
●
●
− Estimates −
Mlate
− MMR Database 2015 −
Observed Data
Adjusted Data
− Data type −
VRExcluded VR data (data quality issues)
1985 1990 1995 2000 2005 2010 2015
020
0040
0060
0080
0010
000
1200
0
Gross Domestic Product
Time
GD
P
1985 1990 1995 2000 2005 2010 2015
0.00
0.02
0.04
0.06
0.08
0.10
0.12
General Fertility Rate
Time
GF
R
1985 1990 1995 2000 2005 2010 2015
0.0
0.2
0.4
0.6
0.8
1.0
Skilled Attendance to Birth
Time
SA
B
1985 1990 1995 2000 2005 2010 2015
0.00
00.
005
0.01
00.
015
0.02
00.
025
Envelope/Births
Time
Env
elop
e/B
irth
s
non−aids
1985 1990 1995 2000 2005 2010 2015
Non−aids MMR
Year
0
50
100
NO
NA
IDS
MM
R
1985 1990 1995 2000 2005 2010 2015
Aids MMR
Year
00.010.02
AID
SM
MR

1985 1990 1995 2000 2005 2010 2015
Algeria [DZA] (Northern Africa)
Year
0
0.05
0.1
0.15
0.2
0.25
0.3
0.35
PM
1985 1990 1995 2000 2005 2010 2015
Algeria [DZA] (Northern Africa)
Year
0
100
200
300
400
500
MM
R
− Estimates −Mlate− MMR Database 2015 −Observed DataAdjusted Data− Data type −Misc. studies
1985 1990 1995 2000 2005 2010 2015
020
0040
0060
0080
0010
000
1200
014
000
Gross Domestic Product
Time
GD
P
1985 1990 1995 2000 2005 2010 2015
0.00
0.05
0.10
0.15
General Fertility Rate
Time
GF
R
1985 1990 1995 2000 2005 2010 2015
0.0
0.2
0.4
0.6
0.8
1.0
Skilled Attendance to Birth
Time
SA
B
1985 1990 1995 2000 2005 2010 2015
0.00
00.
005
0.01
00.
015
0.02
00.
025
Envelope/Births
Time
Env
elop
e/B
irth
s
non−aids
1985 1990 1995 2000 2005 2010 2015
Non−aids MMR
Year
0
100
200
300
400
500
NO
NA
IDS
MM
R
1985 1990 1995 2000 2005 2010 2015
Aids MMR
Year
0
0.1
0.2
0.3
0.4
0.5
0.6
AID
SM
MR
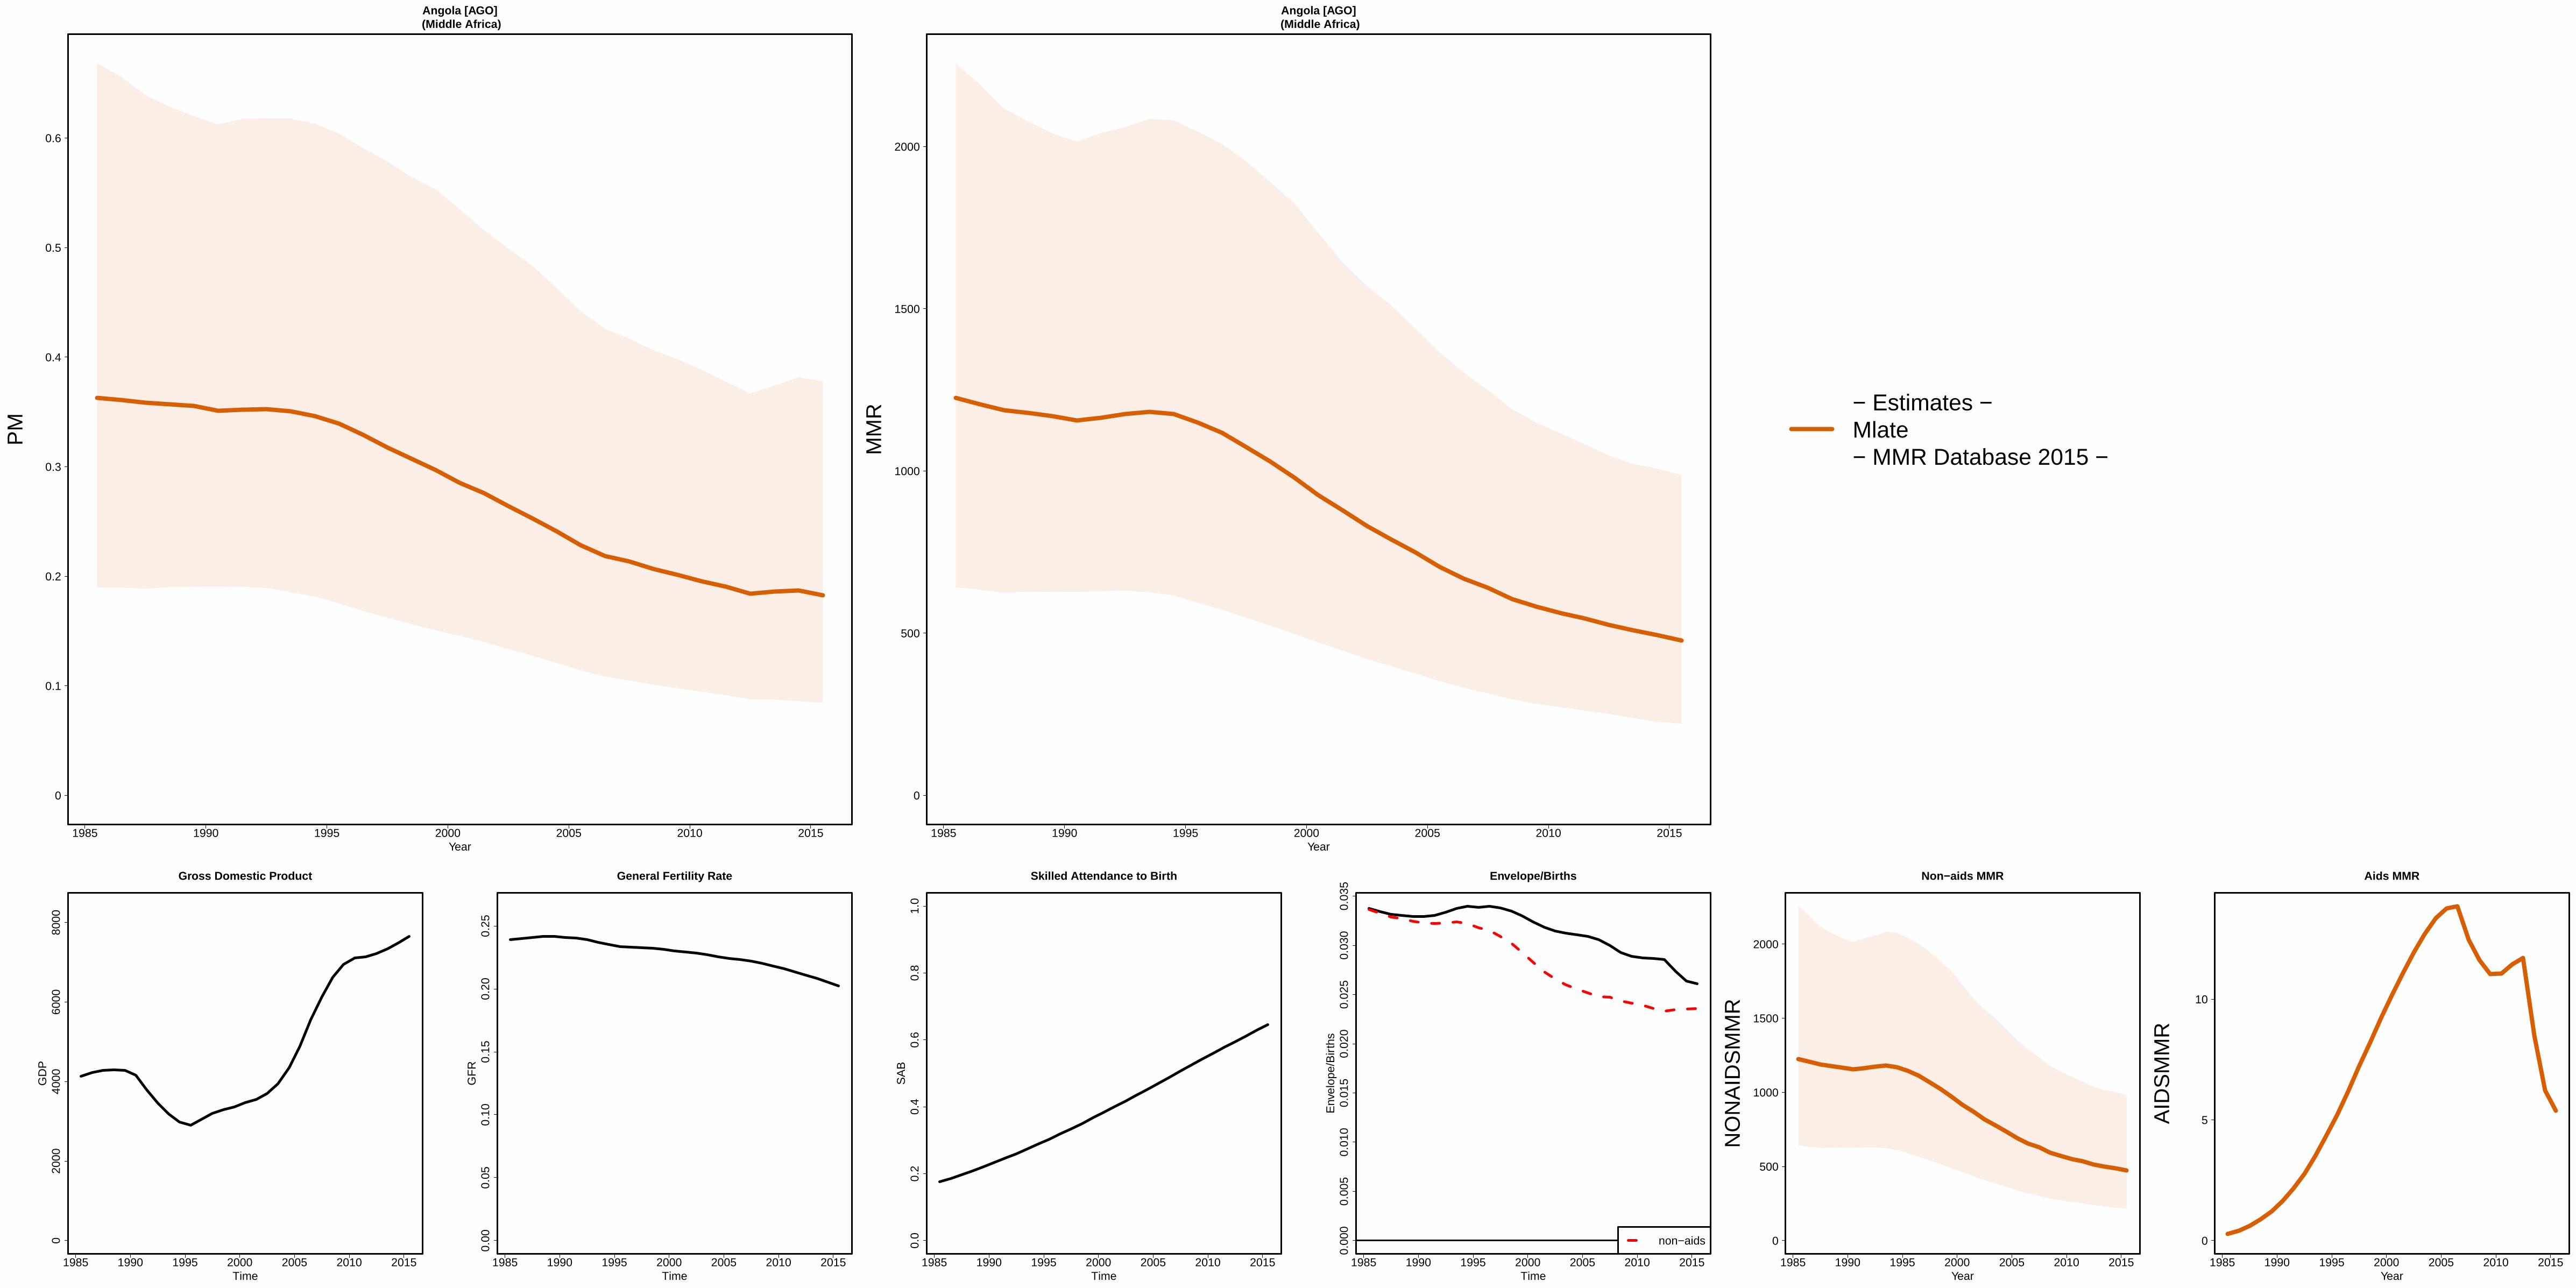
1985 1990 1995 2000 2005 2010 2015
Angola [AGO] (Middle Africa)
Year
0
0.1
0.2
0.3
0.4
0.5
0.6
PM
1985 1990 1995 2000 2005 2010 2015
Angola [AGO] (Middle Africa)
Year
0
500
1000
1500
2000
MM
R − Estimates −Mlate− MMR Database 2015 −
1985 1990 1995 2000 2005 2010 2015
020
0040
0060
0080
00
Gross Domestic Product
Time
GD
P
1985 1990 1995 2000 2005 2010 2015
0.00
0.05
0.10
0.15
0.20
0.25
General Fertility Rate
Time
GF
R
1985 1990 1995 2000 2005 2010 2015
0.0
0.2
0.4
0.6
0.8
1.0
Skilled Attendance to Birth
Time
SA
B
1985 1990 1995 2000 2005 2010 2015
0.00
00.
005
0.01
00.
015
0.02
00.
025
0.03
00.
035
Envelope/Births
Time
Env
elop
e/B
irth
s
non−aids
1985 1990 1995 2000 2005 2010 2015
Non−aids MMR
Year
0
500
1000
1500
2000
NO
NA
IDS
MM
R
1985 1990 1995 2000 2005 2010 2015
Aids MMR
Year
0
5
10
AID
SM
MR

1985 1990 1995 2000 2005 2010 2015
Argentina [ARG] (South America)
Year
0
0.02
0.04
0.06
0.08
PM
1985 1990 1995 2000 2005 2010 2015
Argentina [ARG] (South America)
Year
0
50
100
MM
R
− Estimates −Mlate− MMR Database 2015 −Observed DataAdjusted Data− Data type −VR
1985 1990 1995 2000 2005 2010 2015
050
0010
000
1500
020
000
Gross Domestic Product
Time
GD
P
1985 1990 1995 2000 2005 2010 2015
0.00
0.02
0.04
0.06
0.08
0.10
General Fertility Rate
Time
GF
R
1985 1990 1995 2000 2005 2010 2015
0.0
0.2
0.4
0.6
0.8
1.0
Skilled Attendance to Birth
Time
SA
B
1985 1990 1995 2000 2005 2010 2015
0.00
00.
005
0.01
00.
015
Envelope/Births
Time
Env
elop
e/B
irth
s
non−aids
1985 1990 1995 2000 2005 2010 2015
Non−aids MMR
Year
0
10
20
30
40
50
60
70
80
90
NO
NA
IDS
MM
R
1985 1990 1995 2000 2005 2010 2015
Aids MMR
Year
0
0.1
0.2
0.3
0.4
0.5
0.6
0.7
0.8
AID
SM
MR

1985 1990 1995 2000 2005 2010 2015
Armenia [ARM] (Western Asia)
Year
0
0.02
0.04
0.06
0.08
PM
1985 1990 1995 2000 2005 2010 2015
Armenia [ARM] (Western Asia)
Year
0
50
100
MM
R
− Estimates −Mlate− MMR Database 2015 −Observed DataAdjusted Data− Data type −VR
1985 1990 1995 2000 2005 2010 2015
020
0040
0060
0080
00
Gross Domestic Product
Time
GD
P
1985 1990 1995 2000 2005 2010 2015
0.00
0.02
0.04
0.06
0.08
0.10
General Fertility Rate
Time
GF
R
1985 1990 1995 2000 2005 2010 2015
0.0
0.2
0.4
0.6
0.8
1.0
Skilled Attendance to Birth
Time
SA
B
1985 1990 1995 2000 2005 2010 2015
0.00
00.
005
0.01
00.
015
0.02
00.
025
Envelope/Births
Time
Env
elop
e/B
irth
s
non−aids
1985 1990 1995 2000 2005 2010 2015
Non−aids MMR
Year
0
10
20
30
40
50
60
NO
NA
IDS
MM
R
1985 1990 1995 2000 2005 2010 2015
Aids MMR
Year
0
0.05
0.1
0.15
0.2
AID
SM
MR
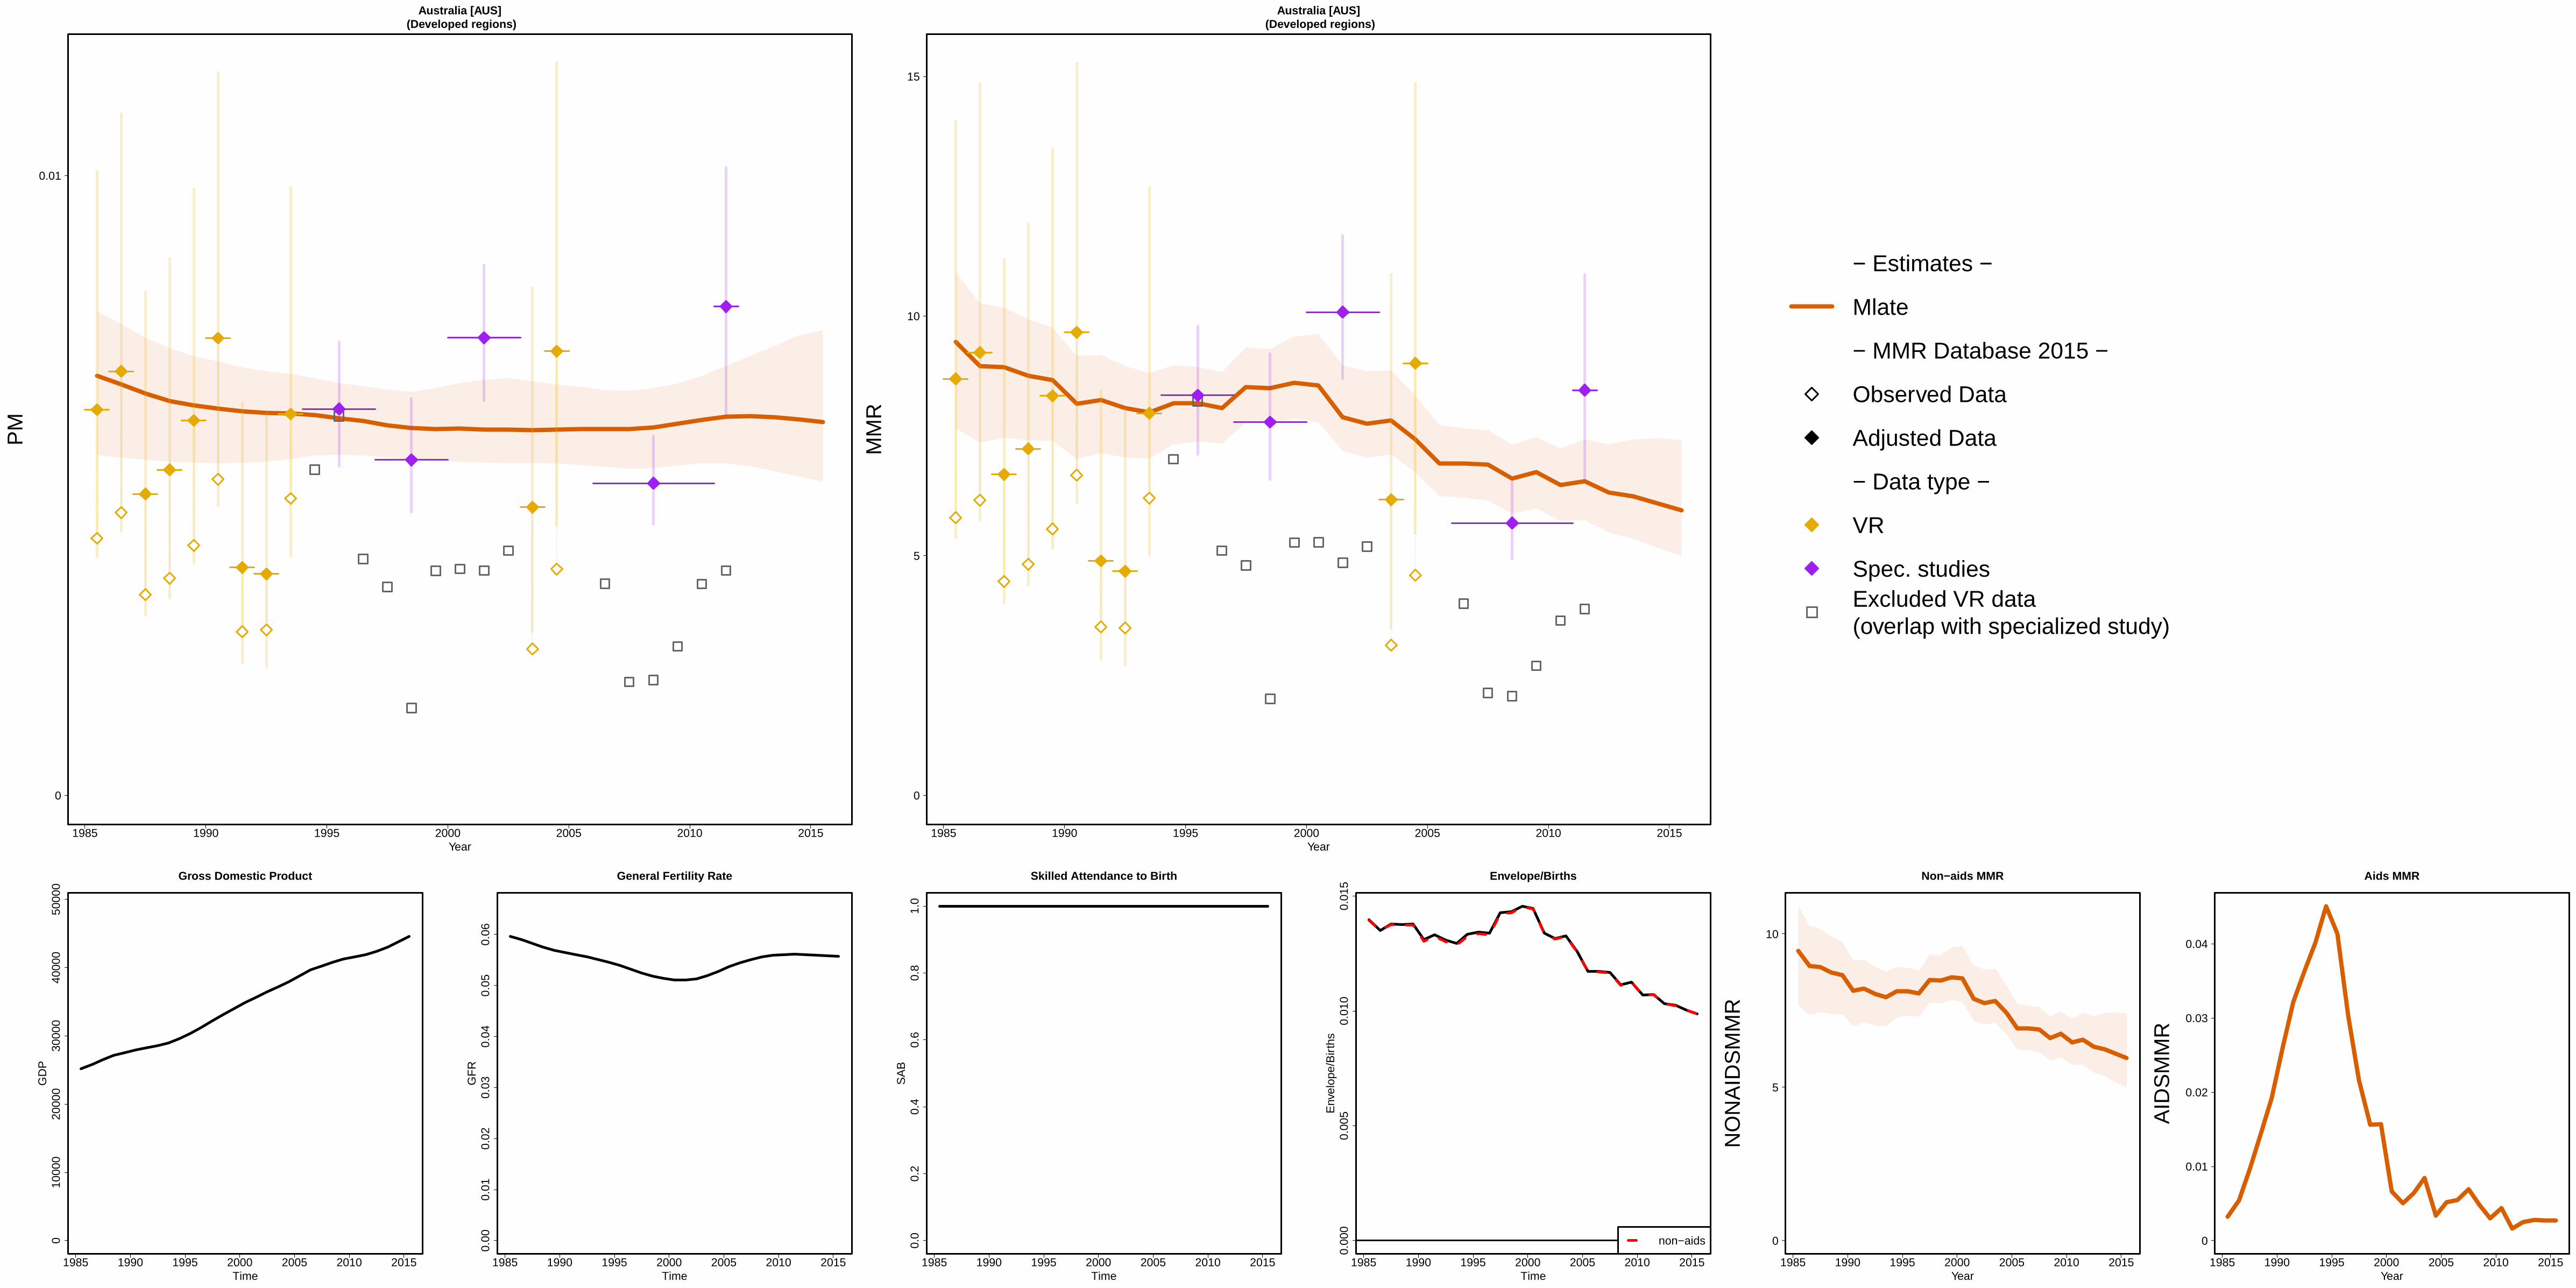
1985 1990 1995 2000 2005 2010 2015
Australia [AUS] (Developed regions)
Year
0
0.01
PM
1985 1990 1995 2000 2005 2010 2015
Australia [AUS] (Developed regions)
Year
0
5
10
15
MM
R
− Estimates −
Mlate
− MMR Database 2015 −
Observed Data
Adjusted Data
− Data type −
VR
Spec. studiesExcluded VR data (overlap with specialized study)
1985 1990 1995 2000 2005 2010 2015
010
000
2000
030
000
4000
050
000
Gross Domestic Product
Time
GD
P
1985 1990 1995 2000 2005 2010 2015
0.00
0.01
0.02
0.03
0.04
0.05
0.06
General Fertility Rate
Time
GF
R
1985 1990 1995 2000 2005 2010 2015
0.0
0.2
0.4
0.6
0.8
1.0
Skilled Attendance to Birth
Time
SA
B
1985 1990 1995 2000 2005 2010 2015
0.00
00.
005
0.01
00.
015
Envelope/Births
Time
Env
elop
e/B
irth
s
non−aids
1985 1990 1995 2000 2005 2010 2015
Non−aids MMR
Year
0
5
10
NO
NA
IDS
MM
R
1985 1990 1995 2000 2005 2010 2015
Aids MMR
Year
0
0.01
0.02
0.03
0.04
AID
SM
MR
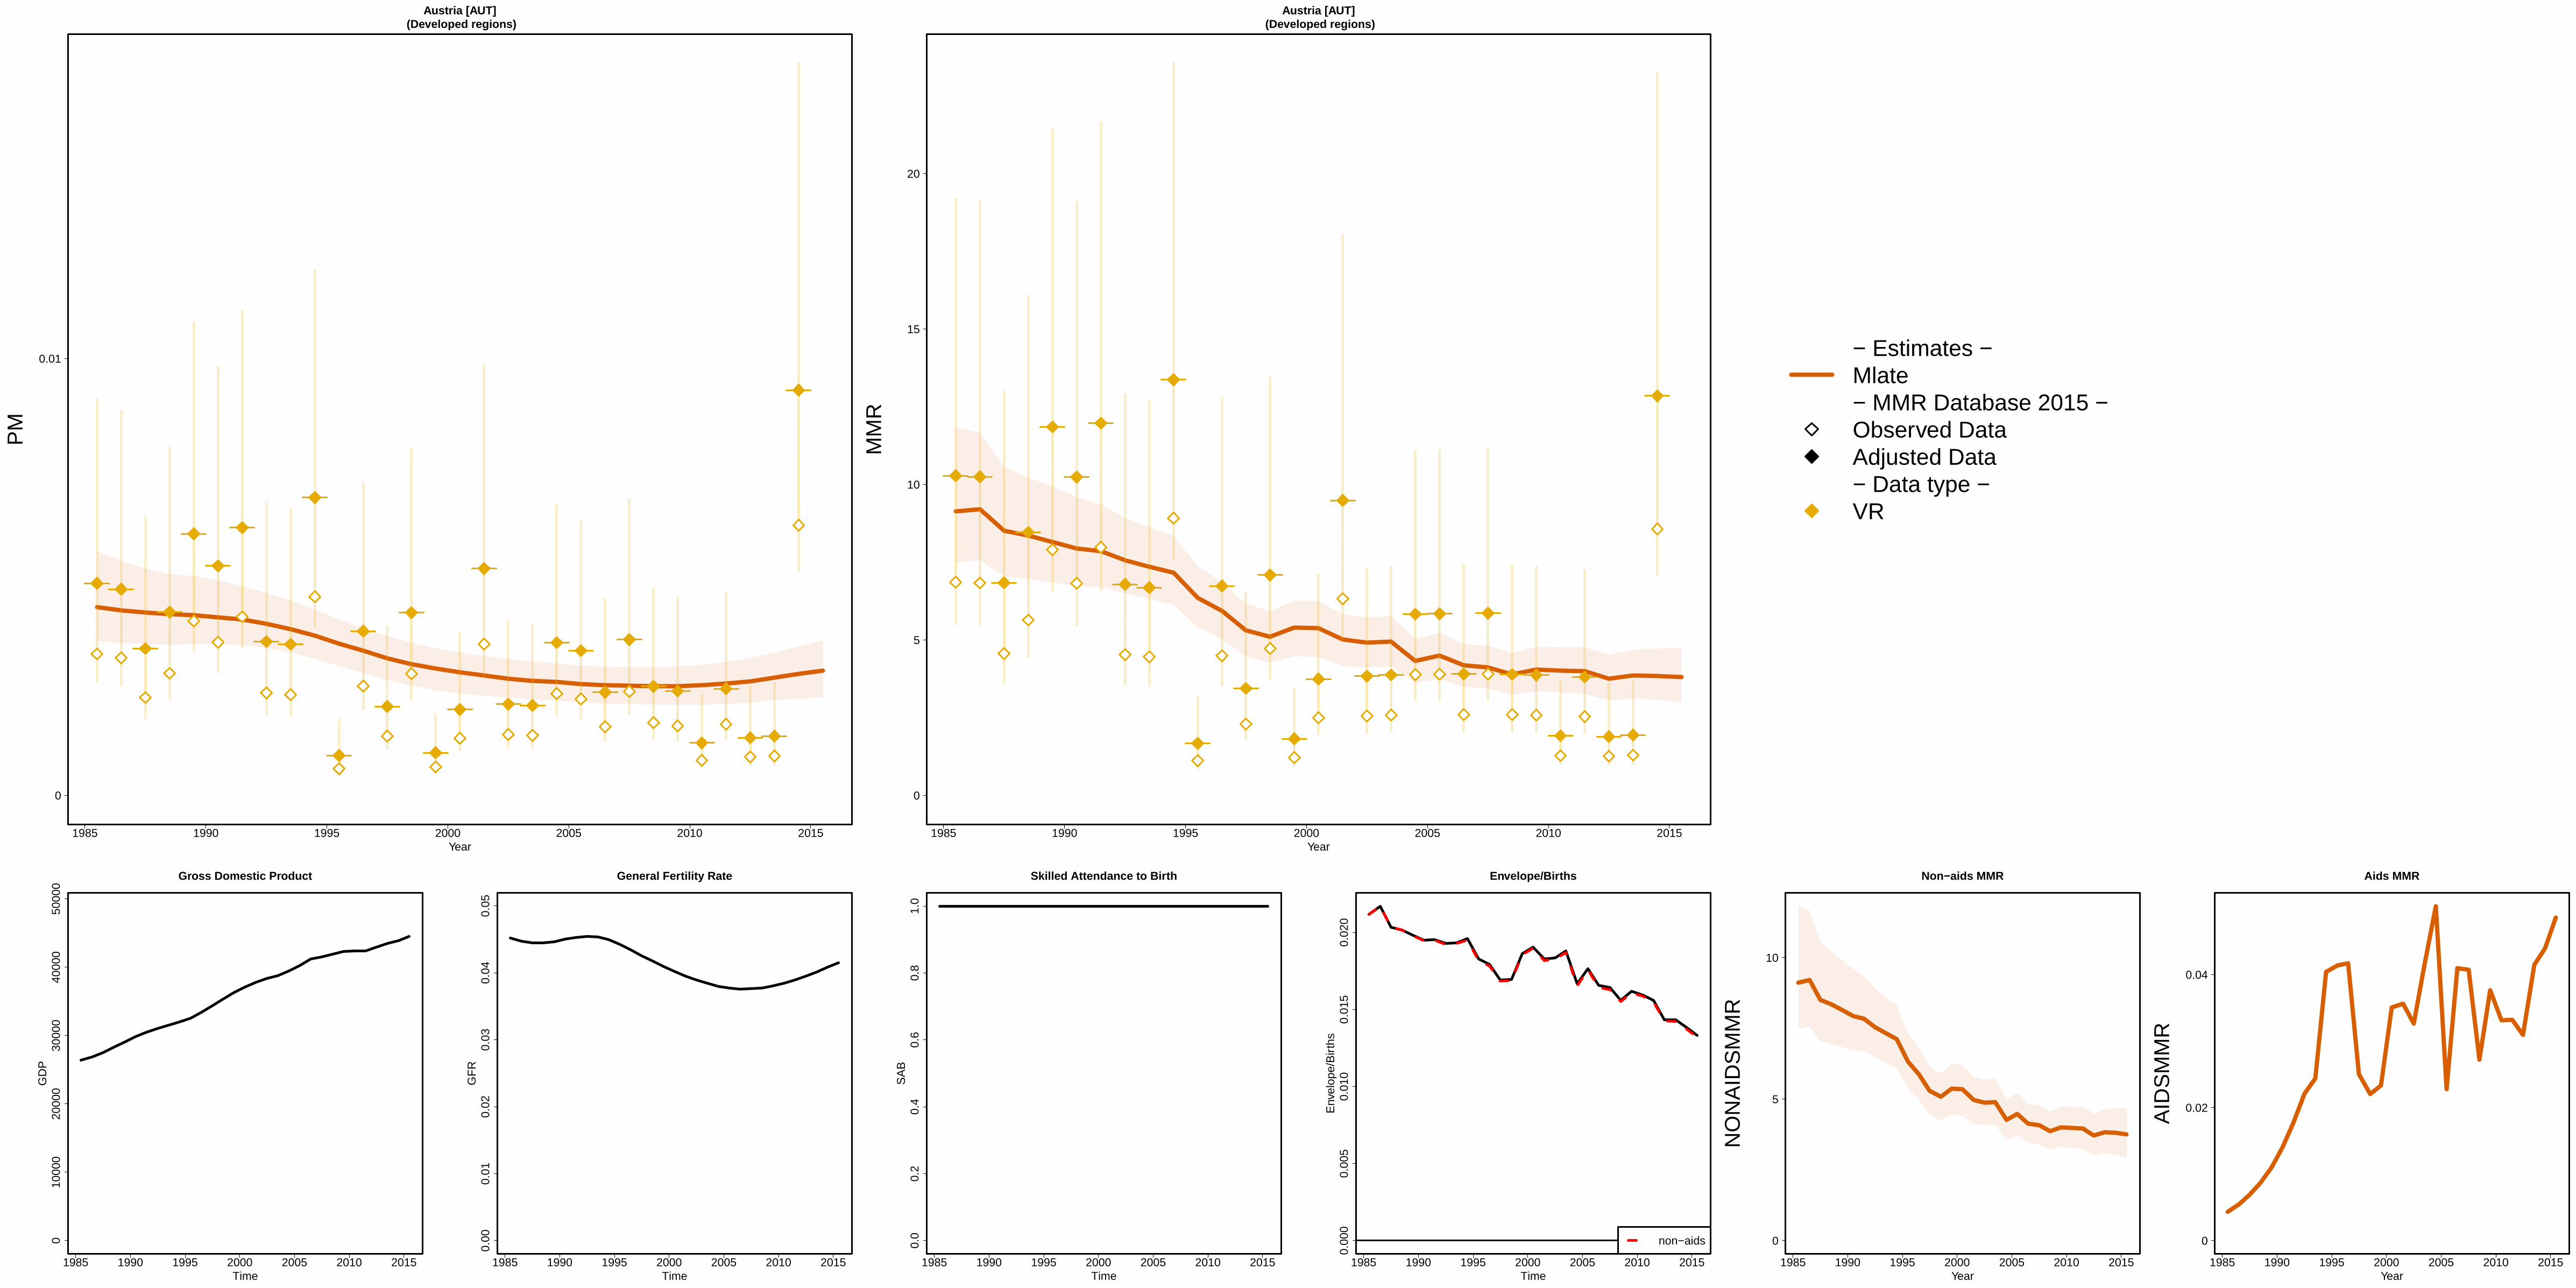
1985 1990 1995 2000 2005 2010 2015
Austria [AUT] (Developed regions)
Year
0
0.01
PM
1985 1990 1995 2000 2005 2010 2015
Austria [AUT] (Developed regions)
Year
0
5
10
15
20
MM
R
− Estimates −Mlate− MMR Database 2015 −Observed DataAdjusted Data− Data type −VR
1985 1990 1995 2000 2005 2010 2015
010
000
2000
030
000
4000
050
000
Gross Domestic Product
Time
GD
P
1985 1990 1995 2000 2005 2010 2015
0.00
0.01
0.02
0.03
0.04
0.05
General Fertility Rate
Time
GF
R
1985 1990 1995 2000 2005 2010 2015
0.0
0.2
0.4
0.6
0.8
1.0
Skilled Attendance to Birth
Time
SA
B
1985 1990 1995 2000 2005 2010 2015
0.00
00.
005
0.01
00.
015
0.02
0
Envelope/Births
Time
Env
elop
e/B
irth
s
non−aids
1985 1990 1995 2000 2005 2010 2015
Non−aids MMR
Year
0
5
10
NO
NA
IDS
MM
R
1985 1990 1995 2000 2005 2010 2015
Aids MMR
Year
0
0.02
0.04
AID
SM
MR
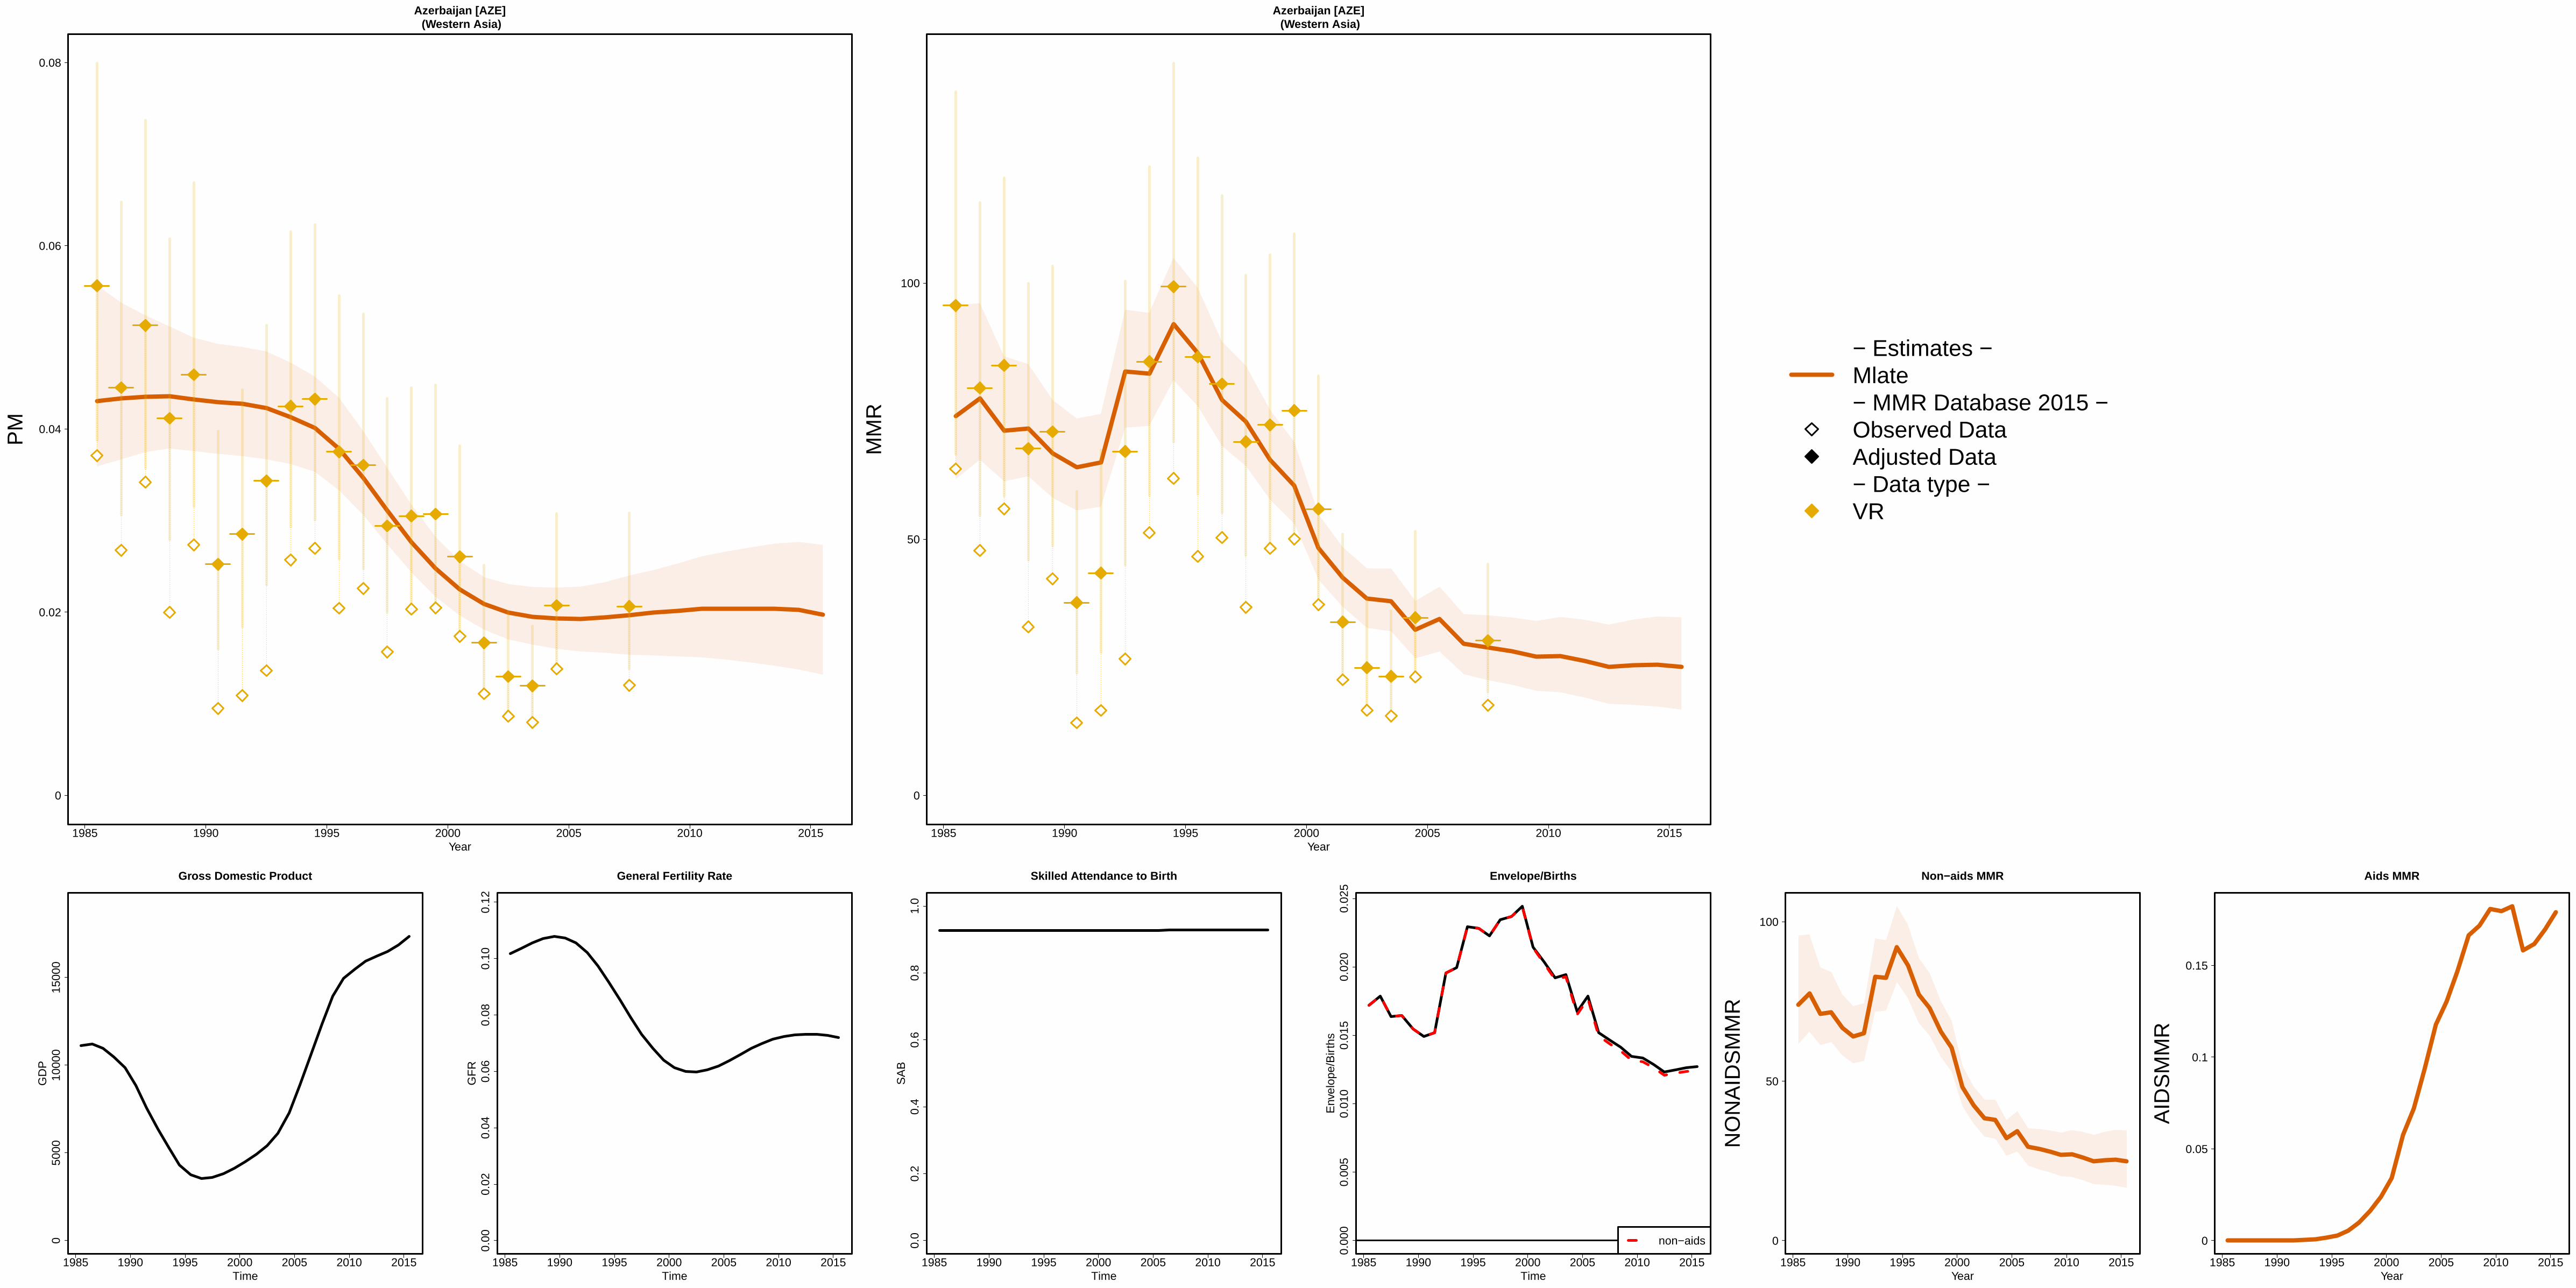
1985 1990 1995 2000 2005 2010 2015
Azerbaijan [AZE] (Western Asia)
Year
0
0.02
0.04
0.06
0.08
PM
1985 1990 1995 2000 2005 2010 2015
Azerbaijan [AZE] (Western Asia)
Year
0
50
100
MM
R
− Estimates −Mlate− MMR Database 2015 −Observed DataAdjusted Data− Data type −VR
1985 1990 1995 2000 2005 2010 2015
050
0010
000
1500
0
Gross Domestic Product
Time
GD
P
1985 1990 1995 2000 2005 2010 2015
0.00
0.02
0.04
0.06
0.08
0.10
0.12
General Fertility Rate
Time
GF
R
1985 1990 1995 2000 2005 2010 2015
0.0
0.2
0.4
0.6
0.8
1.0
Skilled Attendance to Birth
Time
SA
B
1985 1990 1995 2000 2005 2010 2015
0.00
00.
005
0.01
00.
015
0.02
00.
025
Envelope/Births
Time
Env
elop
e/B
irth
s
non−aids
1985 1990 1995 2000 2005 2010 2015
Non−aids MMR
Year
0
50
100
NO
NA
IDS
MM
R
1985 1990 1995 2000 2005 2010 2015
Aids MMR
Year
0
0.05
0.1
0.15
AID
SM
MR
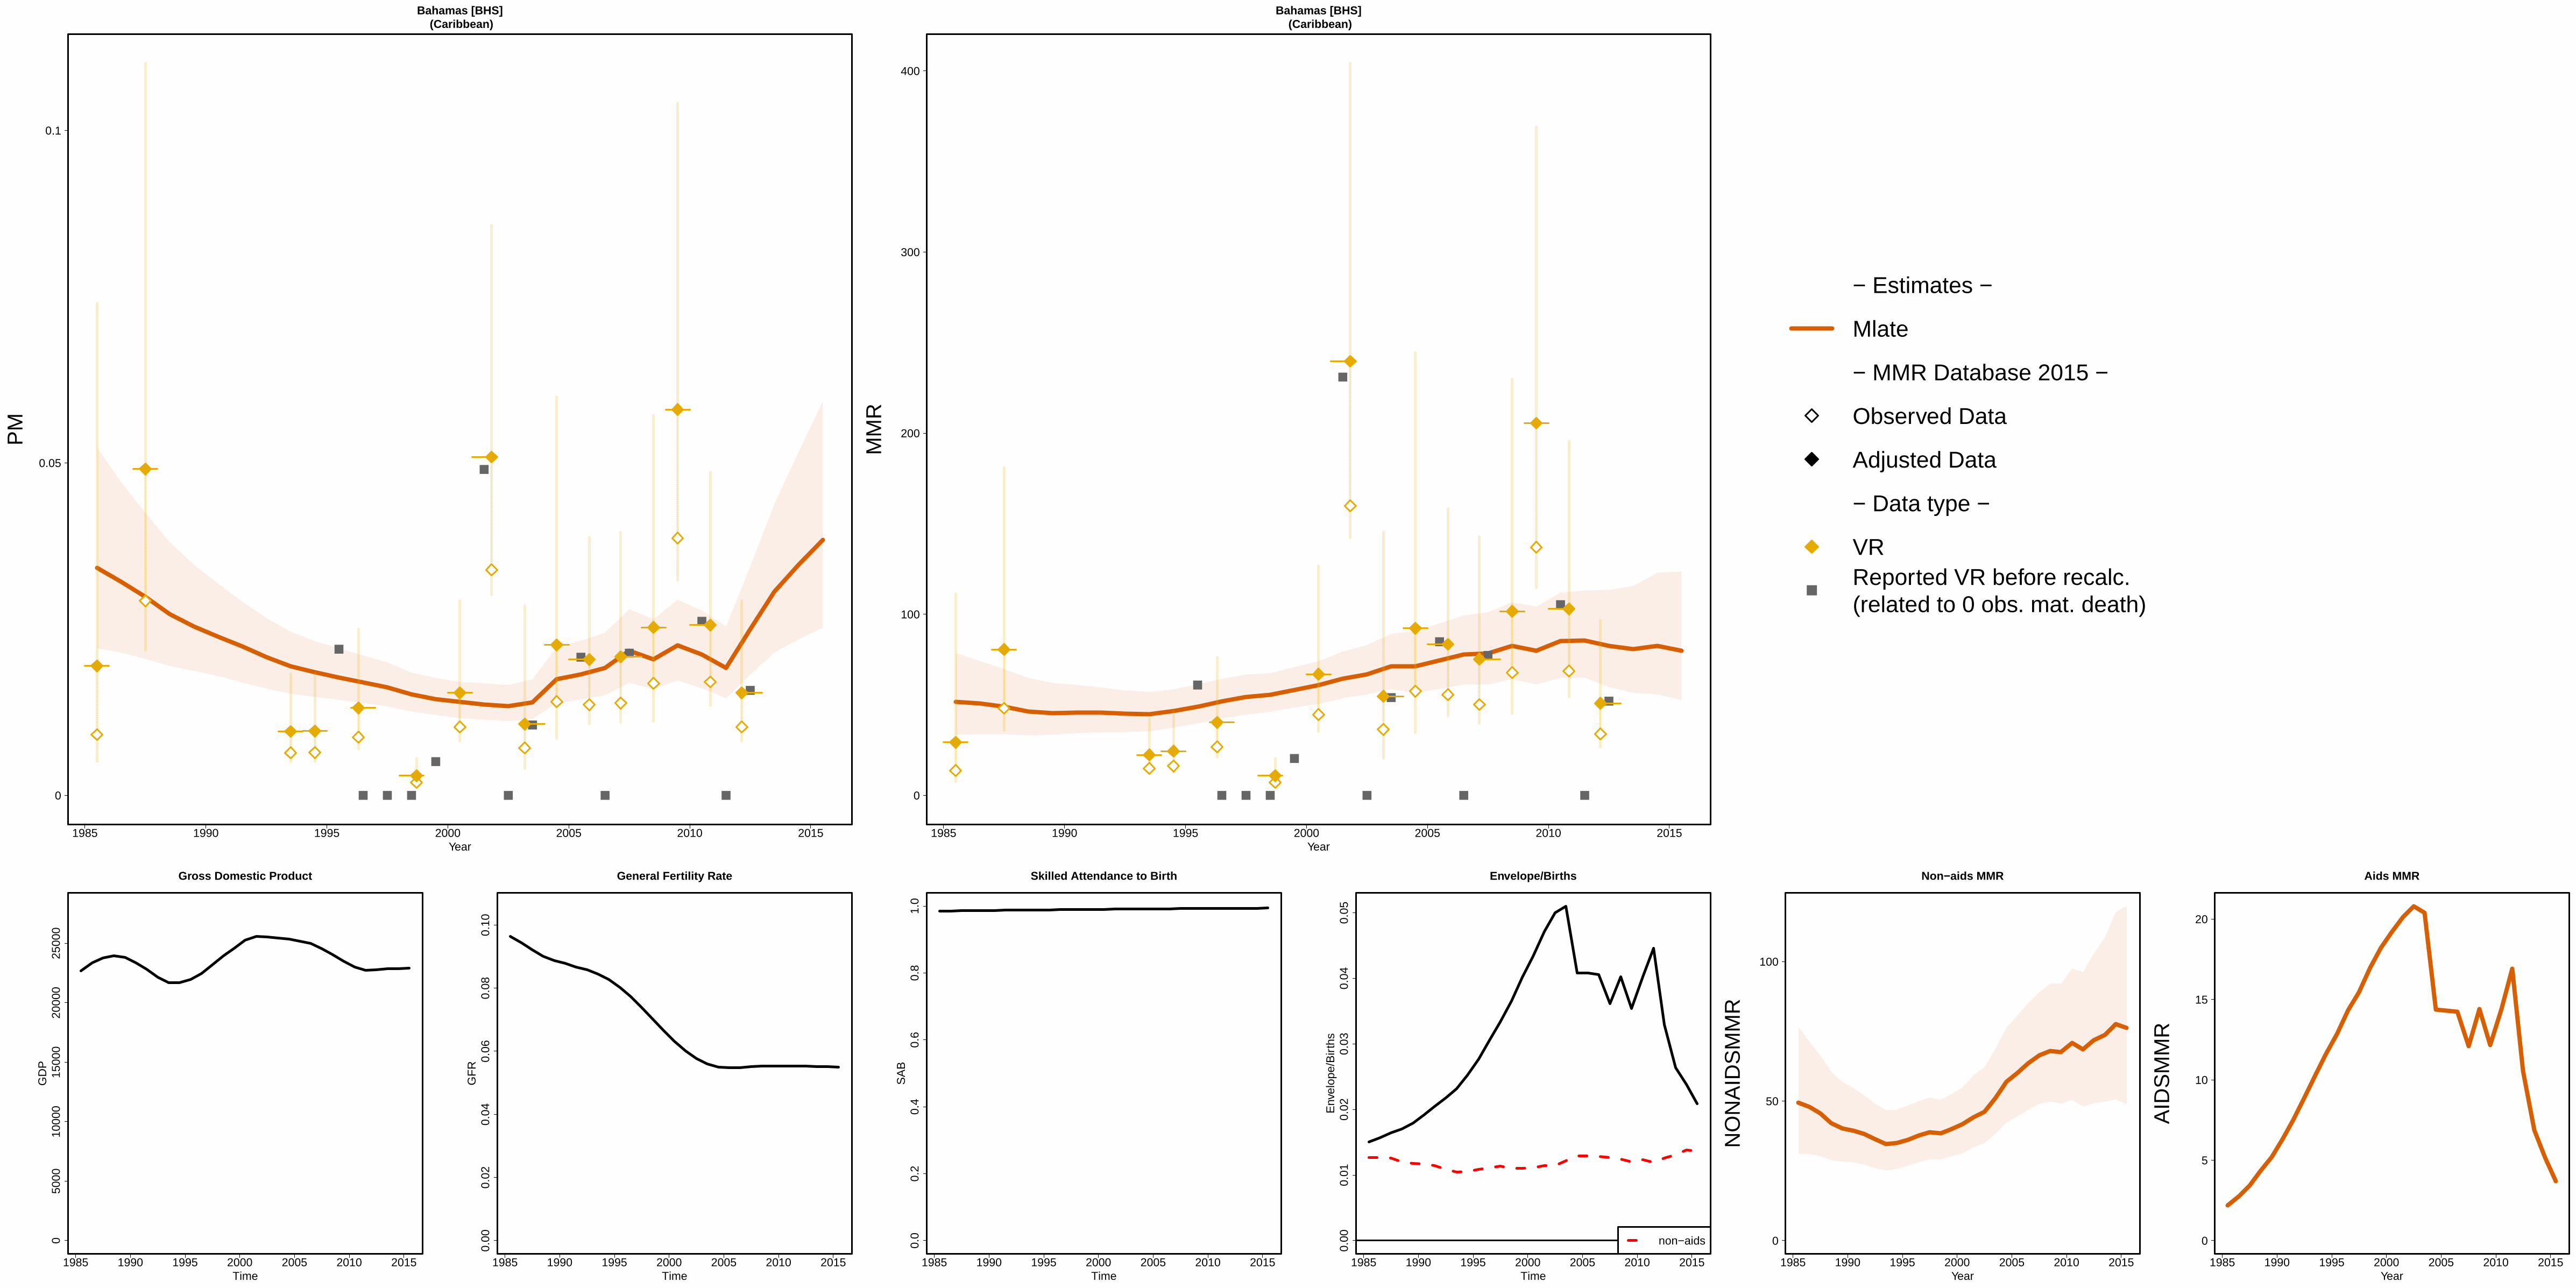
1985 1990 1995 2000 2005 2010 2015
Bahamas [BHS] (Caribbean)
Year
0
0.05
0.1
PM
1985 1990 1995 2000 2005 2010 2015
Bahamas [BHS] (Caribbean)
Year
0
100
200
300
400
MM
R
− Estimates −
Mlate
− MMR Database 2015 −
Observed Data
Adjusted Data
− Data type −
VRReported VR before recalc.(related to 0 obs. mat. death)
1985 1990 1995 2000 2005 2010 2015
050
0010
000
1500
020
000
2500
0
Gross Domestic Product
Time
GD
P
1985 1990 1995 2000 2005 2010 2015
0.00
0.02
0.04
0.06
0.08
0.10
General Fertility Rate
Time
GF
R
1985 1990 1995 2000 2005 2010 2015
0.0
0.2
0.4
0.6
0.8
1.0
Skilled Attendance to Birth
Time
SA
B
1985 1990 1995 2000 2005 2010 2015
0.00
0.01
0.02
0.03
0.04
0.05
Envelope/Births
Time
Env
elop
e/B
irth
s
non−aids
1985 1990 1995 2000 2005 2010 2015
Non−aids MMR
Year
0
50
100
NO
NA
IDS
MM
R
1985 1990 1995 2000 2005 2010 2015
Aids MMR
Year
0
5
10
15
20
AID
SM
MR

1985 1990 1995 2000 2005 2010 2015
Bahrain [BHR] (Western Asia)
Year
0
0.05
0.1
0.15
0.2
PM
1985 1990 1995 2000 2005 2010 2015
Bahrain [BHR] (Western Asia)
Year
0
50
100
MM
R
− Estimates −
Mlate
− MMR Database 2015 −
Observed Data
Adjusted Data
− Data type −
VRReported VR before recalc.(related to 0 obs. mat. death)
1985 1990 1995 2000 2005 2010 2015
010
000
2000
030
000
4000
050
000
Gross Domestic Product
Time
GD
P
1985 1990 1995 2000 2005 2010 2015
0.00
0.05
0.10
0.15
General Fertility Rate
Time
GF
R
1985 1990 1995 2000 2005 2010 2015
0.0
0.2
0.4
0.6
0.8
1.0
Skilled Attendance to Birth
Time
SA
B
1985 1990 1995 2000 2005 2010 2015
0.00
00.
002
0.00
40.
006
0.00
8
Envelope/Births
Time
Env
elop
e/B
irth
s
non−aids
1985 1990 1995 2000 2005 2010 2015
Non−aids MMR
Year
0
5
10
15
20
25
30
35
NO
NA
IDS
MM
R
1985 1990 1995 2000 2005 2010 2015
Aids MMR
Year
0
0.05
0.1
AID
SM
MR
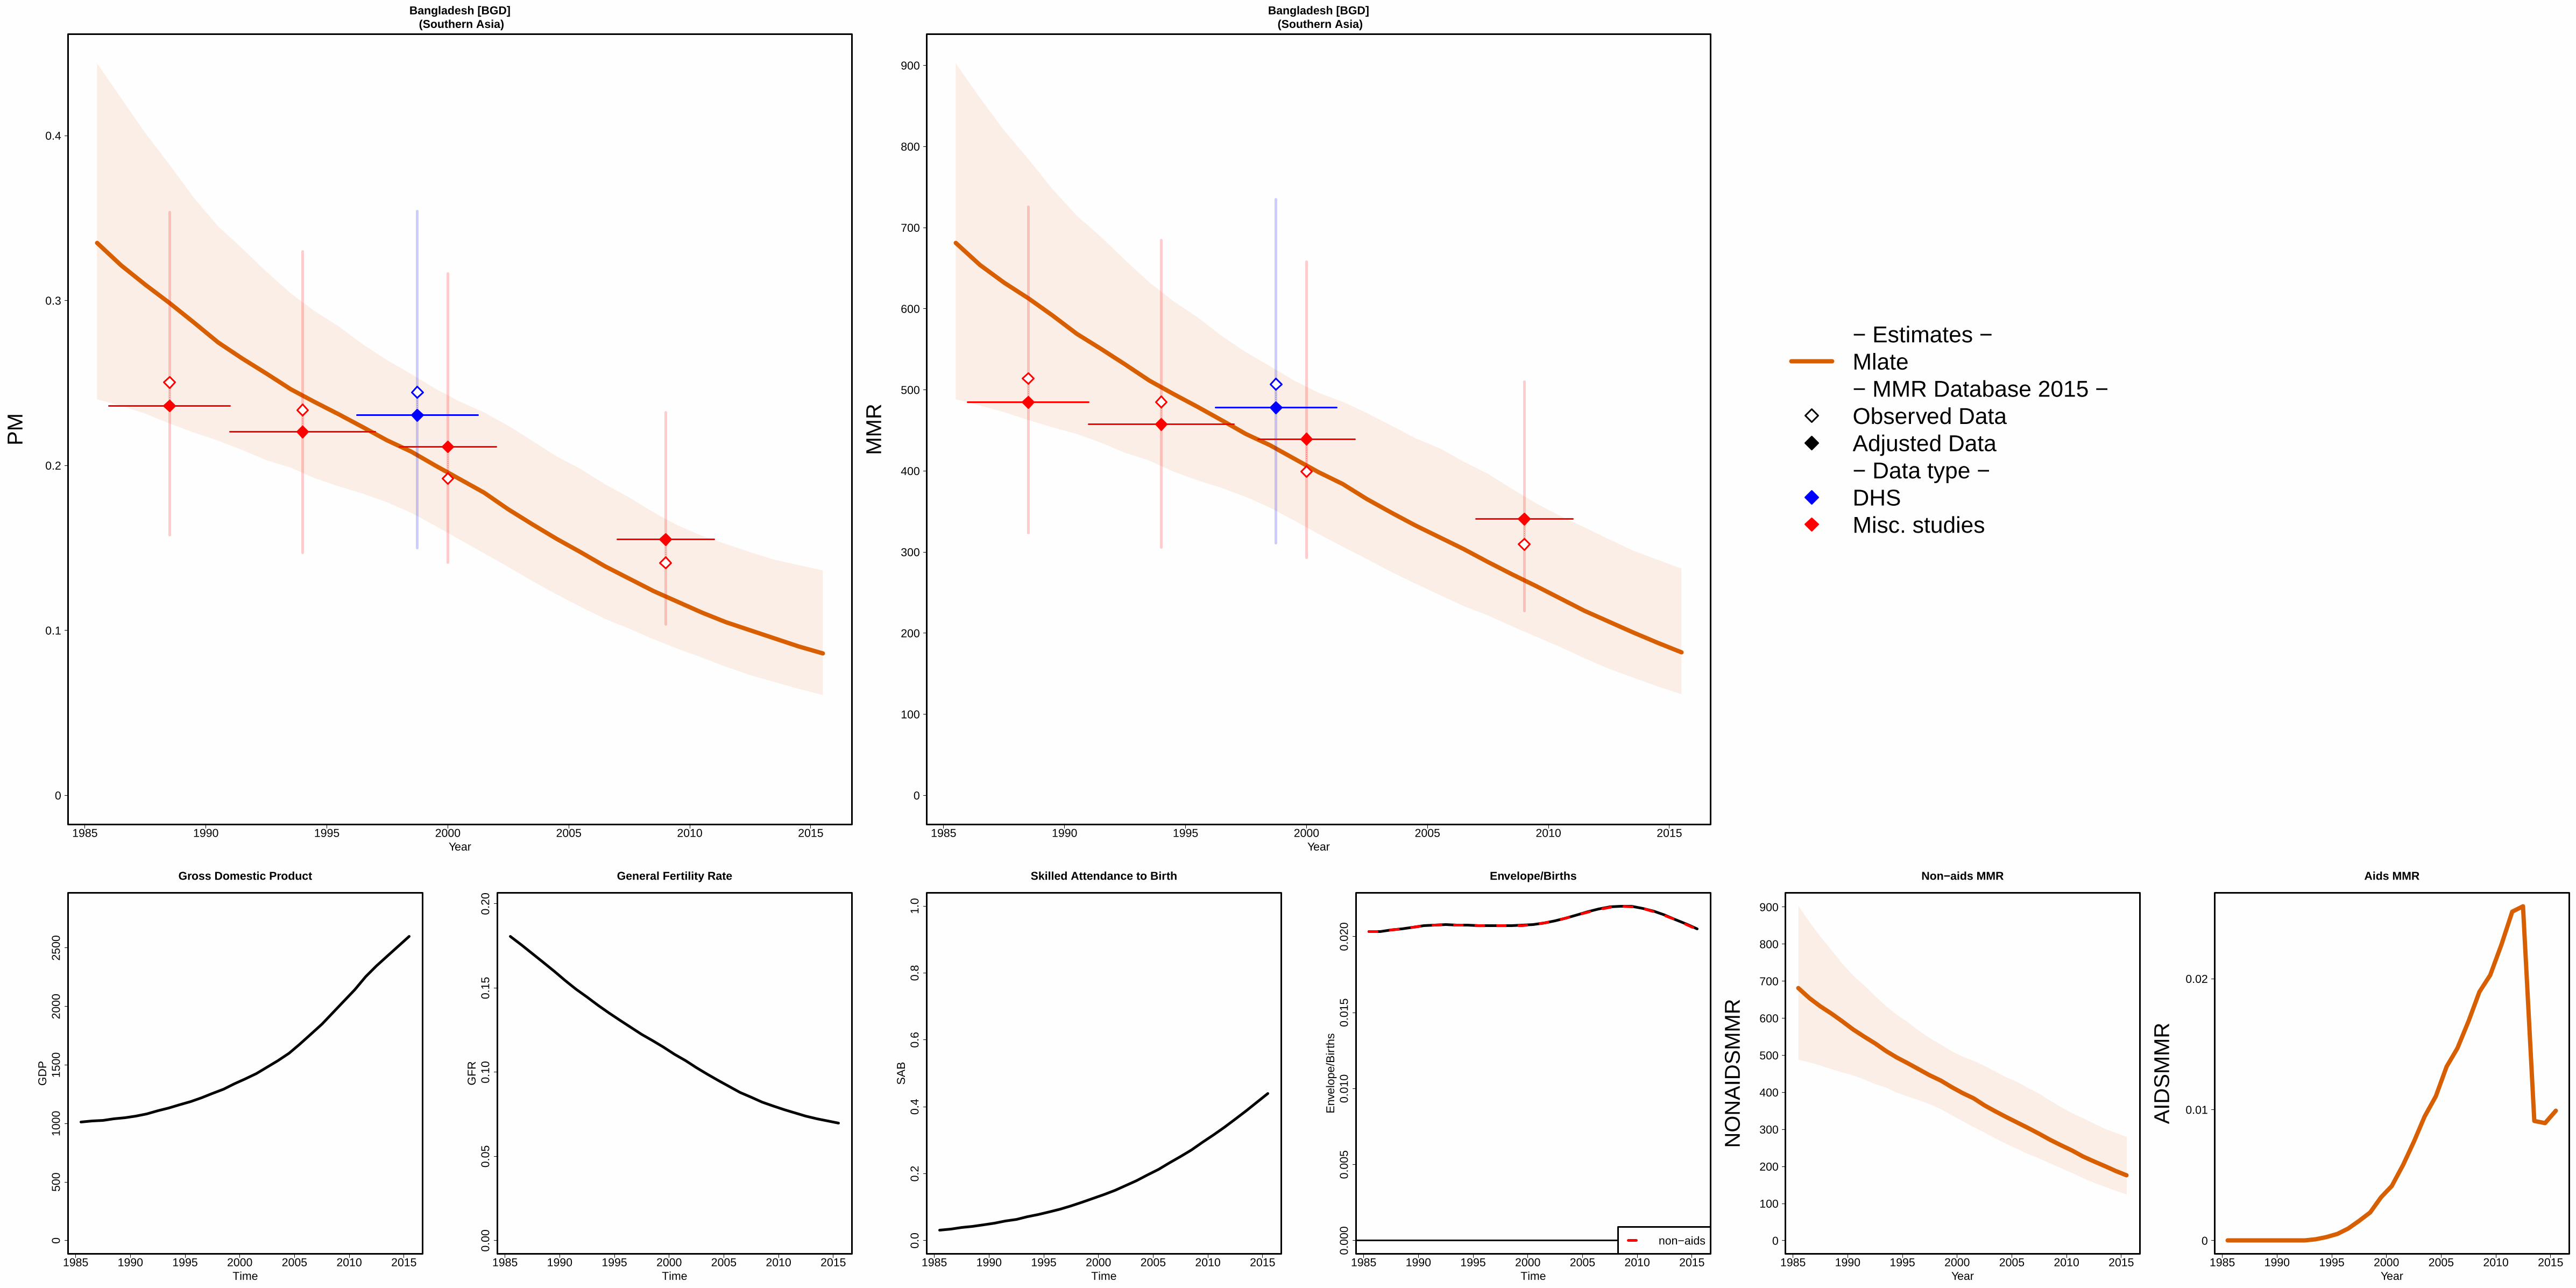
1985 1990 1995 2000 2005 2010 2015
Bangladesh [BGD] (Southern Asia)
Year
0
0.1
0.2
0.3
0.4
PM
1985 1990 1995 2000 2005 2010 2015
Bangladesh [BGD] (Southern Asia)
Year
0
100
200
300
400
500
600
700
800
900
MM
R
− Estimates −Mlate− MMR Database 2015 −Observed DataAdjusted Data− Data type −DHSMisc. studies
1985 1990 1995 2000 2005 2010 2015
050
010
0015
0020
0025
00
Gross Domestic Product
Time
GD
P
1985 1990 1995 2000 2005 2010 2015
0.00
0.05
0.10
0.15
0.20
General Fertility Rate
Time
GF
R
1985 1990 1995 2000 2005 2010 2015
0.0
0.2
0.4
0.6
0.8
1.0
Skilled Attendance to Birth
Time
SA
B
1985 1990 1995 2000 2005 2010 2015
0.00
00.
005
0.01
00.
015
0.02
0
Envelope/Births
Time
Env
elop
e/B
irth
s
non−aids
1985 1990 1995 2000 2005 2010 2015
Non−aids MMR
Year
0
100
200
300
400
500
600
700
800
900
NO
NA
IDS
MM
R
1985 1990 1995 2000 2005 2010 2015
Aids MMR
Year
0
0.01
0.02
AID
SM
MR

1985 1990 1995 2000 2005 2010 2015
Barbados [BRB] (Caribbean)
Year
0
0.05
0.1
0.15
PM
1985 1990 1995 2000 2005 2010 2015
Barbados [BRB] (Caribbean)
Year
0
100
200
300
400
MM
R
− Estimates −
Mlate
− MMR Database 2015 −
Observed Data
Adjusted Data
− Data type −
VRReported VR before recalc.(related to 0 obs. mat. death)
1985 1990 1995 2000 2005 2010 2015
050
0010
000
1500
0
Gross Domestic Product
Time
GD
P
1985 1990 1995 2000 2005 2010 2015
0.00
0.01
0.02
0.03
0.04
0.05
0.06
0.07
General Fertility Rate
Time
GF
R
1985 1990 1995 2000 2005 2010 2015
0.0
0.2
0.4
0.6
0.8
1.0
Skilled Attendance to Birth
Time
SA
B
1985 1990 1995 2000 2005 2010 2015
0.00
00.
005
0.01
00.
015
0.02
00.
025
0.03
0
Envelope/Births
Time
Env
elop
e/B
irth
s
non−aids
1985 1990 1995 2000 2005 2010 2015
Non−aids MMR
Year
0
10
20
30
40
50
60
70
NO
NA
IDS
MM
R
1985 1990 1995 2000 2005 2010 2015
Aids MMR
Year
AID
SM
MR

1985 1990 1995 2000 2005 2010 2015
Belarus [BLR] (Developed regions)
Year
0
0.01
0.02
0.03
PM
1985 1990 1995 2000 2005 2010 2015
Belarus [BLR] (Developed regions)
Year
0
10
20
30
40
50
60
70
MM
R
− Estimates −Mlate− MMR Database 2015 −Observed DataAdjusted Data− Data type −VR
1985 1990 1995 2000 2005 2010 2015
050
0010
000
1500
020
000
Gross Domestic Product
Time
GD
P
1985 1990 1995 2000 2005 2010 2015
0.00
0.01
0.02
0.03
0.04
0.05
0.06
0.07
General Fertility Rate
Time
GF
R
1985 1990 1995 2000 2005 2010 2015
0.0
0.2
0.4
0.6
0.8
1.0
Skilled Attendance to Birth
Time
SA
B
1985 1990 1995 2000 2005 2010 2015
0.00
0.01
0.02
0.03
0.04
0.05
Envelope/Births
Time
Env
elop
e/B
irth
s
non−aids
1985 1990 1995 2000 2005 2010 2015
Non−aids MMR
Year
0
10
20
30
40
NO
NA
IDS
MM
R
1985 1990 1995 2000 2005 2010 2015
Aids MMR
Year
AID
SM
MR
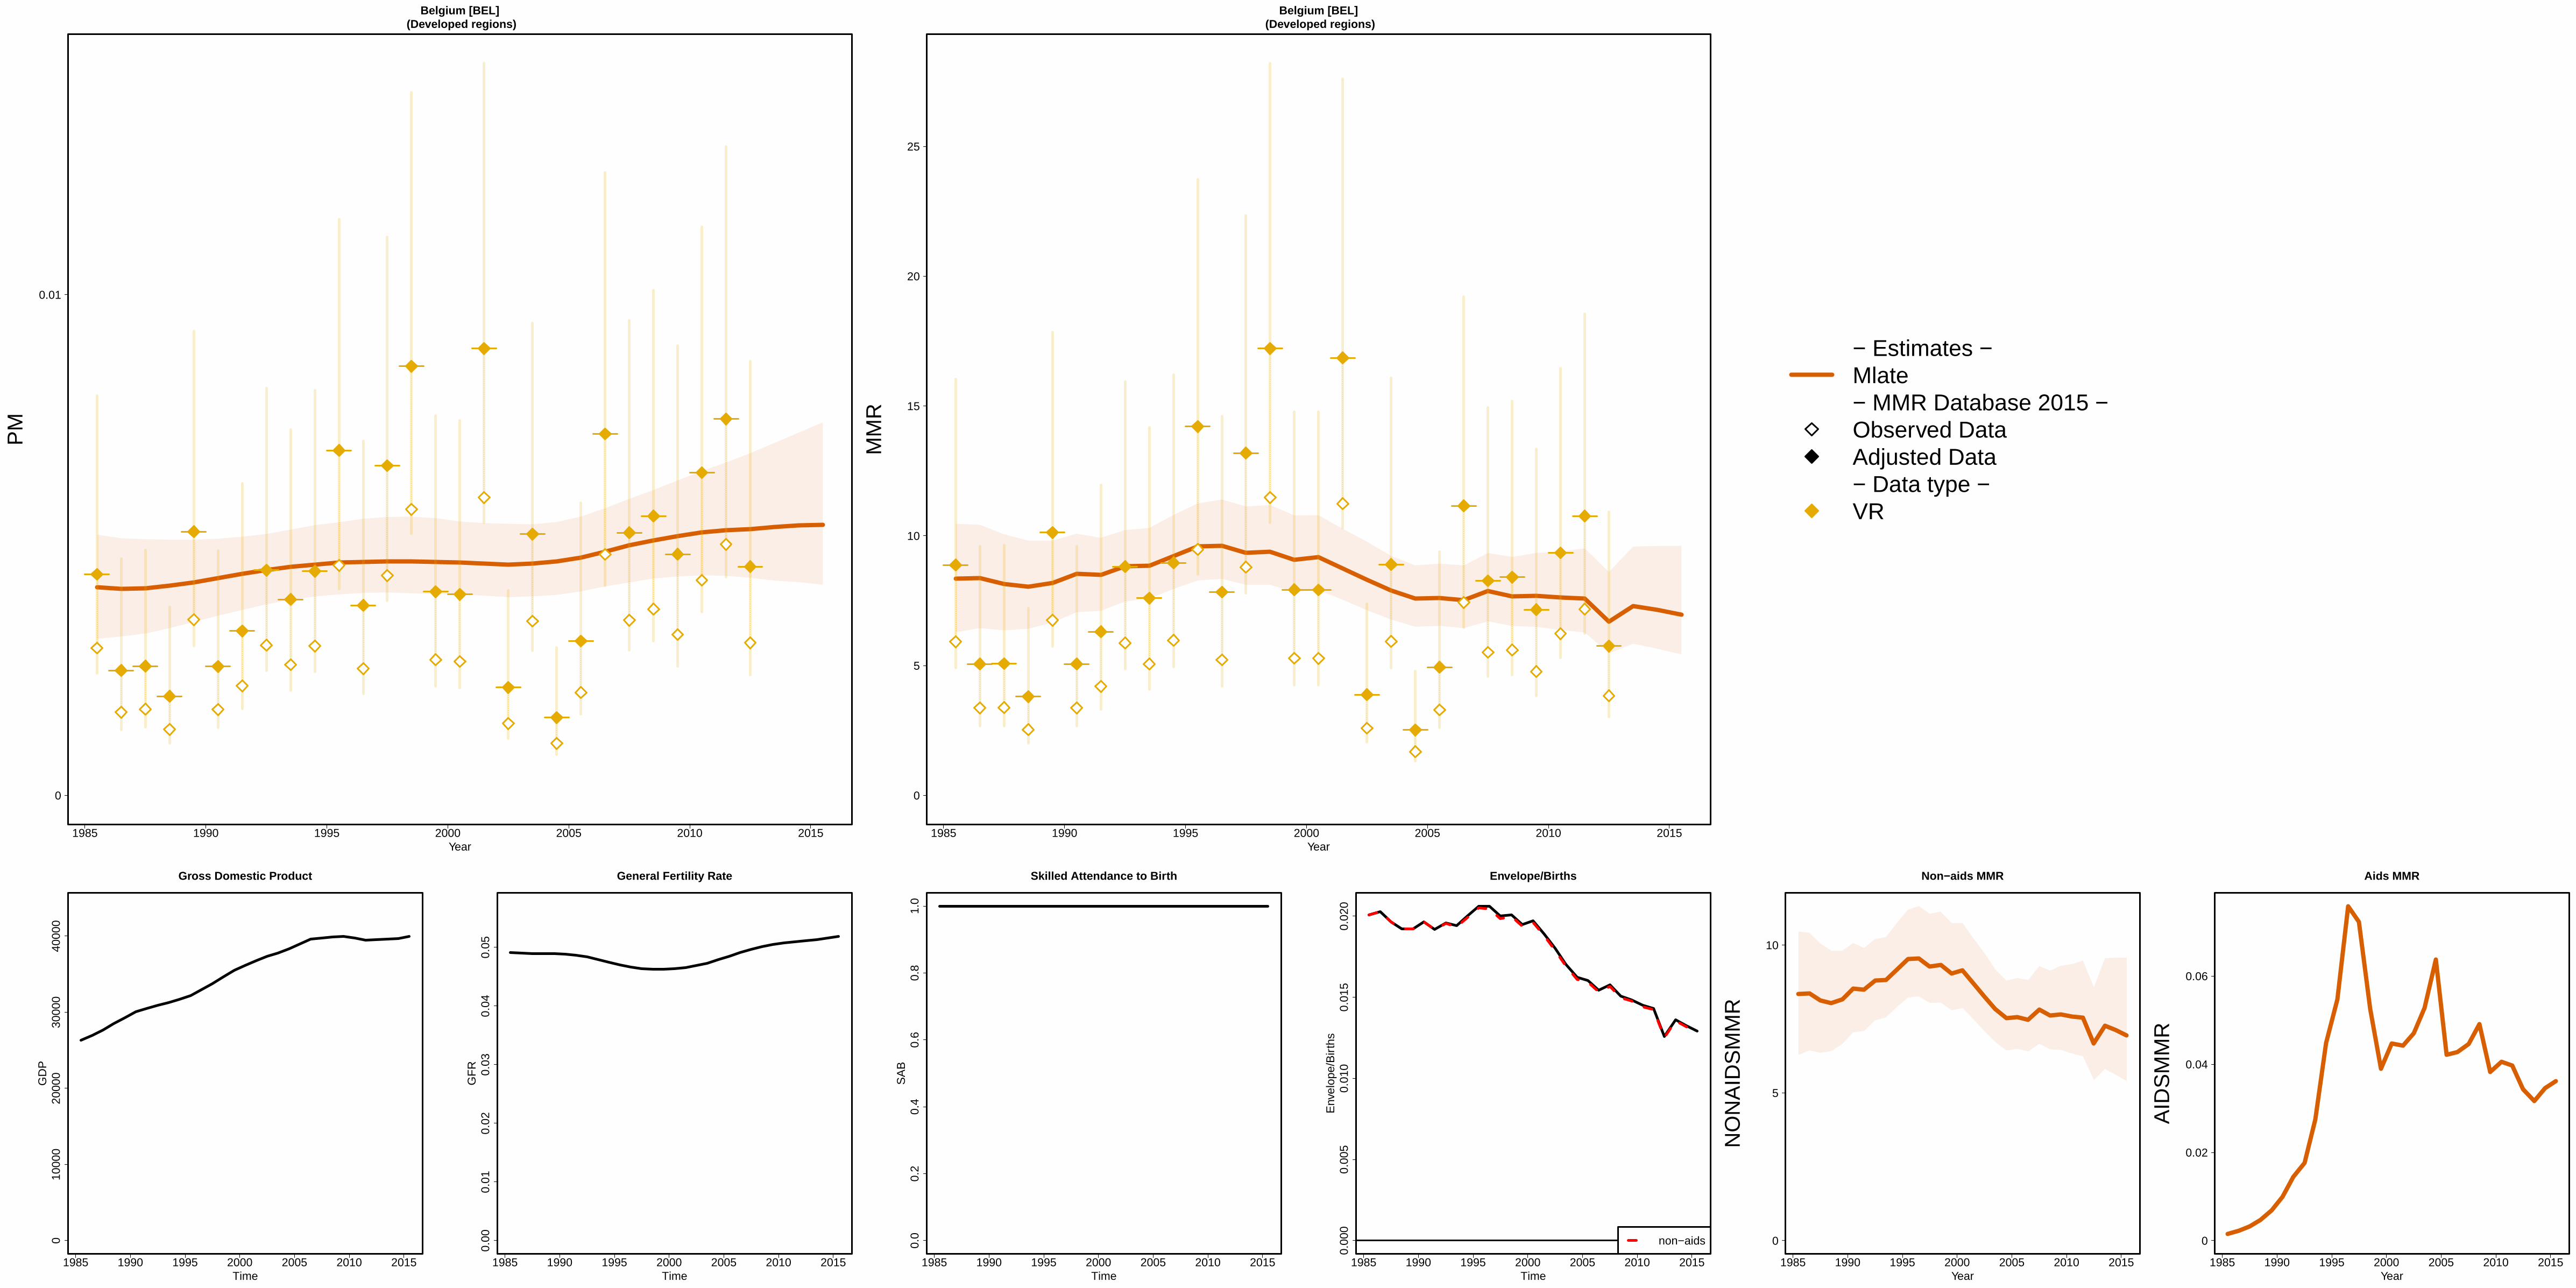
1985 1990 1995 2000 2005 2010 2015
Belgium [BEL] (Developed regions)
Year
0
0.01
PM
1985 1990 1995 2000 2005 2010 2015
Belgium [BEL] (Developed regions)
Year
0
5
10
15
20
25
MM
R
− Estimates −Mlate− MMR Database 2015 −Observed DataAdjusted Data− Data type −VR
1985 1990 1995 2000 2005 2010 2015
010
000
2000
030
000
4000
0
Gross Domestic Product
Time
GD
P
1985 1990 1995 2000 2005 2010 2015
0.00
0.01
0.02
0.03
0.04
0.05
General Fertility Rate
Time
GF
R
1985 1990 1995 2000 2005 2010 2015
0.0
0.2
0.4
0.6
0.8
1.0
Skilled Attendance to Birth
Time
SA
B
1985 1990 1995 2000 2005 2010 2015
0.00
00.
005
0.01
00.
015
0.02
0
Envelope/Births
Time
Env
elop
e/B
irth
s
non−aids
1985 1990 1995 2000 2005 2010 2015
Non−aids MMR
Year
0
5
10
NO
NA
IDS
MM
R
1985 1990 1995 2000 2005 2010 2015
Aids MMR
Year
0
0.02
0.04
0.06
AID
SM
MR

1985 1990 1995 2000 2005 2010 2015
Belize [BLZ] (Central America)
Year
0
0.05
0.1
0.15
0.2
0.25
PM
1985 1990 1995 2000 2005 2010 2015
Belize [BLZ] (Central America)
Year
0
50
100
150
200
250
MM
R
− Estimates −
Mlate
− MMR Database 2015 −
Observed Data
Adjusted Data
− Data type −
VRReported VR before recalc.(related to 0 obs. mat. death)
1985 1990 1995 2000 2005 2010 2015
020
0040
0060
0080
00
Gross Domestic Product
Time
GD
P
1985 1990 1995 2000 2005 2010 2015
0.00
0.05
0.10
0.15
0.20
General Fertility Rate
Time
GF
R
1985 1990 1995 2000 2005 2010 2015
0.0
0.2
0.4
0.6
0.8
1.0
Skilled Attendance to Birth
Time
SA
B
1985 1990 1995 2000 2005 2010 2015
0.00
00.
005
0.01
0
Envelope/Births
Time
Env
elop
e/B
irth
s
non−aids
1985 1990 1995 2000 2005 2010 2015
Non−aids MMR
Year
0
10
20
30
40
50
60
70
80
NO
NA
IDS
MM
R
1985 1990 1995 2000 2005 2010 2015
Aids MMR
Year
AID
SM
MR

1985 1990 1995 2000 2005 2010 2015
Benin [BEN] (Western Africa)
Year
0
0.1
0.2
0.3
0.4
PM
1985 1990 1995 2000 2005 2010 2015
Benin [BEN] (Western Africa)
Year
0
100
200
300
400
500
600
700
800
900
1000
MM
R
− Estimates −Mlate− MMR Database 2015 −Observed DataAdjusted Data− Data type −DHSCensus
1985 1990 1995 2000 2005 2010 2015
050
010
0015
0020
00
Gross Domestic Product
Time
GD
P
1985 1990 1995 2000 2005 2010 2015
0.00
0.05
0.10
0.15
0.20
General Fertility Rate
Time
GF
R
1985 1990 1995 2000 2005 2010 2015
0.0
0.2
0.4
0.6
0.8
1.0
Skilled Attendance to Birth
Time
SA
B
1985 1990 1995 2000 2005 2010 2015
0.00
00.
005
0.01
00.
015
0.02
00.
025
Envelope/Births
Time
Env
elop
e/B
irth
s
non−aids
1985 1990 1995 2000 2005 2010 2015
Non−aids MMR
Year
0
100
200
300
400
500
600
700
800
900
1000
NO
NA
IDS
MM
R
1985 1990 1995 2000 2005 2010 2015
Aids MMR
Year
0
5
10
AID
SM
MR

1985 1990 1995 2000 2005 2010 2015
Bhutan [BTN] (Southern Asia)
Year
0
0.05
0.1
0.15
0.2
0.25
0.3
0.35
0.4
PM
1985 1990 1995 2000 2005 2010 2015
Bhutan [BTN] (Southern Asia)
Year
0
500
1000
1500
2000
MM
R
− Estimates −Mlate− MMR Database 2015 −Observed DataAdjusted Data− Data type −CensusMisc. studies
1985 1990 1995 2000 2005 2010 2015
020
0040
0060
0080
00
Gross Domestic Product
Time
GD
P
1985 1990 1995 2000 2005 2010 2015
0.00
0.05
0.10
0.15
0.20
General Fertility Rate
Time
GF
R
1985 1990 1995 2000 2005 2010 2015
0.0
0.2
0.4
0.6
0.8
1.0
Skilled Attendance to Birth
Time
SA
B
1985 1990 1995 2000 2005 2010 2015
0.00
0.01
0.02
0.03
0.04
0.05
Envelope/Births
Time
Env
elop
e/B
irth
s
non−aids
1985 1990 1995 2000 2005 2010 2015
Non−aids MMR
Year
0
500
1000
1500
2000
NO
NA
IDS
MM
R
1985 1990 1995 2000 2005 2010 2015
Aids MMR
Year
AID
SM
MR
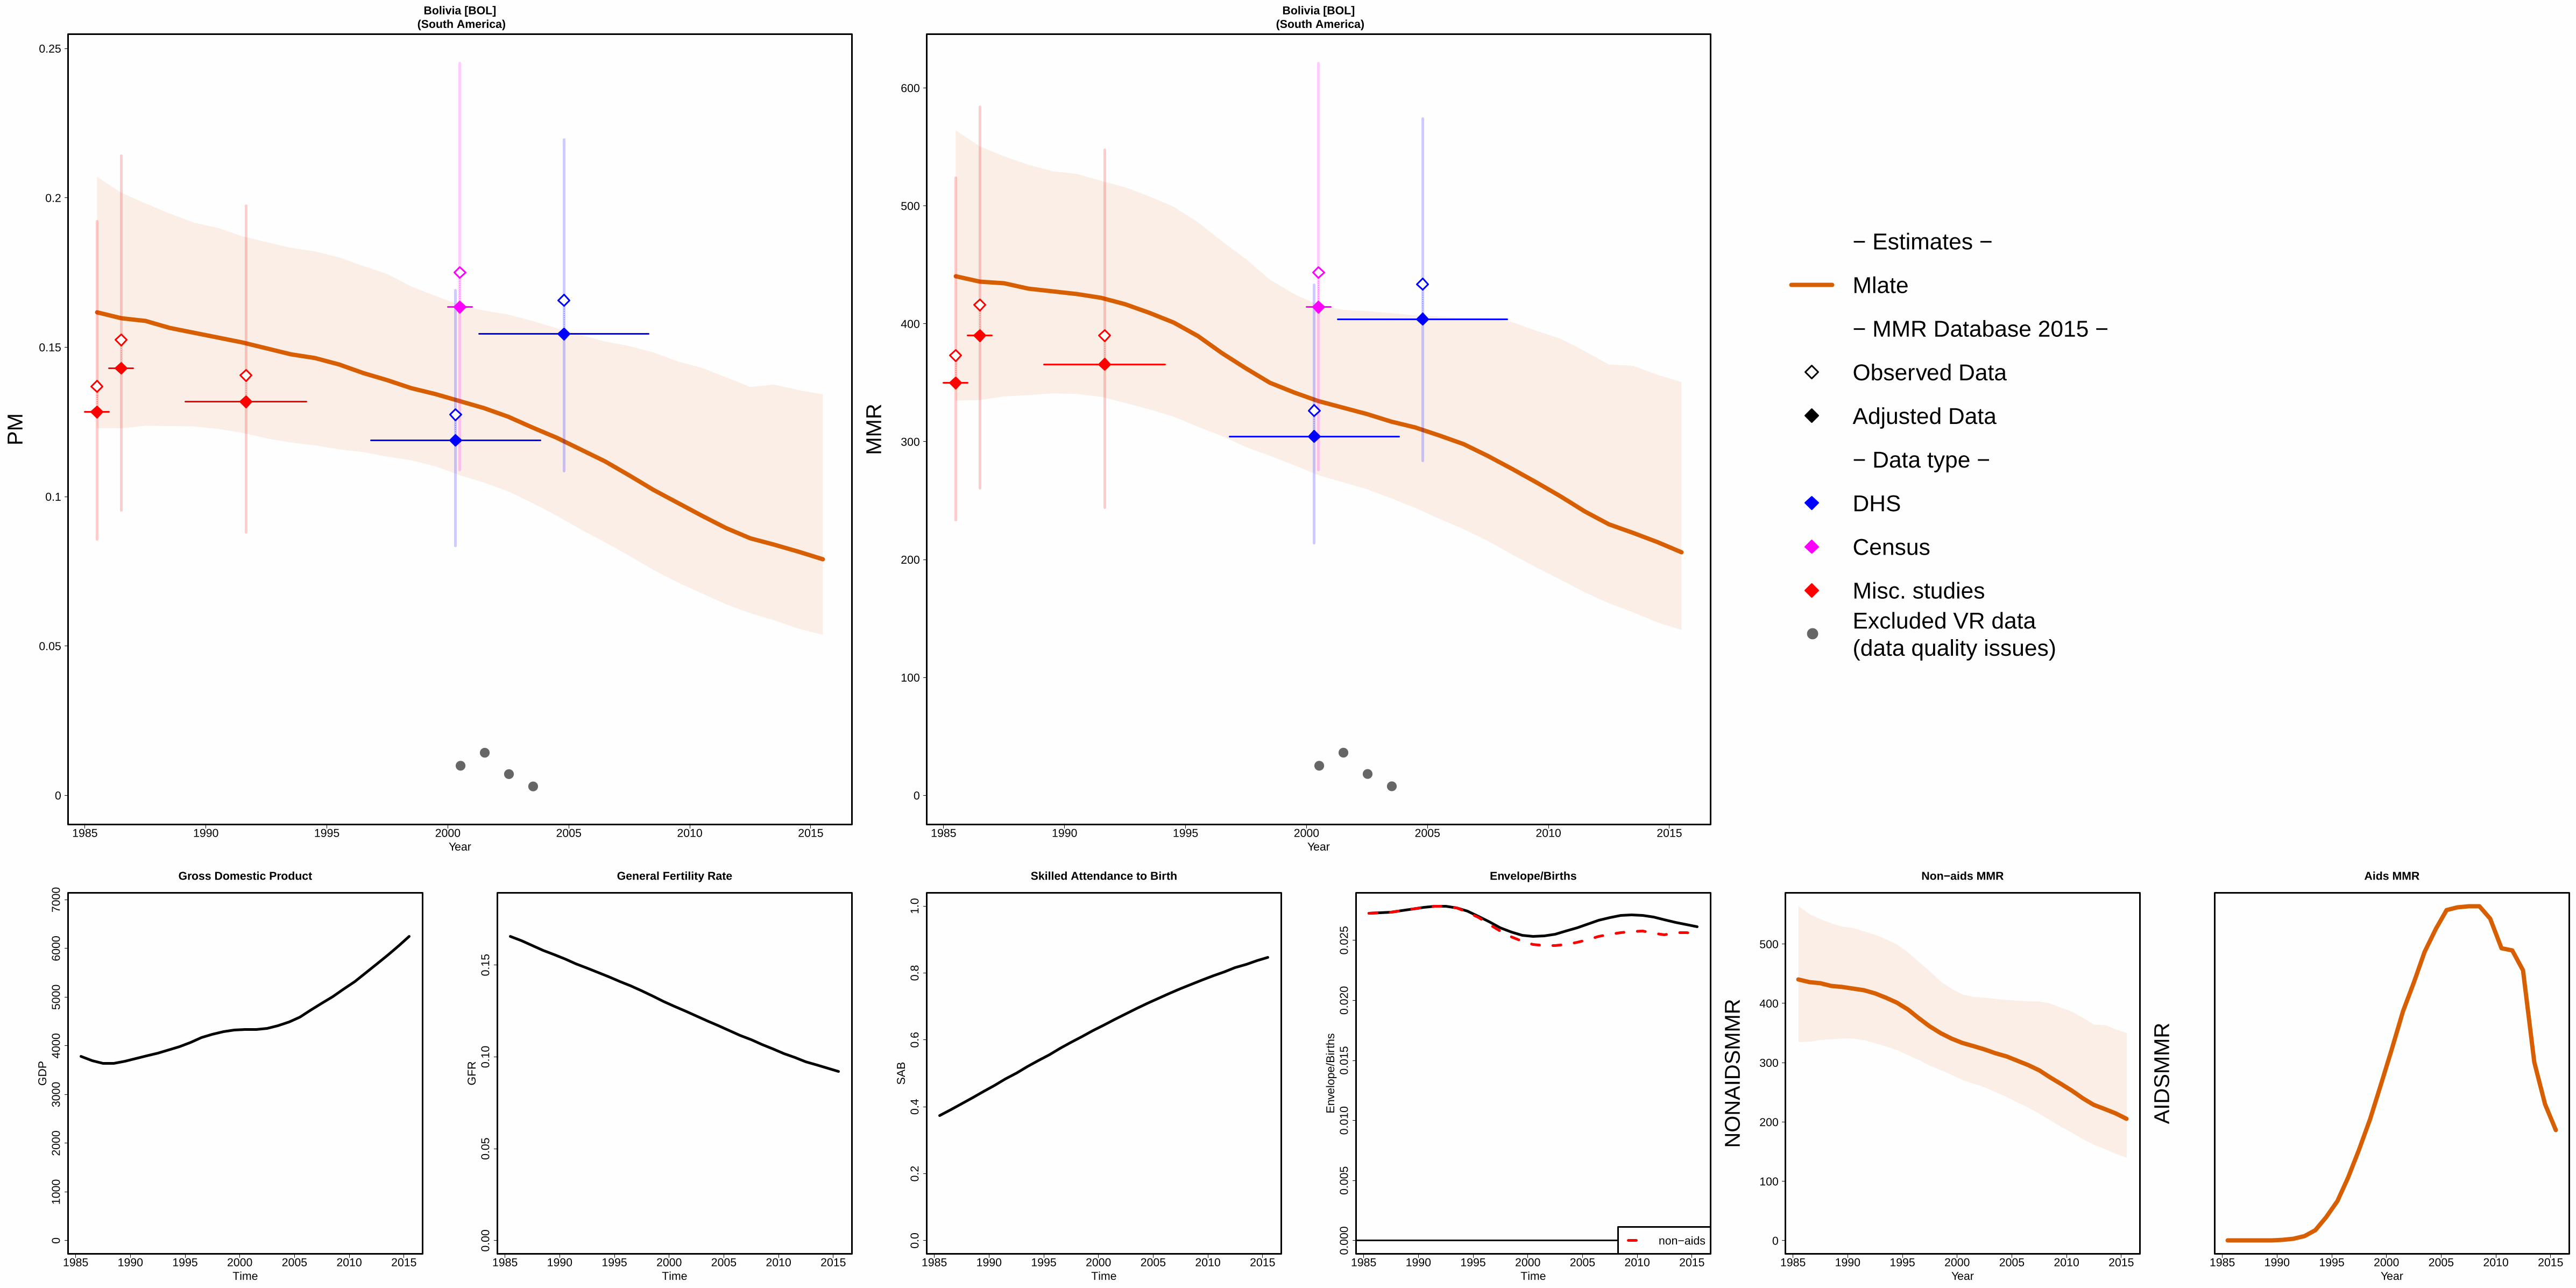
1985 1990 1995 2000 2005 2010 2015
Bolivia [BOL] (South America)
Year
0
0.05
0.1
0.15
0.2
0.25
PM
●●
●●
1985 1990 1995 2000 2005 2010 2015
Bolivia [BOL] (South America)
Year
0
100
200
300
400
500
600
MM
R
●●
●●
●
− Estimates −
Mlate
− MMR Database 2015 −
Observed Data
Adjusted Data
− Data type −
DHS
Census
Misc. studiesExcluded VR data (data quality issues)
1985 1990 1995 2000 2005 2010 2015
010
0020
0030
0040
0050
0060
0070
00
Gross Domestic Product
Time
GD
P
1985 1990 1995 2000 2005 2010 2015
0.00
0.05
0.10
0.15
General Fertility Rate
Time
GF
R
1985 1990 1995 2000 2005 2010 2015
0.0
0.2
0.4
0.6
0.8
1.0
Skilled Attendance to Birth
Time
SA
B
1985 1990 1995 2000 2005 2010 2015
0.00
00.
005
0.01
00.
015
0.02
00.
025
Envelope/Births
Time
Env
elop
e/B
irth
s
non−aids
1985 1990 1995 2000 2005 2010 2015
Non−aids MMR
Year
0
100
200
300
400
500
NO
NA
IDS
MM
R
1985 1990 1995 2000 2005 2010 2015
Aids MMR
Year
AID
SM
MR
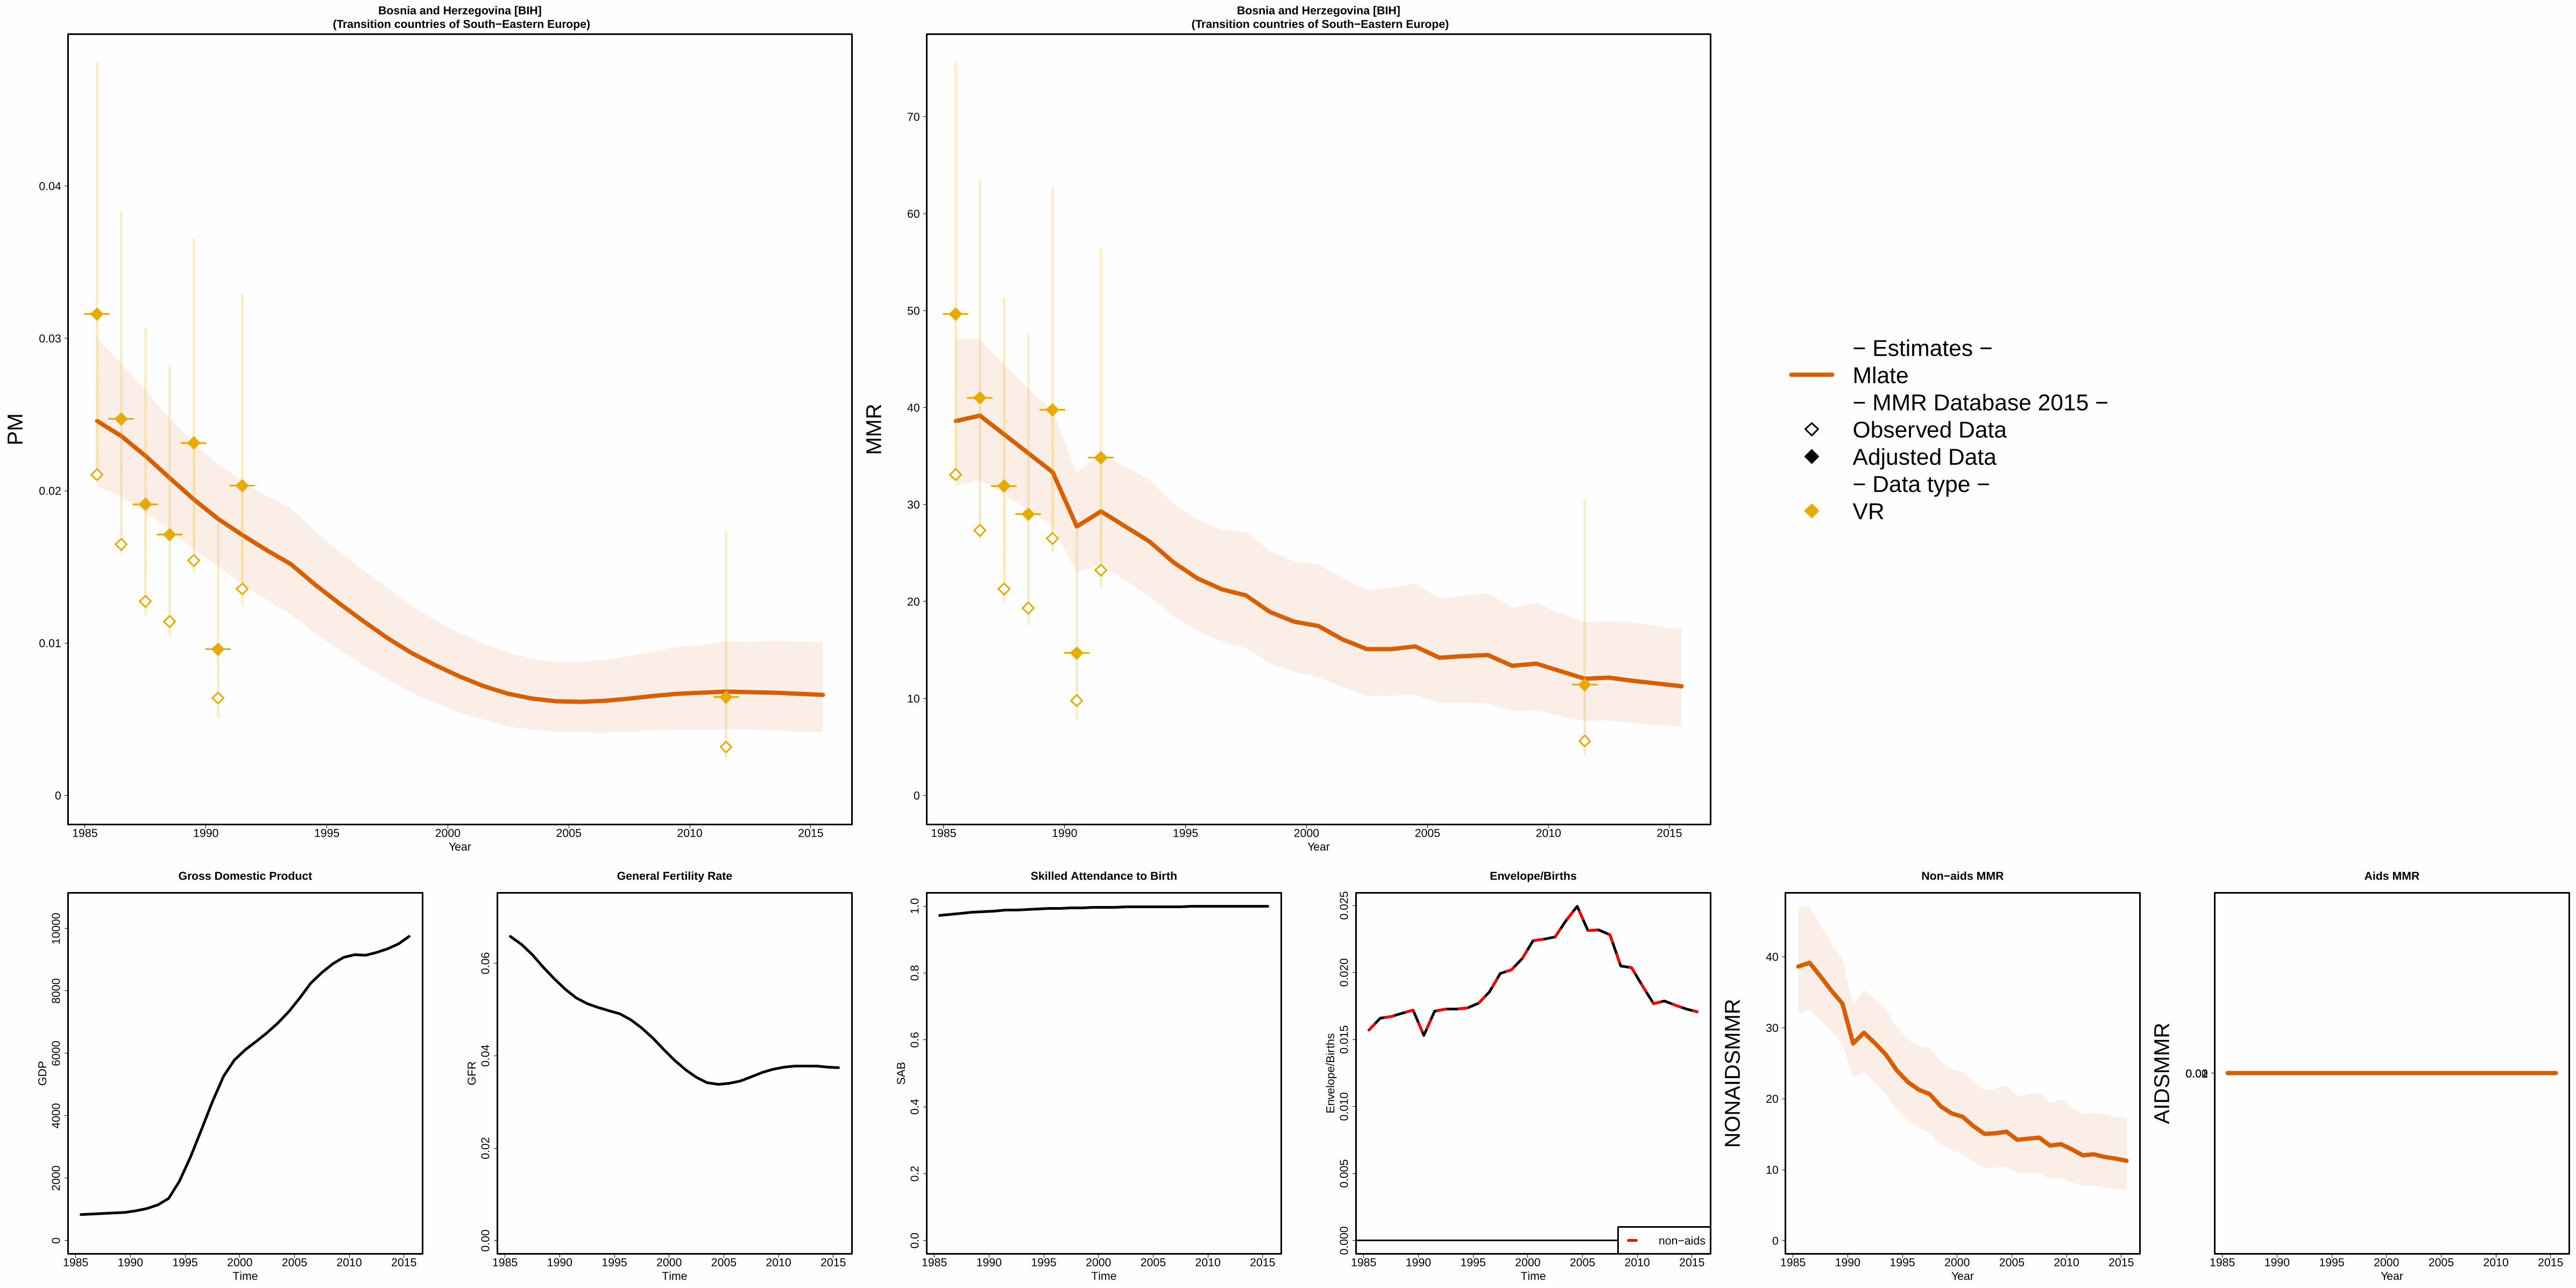
1985 1990 1995 2000 2005 2010 2015
Bosnia and Herzegovina [BIH] (Transition countries of South−Eastern Europe)
Year
0
0.01
0.02
0.03
0.04
PM
1985 1990 1995 2000 2005 2010 2015
Bosnia and Herzegovina [BIH] (Transition countries of South−Eastern Europe)
Year
0
10
20
30
40
50
60
70
MM
R
− Estimates −Mlate− MMR Database 2015 −Observed DataAdjusted Data− Data type −VR
1985 1990 1995 2000 2005 2010 2015
020
0040
0060
0080
0010
000
Gross Domestic Product
Time
GD
P
1985 1990 1995 2000 2005 2010 2015
0.00
0.02
0.04
0.06
General Fertility Rate
Time
GF
R
1985 1990 1995 2000 2005 2010 2015
0.0
0.2
0.4
0.6
0.8
1.0
Skilled Attendance to Birth
Time
SA
B
1985 1990 1995 2000 2005 2010 2015
0.00
00.
005
0.01
00.
015
0.02
00.
025
Envelope/Births
Time
Env
elop
e/B
irth
s
non−aids
1985 1990 1995 2000 2005 2010 2015
Non−aids MMR
Year
0
10
20
30
40
NO
NA
IDS
MM
R
1985 1990 1995 2000 2005 2010 2015
Aids MMR
Year
00.010.02
AID
SM
MR
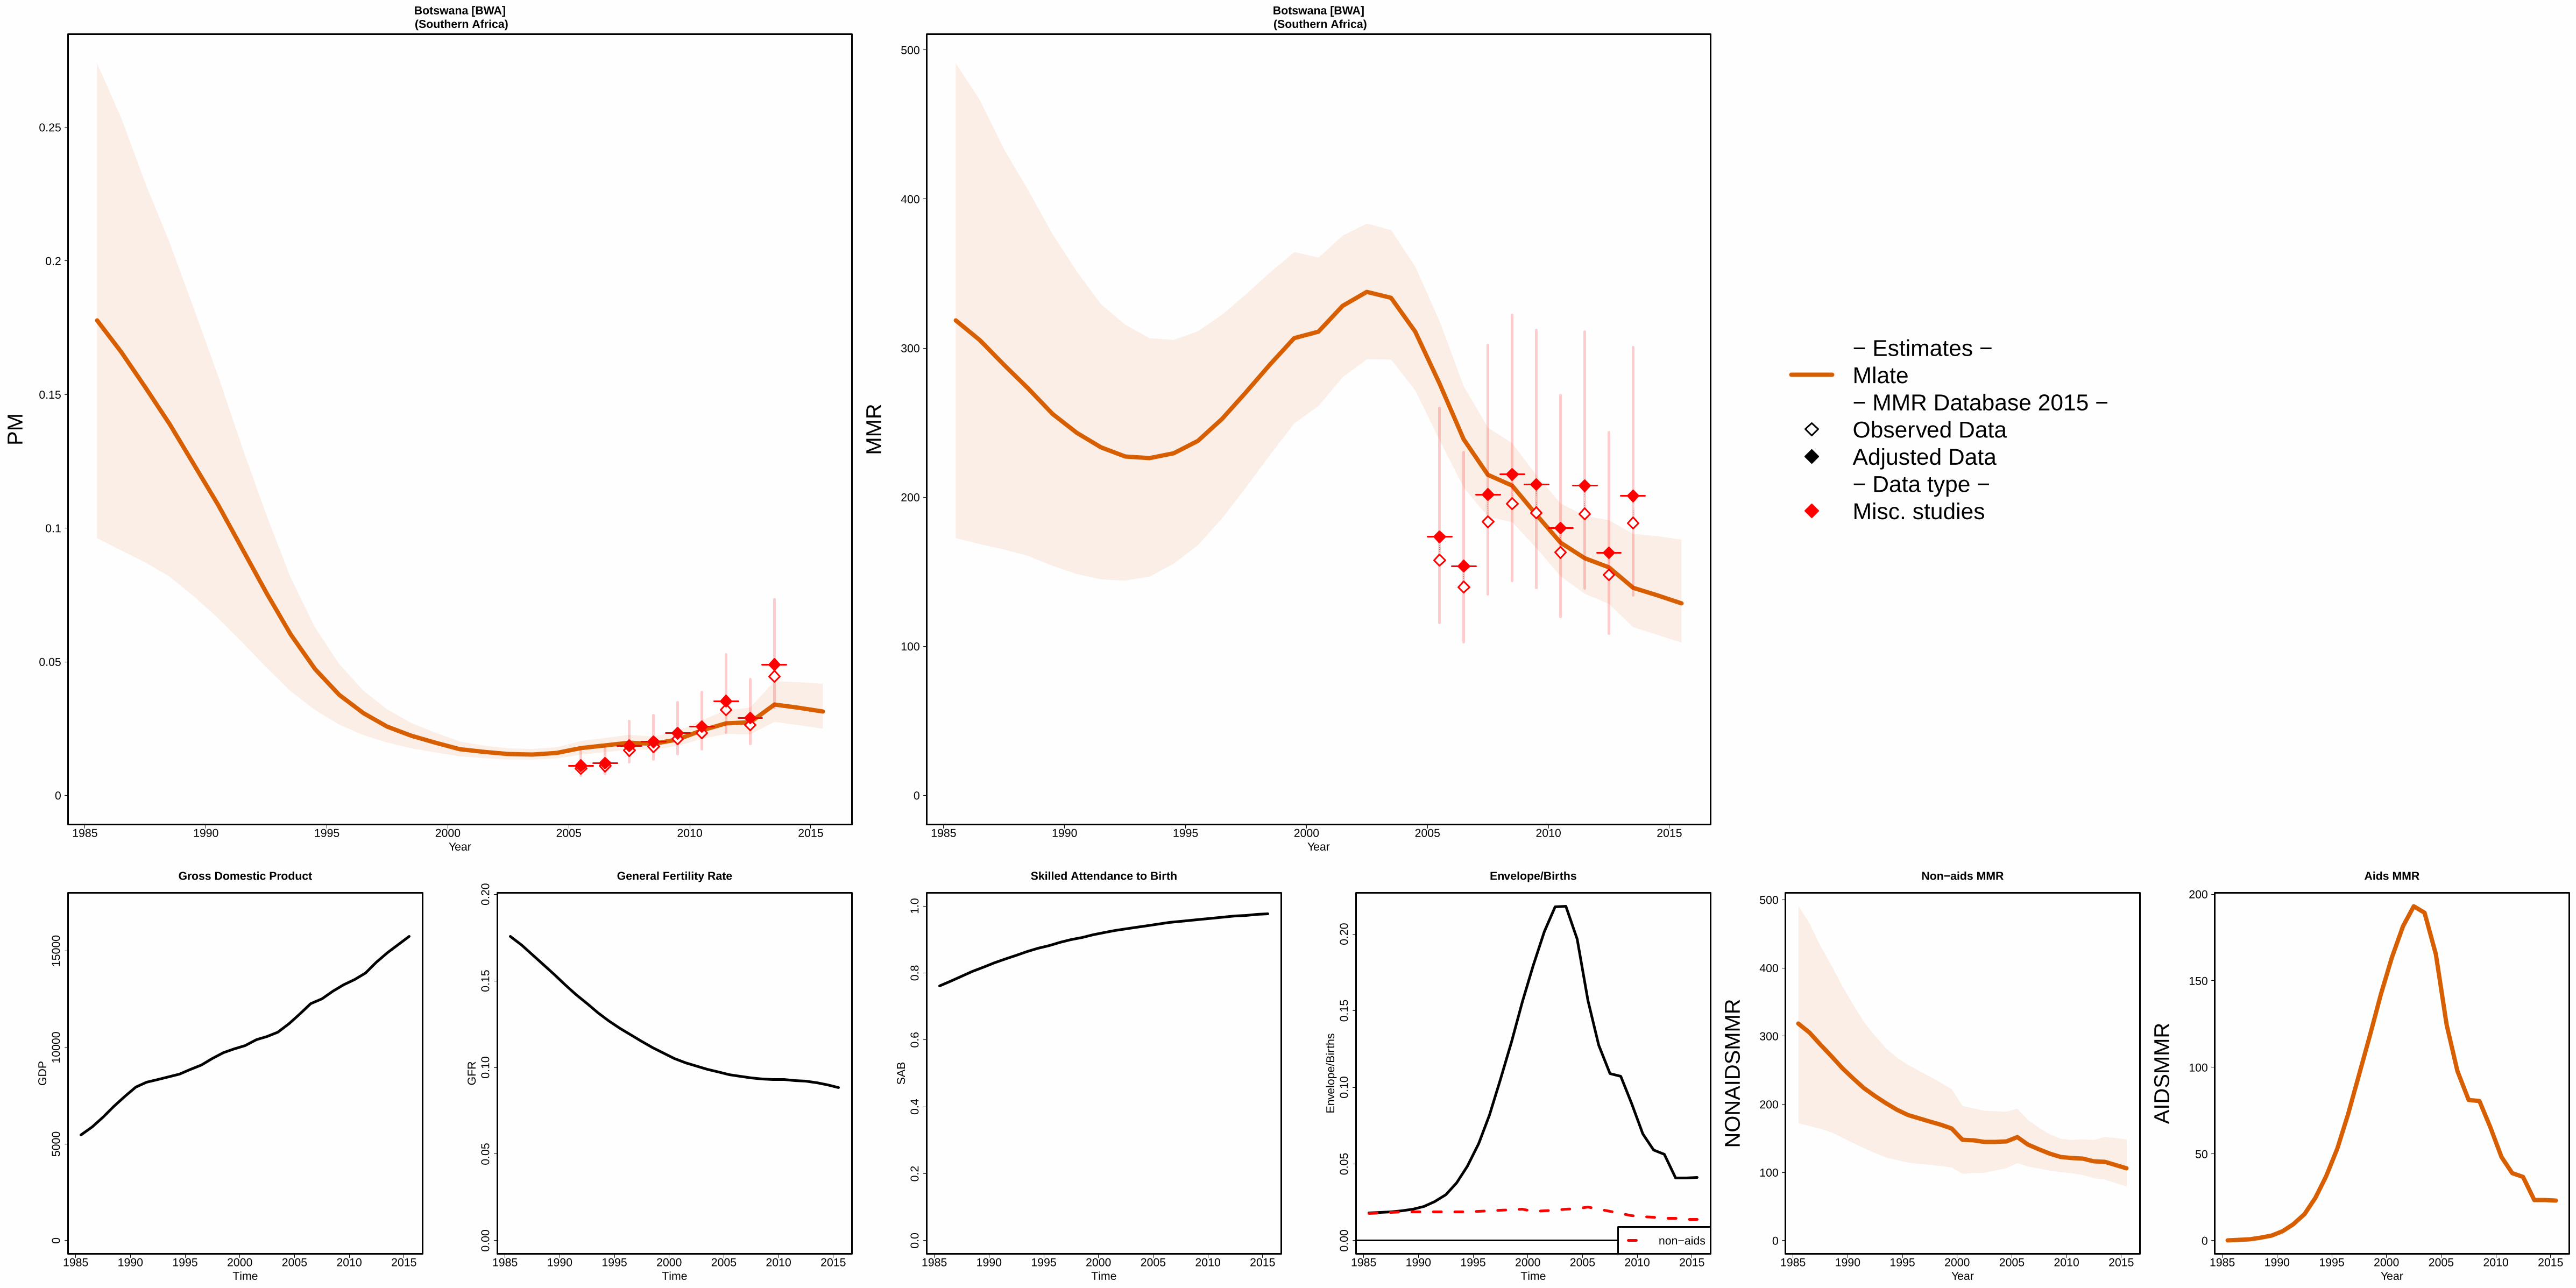
1985 1990 1995 2000 2005 2010 2015
Botswana [BWA] (Southern Africa)
Year
0
0.05
0.1
0.15
0.2
0.25
PM
1985 1990 1995 2000 2005 2010 2015
Botswana [BWA] (Southern Africa)
Year
0
100
200
300
400
500
MM
R
− Estimates −Mlate− MMR Database 2015 −Observed DataAdjusted Data− Data type −Misc. studies
1985 1990 1995 2000 2005 2010 2015
050
0010
000
1500
0
Gross Domestic Product
Time
GD
P
1985 1990 1995 2000 2005 2010 2015
0.00
0.05
0.10
0.15
0.20
General Fertility Rate
Time
GF
R
1985 1990 1995 2000 2005 2010 2015
0.0
0.2
0.4
0.6
0.8
1.0
Skilled Attendance to Birth
Time
SA
B
1985 1990 1995 2000 2005 2010 2015
0.00
0.05
0.10
0.15
0.20
Envelope/Births
Time
Env
elop
e/B
irth
s
non−aids
1985 1990 1995 2000 2005 2010 2015
Non−aids MMR
Year
0
100
200
300
400
500
NO
NA
IDS
MM
R
1985 1990 1995 2000 2005 2010 2015
Aids MMR
Year
0
50
100
150
200
AID
SM
MR

1985 1990 1995 2000 2005 2010 2015
Brazil [BRA] (South America)
Year
0
0.05
0.1
0.15
PM
1985 1990 1995 2000 2005 2010 2015
Brazil [BRA] (South America)
Year
0
50
100
150
200
250
300
MM
R
− Estimates −
Mlate
− MMR Database 2015 −
Observed Data
Adjusted Data
− Data type −
VR
Spec. studies
DHSExcluded VR data (overlap with specialized study)
1985 1990 1995 2000 2005 2010 2015
050
0010
000
1500
0
Gross Domestic Product
Time
GD
P
1985 1990 1995 2000 2005 2010 2015
0.00
0.02
0.04
0.06
0.08
0.10
0.12
General Fertility Rate
Time
GF
R
1985 1990 1995 2000 2005 2010 2015
0.0
0.2
0.4
0.6
0.8
1.0
Skilled Attendance to Birth
Time
SA
B
1985 1990 1995 2000 2005 2010 2015
0.00
00.
005
0.01
00.
015
0.02
00.
025
Envelope/Births
Time
Env
elop
e/B
irth
s
non−aids
1985 1990 1995 2000 2005 2010 2015
Non−aids MMR
Year
0
50
100
150
NO
NA
IDS
MM
R
1985 1990 1995 2000 2005 2010 2015
Aids MMR
Year
0
0.1
0.2
0.3
0.4
0.5
0.6
0.7
AID
SM
MR
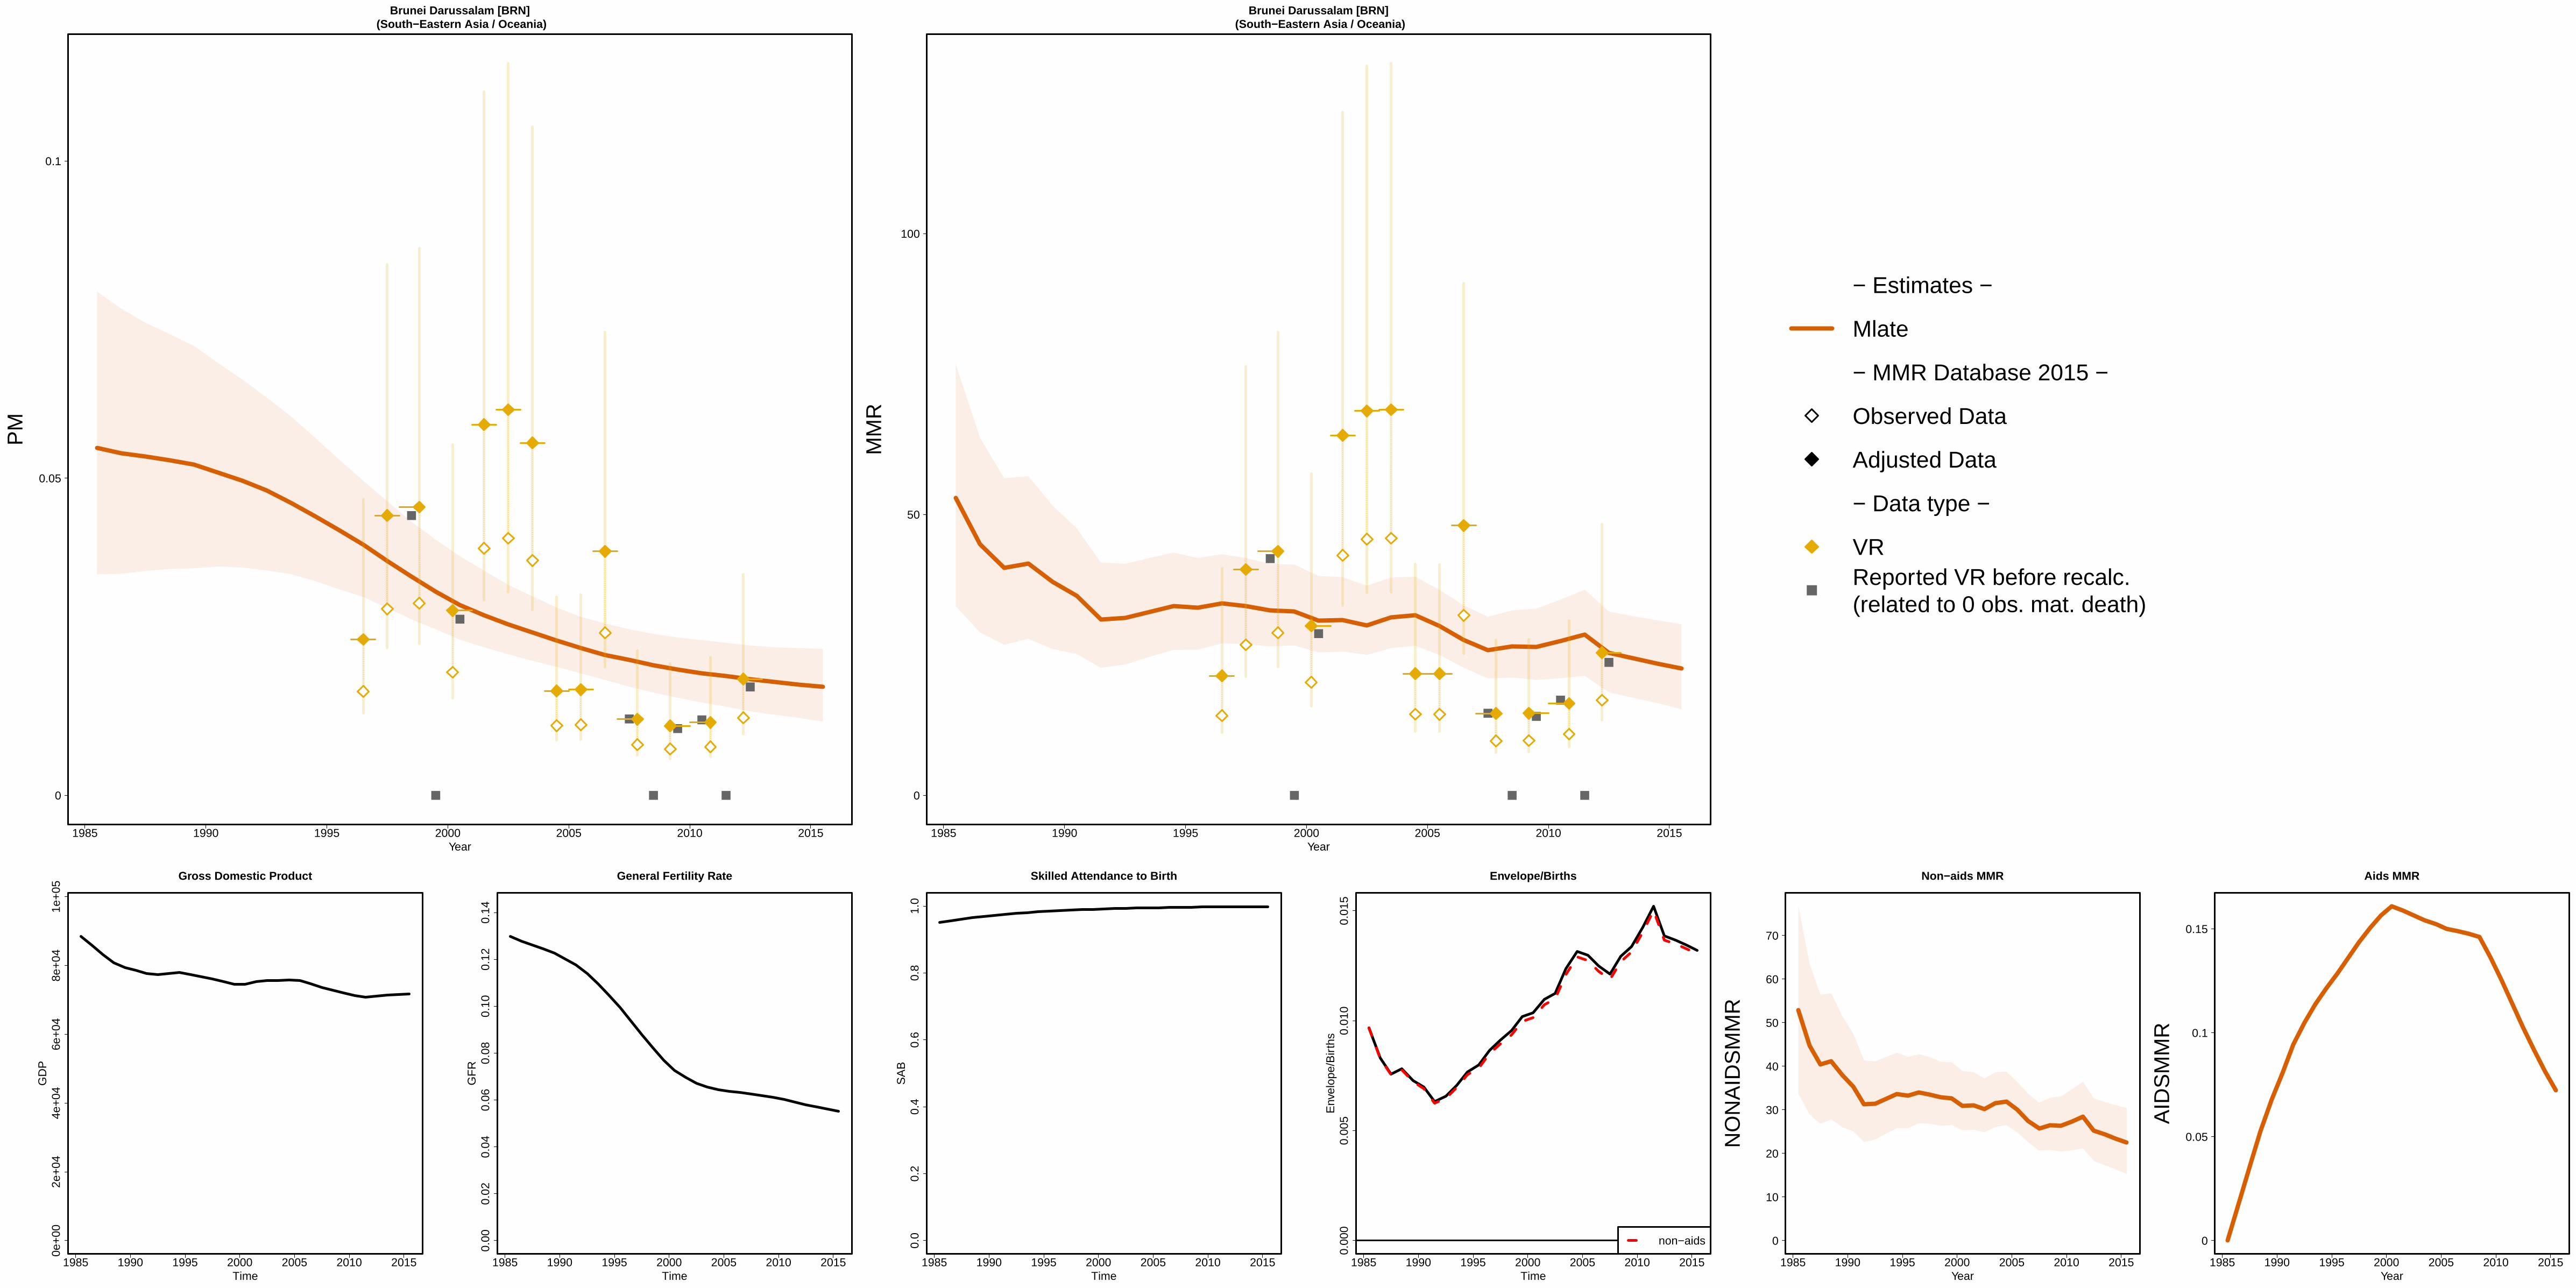
1985 1990 1995 2000 2005 2010 2015
Brunei Darussalam [BRN] (South−Eastern Asia / Oceania)
Year
0
0.05
0.1
PM
1985 1990 1995 2000 2005 2010 2015
Brunei Darussalam [BRN] (South−Eastern Asia / Oceania)
Year
0
50
100
MM
R
− Estimates −
Mlate
− MMR Database 2015 −
Observed Data
Adjusted Data
− Data type −
VRReported VR before recalc.(related to 0 obs. mat. death)
1985 1990 1995 2000 2005 2010 2015
0e+
002e
+04
4e+
046e
+04
8e+
041e
+05
Gross Domestic Product
Time
GD
P
1985 1990 1995 2000 2005 2010 2015
0.00
0.02
0.04
0.06
0.08
0.10
0.12
0.14
General Fertility Rate
Time
GF
R
1985 1990 1995 2000 2005 2010 2015
0.0
0.2
0.4
0.6
0.8
1.0
Skilled Attendance to Birth
Time
SA
B
1985 1990 1995 2000 2005 2010 2015
0.00
00.
005
0.01
00.
015
Envelope/Births
Time
Env
elop
e/B
irth
s
non−aids
1985 1990 1995 2000 2005 2010 2015
Non−aids MMR
Year
0
10
20
30
40
50
60
70
NO
NA
IDS
MM
R
1985 1990 1995 2000 2005 2010 2015
Aids MMR
Year
0
0.05
0.1
0.15
AID
SM
MR
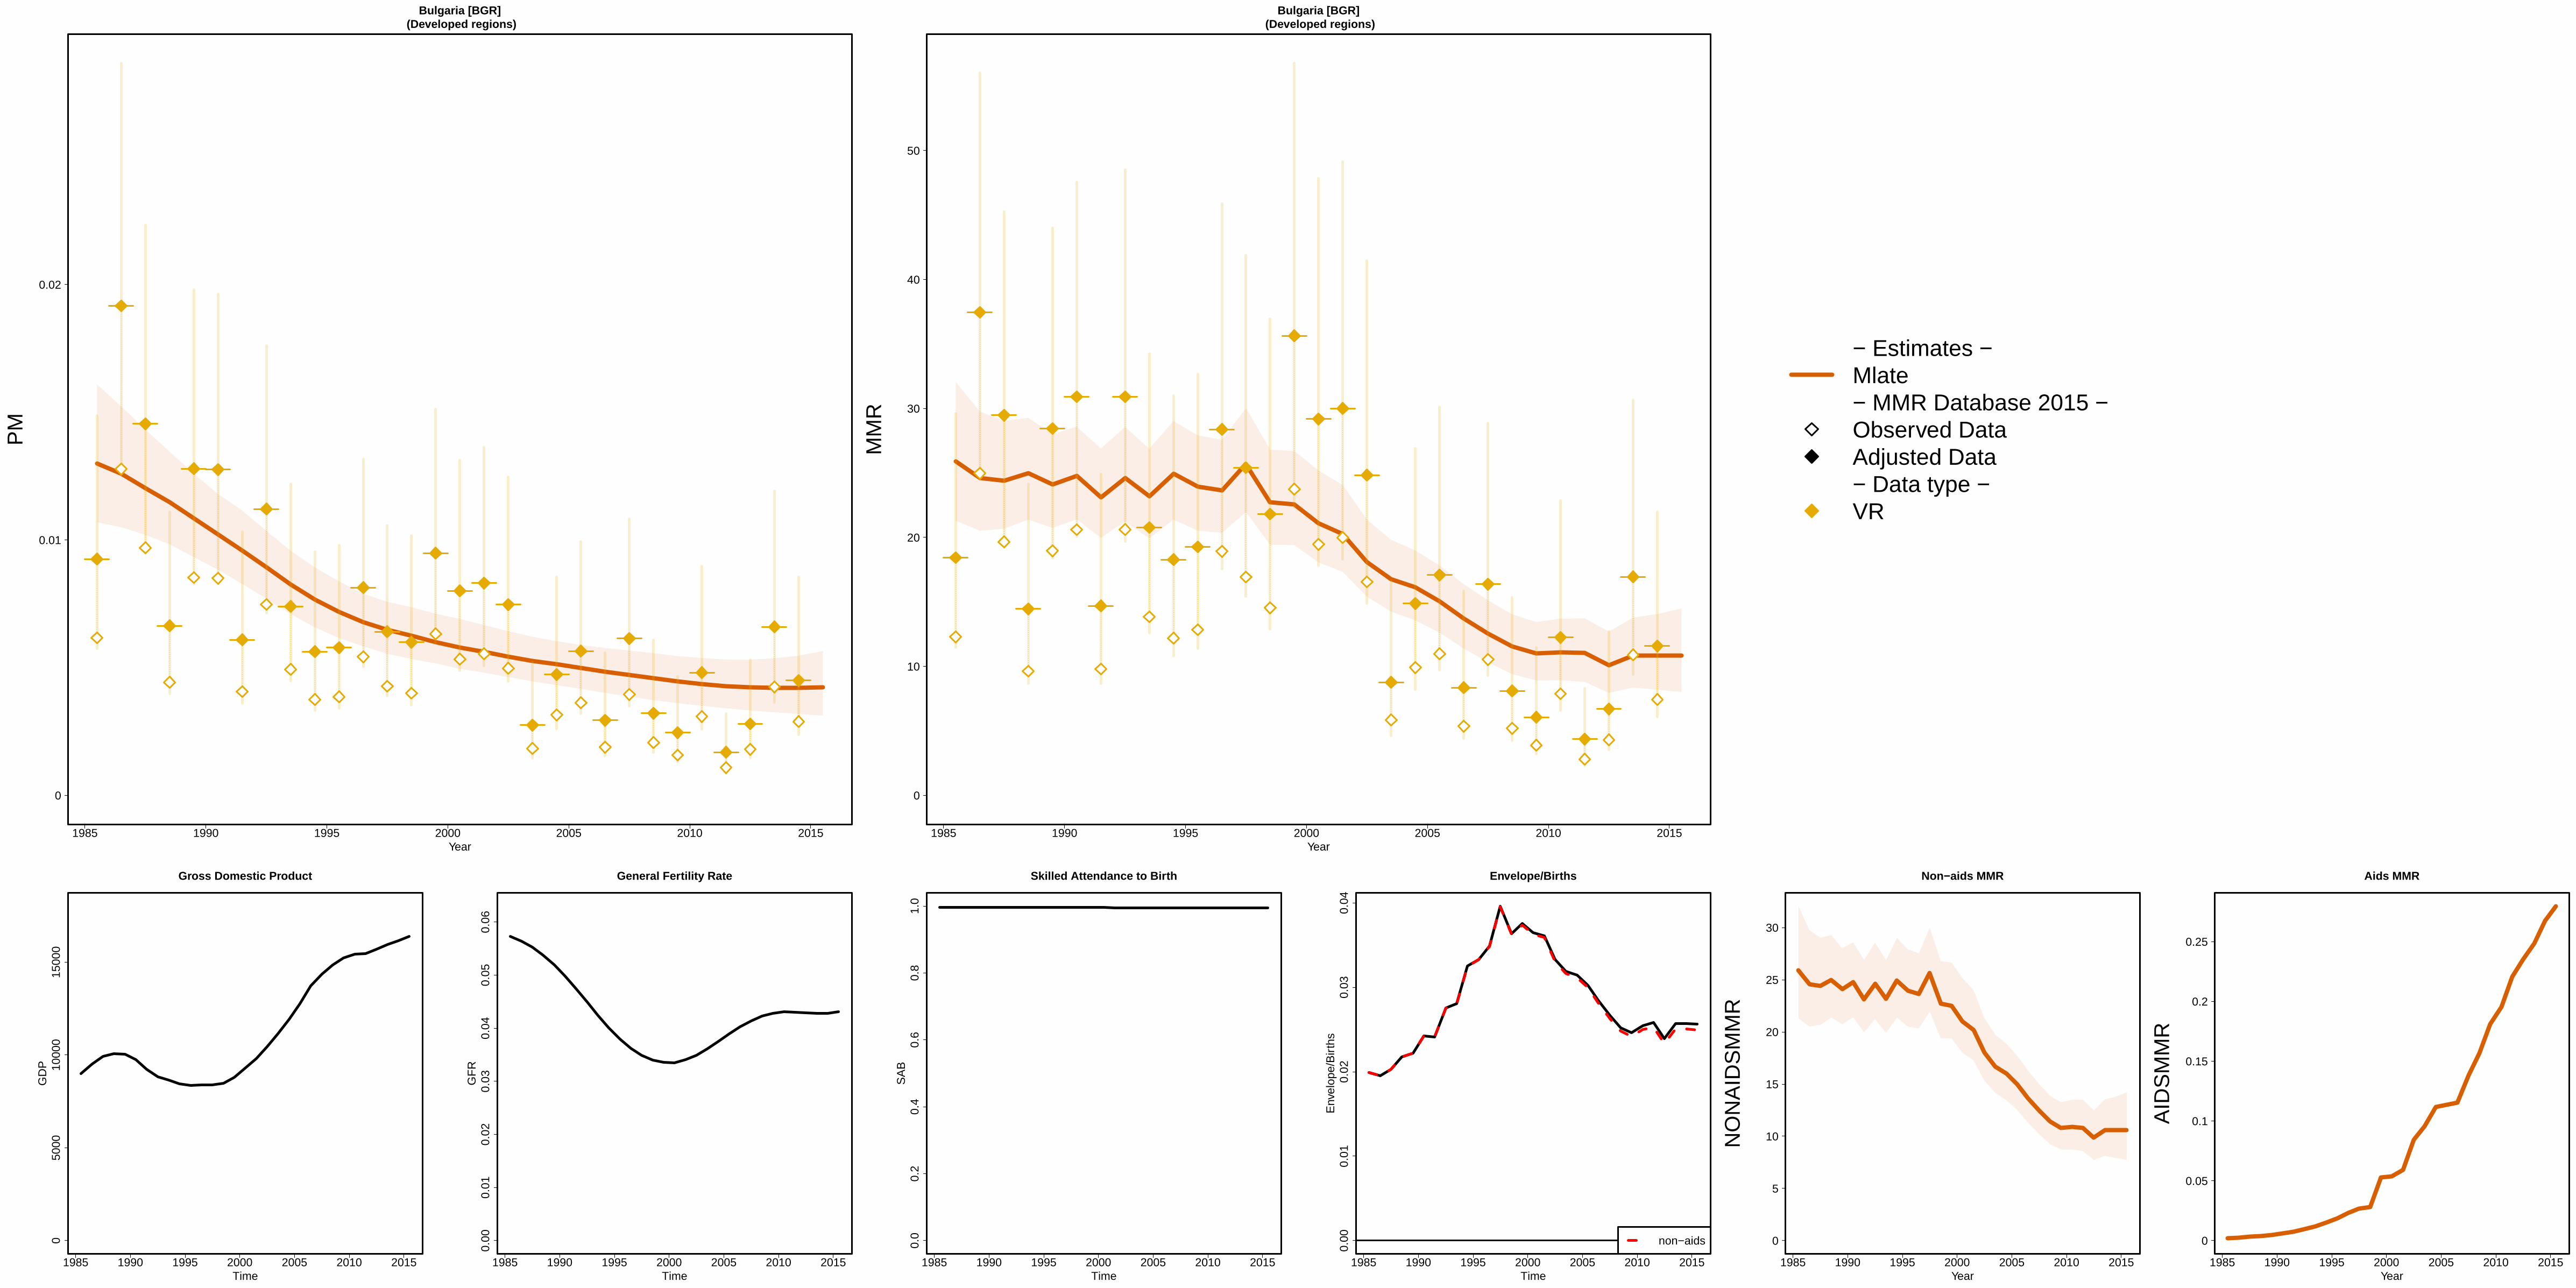
1985 1990 1995 2000 2005 2010 2015
Bulgaria [BGR] (Developed regions)
Year
0
0.01
0.02
PM
1985 1990 1995 2000 2005 2010 2015
Bulgaria [BGR] (Developed regions)
Year
0
10
20
30
40
50
MM
R
− Estimates −Mlate− MMR Database 2015 −Observed DataAdjusted Data− Data type −VR
1985 1990 1995 2000 2005 2010 2015
050
0010
000
1500
0
Gross Domestic Product
Time
GD
P
1985 1990 1995 2000 2005 2010 2015
0.00
0.01
0.02
0.03
0.04
0.05
0.06
General Fertility Rate
Time
GF
R
1985 1990 1995 2000 2005 2010 2015
0.0
0.2
0.4
0.6
0.8
1.0
Skilled Attendance to Birth
Time
SA
B
1985 1990 1995 2000 2005 2010 2015
0.00
0.01
0.02
0.03
0.04
Envelope/Births
Time
Env
elop
e/B
irth
s
non−aids
1985 1990 1995 2000 2005 2010 2015
Non−aids MMR
Year
0
5
10
15
20
25
30
NO
NA
IDS
MM
R
1985 1990 1995 2000 2005 2010 2015
Aids MMR
Year
0
0.05
0.1
0.15
0.2
0.25
AID
SM
MR

1985 1990 1995 2000 2005 2010 2015
Burkina Faso [BFA] (Western Africa)
Year
0
0.1
0.2
0.3
0.4
PM
1985 1990 1995 2000 2005 2010 2015
Burkina Faso [BFA] (Western Africa)
Year
0
500
1000
MM
R
− Estimates −Mlate− MMR Database 2015 −Observed DataAdjusted Data− Data type −DHSCensus
1985 1990 1995 2000 2005 2010 2015
050
010
0015
00
Gross Domestic Product
Time
GD
P
1985 1990 1995 2000 2005 2010 2015
0.00
0.05
0.10
0.15
0.20
General Fertility Rate
Time
GF
R
1985 1990 1995 2000 2005 2010 2015
0.0
0.2
0.4
0.6
0.8
1.0
Skilled Attendance to Birth
Time
SA
B
1985 1990 1995 2000 2005 2010 2015
0.00
0.01
0.02
0.03
Envelope/Births
Time
Env
elop
e/B
irth
s
non−aids
1985 1990 1995 2000 2005 2010 2015
Non−aids MMR
Year
0
500
1000
NO
NA
IDS
MM
R
1985 1990 1995 2000 2005 2010 2015
Aids MMR
Year
0
5
10
15
20
25
30
AID
SM
MR
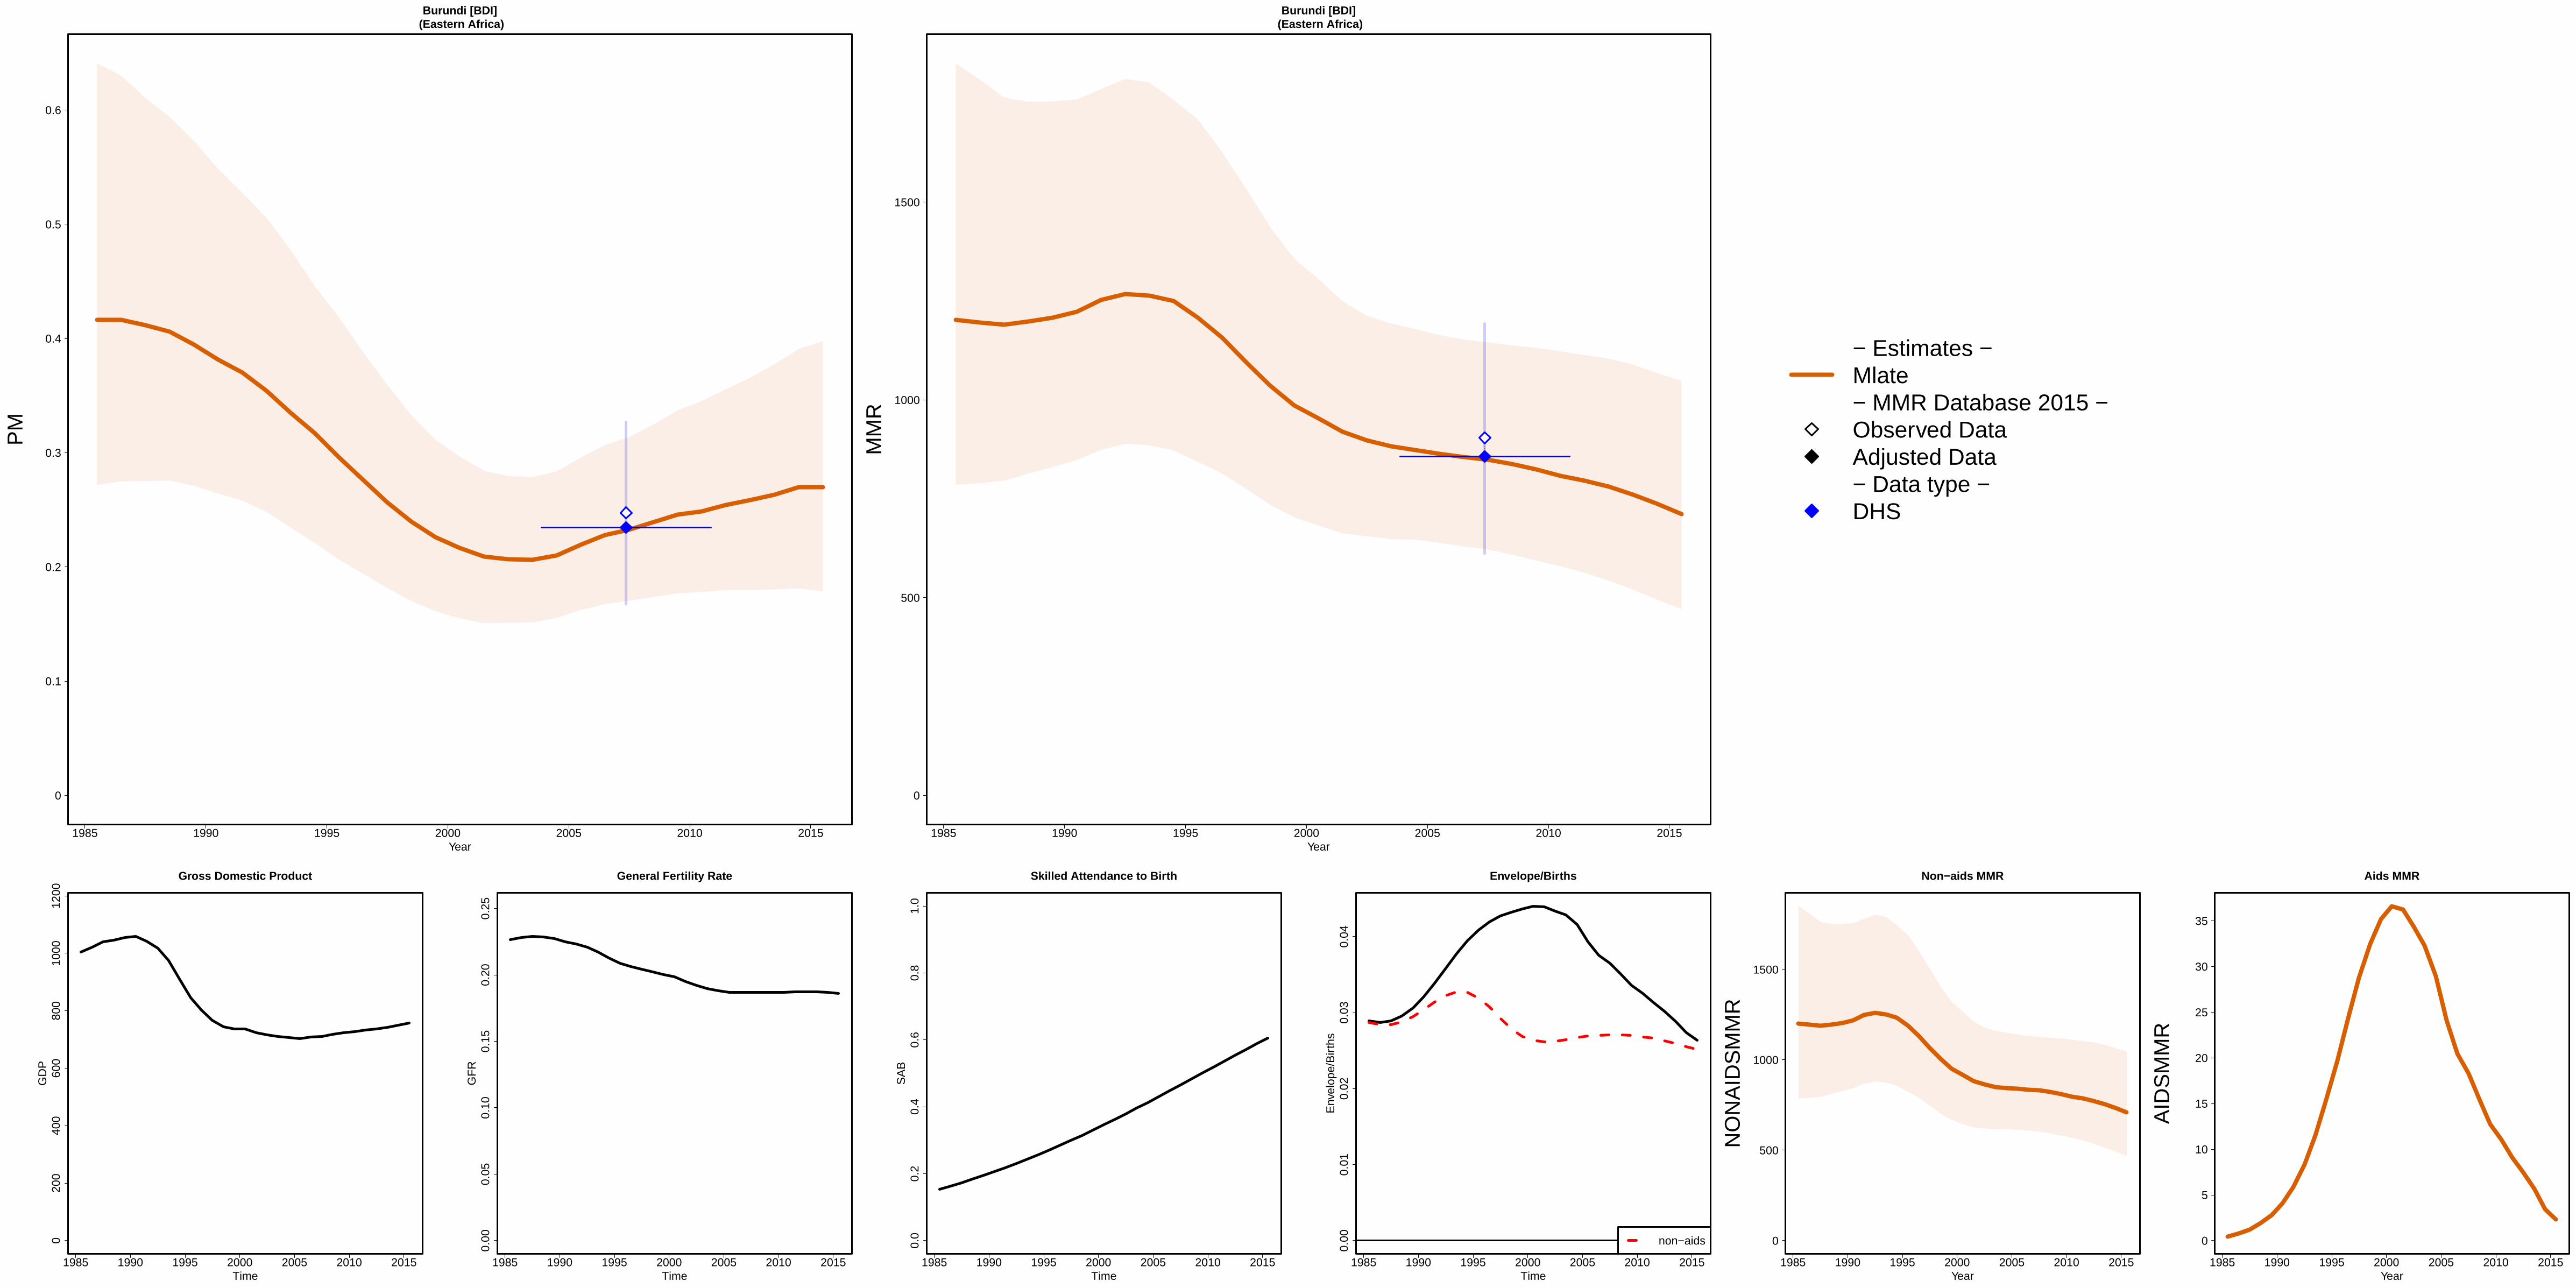
1985 1990 1995 2000 2005 2010 2015
Burundi [BDI] (Eastern Africa)
Year
0
0.1
0.2
0.3
0.4
0.5
0.6
PM
1985 1990 1995 2000 2005 2010 2015
Burundi [BDI] (Eastern Africa)
Year
0
500
1000
1500
MM
R
− Estimates −Mlate− MMR Database 2015 −Observed DataAdjusted Data− Data type −DHS
1985 1990 1995 2000 2005 2010 2015
020
040
060
080
010
0012
00
Gross Domestic Product
Time
GD
P
1985 1990 1995 2000 2005 2010 2015
0.00
0.05
0.10
0.15
0.20
0.25
General Fertility Rate
Time
GF
R
1985 1990 1995 2000 2005 2010 2015
0.0
0.2
0.4
0.6
0.8
1.0
Skilled Attendance to Birth
Time
SA
B
1985 1990 1995 2000 2005 2010 2015
0.00
0.01
0.02
0.03
0.04
Envelope/Births
Time
Env
elop
e/B
irth
s
non−aids
1985 1990 1995 2000 2005 2010 2015
Non−aids MMR
Year
0
500
1000
1500
NO
NA
IDS
MM
R
1985 1990 1995 2000 2005 2010 2015
Aids MMR
Year
0
5
10
15
20
25
30
35
AID
SM
MR

1985 1990 1995 2000 2005 2010 2015
Cabo Verde [CPV] (Western Africa)
Year
0
0.1
0.2
0.3
0.4
PM
●
●
1985 1990 1995 2000 2005 2010 2015
Cabo Verde [CPV] (Western Africa)
Year
0
100
200
300
400
500
600
700
MM
R
●
●
●
− Estimates −
Mlate
− MMR Database 2015 −
Observed Data
Adjusted Data
− Data type −Excluded VR data (data quality issues)
1985 1990 1995 2000 2005 2010 2015
010
0020
0030
0040
0050
0060
0070
00
Gross Domestic Product
Time
GD
P
1985 1990 1995 2000 2005 2010 2015
0.00
0.05
0.10
0.15
0.20
General Fertility Rate
Time
GF
R
1985 1990 1995 2000 2005 2010 2015
0.0
0.2
0.4
0.6
0.8
1.0
Skilled Attendance to Birth
Time
SA
B
1985 1990 1995 2000 2005 2010 2015
0.00
00.
005
0.01
00.
015
Envelope/Births
Time
Env
elop
e/B
irth
s
non−aids
1985 1990 1995 2000 2005 2010 2015
Non−aids MMR
Year
0
100
200
300
400
500
600
700
NO
NA
IDS
MM
R
1985 1990 1995 2000 2005 2010 2015
Aids MMR
Year
AID
SM
MR
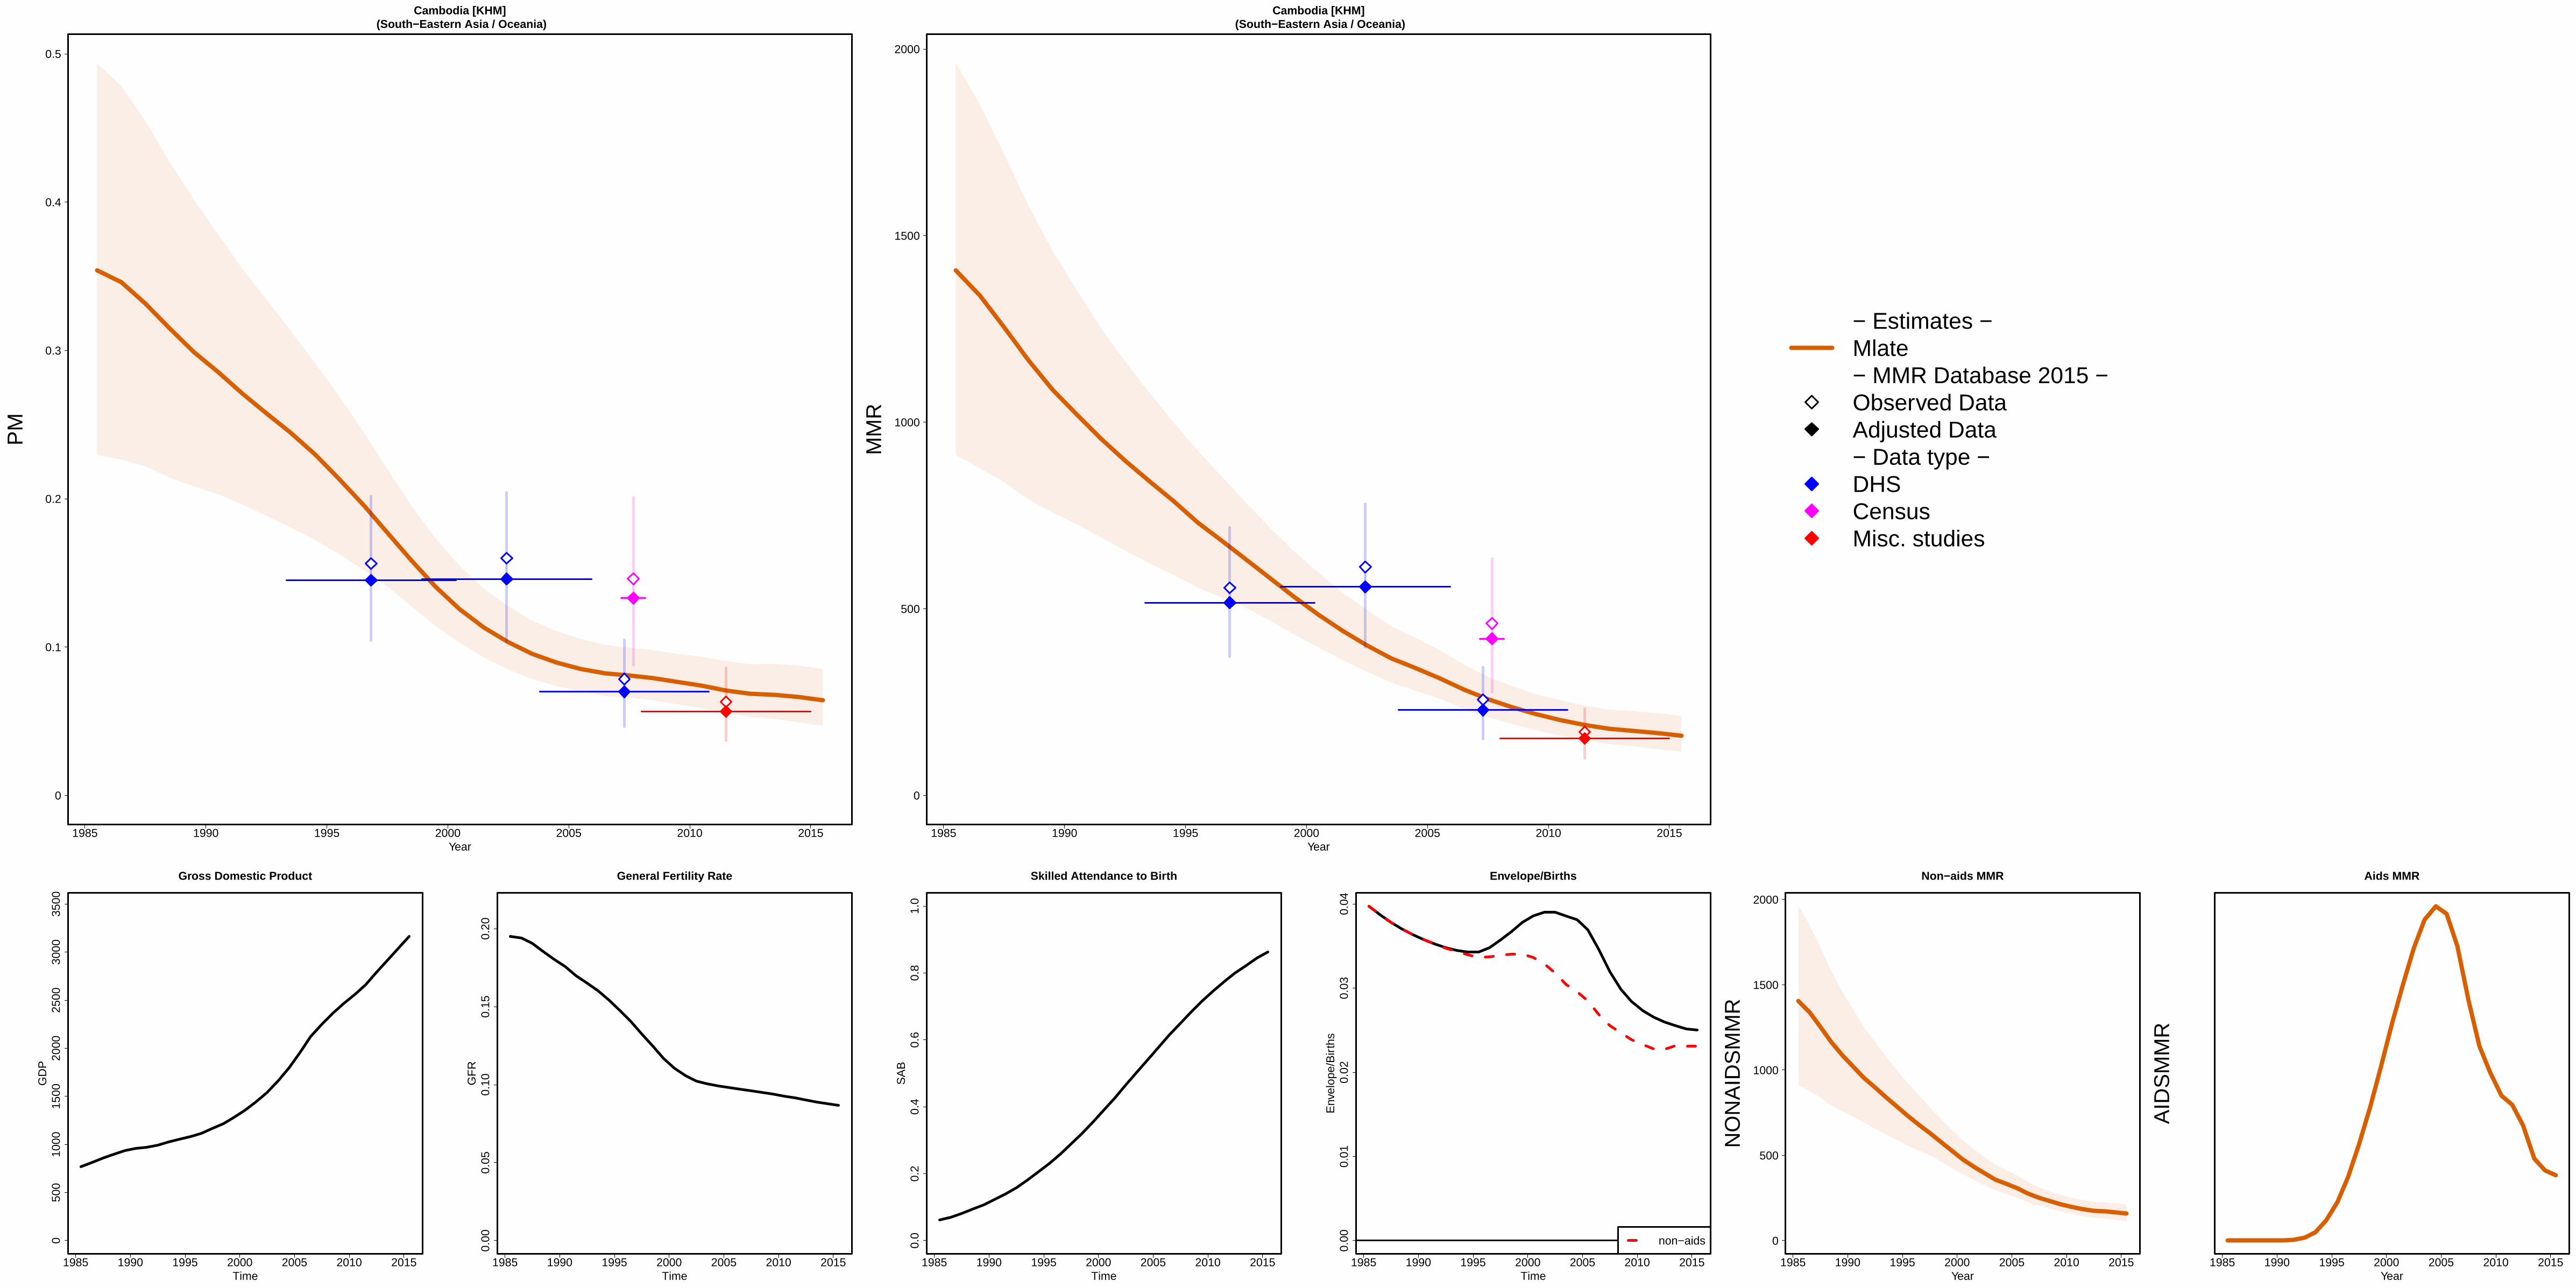
1985 1990 1995 2000 2005 2010 2015
Cambodia [KHM] (South−Eastern Asia / Oceania)
Year
0
0.1
0.2
0.3
0.4
0.5
PM
1985 1990 1995 2000 2005 2010 2015
Cambodia [KHM] (South−Eastern Asia / Oceania)
Year
0
500
1000
1500
2000
MM
R
− Estimates −Mlate− MMR Database 2015 −Observed DataAdjusted Data− Data type −DHSCensusMisc. studies
1985 1990 1995 2000 2005 2010 2015
050
010
0015
0020
0025
0030
0035
00
Gross Domestic Product
Time
GD
P
1985 1990 1995 2000 2005 2010 2015
0.00
0.05
0.10
0.15
0.20
General Fertility Rate
Time
GF
R
1985 1990 1995 2000 2005 2010 2015
0.0
0.2
0.4
0.6
0.8
1.0
Skilled Attendance to Birth
Time
SA
B
1985 1990 1995 2000 2005 2010 2015
0.00
0.01
0.02
0.03
0.04
Envelope/Births
Time
Env
elop
e/B
irth
s
non−aids
1985 1990 1995 2000 2005 2010 2015
Non−aids MMR
Year
0
500
1000
1500
2000
NO
NA
IDS
MM
R
1985 1990 1995 2000 2005 2010 2015
Aids MMR
Year
AID
SM
MR
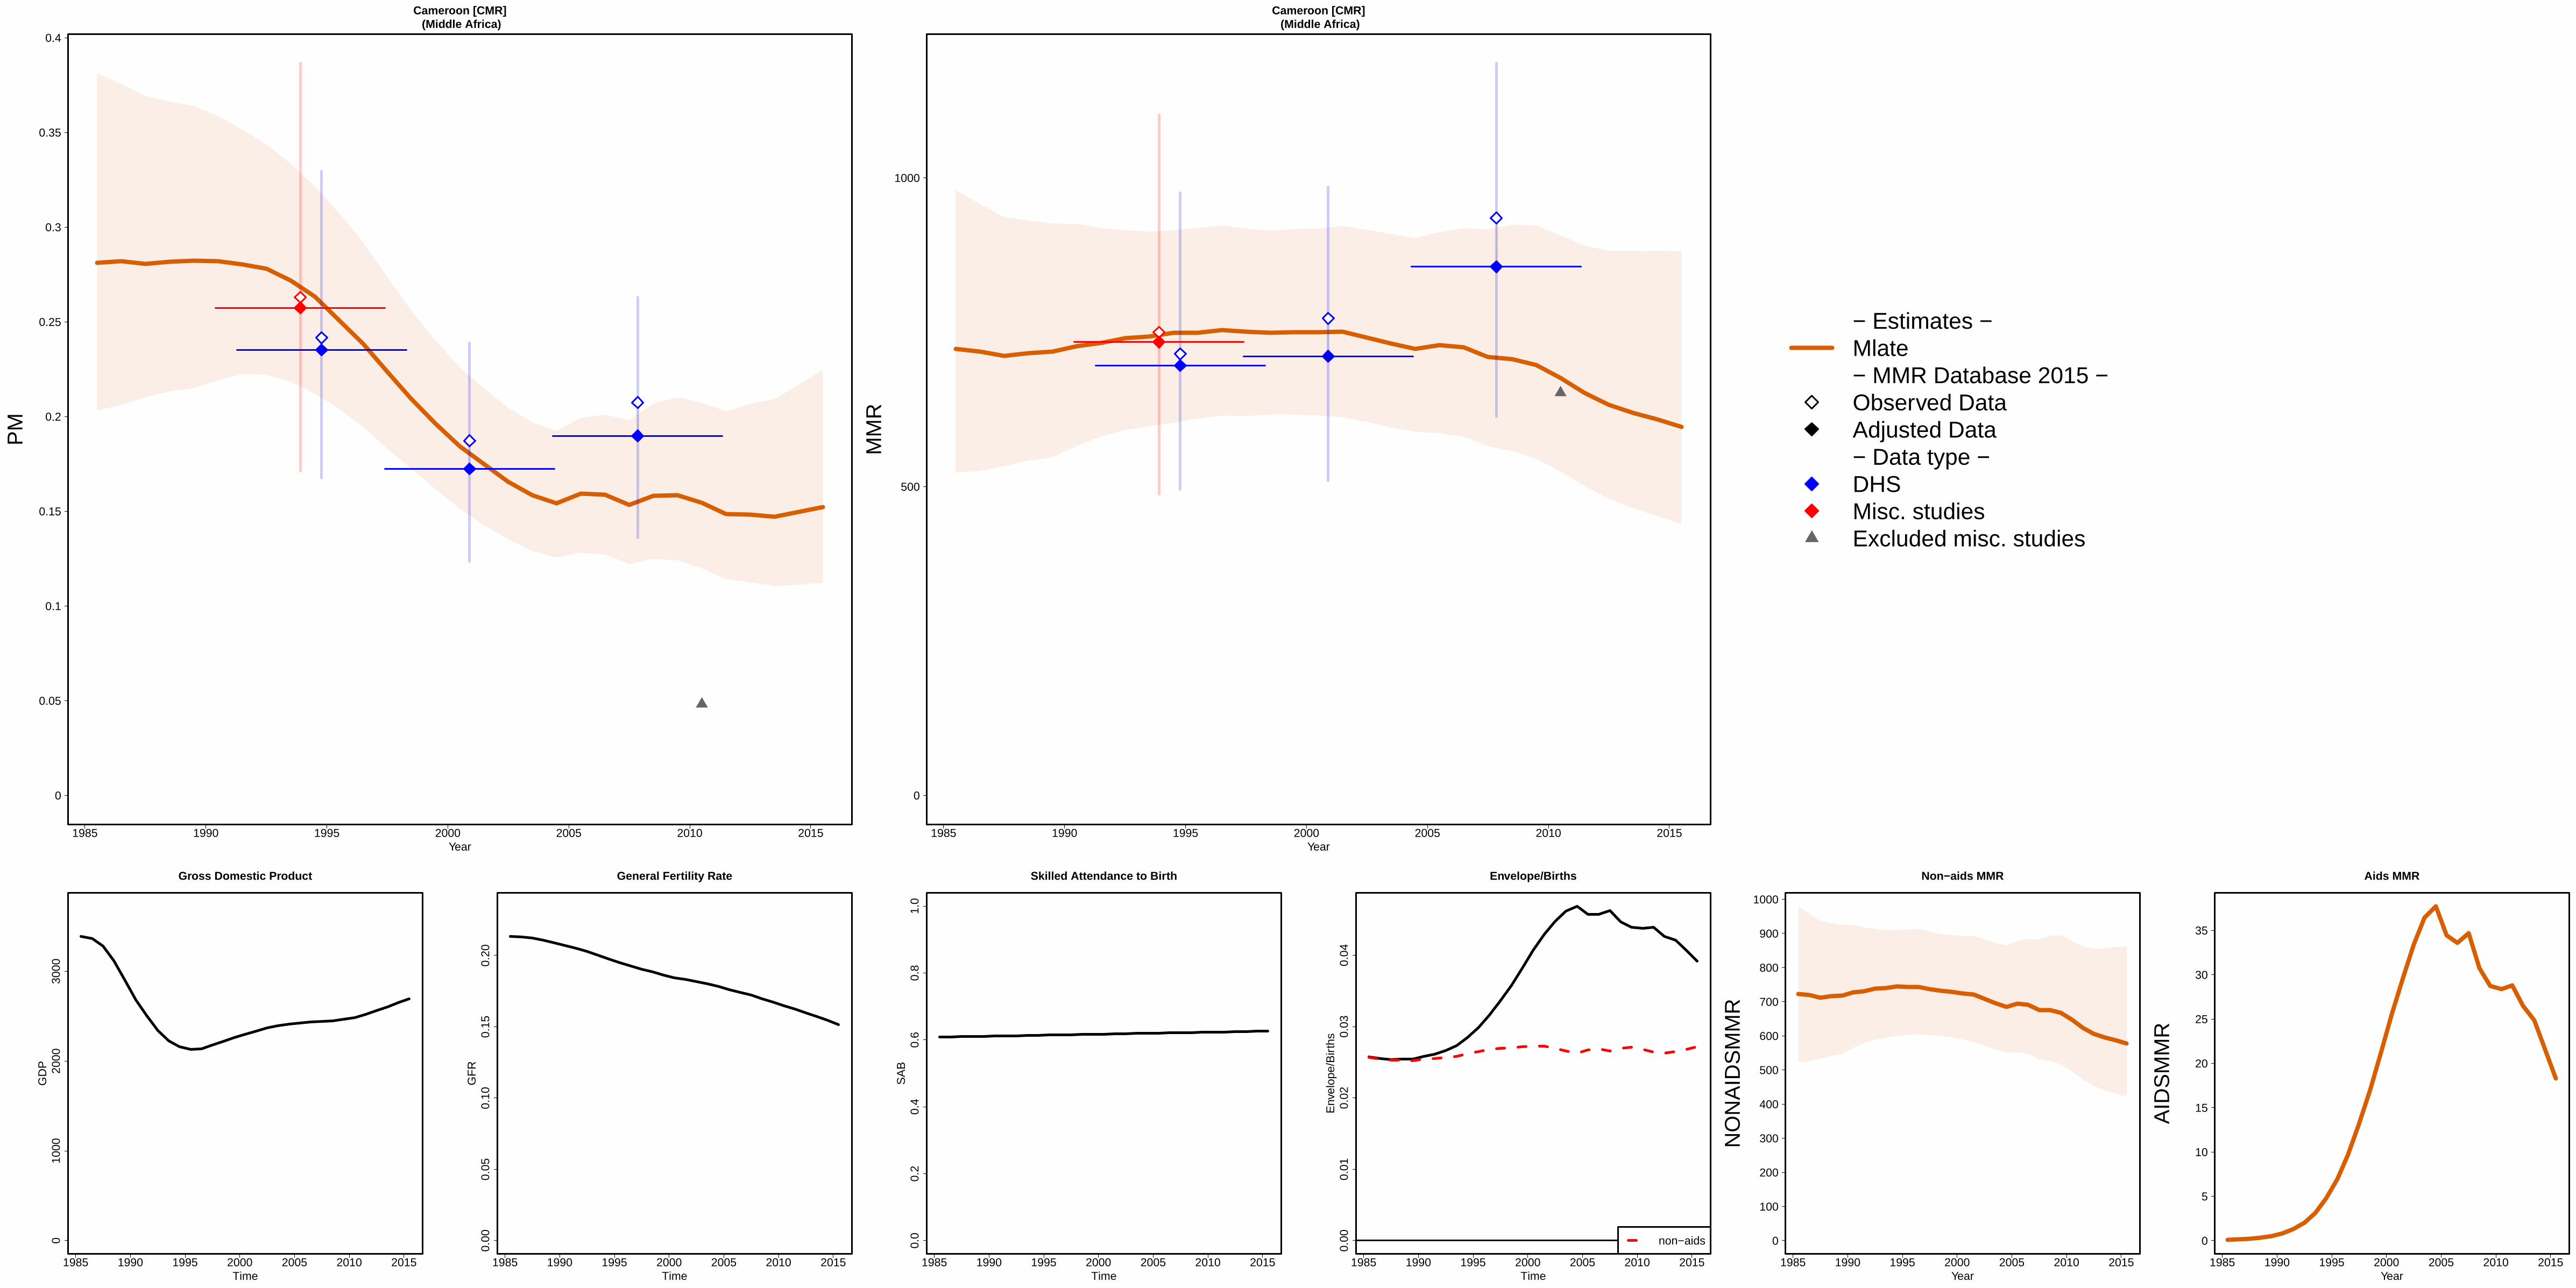
1985 1990 1995 2000 2005 2010 2015
Cameroon [CMR] (Middle Africa)
Year
0
0.05
0.1
0.15
0.2
0.25
0.3
0.35
0.4
PM
1985 1990 1995 2000 2005 2010 2015
Cameroon [CMR] (Middle Africa)
Year
0
500
1000
MM
R
− Estimates −Mlate− MMR Database 2015 −Observed DataAdjusted Data− Data type −DHSMisc. studiesExcluded misc. studies
1985 1990 1995 2000 2005 2010 2015
010
0020
0030
00
Gross Domestic Product
Time
GD
P
1985 1990 1995 2000 2005 2010 2015
0.00
0.05
0.10
0.15
0.20
General Fertility Rate
Time
GF
R
1985 1990 1995 2000 2005 2010 2015
0.0
0.2
0.4
0.6
0.8
1.0
Skilled Attendance to Birth
Time
SA
B
1985 1990 1995 2000 2005 2010 2015
0.00
0.01
0.02
0.03
0.04
Envelope/Births
Time
Env
elop
e/B
irth
s
non−aids
1985 1990 1995 2000 2005 2010 2015
Non−aids MMR
Year
0
100
200
300
400
500
600
700
800
900
1000
NO
NA
IDS
MM
R
1985 1990 1995 2000 2005 2010 2015
Aids MMR
Year
0
5
10
15
20
25
30
35
AID
SM
MR
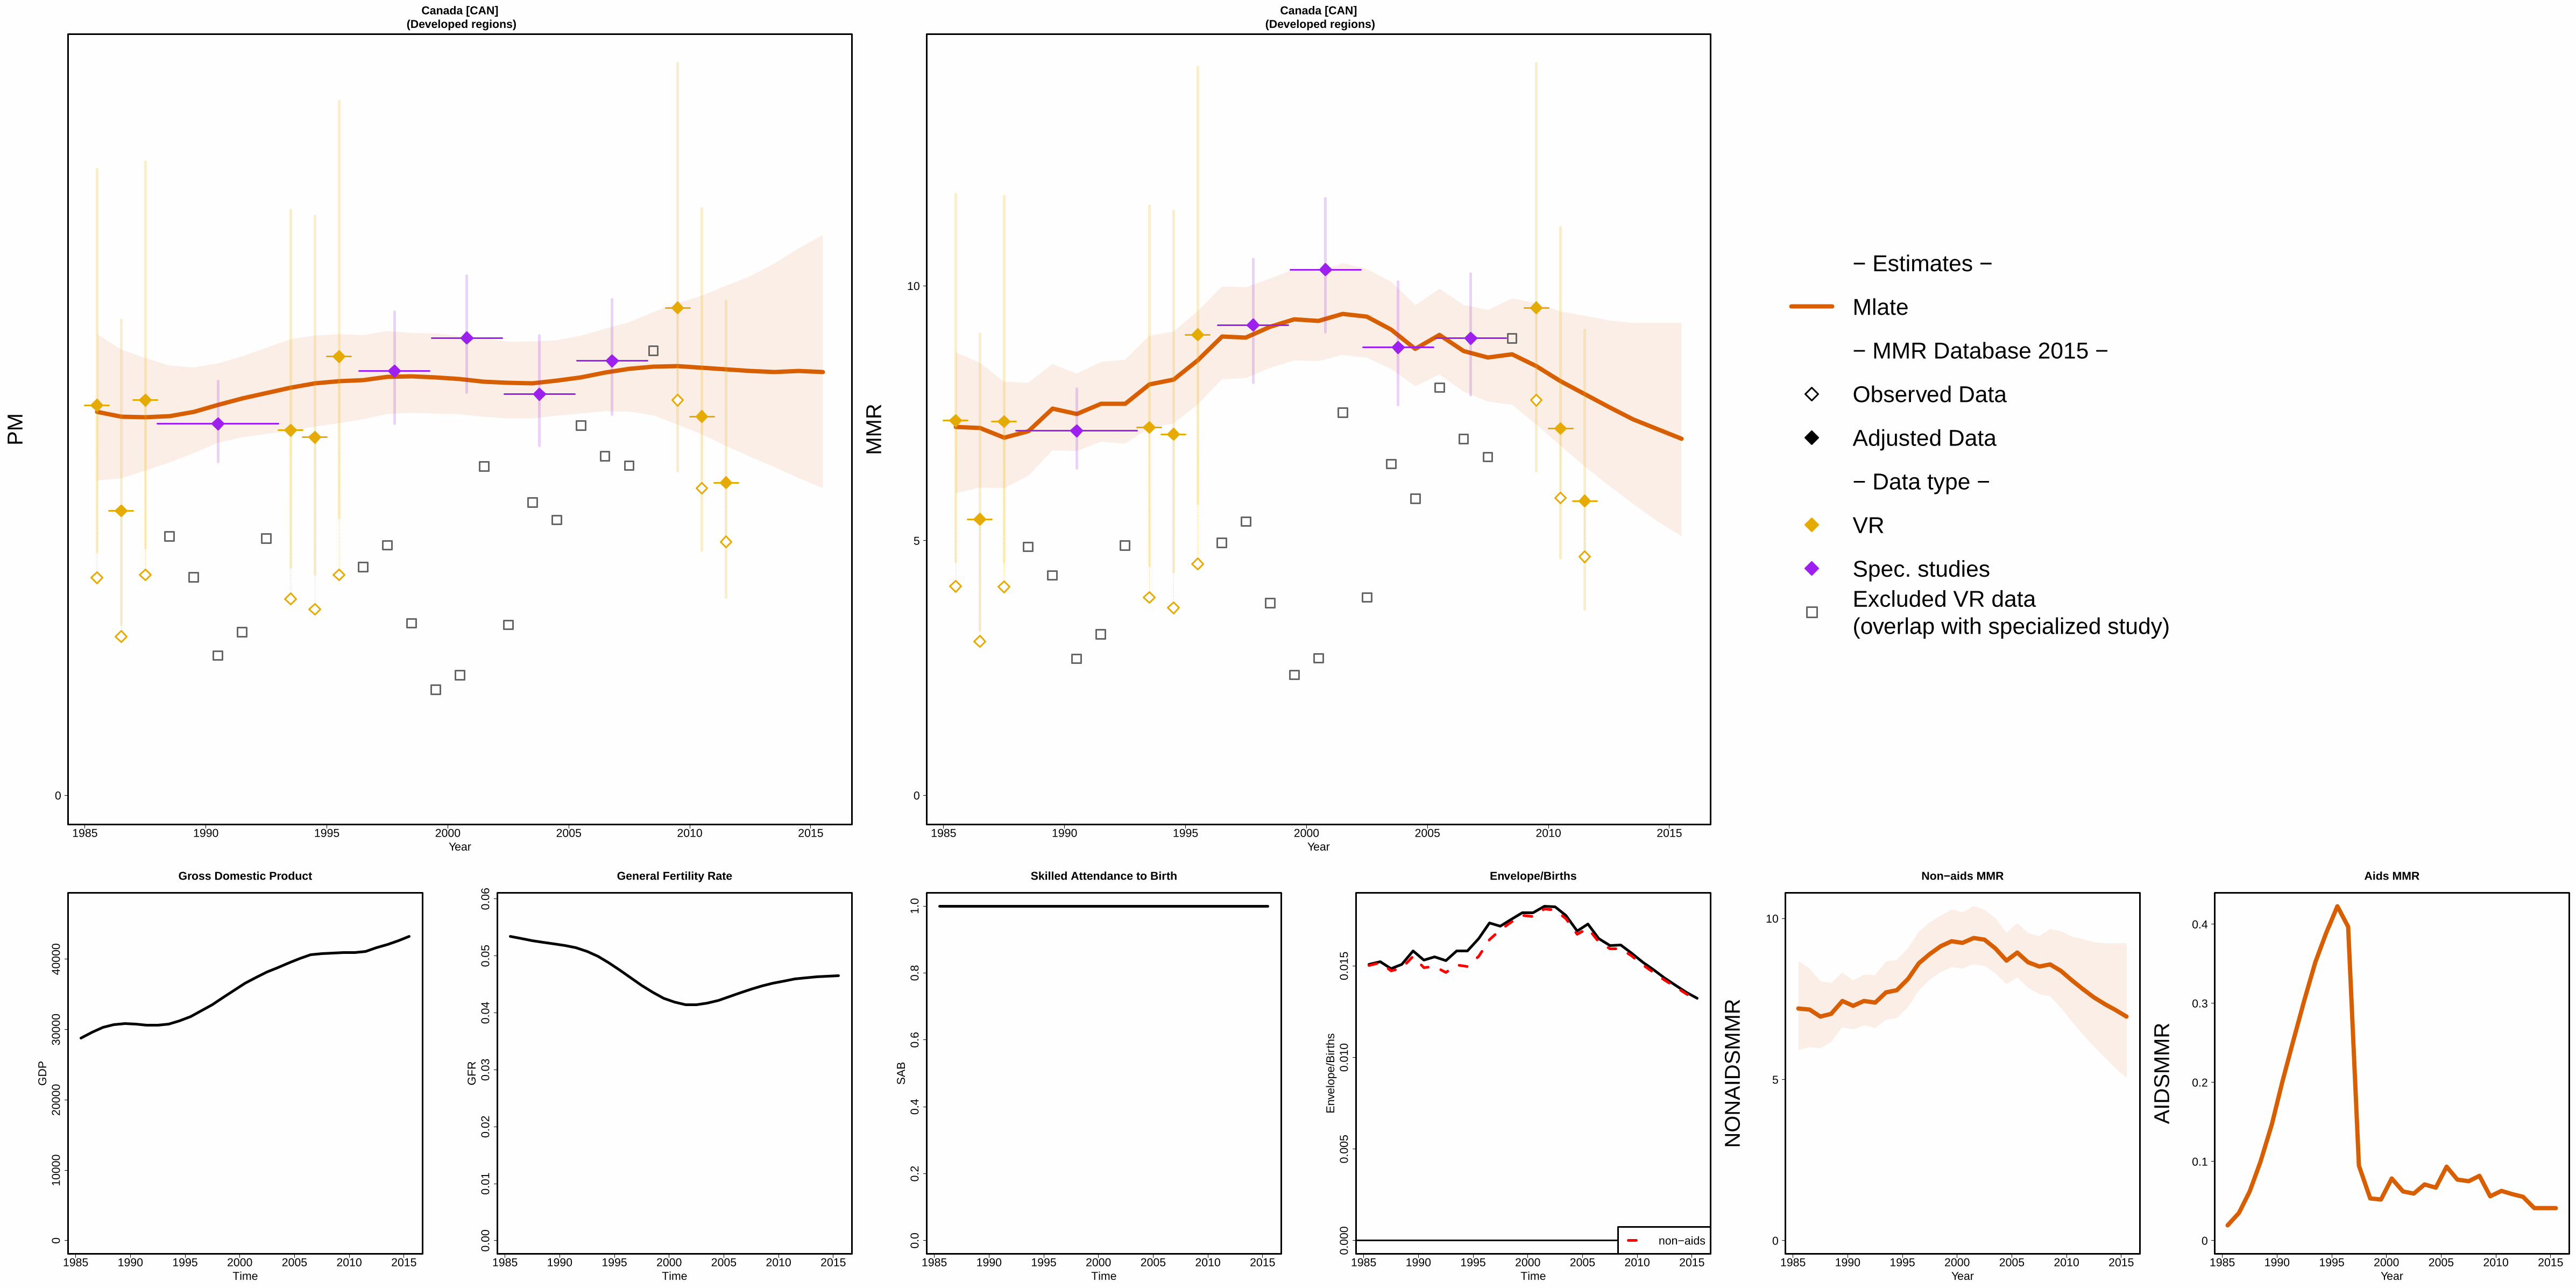
1985 1990 1995 2000 2005 2010 2015
Canada [CAN] (Developed regions)
Year
0
PM
1985 1990 1995 2000 2005 2010 2015
Canada [CAN] (Developed regions)
Year
0
5
10
MM
R
− Estimates −
Mlate
− MMR Database 2015 −
Observed Data
Adjusted Data
− Data type −
VR
Spec. studiesExcluded VR data (overlap with specialized study)
1985 1990 1995 2000 2005 2010 2015
010
000
2000
030
000
4000
0
Gross Domestic Product
Time
GD
P
1985 1990 1995 2000 2005 2010 2015
0.00
0.01
0.02
0.03
0.04
0.05
0.06
General Fertility Rate
Time
GF
R
1985 1990 1995 2000 2005 2010 2015
0.0
0.2
0.4
0.6
0.8
1.0
Skilled Attendance to Birth
Time
SA
B
1985 1990 1995 2000 2005 2010 2015
0.00
00.
005
0.01
00.
015
Envelope/Births
Time
Env
elop
e/B
irth
s
non−aids
1985 1990 1995 2000 2005 2010 2015
Non−aids MMR
Year
0
5
10
NO
NA
IDS
MM
R
1985 1990 1995 2000 2005 2010 2015
Aids MMR
Year
0
0.1
0.2
0.3
0.4
AID
SM
MR
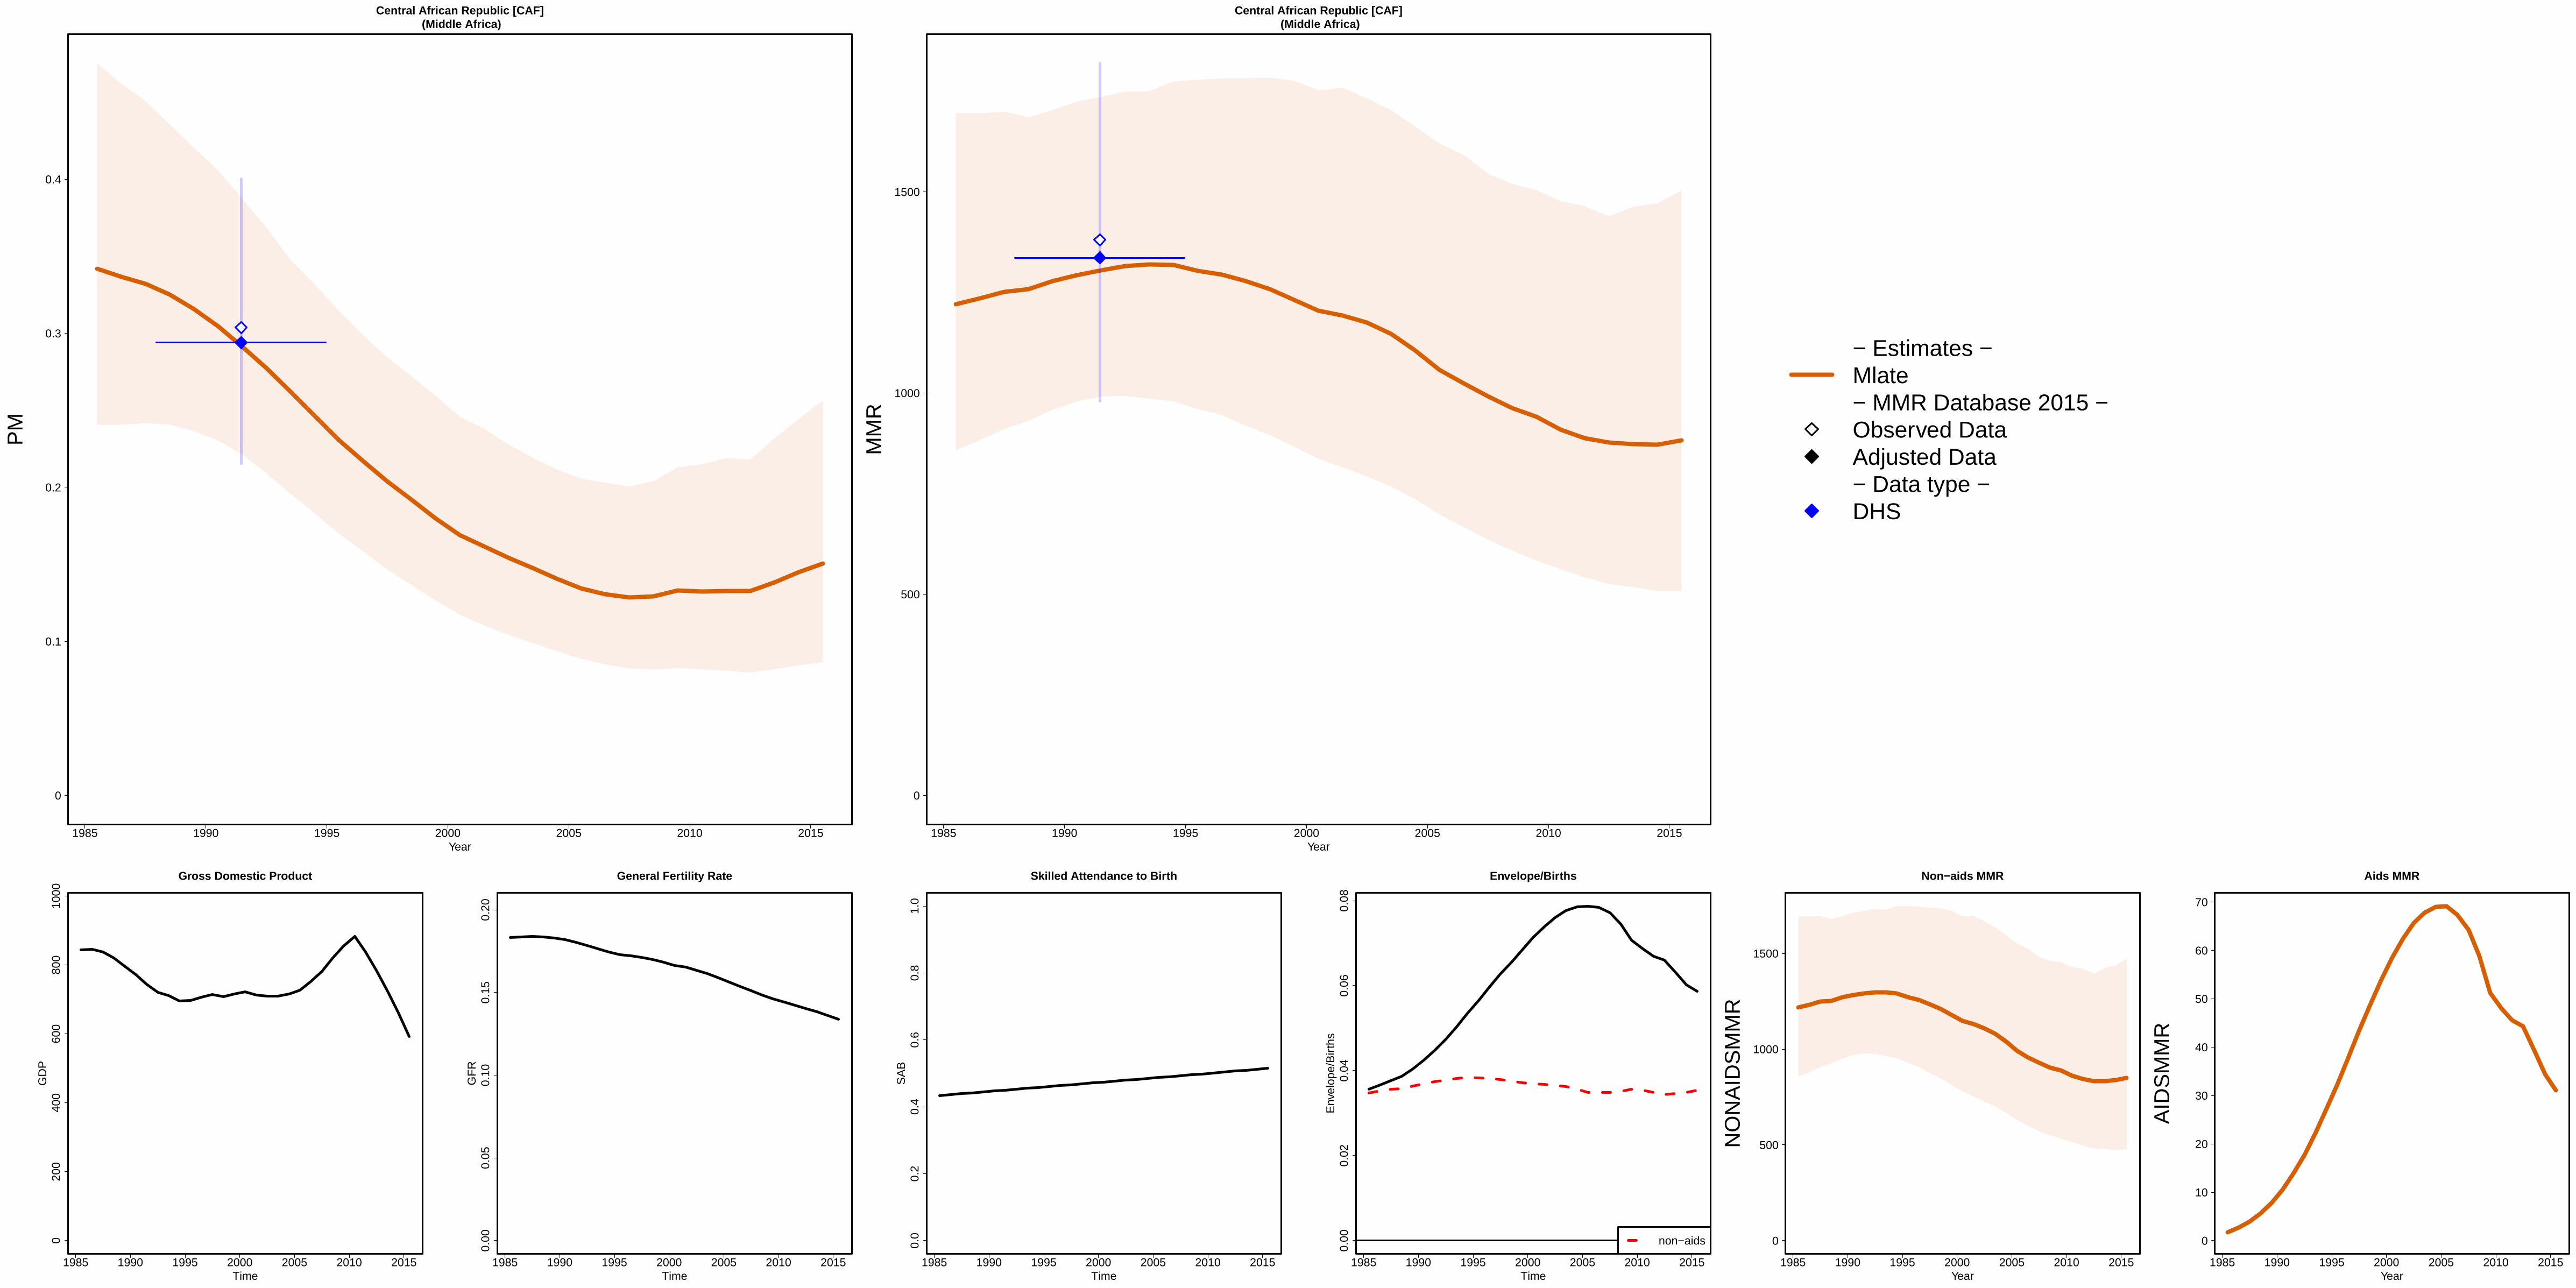
1985 1990 1995 2000 2005 2010 2015
Central African Republic [CAF] (Middle Africa)
Year
0
0.1
0.2
0.3
0.4
PM
1985 1990 1995 2000 2005 2010 2015
Central African Republic [CAF] (Middle Africa)
Year
0
500
1000
1500
MM
R
− Estimates −Mlate− MMR Database 2015 −Observed DataAdjusted Data− Data type −DHS
1985 1990 1995 2000 2005 2010 2015
020
040
060
080
010
00
Gross Domestic Product
Time
GD
P
1985 1990 1995 2000 2005 2010 2015
0.00
0.05
0.10
0.15
0.20
General Fertility Rate
Time
GF
R
1985 1990 1995 2000 2005 2010 2015
0.0
0.2
0.4
0.6
0.8
1.0
Skilled Attendance to Birth
Time
SA
B
1985 1990 1995 2000 2005 2010 2015
0.00
0.02
0.04
0.06
0.08
Envelope/Births
Time
Env
elop
e/B
irth
s
non−aids
1985 1990 1995 2000 2005 2010 2015
Non−aids MMR
Year
0
500
1000
1500
NO
NA
IDS
MM
R
1985 1990 1995 2000 2005 2010 2015
Aids MMR
Year
0
10
20
30
40
50
60
70
AID
SM
MR

1985 1990 1995 2000 2005 2010 2015
Chad [TCD] (Middle Africa)
Year
0
0.1
0.2
0.3
0.4
0.5
0.6
PM
1985 1990 1995 2000 2005 2010 2015
Chad [TCD] (Middle Africa)
Year
0
500
1000
1500
2000
MM
R
− Estimates −Mlate− MMR Database 2015 −Observed DataAdjusted Data− Data type −DHS
1985 1990 1995 2000 2005 2010 2015
050
010
0015
0020
0025
00
Gross Domestic Product
Time
GD
P
1985 1990 1995 2000 2005 2010 2015
0.00
0.05
0.10
0.15
0.20
0.25
General Fertility Rate
Time
GF
R
1985 1990 1995 2000 2005 2010 2015
0.0
0.2
0.4
0.6
0.8
1.0
Skilled Attendance to Birth
Time
SA
B
1985 1990 1995 2000 2005 2010 2015
0.00
0.01
0.02
0.03
0.04
Envelope/Births
Time
Env
elop
e/B
irth
s
non−aids
1985 1990 1995 2000 2005 2010 2015
Non−aids MMR
Year
0
500
1000
1500
2000
NO
NA
IDS
MM
R
1985 1990 1995 2000 2005 2010 2015
Aids MMR
Year
0
5
10
15
20
25
30
AID
SM
MR

1985 1990 1995 2000 2005 2010 2015
Chile [CHL] (South America)
Year
0
0.02
0.04
0.06
0.08
PM
1985 1990 1995 2000 2005 2010 2015
Chile [CHL] (South America)
Year
0
50
100
MM
R
− Estimates −Mlate− MMR Database 2015 −Observed DataAdjusted Data− Data type −VR
1985 1990 1995 2000 2005 2010 2015
050
0010
000
1500
020
000
2500
0
Gross Domestic Product
Time
GD
P
1985 1990 1995 2000 2005 2010 2015
0.00
0.02
0.04
0.06
0.08
General Fertility Rate
Time
GF
R
1985 1990 1995 2000 2005 2010 2015
0.0
0.2
0.4
0.6
0.8
1.0
Skilled Attendance to Birth
Time
SA
B
1985 1990 1995 2000 2005 2010 2015
0.00
00.
002
0.00
40.
006
0.00
80.
010
0.01
20.
014
Envelope/Births
Time
Env
elop
e/B
irth
s
non−aids
1985 1990 1995 2000 2005 2010 2015
Non−aids MMR
Year
0
10
20
30
40
50
60
70
80
NO
NA
IDS
MM
R
1985 1990 1995 2000 2005 2010 2015
Aids MMR
Year
0
0.05
0.1
AID
SM
MR
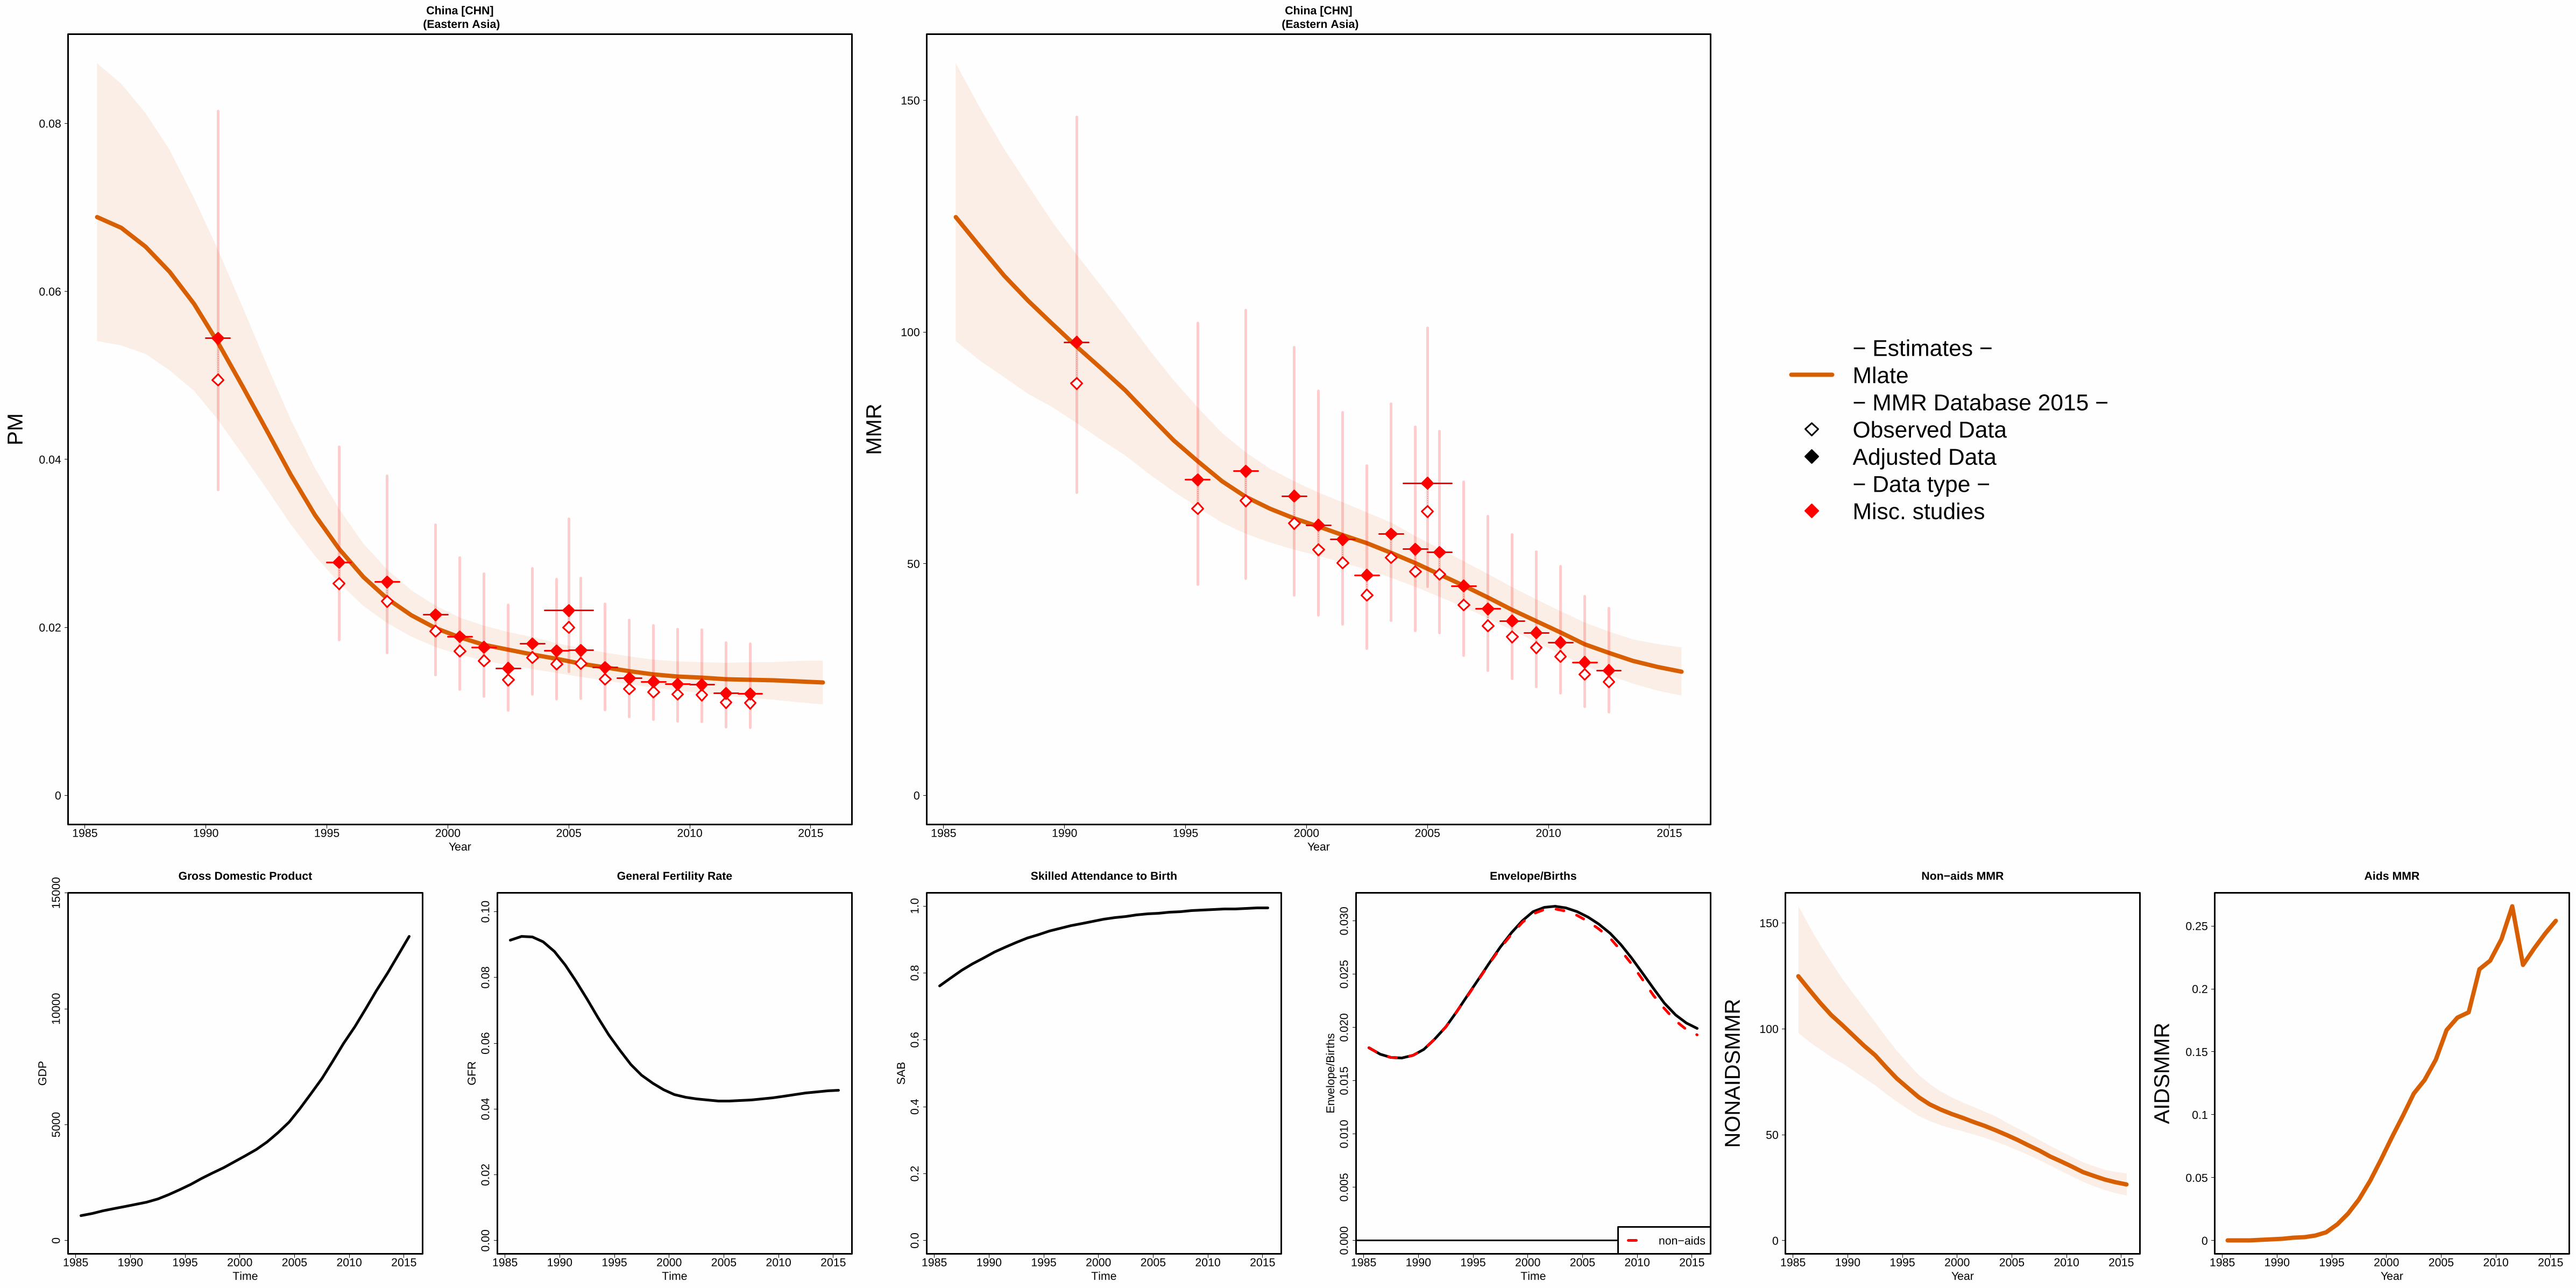
1985 1990 1995 2000 2005 2010 2015
China [CHN] (Eastern Asia)
Year
0
0.02
0.04
0.06
0.08
PM
1985 1990 1995 2000 2005 2010 2015
China [CHN] (Eastern Asia)
Year
0
50
100
150
MM
R
− Estimates −Mlate− MMR Database 2015 −Observed DataAdjusted Data− Data type −Misc. studies
1985 1990 1995 2000 2005 2010 2015
050
0010
000
1500
0 Gross Domestic Product
Time
GD
P
1985 1990 1995 2000 2005 2010 2015
0.00
0.02
0.04
0.06
0.08
0.10
General Fertility Rate
Time
GF
R
1985 1990 1995 2000 2005 2010 2015
0.0
0.2
0.4
0.6
0.8
1.0
Skilled Attendance to Birth
Time
SA
B
1985 1990 1995 2000 2005 2010 2015
0.00
00.
005
0.01
00.
015
0.02
00.
025
0.03
0
Envelope/Births
Time
Env
elop
e/B
irth
s
non−aids
1985 1990 1995 2000 2005 2010 2015
Non−aids MMR
Year
0
50
100
150
NO
NA
IDS
MM
R
1985 1990 1995 2000 2005 2010 2015
Aids MMR
Year
0
0.05
0.1
0.15
0.2
0.25
AID
SM
MR

1985 1990 1995 2000 2005 2010 2015
Colombia [COL] (South America)
Year
0
0.05
0.1
PM
●
●●
●
● ●
●
● ● ●
●● ●
1985 1990 1995 2000 2005 2010 2015
Colombia [COL] (South America)
Year
0
50
100
150
200
MM
R
●
− Estimates −
Mlate
− MMR Database 2015 −
Observed Data
Adjusted Data
− Data type −
VR
Spec. studiesExcluded VR data (data quality issues)Excluded VR data (overlap with specialized study)
1985 1990 1995 2000 2005 2010 2015
020
0040
0060
0080
0010
000
1200
014
000
Gross Domestic Product
Time
GD
P
1985 1990 1995 2000 2005 2010 2015
0.00
0.02
0.04
0.06
0.08
0.10
0.12
General Fertility Rate
Time
GF
R
1985 1990 1995 2000 2005 2010 2015
0.0
0.2
0.4
0.6
0.8
1.0
Skilled Attendance to Birth
Time
SA
B
1985 1990 1995 2000 2005 2010 2015
0.00
00.
005
0.01
00.
015
Envelope/Births
Time
Env
elop
e/B
irth
s
non−aids
1985 1990 1995 2000 2005 2010 2015
Non−aids MMR
Year
0
50
100
150
200
NO
NA
IDS
MM
R
1985 1990 1995 2000 2005 2010 2015
Aids MMR
Year
0
0.1
0.2
0.3
0.4
AID
SM
MR

1985 1990 1995 2000 2005 2010 2015
Comoros [COM] (Eastern Africa)
Year
0
0.1
0.2
0.3
0.4
PM
1985 1990 1995 2000 2005 2010 2015
Comoros [COM] (Eastern Africa)
Year
0
500
1000
MM
R
− Estimates −Mlate− MMR Database 2015 −Observed DataAdjusted Data− Data type −DHS
1985 1990 1995 2000 2005 2010 2015
050
010
0015
0020
00
Gross Domestic Product
Time
GD
P
1985 1990 1995 2000 2005 2010 2015
0.00
0.05
0.10
0.15
0.20
General Fertility Rate
Time
GF
R
1985 1990 1995 2000 2005 2010 2015
0.0
0.2
0.4
0.6
0.8
1.0
Skilled Attendance to Birth
Time
SA
B
1985 1990 1995 2000 2005 2010 2015
0.00
00.
005
0.01
00.
015
0.02
00.
025
Envelope/Births
Time
Env
elop
e/B
irth
s
non−aids
1985 1990 1995 2000 2005 2010 2015
Non−aids MMR
Year
0
500
1000
NO
NA
IDS
MM
R
1985 1990 1995 2000 2005 2010 2015
Aids MMR
Year
0
0.1
0.2
0.3
0.4
AID
SM
MR

1985 1990 1995 2000 2005 2010 2015
Congo [COG] (Middle Africa)
Year
0
0.05
0.1
0.15
0.2
0.25
0.3
0.35
PM
1985 1990 1995 2000 2005 2010 2015
Congo [COG] (Middle Africa)
Year
0
500
1000
MM
R
− Estimates −Mlate− MMR Database 2015 −Observed DataAdjusted Data− Data type −DHS
1985 1990 1995 2000 2005 2010 2015
010
0020
0030
0040
0050
0060
00
Gross Domestic Product
Time
GD
P
1985 1990 1995 2000 2005 2010 2015
0.00
0.05
0.10
0.15
0.20
General Fertility Rate
Time
GF
R
1985 1990 1995 2000 2005 2010 2015
0.0
0.2
0.4
0.6
0.8
1.0
Skilled Attendance to Birth
Time
SA
B
1985 1990 1995 2000 2005 2010 2015
0.00
0.01
0.02
0.03
0.04
0.05
Envelope/Births
Time
Env
elop
e/B
irth
s
non−aids
1985 1990 1995 2000 2005 2010 2015
Non−aids MMR
Year
0
100
200
300
400
500
600
700
800
900
NO
NA
IDS
MM
R
1985 1990 1995 2000 2005 2010 2015
Aids MMR
Year
0
10
20
30
40
50
AID
SM
MR

1985 1990 1995 2000 2005 2010 2015
Costa Rica [CRI] (Central America)
Year
0
0.05
0.1
PM
1985 1990 1995 2000 2005 2010 2015
Costa Rica [CRI] (Central America)
Year
0
10
20
30
40
50
60
70
80
90
MM
R
− Estimates −
Mlate
− MMR Database 2015 −
Observed Data
Adjusted Data
− Data type −
VR
Spec. studiesExcluded VR data (overlap with specialized study)
1985 1990 1995 2000 2005 2010 2015
050
0010
000
1500
0
Gross Domestic Product
Time
GD
P
1985 1990 1995 2000 2005 2010 2015
0.00
0.02
0.04
0.06
0.08
0.10
0.12
General Fertility Rate
Time
GF
R
1985 1990 1995 2000 2005 2010 2015
0.0
0.2
0.4
0.6
0.8
1.0
Skilled Attendance to Birth
Time
SA
B
1985 1990 1995 2000 2005 2010 2015
0.00
00.
005
0.01
00.
015
Envelope/Births
Time
Env
elop
e/B
irth
s
non−aids
1985 1990 1995 2000 2005 2010 2015
Non−aids MMR
Year
0
10
20
30
40
50
NO
NA
IDS
MM
R
1985 1990 1995 2000 2005 2010 2015
Aids MMR
Year
0
0.05
0.1
0.15
0.2
AID
SM
MR

1985 1990 1995 2000 2005 2010 2015
Cote d'Ivoire [CIV] (Western Africa)
Year
0
0.1
0.2
0.3
0.4
PM
1985 1990 1995 2000 2005 2010 2015
Cote d'Ivoire [CIV] (Western Africa)
Year
0
500
1000
MM
R
− Estimates −Mlate− MMR Database 2015 −Observed DataAdjusted Data− Data type −DHS
1985 1990 1995 2000 2005 2010 2015
010
0020
0030
00
Gross Domestic Product
Time
GD
P
1985 1990 1995 2000 2005 2010 2015
0.00
0.05
0.10
0.15
0.20
General Fertility Rate
Time
GF
R
1985 1990 1995 2000 2005 2010 2015
0.0
0.2
0.4
0.6
0.8
1.0
Skilled Attendance to Birth
Time
SA
B
1985 1990 1995 2000 2005 2010 2015
0.00
0.01
0.02
0.03
0.04
0.05
0.06
Envelope/Births
Time
Env
elop
e/B
irth
s
non−aids
1985 1990 1995 2000 2005 2010 2015
Non−aids MMR
Year
0
500
1000
NO
NA
IDS
MM
R
1985 1990 1995 2000 2005 2010 2015
Aids MMR
Year
0
10
20
30
40
50
60
AID
SM
MR

1985 1990 1995 2000 2005 2010 2015
Croatia [HRV] (Transition countries of South−Eastern Europe)
Year
0
0.01
0.02
PM
1985 1990 1995 2000 2005 2010 2015
Croatia [HRV] (Transition countries of South−Eastern Europe)
Year
0
5
10
15
20
25
30
35
MM
R
− Estimates −Mlate− MMR Database 2015 −Observed DataAdjusted Data− Data type −VR
1985 1990 1995 2000 2005 2010 2015
050
0010
000
1500
020
000
Gross Domestic Product
Time
GD
P
1985 1990 1995 2000 2005 2010 2015
0.00
0.01
0.02
0.03
0.04
0.05
0.06
General Fertility Rate
Time
GF
R
1985 1990 1995 2000 2005 2010 2015
0.0
0.2
0.4
0.6
0.8
1.0
Skilled Attendance to Birth
Time
SA
B
1985 1990 1995 2000 2005 2010 2015
0.00
00.
005
0.01
00.
015
0.02
00.
025
Envelope/Births
Time
Env
elop
e/B
irth
s
non−aids
1985 1990 1995 2000 2005 2010 2015
Non−aids MMR
Year
0
5
10
15
NO
NA
IDS
MM
R
1985 1990 1995 2000 2005 2010 2015
Aids MMR
Year
0
AID
SM
MR

1985 1990 1995 2000 2005 2010 2015
Cuba [CUB] (Caribbean)
Year
0
0.01
0.02
0.03
0.04
PM
1985 1990 1995 2000 2005 2010 2015
Cuba [CUB] (Caribbean)
Year
0
50
100
MM
R
− Estimates −
Mlate
− MMR Database 2015 −
Observed Data
Adjusted Data
− Data type −
VR
Spec. studiesExcluded VR data (overlap with specialized study)
1985 1990 1995 2000 2005 2010 2015
050
0010
000
1500
020
000
Gross Domestic Product
Time
GD
P
1985 1990 1995 2000 2005 2010 2015
0.00
0.01
0.02
0.03
0.04
0.05
0.06
0.07
General Fertility Rate
Time
GF
R
1985 1990 1995 2000 2005 2010 2015
0.0
0.2
0.4
0.6
0.8
1.0
Skilled Attendance to Birth
Time
SA
B
1985 1990 1995 2000 2005 2010 2015
0.00
00.
005
0.01
00.
015
0.02
00.
025
Envelope/Births
Time
Env
elop
e/B
irth
s
non−aids
1985 1990 1995 2000 2005 2010 2015
Non−aids MMR
Year
0
10
20
30
40
50
60
70
80
NO
NA
IDS
MM
R
1985 1990 1995 2000 2005 2010 2015
Aids MMR
Year
0
0.02
0.04
0.06
0.08
AID
SM
MR

1985 1990 1995 2000 2005 2010 2015
Cyprus [CYP] (Western Asia)
Year
0
0.01
0.02
0.03
PM
● ●
1985 1990 1995 2000 2005 2010 2015
Cyprus [CYP] (Western Asia)
Year
0
5
10
15
20
25
30
35
MM
R
● ●
●
− Estimates −
Mlate
− MMR Database 2015 −
Observed Data
Adjusted Data
− Data type −
VRReported VR before recalc.(related to 0 obs. mat. death)Excluded VR data (data quality issues)
1985 1990 1995 2000 2005 2010 2015
050
0010
000
1500
020
000
2500
030
000
3500
0
Gross Domestic Product
Time
GD
P
1985 1990 1995 2000 2005 2010 2015
0.00
0.02
0.04
0.06
0.08
General Fertility Rate
Time
GF
R
1985 1990 1995 2000 2005 2010 2015
0.0
0.2
0.4
0.6
0.8
1.0
Skilled Attendance to Birth
Time
SA
B
1985 1990 1995 2000 2005 2010 2015
0.00
00.
005
0.01
00.
015
Envelope/Births
Time
Env
elop
e/B
irth
s
non−aids
1985 1990 1995 2000 2005 2010 2015
Non−aids MMR
Year
0
5
10
15
20
25
30
35
NO
NA
IDS
MM
R
1985 1990 1995 2000 2005 2010 2015
Aids MMR
Year
0
0.02
0.04
0.06
0.08
AID
SM
MR
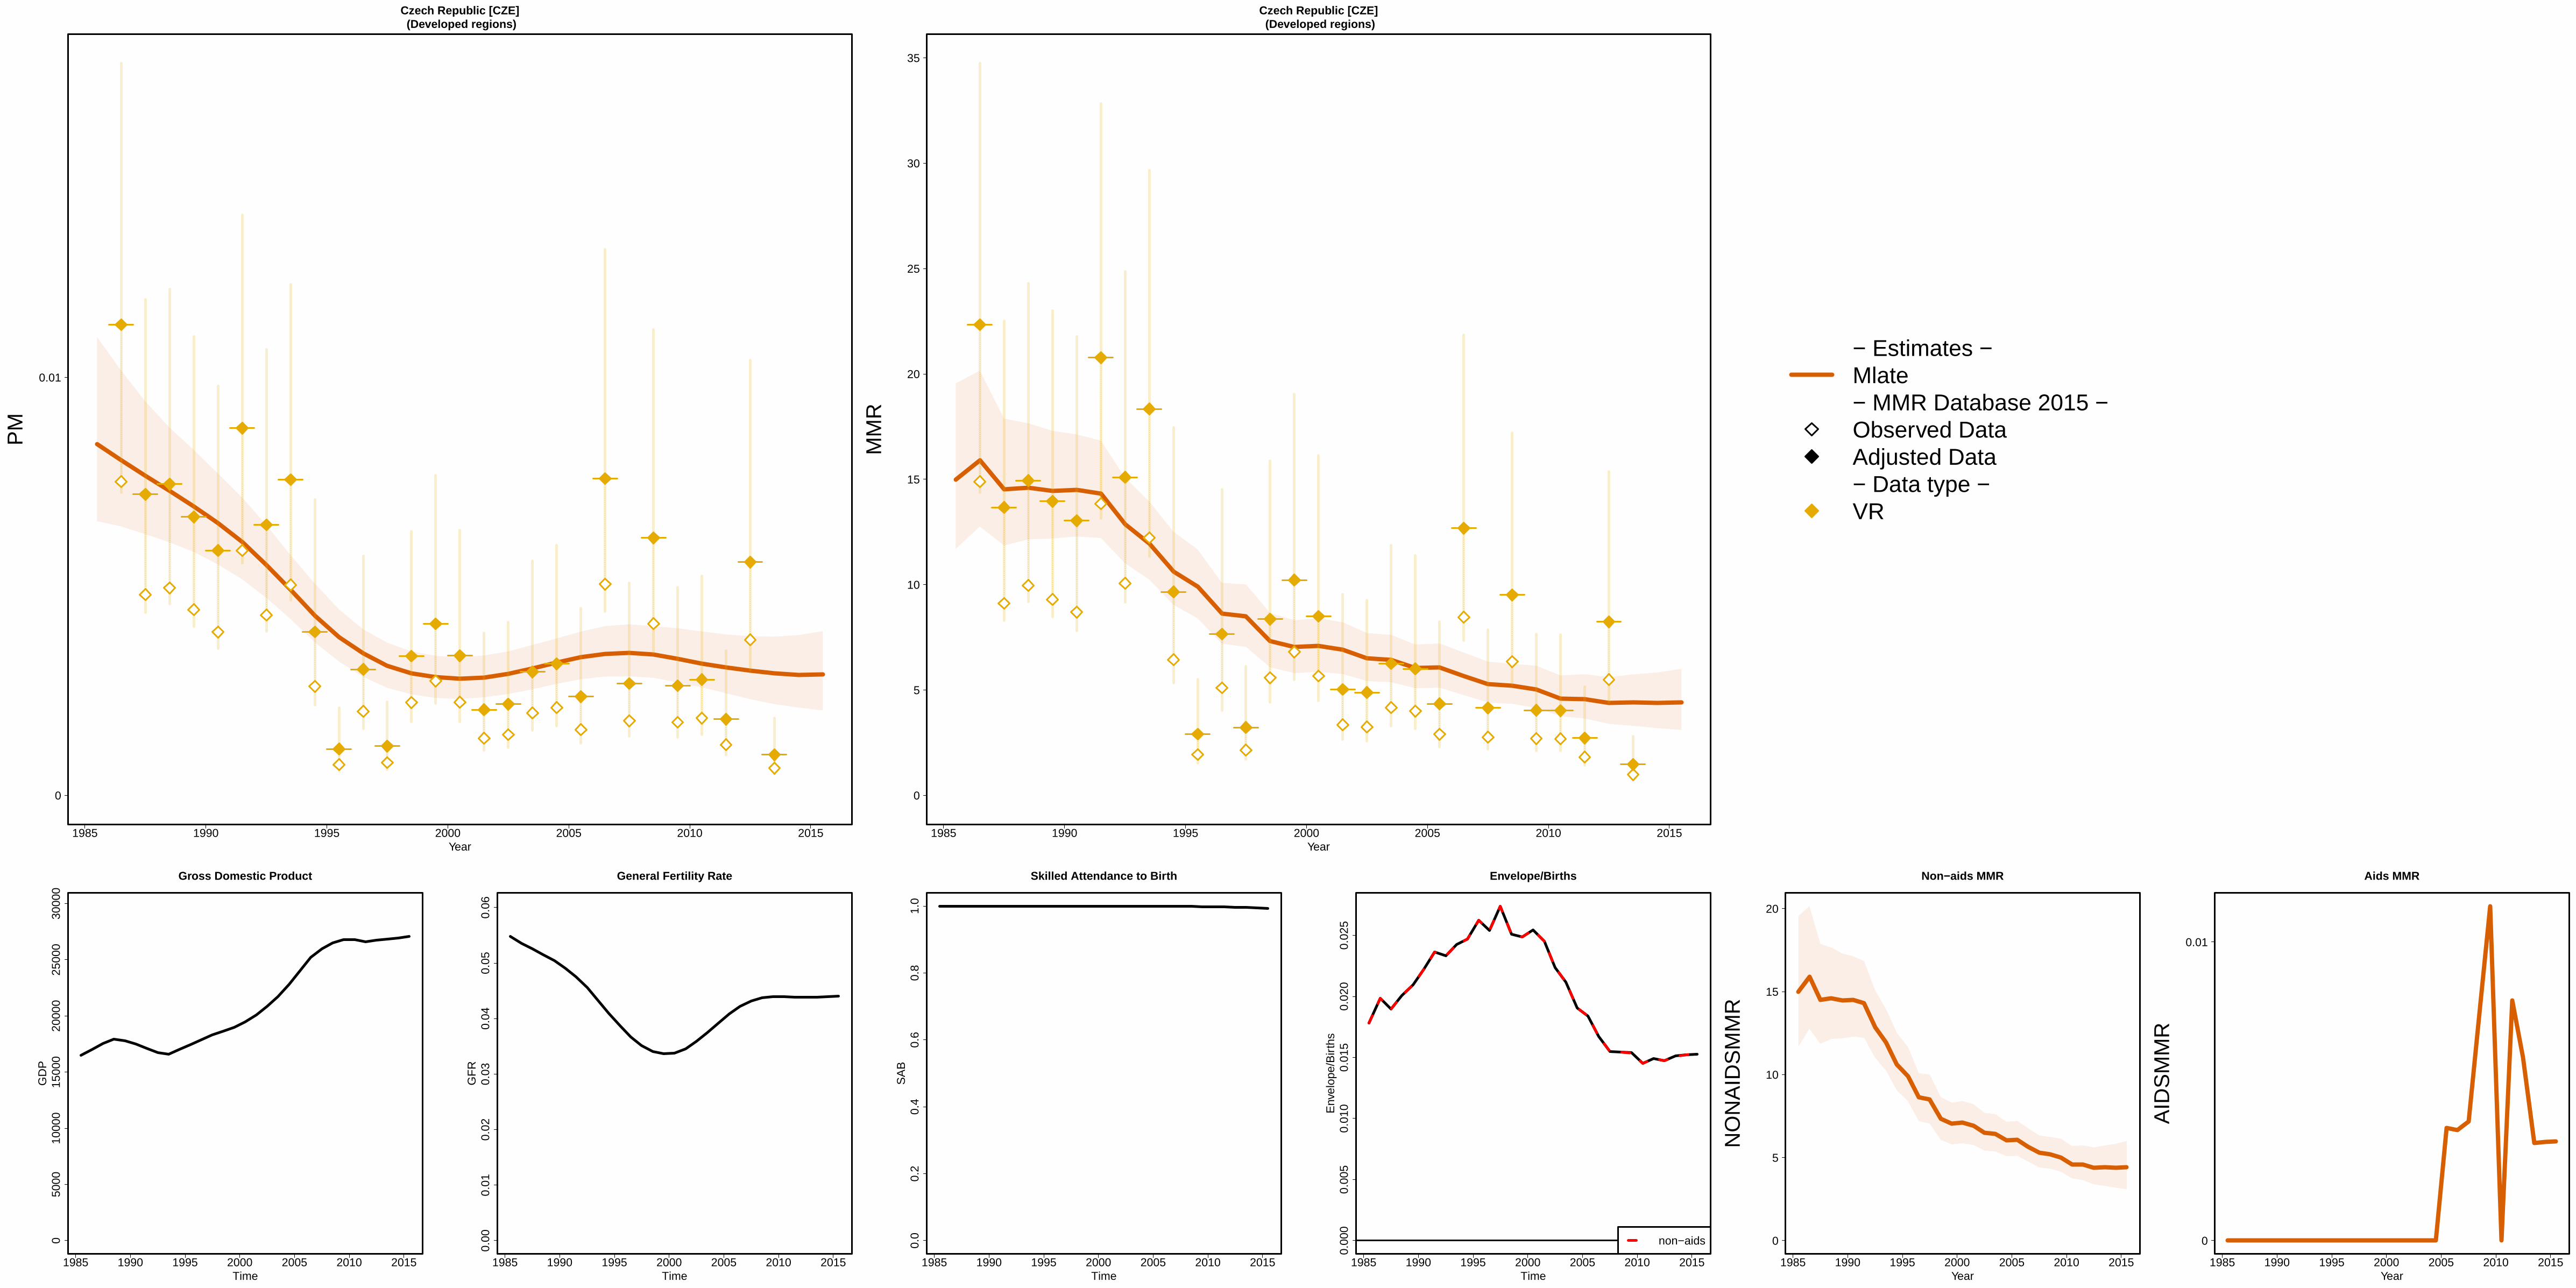
1985 1990 1995 2000 2005 2010 2015
Czech Republic [CZE] (Developed regions)
Year
0
0.01
PM
1985 1990 1995 2000 2005 2010 2015
Czech Republic [CZE] (Developed regions)
Year
0
5
10
15
20
25
30
35
MM
R
− Estimates −Mlate− MMR Database 2015 −Observed DataAdjusted Data− Data type −VR
1985 1990 1995 2000 2005 2010 2015
050
0010
000
1500
020
000
2500
030
000
Gross Domestic Product
Time
GD
P
1985 1990 1995 2000 2005 2010 2015
0.00
0.01
0.02
0.03
0.04
0.05
0.06
General Fertility Rate
Time
GF
R
1985 1990 1995 2000 2005 2010 2015
0.0
0.2
0.4
0.6
0.8
1.0
Skilled Attendance to Birth
Time
SA
B
1985 1990 1995 2000 2005 2010 2015
0.00
00.
005
0.01
00.
015
0.02
00.
025
Envelope/Births
Time
Env
elop
e/B
irth
s
non−aids
1985 1990 1995 2000 2005 2010 2015
Non−aids MMR
Year
0
5
10
15
20
NO
NA
IDS
MM
R
1985 1990 1995 2000 2005 2010 2015
Aids MMR
Year
0
0.01
AID
SM
MR

1985 1990 1995 2000 2005 2010 2015
Democratic People's Republic of Korea [PRK] (Eastern Asia)
Year
0
0.02
0.04
0.06
0.08
PM
1985 1990 1995 2000 2005 2010 2015
Democratic People's Republic of Korea [PRK] (Eastern Asia)
Year
0
50
100
150
200
250
MM
R
− Estimates −Mlate− MMR Database 2015 −Observed DataAdjusted Data− Data type −Excluded misc. studies
1985 1990 1995 2000 2005 2010 2015
050
010
0015
0020
0025
0030
00
Gross Domestic Product
Time
GD
P
1985 1990 1995 2000 2005 2010 2015
0.00
0.02
0.04
0.06
0.08
General Fertility Rate
Time
GF
R
1985 1990 1995 2000 2005 2010 2015
0.0
0.2
0.4
0.6
0.8
1.0
Skilled Attendance to Birth
Time
SA
B
1985 1990 1995 2000 2005 2010 2015
0.00
00.
005
0.01
00.
015
0.02
00.
025
0.03
00.
035
Envelope/Births
Time
Env
elop
e/B
irth
s
non−aids
1985 1990 1995 2000 2005 2010 2015
Non−aids MMR
Year
0
50
100
150
200
250
NO
NA
IDS
MM
R
1985 1990 1995 2000 2005 2010 2015
Aids MMR
Year
0
0.01
0.02
0.03
0.04
AID
SM
MR

1985 1990 1995 2000 2005 2010 2015
Democratic Republic of the Congo [COD] (Middle Africa)
Year
0
0.1
0.2
0.3
0.4
PM
1985 1990 1995 2000 2005 2010 2015
Democratic Republic of the Congo [COD] (Middle Africa)
Year
0
500
1000
MM
R
− Estimates −Mlate− MMR Database 2015 −Observed DataAdjusted Data− Data type −DHS
1985 1990 1995 2000 2005 2010 2015
050
010
0015
00
Gross Domestic Product
Time
GD
P
1985 1990 1995 2000 2005 2010 2015
0.00
0.05
0.10
0.15
0.20
General Fertility Rate
Time
GF
R
1985 1990 1995 2000 2005 2010 2015
0.0
0.2
0.4
0.6
0.8
1.0
Skilled Attendance to Birth
Time
SA
B
1985 1990 1995 2000 2005 2010 2015
0.00
00.
005
0.01
00.
015
0.02
00.
025
0.03
00.
035
Envelope/Births
Time
Env
elop
e/B
irth
s
non−aids
1985 1990 1995 2000 2005 2010 2015
Non−aids MMR
Year
0
500
1000
NO
NA
IDS
MM
R
1985 1990 1995 2000 2005 2010 2015
Aids MMR
Year
0
5
10
AID
SM
MR

1985 1990 1995 2000 2005 2010 2015
Denmark [DNK] (Developed regions)
Year
0
0.01
0.02
PM
1985 1990 1995 2000 2005 2010 2015
Denmark [DNK] (Developed regions)
Year
0
10
20
30
40
MM
R
− Estimates −
Mlate
− MMR Database 2015 −
Observed Data
Adjusted Data
− Data type −
VR
Spec. studiesReported VR before recalc.(related to 0 obs. mat. death)Excluded VR data (overlap with specialized study)
1985 1990 1995 2000 2005 2010 2015
010
000
2000
030
000
4000
0
Gross Domestic Product
Time
GD
P
1985 1990 1995 2000 2005 2010 2015
0.00
0.01
0.02
0.03
0.04
0.05
0.06
General Fertility Rate
Time
GF
R
1985 1990 1995 2000 2005 2010 2015
0.0
0.2
0.4
0.6
0.8
1.0
Skilled Attendance to Birth
Time
SA
B
1985 1990 1995 2000 2005 2010 2015
0.00
00.
005
0.01
00.
015
0.02
00.
025
Envelope/Births
Time
Env
elop
e/B
irth
s
non−aids
1985 1990 1995 2000 2005 2010 2015
Non−aids MMR
Year
0
5
10
NO
NA
IDS
MM
R
1985 1990 1995 2000 2005 2010 2015
Aids MMR
Year
0
0.05
0.1
0.15
AID
SM
MR

1985 1990 1995 2000 2005 2010 2015
Djibouti [DJI] (Eastern Africa)
Year
0
0.1
0.2
0.3
0.4
PM
1985 1990 1995 2000 2005 2010 2015
Djibouti [DJI] (Eastern Africa)
Year
0
500
1000
MM
R − Estimates −Mlate− MMR Database 2015 −
1985 1990 1995 2000 2005 2010 2015
050
010
0015
0020
0025
0030
00
Gross Domestic Product
Time
GD
P
1985 1990 1995 2000 2005 2010 2015
0.00
0.05
0.10
0.15
0.20
General Fertility Rate
Time
GF
R
1985 1990 1995 2000 2005 2010 2015
0.0
0.2
0.4
0.6
0.8
1.0
Skilled Attendance to Birth
Time
SA
B
1985 1990 1995 2000 2005 2010 2015
0.00
0.01
0.02
0.03
0.04
0.05
Envelope/Births
Time
Env
elop
e/B
irth
s
non−aids
1985 1990 1995 2000 2005 2010 2015
Non−aids MMR
Year
0
500
1000
NO
NA
IDS
MM
R
1985 1990 1995 2000 2005 2010 2015
Aids MMR
Year
0
5
10
15
AID
SM
MR

1985 1990 1995 2000 2005 2010 2015
Dominican Republic [DOM] (Caribbean)
Year
0
0.05
0.1
0.15
0.2
PM
● ●
●●
●
●
●
● ● ●
●
●
●
●
●● ●
●
●●
●
●
● ●
●
●
●
1985 1990 1995 2000 2005 2010 2015
Dominican Republic [DOM] (Caribbean)
Year
0
100
200
300
400
MM
R
●
●
●●
●
●●
● ●●
●
●●
●
●
● ●●
●
●
●
●
●●
●
●
● ●
− Estimates −
Mlate
− MMR Database 2015 −
Observed Data
Adjusted Data
− Data type −
Spec. studies
DHSExcluded VR data (data quality issues)
1985 1990 1995 2000 2005 2010 2015
020
0040
0060
0080
0010
000
1200
0
Gross Domestic Product
Time
GD
P
1985 1990 1995 2000 2005 2010 2015
0.00
0.05
0.10
0.15
General Fertility Rate
Time
GF
R
1985 1990 1995 2000 2005 2010 2015
0.0
0.2
0.4
0.6
0.8
1.0
Skilled Attendance to Birth
Time
SA
B
1985 1990 1995 2000 2005 2010 2015
0.00
00.
005
0.01
00.
015
0.02
00.
025
0.03
0 Envelope/Births
Time
Env
elop
e/B
irth
s
non−aids
1985 1990 1995 2000 2005 2010 2015
Non−aids MMR
Year
0
100
200
300
400
NO
NA
IDS
MM
R
1985 1990 1995 2000 2005 2010 2015
Aids MMR
Year
AID
SM
MR

1985 1990 1995 2000 2005 2010 2015
Ecuador [ECU] (South America)
Year
0
0.05
0.1
0.15
0.2
PM
1985 1990 1995 2000 2005 2010 2015
Ecuador [ECU] (South America)
Year
0
50
100
150
200
250
300
350
MM
R
− Estimates −
Mlate
− MMR Database 2015 −
Observed Data
Adjusted Data
− Data type −
VR
Spec. studies
DHSExcluded VR data (overlap with specialized study)
1985 1990 1995 2000 2005 2010 2015
020
0040
0060
0080
0010
000
1200
0 Gross Domestic Product
Time
GD
P
1985 1990 1995 2000 2005 2010 2015
0.00
0.05
0.10
0.15
General Fertility Rate
Time
GF
R
1985 1990 1995 2000 2005 2010 2015
0.0
0.2
0.4
0.6
0.8
1.0
Skilled Attendance to Birth
Time
SA
B
1985 1990 1995 2000 2005 2010 2015
0.00
00.
005
0.01
00.
015
Envelope/Births
Time
Env
elop
e/B
irth
s
non−aids
1985 1990 1995 2000 2005 2010 2015
Non−aids MMR
Year
0
50
100
150
200
250
300
NO
NA
IDS
MM
R
1985 1990 1995 2000 2005 2010 2015
Aids MMR
Year
AID
SM
MR

1985 1990 1995 2000 2005 2010 2015
Egypt [EGY] (Northern Africa)
Year
0
0.05
0.1
0.15
PM
1985 1990 1995 2000 2005 2010 2015
Egypt [EGY] (Northern Africa)
Year
0
50
100
150
200
MM
R
− Estimates −Mlate− MMR Database 2015 −Observed DataAdjusted Data− Data type −VRMisc. studies
1985 1990 1995 2000 2005 2010 2015
020
0040
0060
0080
0010
000
1200
0
Gross Domestic Product
Time
GD
P
1985 1990 1995 2000 2005 2010 2015
0.00
0.05
0.10
0.15
General Fertility Rate
Time
GF
R
1985 1990 1995 2000 2005 2010 2015
0.0
0.2
0.4
0.6
0.8
1.0
Skilled Attendance to Birth
Time
SA
B
1985 1990 1995 2000 2005 2010 2015
0.00
00.
002
0.00
40.
006
0.00
80.
010
0.01
20.
014
Envelope/Births
Time
Env
elop
e/B
irth
s
non−aids
1985 1990 1995 2000 2005 2010 2015
Non−aids MMR
Year
0
50
100
150
NO
NA
IDS
MM
R
1985 1990 1995 2000 2005 2010 2015
Aids MMR
Year
0
0.01
0.02
0.03
0.04
AID
SM
MR

1985 1990 1995 2000 2005 2010 2015
El Salvador [SLV] (Central America)
Year
0
0.05
0.1
0.15
0.2
PM
●
1985 1990 1995 2000 2005 2010 2015
El Salvador [SLV] (Central America)
Year
0
100
200
300
400
MM
R
●
●
− Estimates −
Mlate
− MMR Database 2015 −
Observed Data
Adjusted Data
− Data type −
VR
Spec. studies
DHS
Census
Misc. studiesExcluded VR data (data quality issues)Excluded VR data (overlap with specialized study)
1985 1990 1995 2000 2005 2010 2015
020
0040
0060
0080
00
Gross Domestic Product
Time
GD
P
1985 1990 1995 2000 2005 2010 2015
0.00
0.05
0.10
0.15
General Fertility Rate
Time
GF
R
1985 1990 1995 2000 2005 2010 2015
0.0
0.2
0.4
0.6
0.8
1.0
Skilled Attendance to Birth
Time
SA
B
1985 1990 1995 2000 2005 2010 2015
0.00
00.
005
0.01
00.
015
0.02
00.
025
Envelope/Births
Time
Env
elop
e/B
irth
s
non−aids
1985 1990 1995 2000 2005 2010 2015
Non−aids MMR
Year
0
50
100
150
200
250
NO
NA
IDS
MM
R
1985 1990 1995 2000 2005 2010 2015
Aids MMR
Year
AID
SM
MR

1985 1990 1995 2000 2005 2010 2015
Equatorial Guinea [GNQ] (Middle Africa)
Year
0
0.1
0.2
0.3
0.4
0.5
0.6
PM
1985 1990 1995 2000 2005 2010 2015
Equatorial Guinea [GNQ] (Middle Africa)
Year
0
500
1000
1500
2000
MM
R
− Estimates −Mlate− MMR Database 2015 −Observed DataAdjusted Data− Data type −DHS
1985 1990 1995 2000 2005 2010 2015
010
000
2000
030
000
4000
0
Gross Domestic Product
Time
GD
P
1985 1990 1995 2000 2005 2010 2015
0.00
0.05
0.10
0.15
0.20
General Fertility Rate
Time
GF
R
1985 1990 1995 2000 2005 2010 2015
0.0
0.2
0.4
0.6
0.8
1.0
Skilled Attendance to Birth
Time
SA
B
1985 1990 1995 2000 2005 2010 2015
0.00
0.01
0.02
0.03
0.04
0.05
Envelope/Births
Time
Env
elop
e/B
irth
s
non−aids
1985 1990 1995 2000 2005 2010 2015
Non−aids MMR
Year
0
500
1000
1500
2000
NO
NA
IDS
MM
R
1985 1990 1995 2000 2005 2010 2015
Aids MMR
Year
0
5
10
15
20
25
30
AID
SM
MR

1985 1990 1995 2000 2005 2010 2015
Eritrea [ERI] (Eastern Africa)
Year
0
0.1
0.2
0.3
0.4
0.5
PM
1985 1990 1995 2000 2005 2010 2015
Eritrea [ERI] (Eastern Africa)
Year
0
500
1000
1500
2000
2500
MM
R
− Estimates −Mlate− MMR Database 2015 −Observed DataAdjusted Data− Data type −DHS
1985 1990 1995 2000 2005 2010 2015
050
010
0015
00
Gross Domestic Product
Time
GD
P
1985 1990 1995 2000 2005 2010 2015
0.00
0.05
0.10
0.15
0.20
General Fertility Rate
Time
GF
R
1985 1990 1995 2000 2005 2010 2015
0.0
0.2
0.4
0.6
0.8
1.0
Skilled Attendance to Birth
Time
SA
B
1985 1990 1995 2000 2005 2010 2015
0.00
0.01
0.02
0.03
0.04
0.05
Envelope/Births
Time
Env
elop
e/B
irth
s
non−aids
1985 1990 1995 2000 2005 2010 2015
Non−aids MMR
Year
0
500
1000
1500
2000
2500
NO
NA
IDS
MM
R
1985 1990 1995 2000 2005 2010 2015
Aids MMR
Year
0
5
10
15
20
AID
SM
MR
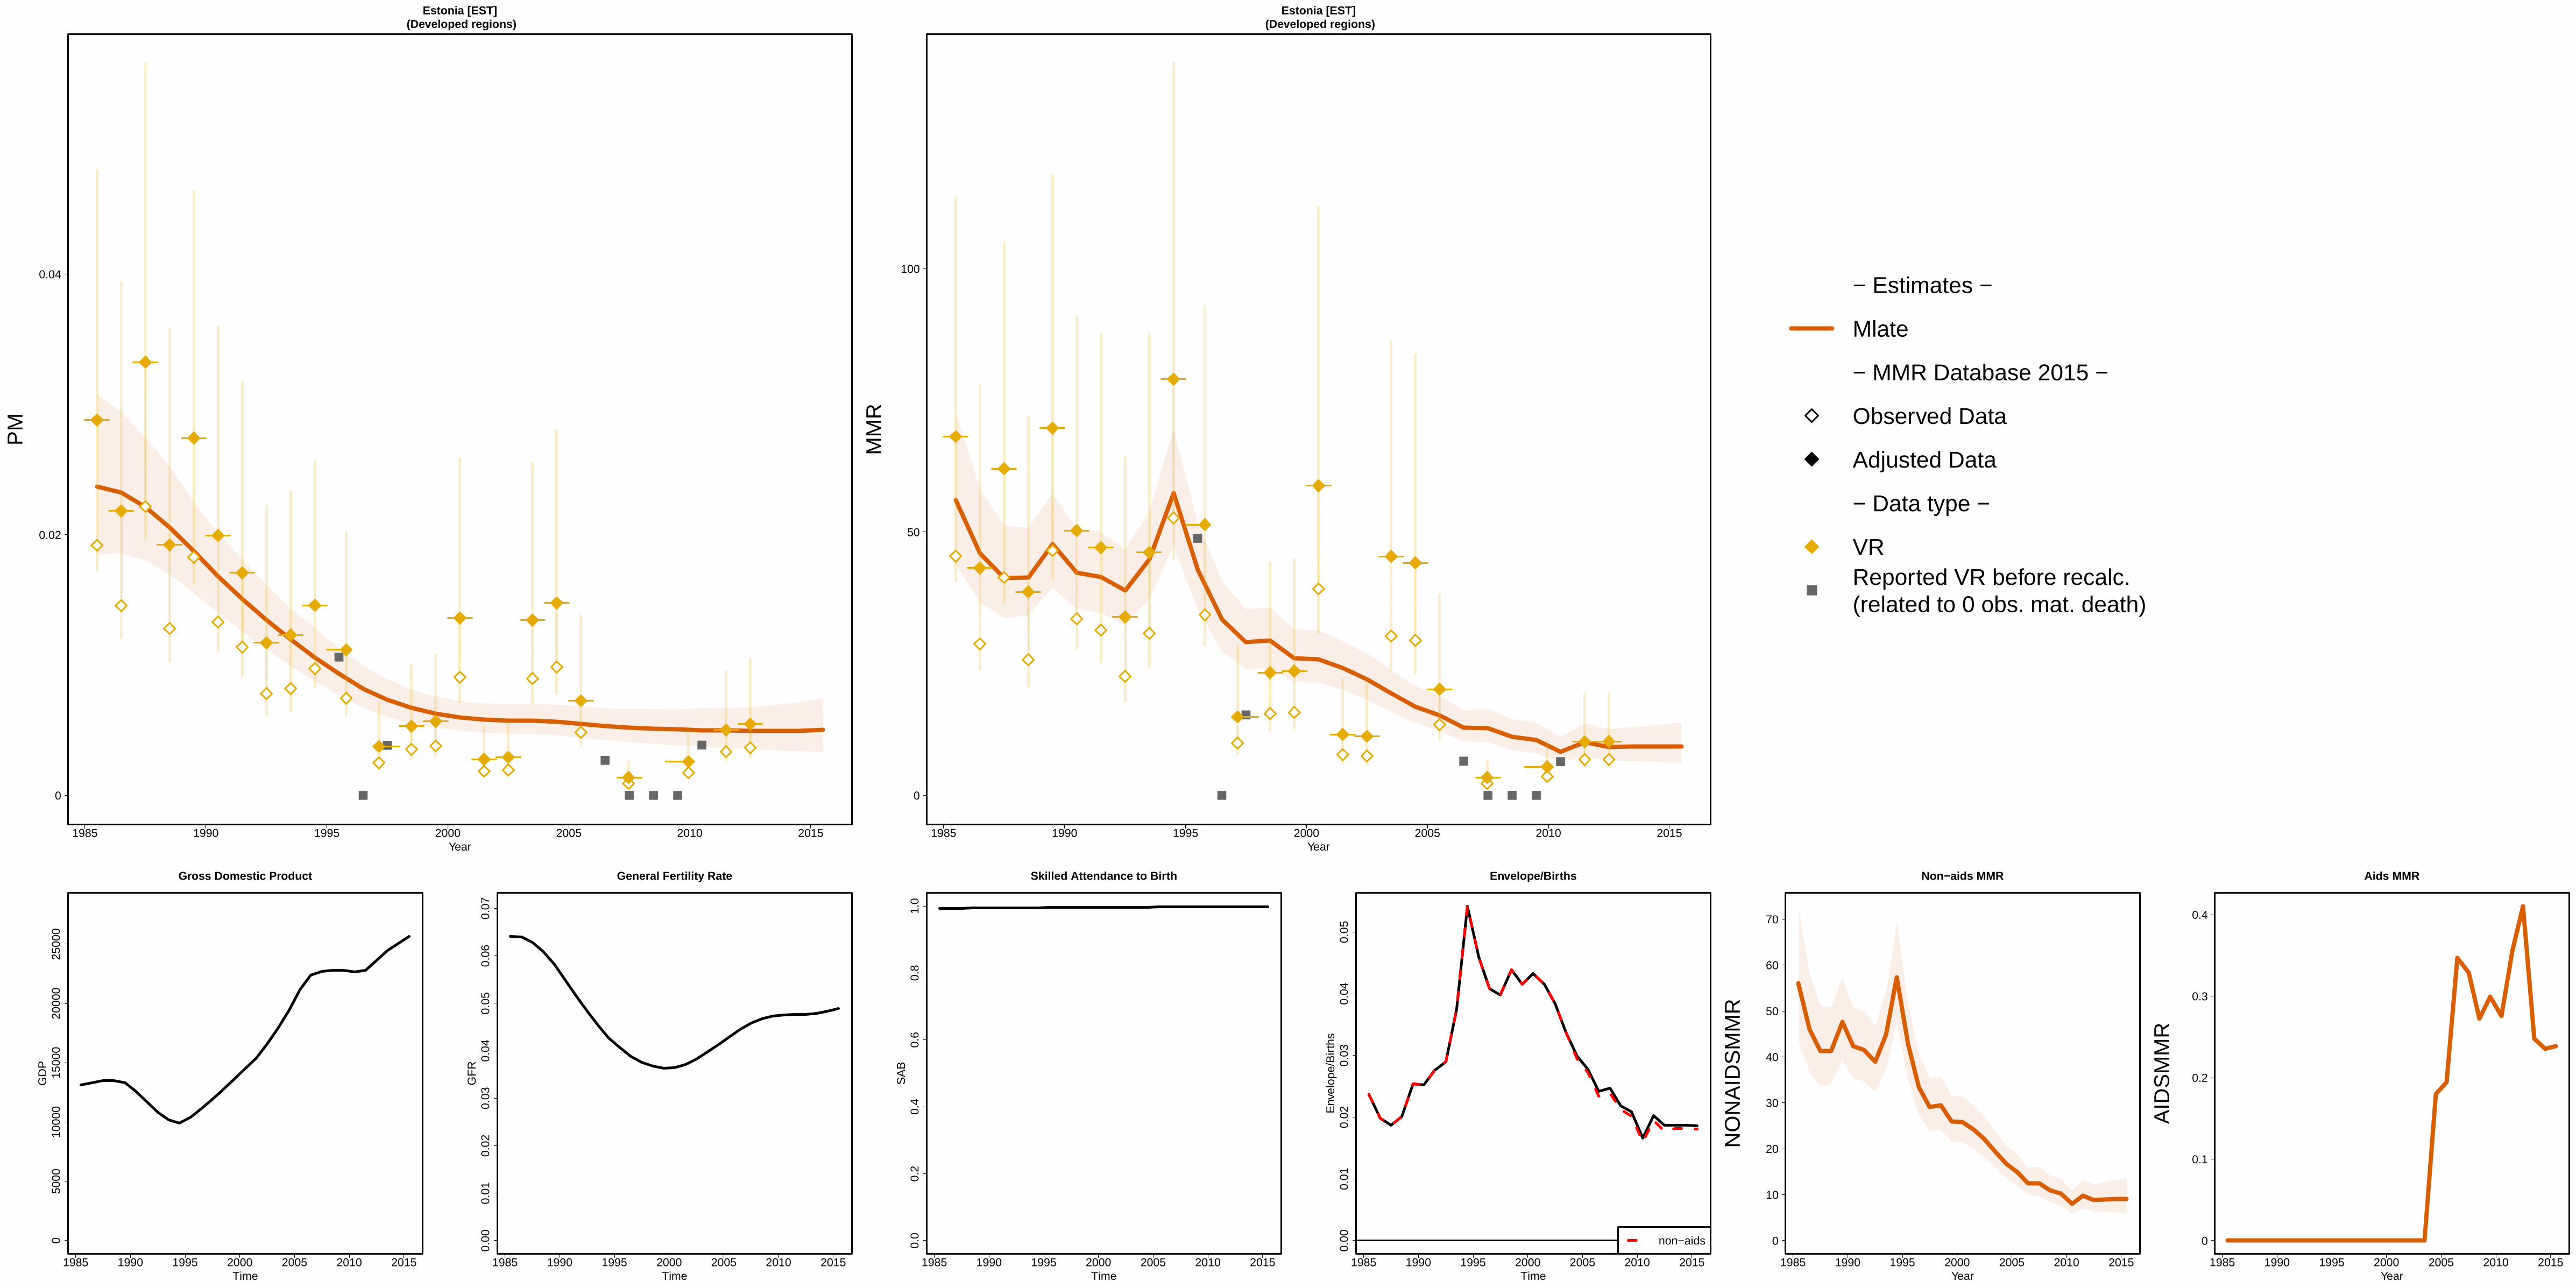
1985 1990 1995 2000 2005 2010 2015
Estonia [EST] (Developed regions)
Year
0
0.02
0.04
PM
1985 1990 1995 2000 2005 2010 2015
Estonia [EST] (Developed regions)
Year
0
50
100
MM
R
− Estimates −
Mlate
− MMR Database 2015 −
Observed Data
Adjusted Data
− Data type −
VRReported VR before recalc.(related to 0 obs. mat. death)
1985 1990 1995 2000 2005 2010 2015
050
0010
000
1500
020
000
2500
0
Gross Domestic Product
Time
GD
P
1985 1990 1995 2000 2005 2010 2015
0.00
0.01
0.02
0.03
0.04
0.05
0.06
0.07
General Fertility Rate
Time
GF
R
1985 1990 1995 2000 2005 2010 2015
0.0
0.2
0.4
0.6
0.8
1.0
Skilled Attendance to Birth
Time
SA
B
1985 1990 1995 2000 2005 2010 2015
0.00
0.01
0.02
0.03
0.04
0.05
Envelope/Births
Time
Env
elop
e/B
irth
s
non−aids
1985 1990 1995 2000 2005 2010 2015
Non−aids MMR
Year
0
10
20
30
40
50
60
70
NO
NA
IDS
MM
R
1985 1990 1995 2000 2005 2010 2015
Aids MMR
Year
0
0.1
0.2
0.3
0.4
AID
SM
MR
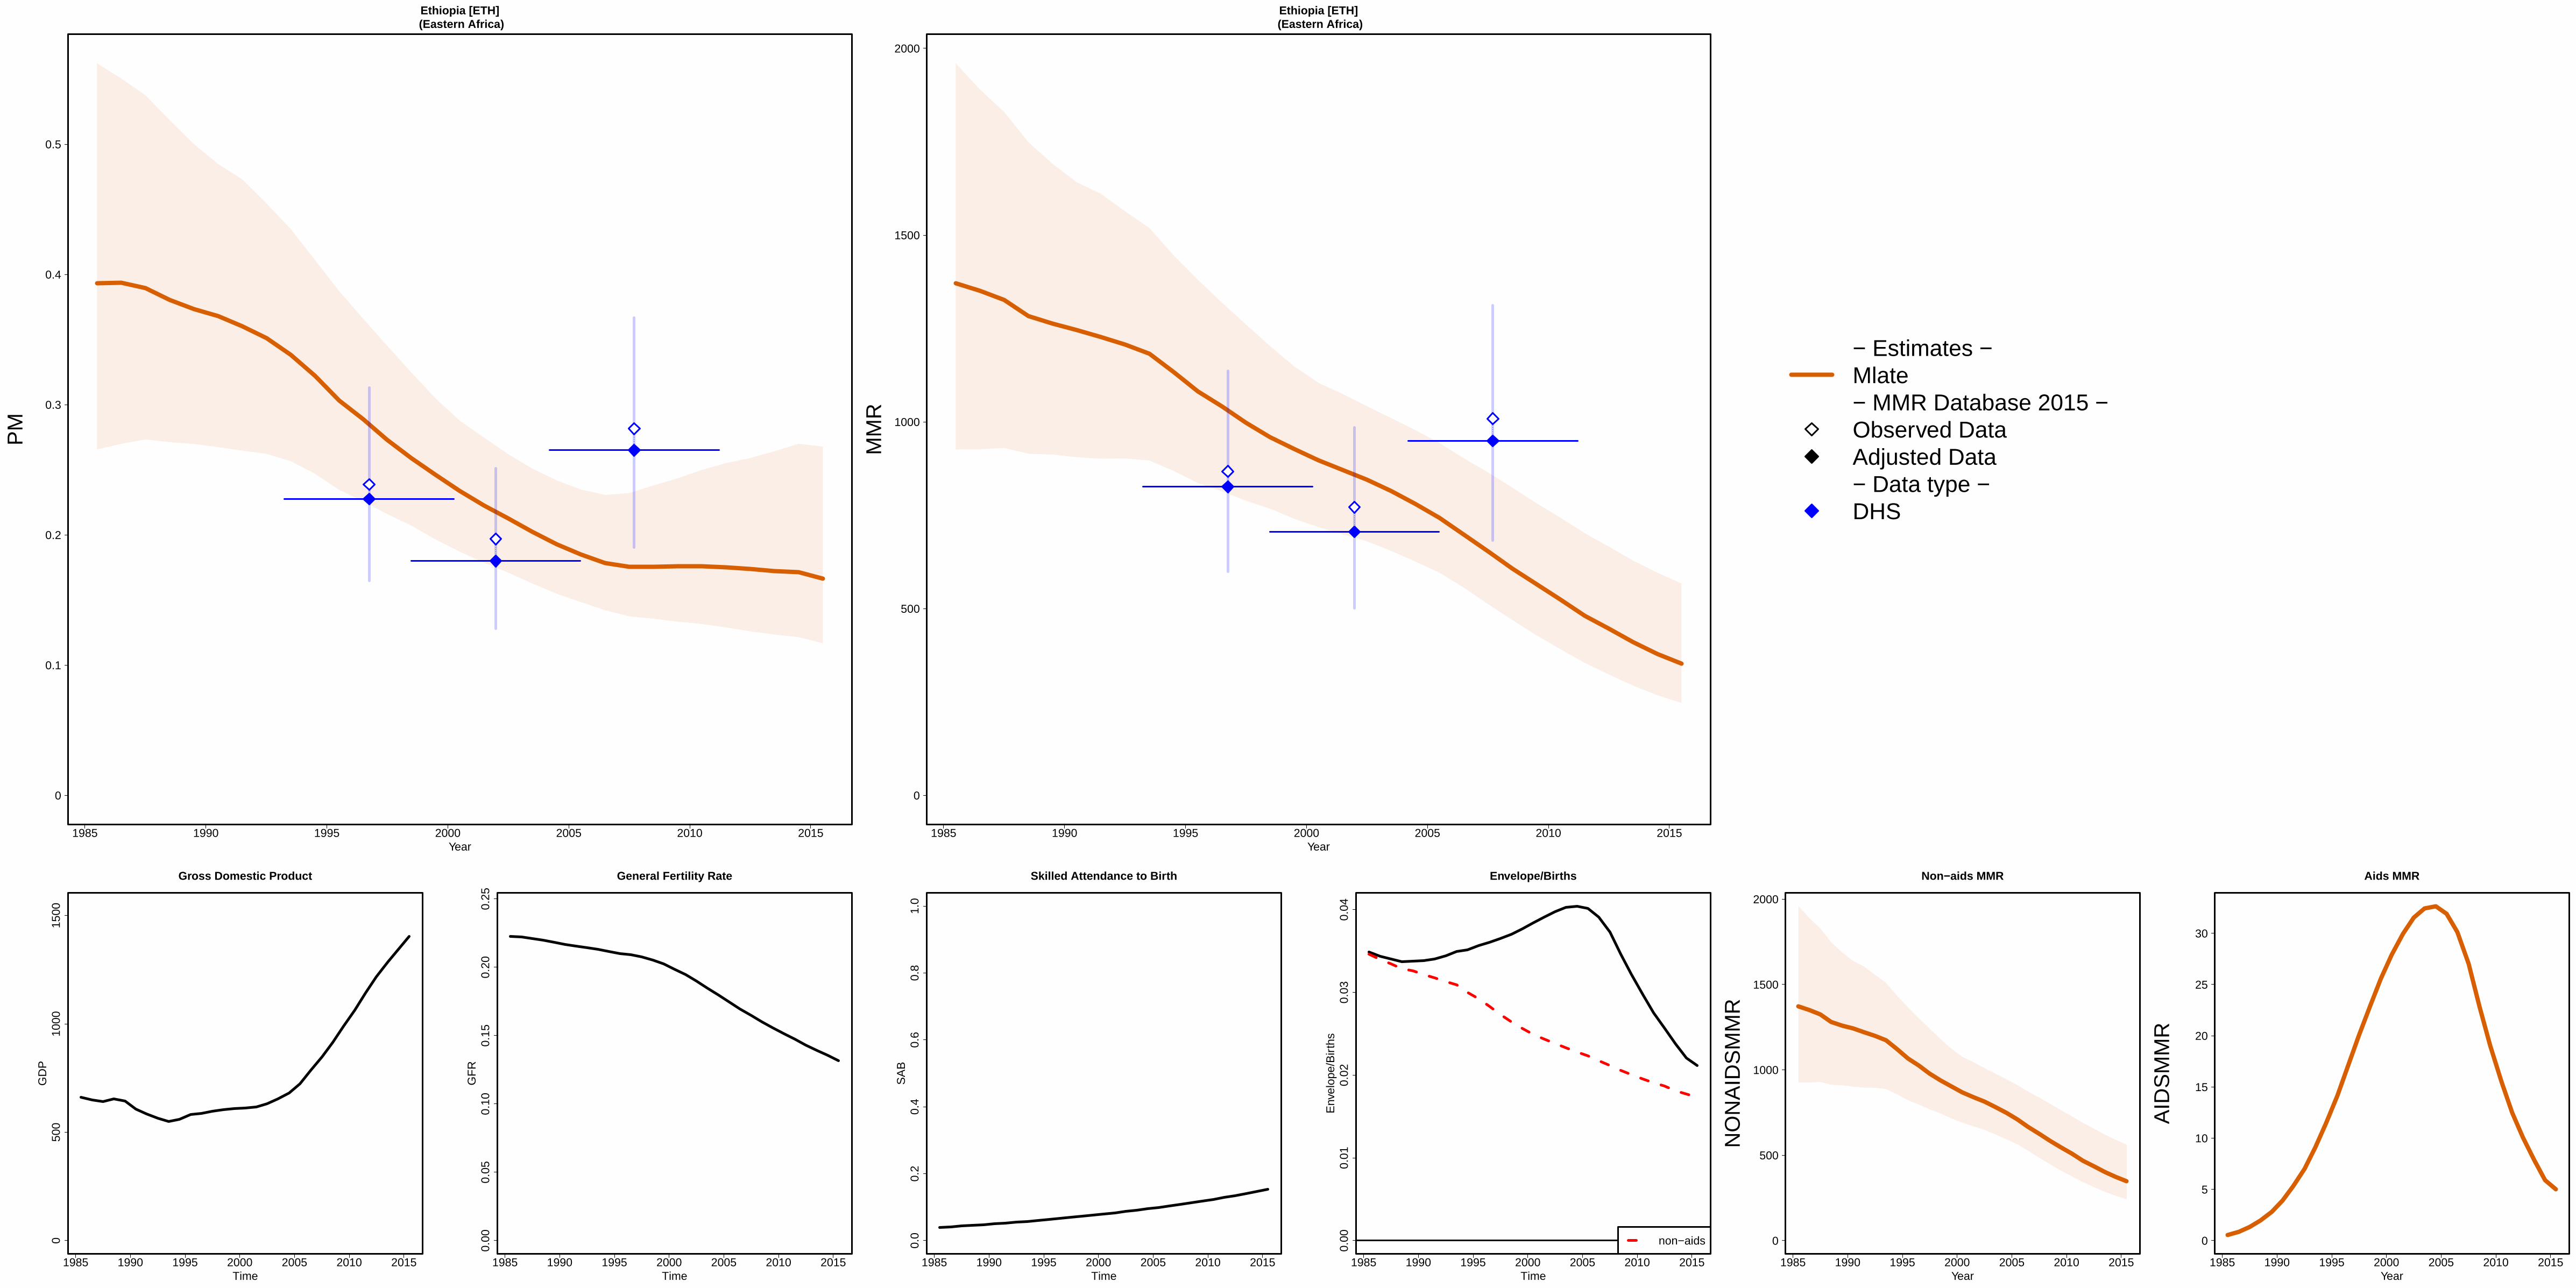
1985 1990 1995 2000 2005 2010 2015
Ethiopia [ETH] (Eastern Africa)
Year
0
0.1
0.2
0.3
0.4
0.5
PM
1985 1990 1995 2000 2005 2010 2015
Ethiopia [ETH] (Eastern Africa)
Year
0
500
1000
1500
2000
MM
R
− Estimates −Mlate− MMR Database 2015 −Observed DataAdjusted Data− Data type −DHS
1985 1990 1995 2000 2005 2010 2015
050
010
0015
00
Gross Domestic Product
Time
GD
P
1985 1990 1995 2000 2005 2010 2015
0.00
0.05
0.10
0.15
0.20
0.25
General Fertility Rate
Time
GF
R
1985 1990 1995 2000 2005 2010 2015
0.0
0.2
0.4
0.6
0.8
1.0
Skilled Attendance to Birth
Time
SA
B
1985 1990 1995 2000 2005 2010 2015
0.00
0.01
0.02
0.03
0.04
Envelope/Births
Time
Env
elop
e/B
irth
s
non−aids
1985 1990 1995 2000 2005 2010 2015
Non−aids MMR
Year
0
500
1000
1500
2000
NO
NA
IDS
MM
R
1985 1990 1995 2000 2005 2010 2015
Aids MMR
Year
0
5
10
15
20
25
30
AID
SM
MR
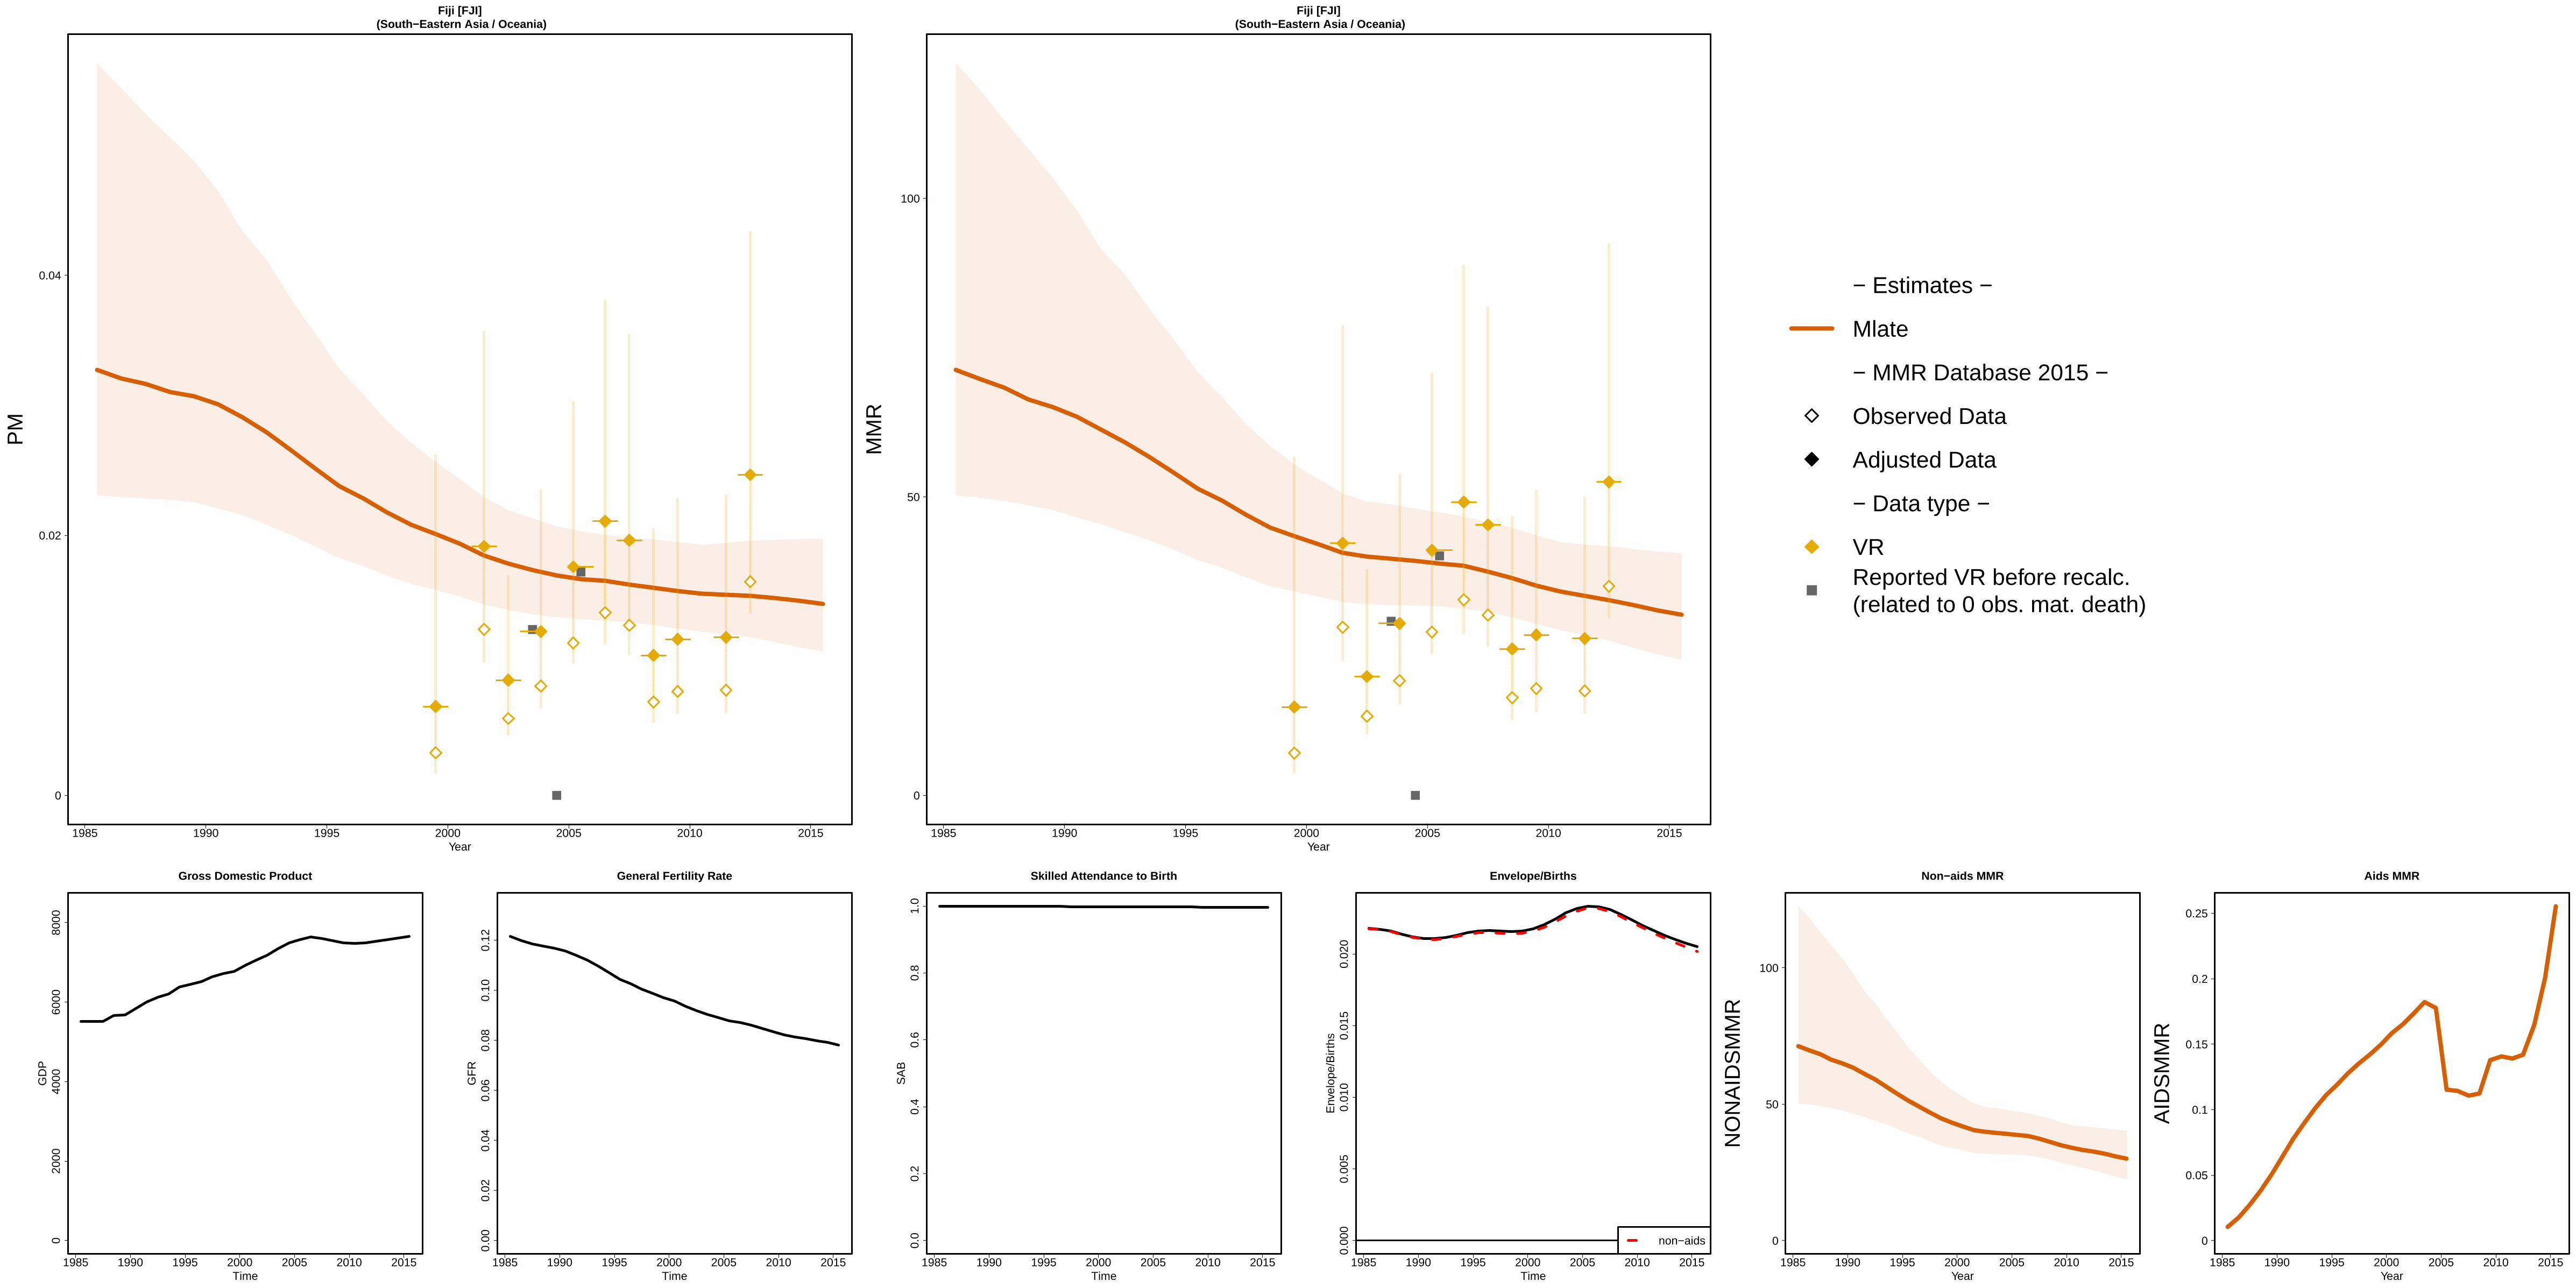
1985 1990 1995 2000 2005 2010 2015
Fiji [FJI] (South−Eastern Asia / Oceania)
Year
0
0.02
0.04
PM
1985 1990 1995 2000 2005 2010 2015
Fiji [FJI] (South−Eastern Asia / Oceania)
Year
0
50
100
MM
R
− Estimates −
Mlate
− MMR Database 2015 −
Observed Data
Adjusted Data
− Data type −
VRReported VR before recalc.(related to 0 obs. mat. death)
1985 1990 1995 2000 2005 2010 2015
020
0040
0060
0080
00
Gross Domestic Product
Time
GD
P
1985 1990 1995 2000 2005 2010 2015
0.00
0.02
0.04
0.06
0.08
0.10
0.12
General Fertility Rate
Time
GF
R
1985 1990 1995 2000 2005 2010 2015
0.0
0.2
0.4
0.6
0.8
1.0
Skilled Attendance to Birth
Time
SA
B
1985 1990 1995 2000 2005 2010 2015
0.00
00.
005
0.01
00.
015
0.02
0
Envelope/Births
Time
Env
elop
e/B
irth
s
non−aids
1985 1990 1995 2000 2005 2010 2015
Non−aids MMR
Year
0
50
100
NO
NA
IDS
MM
R
1985 1990 1995 2000 2005 2010 2015
Aids MMR
Year
0
0.05
0.1
0.15
0.2
0.25
AID
SM
MR

1985 1990 1995 2000 2005 2010 2015
Finland [FIN] (Developed regions)
Year
0
0.01
PM
1985 1990 1995 2000 2005 2010 2015
Finland [FIN] (Developed regions)
Year
0
5
10
15
20
MM
R
− Estimates −
Mlate
− MMR Database 2015 −
Observed Data
Adjusted Data
− Data type −
VR
Spec. studiesReported VR before recalc.(related to 0 obs. mat. death)Excluded VR data (overlap with specialized study)
1985 1990 1995 2000 2005 2010 2015
010
000
2000
030
000
4000
0
Gross Domestic Product
Time
GD
P
1985 1990 1995 2000 2005 2010 2015
0.00
0.01
0.02
0.03
0.04
0.05
General Fertility Rate
Time
GF
R
1985 1990 1995 2000 2005 2010 2015
0.0
0.2
0.4
0.6
0.8
1.0
Skilled Attendance to Birth
Time
SA
B
1985 1990 1995 2000 2005 2010 2015
0.00
00.
005
0.01
00.
015
0.02
0 Envelope/Births
Time
Env
elop
e/B
irth
s
non−aids
1985 1990 1995 2000 2005 2010 2015
Non−aids MMR
Year
NO
NA
IDS
MM
R
1985 1990 1995 2000 2005 2010 2015
Aids MMR
Year
0
0.01
0.02
AID
SM
MR
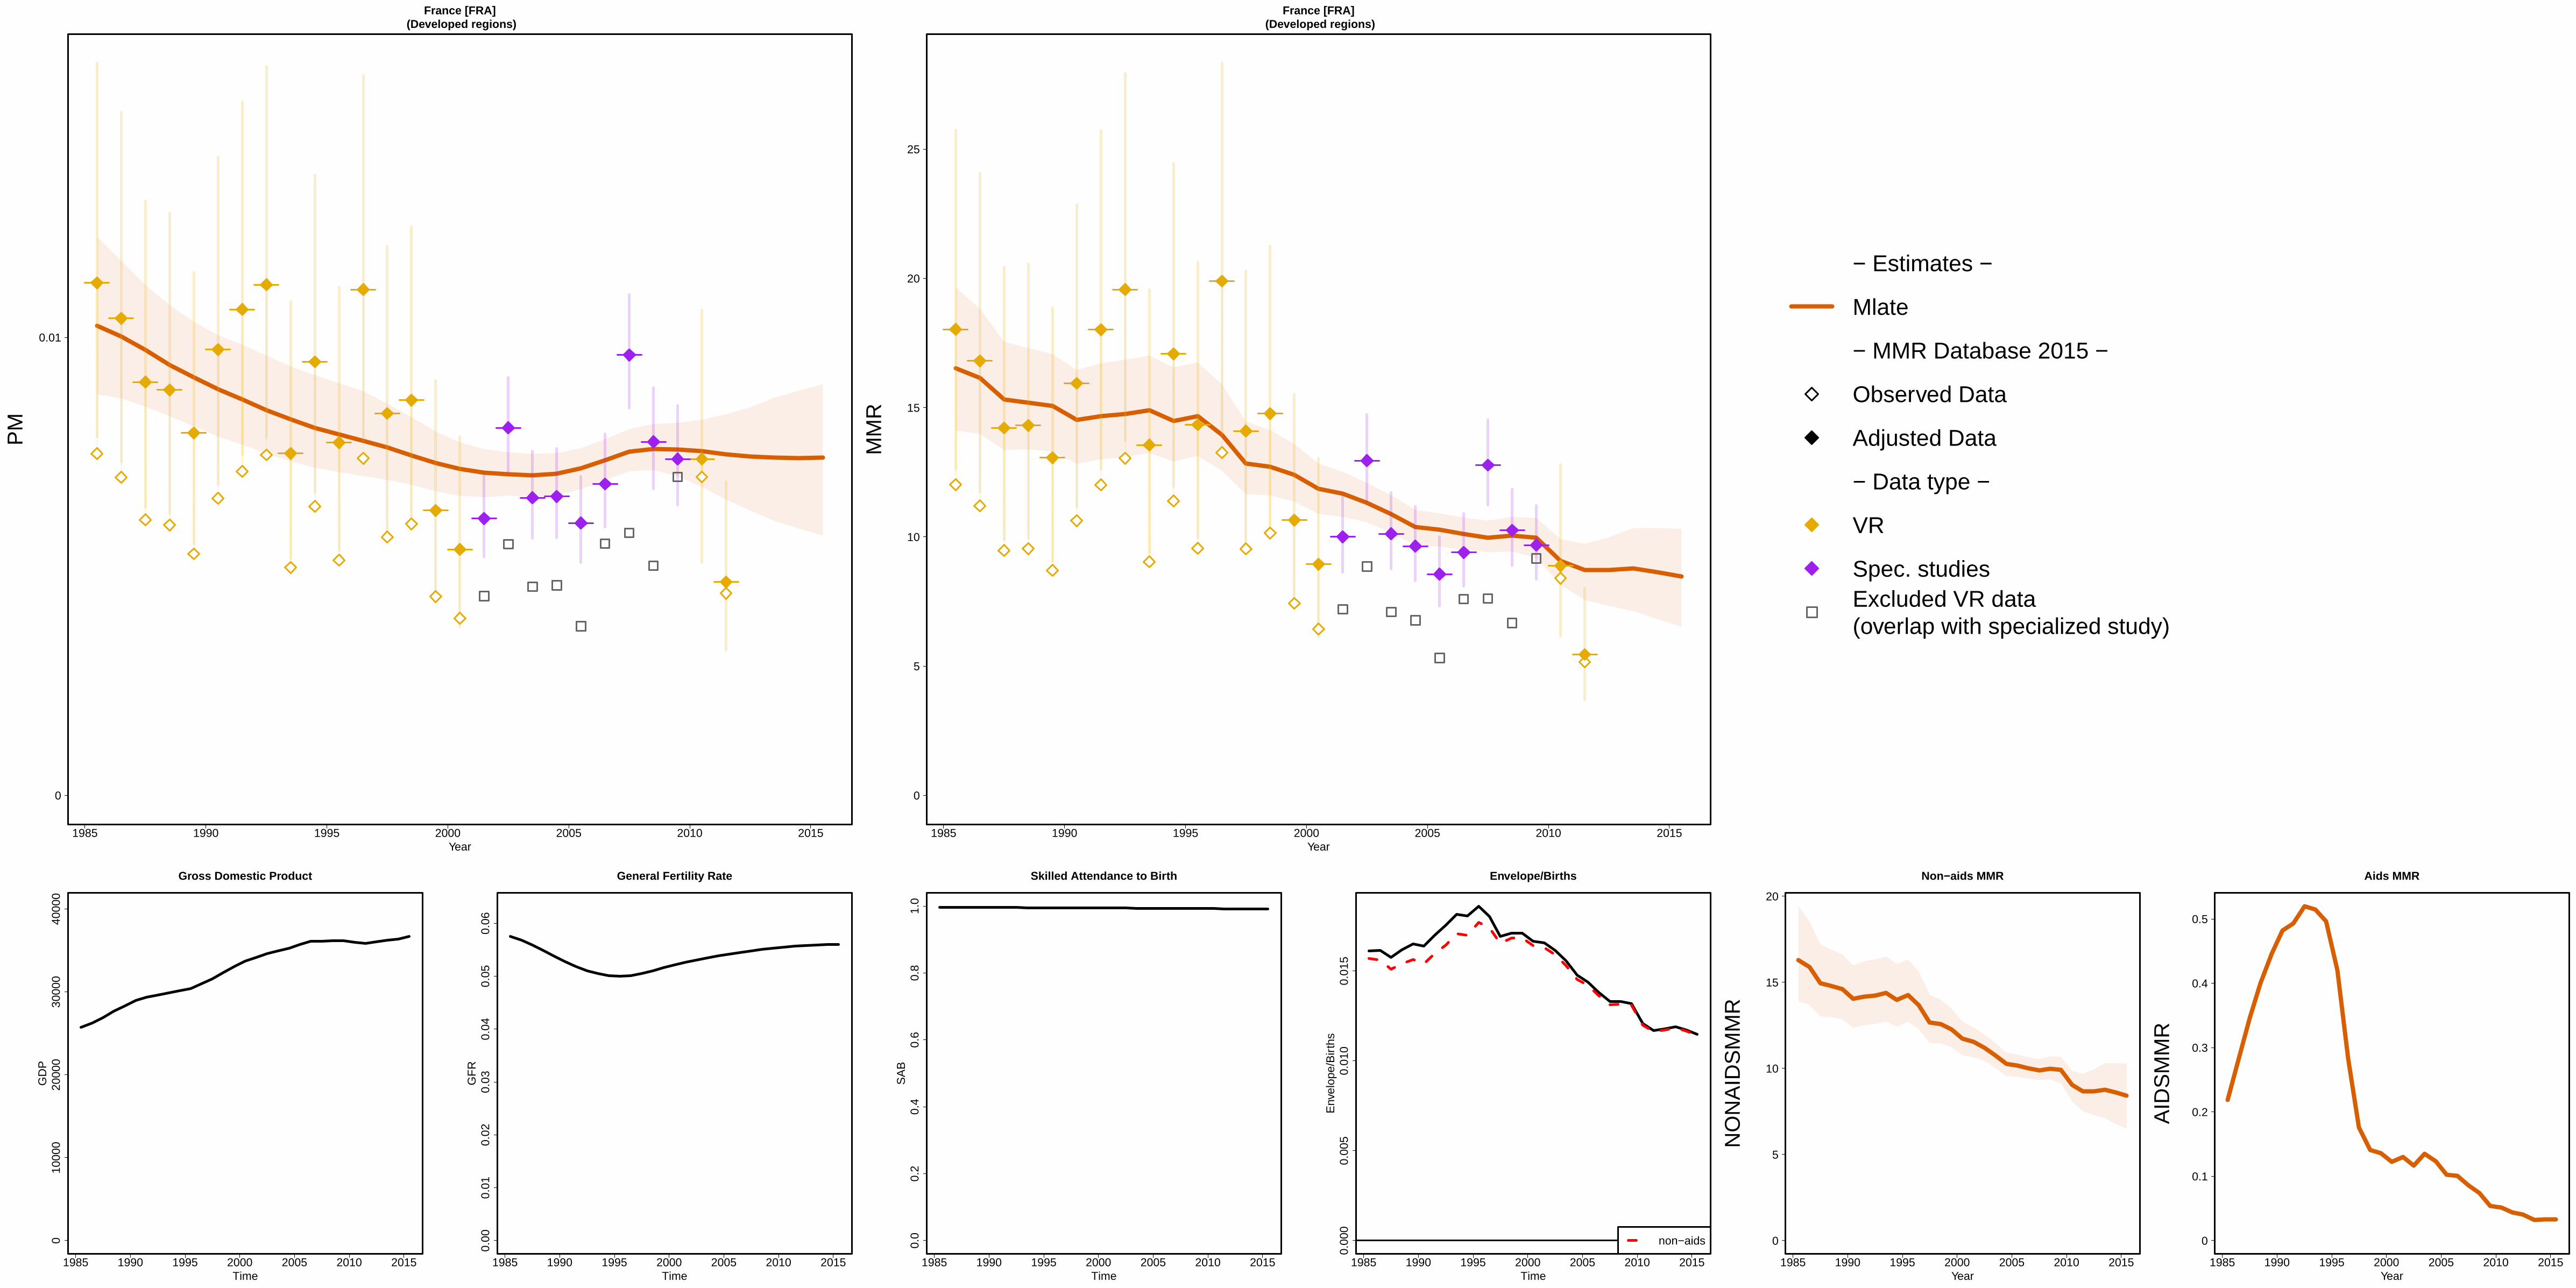
1985 1990 1995 2000 2005 2010 2015
France [FRA] (Developed regions)
Year
0
0.01
PM
1985 1990 1995 2000 2005 2010 2015
France [FRA] (Developed regions)
Year
0
5
10
15
20
25
MM
R
− Estimates −
Mlate
− MMR Database 2015 −
Observed Data
Adjusted Data
− Data type −
VR
Spec. studiesExcluded VR data (overlap with specialized study)
1985 1990 1995 2000 2005 2010 2015
010
000
2000
030
000
4000
0
Gross Domestic Product
Time
GD
P
1985 1990 1995 2000 2005 2010 2015
0.00
0.01
0.02
0.03
0.04
0.05
0.06
General Fertility Rate
Time
GF
R
1985 1990 1995 2000 2005 2010 2015
0.0
0.2
0.4
0.6
0.8
1.0
Skilled Attendance to Birth
Time
SA
B
1985 1990 1995 2000 2005 2010 2015
0.00
00.
005
0.01
00.
015
Envelope/Births
Time
Env
elop
e/B
irth
s
non−aids
1985 1990 1995 2000 2005 2010 2015
Non−aids MMR
Year
0
5
10
15
20
NO
NA
IDS
MM
R
1985 1990 1995 2000 2005 2010 2015
Aids MMR
Year
0
0.1
0.2
0.3
0.4
0.5
AID
SM
MR

1985 1990 1995 2000 2005 2010 2015
Gabon [GAB] (Middle Africa)
Year
0
0.05
0.1
0.15
0.2
0.25
0.3
PM
1985 1990 1995 2000 2005 2010 2015
Gabon [GAB] (Middle Africa)
Year
0
100
200
300
400
500
600
700
MM
R
− Estimates −Mlate− MMR Database 2015 −Observed DataAdjusted Data− Data type −DHS
1985 1990 1995 2000 2005 2010 2015
050
0010
000
1500
020
000
Gross Domestic Product
Time
GD
P
1985 1990 1995 2000 2005 2010 2015
0.00
0.05
0.10
0.15
0.20
General Fertility Rate
Time
GF
R
1985 1990 1995 2000 2005 2010 2015
0.0
0.2
0.4
0.6
0.8
1.0
Skilled Attendance to Birth
Time
SA
B
1985 1990 1995 2000 2005 2010 2015
0.00
0.01
0.02
0.03
0.04
0.05
Envelope/Births
Time
Env
elop
e/B
irth
s
non−aids
1985 1990 1995 2000 2005 2010 2015
Non−aids MMR
Year
0
100
200
300
400
500
600
700
NO
NA
IDS
MM
R
1985 1990 1995 2000 2005 2010 2015
Aids MMR
Year
0
10
20
30
40
AID
SM
MR

1985 1990 1995 2000 2005 2010 2015
Gambia [GMB] (Western Africa)
Year
0
0.1
0.2
0.3
0.4
0.5
0.6
PM
1985 1990 1995 2000 2005 2010 2015
Gambia [GMB] (Western Africa)
Year
0
500
1000
1500
MM
R
− Estimates −Mlate− MMR Database 2015 −Observed DataAdjusted Data− Data type −DHS
1985 1990 1995 2000 2005 2010 2015
050
010
0015
00
Gross Domestic Product
Time
GD
P
1985 1990 1995 2000 2005 2010 2015
0.00
0.05
0.10
0.15
0.20
General Fertility Rate
Time
GF
R
1985 1990 1995 2000 2005 2010 2015
0.0
0.2
0.4
0.6
0.8
1.0
Skilled Attendance to Birth
Time
SA
B
1985 1990 1995 2000 2005 2010 2015
0.00
00.
005
0.01
00.
015
0.02
00.
025
Envelope/Births
Time
Env
elop
e/B
irth
s
non−aids
1985 1990 1995 2000 2005 2010 2015
Non−aids MMR
Year
0
500
1000
1500
NO
NA
IDS
MM
R
1985 1990 1995 2000 2005 2010 2015
Aids MMR
Year
AID
SM
MR

1985 1990 1995 2000 2005 2010 2015
Georgia [GEO] (Western Asia)
Year
0
0.05
0.1
PM
●
1985 1990 1995 2000 2005 2010 2015
Georgia [GEO] (Western Asia)
Year
0
50
100
150
MM
R
●
●
− Estimates −
Mlate
− MMR Database 2015 −
Observed Data
Adjusted Data
− Data type −
VR
Spec. studiesExcluded VR data (data quality issues)Excluded VR data (overlap with specialized study)
1985 1990 1995 2000 2005 2010 2015
020
0040
0060
0080
0010
000
Gross Domestic Product
Time
GD
P
1985 1990 1995 2000 2005 2010 2015
0.00
0.02
0.04
0.06
0.08
General Fertility Rate
Time
GF
R
1985 1990 1995 2000 2005 2010 2015
0.0
0.2
0.4
0.6
0.8
1.0
Skilled Attendance to Birth
Time
SA
B
1985 1990 1995 2000 2005 2010 2015
0.00
00.
005
0.01
00.
015
0.02
0
Envelope/Births
Time
Env
elop
e/B
irth
s
non−aids
1985 1990 1995 2000 2005 2010 2015
Non−aids MMR
Year
0
10
20
30
40
50
60
NO
NA
IDS
MM
R
1985 1990 1995 2000 2005 2010 2015
Aids MMR
Year
0
0.1
0.2
0.3
0.4
0.5
AID
SM
MR

1985 1990 1995 2000 2005 2010 2015
Germany [DEU] (Developed regions)
Year
0
0.01
PM
1985 1990 1995 2000 2005 2010 2015
Germany [DEU] (Developed regions)
Year
0
5
10
15
20
MM
R
− Estimates −Mlate− MMR Database 2015 −Observed DataAdjusted Data− Data type −VR
1985 1990 1995 2000 2005 2010 2015
010
000
2000
030
000
4000
0
Gross Domestic Product
Time
GD
P
1985 1990 1995 2000 2005 2010 2015
0.00
0.01
0.02
0.03
0.04
General Fertility Rate
Time
GF
R
1985 1990 1995 2000 2005 2010 2015
0.0
0.2
0.4
0.6
0.8
1.0
Skilled Attendance to Birth
Time
SA
B
1985 1990 1995 2000 2005 2010 2015
0.00
00.
005
0.01
00.
015
0.02
0
Envelope/Births
Time
Env
elop
e/B
irth
s
non−aids
1985 1990 1995 2000 2005 2010 2015
Non−aids MMR
Year
0
5
10
15
NO
NA
IDS
MM
R
1985 1990 1995 2000 2005 2010 2015
Aids MMR
Year
0
0.02
0.04
0.06
0.08
AID
SM
MR

1985 1990 1995 2000 2005 2010 2015
Ghana [GHA] (Western Africa)
Year
0
0.1
0.2
0.3
0.4
PM
1985 1990 1995 2000 2005 2010 2015
Ghana [GHA] (Western Africa)
Year
0
500
1000
MM
R
− Estimates −Mlate− MMR Database 2015 −Observed DataAdjusted Data− Data type −DHSCensus
1985 1990 1995 2000 2005 2010 2015
010
0020
0030
0040
00
Gross Domestic Product
Time
GD
P
1985 1990 1995 2000 2005 2010 2015
0.00
0.05
0.10
0.15
0.20
General Fertility Rate
Time
GF
R
1985 1990 1995 2000 2005 2010 2015
0.0
0.2
0.4
0.6
0.8
1.0
Skilled Attendance to Birth
Time
SA
B
1985 1990 1995 2000 2005 2010 2015
0.00
0.01
0.02
0.03
Envelope/Births
Time
Env
elop
e/B
irth
s
non−aids
1985 1990 1995 2000 2005 2010 2015
Non−aids MMR
Year
0
500
1000
NO
NA
IDS
MM
R
1985 1990 1995 2000 2005 2010 2015
Aids MMR
Year
0
5
10
15
AID
SM
MR

1985 1990 1995 2000 2005 2010 2015
Greece [GRC] (Developed regions)
Year
0
0.01
PM
1985 1990 1995 2000 2005 2010 2015
Greece [GRC] (Developed regions)
Year
0
5
10
15
20
MM
R
− Estimates −
Mlate
− MMR Database 2015 −
Observed Data
Adjusted Data
− Data type −
VRReported VR before recalc.(related to 0 obs. mat. death)
1985 1990 1995 2000 2005 2010 2015
050
0010
000
1500
020
000
2500
030
000
3500
0 Gross Domestic Product
Time
GD
P
1985 1990 1995 2000 2005 2010 2015
0.00
0.01
0.02
0.03
0.04
0.05
General Fertility Rate
Time
GF
R
1985 1990 1995 2000 2005 2010 2015
0.0
0.2
0.4
0.6
0.8
1.0
Skilled Attendance to Birth
Time
SA
B
1985 1990 1995 2000 2005 2010 2015
0.00
00.
005
0.01
00.
015
Envelope/Births
Time
Env
elop
e/B
irth
s
non−aids
1985 1990 1995 2000 2005 2010 2015
Non−aids MMR
Year
NO
NA
IDS
MM
R
1985 1990 1995 2000 2005 2010 2015
Aids MMR
Year
0
0.05
0.1
0.15
0.2
0.25
0.3
AID
SM
MR

1985 1990 1995 2000 2005 2010 2015
Grenada [GRD] (Caribbean)
Year
0
0.05
0.1
0.15
0.2
PM
1985 1990 1995 2000 2005 2010 2015
Grenada [GRD] (Caribbean)
Year
0
50
100
150
200
250
MM
R
− Estimates −
Mlate
− MMR Database 2015 −
Observed Data
Adjusted Data
− Data type −
VRReported VR before recalc.(related to 0 obs. mat. death)
1985 1990 1995 2000 2005 2010 2015
020
0040
0060
0080
0010
000
1200
0
Gross Domestic Product
Time
GD
P
1985 1990 1995 2000 2005 2010 2015
0.00
0.05
0.10
0.15
General Fertility Rate
Time
GF
R
1985 1990 1995 2000 2005 2010 2015
0.0
0.2
0.4
0.6
0.8
1.0
Skilled Attendance to Birth
Time
SA
B
1985 1990 1995 2000 2005 2010 2015
0.00
00.
005
0.01
00.
015
Envelope/Births
Time
Env
elop
e/B
irth
s
non−aids
1985 1990 1995 2000 2005 2010 2015
Non−aids MMR
Year
0
10
20
30
40
50
60
NO
NA
IDS
MM
R
1985 1990 1995 2000 2005 2010 2015
Aids MMR
Year
0
0.05
0.1
0.15
0.2
0.25
0.3
0.35
AID
SM
MR

1985 1990 1995 2000 2005 2010 2015
Guatemala [GTM] (Central America)
Year
0
0.05
0.1
0.15
0.2
PM
1985 1990 1995 2000 2005 2010 2015
Guatemala [GTM] (Central America)
Year
0
50
100
150
200
250
300
350
MM
R
− Estimates −
Mlate
− MMR Database 2015 −
Observed Data
Adjusted Data
− Data type −
VR
Spec. studies
Misc. studiesExcluded VR data (overlap with specialized study)
1985 1990 1995 2000 2005 2010 2015
020
0040
0060
0080
00
Gross Domestic Product
Time
GD
P
1985 1990 1995 2000 2005 2010 2015
0.00
0.05
0.10
0.15
0.20
General Fertility Rate
Time
GF
R
1985 1990 1995 2000 2005 2010 2015
0.0
0.2
0.4
0.6
0.8
1.0
Skilled Attendance to Birth
Time
SA
B
1985 1990 1995 2000 2005 2010 2015
0.00
00.
005
0.01
00.
015
Envelope/Births
Time
Env
elop
e/B
irth
s
non−aids
1985 1990 1995 2000 2005 2010 2015
Non−aids MMR
Year
0
50
100
150
200
250
300
NO
NA
IDS
MM
R
1985 1990 1995 2000 2005 2010 2015
Aids MMR
Year
AID
SM
MR

1985 1990 1995 2000 2005 2010 2015
Guinea [GIN] (Western Africa)
Year
0
0.1
0.2
0.3
0.4
0.5
PM
1985 1990 1995 2000 2005 2010 2015
Guinea [GIN] (Western Africa)
Year
0
500
1000
1500
MM
R
− Estimates −Mlate− MMR Database 2015 −Observed DataAdjusted Data− Data type −DHS
1985 1990 1995 2000 2005 2010 2015
020
040
060
080
010
0012
0014
00
Gross Domestic Product
Time
GD
P
1985 1990 1995 2000 2005 2010 2015
0.00
0.05
0.10
0.15
0.20
General Fertility Rate
Time
GF
R
1985 1990 1995 2000 2005 2010 2015
0.0
0.2
0.4
0.6
0.8
1.0
Skilled Attendance to Birth
Time
SA
B
1985 1990 1995 2000 2005 2010 2015
0.00
00.
005
0.01
00.
015
0.02
00.
025
0.03
00.
035
Envelope/Births
Time
Env
elop
e/B
irth
s
non−aids
1985 1990 1995 2000 2005 2010 2015
Non−aids MMR
Year
0
500
1000
1500
NO
NA
IDS
MM
R
1985 1990 1995 2000 2005 2010 2015
Aids MMR
Year
0
5
10
AID
SM
MR
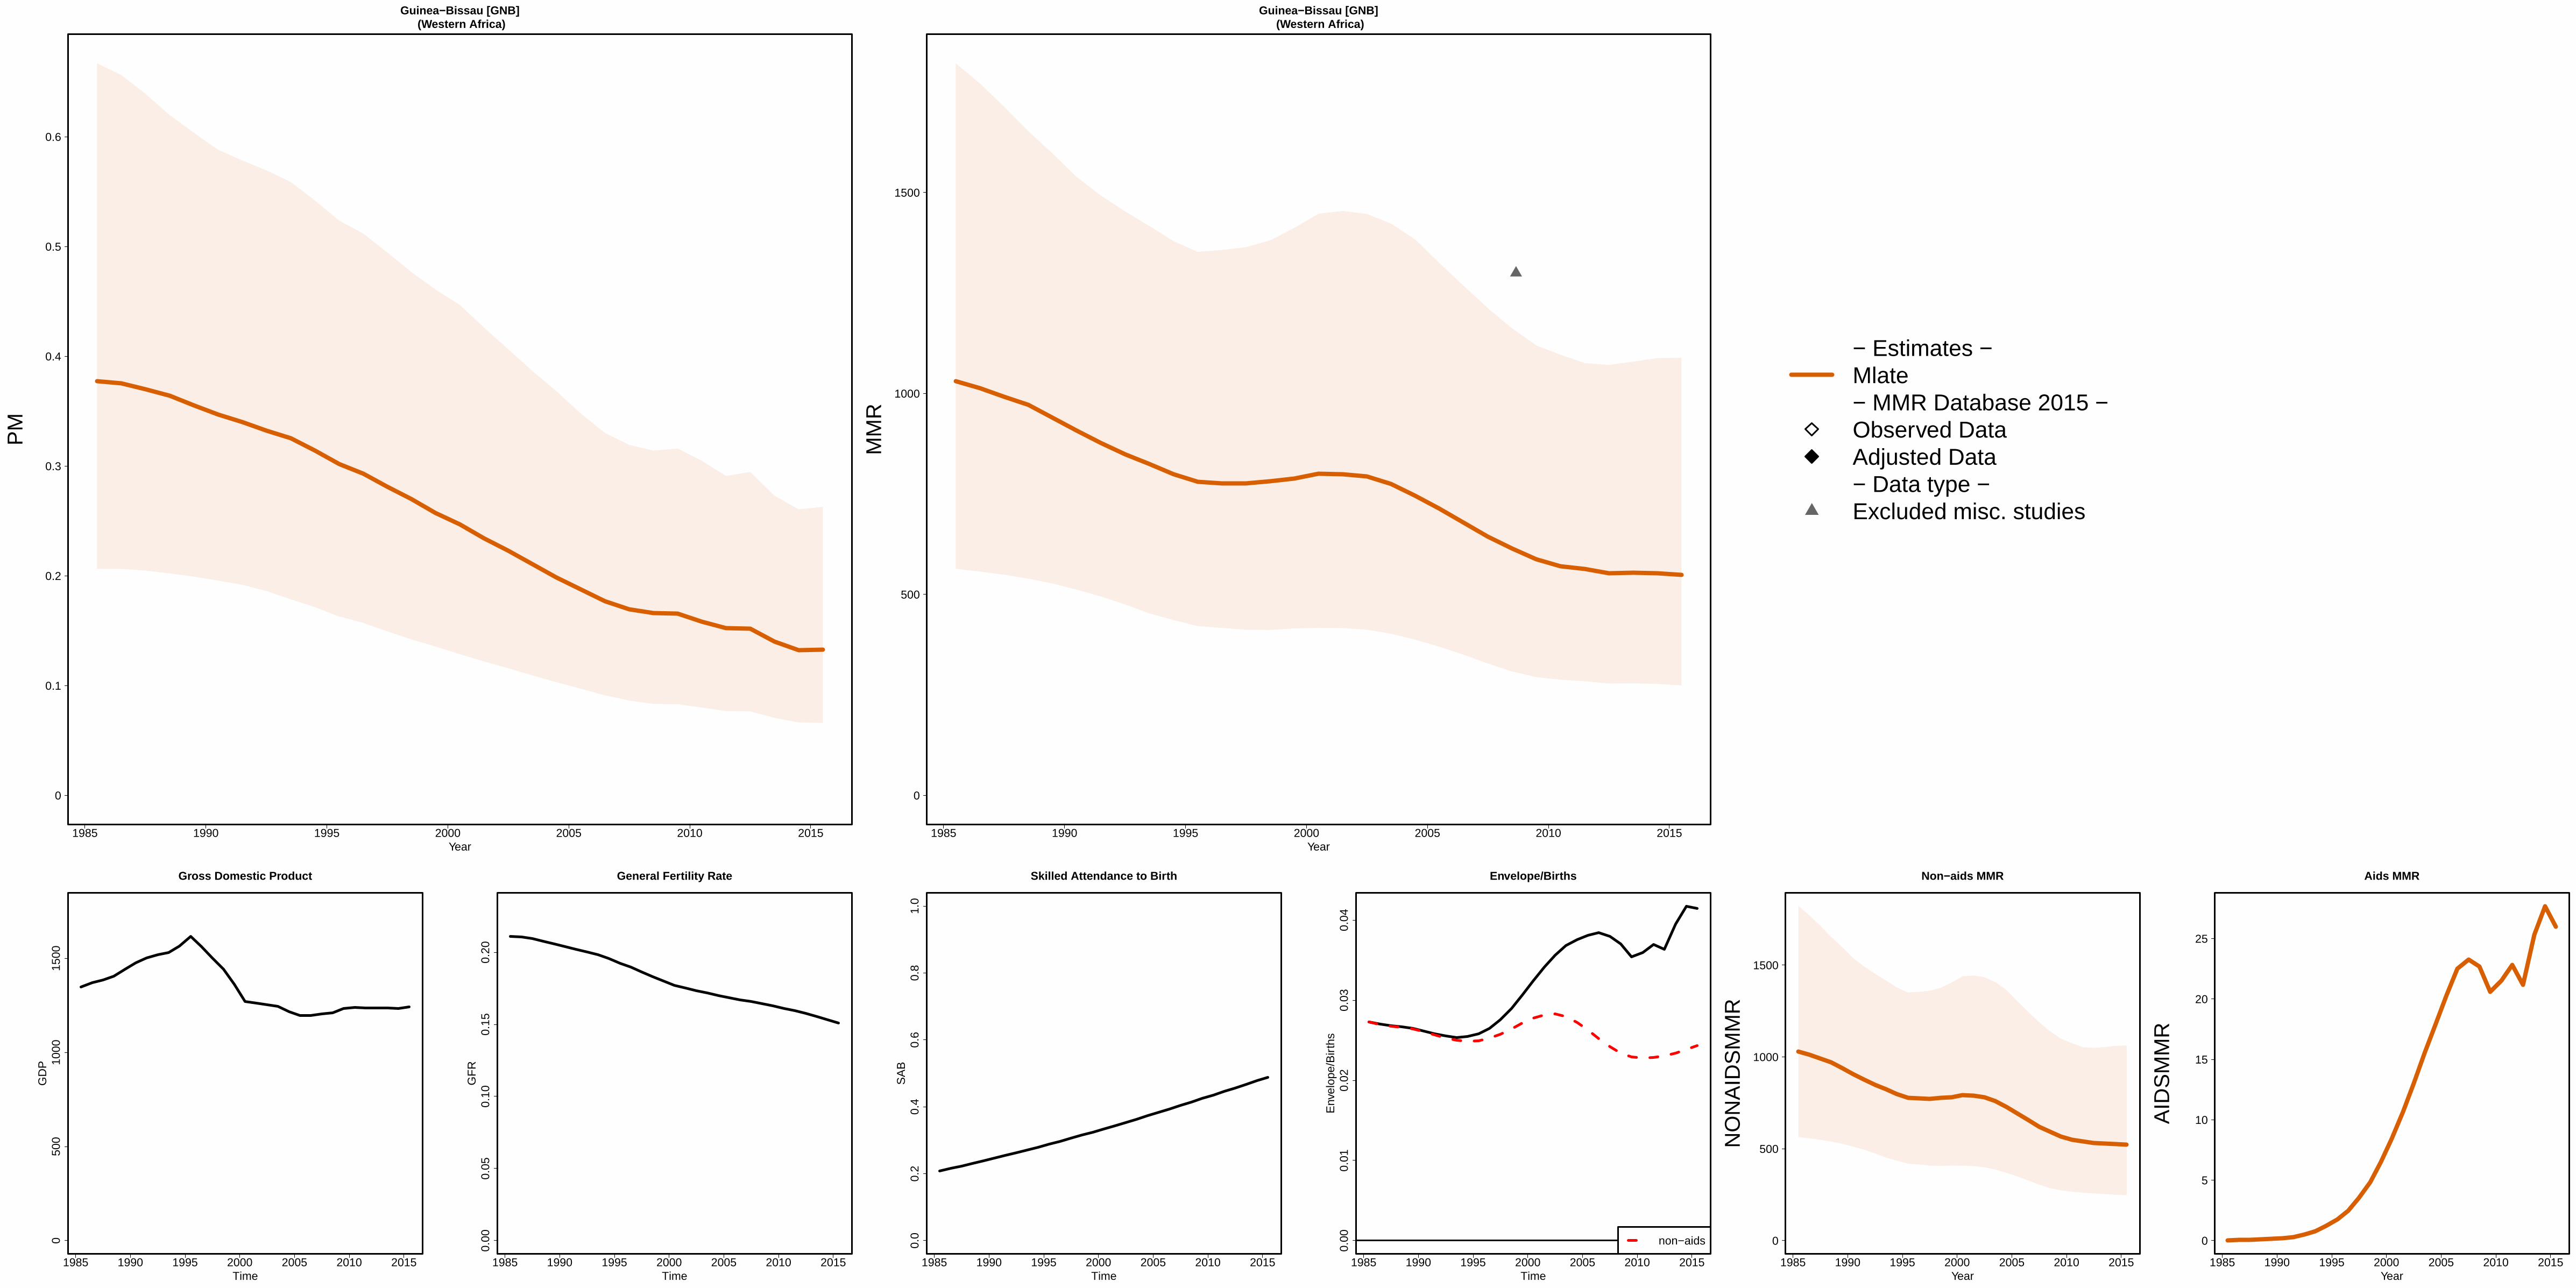
1985 1990 1995 2000 2005 2010 2015
Guinea−Bissau [GNB] (Western Africa)
Year
0
0.1
0.2
0.3
0.4
0.5
0.6
PM
1985 1990 1995 2000 2005 2010 2015
Guinea−Bissau [GNB] (Western Africa)
Year
0
500
1000
1500
MM
R
− Estimates −Mlate− MMR Database 2015 −Observed DataAdjusted Data− Data type −Excluded misc. studies
1985 1990 1995 2000 2005 2010 2015
050
010
0015
00
Gross Domestic Product
Time
GD
P
1985 1990 1995 2000 2005 2010 2015
0.00
0.05
0.10
0.15
0.20
General Fertility Rate
Time
GF
R
1985 1990 1995 2000 2005 2010 2015
0.0
0.2
0.4
0.6
0.8
1.0
Skilled Attendance to Birth
Time
SA
B
1985 1990 1995 2000 2005 2010 2015
0.00
0.01
0.02
0.03
0.04
Envelope/Births
Time
Env
elop
e/B
irth
s
non−aids
1985 1990 1995 2000 2005 2010 2015
Non−aids MMR
Year
0
500
1000
1500
NO
NA
IDS
MM
R
1985 1990 1995 2000 2005 2010 2015
Aids MMR
Year
0
5
10
15
20
25
AID
SM
MR

1985 1990 1995 2000 2005 2010 2015
Guyana [GUY] (South America)
Year
0
0.05
0.1
0.15
PM
1985 1990 1995 2000 2005 2010 2015
Guyana [GUY] (South America)
Year
0
100
200
300
400
MM
R
− Estimates −Mlate− MMR Database 2015 −Observed DataAdjusted Data− Data type −VR
1985 1990 1995 2000 2005 2010 2015
020
0040
0060
00
Gross Domestic Product
Time
GD
P
1985 1990 1995 2000 2005 2010 2015
0.00
0.05
0.10
0.15
General Fertility Rate
Time
GF
R
1985 1990 1995 2000 2005 2010 2015
0.0
0.2
0.4
0.6
0.8
1.0
Skilled Attendance to Birth
Time
SA
B
1985 1990 1995 2000 2005 2010 2015
0.00
0.01
0.02
0.03
0.04
0.05
Envelope/Births
Time
Env
elop
e/B
irth
s
non−aids
1985 1990 1995 2000 2005 2010 2015
Non−aids MMR
Year
0
50
100
150
200
250
300
NO
NA
IDS
MM
R
1985 1990 1995 2000 2005 2010 2015
Aids MMR
Year
AID
SM
MR
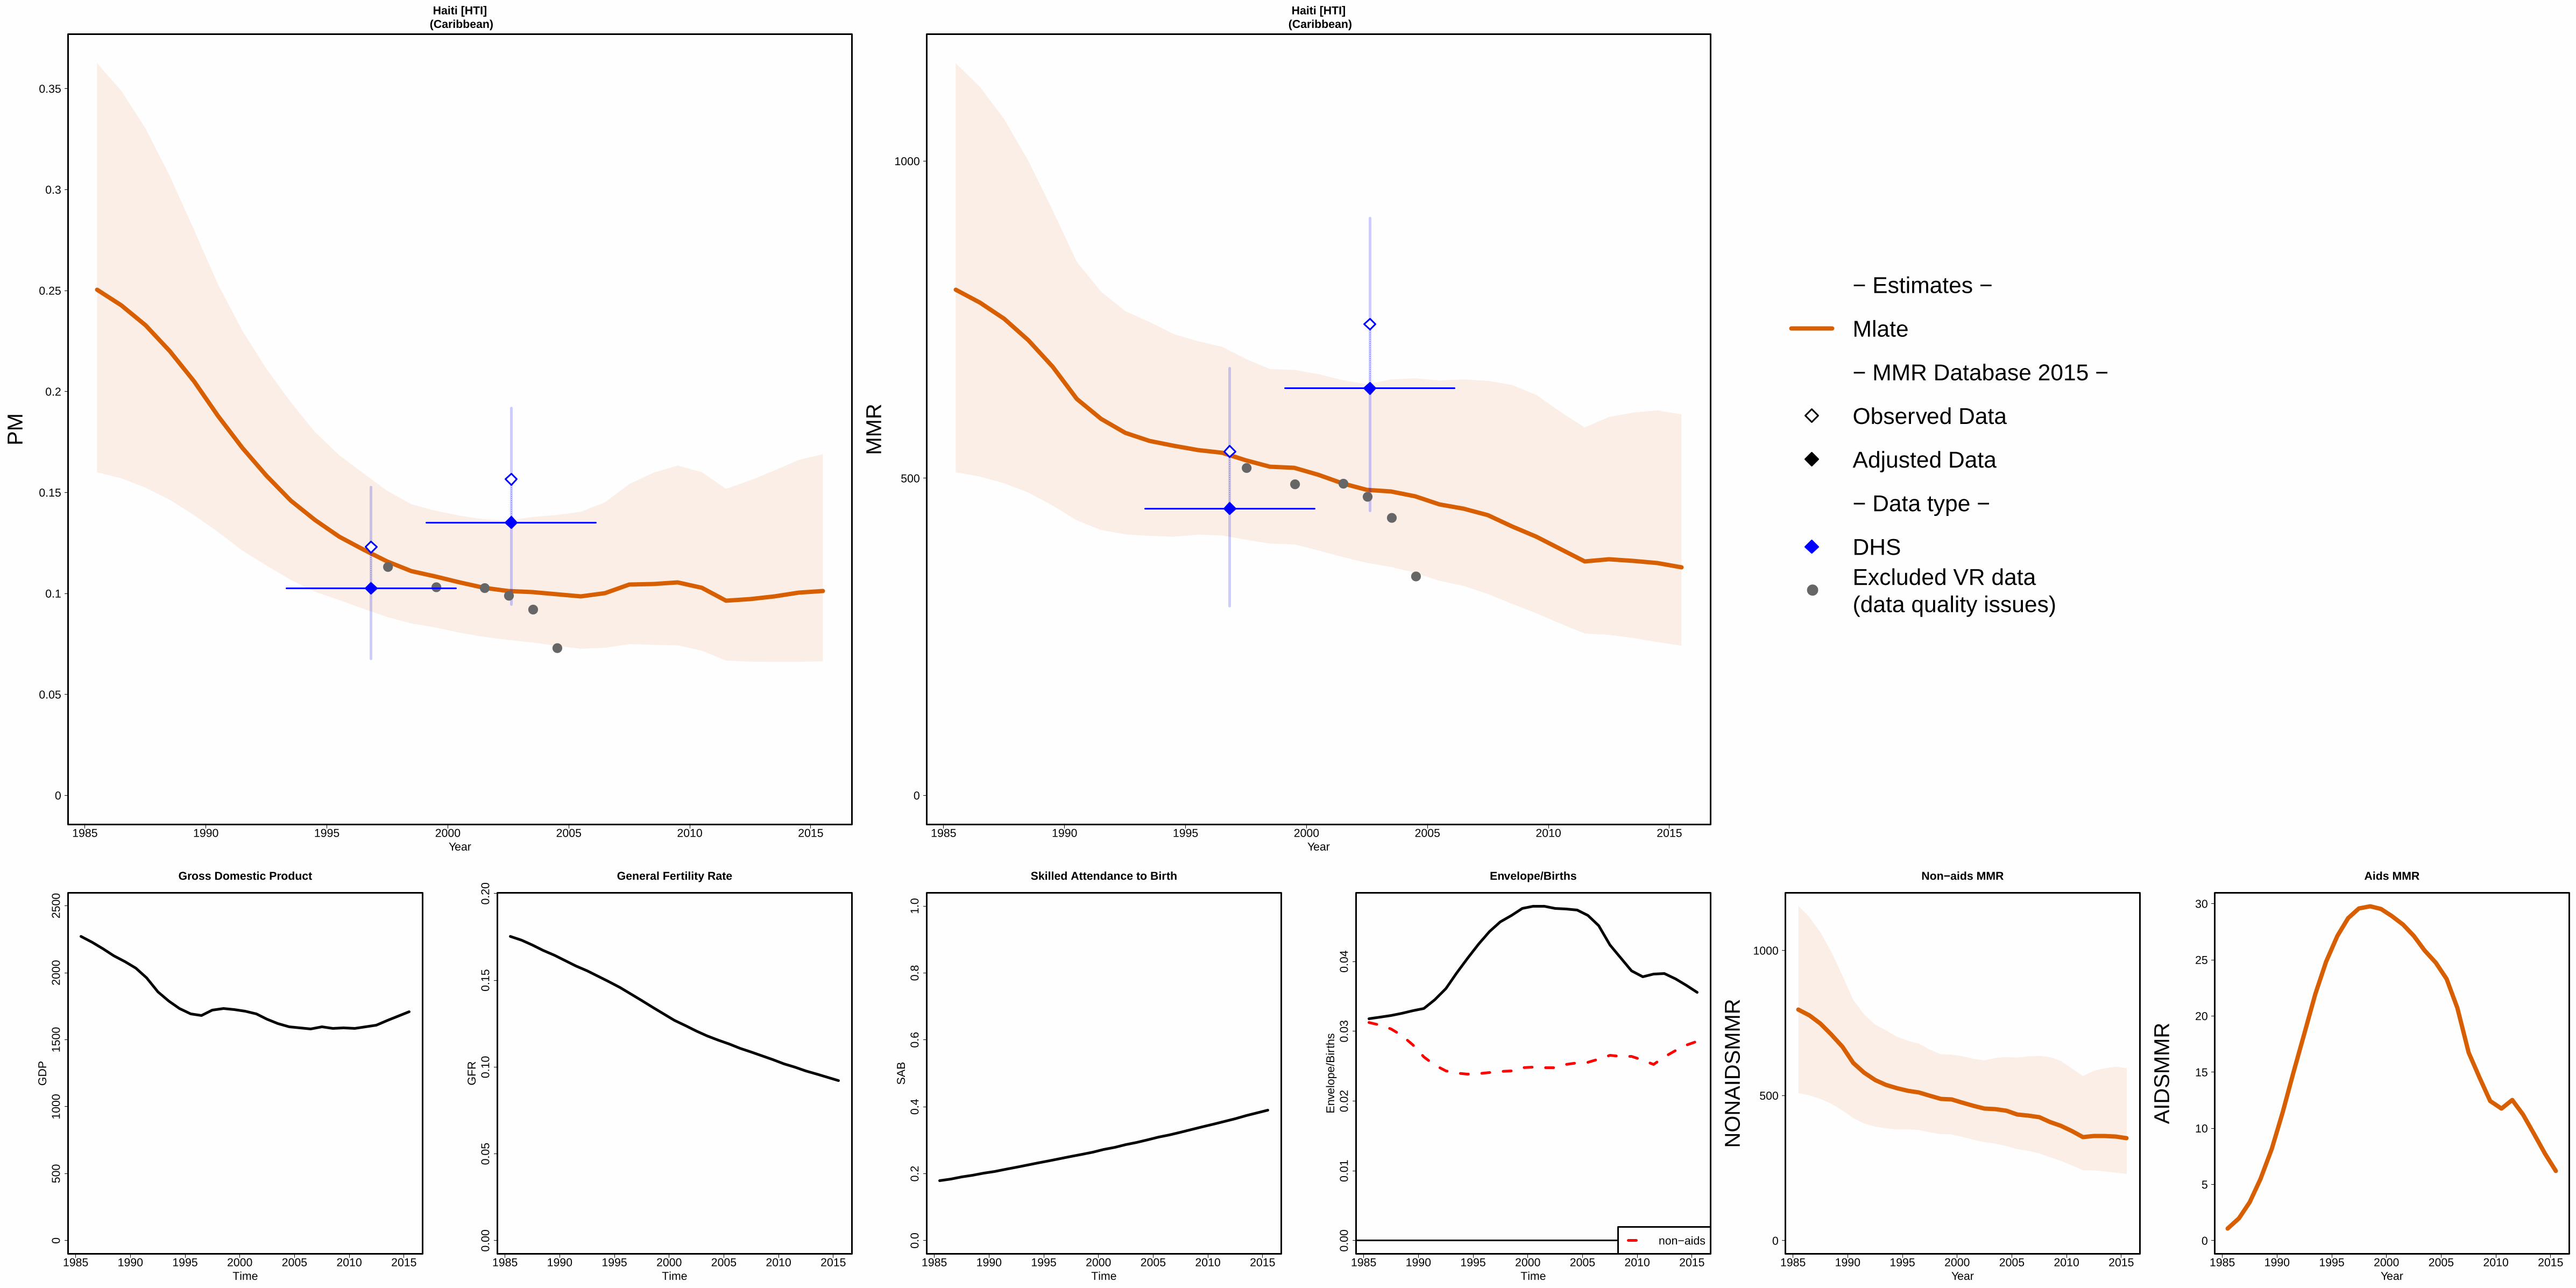
1985 1990 1995 2000 2005 2010 2015
Haiti [HTI] (Caribbean)
Year
0
0.05
0.1
0.15
0.2
0.25
0.3
0.35
PM
●
● ●●
●
●
1985 1990 1995 2000 2005 2010 2015
Haiti [HTI] (Caribbean)
Year
0
500
1000
MM
R
●
● ●●
●
●●
− Estimates −
Mlate
− MMR Database 2015 −
Observed Data
Adjusted Data
− Data type −
DHSExcluded VR data (data quality issues)
1985 1990 1995 2000 2005 2010 2015
050
010
0015
0020
0025
00
Gross Domestic Product
Time
GD
P
1985 1990 1995 2000 2005 2010 2015
0.00
0.05
0.10
0.15
0.20
General Fertility Rate
Time
GF
R
1985 1990 1995 2000 2005 2010 2015
0.0
0.2
0.4
0.6
0.8
1.0
Skilled Attendance to Birth
Time
SA
B
1985 1990 1995 2000 2005 2010 2015
0.00
0.01
0.02
0.03
0.04
Envelope/Births
Time
Env
elop
e/B
irth
s
non−aids
1985 1990 1995 2000 2005 2010 2015
Non−aids MMR
Year
0
500
1000
NO
NA
IDS
MM
R
1985 1990 1995 2000 2005 2010 2015
Aids MMR
Year
0
5
10
15
20
25
30
AID
SM
MR

1985 1990 1995 2000 2005 2010 2015
Honduras [HND] (Central America)
Year
0
0.05
0.1
0.15
0.2
0.25
0.3
PM
●
●
●
●
●
●●
●
●
●
1985 1990 1995 2000 2005 2010 2015
Honduras [HND] (Central America)
Year
0
100
200
300
400
500
MM
R
●
●
●
●
●
●●
●
●
●
●
− Estimates −
Mlate
− MMR Database 2015 −
Observed Data
Adjusted Data
− Data type −
Spec. studies
Census
Misc. studiesExcluded VR data (data quality issues)
1985 1990 1995 2000 2005 2010 2015
010
0020
0030
0040
0050
00
Gross Domestic Product
Time
GD
P
1985 1990 1995 2000 2005 2010 2015
0.00
0.05
0.10
0.15
0.20
General Fertility Rate
Time
GF
R
1985 1990 1995 2000 2005 2010 2015
0.0
0.2
0.4
0.6
0.8
1.0
Skilled Attendance to Birth
Time
SA
B
1985 1990 1995 2000 2005 2010 2015
0.00
00.
005
0.01
00.
015
0.02
0
Envelope/Births
Time
Env
elop
e/B
irth
s
non−aids
1985 1990 1995 2000 2005 2010 2015
Non−aids MMR
Year
0
100
200
300
400
500
NO
NA
IDS
MM
R
1985 1990 1995 2000 2005 2010 2015
Aids MMR
Year
AID
SM
MR

1985 1990 1995 2000 2005 2010 2015
Hungary [HUN] (Developed regions)
Year
0
0.01
PM
1985 1990 1995 2000 2005 2010 2015
Hungary [HUN] (Developed regions)
Year
0
10
20
30
40
50
60
MM
R
− Estimates −Mlate− MMR Database 2015 −Observed DataAdjusted Data− Data type −VR
1985 1990 1995 2000 2005 2010 2015
050
0010
000
1500
020
000
2500
0
Gross Domestic Product
Time
GD
P
1985 1990 1995 2000 2005 2010 2015
0.00
0.01
0.02
0.03
0.04
0.05
General Fertility Rate
Time
GF
R
1985 1990 1995 2000 2005 2010 2015
0.0
0.2
0.4
0.6
0.8
1.0
Skilled Attendance to Birth
Time
SA
B
1985 1990 1995 2000 2005 2010 2015
0.00
0.01
0.02
0.03
0.04
Envelope/Births
Time
Env
elop
e/B
irth
s
non−aids
1985 1990 1995 2000 2005 2010 2015
Non−aids MMR
Year
0
5
10
15
20
25
30
NO
NA
IDS
MM
R
1985 1990 1995 2000 2005 2010 2015
Aids MMR
Year
0
0.01
0.02
AID
SM
MR

1985 1990 1995 2000 2005 2010 2015
Iceland [ISL] (Developed regions)
Year
0
0.01
0.02
PM
1985 1990 1995 2000 2005 2010 2015
Iceland [ISL] (Developed regions)
Year
0
5
10
15
20
25
MM
R
− Estimates −
Mlate
− MMR Database 2015 −
Observed Data
Adjusted Data
− Data type −
VRReported VR before recalc.(related to 0 obs. mat. death)
1985 1990 1995 2000 2005 2010 2015
010
000
2000
030
000
4000
0
Gross Domestic Product
Time
GD
P
1985 1990 1995 2000 2005 2010 2015
0.00
0.02
0.04
0.06
0.08
General Fertility Rate
Time
GF
R
1985 1990 1995 2000 2005 2010 2015
0.0
0.2
0.4
0.6
0.8
1.0
Skilled Attendance to Birth
Time
SA
B
1985 1990 1995 2000 2005 2010 2015
0.00
00.
002
0.00
40.
006
0.00
80.
010
Envelope/Births
Time
Env
elop
e/B
irth
s
non−aids
1985 1990 1995 2000 2005 2010 2015
Non−aids MMR
Year
0
5
10
NO
NA
IDS
MM
R
1985 1990 1995 2000 2005 2010 2015
Aids MMR
Year
0
0.05
0.1
AID
SM
MR

1985 1990 1995 2000 2005 2010 2015
India [IND] (Southern Asia)
Year
0
0.05
0.1
0.15
0.2
0.25
0.3
PM
1985 1990 1995 2000 2005 2010 2015
India [IND] (Southern Asia)
Year
0
100
200
300
400
500
600
700
800
900
MM
R
− Estimates −Mlate− MMR Database 2015 −Observed DataAdjusted Data− Data type −Misc. studies
1985 1990 1995 2000 2005 2010 2015
010
0020
0030
0040
0050
0060
00
Gross Domestic Product
Time
GD
P
1985 1990 1995 2000 2005 2010 2015
0.00
0.05
0.10
0.15
General Fertility Rate
Time
GF
R
1985 1990 1995 2000 2005 2010 2015
0.0
0.2
0.4
0.6
0.8
1.0
Skilled Attendance to Birth
Time
SA
B
1985 1990 1995 2000 2005 2010 2015
0.00
00.
005
0.01
00.
015
0.02
00.
025
0.03
0 Envelope/Births
Time
Env
elop
e/B
irth
s
non−aids
1985 1990 1995 2000 2005 2010 2015
Non−aids MMR
Year
0
100
200
300
400
500
600
700
800
NO
NA
IDS
MM
R
1985 1990 1995 2000 2005 2010 2015
Aids MMR
Year
AID
SM
MR
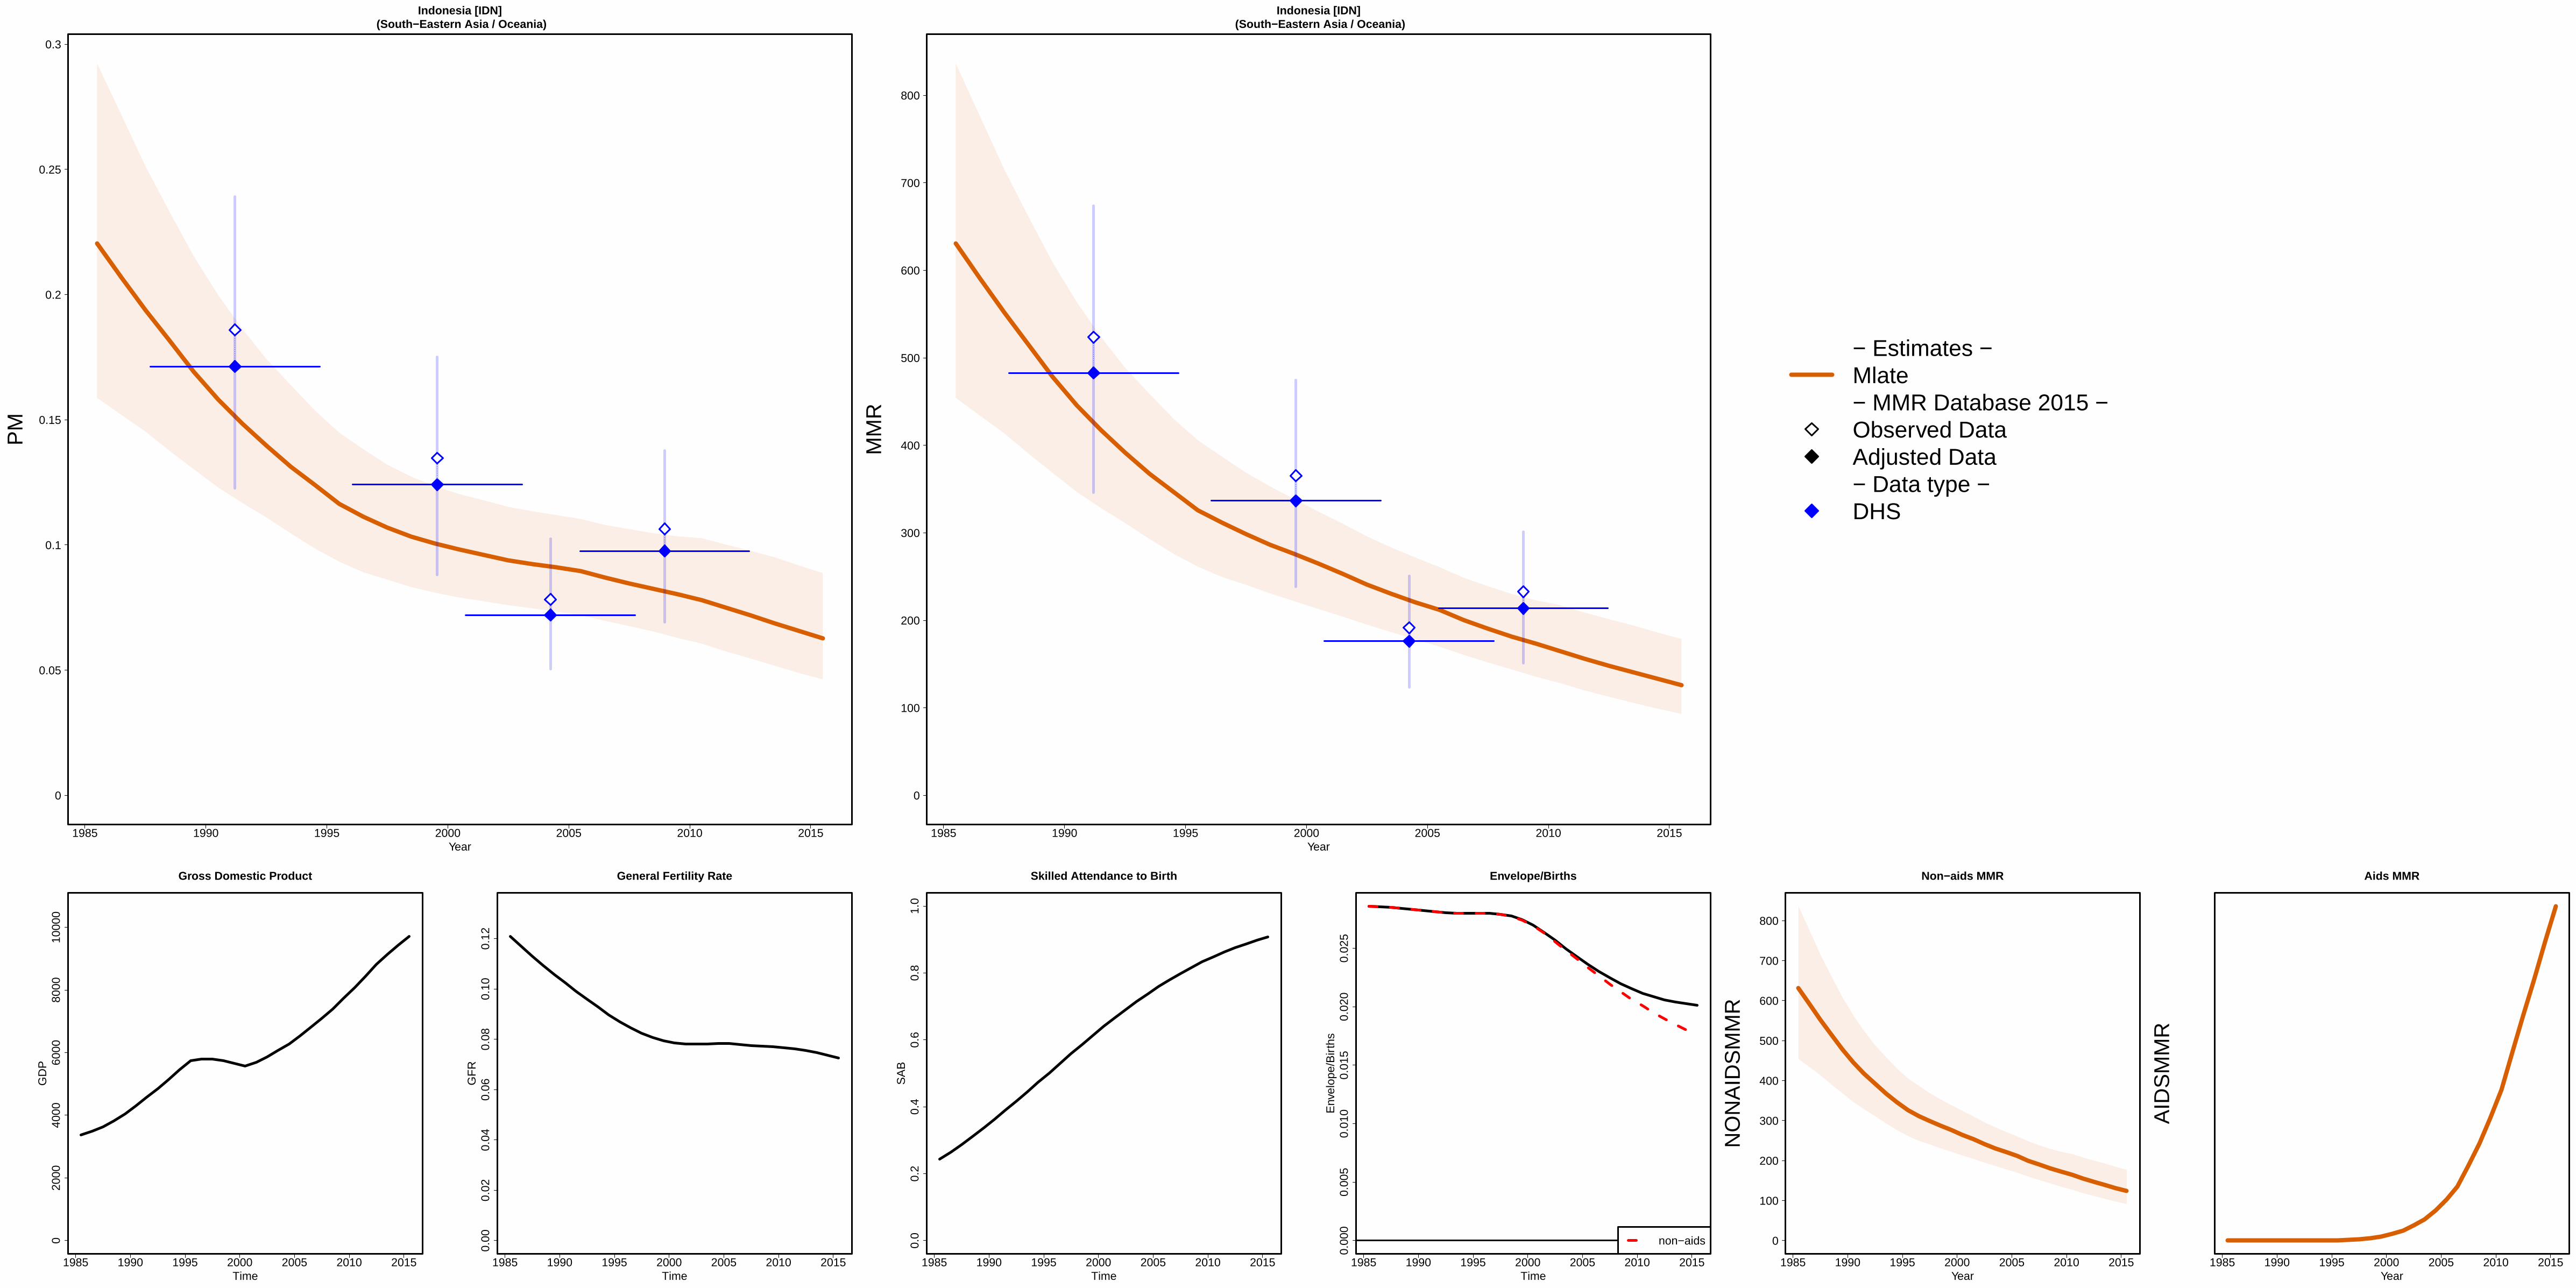
1985 1990 1995 2000 2005 2010 2015
Indonesia [IDN] (South−Eastern Asia / Oceania)
Year
0
0.05
0.1
0.15
0.2
0.25
0.3
PM
1985 1990 1995 2000 2005 2010 2015
Indonesia [IDN] (South−Eastern Asia / Oceania)
Year
0
100
200
300
400
500
600
700
800
MM
R
− Estimates −Mlate− MMR Database 2015 −Observed DataAdjusted Data− Data type −DHS
1985 1990 1995 2000 2005 2010 2015
020
0040
0060
0080
0010
000
Gross Domestic Product
Time
GD
P
1985 1990 1995 2000 2005 2010 2015
0.00
0.02
0.04
0.06
0.08
0.10
0.12
General Fertility Rate
Time
GF
R
1985 1990 1995 2000 2005 2010 2015
0.0
0.2
0.4
0.6
0.8
1.0
Skilled Attendance to Birth
Time
SA
B
1985 1990 1995 2000 2005 2010 2015
0.00
00.
005
0.01
00.
015
0.02
00.
025
Envelope/Births
Time
Env
elop
e/B
irth
s
non−aids
1985 1990 1995 2000 2005 2010 2015
Non−aids MMR
Year
0
100
200
300
400
500
600
700
800
NO
NA
IDS
MM
R
1985 1990 1995 2000 2005 2010 2015
Aids MMR
Year
AID
SM
MR

1985 1990 1995 2000 2005 2010 2015
Iran [IRN] (Southern Asia)
Year
0
0.05
0.1
0.15
PM
1985 1990 1995 2000 2005 2010 2015
Iran [IRN] (Southern Asia)
Year
0
50
100
150
200
250
MM
R
− Estimates −Mlate− MMR Database 2015 −Observed DataAdjusted Data− Data type −CensusMisc. studies
1985 1990 1995 2000 2005 2010 2015
050
0010
000
1500
0
Gross Domestic Product
Time
GD
P
1985 1990 1995 2000 2005 2010 2015
0.00
0.05
0.10
0.15
0.20
General Fertility Rate
Time
GF
R
1985 1990 1995 2000 2005 2010 2015
0.0
0.2
0.4
0.6
0.8
1.0
Skilled Attendance to Birth
Time
SA
B
1985 1990 1995 2000 2005 2010 2015
0.00
00.
005
0.01
00.
015
0.02
0
Envelope/Births
Time
Env
elop
e/B
irth
s
non−aids
1985 1990 1995 2000 2005 2010 2015
Non−aids MMR
Year
0
50
100
150
200
250
NO
NA
IDS
MM
R
1985 1990 1995 2000 2005 2010 2015
Aids MMR
Year
0
0.05
0.1
0.15
0.2
0.25
AID
SM
MR
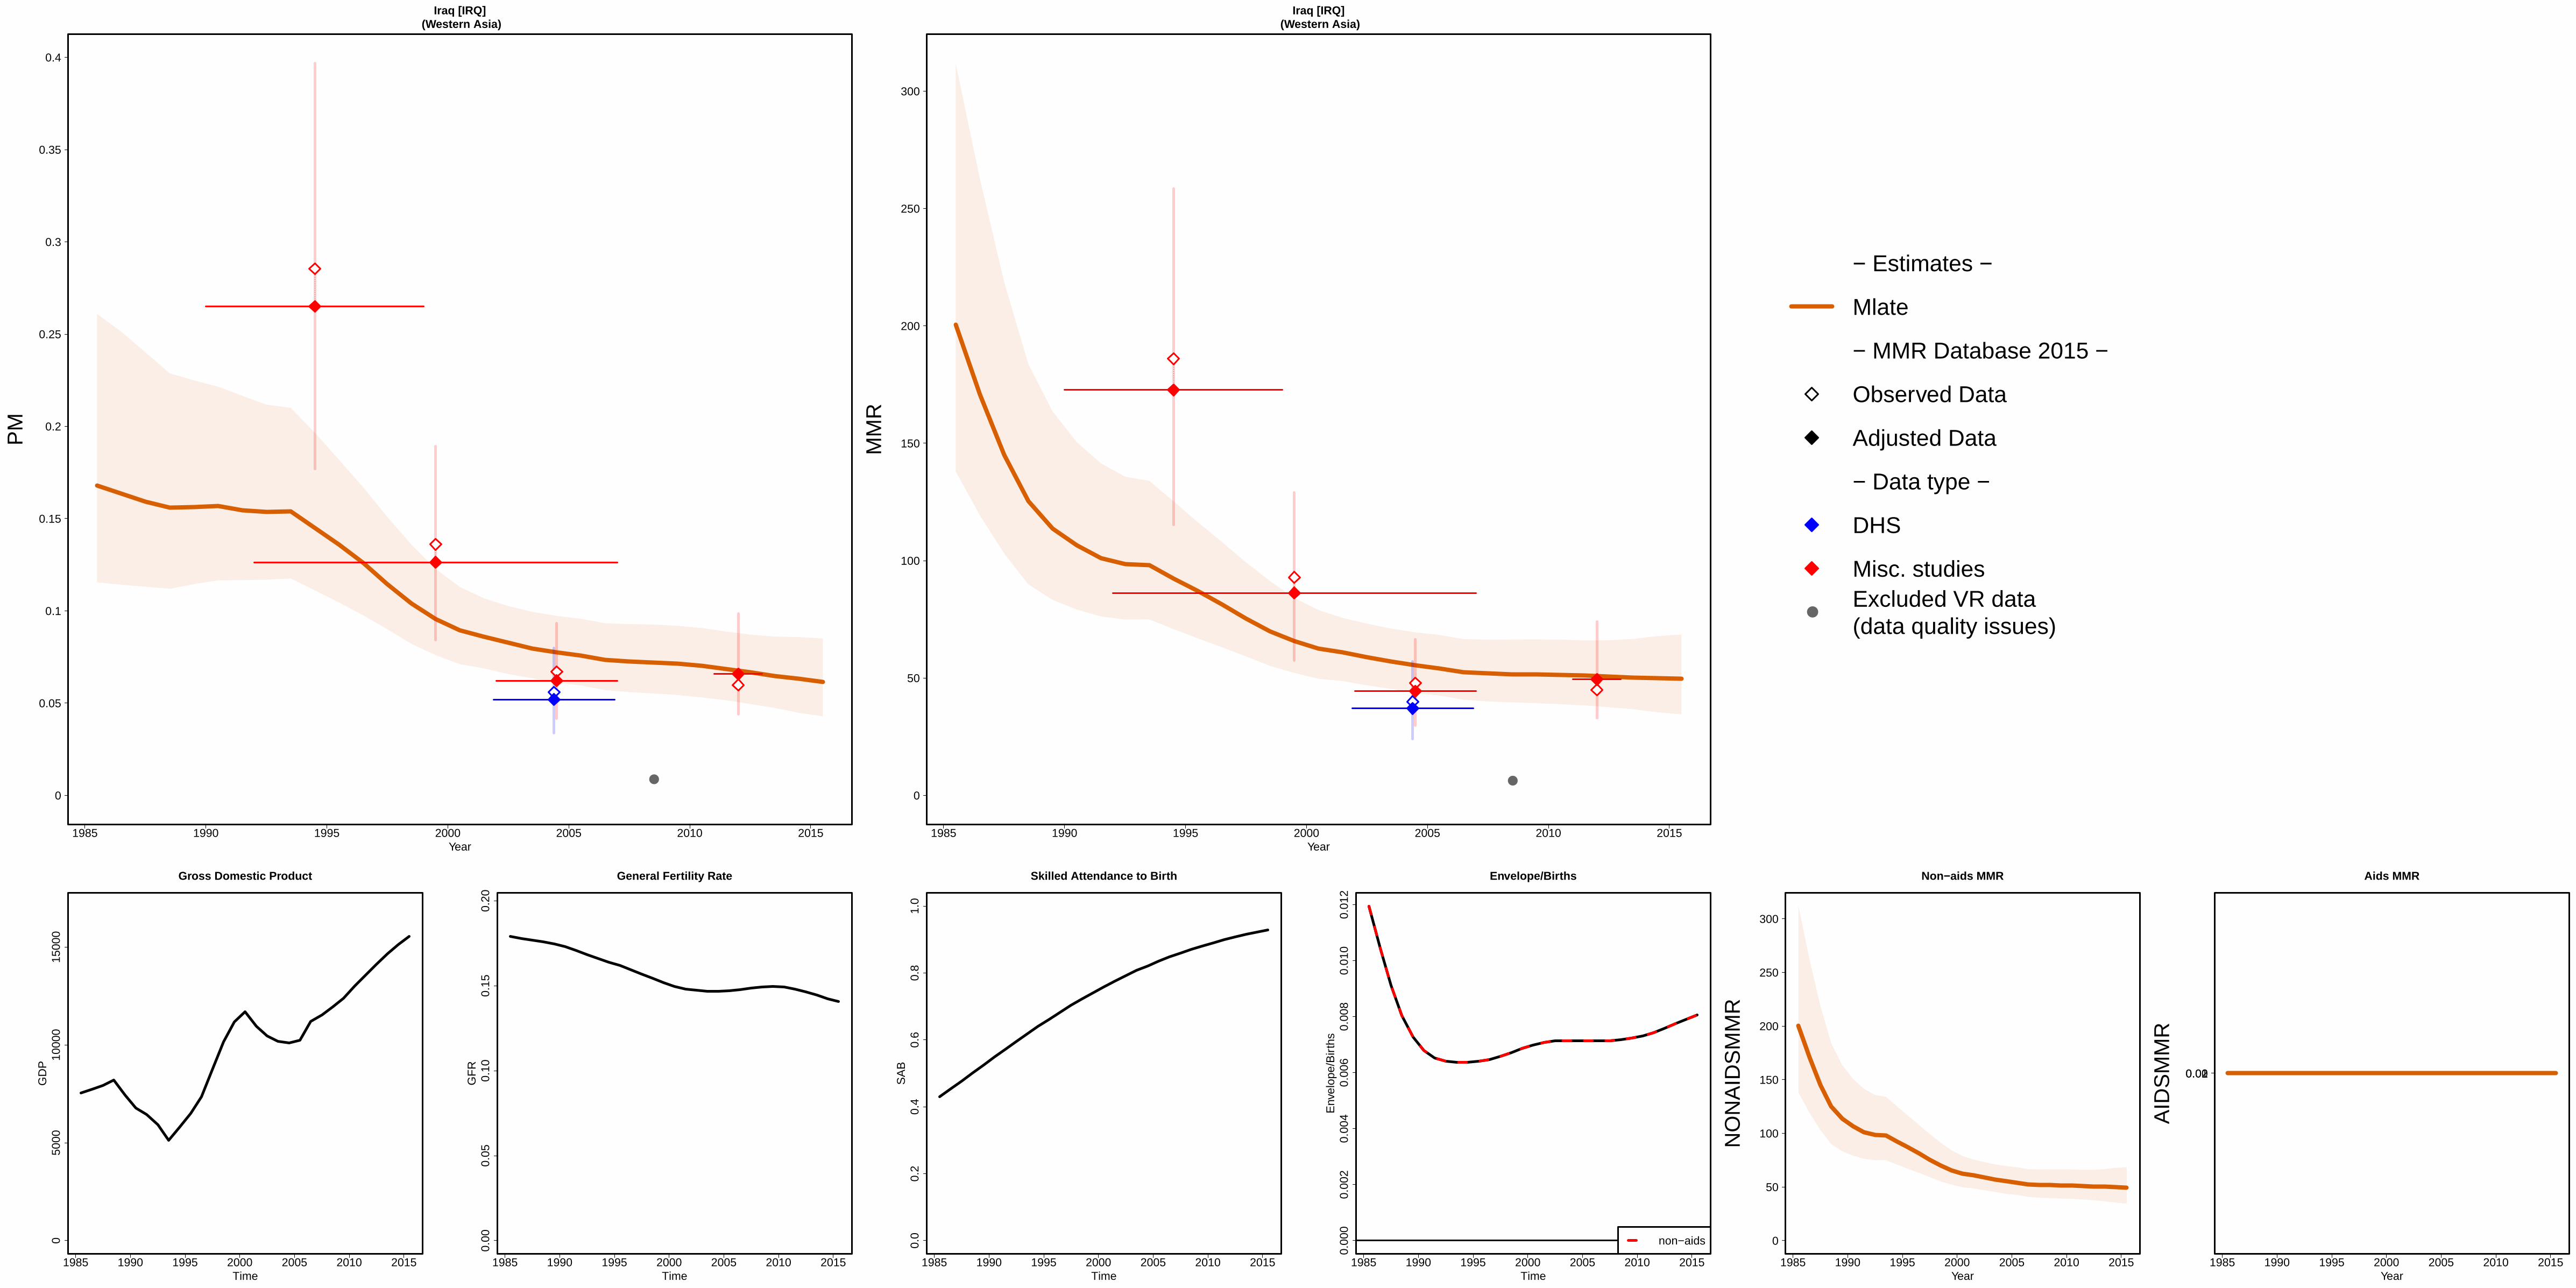
1985 1990 1995 2000 2005 2010 2015
Iraq [IRQ] (Western Asia)
Year
0
0.05
0.1
0.15
0.2
0.25
0.3
0.35
0.4
PM
●
1985 1990 1995 2000 2005 2010 2015
Iraq [IRQ] (Western Asia)
Year
0
50
100
150
200
250
300
MM
R
●
●
− Estimates −
Mlate
− MMR Database 2015 −
Observed Data
Adjusted Data
− Data type −
DHS
Misc. studiesExcluded VR data (data quality issues)
1985 1990 1995 2000 2005 2010 2015
050
0010
000
1500
0
Gross Domestic Product
Time
GD
P
1985 1990 1995 2000 2005 2010 2015
0.00
0.05
0.10
0.15
0.20
General Fertility Rate
Time
GF
R
1985 1990 1995 2000 2005 2010 2015
0.0
0.2
0.4
0.6
0.8
1.0
Skilled Attendance to Birth
Time
SA
B
1985 1990 1995 2000 2005 2010 2015
0.00
00.
002
0.00
40.
006
0.00
80.
010
0.01
2
Envelope/Births
Time
Env
elop
e/B
irth
s
non−aids
1985 1990 1995 2000 2005 2010 2015
Non−aids MMR
Year
0
50
100
150
200
250
300
NO
NA
IDS
MM
R
1985 1990 1995 2000 2005 2010 2015
Aids MMR
Year
00.010.02
AID
SM
MR

1985 1990 1995 2000 2005 2010 2015
Ireland [IRL] (Developed regions)
Year
0
0.01
0.02
0.03
PM
1985 1990 1995 2000 2005 2010 2015
Ireland [IRL] (Developed regions)
Year
0
10
20
30
40
MM
R
− Estimates −
Mlate
− MMR Database 2015 −
Observed Data
Adjusted Data
− Data type −
VR
Spec. studiesReported VR before recalc.(related to 0 obs. mat. death)Excluded VR data (overlap with specialized study)
1985 1990 1995 2000 2005 2010 2015
010
000
2000
030
000
4000
050
000
Gross Domestic Product
Time
GD
P
1985 1990 1995 2000 2005 2010 2015
0.00
0.02
0.04
0.06
0.08
General Fertility Rate
Time
GF
R
1985 1990 1995 2000 2005 2010 2015
0.0
0.2
0.4
0.6
0.8
1.0
Skilled Attendance to Birth
Time
SA
B
1985 1990 1995 2000 2005 2010 2015
0.00
00.
005
0.01
00.
015 Envelope/Births
Time
Env
elop
e/B
irth
s
non−aids
1985 1990 1995 2000 2005 2010 2015
Non−aids MMR
Year
0
5
10
15
NO
NA
IDS
MM
R
1985 1990 1995 2000 2005 2010 2015
Aids MMR
Year
0
0.01
0.02
0.03
0.04
AID
SM
MR

1985 1990 1995 2000 2005 2010 2015
Israel [ISR] (Western Asia)
Year
0
0.01
0.02
0.03
0.04
PM
1985 1990 1995 2000 2005 2010 2015
Israel [ISR] (Western Asia)
Year
0
5
10
15
20
25
30
MM
R
− Estimates −Mlate− MMR Database 2015 −Observed DataAdjusted Data− Data type −VR
1985 1990 1995 2000 2005 2010 2015
050
0010
000
1500
020
000
2500
030
000
3500
0
Gross Domestic Product
Time
GD
P
1985 1990 1995 2000 2005 2010 2015
0.00
0.02
0.04
0.06
0.08
0.10
General Fertility Rate
Time
GF
R
1985 1990 1995 2000 2005 2010 2015
0.0
0.2
0.4
0.6
0.8
1.0
Skilled Attendance to Birth
Time
SA
B
1985 1990 1995 2000 2005 2010 2015
0.00
00.
002
0.00
40.
006
Envelope/Births
Time
Env
elop
e/B
irth
s
non−aids
1985 1990 1995 2000 2005 2010 2015
Non−aids MMR
Year
0
5
10
NO
NA
IDS
MM
R
1985 1990 1995 2000 2005 2010 2015
Aids MMR
Year
0
0.02
0.04
0.06
AID
SM
MR
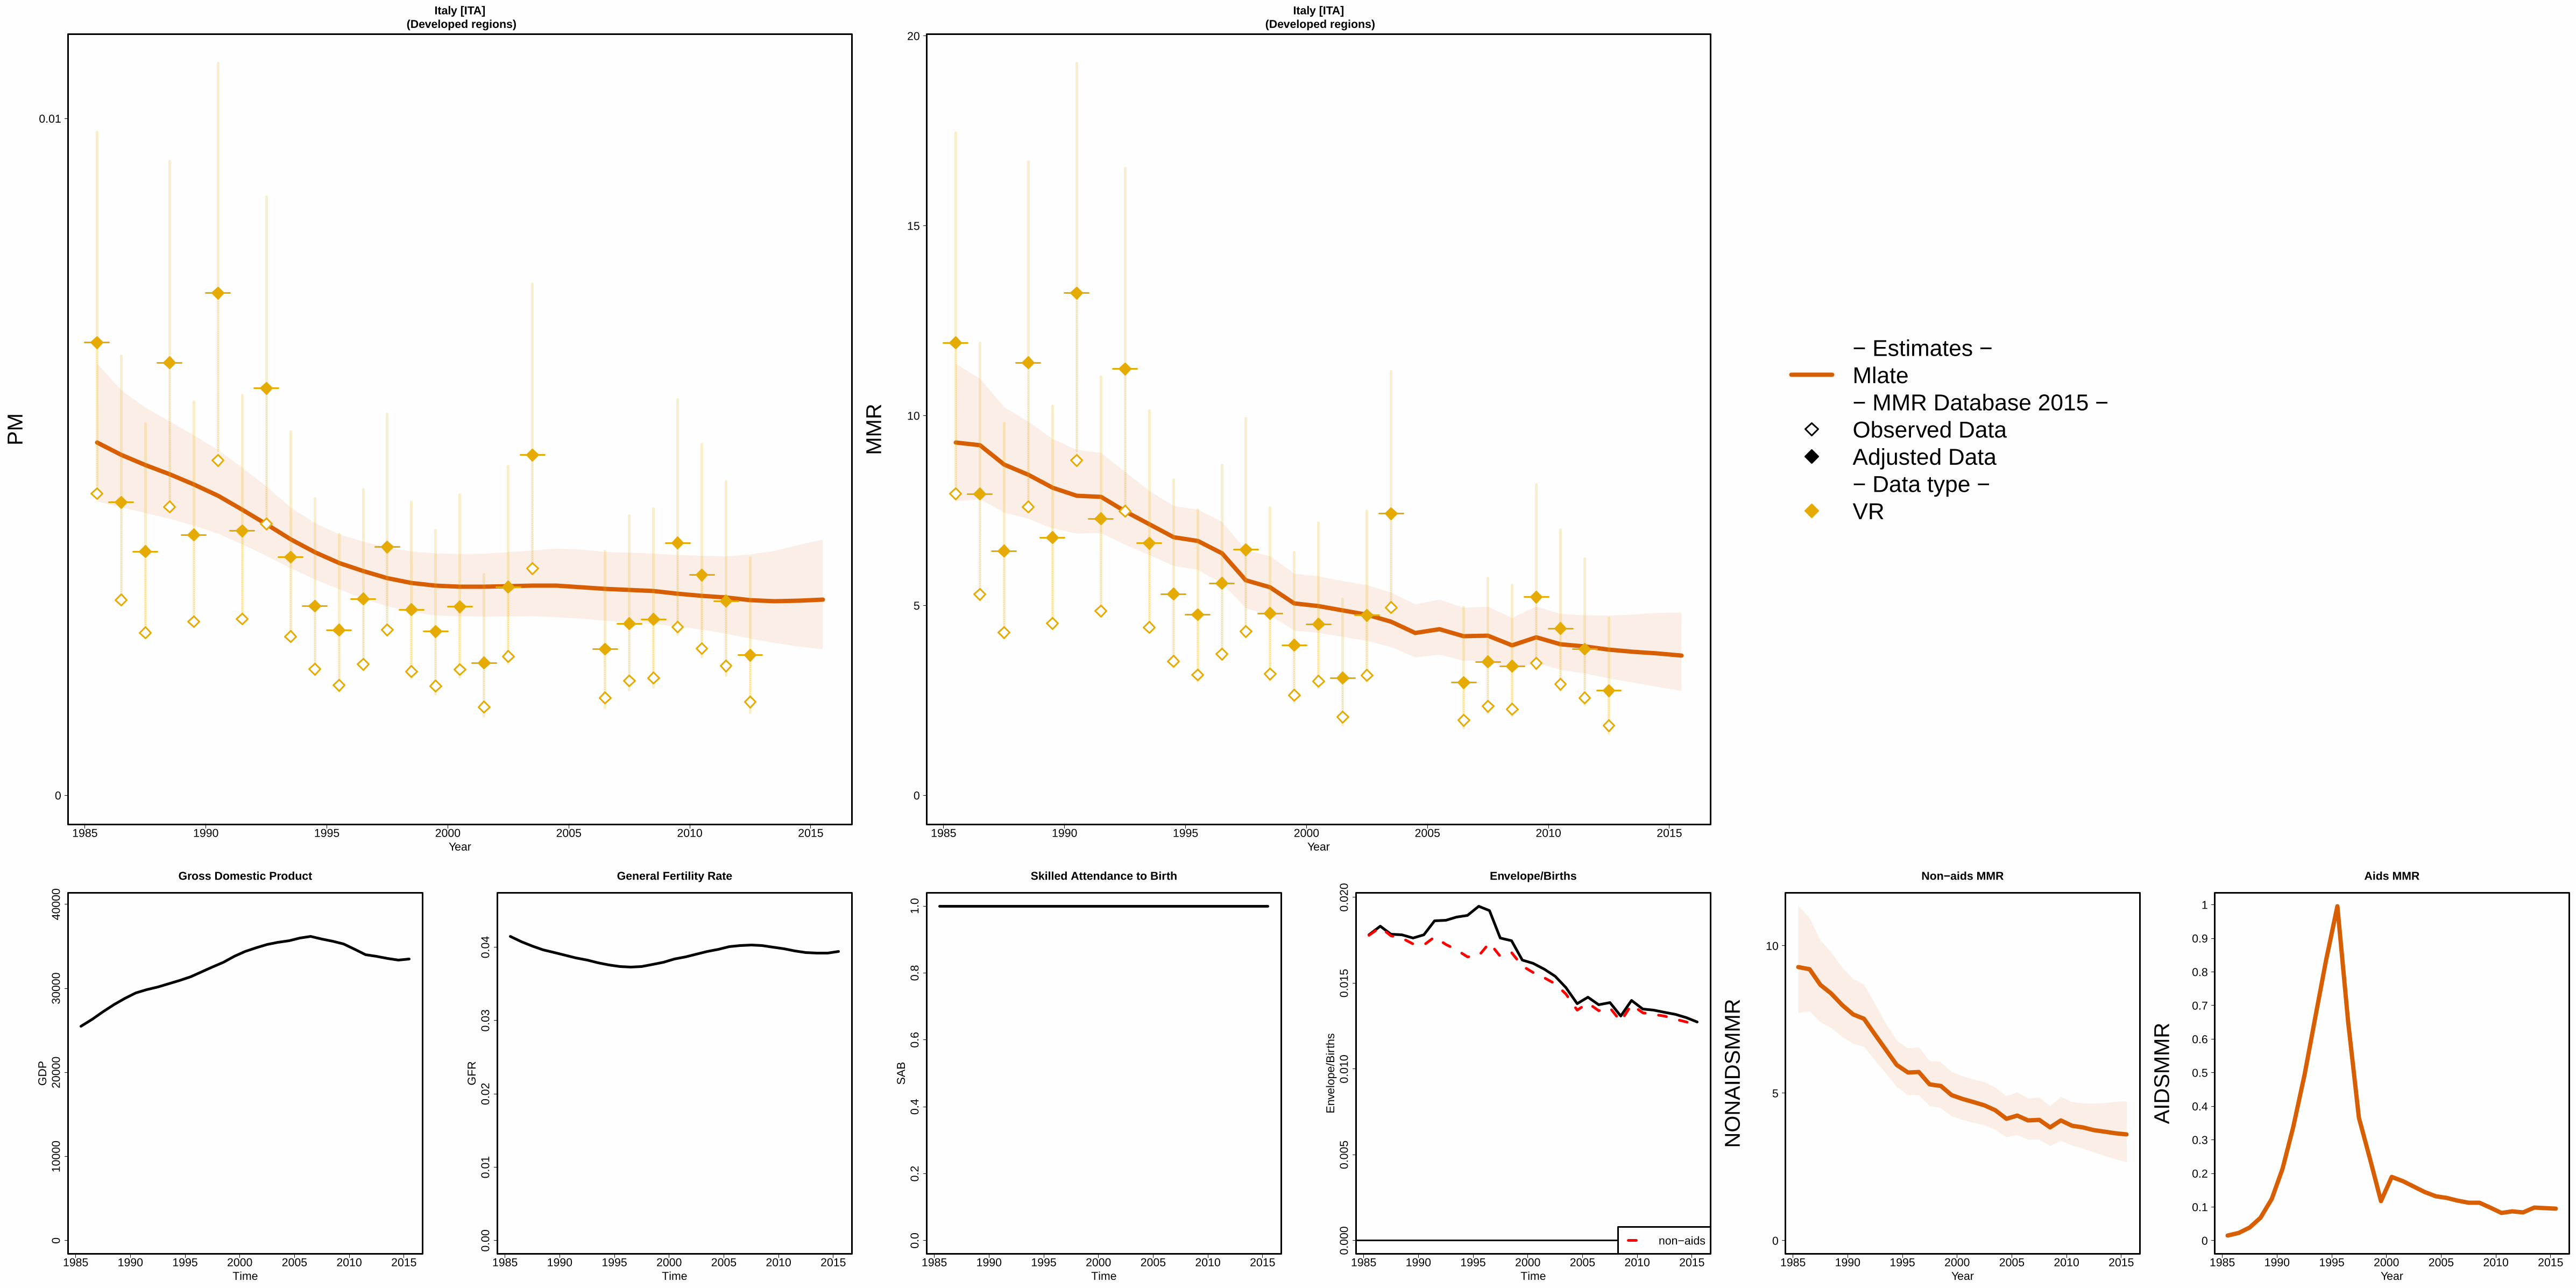
1985 1990 1995 2000 2005 2010 2015
Italy [ITA] (Developed regions)
Year
0
0.01
PM
1985 1990 1995 2000 2005 2010 2015
Italy [ITA] (Developed regions)
Year
0
5
10
15
20
MM
R
− Estimates −Mlate− MMR Database 2015 −Observed DataAdjusted Data− Data type −VR
1985 1990 1995 2000 2005 2010 2015
010
000
2000
030
000
4000
0
Gross Domestic Product
Time
GD
P
1985 1990 1995 2000 2005 2010 2015
0.00
0.01
0.02
0.03
0.04
General Fertility Rate
Time
GF
R
1985 1990 1995 2000 2005 2010 2015
0.0
0.2
0.4
0.6
0.8
1.0
Skilled Attendance to Birth
Time
SA
B
1985 1990 1995 2000 2005 2010 2015
0.00
00.
005
0.01
00.
015
0.02
0
Envelope/Births
Time
Env
elop
e/B
irth
s
non−aids
1985 1990 1995 2000 2005 2010 2015
Non−aids MMR
Year
0
5
10
NO
NA
IDS
MM
R
1985 1990 1995 2000 2005 2010 2015
Aids MMR
Year
0
0.1
0.2
0.3
0.4
0.5
0.6
0.7
0.8
0.9
1
AID
SM
MR

1985 1990 1995 2000 2005 2010 2015
Jamaica [JAM] (Caribbean)
Year
0
0.05
0.1
PM
1985 1990 1995 2000 2005 2010 2015
Jamaica [JAM] (Caribbean)
Year
0
50
100
150
MM
R
− Estimates −Mlate− MMR Database 2015 −Observed DataAdjusted Data− Data type −VRMisc. studies
1985 1990 1995 2000 2005 2010 2015
020
0040
0060
0080
0010
000
Gross Domestic Product
Time
GD
P
1985 1990 1995 2000 2005 2010 2015
0.00
0.02
0.04
0.06
0.08
0.10
0.12
General Fertility Rate
Time
GF
R
1985 1990 1995 2000 2005 2010 2015
0.0
0.2
0.4
0.6
0.8
1.0
Skilled Attendance to Birth
Time
SA
B
1985 1990 1995 2000 2005 2010 2015
0.00
00.
005
0.01
00.
015
0.02
00.
025
0.03
00.
035
Envelope/Births
Time
Env
elop
e/B
irth
s
non−aids
1985 1990 1995 2000 2005 2010 2015
Non−aids MMR
Year
0
50
100
NO
NA
IDS
MM
R
1985 1990 1995 2000 2005 2010 2015
Aids MMR
Year
0
5
10
AID
SM
MR

1985 1990 1995 2000 2005 2010 2015
Japan [JPN] (Developed regions)
Year
0
0.01
0.02
PM
1985 1990 1995 2000 2005 2010 2015
Japan [JPN] (Developed regions)
Year
0
5
10
15
20
25
30
MM
R
− Estimates −
Mlate
− MMR Database 2015 −
Observed Data
Adjusted Data
− Data type −
VR
Spec. studiesExcluded VR data (overlap with specialized study)
1985 1990 1995 2000 2005 2010 2015
010
000
2000
030
000
4000
0
Gross Domestic Product
Time
GD
P
1985 1990 1995 2000 2005 2010 2015
0.00
0.01
0.02
0.03
0.04
0.05
General Fertility Rate
Time
GF
R
1985 1990 1995 2000 2005 2010 2015
0.0
0.2
0.4
0.6
0.8
1.0
Skilled Attendance to Birth
Time
SA
B
1985 1990 1995 2000 2005 2010 2015
0.00
00.
005
0.01
00.
015
Envelope/Births
Time
Env
elop
e/B
irth
s
non−aids
1985 1990 1995 2000 2005 2010 2015
Non−aids MMR
Year
0
5
10
15
20
NO
NA
IDS
MM
R
1985 1990 1995 2000 2005 2010 2015
Aids MMR
Year
0
AID
SM
MR

1985 1990 1995 2000 2005 2010 2015
Jordan [JOR] (Western Asia)
Year
0
0.05
0.1
0.15
0.2
PM
●
1985 1990 1995 2000 2005 2010 2015
Jordan [JOR] (Western Asia)
Year
0
50
100
150
200
MM
R
●
●
− Estimates −
Mlate
− MMR Database 2015 −
Observed Data
Adjusted Data
− Data type −
VR
Spec. studiesExcluded VR data (data quality issues)
1985 1990 1995 2000 2005 2010 2015
020
0040
0060
0080
0010
000
1200
0
Gross Domestic Product
Time
GD
P
1985 1990 1995 2000 2005 2010 2015
0.00
0.05
0.10
0.15
0.20
General Fertility Rate
Time
GF
R
1985 1990 1995 2000 2005 2010 2015
0.0
0.2
0.4
0.6
0.8
1.0
Skilled Attendance to Birth
Time
SA
B
1985 1990 1995 2000 2005 2010 2015
0.00
00.
002
0.00
40.
006
0.00
80.
010
Envelope/Births
Time
Env
elop
e/B
irth
s
non−aids
1985 1990 1995 2000 2005 2010 2015
Non−aids MMR
Year
0
50
100
150
200
NO
NA
IDS
MM
R
1985 1990 1995 2000 2005 2010 2015
Aids MMR
Year
00.010.02
AID
SM
MR

1985 1990 1995 2000 2005 2010 2015
Kazakhstan [KAZ] (Central Asia)
Year
0
0.02
0.04
0.06
PM
1985 1990 1995 2000 2005 2010 2015
Kazakhstan [KAZ] (Central Asia)
Year
0
50
100
MM
R
− Estimates −
Mlate
− MMR Database 2015 −
Observed Data
Adjusted Data
− Data type −
VR
Spec. studiesExcluded VR data (overlap with specialized study)
1985 1990 1995 2000 2005 2010 2015
050
0010
000
1500
020
000
2500
0
Gross Domestic Product
Time
GD
P
1985 1990 1995 2000 2005 2010 2015
0.00
0.02
0.04
0.06
0.08
0.10
General Fertility Rate
Time
GF
R
1985 1990 1995 2000 2005 2010 2015
0.0
0.2
0.4
0.6
0.8
1.0
Skilled Attendance to Birth
Time
SA
B
1985 1990 1995 2000 2005 2010 2015
0.00
0.01
0.02
0.03
0.04
Envelope/Births
Time
Env
elop
e/B
irth
s
non−aids
1985 1990 1995 2000 2005 2010 2015
Non−aids MMR
Year
0
50
100
NO
NA
IDS
MM
R
1985 1990 1995 2000 2005 2010 2015
Aids MMR
Year
0
0.05
0.1
0.15
AID
SM
MR

1985 1990 1995 2000 2005 2010 2015
Kenya [KEN] (Eastern Africa)
Year
0
0.1
0.2
0.3
0.4
0.5
0.6
PM
1985 1990 1995 2000 2005 2010 2015
Kenya [KEN] (Eastern Africa)
Year
0
500
1000
MM
R
− Estimates −Mlate− MMR Database 2015 −Observed DataAdjusted Data− Data type −DHS
1985 1990 1995 2000 2005 2010 2015
050
010
0015
0020
0025
00
Gross Domestic Product
Time
GD
P
1985 1990 1995 2000 2005 2010 2015
0.00
0.05
0.10
0.15
0.20
0.25
General Fertility Rate
Time
GF
R
1985 1990 1995 2000 2005 2010 2015
0.0
0.2
0.4
0.6
0.8
1.0
Skilled Attendance to Birth
Time
SA
B
1985 1990 1995 2000 2005 2010 2015
0.00
0.01
0.02
0.03
0.04
0.05
0.06
0.07
Envelope/Births
Time
Env
elop
e/B
irth
s
non−aids
1985 1990 1995 2000 2005 2010 2015
Non−aids MMR
Year
0
500
1000
NO
NA
IDS
MM
R
1985 1990 1995 2000 2005 2010 2015
Aids MMR
Year
0
10
20
30
40
50
60
70
80
AID
SM
MR

1985 1990 1995 2000 2005 2010 2015
Kiribati [KIR] (South−Eastern Asia / Oceania)
Year
0
0.05
0.1
0.15
0.2
0.25
0.3
PM
●
●
●
1985 1990 1995 2000 2005 2010 2015
Kiribati [KIR] (South−Eastern Asia / Oceania)
Year
0
100
200
300
400
500
600
700
MM
R
●
●
●
●
− Estimates −
Mlate
− MMR Database 2015 −
Observed Data
Adjusted Data
− Data type −
VRReported VR before recalc.(related to 0 obs. mat. death)Excluded VR data (data quality issues)
1985 1990 1995 2000 2005 2010 2015
050
010
0015
0020
00
Gross Domestic Product
Time
GD
P
1985 1990 1995 2000 2005 2010 2015
0.00
0.05
0.10
0.15
General Fertility Rate
Time
GF
R
1985 1990 1995 2000 2005 2010 2015
0.0
0.2
0.4
0.6
0.8
1.0
Skilled Attendance to Birth
Time
SA
B
1985 1990 1995 2000 2005 2010 2015
0.00
00.
005
0.01
00.
015
0.02
00.
025
Envelope/Births
Time
Env
elop
e/B
irth
s
non−aids
1985 1990 1995 2000 2005 2010 2015
Non−aids MMR
Year
0
50
100
150
200
250
300
350
400
NO
NA
IDS
MM
R
1985 1990 1995 2000 2005 2010 2015
Aids MMR
Year
00.010.02
AID
SM
MR
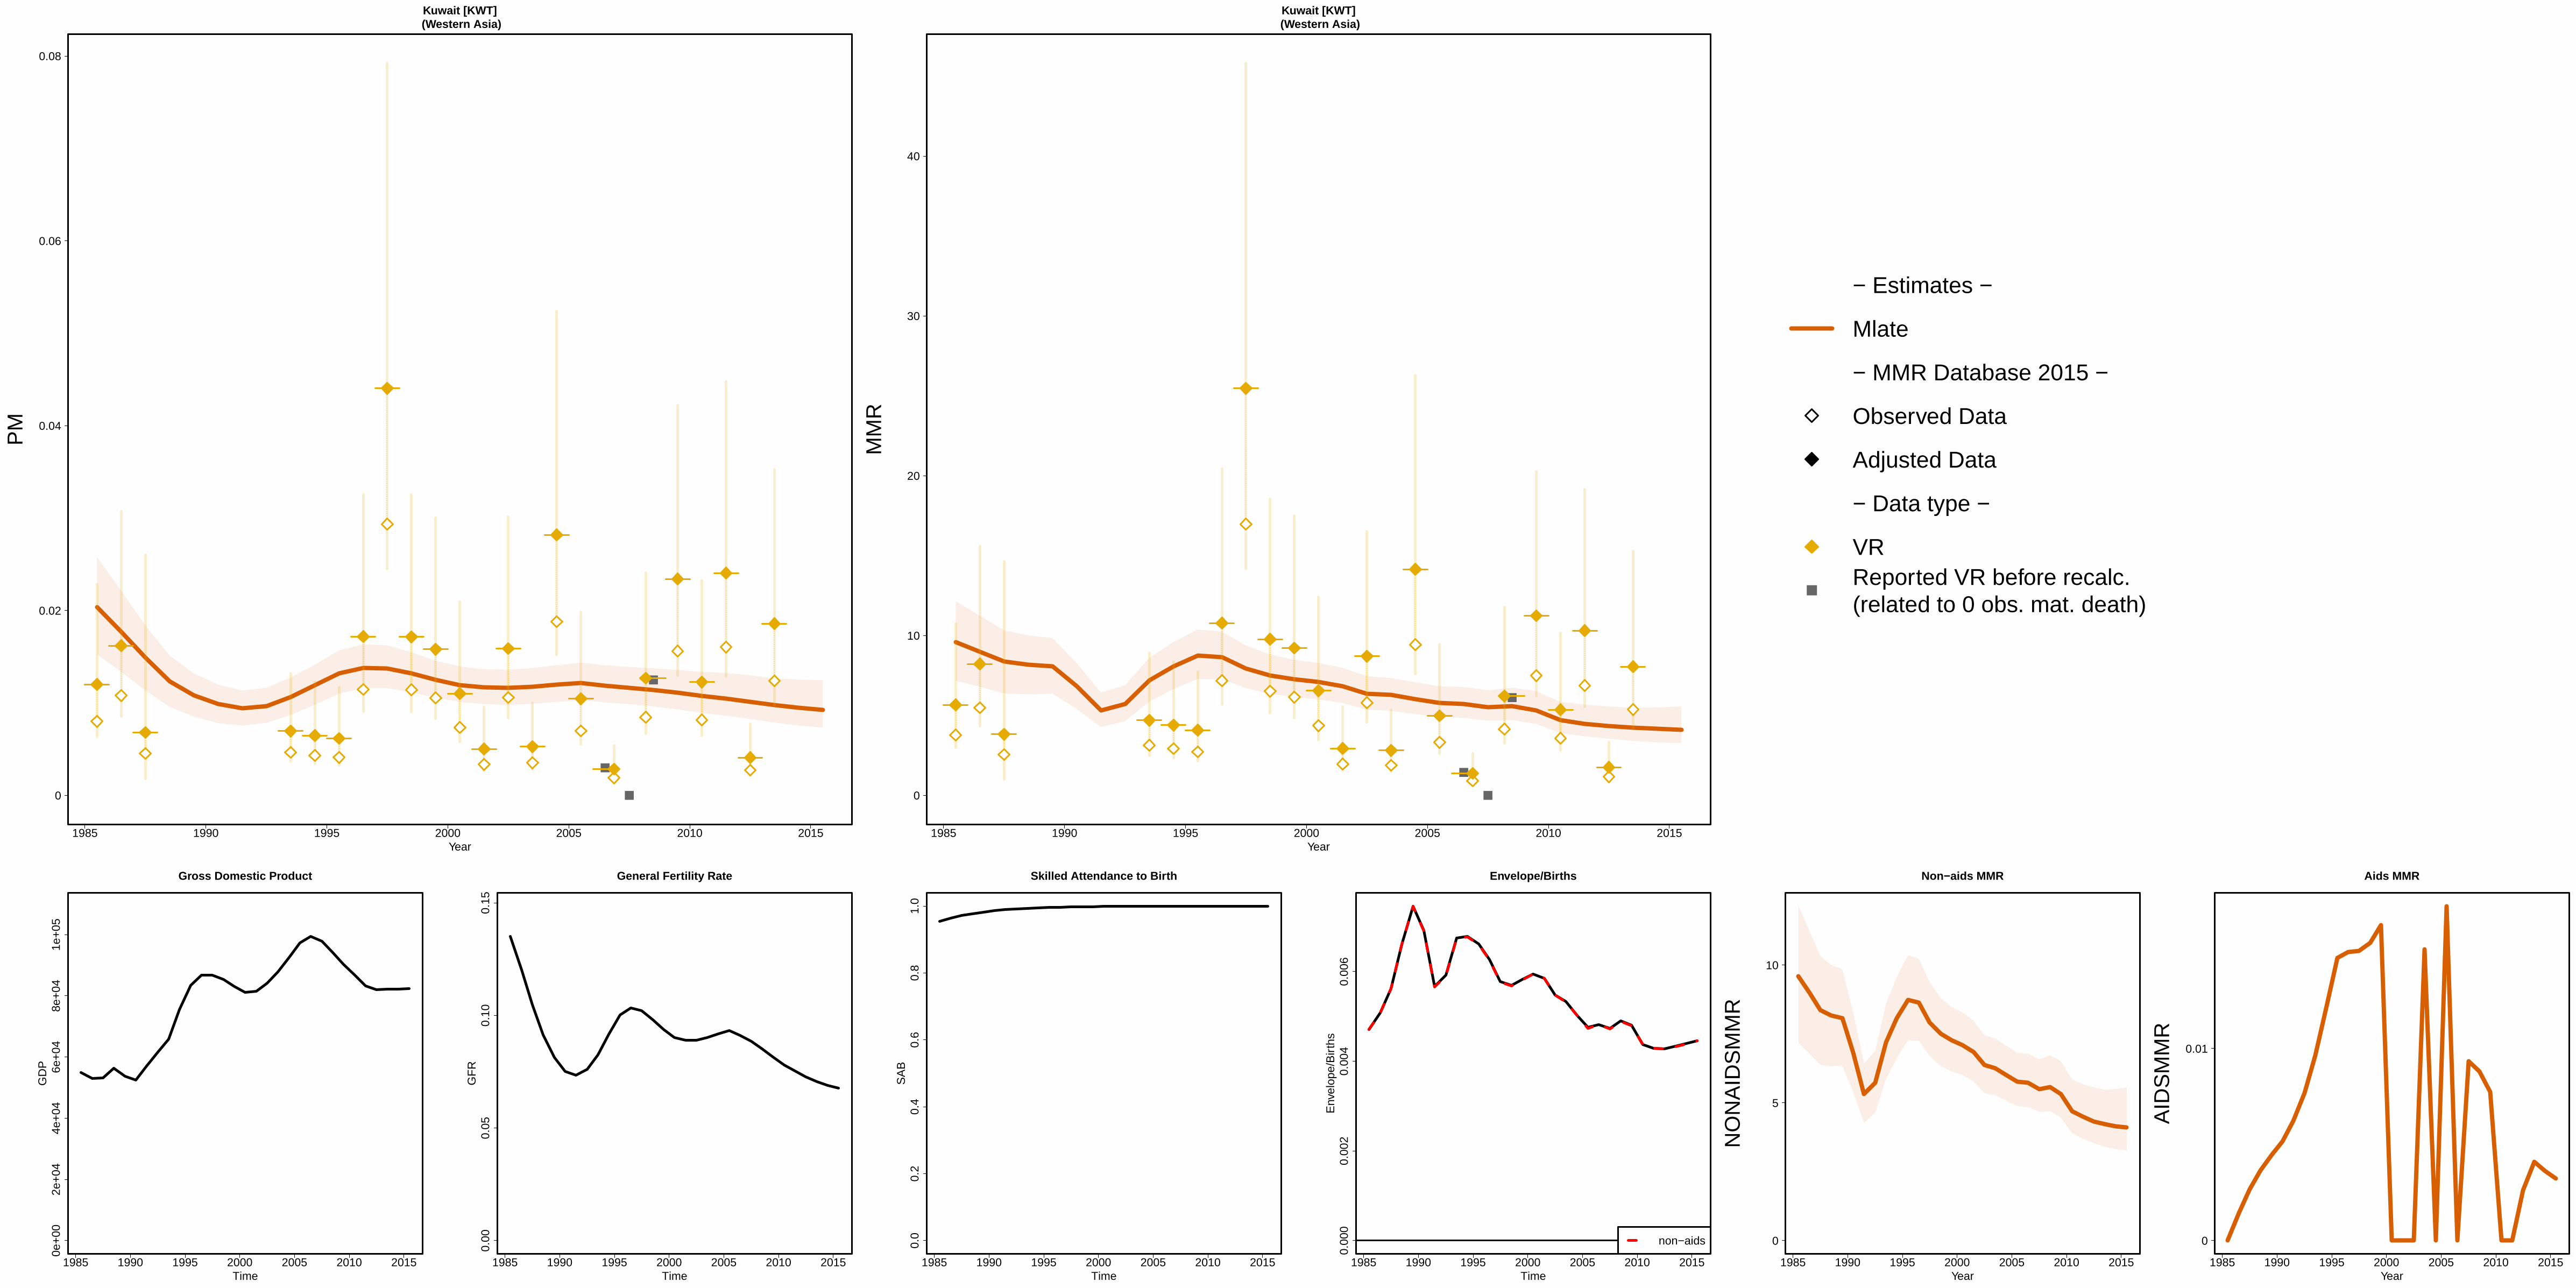
1985 1990 1995 2000 2005 2010 2015
Kuwait [KWT] (Western Asia)
Year
0
0.02
0.04
0.06
0.08
PM
1985 1990 1995 2000 2005 2010 2015
Kuwait [KWT] (Western Asia)
Year
0
10
20
30
40
MM
R
− Estimates −
Mlate
− MMR Database 2015 −
Observed Data
Adjusted Data
− Data type −
VRReported VR before recalc.(related to 0 obs. mat. death)
1985 1990 1995 2000 2005 2010 2015
0e+
002e
+04
4e+
046e
+04
8e+
041e
+05
Gross Domestic Product
Time
GD
P
1985 1990 1995 2000 2005 2010 2015
0.00
0.05
0.10
0.15
General Fertility Rate
Time
GF
R
1985 1990 1995 2000 2005 2010 2015
0.0
0.2
0.4
0.6
0.8
1.0
Skilled Attendance to Birth
Time
SA
B
1985 1990 1995 2000 2005 2010 2015
0.00
00.
002
0.00
40.
006
Envelope/Births
Time
Env
elop
e/B
irth
s
non−aids
1985 1990 1995 2000 2005 2010 2015
Non−aids MMR
Year
0
5
10
NO
NA
IDS
MM
R
1985 1990 1995 2000 2005 2010 2015
Aids MMR
Year
0
0.01
AID
SM
MR

1985 1990 1995 2000 2005 2010 2015
Kyrgyzstan [KGZ] (Central Asia)
Year
0
0.05
0.1
PM
1985 1990 1995 2000 2005 2010 2015
Kyrgyzstan [KGZ] (Central Asia)
Year
0
50
100
150
MM
R
− Estimates −Mlate− MMR Database 2015 −Observed DataAdjusted Data− Data type −VR
1985 1990 1995 2000 2005 2010 2015
050
010
0015
0020
0025
0030
0035
00
Gross Domestic Product
Time
GD
P
1985 1990 1995 2000 2005 2010 2015
0.00
0.05
0.10
0.15
General Fertility Rate
Time
GF
R
1985 1990 1995 2000 2005 2010 2015
0.0
0.2
0.4
0.6
0.8
1.0
Skilled Attendance to Birth
Time
SA
B
1985 1990 1995 2000 2005 2010 2015
0.00
00.
005
0.01
00.
015
0.02
00.
025 Envelope/Births
Time
Env
elop
e/B
irth
s
non−aids
1985 1990 1995 2000 2005 2010 2015
Non−aids MMR
Year
0
50
100
NO
NA
IDS
MM
R
1985 1990 1995 2000 2005 2010 2015
Aids MMR
Year
0
0.05
0.1
AID
SM
MR

1985 1990 1995 2000 2005 2010 2015
Lao [LAO] (South−Eastern Asia / Oceania)
Year
0
0.1
0.2
0.3
0.4
0.5
PM
1985 1990 1995 2000 2005 2010 2015
Lao [LAO] (South−Eastern Asia / Oceania)
Year
0
500
1000
1500
MM
R
− Estimates −Mlate− MMR Database 2015 −Observed DataAdjusted Data− Data type −DHSCensus
1985 1990 1995 2000 2005 2010 2015
010
0020
0030
0040
0050
00
Gross Domestic Product
Time
GD
P
1985 1990 1995 2000 2005 2010 2015
0.00
0.05
0.10
0.15
0.20
General Fertility Rate
Time
GF
R
1985 1990 1995 2000 2005 2010 2015
0.0
0.2
0.4
0.6
0.8
1.0
Skilled Attendance to Birth
Time
SA
B
1985 1990 1995 2000 2005 2010 2015
0.00
00.
005
0.01
00.
015
0.02
00.
025
0.03
0
Envelope/Births
Time
Env
elop
e/B
irth
s
non−aids
1985 1990 1995 2000 2005 2010 2015
Non−aids MMR
Year
0
500
1000
1500
NO
NA
IDS
MM
R
1985 1990 1995 2000 2005 2010 2015
Aids MMR
Year
AID
SM
MR

1985 1990 1995 2000 2005 2010 2015
Latvia [LVA] (Developed regions)
Year
0
0.02
0.04
PM
1985 1990 1995 2000 2005 2010 2015
Latvia [LVA] (Developed regions)
Year
0
50
100
MM
R
− Estimates −
Mlate
− MMR Database 2015 −
Observed Data
Adjusted Data
− Data type −
VRReported VR before recalc.(related to 0 obs. mat. death)
1985 1990 1995 2000 2005 2010 2015
050
0010
000
1500
020
000
2500
0
Gross Domestic Product
Time
GD
P
1985 1990 1995 2000 2005 2010 2015
0.00
0.01
0.02
0.03
0.04
0.05
0.06
0.07
General Fertility Rate
Time
GF
R
1985 1990 1995 2000 2005 2010 2015
0.0
0.2
0.4
0.6
0.8
1.0
Skilled Attendance to Birth
Time
SA
B
1985 1990 1995 2000 2005 2010 2015
0.00
0.01
0.02
0.03
0.04
0.05
Envelope/Births
Time
Env
elop
e/B
irth
s
non−aids
1985 1990 1995 2000 2005 2010 2015
Non−aids MMR
Year
0
10
20
30
40
50
60
70
NO
NA
IDS
MM
R
1985 1990 1995 2000 2005 2010 2015
Aids MMR
Year
0
0.05
0.1
0.15
0.2
0.25
0.3
0.35
AID
SM
MR

1985 1990 1995 2000 2005 2010 2015
Lebanon [LBN] (Western Asia)
Year
0
0.02
0.04
0.06
0.08
PM
1985 1990 1995 2000 2005 2010 2015
Lebanon [LBN] (Western Asia)
Year
0
50
100
MM
R
− Estimates −Mlate− MMR Database 2015 −Observed DataAdjusted Data− Data type −Spec. studies
1985 1990 1995 2000 2005 2010 2015
050
0010
000
1500
0
Gross Domestic Product
Time
GD
P
1985 1990 1995 2000 2005 2010 2015
0.00
0.02
0.04
0.06
0.08
0.10
0.12
General Fertility Rate
Time
GF
R
1985 1990 1995 2000 2005 2010 2015
0.0
0.2
0.4
0.6
0.8
1.0
Skilled Attendance to Birth
Time
SA
B
1985 1990 1995 2000 2005 2010 2015
0.00
00.
005
0.01
00.
015
Envelope/Births
Time
Env
elop
e/B
irth
s
non−aids
1985 1990 1995 2000 2005 2010 2015
Non−aids MMR
Year
0
50
100
NO
NA
IDS
MM
R
1985 1990 1995 2000 2005 2010 2015
Aids MMR
Year
0
0.05
0.1
0.15
0.2
0.25
AID
SM
MR

1985 1990 1995 2000 2005 2010 2015
Lesotho [LSO] (Southern Africa)
Year
0
0.1
0.2
0.3
0.4
PM
1985 1990 1995 2000 2005 2010 2015
Lesotho [LSO] (Southern Africa)
Year
0
500
1000
1500
MM
R
− Estimates −Mlate− MMR Database 2015 −Observed DataAdjusted Data− Data type −DHSCensus
1985 1990 1995 2000 2005 2010 2015
050
010
0015
0020
0025
00
Gross Domestic Product
Time
GD
P
1985 1990 1995 2000 2005 2010 2015
0.00
0.05
0.10
0.15
General Fertility Rate
Time
GF
R
1985 1990 1995 2000 2005 2010 2015
0.0
0.2
0.4
0.6
0.8
1.0
Skilled Attendance to Birth
Time
SA
B
1985 1990 1995 2000 2005 2010 2015
0.00
0.05
0.10
0.15
Envelope/Births
Time
Env
elop
e/B
irth
s
non−aids
1985 1990 1995 2000 2005 2010 2015
Non−aids MMR
Year
0
500
1000
NO
NA
IDS
MM
R
1985 1990 1995 2000 2005 2010 2015
Aids MMR
Year
0
50
100
150
AID
SM
MR

1985 1990 1995 2000 2005 2010 2015
Liberia [LBR] (Western Africa)
Year
0
0.1
0.2
0.3
0.4
0.5
0.6
0.7
0.8
PM
1985 1990 1995 2000 2005 2010 2015
Liberia [LBR] (Western Africa)
Year
0
500
1000
1500
2000
2500
MM
R
− Estimates −Mlate− MMR Database 2015 −Observed DataAdjusted Data− Data type −DHS
1985 1990 1995 2000 2005 2010 2015
050
010
0015
00
Gross Domestic Product
Time
GD
P
1985 1990 1995 2000 2005 2010 2015
0.00
0.05
0.10
0.15
0.20
General Fertility Rate
Time
GF
R
1985 1990 1995 2000 2005 2010 2015
0.0
0.2
0.4
0.6
0.8
1.0
Skilled Attendance to Birth
Time
SA
B
1985 1990 1995 2000 2005 2010 2015
0.00
0.01
0.02
0.03
Envelope/Births
Time
Env
elop
e/B
irth
s
non−aids
1985 1990 1995 2000 2005 2010 2015
Non−aids MMR
Year
0
500
1000
1500
2000
2500
NO
NA
IDS
MM
R
1985 1990 1995 2000 2005 2010 2015
Aids MMR
Year
0
5
10
15
20
AID
SM
MR

1985 1990 1995 2000 2005 2010 2015
Libya [LBY] (Northern Africa)
Year
0
0.02
0.04
0.06
0.08
PM
1985 1990 1995 2000 2005 2010 2015
Libya [LBY] (Northern Africa)
Year
0
50
100
MM
R
− Estimates −Mlate− MMR Database 2015 −Observed DataAdjusted Data− Data type −Misc. studies
1985 1990 1995 2000 2005 2010 2015
010
000
2000
030
000
Gross Domestic Product
Time
GD
P
1985 1990 1995 2000 2005 2010 2015
0.00
0.05
0.10
0.15
General Fertility Rate
Time
GF
R
1985 1990 1995 2000 2005 2010 2015
0.0
0.2
0.4
0.6
0.8
1.0
Skilled Attendance to Birth
Time
SA
B
1985 1990 1995 2000 2005 2010 2015
0.00
00.
002
0.00
40.
006
0.00
80.
010
0.01
20.
014
Envelope/Births
Time
Env
elop
e/B
irth
s
non−aids
1985 1990 1995 2000 2005 2010 2015
Non−aids MMR
Year
0
50
100
NO
NA
IDS
MM
R
1985 1990 1995 2000 2005 2010 2015
Aids MMR
Year
00.010.02
AID
SM
MR

1985 1990 1995 2000 2005 2010 2015
Lithuania [LTU] (Developed regions)
Year
0
0.01
0.02
0.03
PM
1985 1990 1995 2000 2005 2010 2015
Lithuania [LTU] (Developed regions)
Year
0
10
20
30
40
50
60
70
MM
R
− Estimates −
Mlate
− MMR Database 2015 −
Observed Data
Adjusted Data
− Data type −
VRReported VR before recalc.(related to 0 obs. mat. death)
1985 1990 1995 2000 2005 2010 2015
050
0010
000
1500
020
000
2500
0
Gross Domestic Product
Time
GD
P
1985 1990 1995 2000 2005 2010 2015
0.00
0.01
0.02
0.03
0.04
0.05
0.06
0.07
General Fertility Rate
Time
GF
R
1985 1990 1995 2000 2005 2010 2015
0.0
0.2
0.4
0.6
0.8
1.0
Skilled Attendance to Birth
Time
SA
B
1985 1990 1995 2000 2005 2010 2015
0.00
0.01
0.02
0.03
0.04
Envelope/Births
Time
Env
elop
e/B
irth
s
non−aids
1985 1990 1995 2000 2005 2010 2015
Non−aids MMR
Year
0
10
20
30
40
NO
NA
IDS
MM
R
1985 1990 1995 2000 2005 2010 2015
Aids MMR
Year
0
0.05
0.1
0.15
AID
SM
MR

1985 1990 1995 2000 2005 2010 2015
Luxembourg [LUX] (Developed regions)
Year
0
0.02
0.04
0.06
PM
1985 1990 1995 2000 2005 2010 2015
Luxembourg [LUX] (Developed regions)
Year
0
10
20
30
40
50
60
70
80
90
MM
R
− Estimates −
Mlate
− MMR Database 2015 −
Observed Data
Adjusted Data
− Data type −
VRReported VR before recalc.(related to 0 obs. mat. death)
1985 1990 1995 2000 2005 2010 2015
0e+
002e
+04
4e+
046e
+04
8e+
041e
+05
Gross Domestic Product
Time
GD
P
1985 1990 1995 2000 2005 2010 2015
0.00
0.01
0.02
0.03
0.04
0.05
0.06
General Fertility Rate
Time
GF
R
1985 1990 1995 2000 2005 2010 2015
0.0
0.2
0.4
0.6
0.8
1.0
Skilled Attendance to Birth
Time
SA
B
1985 1990 1995 2000 2005 2010 2015
0.00
00.
005
0.01
00.
015
0.02
0
Envelope/Births
Time
Env
elop
e/B
irth
s
non−aids
1985 1990 1995 2000 2005 2010 2015
Non−aids MMR
Year
0
5
10
15
NO
NA
IDS
MM
R
1985 1990 1995 2000 2005 2010 2015
Aids MMR
Year
0
0.05
0.1
AID
SM
MR

1985 1990 1995 2000 2005 2010 2015
Madagascar [MDG] (Eastern Africa)
Year
0
0.05
0.1
0.15
0.2
0.25
0.3
0.35
PM
1985 1990 1995 2000 2005 2010 2015
Madagascar [MDG] (Eastern Africa)
Year
0
500
1000
MM
R
− Estimates −Mlate− MMR Database 2015 −Observed DataAdjusted Data− Data type −DHS
1985 1990 1995 2000 2005 2010 2015
050
010
0015
00
Gross Domestic Product
Time
GD
P
1985 1990 1995 2000 2005 2010 2015
0.00
0.05
0.10
0.15
0.20
General Fertility Rate
Time
GF
R
1985 1990 1995 2000 2005 2010 2015
0.0
0.2
0.4
0.6
0.8
1.0
Skilled Attendance to Birth
Time
SA
B
1985 1990 1995 2000 2005 2010 2015
0.00
00.
005
0.01
00.
015
0.02
00.
025
0.03
0
Envelope/Births
Time
Env
elop
e/B
irth
s
non−aids
1985 1990 1995 2000 2005 2010 2015
Non−aids MMR
Year
0
500
1000
NO
NA
IDS
MM
R
1985 1990 1995 2000 2005 2010 2015
Aids MMR
Year
AID
SM
MR

1985 1990 1995 2000 2005 2010 2015
Malawi [MWI] (Eastern Africa)
Year
0
0.1
0.2
0.3
0.4
0.5
0.6
PM
1985 1990 1995 2000 2005 2010 2015
Malawi [MWI] (Eastern Africa)
Year
0
500
1000
1500
MM
R
− Estimates −Mlate− MMR Database 2015 −Observed DataAdjusted Data− Data type −DHS
1985 1990 1995 2000 2005 2010 2015
020
040
060
080
0
Gross Domestic Product
Time
GD
P
1985 1990 1995 2000 2005 2010 2015
0.00
0.05
0.10
0.15
0.20
0.25
General Fertility Rate
Time
GF
R
1985 1990 1995 2000 2005 2010 2015
0.0
0.2
0.4
0.6
0.8
1.0
Skilled Attendance to Birth
Time
SA
B
1985 1990 1995 2000 2005 2010 2015
0.00
0.02
0.04
0.06
0.08
Envelope/Births
Time
Env
elop
e/B
irth
s
non−aids
1985 1990 1995 2000 2005 2010 2015
Non−aids MMR
Year
0
500
1000
1500
NO
NA
IDS
MM
R
1985 1990 1995 2000 2005 2010 2015
Aids MMR
Year
0
50
100
AID
SM
MR
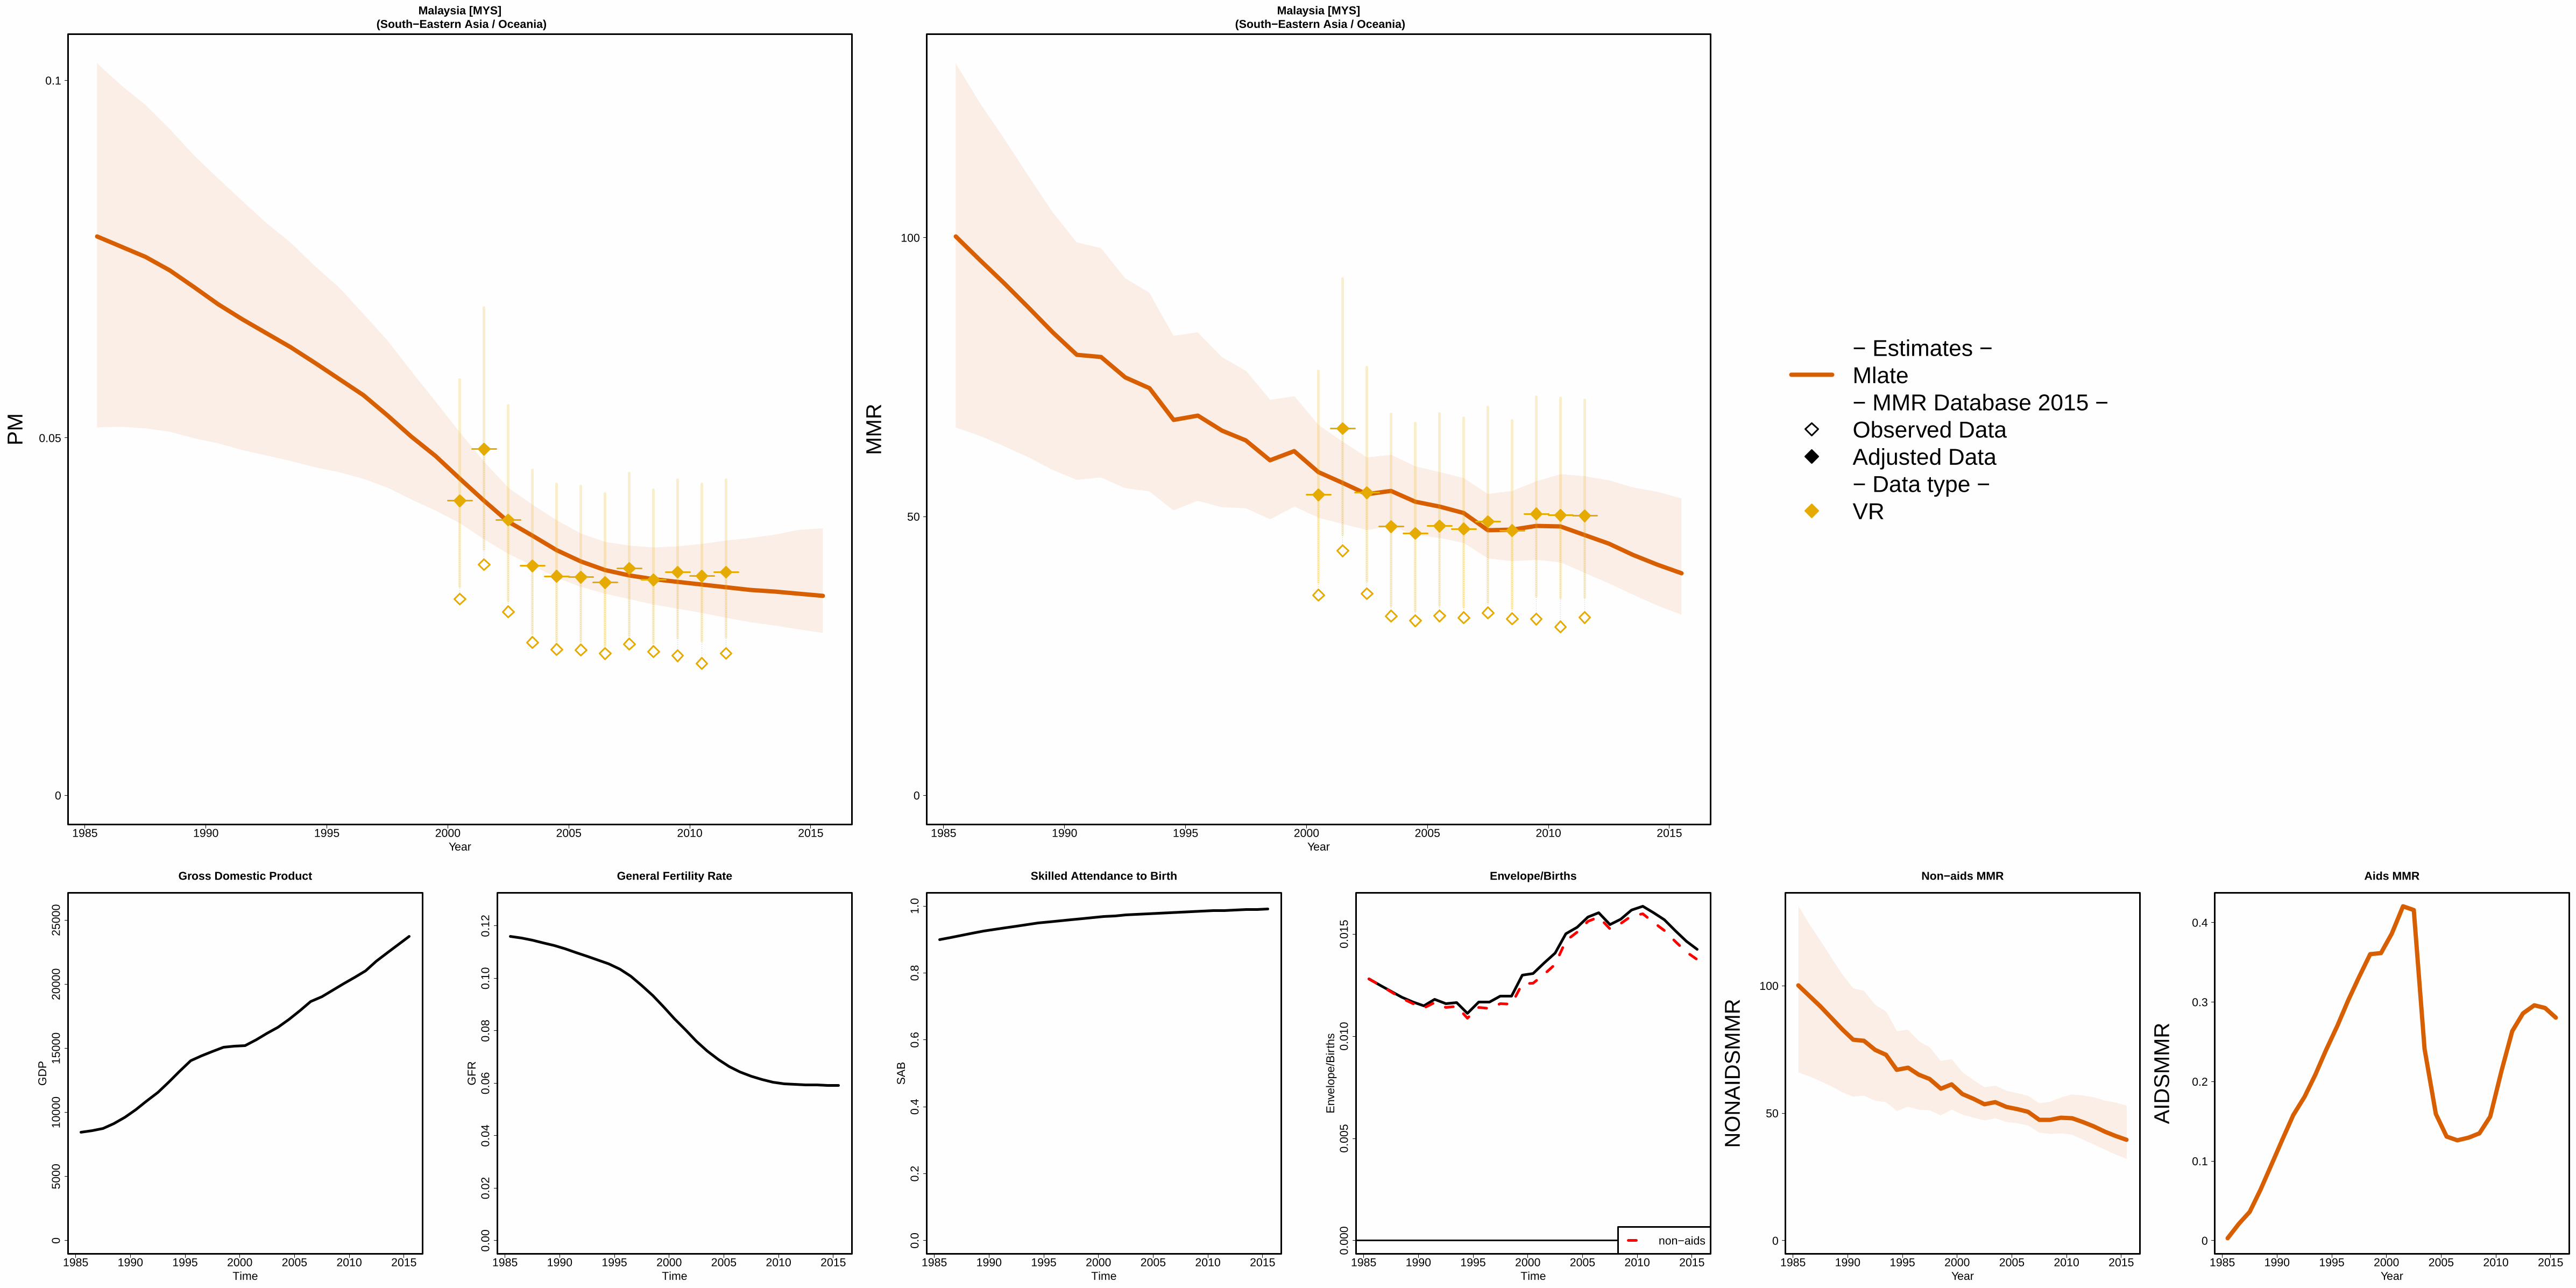
1985 1990 1995 2000 2005 2010 2015
Malaysia [MYS] (South−Eastern Asia / Oceania)
Year
0
0.05
0.1
PM
1985 1990 1995 2000 2005 2010 2015
Malaysia [MYS] (South−Eastern Asia / Oceania)
Year
0
50
100
MM
R
− Estimates −Mlate− MMR Database 2015 −Observed DataAdjusted Data− Data type −VR
1985 1990 1995 2000 2005 2010 2015
050
0010
000
1500
020
000
2500
0
Gross Domestic Product
Time
GD
P
1985 1990 1995 2000 2005 2010 2015
0.00
0.02
0.04
0.06
0.08
0.10
0.12
General Fertility Rate
Time
GF
R
1985 1990 1995 2000 2005 2010 2015
0.0
0.2
0.4
0.6
0.8
1.0
Skilled Attendance to Birth
Time
SA
B
1985 1990 1995 2000 2005 2010 2015
0.00
00.
005
0.01
00.
015
Envelope/Births
Time
Env
elop
e/B
irth
s
non−aids
1985 1990 1995 2000 2005 2010 2015
Non−aids MMR
Year
0
50
100
NO
NA
IDS
MM
R
1985 1990 1995 2000 2005 2010 2015
Aids MMR
Year
0
0.1
0.2
0.3
0.4
AID
SM
MR
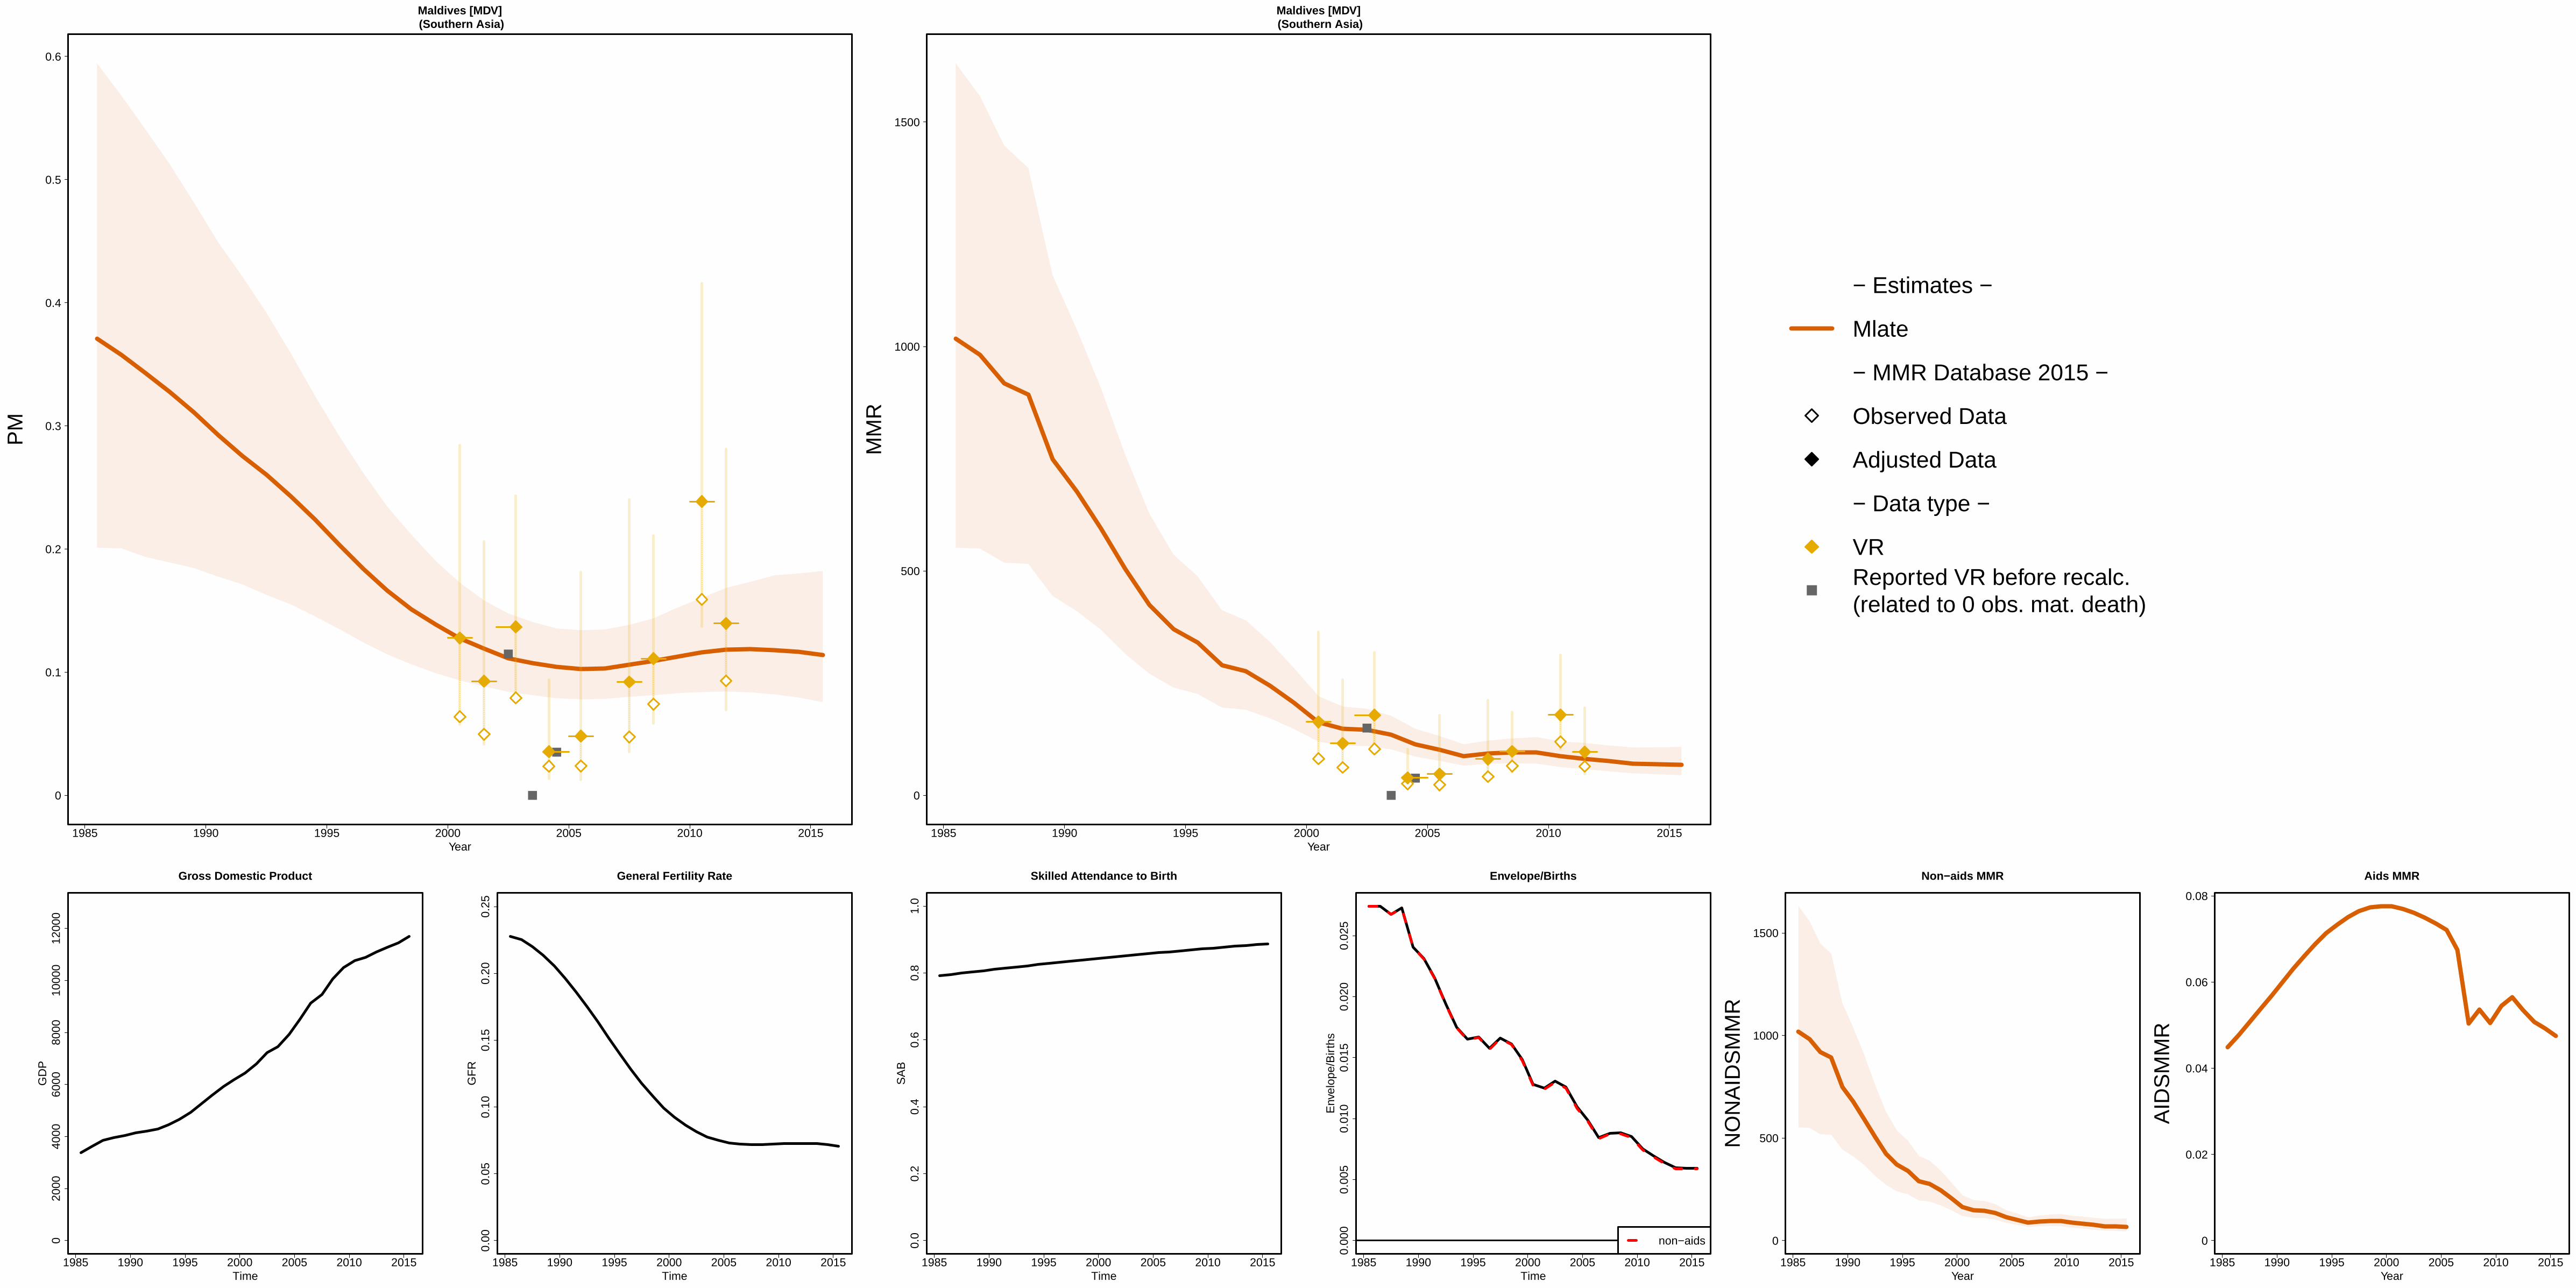
1985 1990 1995 2000 2005 2010 2015
Maldives [MDV] (Southern Asia)
Year
0
0.1
0.2
0.3
0.4
0.5
0.6
PM
1985 1990 1995 2000 2005 2010 2015
Maldives [MDV] (Southern Asia)
Year
0
500
1000
1500
MM
R
− Estimates −
Mlate
− MMR Database 2015 −
Observed Data
Adjusted Data
− Data type −
VRReported VR before recalc.(related to 0 obs. mat. death)
1985 1990 1995 2000 2005 2010 2015
020
0040
0060
0080
0010
000
1200
0
Gross Domestic Product
Time
GD
P
1985 1990 1995 2000 2005 2010 2015
0.00
0.05
0.10
0.15
0.20
0.25
General Fertility Rate
Time
GF
R
1985 1990 1995 2000 2005 2010 2015
0.0
0.2
0.4
0.6
0.8
1.0
Skilled Attendance to Birth
Time
SA
B
1985 1990 1995 2000 2005 2010 2015
0.00
00.
005
0.01
00.
015
0.02
00.
025
Envelope/Births
Time
Env
elop
e/B
irth
s
non−aids
1985 1990 1995 2000 2005 2010 2015
Non−aids MMR
Year
0
500
1000
1500
NO
NA
IDS
MM
R
1985 1990 1995 2000 2005 2010 2015
Aids MMR
Year
0
0.02
0.04
0.06
0.08
AID
SM
MR

1985 1990 1995 2000 2005 2010 2015
Mali [MLI] (Western Africa)
Year
0
0.1
0.2
0.3
0.4
0.5
PM
1985 1990 1995 2000 2005 2010 2015
Mali [MLI] (Western Africa)
Year
0
500
1000
1500
MM
R
− Estimates −Mlate− MMR Database 2015 −Observed DataAdjusted Data− Data type −DHSCensus
1985 1990 1995 2000 2005 2010 2015
050
010
0015
00
Gross Domestic Product
Time
GD
P
1985 1990 1995 2000 2005 2010 2015
0.00
0.05
0.10
0.15
0.20
0.25
General Fertility Rate
Time
GF
R
1985 1990 1995 2000 2005 2010 2015
0.0
0.2
0.4
0.6
0.8
1.0
Skilled Attendance to Birth
Time
SA
B
1985 1990 1995 2000 2005 2010 2015
0.00
00.
005
0.01
00.
015
0.02
00.
025
0.03
00.
035
Envelope/Births
Time
Env
elop
e/B
irth
s
non−aids
1985 1990 1995 2000 2005 2010 2015
Non−aids MMR
Year
0
500
1000
1500
NO
NA
IDS
MM
R
1985 1990 1995 2000 2005 2010 2015
Aids MMR
Year
0
5
10
AID
SM
MR

1985 1990 1995 2000 2005 2010 2015
Malta [MLT] (Developed regions)
Year
0
0.02
0.04
0.06
PM
1985 1990 1995 2000 2005 2010 2015
Malta [MLT] (Developed regions)
Year
0
10
20
30
40
50
60
70
80
90
100
MM
R
− Estimates −
Mlate
− MMR Database 2015 −
Observed Data
Adjusted Data
− Data type −
VRReported VR before recalc.(related to 0 obs. mat. death)
1985 1990 1995 2000 2005 2010 2015
050
0010
000
1500
020
000
2500
030
000
Gross Domestic Product
Time
GD
P
1985 1990 1995 2000 2005 2010 2015
0.00
0.01
0.02
0.03
0.04
0.05
0.06
0.07
General Fertility Rate
Time
GF
R
1985 1990 1995 2000 2005 2010 2015
0.0
0.2
0.4
0.6
0.8
1.0
Skilled Attendance to Birth
Time
SA
B
1985 1990 1995 2000 2005 2010 2015
0.00
00.
005
0.01
00.
015
Envelope/Births
Time
Env
elop
e/B
irth
s
non−aids
1985 1990 1995 2000 2005 2010 2015
Non−aids MMR
Year
0
5
10
15
20
NO
NA
IDS
MM
R
1985 1990 1995 2000 2005 2010 2015
Aids MMR
Year
0
0.02
0.04
0.06
AID
SM
MR

1985 1990 1995 2000 2005 2010 2015
Mauritania [MRT] (Western Africa)
Year
0
0.1
0.2
0.3
0.4
0.5
0.6
0.7
PM
1985 1990 1995 2000 2005 2010 2015
Mauritania [MRT] (Western Africa)
Year
0
500
1000
1500
MM
R
− Estimates −Mlate− MMR Database 2015 −Observed DataAdjusted Data− Data type −DHSMisc. studies
1985 1990 1995 2000 2005 2010 2015
050
010
0015
0020
0025
0030
0035
00
Gross Domestic Product
Time
GD
P
1985 1990 1995 2000 2005 2010 2015
0.00
0.05
0.10
0.15
0.20
General Fertility Rate
Time
GF
R
1985 1990 1995 2000 2005 2010 2015
0.0
0.2
0.4
0.6
0.8
1.0
Skilled Attendance to Birth
Time
SA
B
1985 1990 1995 2000 2005 2010 2015
0.00
00.
005
0.01
00.
015
0.02
0
Envelope/Births
Time
Env
elop
e/B
irth
s
non−aids
1985 1990 1995 2000 2005 2010 2015
Non−aids MMR
Year
0
500
1000
1500
NO
NA
IDS
MM
R
1985 1990 1995 2000 2005 2010 2015
Aids MMR
Year
AID
SM
MR

1985 1990 1995 2000 2005 2010 2015
Mauritius [MUS] (Eastern Africa)
Year
0
0.05
0.1
PM
1985 1990 1995 2000 2005 2010 2015
Mauritius [MUS] (Eastern Africa)
Year
0
50
100
150
200
250
MM
R
− Estimates −Mlate− MMR Database 2015 −Observed DataAdjusted Data− Data type −VR
1985 1990 1995 2000 2005 2010 2015
050
0010
000
1500
0
Gross Domestic Product
Time
GD
P
1985 1990 1995 2000 2005 2010 2015
0.00
0.02
0.04
0.06
0.08
General Fertility Rate
Time
GF
R
1985 1990 1995 2000 2005 2010 2015
0.0
0.2
0.4
0.6
0.8
1.0
Skilled Attendance to Birth
Time
SA
B
1985 1990 1995 2000 2005 2010 2015
0.00
00.
005
0.01
00.
015
0.02
00.
025
0.03
0
Envelope/Births
Time
Env
elop
e/B
irth
s
non−aids
1985 1990 1995 2000 2005 2010 2015
Non−aids MMR
Year
0
50
100
150
NO
NA
IDS
MM
R
1985 1990 1995 2000 2005 2010 2015
Aids MMR
Year
0
0.05
0.1
0.15
0.2
0.25
0.3
0.35
AID
SM
MR

1985 1990 1995 2000 2005 2010 2015
Mexico [MEX] (Central America)
Year
0
0.05
0.1
PM
1985 1990 1995 2000 2005 2010 2015
Mexico [MEX] (Central America)
Year
0
50
100
150
MM
R
− Estimates −
Mlate
− MMR Database 2015 −
Observed Data
Adjusted Data
− Data type −
VR
Spec. studiesExcluded VR data (overlap with specialized study)
1985 1990 1995 2000 2005 2010 2015
050
0010
000
1500
0
Gross Domestic Product
Time
GD
P
1985 1990 1995 2000 2005 2010 2015
0.00
0.05
0.10
0.15
General Fertility Rate
Time
GF
R
1985 1990 1995 2000 2005 2010 2015
0.0
0.2
0.4
0.6
0.8
1.0
Skilled Attendance to Birth
Time
SA
B
1985 1990 1995 2000 2005 2010 2015
0.00
00.
005
0.01
00.
015
Envelope/Births
Time
Env
elop
e/B
irth
s
non−aids
1985 1990 1995 2000 2005 2010 2015
Non−aids MMR
Year
0
50
100
NO
NA
IDS
MM
R
1985 1990 1995 2000 2005 2010 2015
Aids MMR
Year
0
0.05
0.1
0.15
0.2
0.25
AID
SM
MR

1985 1990 1995 2000 2005 2010 2015
Micronesia [FSM] (South−Eastern Asia / Oceania)
Year
0
0.05
0.1
0.15
0.2
0.25
PM
1985 1990 1995 2000 2005 2010 2015
Micronesia [FSM] (South−Eastern Asia / Oceania)
Year
0
50
100
150
200
250
300
350
MM
R − Estimates −Mlate− MMR Database 2015 −
1985 1990 1995 2000 2005 2010 2015
010
0020
0030
0040
00
Gross Domestic Product
Time
GD
P
1985 1990 1995 2000 2005 2010 2015
0.00
0.05
0.10
0.15
General Fertility Rate
Time
GF
R
1985 1990 1995 2000 2005 2010 2015
0.0
0.2
0.4
0.6
0.8
1.0
Skilled Attendance to Birth
Time
SA
B
1985 1990 1995 2000 2005 2010 2015
0.00
00.
005
0.01
00.
015
0.02
0
Envelope/Births
Time
Env
elop
e/B
irth
s
non−aids
1985 1990 1995 2000 2005 2010 2015
Non−aids MMR
Year
0
50
100
150
200
250
300
350
NO
NA
IDS
MM
R
1985 1990 1995 2000 2005 2010 2015
Aids MMR
Year
00.010.02
AID
SM
MR

1985 1990 1995 2000 2005 2010 2015
Mongolia [MNG] (Eastern Asia)
Year
0
0.05
0.1
0.15
0.2
0.25
PM
●
1985 1990 1995 2000 2005 2010 2015
Mongolia [MNG] (Eastern Asia)
Year
0
100
200
300
400
MM
R
●
●
− Estimates −
Mlate
− MMR Database 2015 −
Observed Data
Adjusted Data
− Data type −
Misc. studiesExcluded VR data (data quality issues)
1985 1990 1995 2000 2005 2010 2015
020
0040
0060
0080
0010
000
Gross Domestic Product
Time
GD
P
1985 1990 1995 2000 2005 2010 2015
0.00
0.05
0.10
0.15
General Fertility Rate
Time
GF
R
1985 1990 1995 2000 2005 2010 2015
0.0
0.2
0.4
0.6
0.8
1.0
Skilled Attendance to Birth
Time
SA
B
1985 1990 1995 2000 2005 2010 2015
0.00
00.
005
0.01
00.
015
0.02
00.
025
0.03
0
Envelope/Births
Time
Env
elop
e/B
irth
s
non−aids
1985 1990 1995 2000 2005 2010 2015
Non−aids MMR
Year
0
50
100
150
200
250
300
NO
NA
IDS
MM
R
1985 1990 1995 2000 2005 2010 2015
Aids MMR
Year
0
0.05
0.1
0.15
0.2
0.25
0.3
0.35
AID
SM
MR

1985 1990 1995 2000 2005 2010 2015
Montenegro [MNE] (Transition countries of South−Eastern Europe)
Year
0
0.01
PM
1985 1990 1995 2000 2005 2010 2015
Montenegro [MNE] (Transition countries of South−Eastern Europe)
Year
0
5
10
15
20
MM
R
− Estimates −
Mlate
− MMR Database 2015 −
Observed Data
Adjusted Data
− Data type −
VRReported VR before recalc.(related to 0 obs. mat. death)
1985 1990 1995 2000 2005 2010 2015
050
0010
000
1500
0
Gross Domestic Product
Time
GD
P
1985 1990 1995 2000 2005 2010 2015
0.00
0.02
0.04
0.06
General Fertility Rate
Time
GF
R
1985 1990 1995 2000 2005 2010 2015
0.0
0.2
0.4
0.6
0.8
1.0
Skilled Attendance to Birth
Time
SA
B
1985 1990 1995 2000 2005 2010 2015
0.00
00.
005
0.01
00.
015
0.02
0
Envelope/Births
Time
Env
elop
e/B
irth
s
non−aids
1985 1990 1995 2000 2005 2010 2015
Non−aids MMR
Year
0
5
10
15
20
NO
NA
IDS
MM
R
1985 1990 1995 2000 2005 2010 2015
Aids MMR
Year
00.010.02
AID
SM
MR
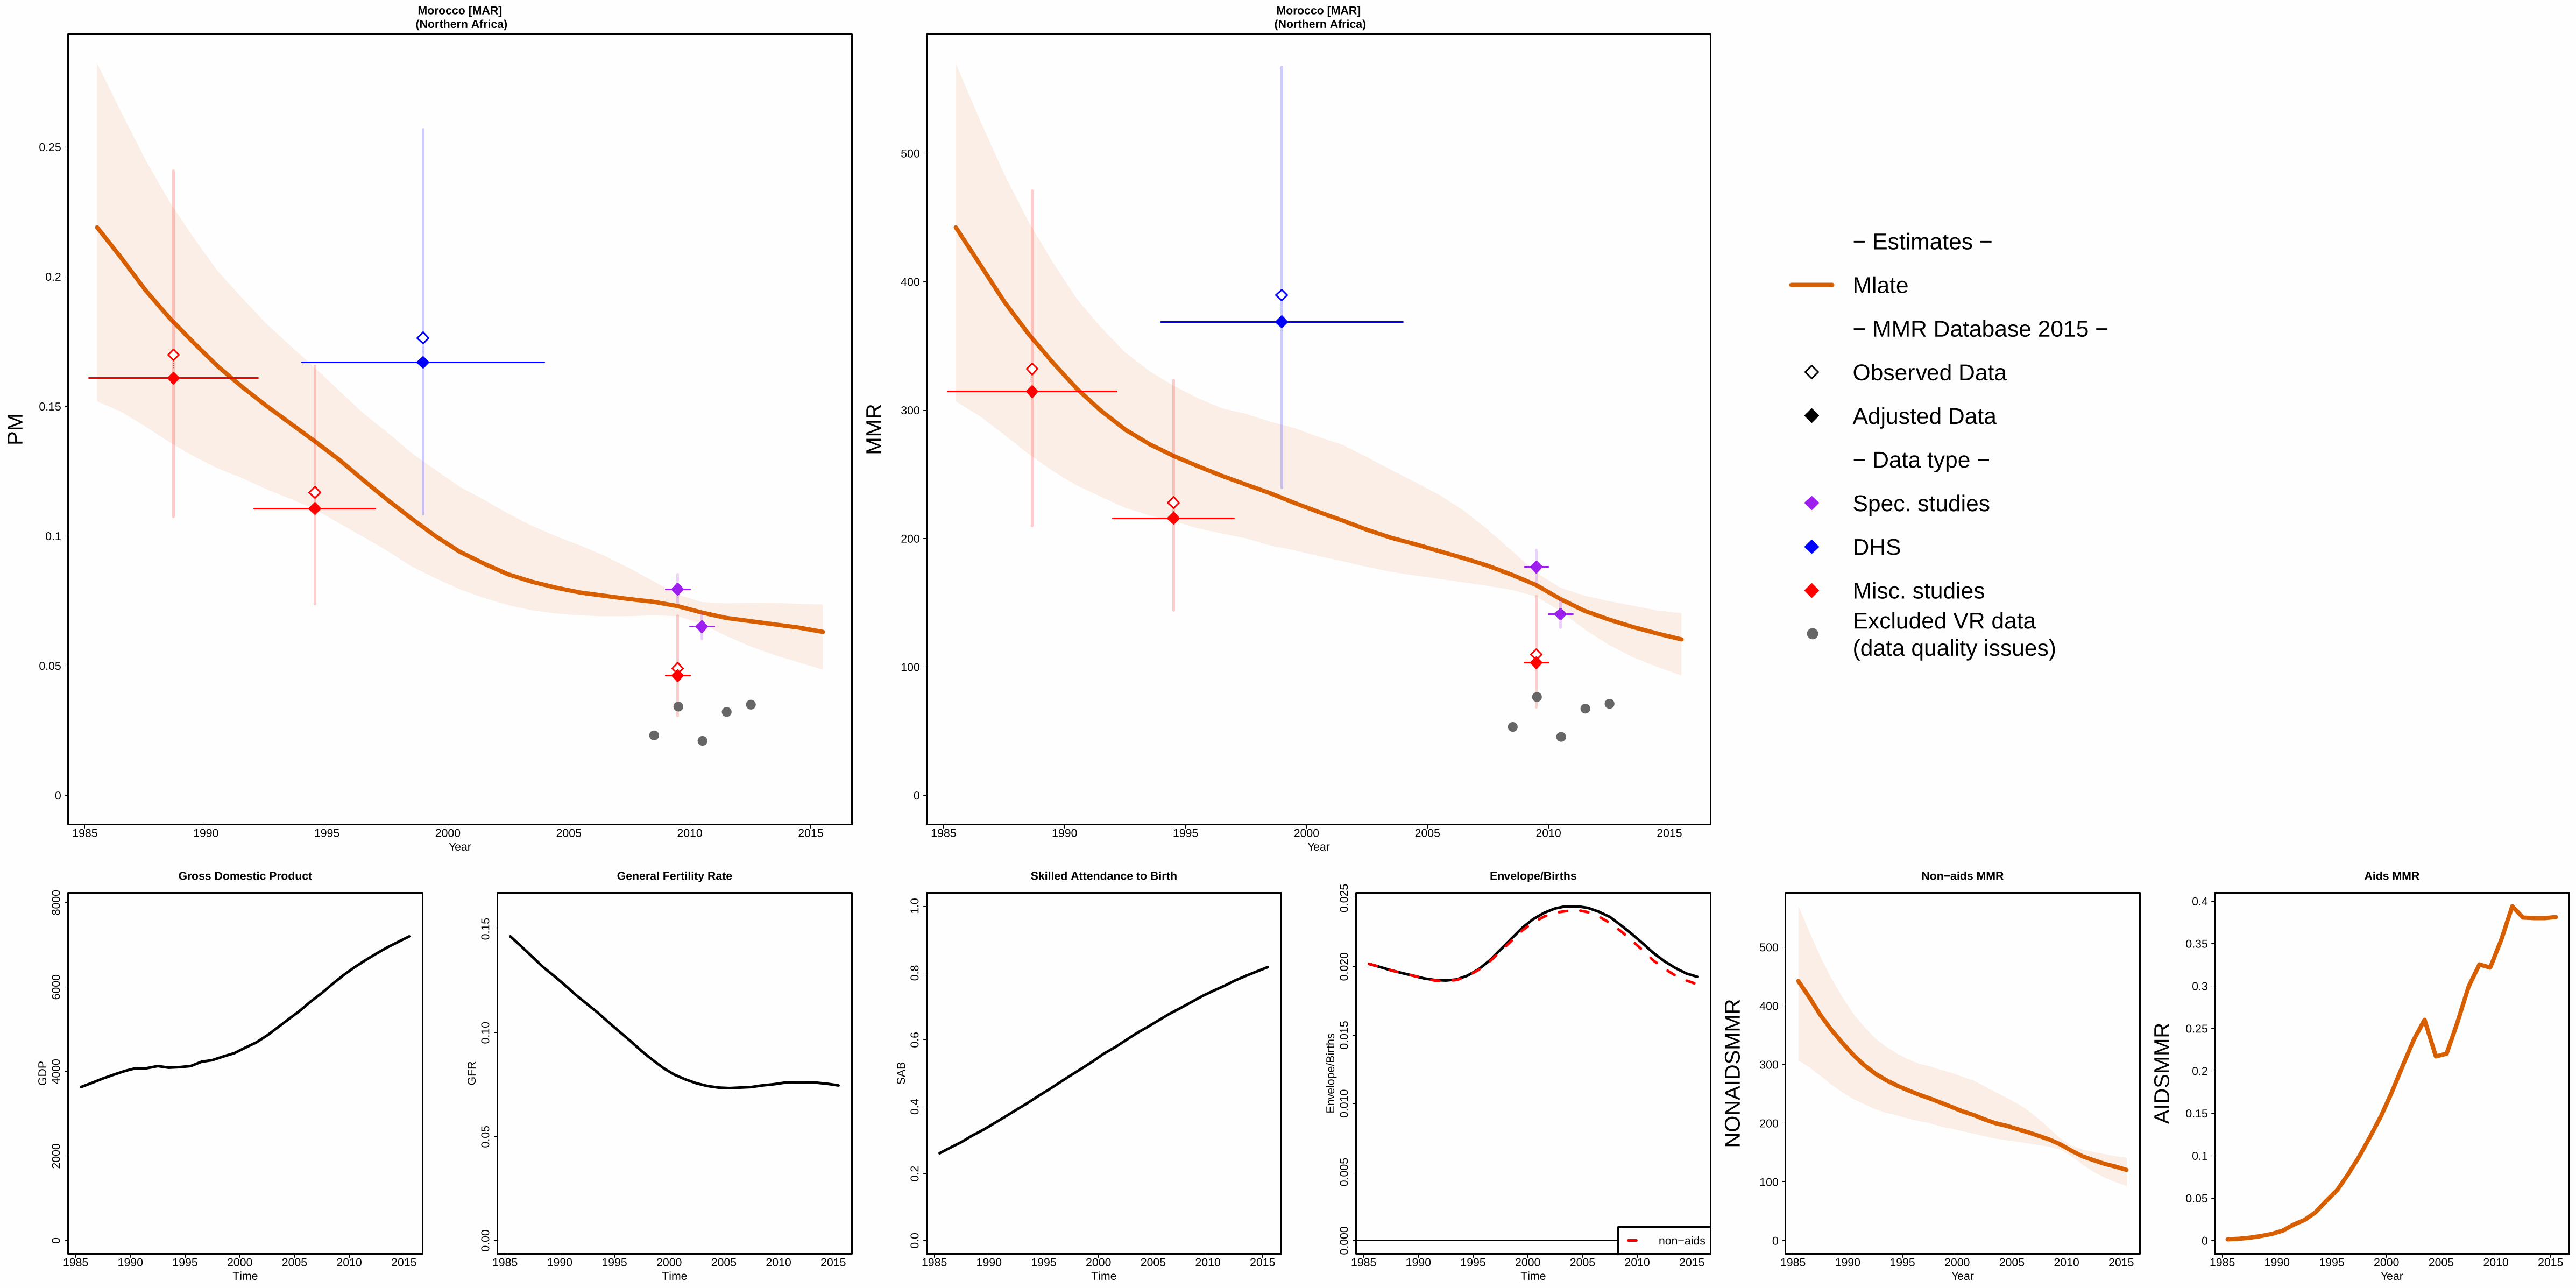
1985 1990 1995 2000 2005 2010 2015
Morocco [MAR] (Northern Africa)
Year
0
0.05
0.1
0.15
0.2
0.25
PM
●
●
●
●●
1985 1990 1995 2000 2005 2010 2015
Morocco [MAR] (Northern Africa)
Year
0
100
200
300
400
500
MM
R
●
●
●
● ●
●
− Estimates −
Mlate
− MMR Database 2015 −
Observed Data
Adjusted Data
− Data type −
Spec. studies
DHS
Misc. studiesExcluded VR data (data quality issues)
1985 1990 1995 2000 2005 2010 2015
020
0040
0060
0080
00
Gross Domestic Product
Time
GD
P
1985 1990 1995 2000 2005 2010 2015
0.00
0.05
0.10
0.15
General Fertility Rate
Time
GF
R
1985 1990 1995 2000 2005 2010 2015
0.0
0.2
0.4
0.6
0.8
1.0
Skilled Attendance to Birth
Time
SA
B
1985 1990 1995 2000 2005 2010 2015
0.00
00.
005
0.01
00.
015
0.02
00.
025
Envelope/Births
Time
Env
elop
e/B
irth
s
non−aids
1985 1990 1995 2000 2005 2010 2015
Non−aids MMR
Year
0
100
200
300
400
500
NO
NA
IDS
MM
R
1985 1990 1995 2000 2005 2010 2015
Aids MMR
Year
0
0.05
0.1
0.15
0.2
0.25
0.3
0.35
0.4
AID
SM
MR
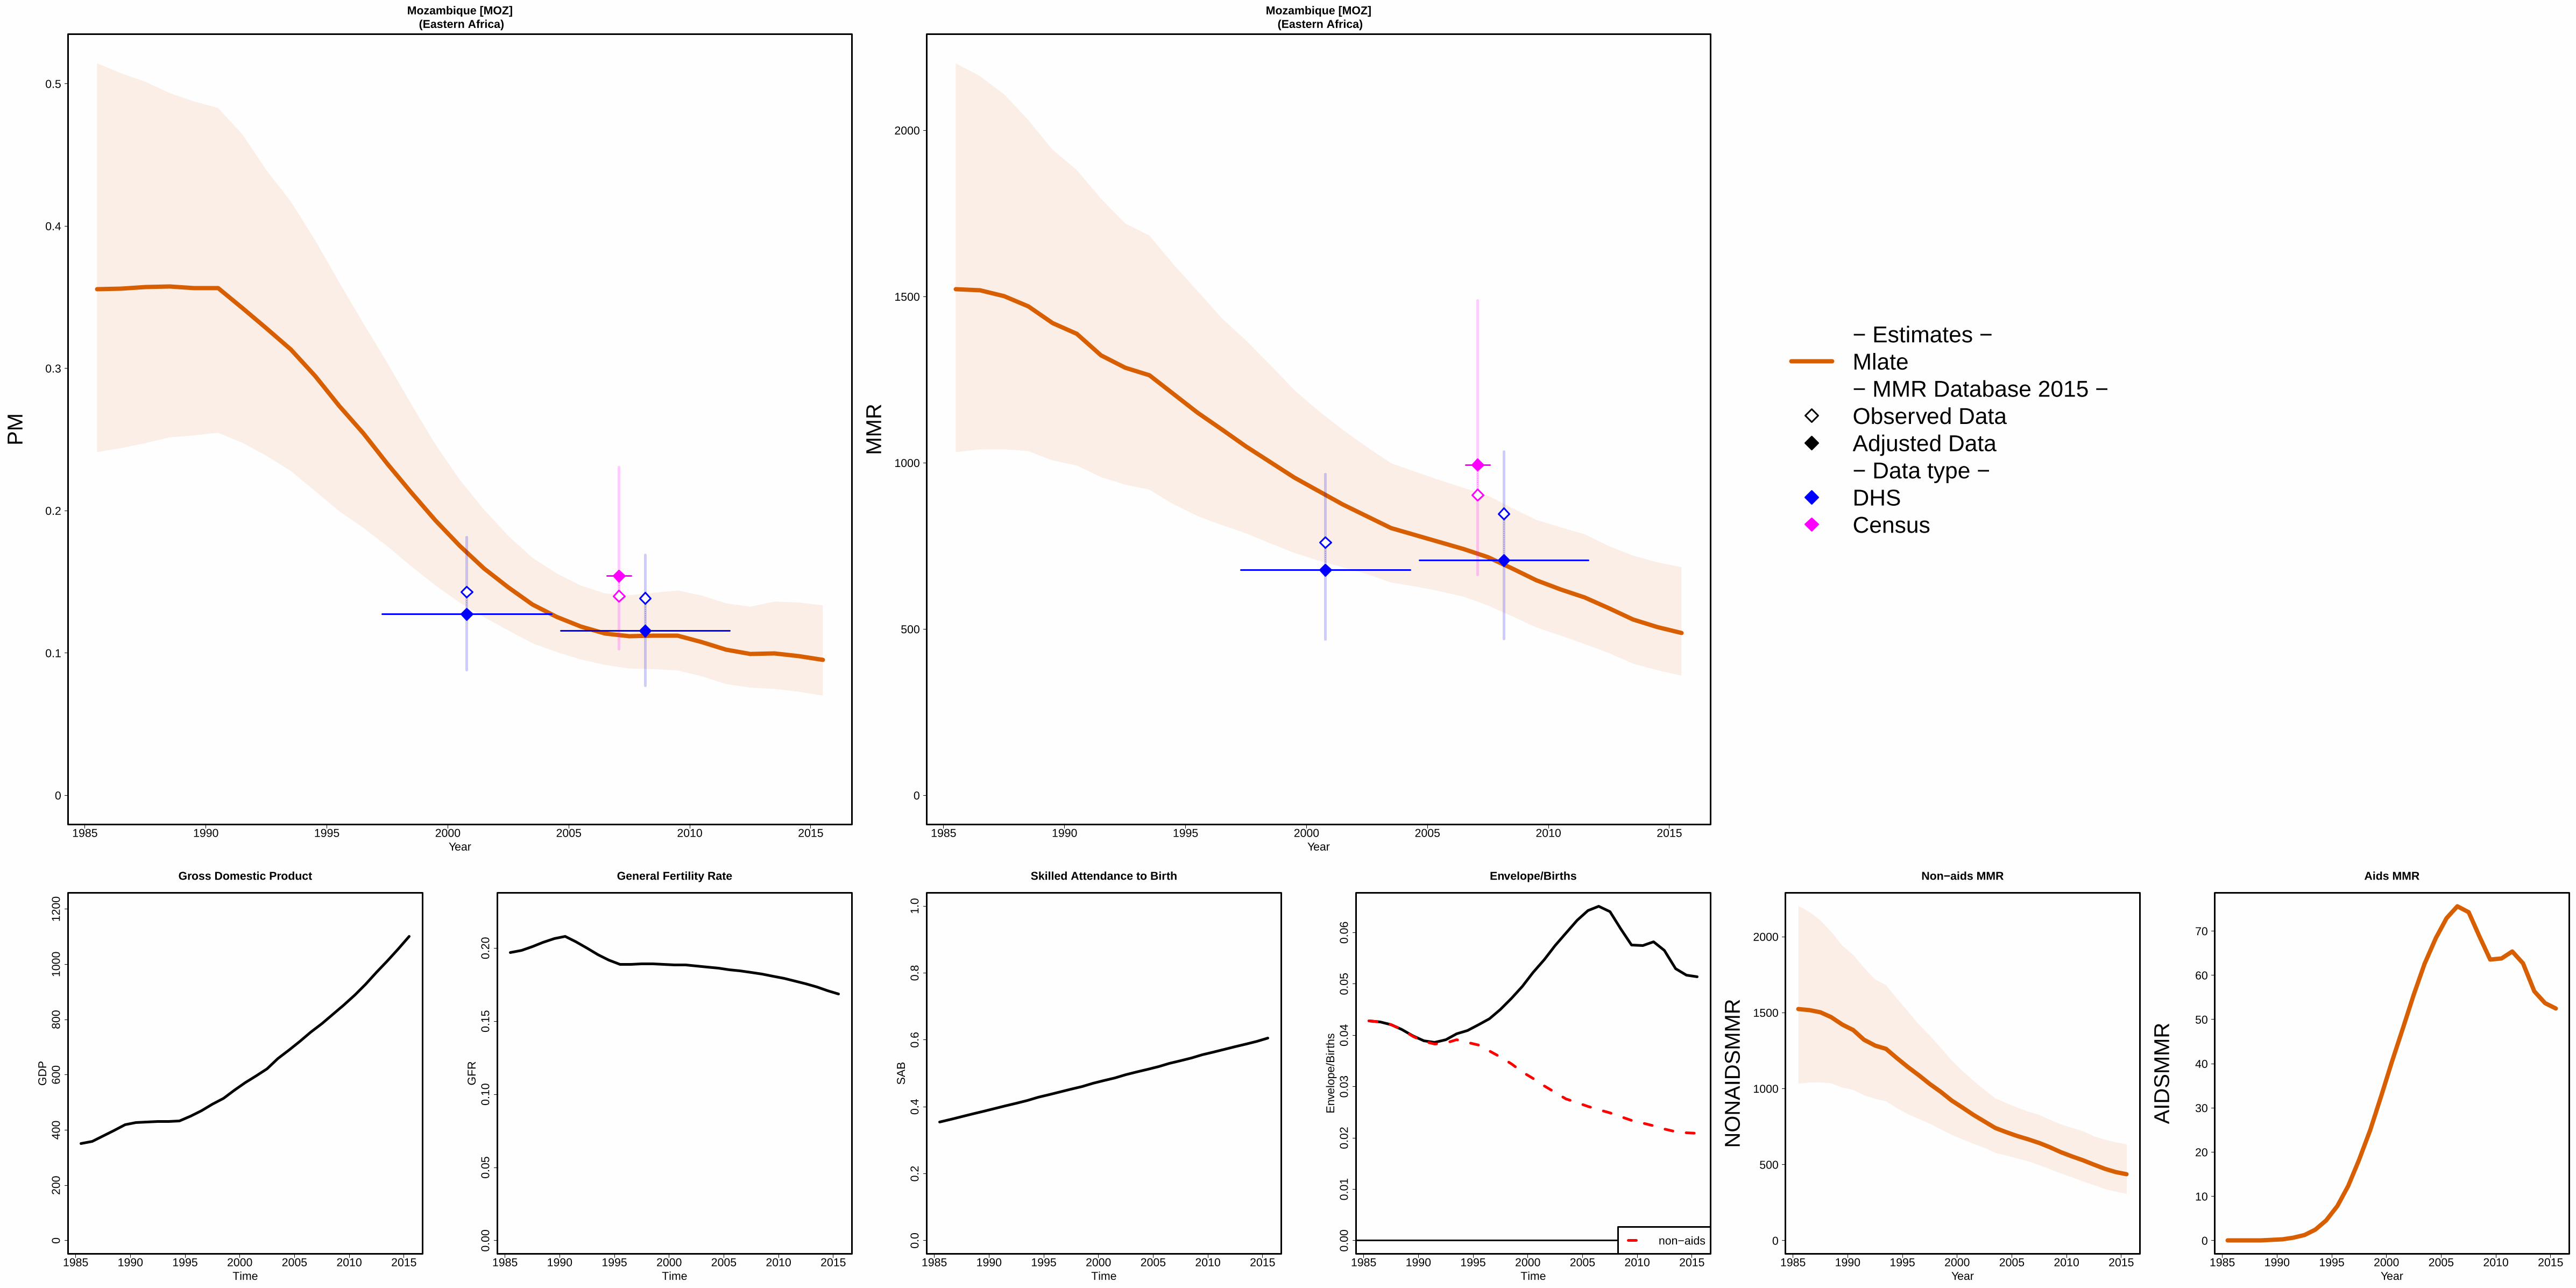
1985 1990 1995 2000 2005 2010 2015
Mozambique [MOZ] (Eastern Africa)
Year
0
0.1
0.2
0.3
0.4
0.5
PM
1985 1990 1995 2000 2005 2010 2015
Mozambique [MOZ] (Eastern Africa)
Year
0
500
1000
1500
2000
MM
R
− Estimates −Mlate− MMR Database 2015 −Observed DataAdjusted Data− Data type −DHSCensus
1985 1990 1995 2000 2005 2010 2015
020
040
060
080
010
0012
00
Gross Domestic Product
Time
GD
P
1985 1990 1995 2000 2005 2010 2015
0.00
0.05
0.10
0.15
0.20
General Fertility Rate
Time
GF
R
1985 1990 1995 2000 2005 2010 2015
0.0
0.2
0.4
0.6
0.8
1.0
Skilled Attendance to Birth
Time
SA
B
1985 1990 1995 2000 2005 2010 2015
0.00
0.01
0.02
0.03
0.04
0.05
0.06
Envelope/Births
Time
Env
elop
e/B
irth
s
non−aids
1985 1990 1995 2000 2005 2010 2015
Non−aids MMR
Year
0
500
1000
1500
2000
NO
NA
IDS
MM
R
1985 1990 1995 2000 2005 2010 2015
Aids MMR
Year
0
10
20
30
40
50
60
70
AID
SM
MR
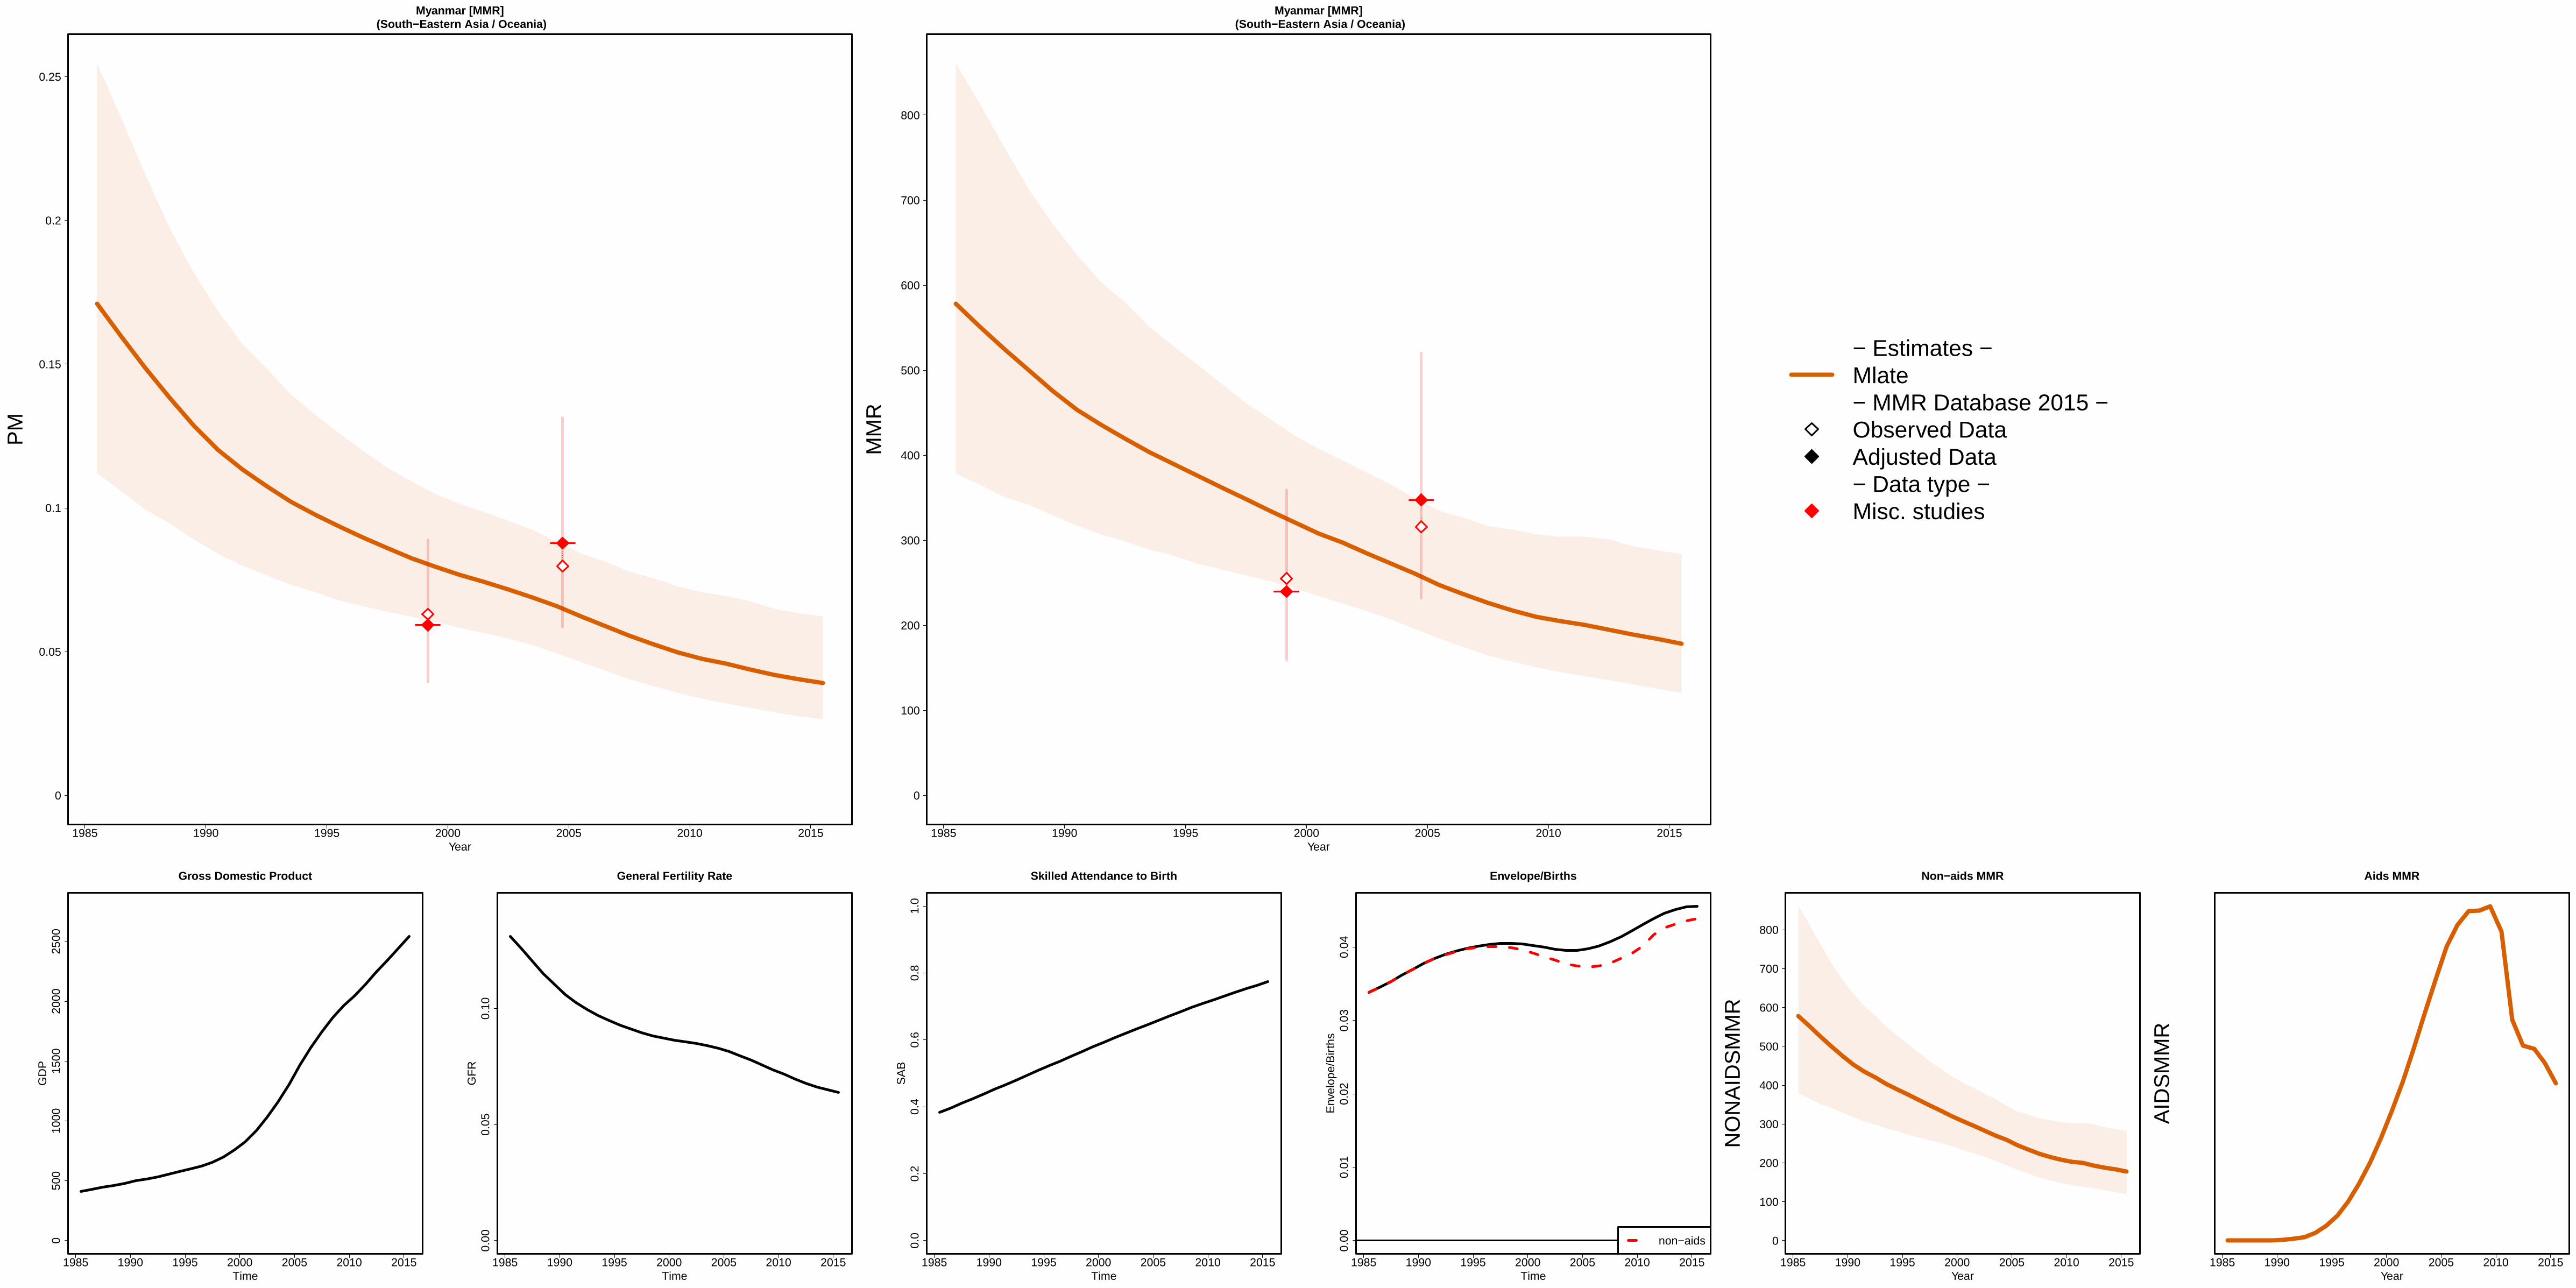
1985 1990 1995 2000 2005 2010 2015
Myanmar [MMR] (South−Eastern Asia / Oceania)
Year
0
0.05
0.1
0.15
0.2
0.25
PM
1985 1990 1995 2000 2005 2010 2015
Myanmar [MMR] (South−Eastern Asia / Oceania)
Year
0
100
200
300
400
500
600
700
800
MM
R
− Estimates −Mlate− MMR Database 2015 −Observed DataAdjusted Data− Data type −Misc. studies
1985 1990 1995 2000 2005 2010 2015
050
010
0015
0020
0025
00
Gross Domestic Product
Time
GD
P
1985 1990 1995 2000 2005 2010 2015
0.00
0.05
0.10
General Fertility Rate
Time
GF
R
1985 1990 1995 2000 2005 2010 2015
0.0
0.2
0.4
0.6
0.8
1.0
Skilled Attendance to Birth
Time
SA
B
1985 1990 1995 2000 2005 2010 2015
0.00
0.01
0.02
0.03
0.04
Envelope/Births
Time
Env
elop
e/B
irth
s
non−aids
1985 1990 1995 2000 2005 2010 2015
Non−aids MMR
Year
0
100
200
300
400
500
600
700
800
NO
NA
IDS
MM
R
1985 1990 1995 2000 2005 2010 2015
Aids MMR
Year
AID
SM
MR

1985 1990 1995 2000 2005 2010 2015
Namibia [NAM] (Southern Africa)
Year
0
0.05
0.1
0.15
0.2
0.25
PM
1985 1990 1995 2000 2005 2010 2015
Namibia [NAM] (Southern Africa)
Year
0
100
200
300
400
500
600
700
800
MM
R
− Estimates −Mlate− MMR Database 2015 −Observed DataAdjusted Data− Data type −DHSCensus
1985 1990 1995 2000 2005 2010 2015
020
0040
0060
0080
0010
000
Gross Domestic Product
Time
GD
P
1985 1990 1995 2000 2005 2010 2015
0.00
0.05
0.10
0.15
0.20
General Fertility Rate
Time
GF
R
1985 1990 1995 2000 2005 2010 2015
0.0
0.2
0.4
0.6
0.8
1.0
Skilled Attendance to Birth
Time
SA
B
1985 1990 1995 2000 2005 2010 2015
0.00
0.02
0.04
0.06
0.08
0.10
Envelope/Births
Time
Env
elop
e/B
irth
s
non−aids
1985 1990 1995 2000 2005 2010 2015
Non−aids MMR
Year
0
100
200
300
400
500
NO
NA
IDS
MM
R
1985 1990 1995 2000 2005 2010 2015
Aids MMR
Year
0
50
100
AID
SM
MR

1985 1990 1995 2000 2005 2010 2015
Nepal [NPL] (Southern Asia)
Year
0
0.1
0.2
0.3
0.4
PM
1985 1990 1995 2000 2005 2010 2015
Nepal [NPL] (Southern Asia)
Year
0
500
1000
1500
MM
R
− Estimates −Mlate− MMR Database 2015 −Observed DataAdjusted Data− Data type −DHSCensusExcluded misc. studies
1985 1990 1995 2000 2005 2010 2015
050
010
0015
0020
0025
00
Gross Domestic Product
Time
GD
P
1985 1990 1995 2000 2005 2010 2015
0.00
0.05
0.10
0.15
0.20
General Fertility Rate
Time
GF
R
1985 1990 1995 2000 2005 2010 2015
0.0
0.2
0.4
0.6
0.8
1.0
Skilled Attendance to Birth
Time
SA
B
1985 1990 1995 2000 2005 2010 2015
0.00
0.01
0.02
0.03
Envelope/Births
Time
Env
elop
e/B
irth
s
non−aids
1985 1990 1995 2000 2005 2010 2015
Non−aids MMR
Year
0
500
1000
1500
NO
NA
IDS
MM
R
1985 1990 1995 2000 2005 2010 2015
Aids MMR
Year
AID
SM
MR

1985 1990 1995 2000 2005 2010 2015
Netherlands [NLD] (Developed regions)
Year
0
0.01
PM
1985 1990 1995 2000 2005 2010 2015
Netherlands [NLD] (Developed regions)
Year
0
5
10
15
20
25
MM
R
− Estimates −
Mlate
− MMR Database 2015 −
Observed Data
Adjusted Data
− Data type −
VR
Spec. studiesExcluded VR data (overlap with specialized study)
1985 1990 1995 2000 2005 2010 2015
010
000
2000
030
000
4000
0
Gross Domestic Product
Time
GD
P
1985 1990 1995 2000 2005 2010 2015
0.00
0.01
0.02
0.03
0.04
0.05
General Fertility Rate
Time
GF
R
1985 1990 1995 2000 2005 2010 2015
0.0
0.2
0.4
0.6
0.8
1.0
Skilled Attendance to Birth
Time
SA
B
1985 1990 1995 2000 2005 2010 2015
0.00
00.
005
0.01
00.
015
Envelope/Births
Time
Env
elop
e/B
irth
s
non−aids
1985 1990 1995 2000 2005 2010 2015
Non−aids MMR
Year
0
5
10
15
NO
NA
IDS
MM
R
1985 1990 1995 2000 2005 2010 2015
Aids MMR
Year
0
0.05
0.1
AID
SM
MR
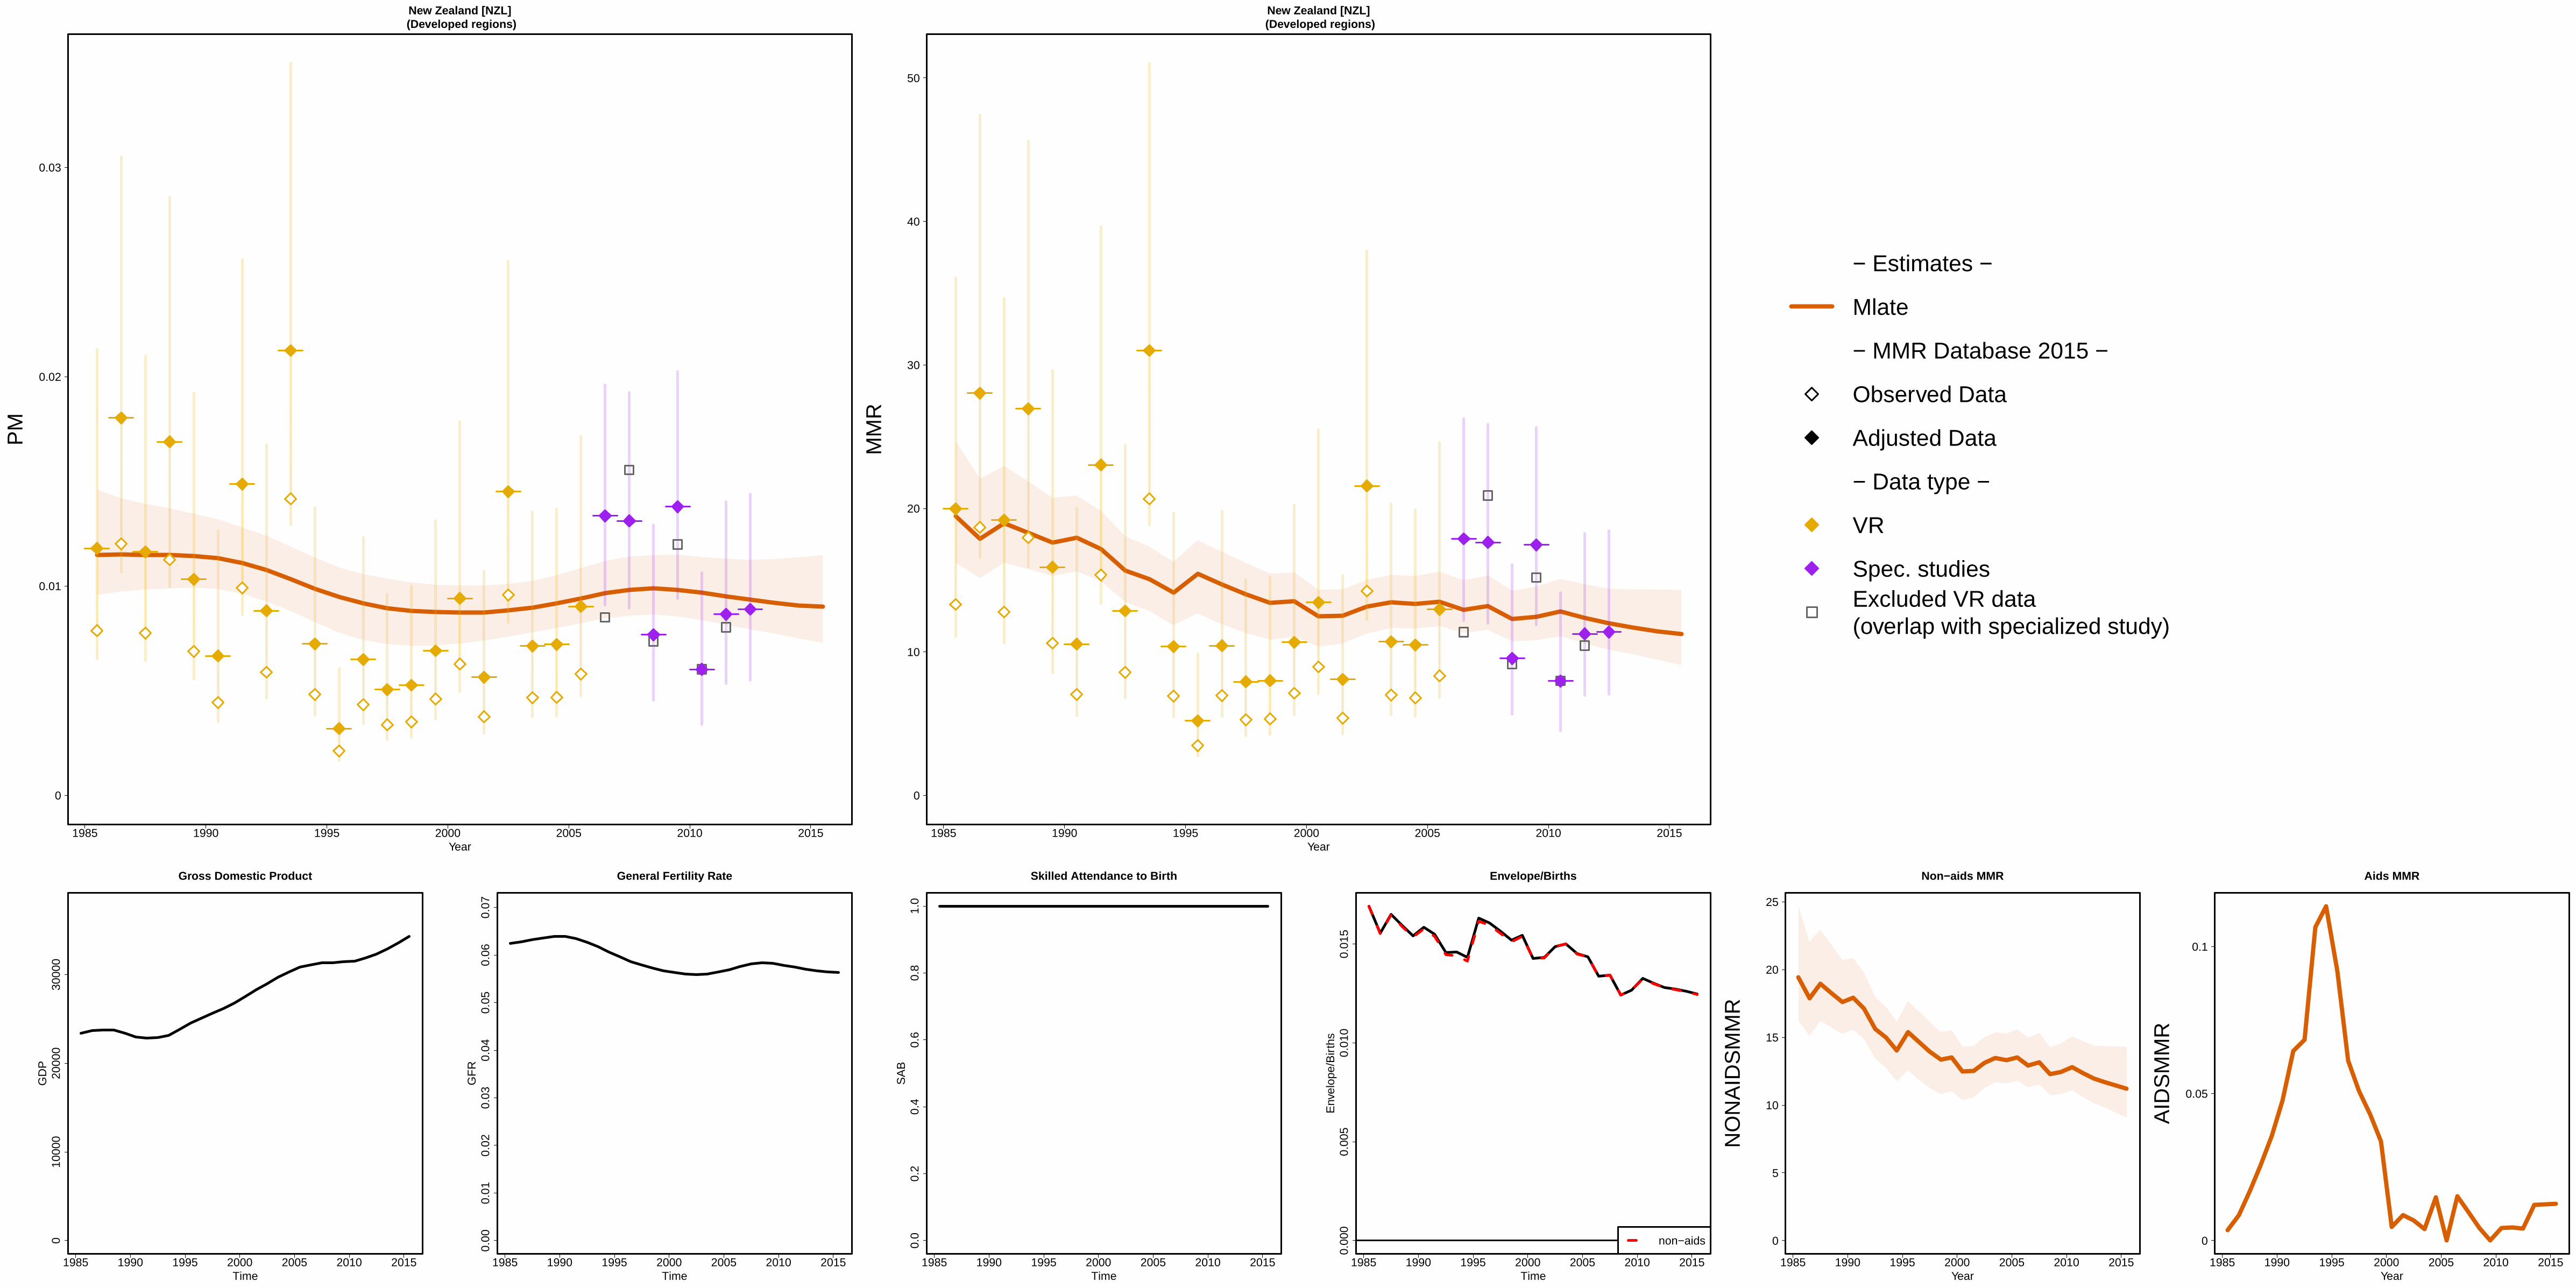
1985 1990 1995 2000 2005 2010 2015
New Zealand [NZL] (Developed regions)
Year
0
0.01
0.02
0.03
PM
1985 1990 1995 2000 2005 2010 2015
New Zealand [NZL] (Developed regions)
Year
0
10
20
30
40
50
MM
R
− Estimates −
Mlate
− MMR Database 2015 −
Observed Data
Adjusted Data
− Data type −
VR
Spec. studiesExcluded VR data (overlap with specialized study)
1985 1990 1995 2000 2005 2010 2015
010
000
2000
030
000
Gross Domestic Product
Time
GD
P
1985 1990 1995 2000 2005 2010 2015
0.00
0.01
0.02
0.03
0.04
0.05
0.06
0.07
General Fertility Rate
Time
GF
R
1985 1990 1995 2000 2005 2010 2015
0.0
0.2
0.4
0.6
0.8
1.0
Skilled Attendance to Birth
Time
SA
B
1985 1990 1995 2000 2005 2010 2015
0.00
00.
005
0.01
00.
015
Envelope/Births
Time
Env
elop
e/B
irth
s
non−aids
1985 1990 1995 2000 2005 2010 2015
Non−aids MMR
Year
0
5
10
15
20
25
NO
NA
IDS
MM
R
1985 1990 1995 2000 2005 2010 2015
Aids MMR
Year
0
0.05
0.1
AID
SM
MR

1985 1990 1995 2000 2005 2010 2015
Nicaragua [NIC] (Central America)
Year
0
0.05
0.1
0.15
0.2
0.25
PM
1985 1990 1995 2000 2005 2010 2015
Nicaragua [NIC] (Central America)
Year
0
50
100
150
200
250
300
MM
R
− Estimates −Mlate− MMR Database 2015 −Observed DataAdjusted Data− Data type −VRCensus
1985 1990 1995 2000 2005 2010 2015
010
0020
0030
0040
0050
00
Gross Domestic Product
Time
GD
P
1985 1990 1995 2000 2005 2010 2015
0.00
0.05
0.10
0.15
0.20
General Fertility Rate
Time
GF
R
1985 1990 1995 2000 2005 2010 2015
0.0
0.2
0.4
0.6
0.8
1.0
Skilled Attendance to Birth
Time
SA
B
1985 1990 1995 2000 2005 2010 2015
0.00
00.
005
0.01
00.
015
Envelope/Births
Time
Env
elop
e/B
irth
s
non−aids
1985 1990 1995 2000 2005 2010 2015
Non−aids MMR
Year
0
50
100
150
200
250
NO
NA
IDS
MM
R
1985 1990 1995 2000 2005 2010 2015
Aids MMR
Year
0
0.05
0.1
0.15
0.2
0.25
AID
SM
MR
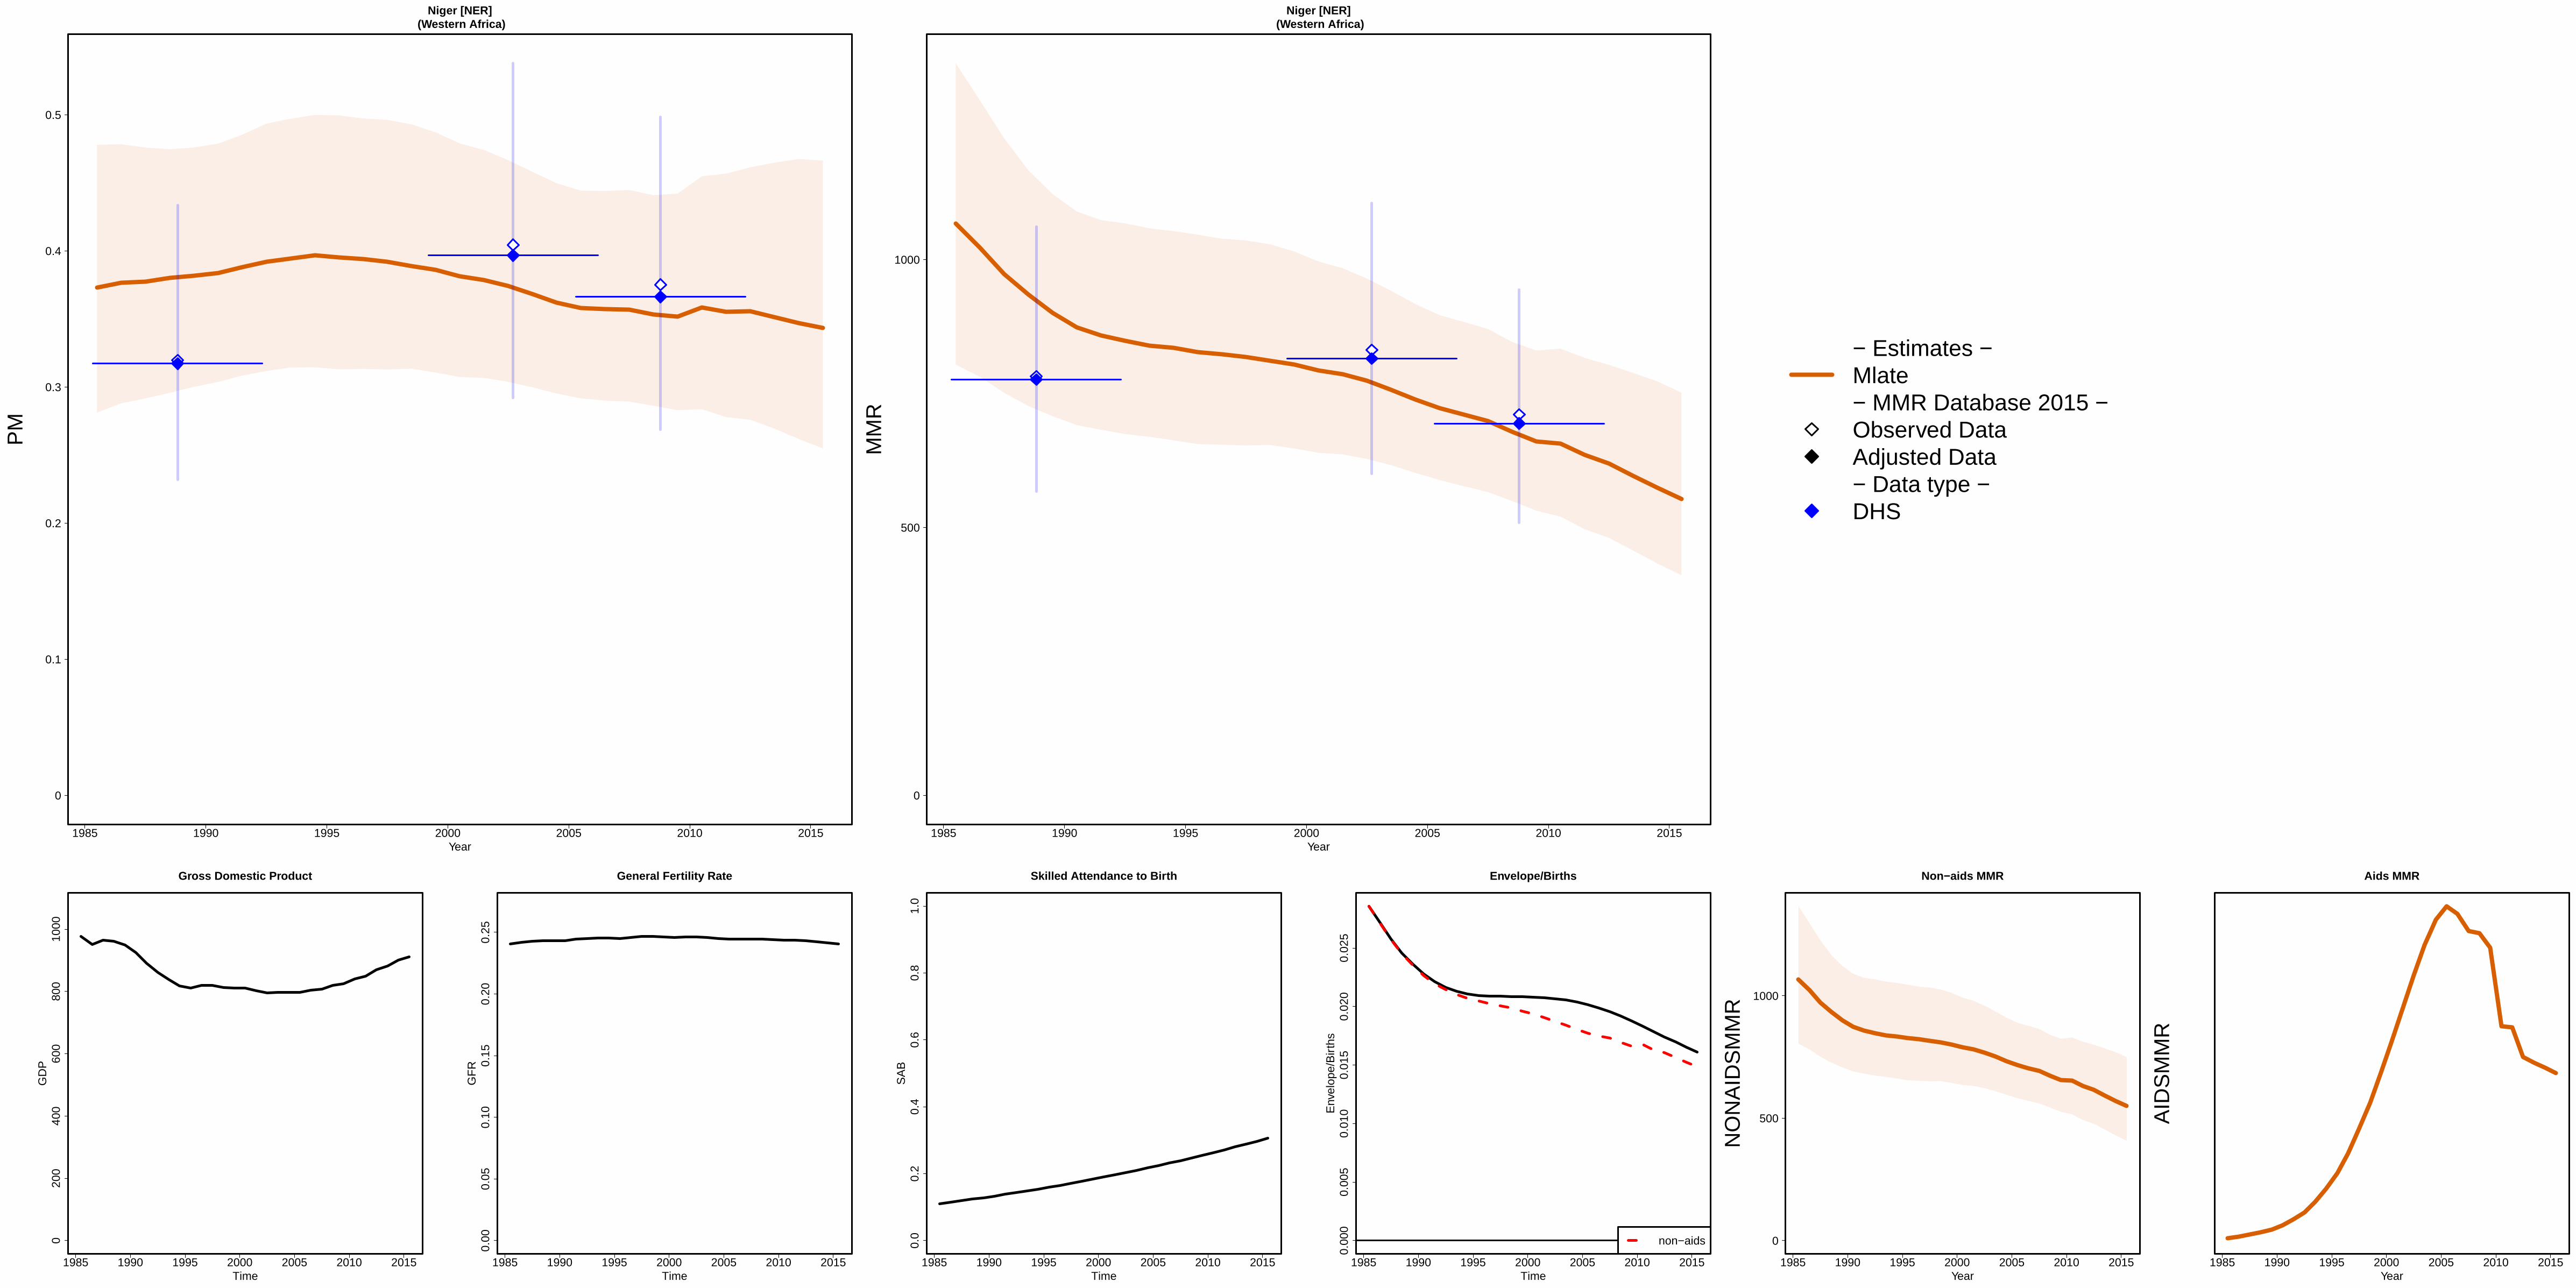
1985 1990 1995 2000 2005 2010 2015
Niger [NER] (Western Africa)
Year
0
0.1
0.2
0.3
0.4
0.5
PM
1985 1990 1995 2000 2005 2010 2015
Niger [NER] (Western Africa)
Year
0
500
1000
MM
R
− Estimates −Mlate− MMR Database 2015 −Observed DataAdjusted Data− Data type −DHS
1985 1990 1995 2000 2005 2010 2015
020
040
060
080
010
00
Gross Domestic Product
Time
GD
P
1985 1990 1995 2000 2005 2010 2015
0.00
0.05
0.10
0.15
0.20
0.25
General Fertility Rate
Time
GF
R
1985 1990 1995 2000 2005 2010 2015
0.0
0.2
0.4
0.6
0.8
1.0
Skilled Attendance to Birth
Time
SA
B
1985 1990 1995 2000 2005 2010 2015
0.00
00.
005
0.01
00.
015
0.02
00.
025
Envelope/Births
Time
Env
elop
e/B
irth
s
non−aids
1985 1990 1995 2000 2005 2010 2015
Non−aids MMR
Year
0
500
1000
NO
NA
IDS
MM
R
1985 1990 1995 2000 2005 2010 2015
Aids MMR
Year
AID
SM
MR
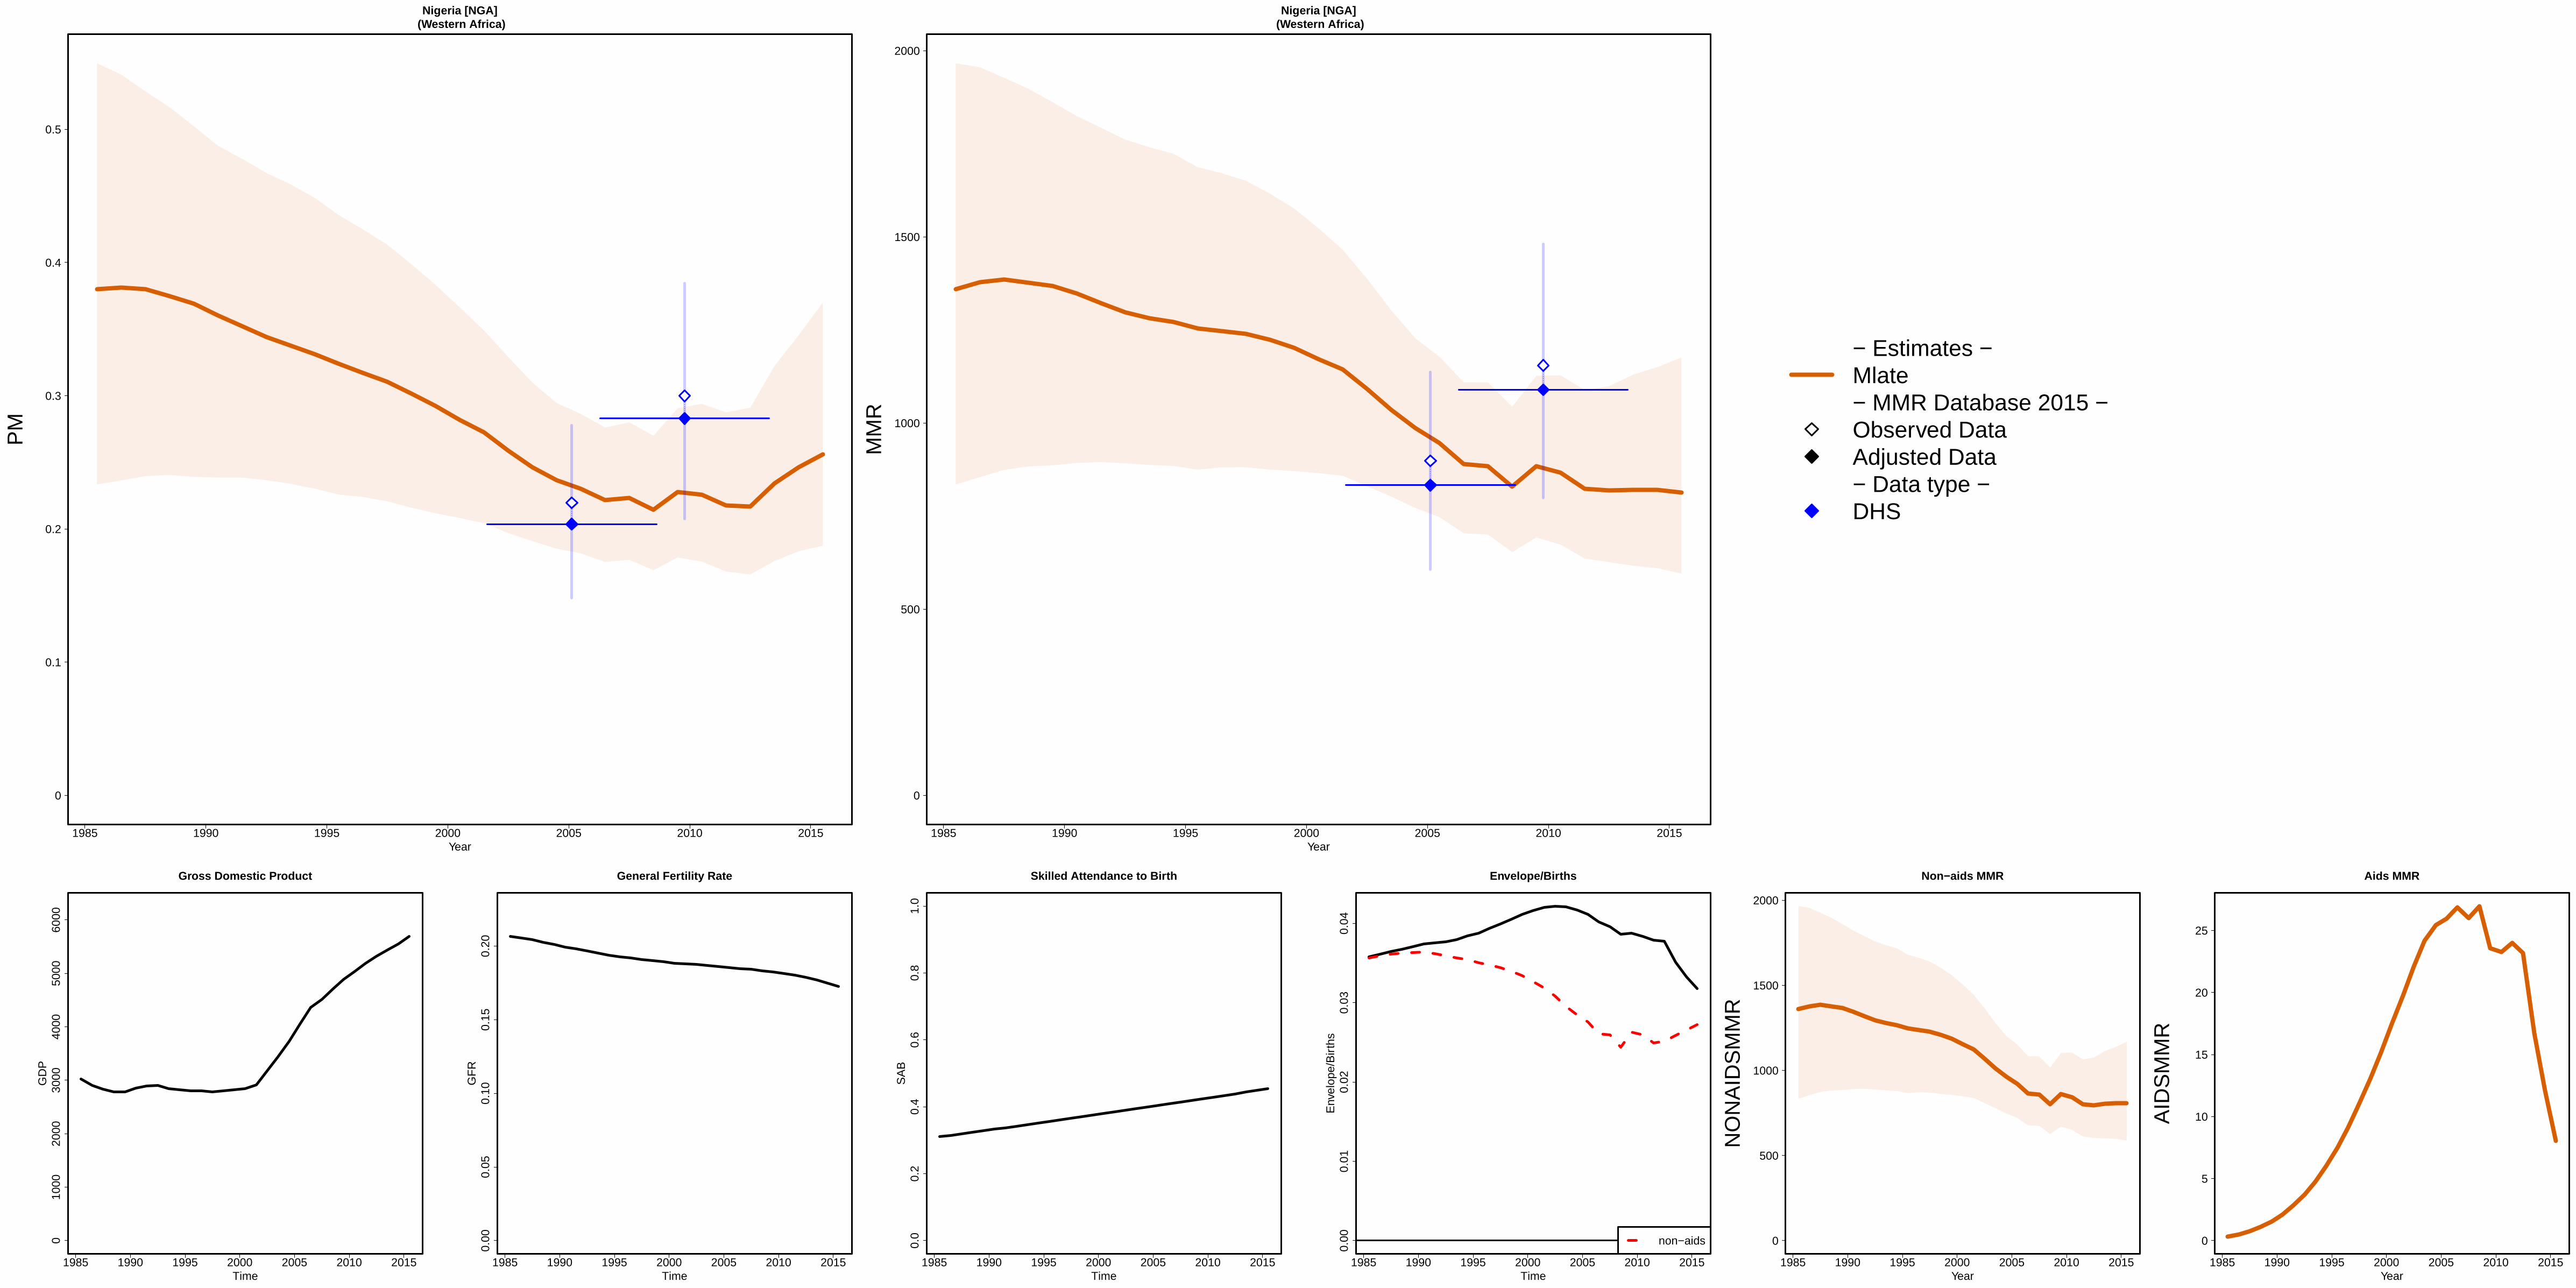
1985 1990 1995 2000 2005 2010 2015
Nigeria [NGA] (Western Africa)
Year
0
0.1
0.2
0.3
0.4
0.5
PM
1985 1990 1995 2000 2005 2010 2015
Nigeria [NGA] (Western Africa)
Year
0
500
1000
1500
2000
MM
R
− Estimates −Mlate− MMR Database 2015 −Observed DataAdjusted Data− Data type −DHS
1985 1990 1995 2000 2005 2010 2015
010
0020
0030
0040
0050
0060
00
Gross Domestic Product
Time
GD
P
1985 1990 1995 2000 2005 2010 2015
0.00
0.05
0.10
0.15
0.20
General Fertility Rate
Time
GF
R
1985 1990 1995 2000 2005 2010 2015
0.0
0.2
0.4
0.6
0.8
1.0
Skilled Attendance to Birth
Time
SA
B
1985 1990 1995 2000 2005 2010 2015
0.00
0.01
0.02
0.03
0.04
Envelope/Births
Time
Env
elop
e/B
irth
s
non−aids
1985 1990 1995 2000 2005 2010 2015
Non−aids MMR
Year
0
500
1000
1500
2000
NO
NA
IDS
MM
R
1985 1990 1995 2000 2005 2010 2015
Aids MMR
Year
0
5
10
15
20
25
AID
SM
MR

1985 1990 1995 2000 2005 2010 2015
Norway [NOR] (Developed regions)
Year
0
0.01
PM
1985 1990 1995 2000 2005 2010 2015
Norway [NOR] (Developed regions)
Year
0
5
10
15
20
25
MM
R
− Estimates −
Mlate
− MMR Database 2015 −
Observed Data
Adjusted Data
− Data type −
VR
Spec. studiesReported VR before recalc.(related to 0 obs. mat. death)Excluded VR data (overlap with specialized study)
1985 1990 1995 2000 2005 2010 2015
010
000
2000
030
000
4000
050
000
6000
070
000
Gross Domestic Product
Time
GD
P
1985 1990 1995 2000 2005 2010 2015
0.00
0.01
0.02
0.03
0.04
0.05
0.06
General Fertility Rate
Time
GF
R
1985 1990 1995 2000 2005 2010 2015
0.0
0.2
0.4
0.6
0.8
1.0
Skilled Attendance to Birth
Time
SA
B
1985 1990 1995 2000 2005 2010 2015
0.00
00.
002
0.00
40.
006
0.00
80.
010
0.01
20.
014
Envelope/Births
Time
Env
elop
e/B
irth
s
non−aids
1985 1990 1995 2000 2005 2010 2015
Non−aids MMR
Year
NO
NA
IDS
MM
R
1985 1990 1995 2000 2005 2010 2015
Aids MMR
Year
0
0.02
0.04
0.06
AID
SM
MR

1985 1990 1995 2000 2005 2010 2015
Occupied Palestinian Territory [PSE] (Western Asia)
Year
0
0.05
0.1
0.15
0.2
0.25
PM
1985 1990 1995 2000 2005 2010 2015
Occupied Palestinian Territory [PSE] (Western Asia)
Year
0
50
100
150
200
250
MM
R − Estimates −Mlate− MMR Database 2015 −
1985 1990 1995 2000 2005 2010 2015
010
0020
0030
0040
0050
00
Gross Domestic Product
Time
GD
P
1985 1990 1995 2000 2005 2010 2015
0.00
0.05
0.10
0.15
0.20
General Fertility Rate
Time
GF
R
1985 1990 1995 2000 2005 2010 2015
0.0
0.2
0.4
0.6
0.8
1.0
Skilled Attendance to Birth
Time
SA
B
1985 1990 1995 2000 2005 2010 2015
0.00
00.
002
0.00
40.
006
0.00
80.
010
Envelope/Births
Time
Env
elop
e/B
irth
s
non−aids
1985 1990 1995 2000 2005 2010 2015
Non−aids MMR
Year
0
50
100
150
200
250
NO
NA
IDS
MM
R
1985 1990 1995 2000 2005 2010 2015
Aids MMR
Year
00.010.02
AID
SM
MR
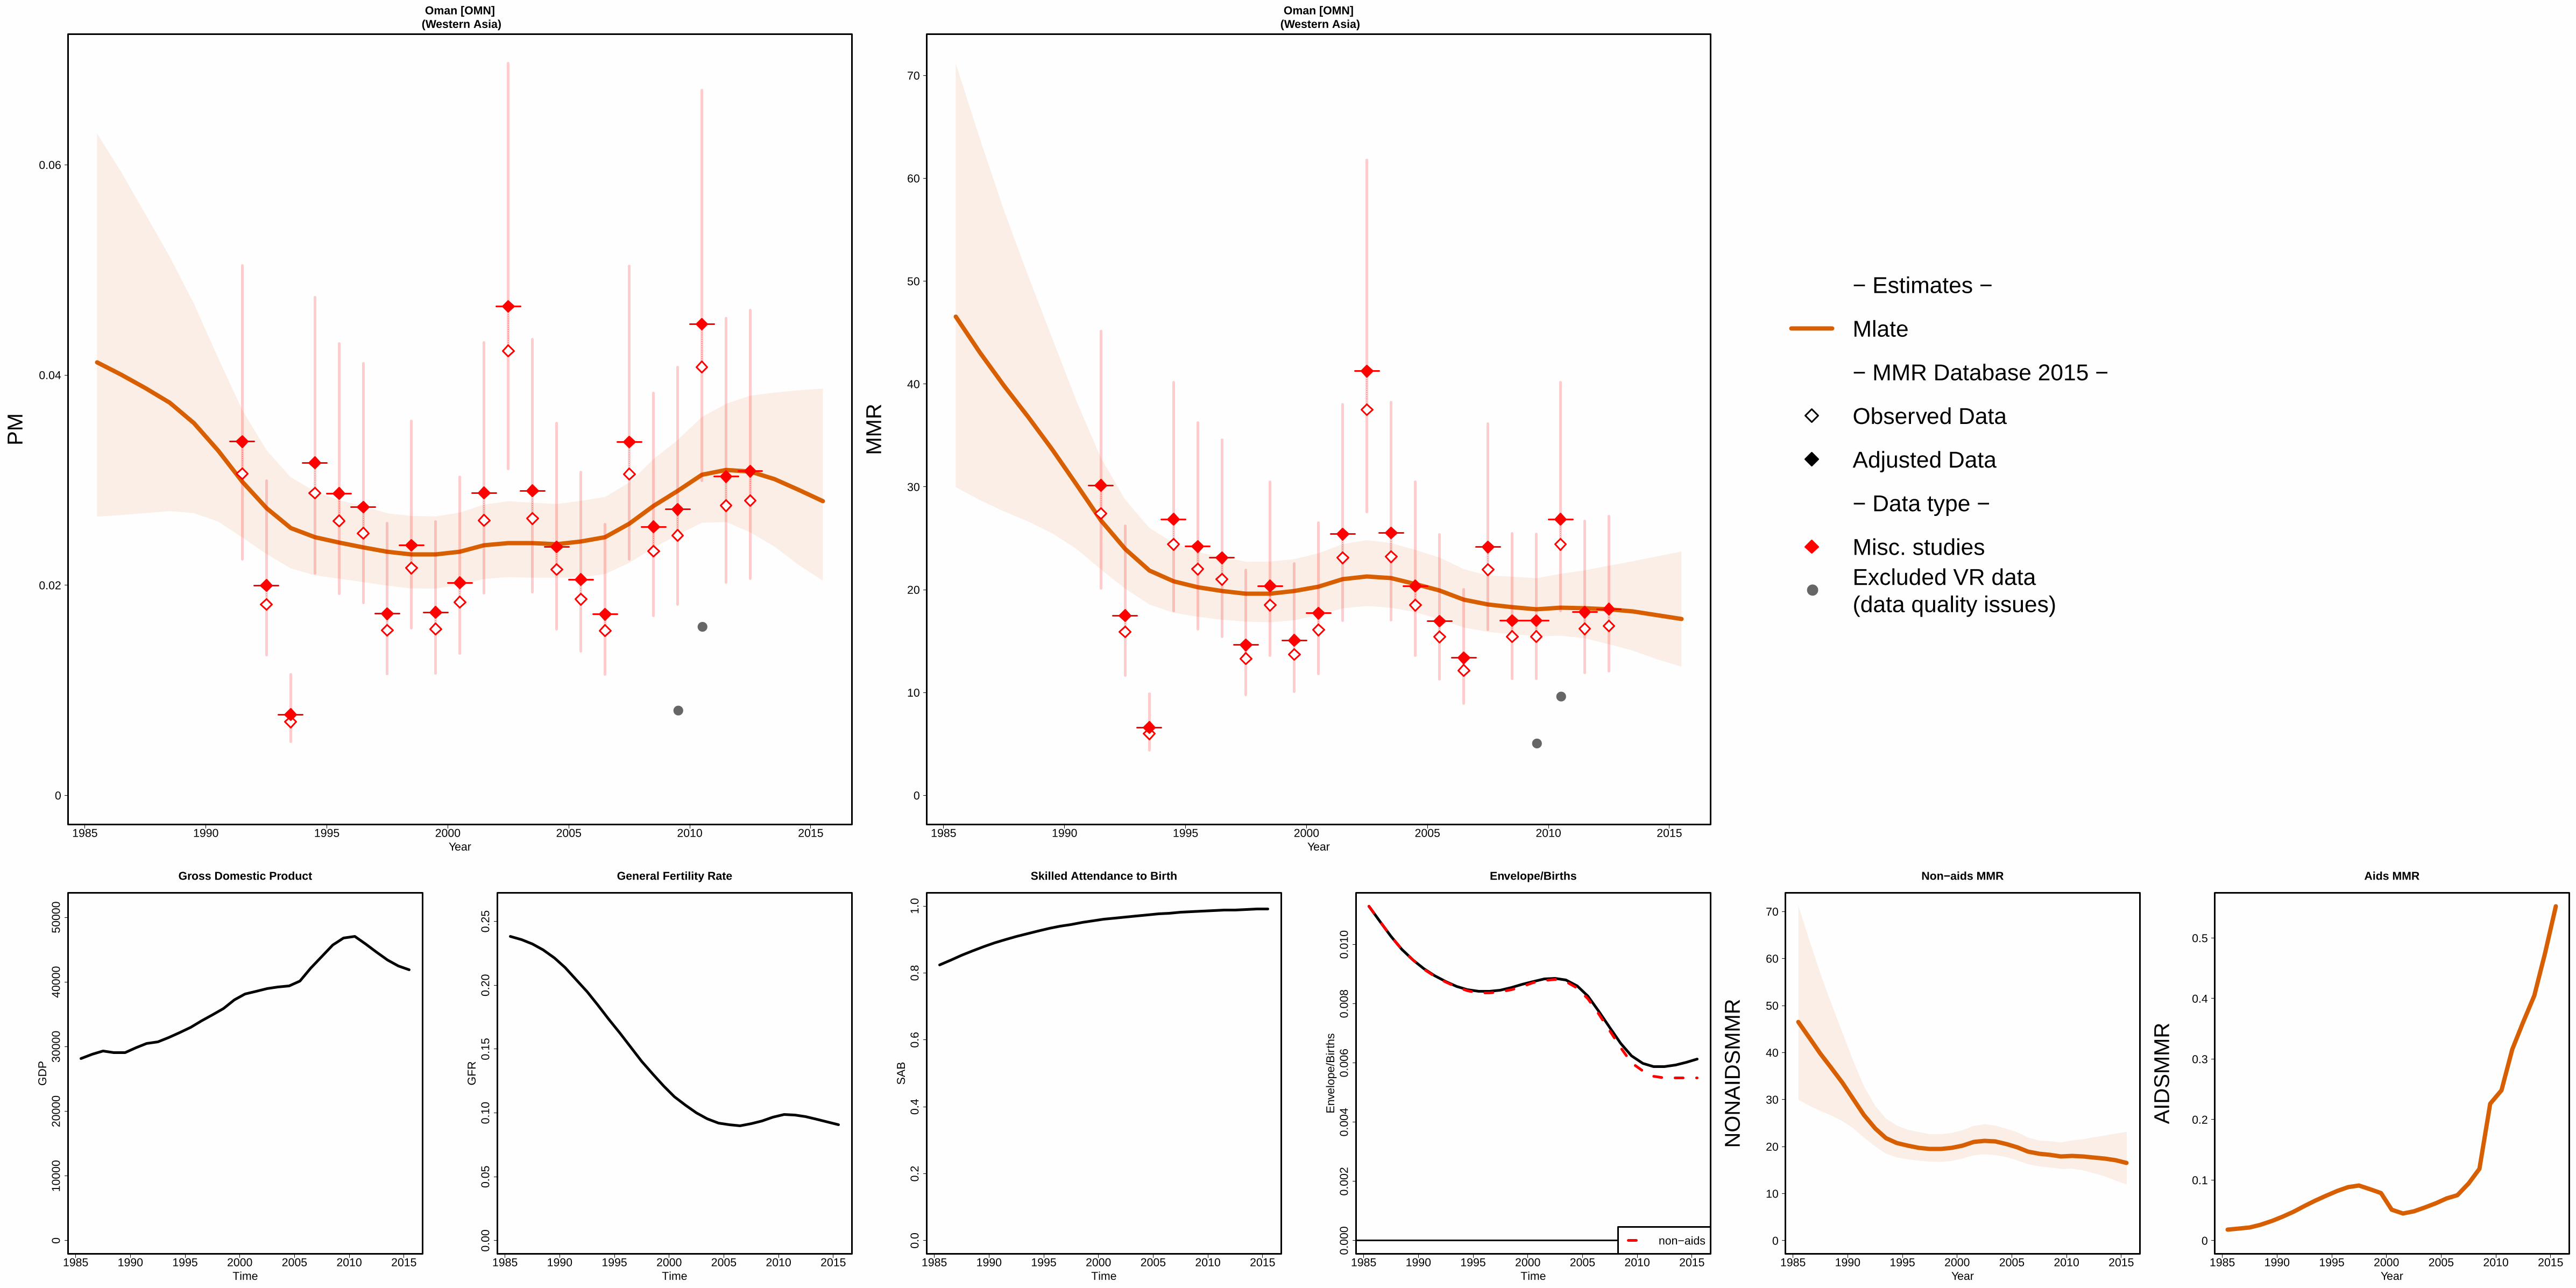
1985 1990 1995 2000 2005 2010 2015
Oman [OMN] (Western Asia)
Year
0
0.02
0.04
0.06
PM
●
●
1985 1990 1995 2000 2005 2010 2015
Oman [OMN] (Western Asia)
Year
0
10
20
30
40
50
60
70
MM
R
●
●
●
− Estimates −
Mlate
− MMR Database 2015 −
Observed Data
Adjusted Data
− Data type −
Misc. studiesExcluded VR data (data quality issues)
1985 1990 1995 2000 2005 2010 2015
010
000
2000
030
000
4000
050
000
Gross Domestic Product
Time
GD
P
1985 1990 1995 2000 2005 2010 2015
0.00
0.05
0.10
0.15
0.20
0.25
General Fertility Rate
Time
GF
R
1985 1990 1995 2000 2005 2010 2015
0.0
0.2
0.4
0.6
0.8
1.0
Skilled Attendance to Birth
Time
SA
B
1985 1990 1995 2000 2005 2010 2015
0.00
00.
002
0.00
40.
006
0.00
80.
010
Envelope/Births
Time
Env
elop
e/B
irth
s
non−aids
1985 1990 1995 2000 2005 2010 2015
Non−aids MMR
Year
0
10
20
30
40
50
60
70
NO
NA
IDS
MM
R
1985 1990 1995 2000 2005 2010 2015
Aids MMR
Year
0
0.1
0.2
0.3
0.4
0.5
AID
SM
MR

1985 1990 1995 2000 2005 2010 2015
Pakistan [PAK] (Southern Asia)
Year
0
0.1
0.2
0.3
0.4
PM
1985 1990 1995 2000 2005 2010 2015
Pakistan [PAK] (Southern Asia)
Year
0
100
200
300
400
500
600
700
800
MM
R
− Estimates −Mlate− MMR Database 2015 −Observed DataAdjusted Data− Data type −DHS
1985 1990 1995 2000 2005 2010 2015
010
0020
0030
0040
0050
00
Gross Domestic Product
Time
GD
P
1985 1990 1995 2000 2005 2010 2015
0.00
0.05
0.10
0.15
0.20
General Fertility Rate
Time
GF
R
1985 1990 1995 2000 2005 2010 2015
0.0
0.2
0.4
0.6
0.8
1.0
Skilled Attendance to Birth
Time
SA
B
1985 1990 1995 2000 2005 2010 2015
0.00
00.
005
0.01
00.
015
Envelope/Births
Time
Env
elop
e/B
irth
s
non−aids
1985 1990 1995 2000 2005 2010 2015
Non−aids MMR
Year
0
100
200
300
400
500
600
700
800
NO
NA
IDS
MM
R
1985 1990 1995 2000 2005 2010 2015
Aids MMR
Year
0
0.05
0.1
0.15
0.2
0.25
0.3
AID
SM
MR

1985 1990 1995 2000 2005 2010 2015
Panama [PAN] (Central America)
Year
0
0.05
0.1
PM
1985 1990 1995 2000 2005 2010 2015
Panama [PAN] (Central America)
Year
0
50
100
150
200
MM
R
− Estimates −Mlate− MMR Database 2015 −Observed DataAdjusted Data− Data type −VR
1985 1990 1995 2000 2005 2010 2015
050
0010
000
1500
020
000
Gross Domestic Product
Time
GD
P
1985 1990 1995 2000 2005 2010 2015
0.00
0.02
0.04
0.06
0.08
0.10
0.12
General Fertility Rate
Time
GF
R
1985 1990 1995 2000 2005 2010 2015
0.0
0.2
0.4
0.6
0.8
1.0
Skilled Attendance to Birth
Time
SA
B
1985 1990 1995 2000 2005 2010 2015
0.00
00.
005
0.01
00.
015
Envelope/Births
Time
Env
elop
e/B
irth
s
non−aids
1985 1990 1995 2000 2005 2010 2015
Non−aids MMR
Year
0
50
100
NO
NA
IDS
MM
R
1985 1990 1995 2000 2005 2010 2015
Aids MMR
Year
AID
SM
MR

1985 1990 1995 2000 2005 2010 2015
Papua New Guinea [PNG] (South−Eastern Asia / Oceania)
Year
0
0.05
0.1
0.15
0.2
0.25
0.3
PM
1985 1990 1995 2000 2005 2010 2015
Papua New Guinea [PNG] (South−Eastern Asia / Oceania)
Year
0
500
1000
MM
R − Estimates −Mlate− MMR Database 2015 −
1985 1990 1995 2000 2005 2010 2015
050
010
0015
0020
0025
00
Gross Domestic Product
Time
GD
P
1985 1990 1995 2000 2005 2010 2015
0.00
0.05
0.10
0.15
General Fertility Rate
Time
GF
R
1985 1990 1995 2000 2005 2010 2015
0.0
0.2
0.4
0.6
0.8
1.0
Skilled Attendance to Birth
Time
SA
B
1985 1990 1995 2000 2005 2010 2015
0.00
00.
005
0.01
00.
015
0.02
00.
025
0.03
00.
035
Envelope/Births
Time
Env
elop
e/B
irth
s
non−aids
1985 1990 1995 2000 2005 2010 2015
Non−aids MMR
Year
0
500
1000
NO
NA
IDS
MM
R
1985 1990 1995 2000 2005 2010 2015
Aids MMR
Year
AID
SM
MR
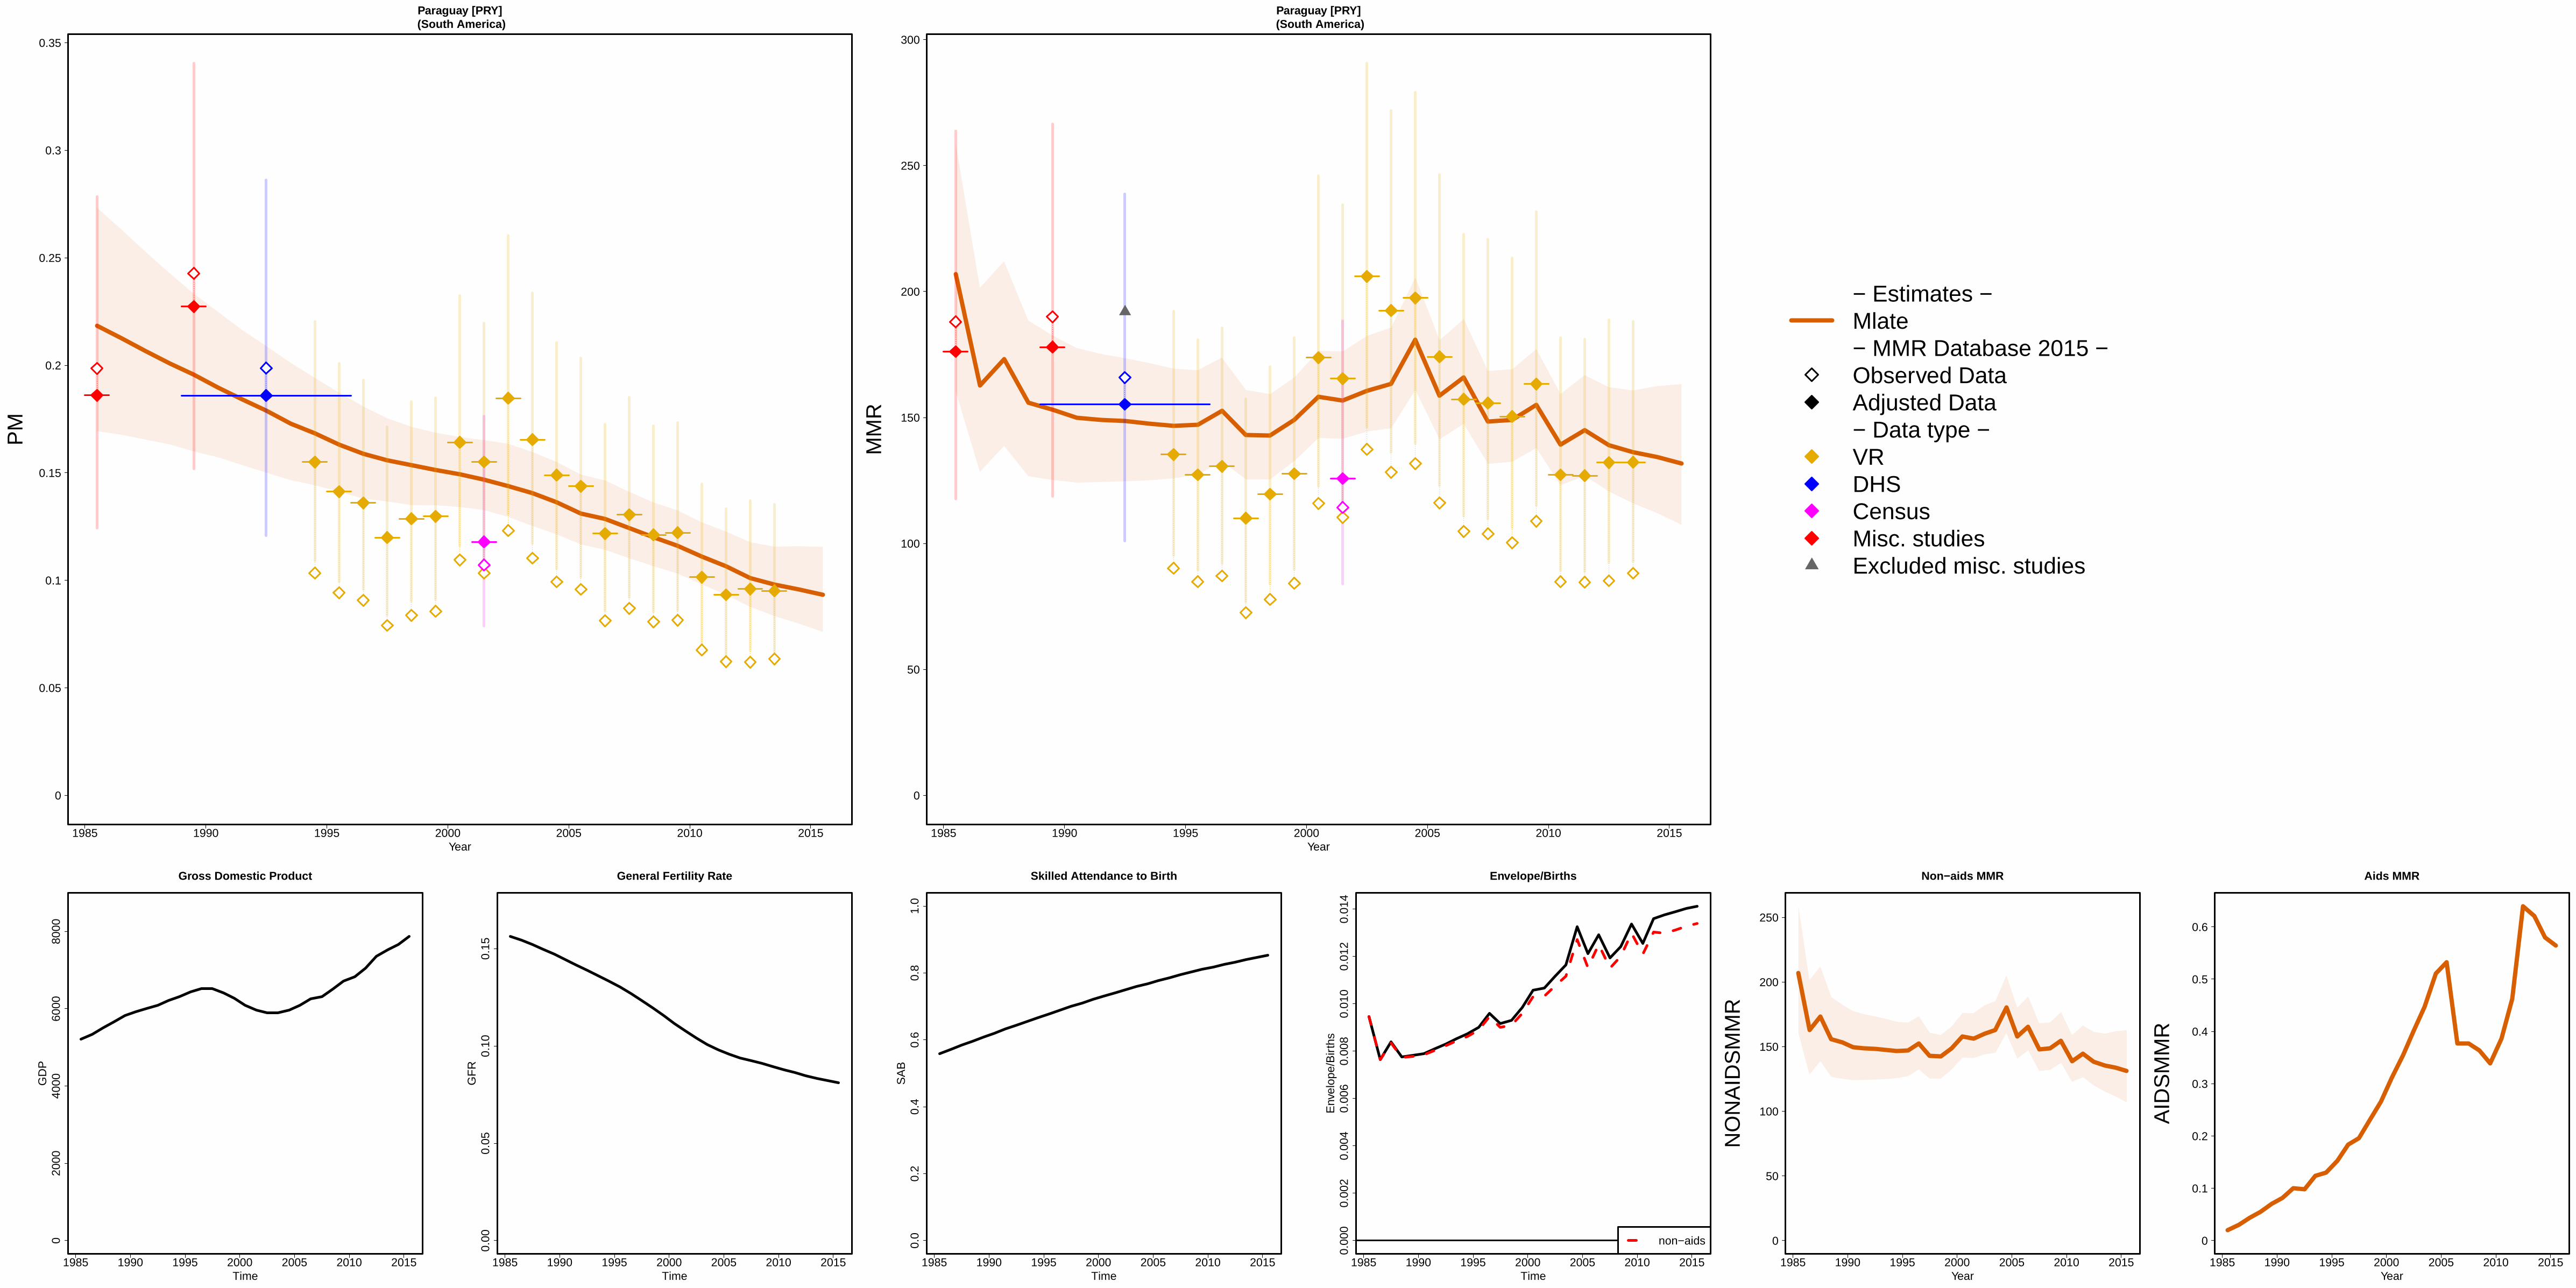
1985 1990 1995 2000 2005 2010 2015
Paraguay [PRY] (South America)
Year
0
0.05
0.1
0.15
0.2
0.25
0.3
0.35
PM
1985 1990 1995 2000 2005 2010 2015
Paraguay [PRY] (South America)
Year
0
50
100
150
200
250
300
MM
R
− Estimates −Mlate− MMR Database 2015 −Observed DataAdjusted Data− Data type −VRDHSCensusMisc. studiesExcluded misc. studies
1985 1990 1995 2000 2005 2010 2015
020
0040
0060
0080
00
Gross Domestic Product
Time
GD
P
1985 1990 1995 2000 2005 2010 2015
0.00
0.05
0.10
0.15
General Fertility Rate
Time
GF
R
1985 1990 1995 2000 2005 2010 2015
0.0
0.2
0.4
0.6
0.8
1.0
Skilled Attendance to Birth
Time
SA
B
1985 1990 1995 2000 2005 2010 2015
0.00
00.
002
0.00
40.
006
0.00
80.
010
0.01
20.
014
Envelope/Births
Time
Env
elop
e/B
irth
s
non−aids
1985 1990 1995 2000 2005 2010 2015
Non−aids MMR
Year
0
50
100
150
200
250
NO
NA
IDS
MM
R
1985 1990 1995 2000 2005 2010 2015
Aids MMR
Year
0
0.1
0.2
0.3
0.4
0.5
0.6
AID
SM
MR

1985 1990 1995 2000 2005 2010 2015
Peru [PER] (South America)
Year
0
0.05
0.1
0.15
0.2
0.25
PM
●●
●●
●● ●
●●
●
●
● ●●
1985 1990 1995 2000 2005 2010 2015
Peru [PER] (South America)
Year
0
100
200
300
400
MM
R
● ●
●
●
●● ● ●
●
●
●●
● ●
●
− Estimates −
Mlate
− MMR Database 2015 −
Observed Data
Adjusted Data
− Data type −
VR
DHS
Misc. studiesExcluded VR data (data quality issues)
1985 1990 1995 2000 2005 2010 2015
020
0040
0060
0080
0010
000
1200
0
Gross Domestic Product
Time
GD
P
1985 1990 1995 2000 2005 2010 2015
0.00
0.05
0.10
0.15
General Fertility Rate
Time
GF
R
1985 1990 1995 2000 2005 2010 2015
0.0
0.2
0.4
0.6
0.8
1.0
Skilled Attendance to Birth
Time
SA
B
1985 1990 1995 2000 2005 2010 2015
0.00
00.
005
0.01
00.
015
Envelope/Births
Time
Env
elop
e/B
irth
s
non−aids
1985 1990 1995 2000 2005 2010 2015
Non−aids MMR
Year
0
100
200
300
400
NO
NA
IDS
MM
R
1985 1990 1995 2000 2005 2010 2015
Aids MMR
Year
AID
SM
MR
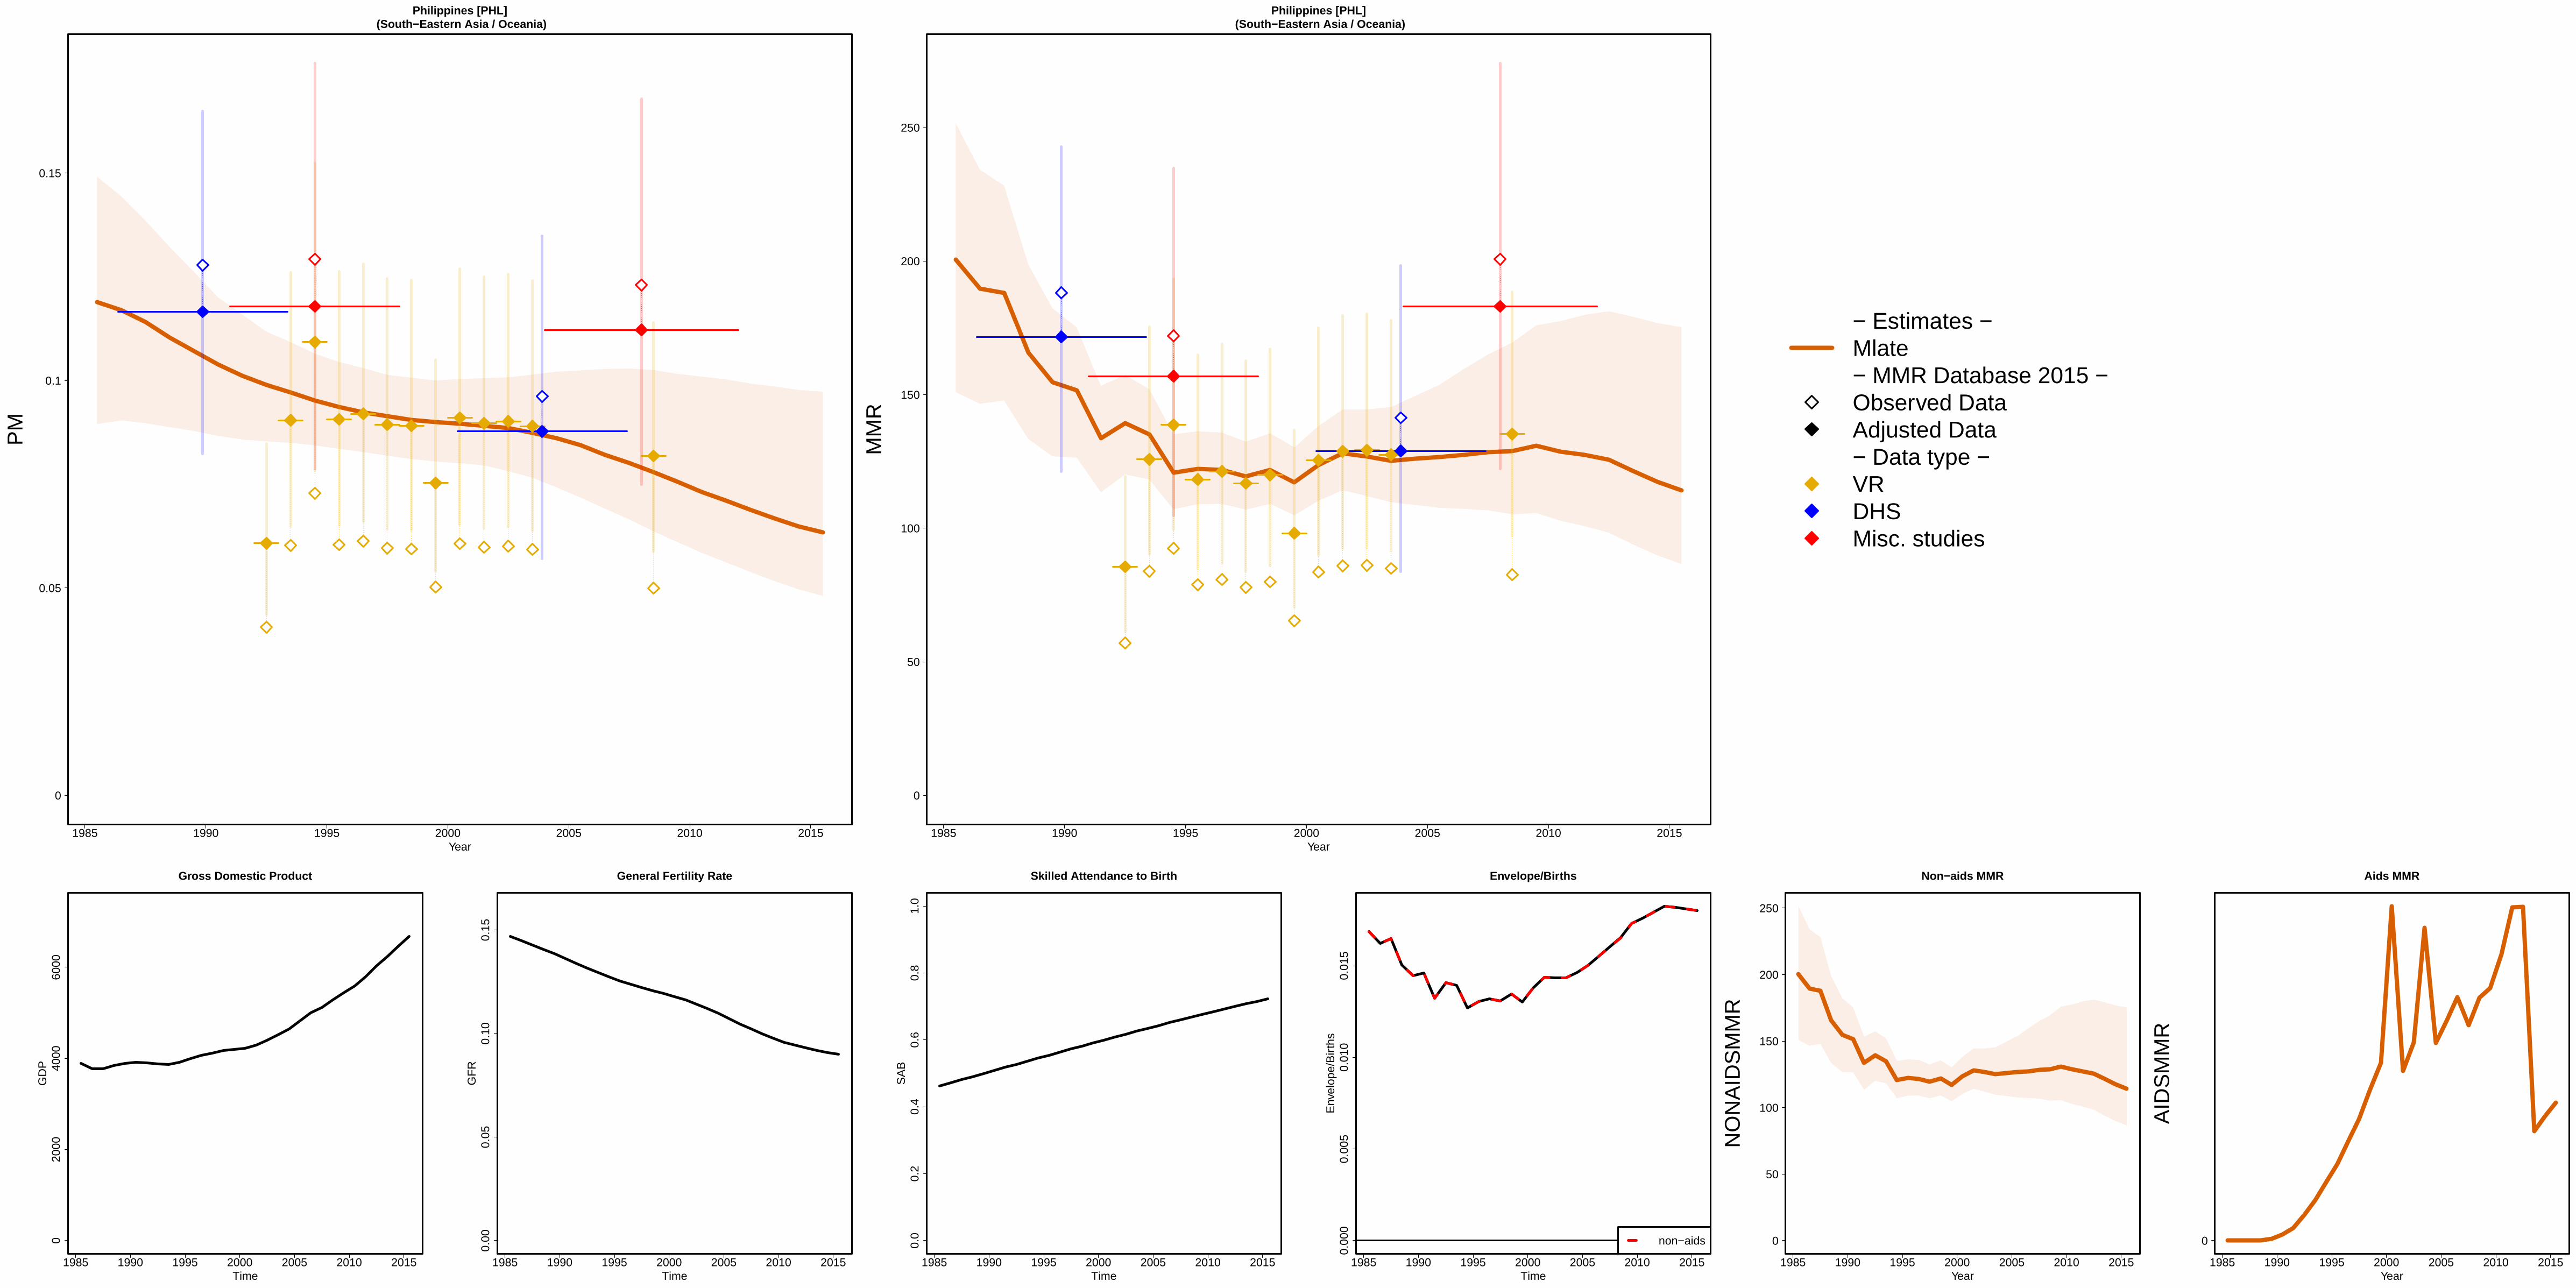
1985 1990 1995 2000 2005 2010 2015
Philippines [PHL] (South−Eastern Asia / Oceania)
Year
0
0.05
0.1
0.15
PM
1985 1990 1995 2000 2005 2010 2015
Philippines [PHL] (South−Eastern Asia / Oceania)
Year
0
50
100
150
200
250
MM
R
− Estimates −Mlate− MMR Database 2015 −Observed DataAdjusted Data− Data type −VRDHSMisc. studies
1985 1990 1995 2000 2005 2010 2015
020
0040
0060
00
Gross Domestic Product
Time
GD
P
1985 1990 1995 2000 2005 2010 2015
0.00
0.05
0.10
0.15
General Fertility Rate
Time
GF
R
1985 1990 1995 2000 2005 2010 2015
0.0
0.2
0.4
0.6
0.8
1.0
Skilled Attendance to Birth
Time
SA
B
1985 1990 1995 2000 2005 2010 2015
0.00
00.
005
0.01
00.
015
Envelope/Births
Time
Env
elop
e/B
irth
s
non−aids
1985 1990 1995 2000 2005 2010 2015
Non−aids MMR
Year
0
50
100
150
200
250
NO
NA
IDS
MM
R
1985 1990 1995 2000 2005 2010 2015
Aids MMR
Year
0
AID
SM
MR
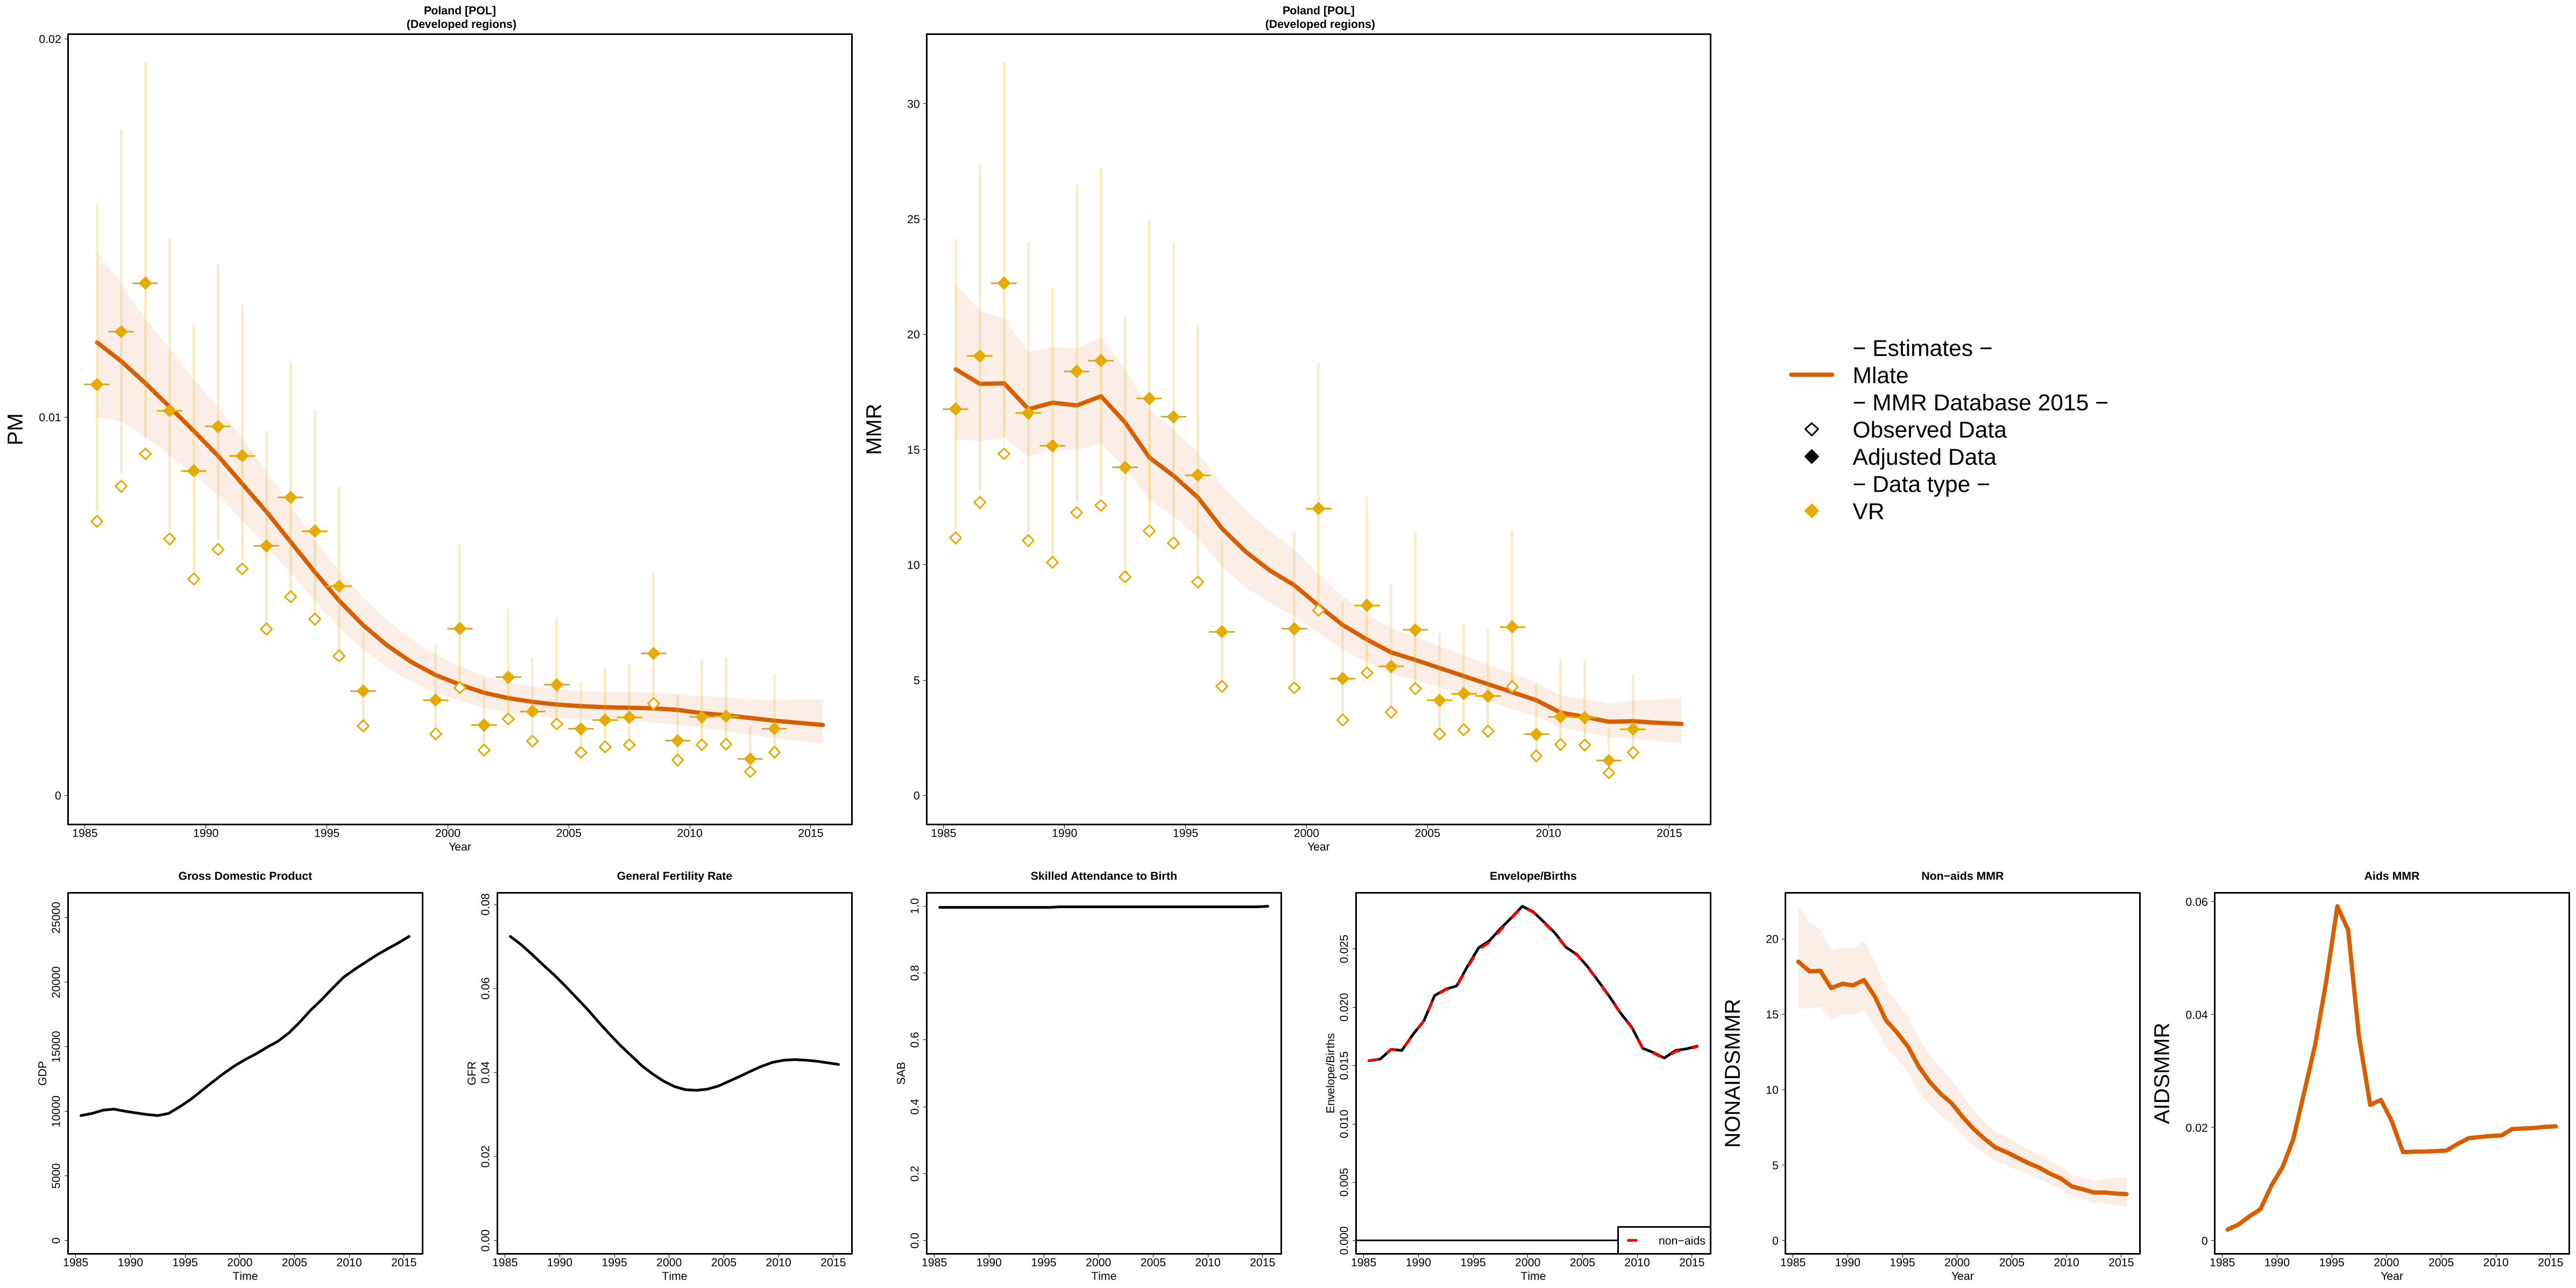
1985 1990 1995 2000 2005 2010 2015
Poland [POL] (Developed regions)
Year
0
0.01
0.02
PM
1985 1990 1995 2000 2005 2010 2015
Poland [POL] (Developed regions)
Year
0
5
10
15
20
25
30
MM
R
− Estimates −Mlate− MMR Database 2015 −Observed DataAdjusted Data− Data type −VR
1985 1990 1995 2000 2005 2010 2015
050
0010
000
1500
020
000
2500
0
Gross Domestic Product
Time
GD
P
1985 1990 1995 2000 2005 2010 2015
0.00
0.02
0.04
0.06
0.08
General Fertility Rate
Time
GF
R
1985 1990 1995 2000 2005 2010 2015
0.0
0.2
0.4
0.6
0.8
1.0
Skilled Attendance to Birth
Time
SA
B
1985 1990 1995 2000 2005 2010 2015
0.00
00.
005
0.01
00.
015
0.02
00.
025
Envelope/Births
Time
Env
elop
e/B
irth
s
non−aids
1985 1990 1995 2000 2005 2010 2015
Non−aids MMR
Year
0
5
10
15
20
NO
NA
IDS
MM
R
1985 1990 1995 2000 2005 2010 2015
Aids MMR
Year
0
0.02
0.04
0.06
AID
SM
MR

1985 1990 1995 2000 2005 2010 2015
Portugal [PRT] (Developed regions)
Year
0
0.01
PM
1985 1990 1995 2000 2005 2010 2015
Portugal [PRT] (Developed regions)
Year
0
5
10
15
20
25
30
35
40
MM
R
− Estimates −
Mlate
− MMR Database 2015 −
Observed Data
Adjusted Data
− Data type −
VR
Spec. studiesExcluded VR data (overlap with specialized study)
1985 1990 1995 2000 2005 2010 2015
050
0010
000
1500
020
000
2500
0
Gross Domestic Product
Time
GD
P
1985 1990 1995 2000 2005 2010 2015
0.00
0.01
0.02
0.03
0.04
0.05
0.06
General Fertility Rate
Time
GF
R
1985 1990 1995 2000 2005 2010 2015
0.0
0.2
0.4
0.6
0.8
1.0
Skilled Attendance to Birth
Time
SA
B
1985 1990 1995 2000 2005 2010 2015
0.00
00.
005
0.01
00.
015
0.02
0
Envelope/Births
Time
Env
elop
e/B
irth
s
non−aids
1985 1990 1995 2000 2005 2010 2015
Non−aids MMR
Year
0
5
10
15
20
25
NO
NA
IDS
MM
R
1985 1990 1995 2000 2005 2010 2015
Aids MMR
Year
0
0.1
0.2
0.3
0.4
0.5
AID
SM
MR

1985 1990 1995 2000 2005 2010 2015
Puerto Rico [PRI] (Caribbean)
Year
0
0.01
0.02
0.03
PM
1985 1990 1995 2000 2005 2010 2015
Puerto Rico [PRI] (Caribbean)
Year
0
10
20
30
40
50
60
MM
R
− Estimates −Mlate− MMR Database 2015 −Observed DataAdjusted Data− Data type −VR
1985 1990 1995 2000 2005 2010 2015
010
000
2000
030
000
4000
0
Gross Domestic Product
Time
GD
P
1985 1990 1995 2000 2005 2010 2015
0.00
0.02
0.04
0.06
0.08
General Fertility Rate
Time
GF
R
1985 1990 1995 2000 2005 2010 2015
0.0
0.2
0.4
0.6
0.8
1.0
Skilled Attendance to Birth
Time
SA
B
1985 1990 1995 2000 2005 2010 2015
0.00
00.
005
0.01
00.
015
Envelope/Births
Time
Env
elop
e/B
irth
s
non−aids
1985 1990 1995 2000 2005 2010 2015
Non−aids MMR
Year
0
5
10
15
20
25
30
35
NO
NA
IDS
MM
R
1985 1990 1995 2000 2005 2010 2015
Aids MMR
Year
00.010.02
AID
SM
MR
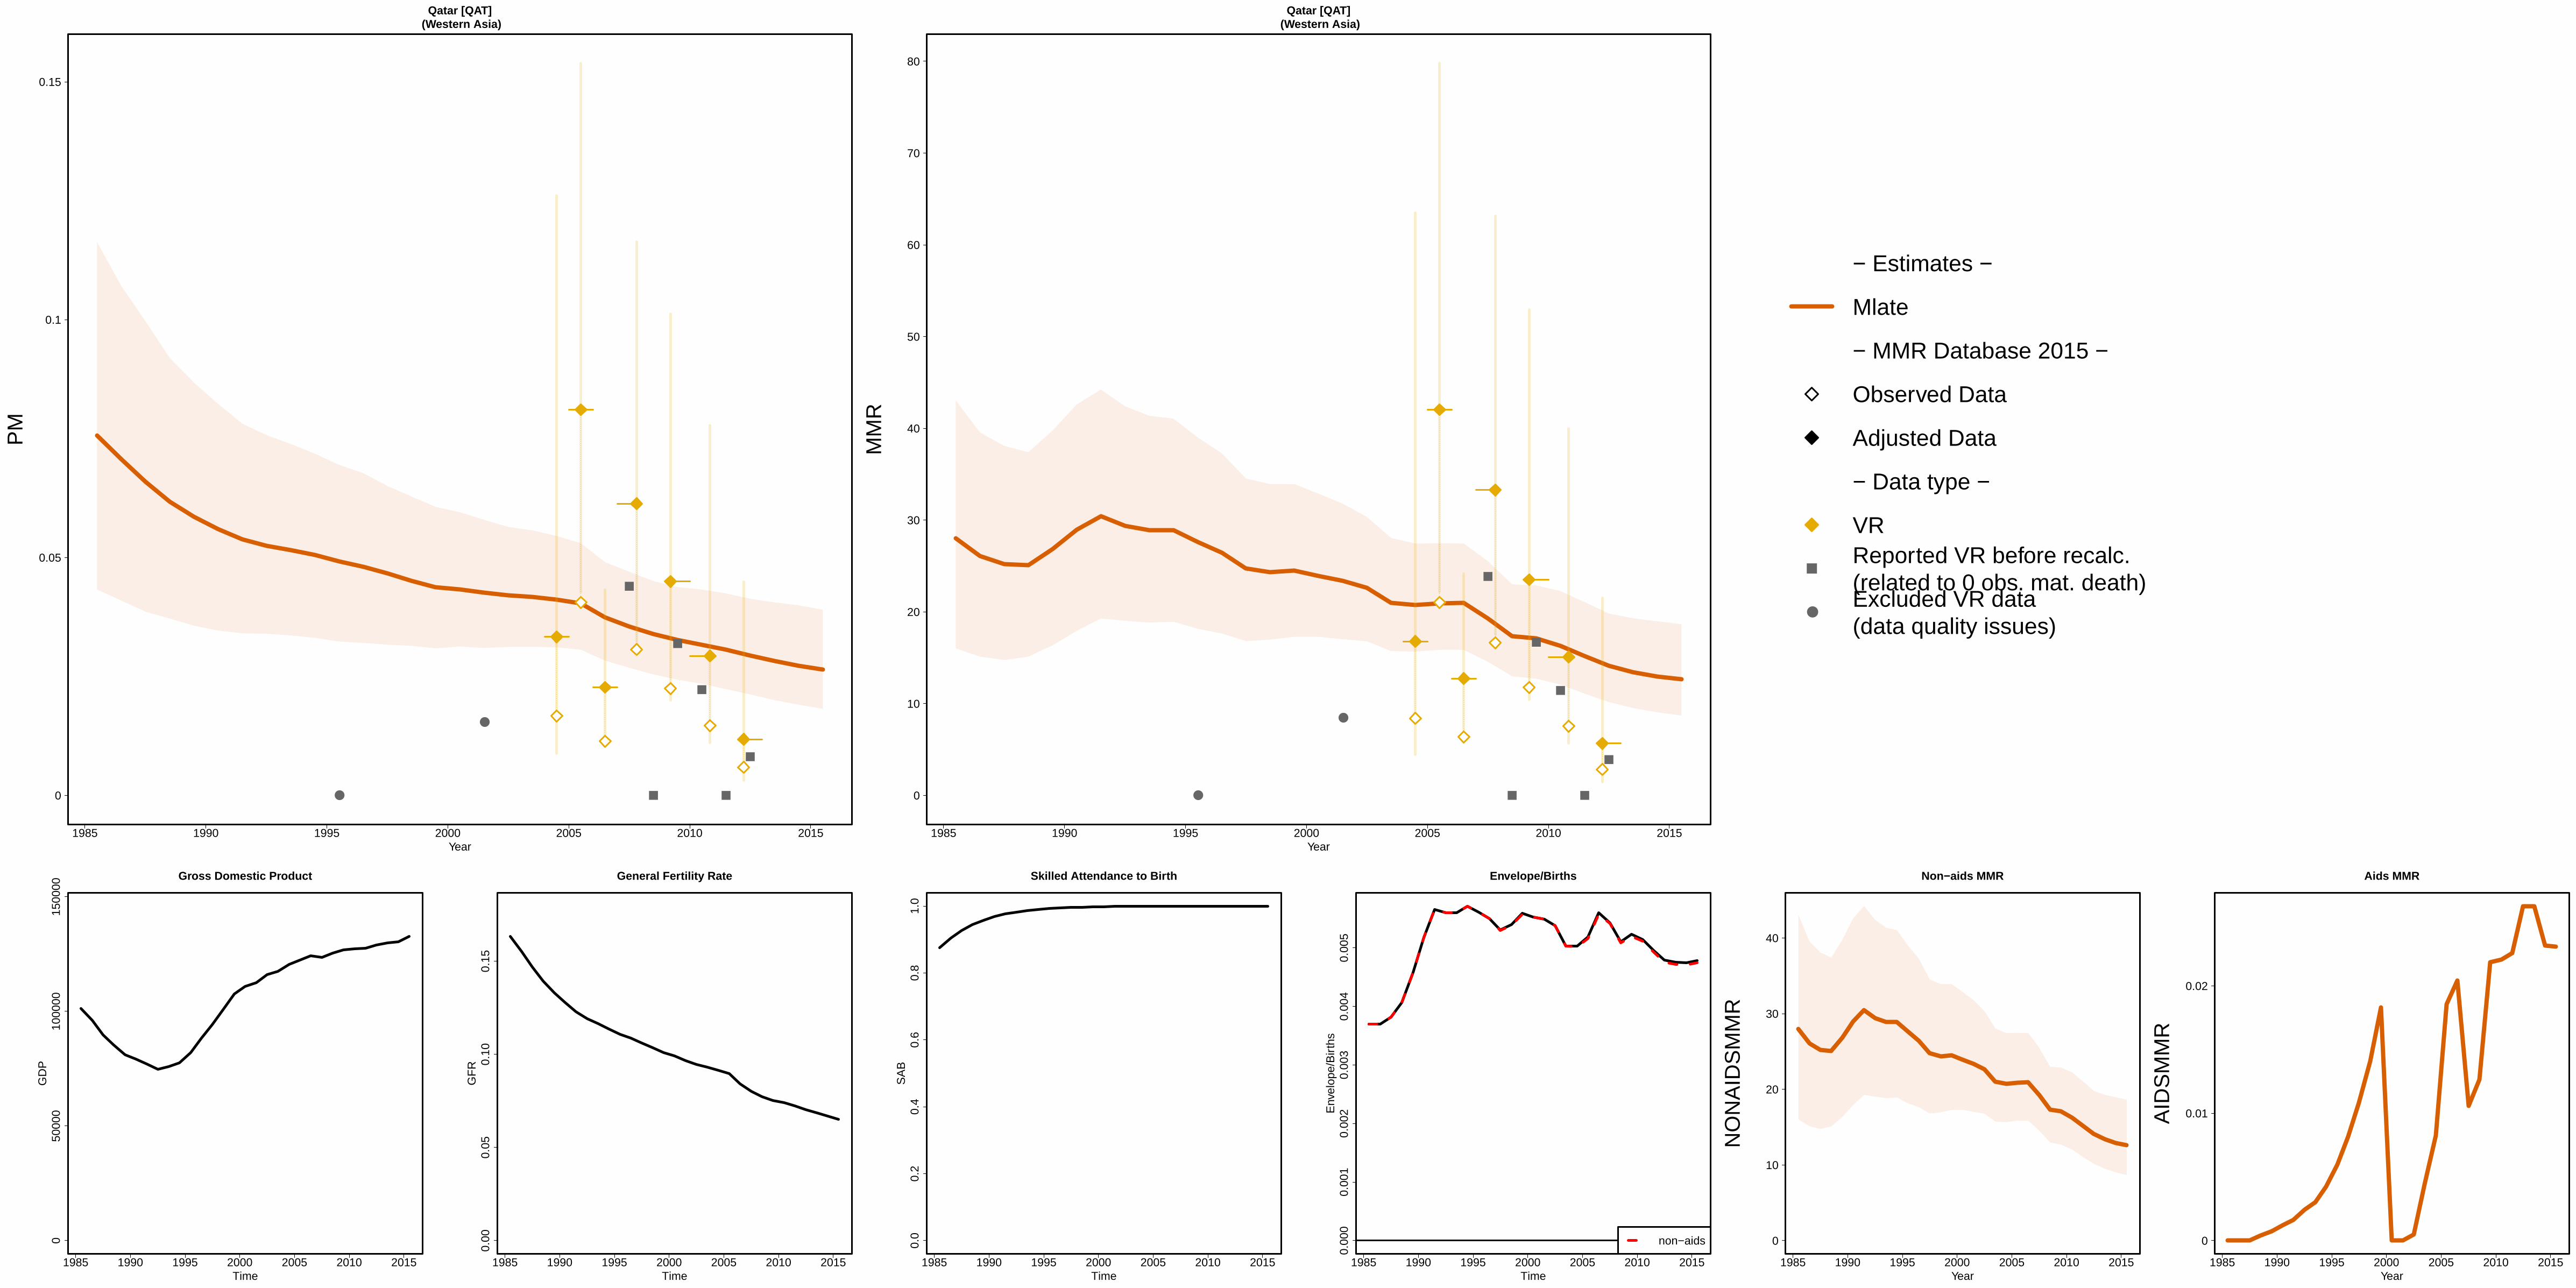
1985 1990 1995 2000 2005 2010 2015
Qatar [QAT] (Western Asia)
Year
0
0.05
0.1
0.15
PM
●
●
1985 1990 1995 2000 2005 2010 2015
Qatar [QAT] (Western Asia)
Year
0
10
20
30
40
50
60
70
80
MM
R
●
●
●
− Estimates −
Mlate
− MMR Database 2015 −
Observed Data
Adjusted Data
− Data type −
VRReported VR before recalc.(related to 0 obs. mat. death)Excluded VR data (data quality issues)
1985 1990 1995 2000 2005 2010 2015
050
000
1000
0015
0000
Gross Domestic Product
Time
GD
P
1985 1990 1995 2000 2005 2010 2015
0.00
0.05
0.10
0.15
General Fertility Rate
Time
GF
R
1985 1990 1995 2000 2005 2010 2015
0.0
0.2
0.4
0.6
0.8
1.0
Skilled Attendance to Birth
Time
SA
B
1985 1990 1995 2000 2005 2010 2015
0.00
00.
001
0.00
20.
003
0.00
40.
005
Envelope/Births
Time
Env
elop
e/B
irth
s
non−aids
1985 1990 1995 2000 2005 2010 2015
Non−aids MMR
Year
0
10
20
30
40
NO
NA
IDS
MM
R
1985 1990 1995 2000 2005 2010 2015
Aids MMR
Year
0
0.01
0.02
AID
SM
MR

1985 1990 1995 2000 2005 2010 2015
Republic of Korea [KOR] (Eastern Asia)
Year
0
0.01
PM
1985 1990 1995 2000 2005 2010 2015
Republic of Korea [KOR] (Eastern Asia)
Year
0
5
10
15
20
25
30
35
MM
R
− Estimates −
Mlate
− MMR Database 2015 −
Observed Data
Adjusted Data
− Data type −
VR
Spec. studiesExcluded VR data (overlap with specialized study)
1985 1990 1995 2000 2005 2010 2015
010
000
2000
030
000
Gross Domestic Product
Time
GD
P
1985 1990 1995 2000 2005 2010 2015
0.00
0.01
0.02
0.03
0.04
0.05
0.06
0.07
General Fertility Rate
Time
GF
R
1985 1990 1995 2000 2005 2010 2015
0.0
0.2
0.4
0.6
0.8
1.0
Skilled Attendance to Birth
Time
SA
B
1985 1990 1995 2000 2005 2010 2015
0.00
00.
005
0.01
00.
015
0.02
00.
025
Envelope/Births
Time
Env
elop
e/B
irth
s
non−aids
1985 1990 1995 2000 2005 2010 2015
Non−aids MMR
Year
0
5
10
15
20
25
30
NO
NA
IDS
MM
R
1985 1990 1995 2000 2005 2010 2015
Aids MMR
Year
0
AID
SM
MR
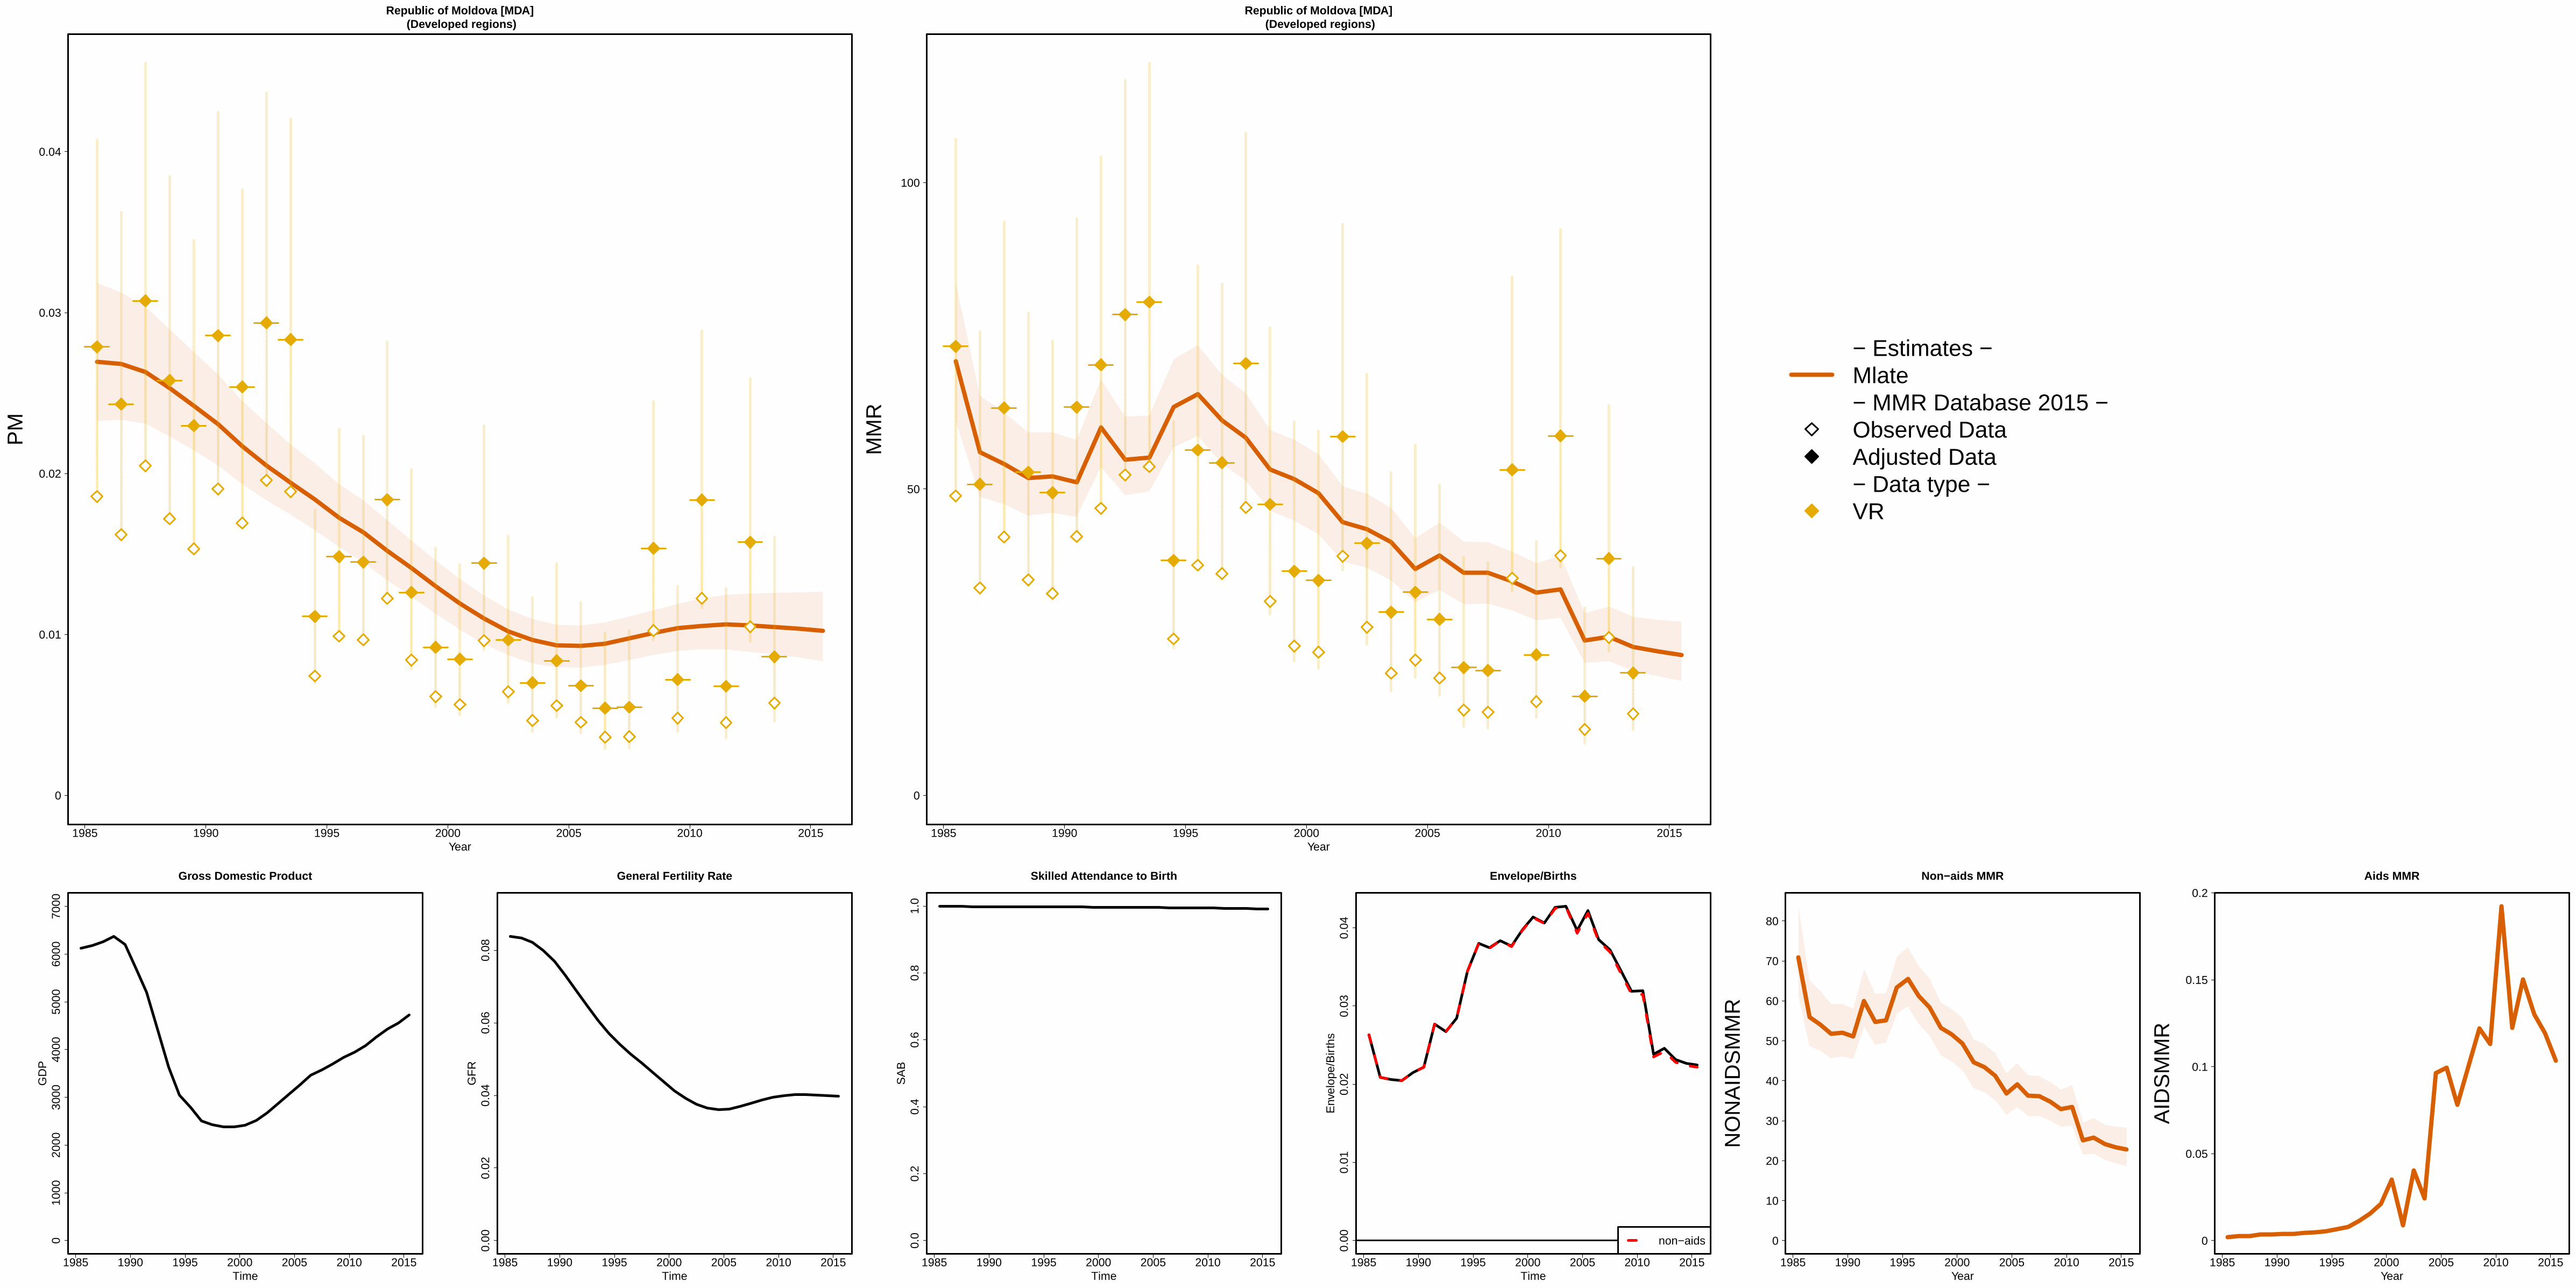
1985 1990 1995 2000 2005 2010 2015
Republic of Moldova [MDA] (Developed regions)
Year
0
0.01
0.02
0.03
0.04
PM
1985 1990 1995 2000 2005 2010 2015
Republic of Moldova [MDA] (Developed regions)
Year
0
50
100
MM
R
− Estimates −Mlate− MMR Database 2015 −Observed DataAdjusted Data− Data type −VR
1985 1990 1995 2000 2005 2010 2015
010
0020
0030
0040
0050
0060
0070
00
Gross Domestic Product
Time
GD
P
1985 1990 1995 2000 2005 2010 2015
0.00
0.02
0.04
0.06
0.08
General Fertility Rate
Time
GF
R
1985 1990 1995 2000 2005 2010 2015
0.0
0.2
0.4
0.6
0.8
1.0
Skilled Attendance to Birth
Time
SA
B
1985 1990 1995 2000 2005 2010 2015
0.00
0.01
0.02
0.03
0.04
Envelope/Births
Time
Env
elop
e/B
irth
s
non−aids
1985 1990 1995 2000 2005 2010 2015
Non−aids MMR
Year
0
10
20
30
40
50
60
70
80
NO
NA
IDS
MM
R
1985 1990 1995 2000 2005 2010 2015
Aids MMR
Year
0
0.05
0.1
0.15
0.2
AID
SM
MR

1985 1990 1995 2000 2005 2010 2015
Romania [ROU] (Developed regions)
Year
0
0.05
0.1
0.15
PM
1985 1990 1995 2000 2005 2010 2015
Romania [ROU] (Developed regions)
Year
0
50
100
150
200
250
300
350
MM
R
− Estimates −Mlate− MMR Database 2015 −Observed DataAdjusted Data− Data type −VR
1985 1990 1995 2000 2005 2010 2015
050
0010
000
1500
020
000
Gross Domestic Product
Time
GD
P
1985 1990 1995 2000 2005 2010 2015
0.00
0.02
0.04
0.06
General Fertility Rate
Time
GF
R
1985 1990 1995 2000 2005 2010 2015
0.0
0.2
0.4
0.6
0.8
1.0
Skilled Attendance to Birth
Time
SA
B
1985 1990 1995 2000 2005 2010 2015
0.00
0.01
0.02
0.03
0.04
Envelope/Births
Time
Env
elop
e/B
irth
s
non−aids
1985 1990 1995 2000 2005 2010 2015
Non−aids MMR
Year
0
50
100
150
200
250
NO
NA
IDS
MM
R
1985 1990 1995 2000 2005 2010 2015
Aids MMR
Year
0
0.05
0.1
0.15
AID
SM
MR
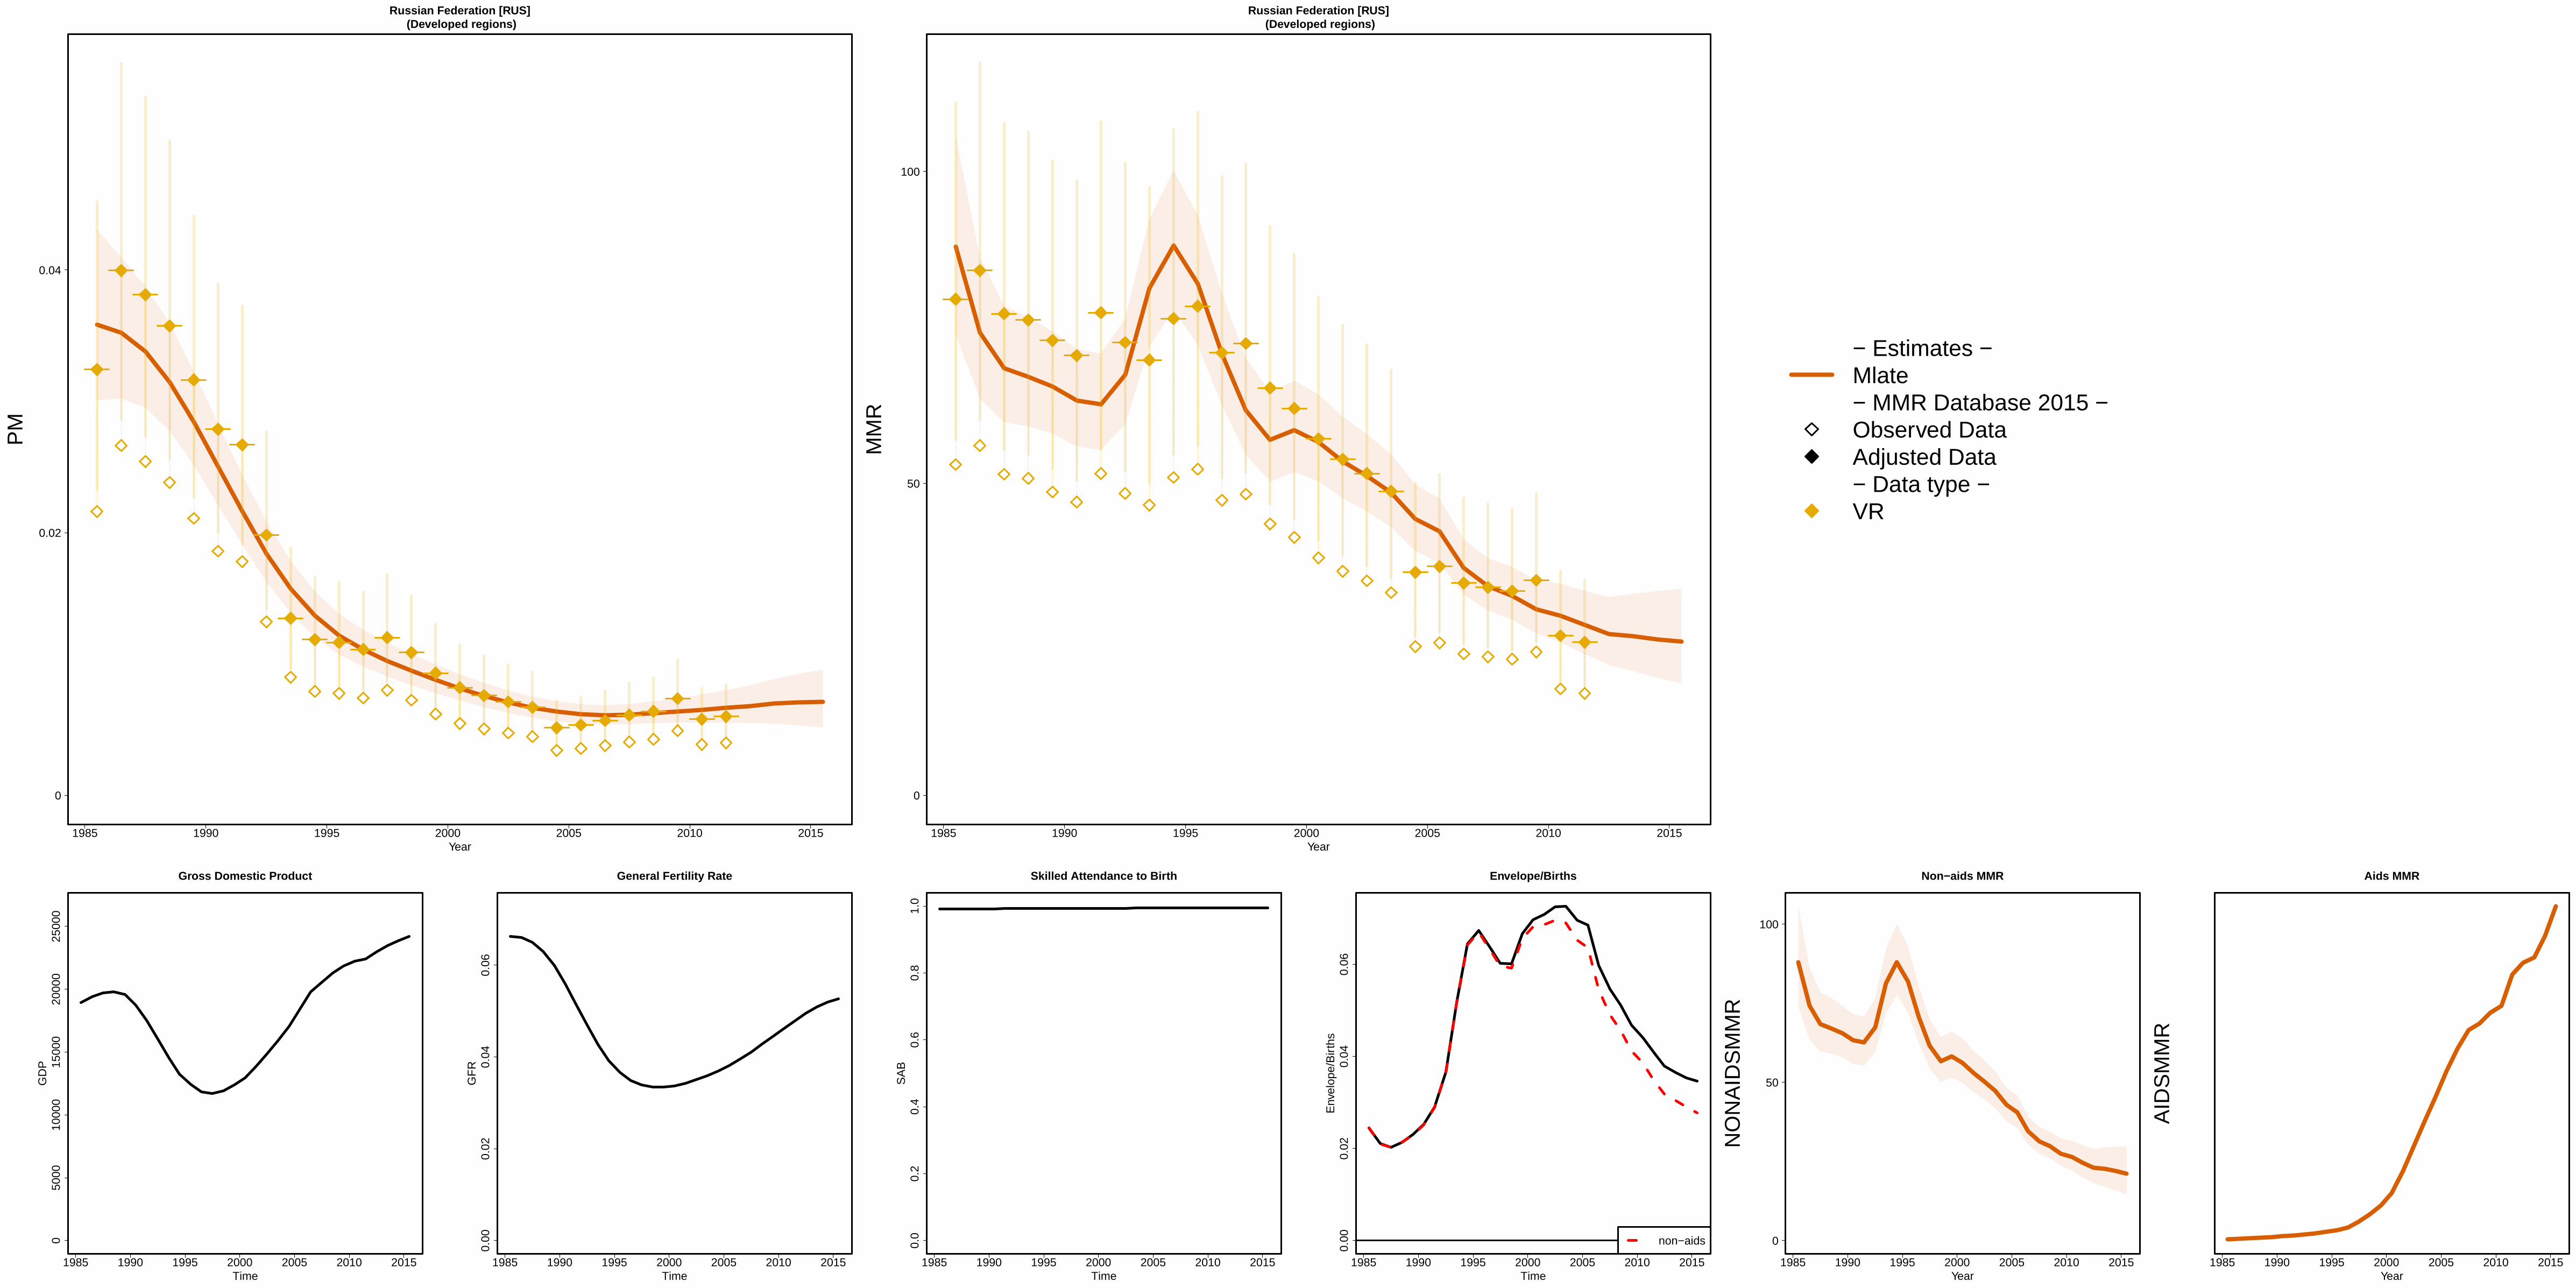
1985 1990 1995 2000 2005 2010 2015
Russian Federation [RUS] (Developed regions)
Year
0
0.02
0.04
PM
1985 1990 1995 2000 2005 2010 2015
Russian Federation [RUS] (Developed regions)
Year
0
50
100
MM
R
− Estimates −Mlate− MMR Database 2015 −Observed DataAdjusted Data− Data type −VR
1985 1990 1995 2000 2005 2010 2015
050
0010
000
1500
020
000
2500
0
Gross Domestic Product
Time
GD
P
1985 1990 1995 2000 2005 2010 2015
0.00
0.02
0.04
0.06
General Fertility Rate
Time
GF
R
1985 1990 1995 2000 2005 2010 2015
0.0
0.2
0.4
0.6
0.8
1.0
Skilled Attendance to Birth
Time
SA
B
1985 1990 1995 2000 2005 2010 2015
0.00
0.02
0.04
0.06
Envelope/Births
Time
Env
elop
e/B
irth
s
non−aids
1985 1990 1995 2000 2005 2010 2015
Non−aids MMR
Year
0
50
100
NO
NA
IDS
MM
R
1985 1990 1995 2000 2005 2010 2015
Aids MMR
Year
AID
SM
MR

1985 1990 1995 2000 2005 2010 2015
Rwanda [RWA] (Eastern Africa)
Year
0
0.1
0.2
0.3
0.4
0.5
0.6
0.7
PM
1985 1990 1995 2000 2005 2010 2015
Rwanda [RWA] (Eastern Africa)
Year
0
500
1000
1500
2000
MM
R
− Estimates −Mlate− MMR Database 2015 −Observed DataAdjusted Data− Data type −DHSMisc. studiesExcluded misc. studies
1985 1990 1995 2000 2005 2010 2015
050
010
0015
00
Gross Domestic Product
Time
GD
P
1985 1990 1995 2000 2005 2010 2015
0.00
0.05
0.10
0.15
0.20
0.25
General Fertility Rate
Time
GF
R
1985 1990 1995 2000 2005 2010 2015
0.0
0.2
0.4
0.6
0.8
1.0
Skilled Attendance to Birth
Time
SA
B
1985 1990 1995 2000 2005 2010 2015
0.00
0.01
0.02
0.03
0.04
0.05
0.06
Envelope/Births
Time
Env
elop
e/B
irth
s
non−aids
1985 1990 1995 2000 2005 2010 2015
Non−aids MMR
Year
0
500
1000
1500
2000
NO
NA
IDS
MM
R
1985 1990 1995 2000 2005 2010 2015
Aids MMR
Year
0
10
20
30
40
AID
SM
MR

1985 1990 1995 2000 2005 2010 2015
Saint Lucia [LCA] (Caribbean)
Year
0
0.05
0.1
0.15
0.2
PM
1985 1990 1995 2000 2005 2010 2015
Saint Lucia [LCA] (Caribbean)
Year
0
100
200
300
400
MM
R
− Estimates −
Mlate
− MMR Database 2015 −
Observed Data
Adjusted Data
− Data type −
VRReported VR before recalc.(related to 0 obs. mat. death)
1985 1990 1995 2000 2005 2010 2015
020
0040
0060
0080
0010
000
1200
0
Gross Domestic Product
Time
GD
P
1985 1990 1995 2000 2005 2010 2015
0.00
0.05
0.10
0.15
General Fertility Rate
Time
GF
R
1985 1990 1995 2000 2005 2010 2015
0.0
0.2
0.4
0.6
0.8
1.0
Skilled Attendance to Birth
Time
SA
B
1985 1990 1995 2000 2005 2010 2015
0.00
00.
005
0.01
00.
015
Envelope/Births
Time
Env
elop
e/B
irth
s
non−aids
1985 1990 1995 2000 2005 2010 2015
Non−aids MMR
Year
0
10
20
30
40
50
60
70
80
NO
NA
IDS
MM
R
1985 1990 1995 2000 2005 2010 2015
Aids MMR
Year
0
0.1
0.2
0.3
0.4
0.5
0.6
0.7
0.8
AID
SM
MR
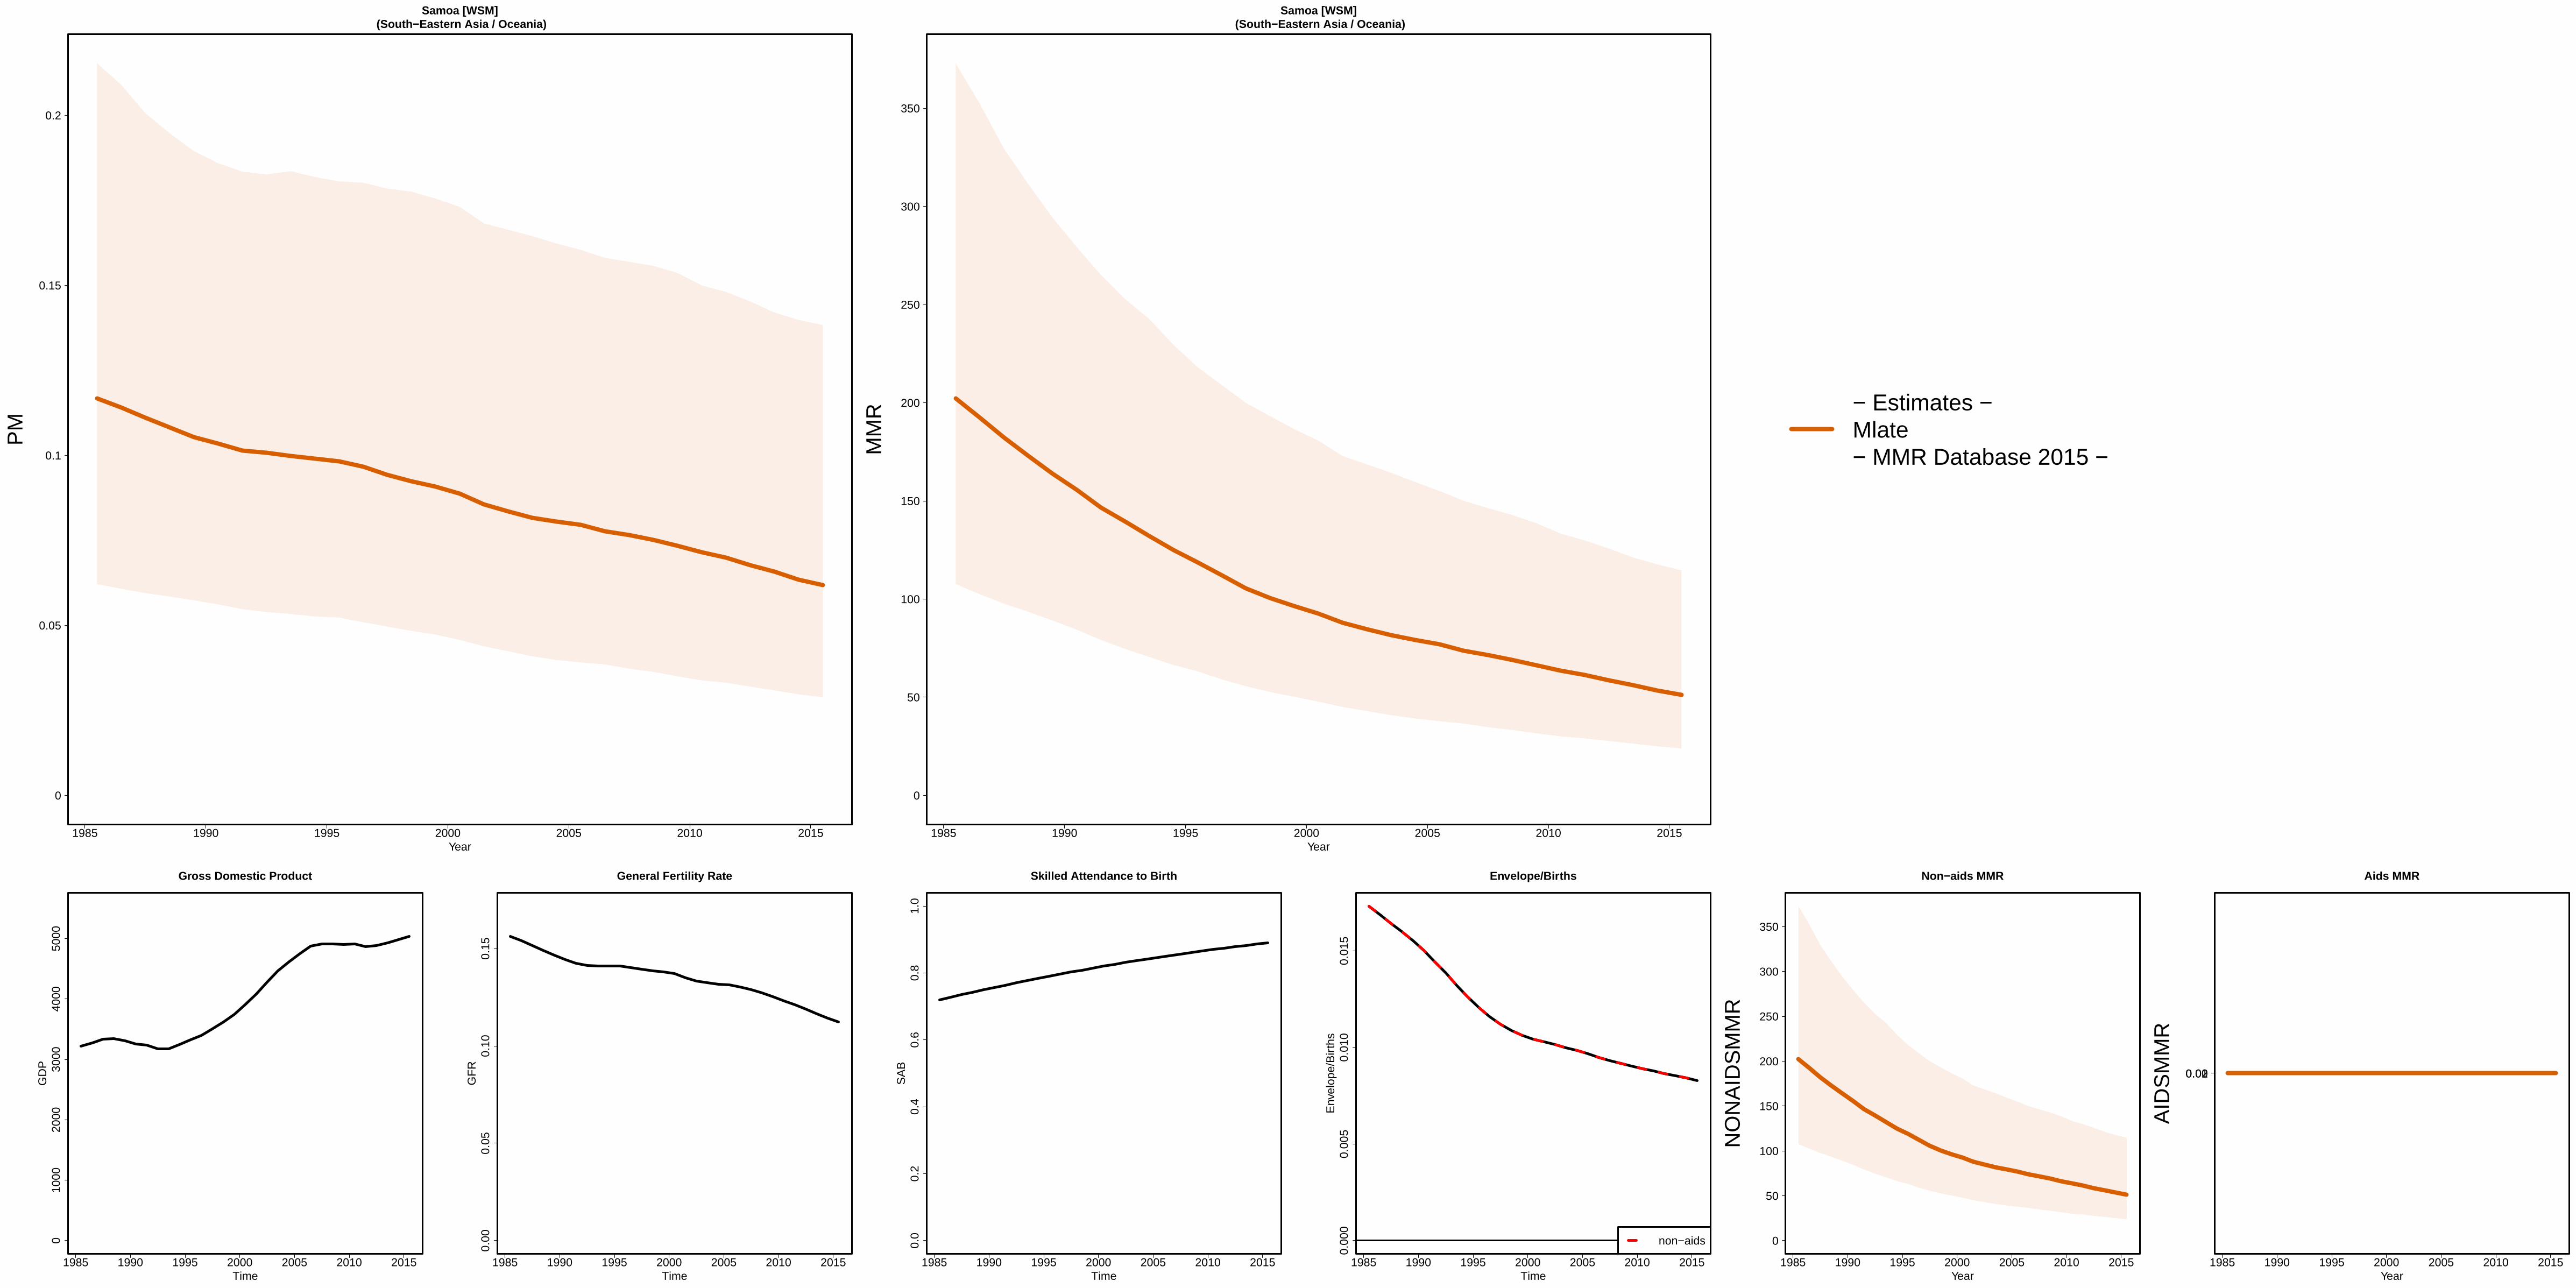
1985 1990 1995 2000 2005 2010 2015
Samoa [WSM] (South−Eastern Asia / Oceania)
Year
0
0.05
0.1
0.15
0.2
PM
1985 1990 1995 2000 2005 2010 2015
Samoa [WSM] (South−Eastern Asia / Oceania)
Year
0
50
100
150
200
250
300
350
MM
R − Estimates −Mlate− MMR Database 2015 −
1985 1990 1995 2000 2005 2010 2015
010
0020
0030
0040
0050
00
Gross Domestic Product
Time
GD
P
1985 1990 1995 2000 2005 2010 2015
0.00
0.05
0.10
0.15
General Fertility Rate
Time
GF
R
1985 1990 1995 2000 2005 2010 2015
0.0
0.2
0.4
0.6
0.8
1.0
Skilled Attendance to Birth
Time
SA
B
1985 1990 1995 2000 2005 2010 2015
0.00
00.
005
0.01
00.
015
Envelope/Births
Time
Env
elop
e/B
irth
s
non−aids
1985 1990 1995 2000 2005 2010 2015
Non−aids MMR
Year
0
50
100
150
200
250
300
350
NO
NA
IDS
MM
R
1985 1990 1995 2000 2005 2010 2015
Aids MMR
Year
00.010.02
AID
SM
MR

1985 1990 1995 2000 2005 2010 2015
Sao Tome and Principe [STP] (Middle Africa)
Year
0
0.05
0.1
0.15
0.2
0.25
0.3
0.35
PM
●
●
1985 1990 1995 2000 2005 2010 2015
Sao Tome and Principe [STP] (Middle Africa)
Year
0
100
200
300
400
500
600
MM
R
●
●
●
− Estimates −
Mlate
− MMR Database 2015 −
Observed Data
Adjusted Data
− Data type −
DHSExcluded VR data (data quality issues)
1985 1990 1995 2000 2005 2010 2015
050
010
0015
0020
0025
0030
00
Gross Domestic Product
Time
GD
P
1985 1990 1995 2000 2005 2010 2015
0.00
0.05
0.10
0.15
0.20
General Fertility Rate
Time
GF
R
1985 1990 1995 2000 2005 2010 2015
0.0
0.2
0.4
0.6
0.8
1.0
Skilled Attendance to Birth
Time
SA
B
1985 1990 1995 2000 2005 2010 2015
0.00
00.
005
0.01
00.
015
0.02
0
Envelope/Births
Time
Env
elop
e/B
irth
s
non−aids
1985 1990 1995 2000 2005 2010 2015
Non−aids MMR
Year
0
100
200
300
400
500
600
NO
NA
IDS
MM
R
1985 1990 1995 2000 2005 2010 2015
Aids MMR
Year
AID
SM
MR

1985 1990 1995 2000 2005 2010 2015
Saudi Arabia [SAU] (Western Asia)
Year
0
0.05
0.1
PM
● ●
1985 1990 1995 2000 2005 2010 2015
Saudi Arabia [SAU] (Western Asia)
Year
0
10
20
30
40
50
60
70
80
90
100
MM
R
● ●
●
− Estimates −
Mlate
− MMR Database 2015 −
Observed Data
Adjusted Data
− Data type −
Misc. studiesExcluded VR data (data quality issues)
1985 1990 1995 2000 2005 2010 2015
010
000
2000
030
000
4000
050
000
6000
0
Gross Domestic Product
Time
GD
P
1985 1990 1995 2000 2005 2010 2015
0.00
0.05
0.10
0.15
0.20
General Fertility Rate
Time
GF
R
1985 1990 1995 2000 2005 2010 2015
0.0
0.2
0.4
0.6
0.8
1.0
Skilled Attendance to Birth
Time
SA
B
1985 1990 1995 2000 2005 2010 2015
0.00
00.
002
0.00
40.
006
0.00
8
Envelope/Births
Time
Env
elop
e/B
irth
s
non−aids
1985 1990 1995 2000 2005 2010 2015
Non−aids MMR
Year
0
10
20
30
40
50
60
70
80
90
100
NO
NA
IDS
MM
R
1985 1990 1995 2000 2005 2010 2015
Aids MMR
Year
00.010.02
AID
SM
MR
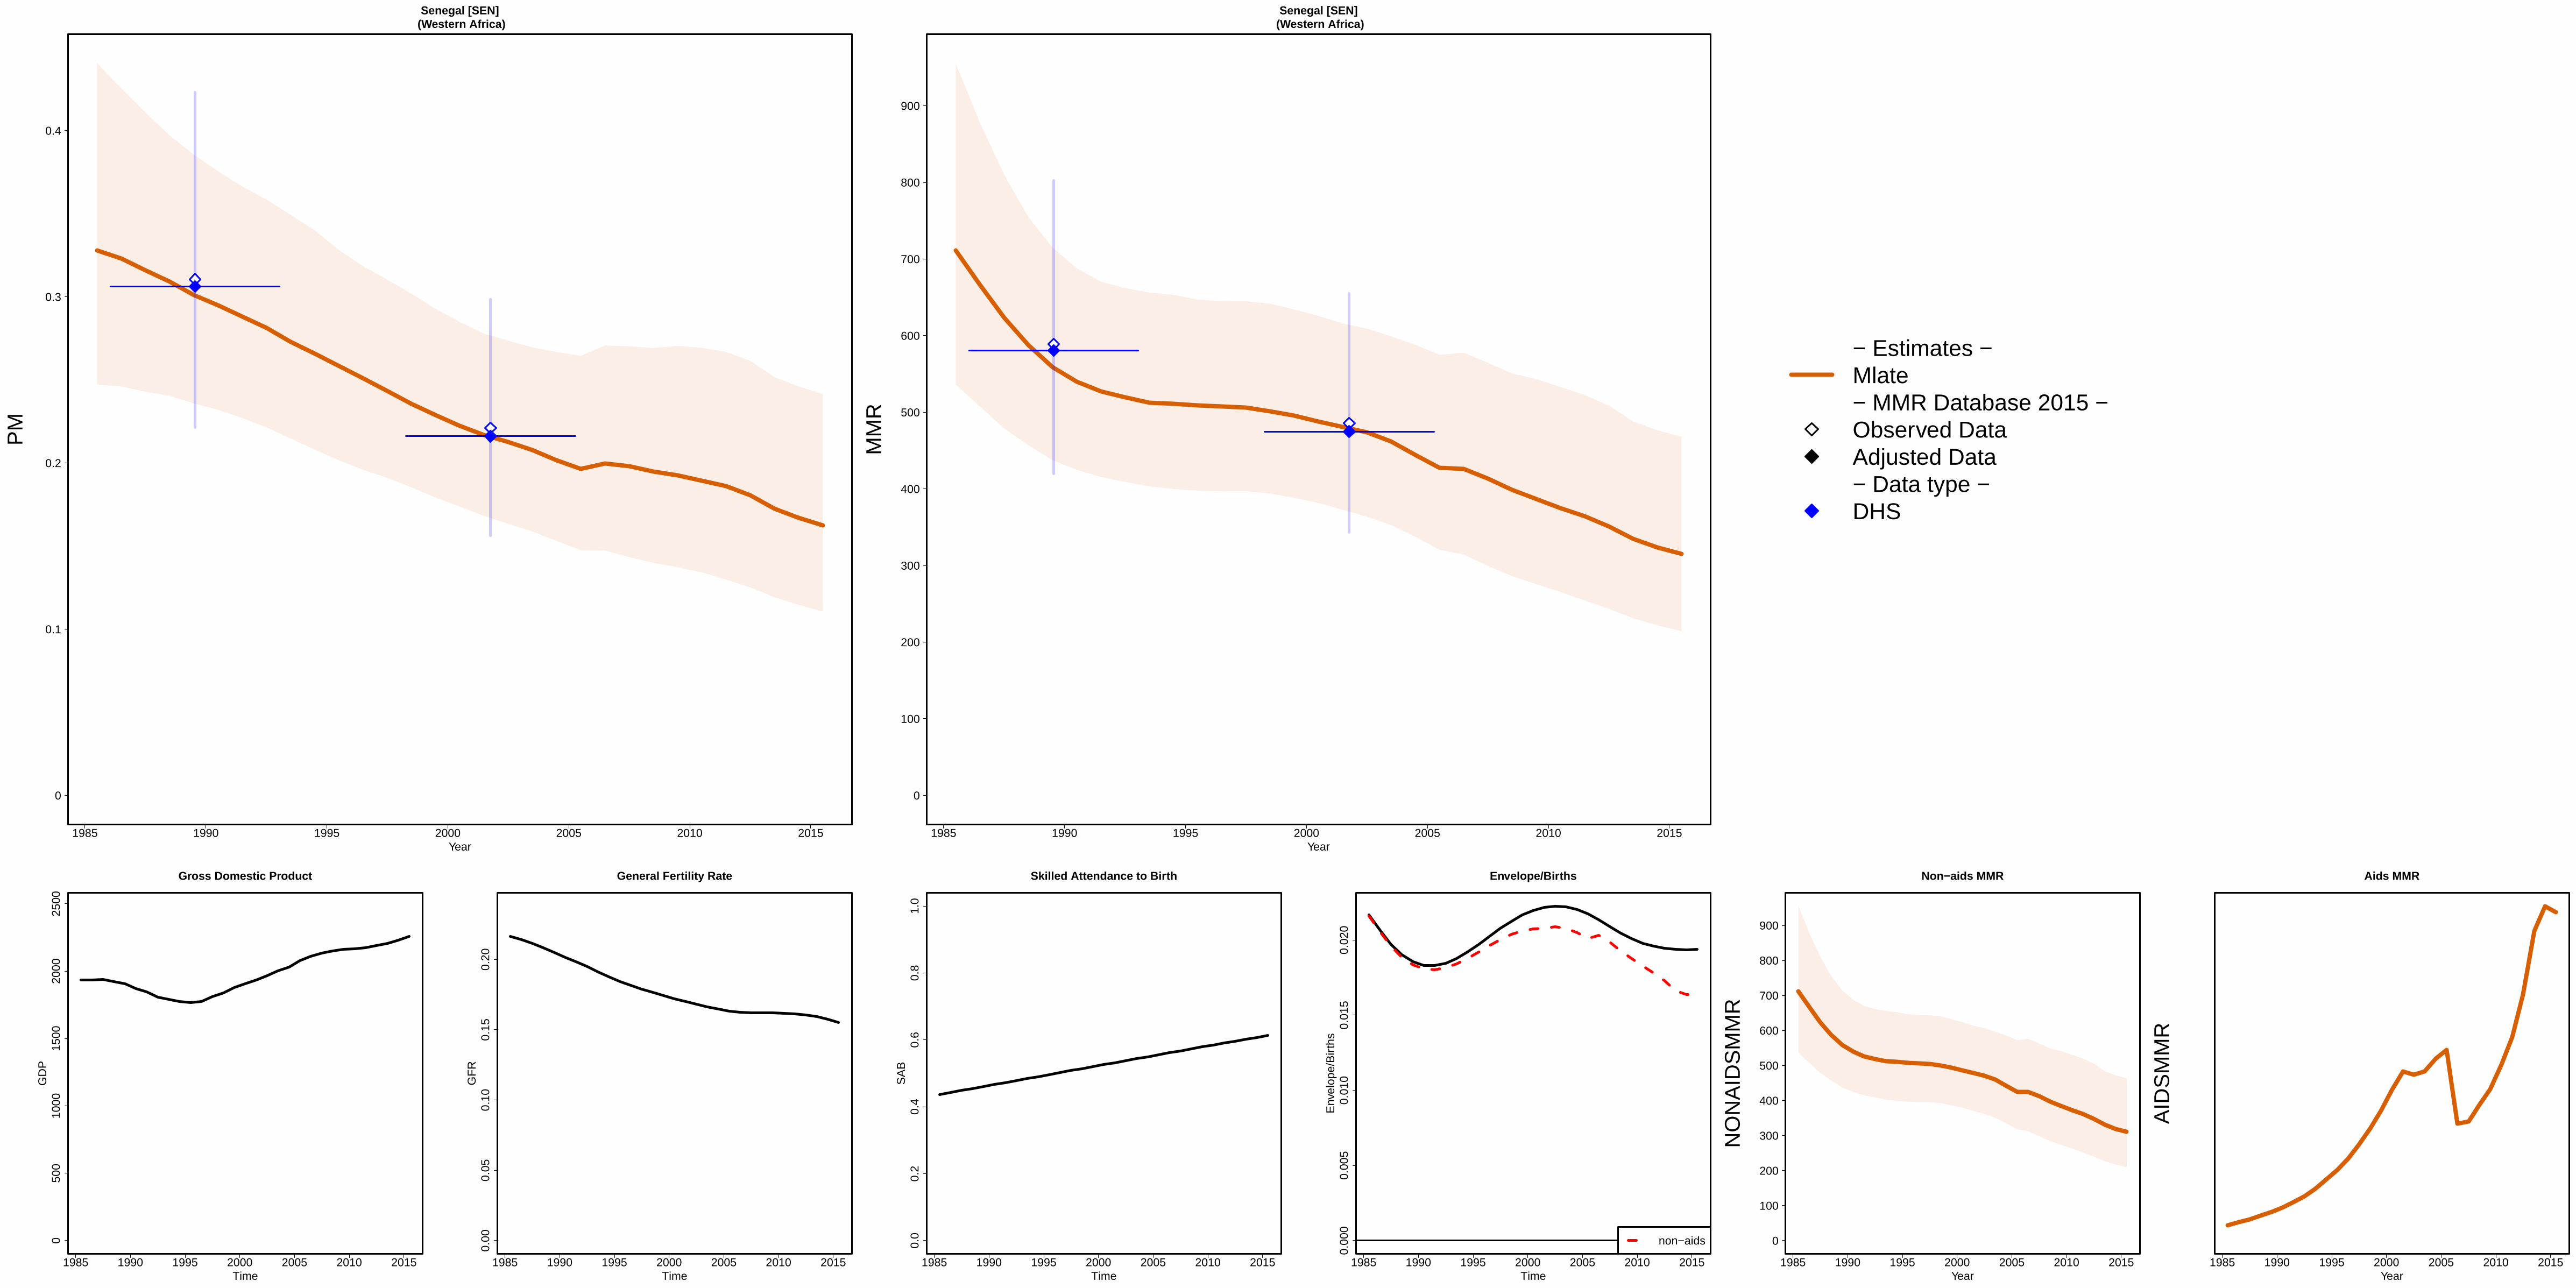
1985 1990 1995 2000 2005 2010 2015
Senegal [SEN] (Western Africa)
Year
0
0.1
0.2
0.3
0.4
PM
1985 1990 1995 2000 2005 2010 2015
Senegal [SEN] (Western Africa)
Year
0
100
200
300
400
500
600
700
800
900
MM
R
− Estimates −Mlate− MMR Database 2015 −Observed DataAdjusted Data− Data type −DHS
1985 1990 1995 2000 2005 2010 2015
050
010
0015
0020
0025
00
Gross Domestic Product
Time
GD
P
1985 1990 1995 2000 2005 2010 2015
0.00
0.05
0.10
0.15
0.20
General Fertility Rate
Time
GF
R
1985 1990 1995 2000 2005 2010 2015
0.0
0.2
0.4
0.6
0.8
1.0
Skilled Attendance to Birth
Time
SA
B
1985 1990 1995 2000 2005 2010 2015
0.00
00.
005
0.01
00.
015
0.02
0
Envelope/Births
Time
Env
elop
e/B
irth
s
non−aids
1985 1990 1995 2000 2005 2010 2015
Non−aids MMR
Year
0
100
200
300
400
500
600
700
800
900
NO
NA
IDS
MM
R
1985 1990 1995 2000 2005 2010 2015
Aids MMR
Year
AID
SM
MR

1985 1990 1995 2000 2005 2010 2015
Serbia [SRB] (Transition countries of South−Eastern Europe)
Year
0
0.01
PM
1985 1990 1995 2000 2005 2010 2015
Serbia [SRB] (Transition countries of South−Eastern Europe)
Year
0
10
20
30
40
MM
R
− Estimates −
Mlate
− MMR Database 2015 −
Observed Data
Adjusted Data
− Data type −
VR
Spec. studiesReported VR before recalc.(related to 0 obs. mat. death)
1985 1990 1995 2000 2005 2010 2015
020
0040
0060
0080
0010
000
1200
014
000
Gross Domestic Product
Time
GD
P
1985 1990 1995 2000 2005 2010 2015
0.00
0.02
0.04
0.06
General Fertility Rate
Time
GF
R
1985 1990 1995 2000 2005 2010 2015
0.0
0.2
0.4
0.6
0.8
1.0
Skilled Attendance to Birth
Time
SA
B
1985 1990 1995 2000 2005 2010 2015
0.00
00.
005
0.01
00.
015
0.02
00.
025
Envelope/Births
Time
Env
elop
e/B
irth
s
non−aids
1985 1990 1995 2000 2005 2010 2015
Non−aids MMR
Year
0
5
10
15
20
25
NO
NA
IDS
MM
R
1985 1990 1995 2000 2005 2010 2015
Aids MMR
Year
0
0.02
0.04
0.06
0.08
AID
SM
MR

1985 1990 1995 2000 2005 2010 2015
Sierra Leone [SLE] (Western Africa)
Year
0
0.1
0.2
0.3
0.4
0.5
0.6
PM
1985 1990 1995 2000 2005 2010 2015
Sierra Leone [SLE] (Western Africa)
Year
0
500
1000
1500
2000
2500
3000
3500
4000
MM
R
− Estimates −Mlate− MMR Database 2015 −Observed DataAdjusted Data− Data type −DHS
1985 1990 1995 2000 2005 2010 2015
050
010
0015
0020
00
Gross Domestic Product
Time
GD
P
1985 1990 1995 2000 2005 2010 2015
0.00
0.05
0.10
0.15
0.20
General Fertility Rate
Time
GF
R
1985 1990 1995 2000 2005 2010 2015
0.0
0.2
0.4
0.6
0.8
1.0
Skilled Attendance to Birth
Time
SA
B
1985 1990 1995 2000 2005 2010 2015
0.00
0.01
0.02
0.03
0.04
0.05
0.06
0.07
Envelope/Births
Time
Env
elop
e/B
irth
s
non−aids
1985 1990 1995 2000 2005 2010 2015
Non−aids MMR
Year
0
500
1000
1500
2000
2500
3000
3500
4000
NO
NA
IDS
MM
R
1985 1990 1995 2000 2005 2010 2015
Aids MMR
Year
0
5
10
AID
SM
MR
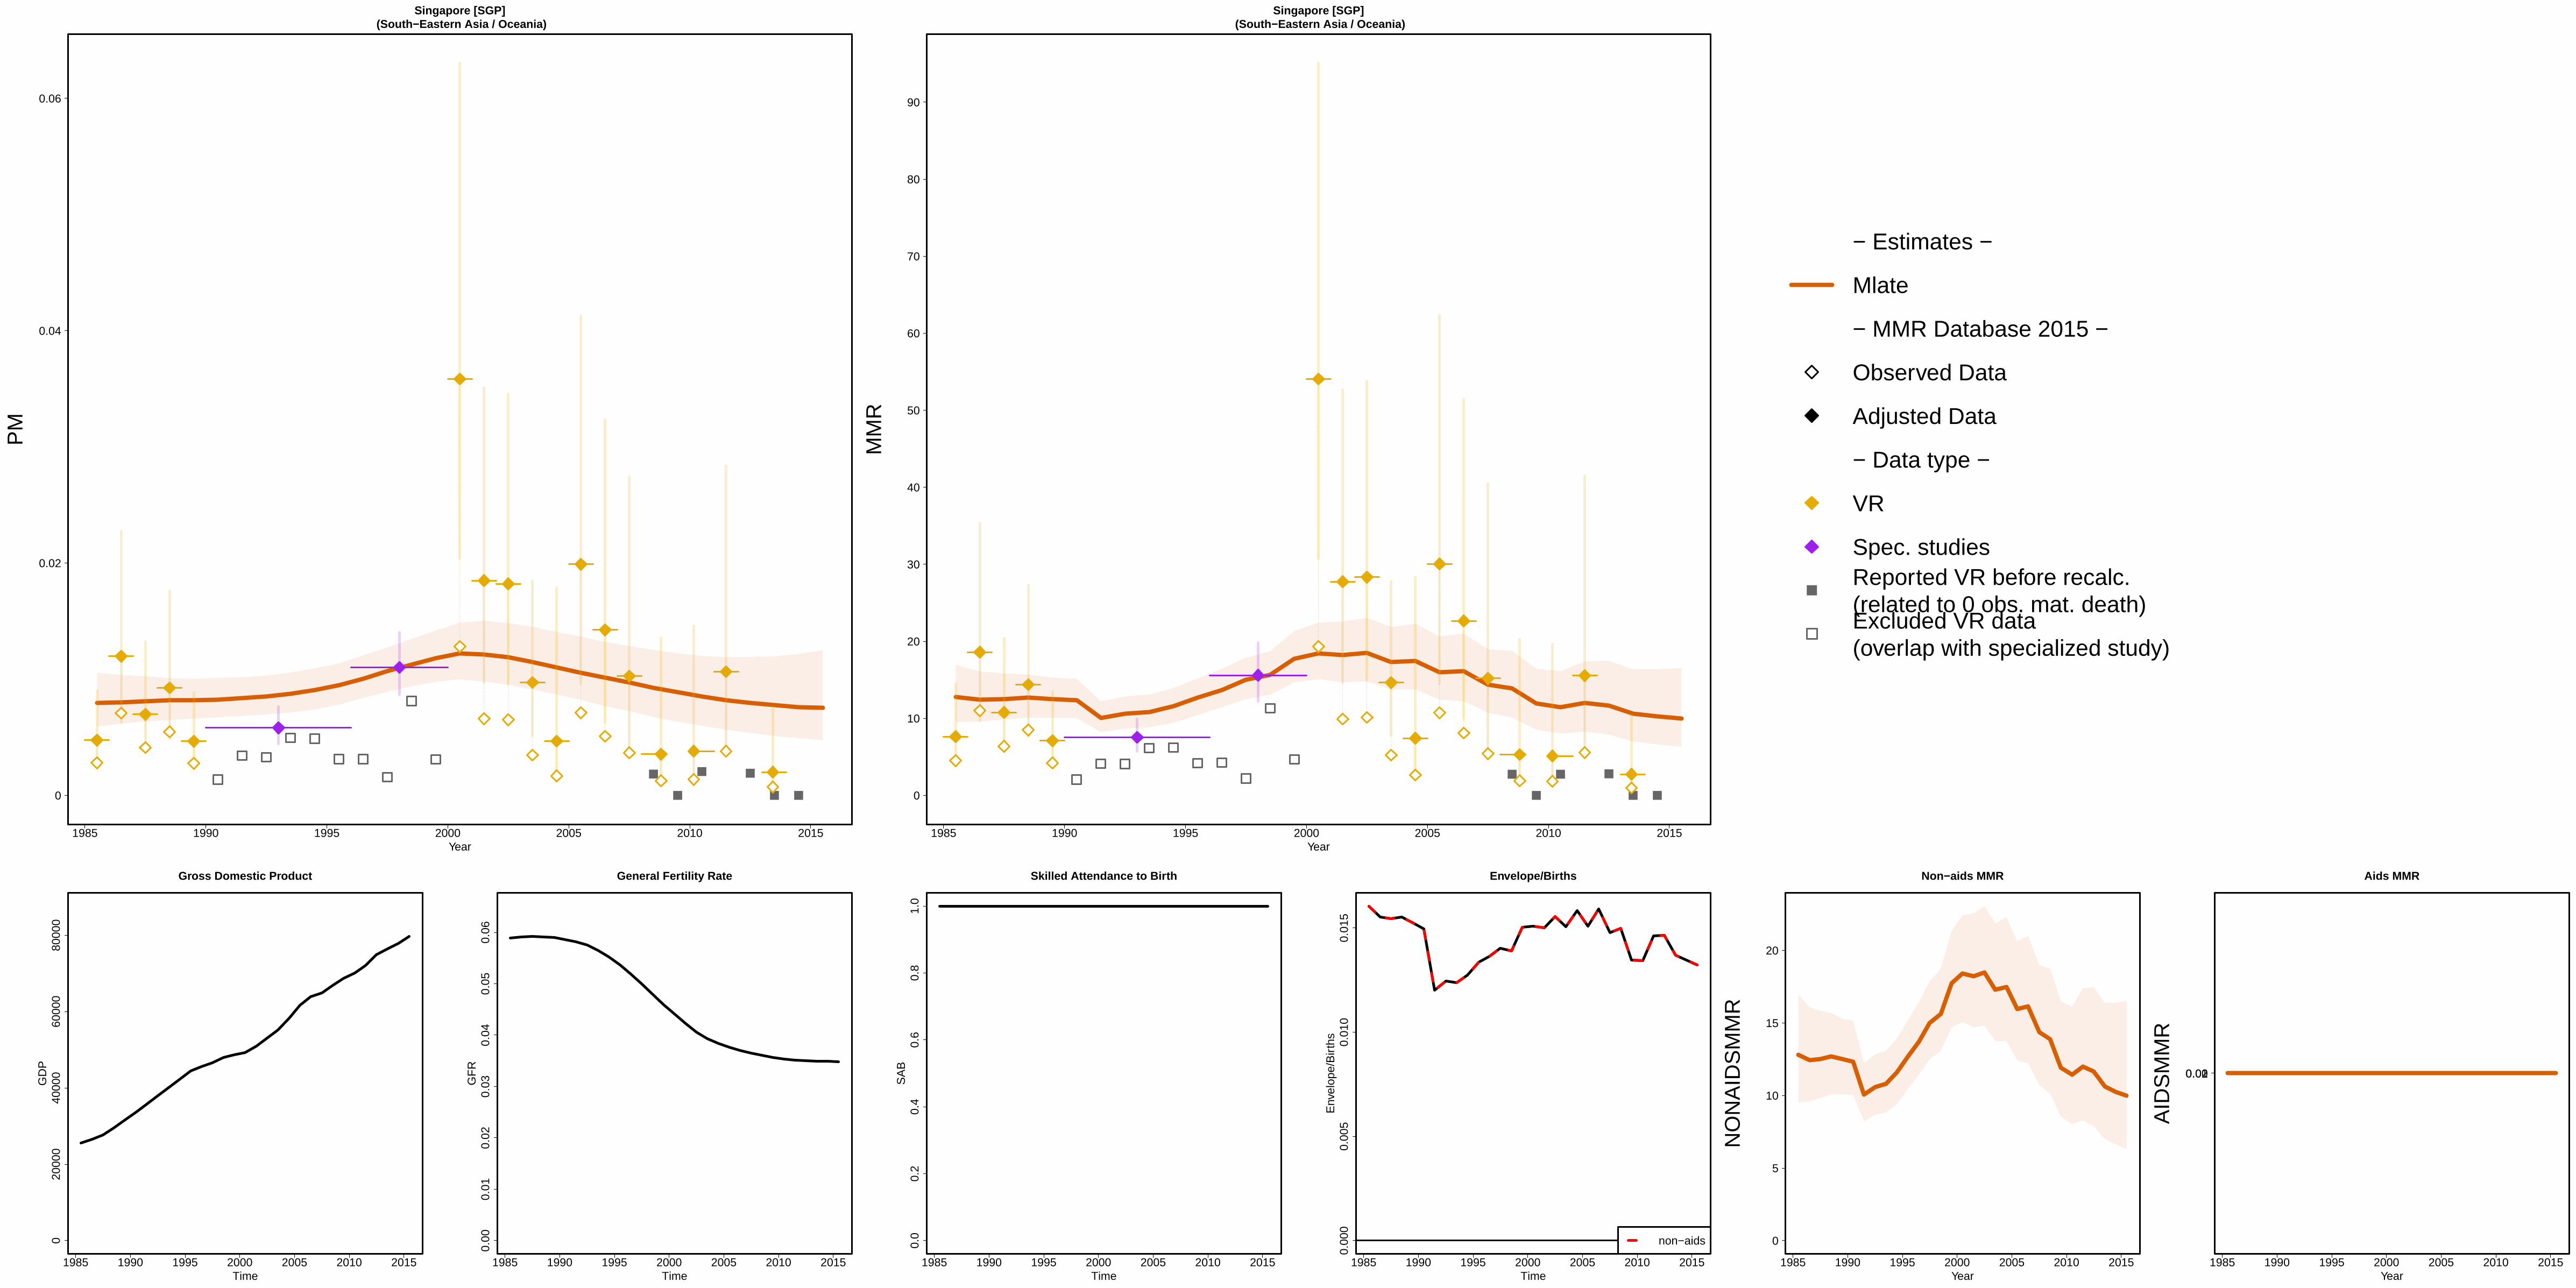
1985 1990 1995 2000 2005 2010 2015
Singapore [SGP] (South−Eastern Asia / Oceania)
Year
0
0.02
0.04
0.06
PM
1985 1990 1995 2000 2005 2010 2015
Singapore [SGP] (South−Eastern Asia / Oceania)
Year
0
10
20
30
40
50
60
70
80
90
MM
R
− Estimates −
Mlate
− MMR Database 2015 −
Observed Data
Adjusted Data
− Data type −
VR
Spec. studiesReported VR before recalc.(related to 0 obs. mat. death)Excluded VR data (overlap with specialized study)
1985 1990 1995 2000 2005 2010 2015
020
000
4000
060
000
8000
0
Gross Domestic Product
Time
GD
P
1985 1990 1995 2000 2005 2010 2015
0.00
0.01
0.02
0.03
0.04
0.05
0.06
General Fertility Rate
Time
GF
R
1985 1990 1995 2000 2005 2010 2015
0.0
0.2
0.4
0.6
0.8
1.0
Skilled Attendance to Birth
Time
SA
B
1985 1990 1995 2000 2005 2010 2015
0.00
00.
005
0.01
00.
015
Envelope/Births
Time
Env
elop
e/B
irth
s
non−aids
1985 1990 1995 2000 2005 2010 2015
Non−aids MMR
Year
0
5
10
15
20
NO
NA
IDS
MM
R
1985 1990 1995 2000 2005 2010 2015
Aids MMR
Year
00.010.02
AID
SM
MR
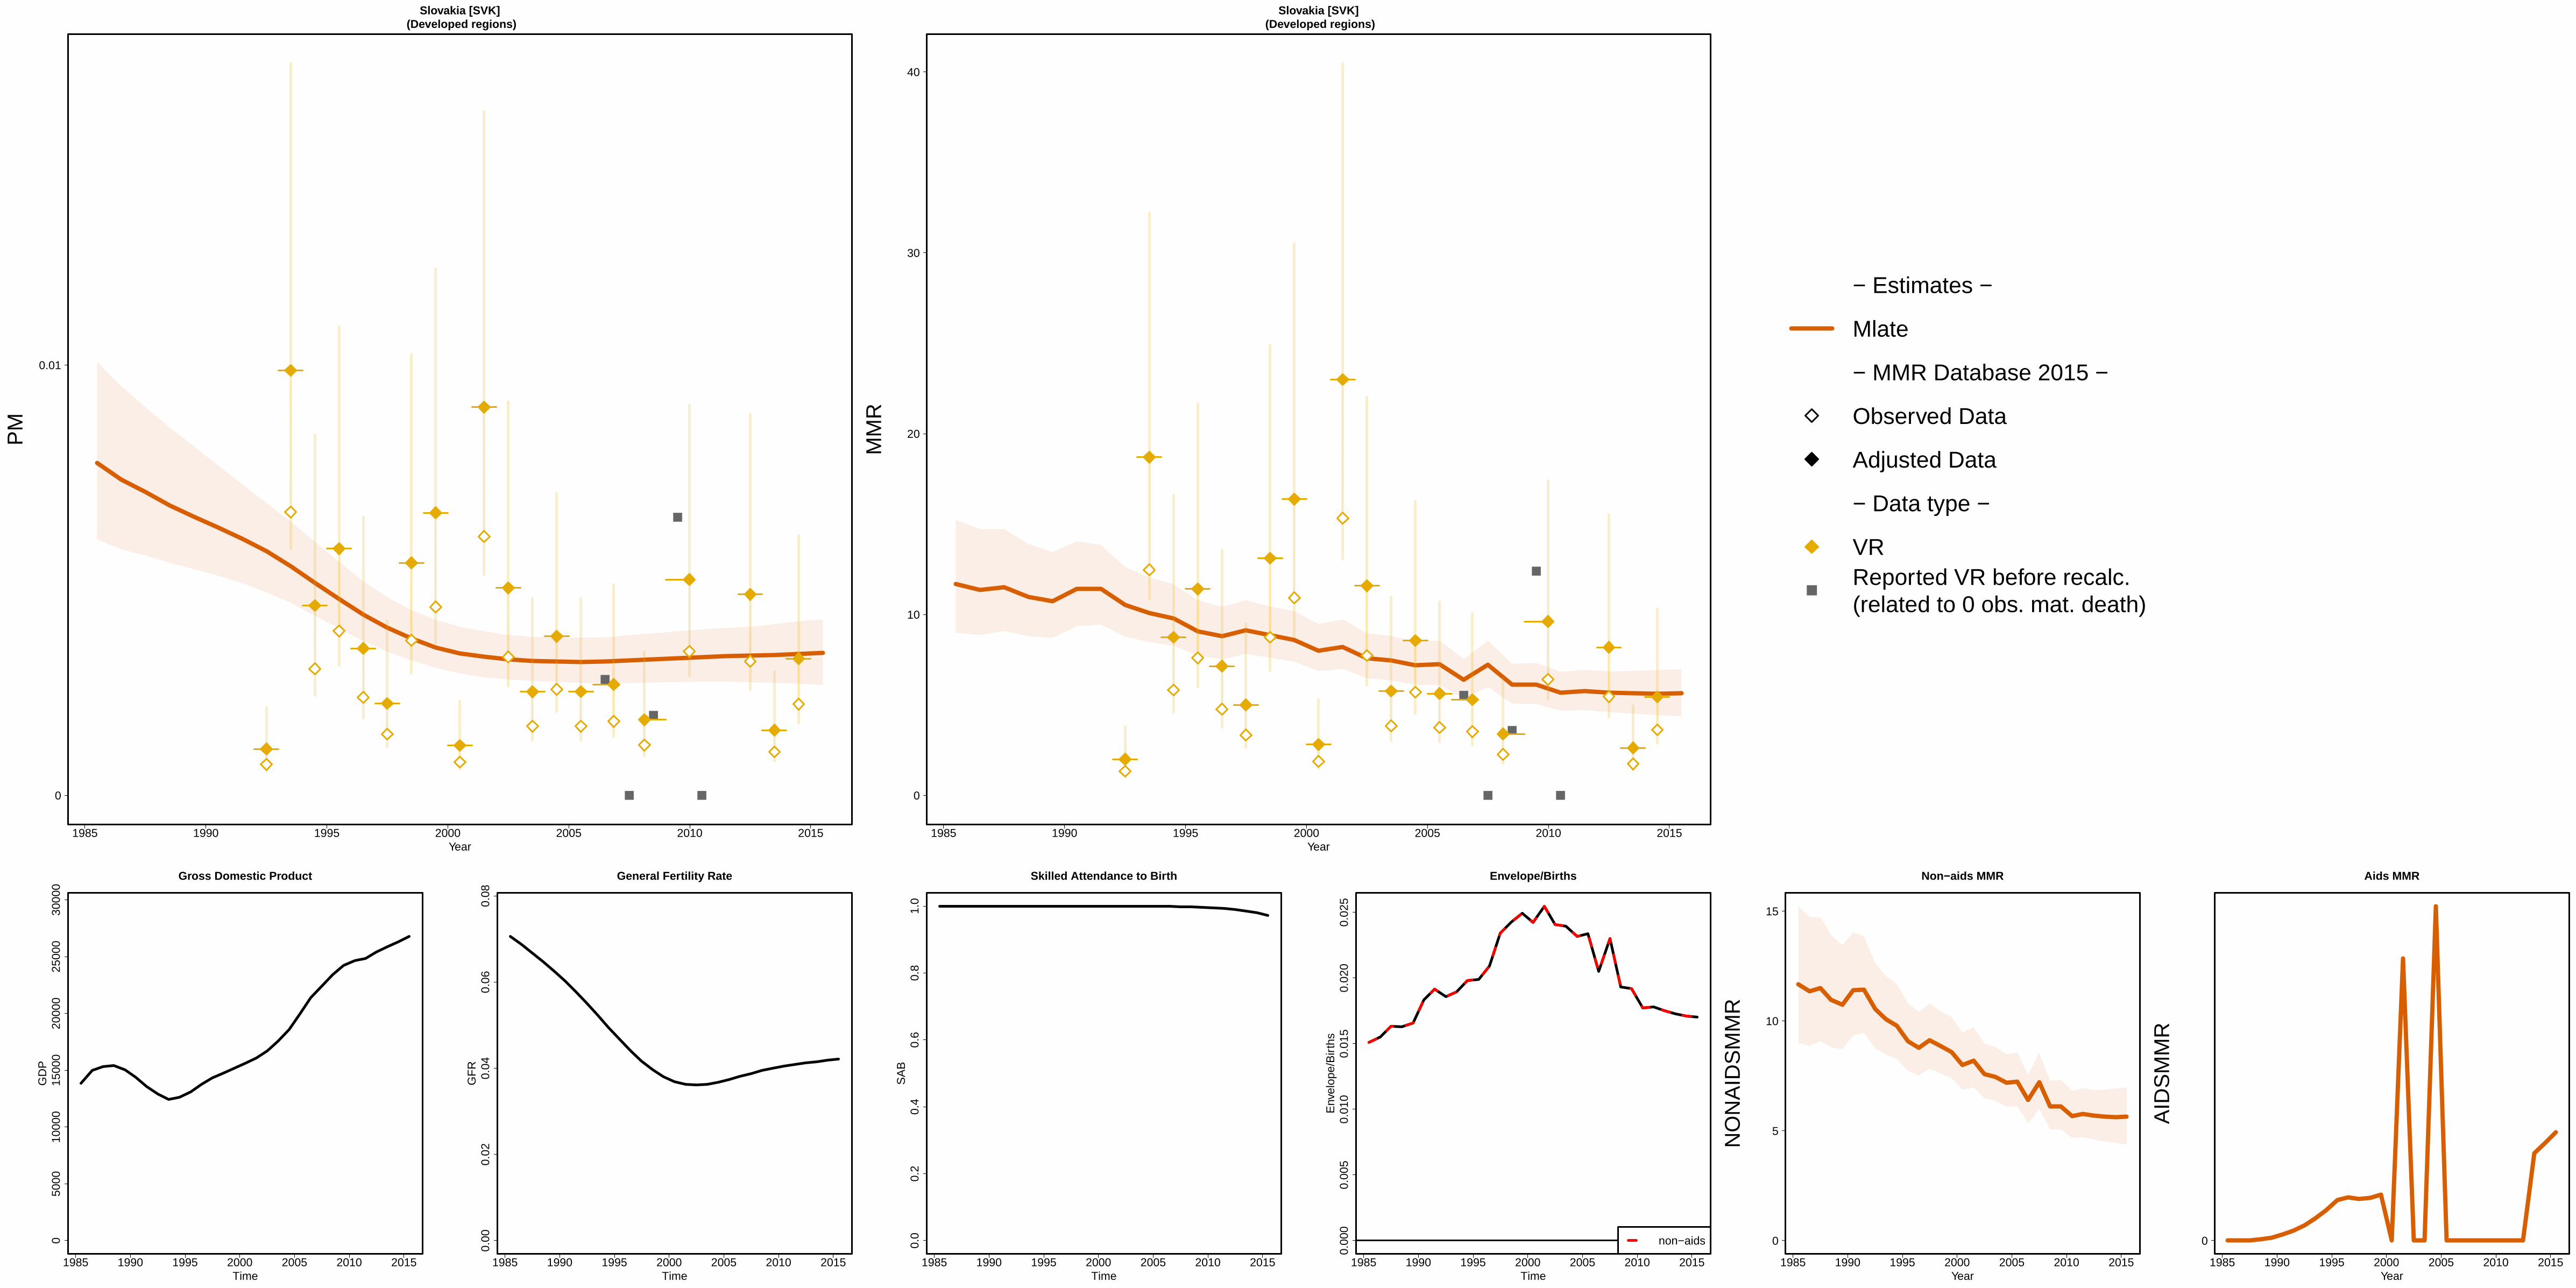
1985 1990 1995 2000 2005 2010 2015
Slovakia [SVK] (Developed regions)
Year
0
0.01
PM
1985 1990 1995 2000 2005 2010 2015
Slovakia [SVK] (Developed regions)
Year
0
10
20
30
40
MM
R
− Estimates −
Mlate
− MMR Database 2015 −
Observed Data
Adjusted Data
− Data type −
VRReported VR before recalc.(related to 0 obs. mat. death)
1985 1990 1995 2000 2005 2010 2015
050
0010
000
1500
020
000
2500
030
000
Gross Domestic Product
Time
GD
P
1985 1990 1995 2000 2005 2010 2015
0.00
0.02
0.04
0.06
0.08
General Fertility Rate
Time
GF
R
1985 1990 1995 2000 2005 2010 2015
0.0
0.2
0.4
0.6
0.8
1.0
Skilled Attendance to Birth
Time
SA
B
1985 1990 1995 2000 2005 2010 2015
0.00
00.
005
0.01
00.
015
0.02
00.
025
Envelope/Births
Time
Env
elop
e/B
irth
s
non−aids
1985 1990 1995 2000 2005 2010 2015
Non−aids MMR
Year
0
5
10
15
NO
NA
IDS
MM
R
1985 1990 1995 2000 2005 2010 2015
Aids MMR
Year
0
AID
SM
MR
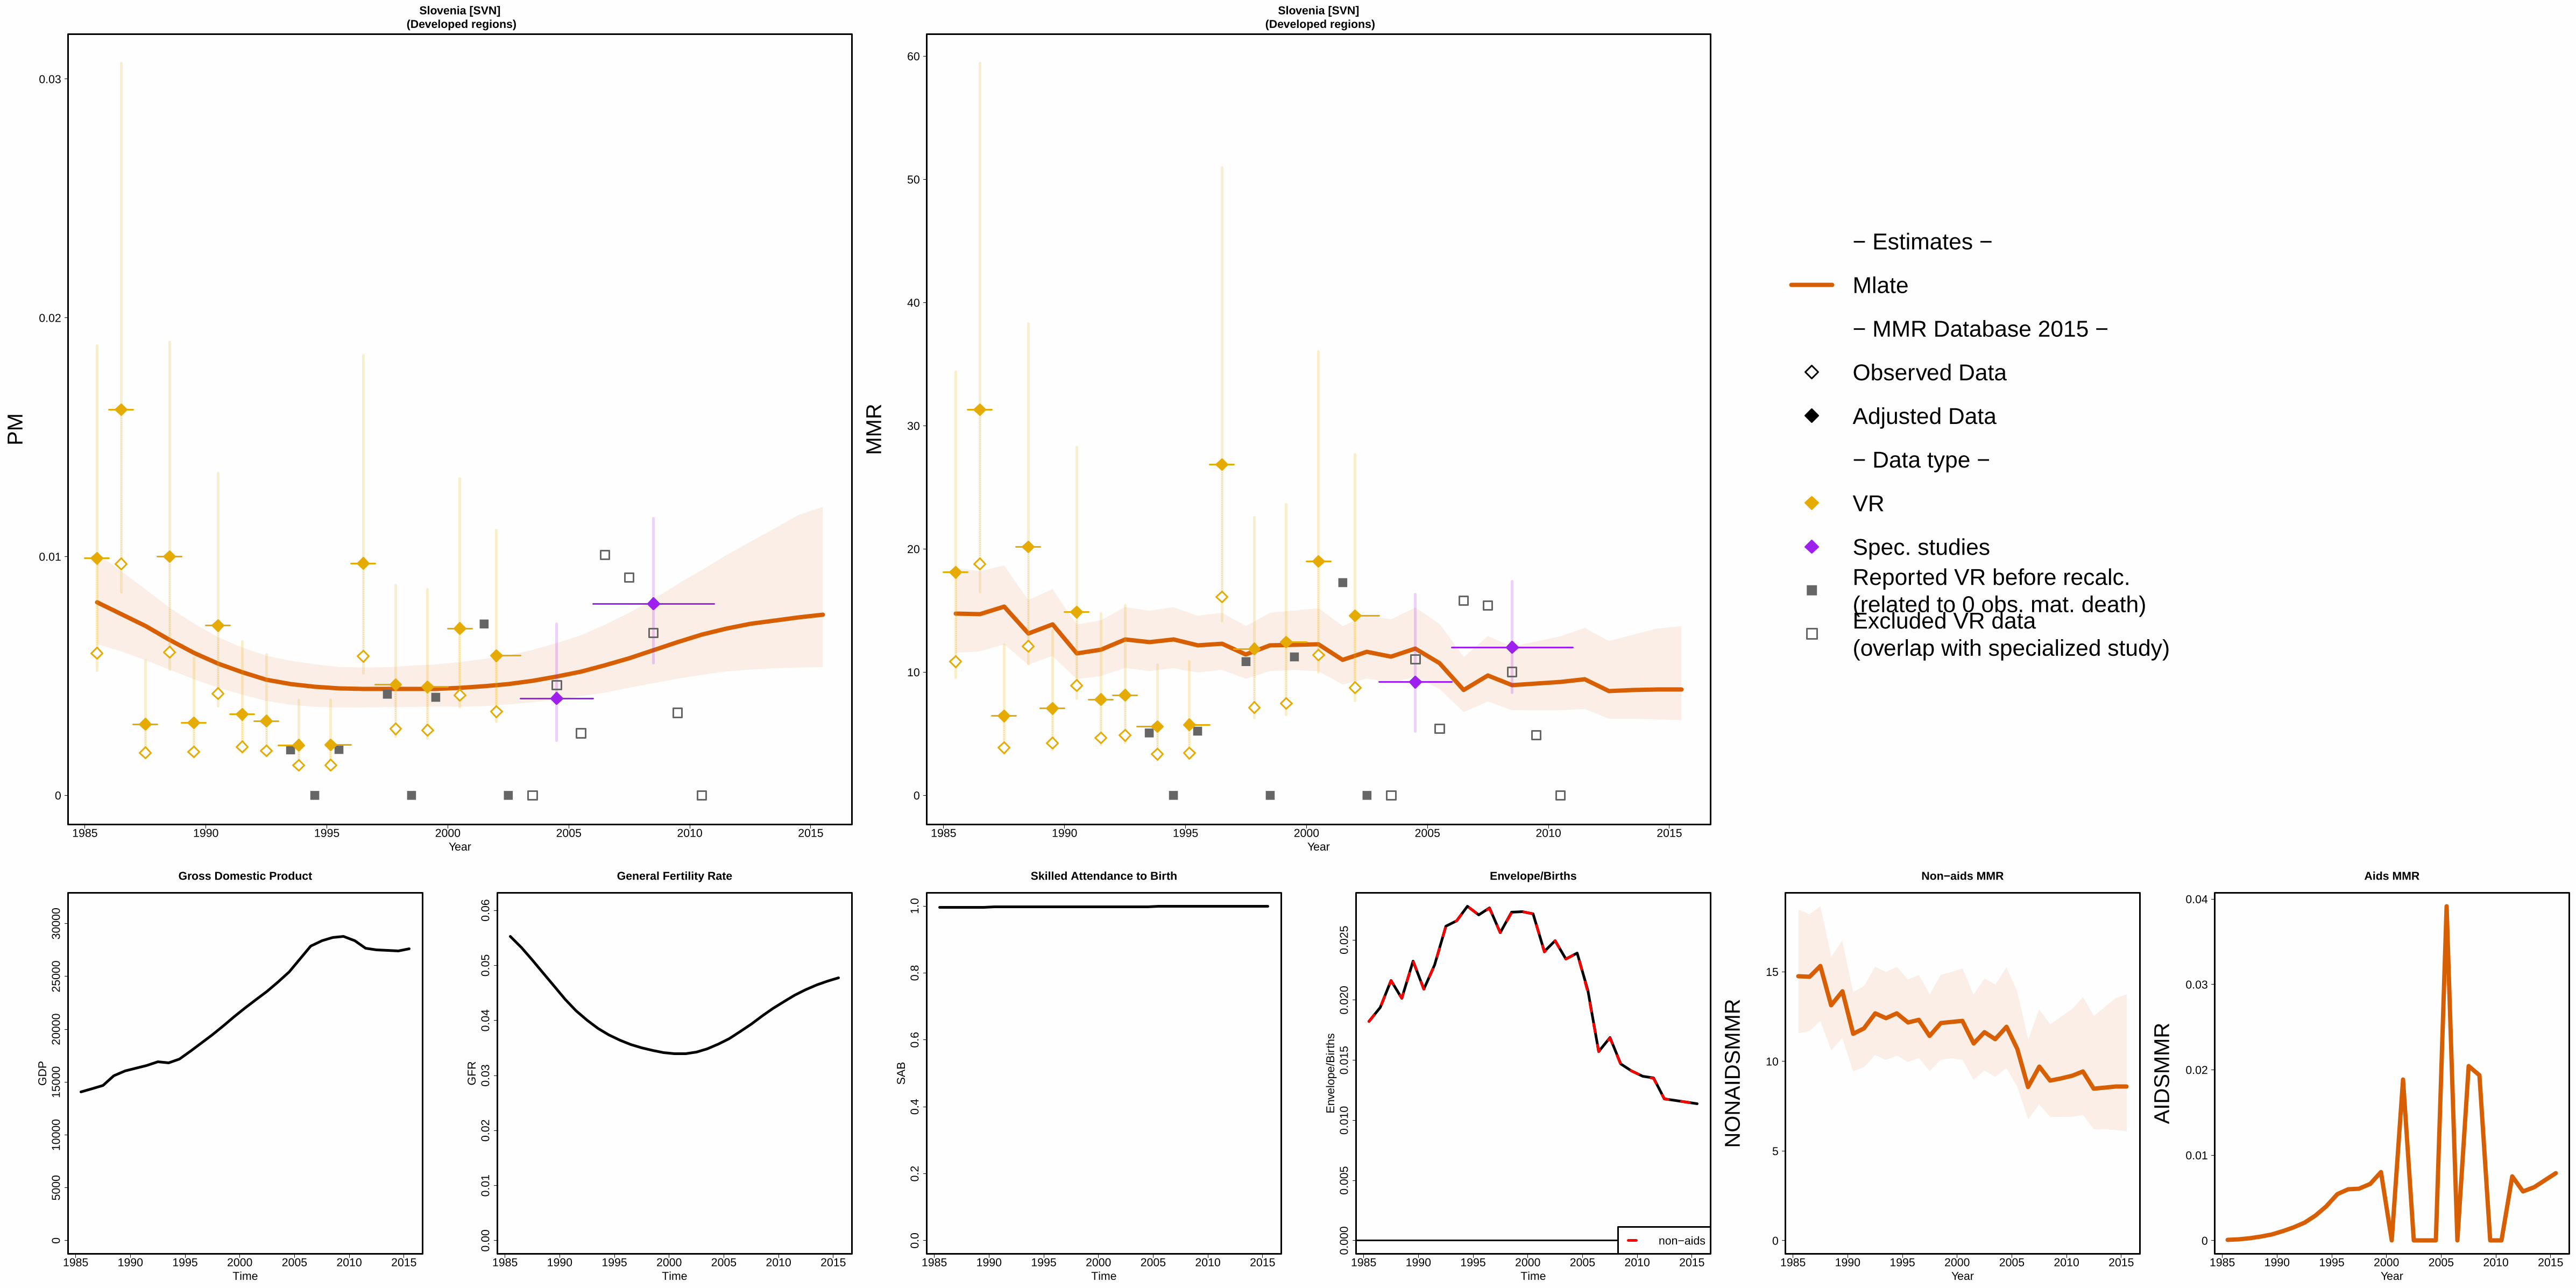
1985 1990 1995 2000 2005 2010 2015
Slovenia [SVN] (Developed regions)
Year
0
0.01
0.02
0.03
PM
1985 1990 1995 2000 2005 2010 2015
Slovenia [SVN] (Developed regions)
Year
0
10
20
30
40
50
60
MM
R
− Estimates −
Mlate
− MMR Database 2015 −
Observed Data
Adjusted Data
− Data type −
VR
Spec. studiesReported VR before recalc.(related to 0 obs. mat. death)Excluded VR data (overlap with specialized study)
1985 1990 1995 2000 2005 2010 2015
050
0010
000
1500
020
000
2500
030
000
Gross Domestic Product
Time
GD
P
1985 1990 1995 2000 2005 2010 2015
0.00
0.01
0.02
0.03
0.04
0.05
0.06
General Fertility Rate
Time
GF
R
1985 1990 1995 2000 2005 2010 2015
0.0
0.2
0.4
0.6
0.8
1.0
Skilled Attendance to Birth
Time
SA
B
1985 1990 1995 2000 2005 2010 2015
0.00
00.
005
0.01
00.
015
0.02
00.
025
Envelope/Births
Time
Env
elop
e/B
irth
s
non−aids
1985 1990 1995 2000 2005 2010 2015
Non−aids MMR
Year
0
5
10
15
NO
NA
IDS
MM
R
1985 1990 1995 2000 2005 2010 2015
Aids MMR
Year
0
0.01
0.02
0.03
0.04
AID
SM
MR
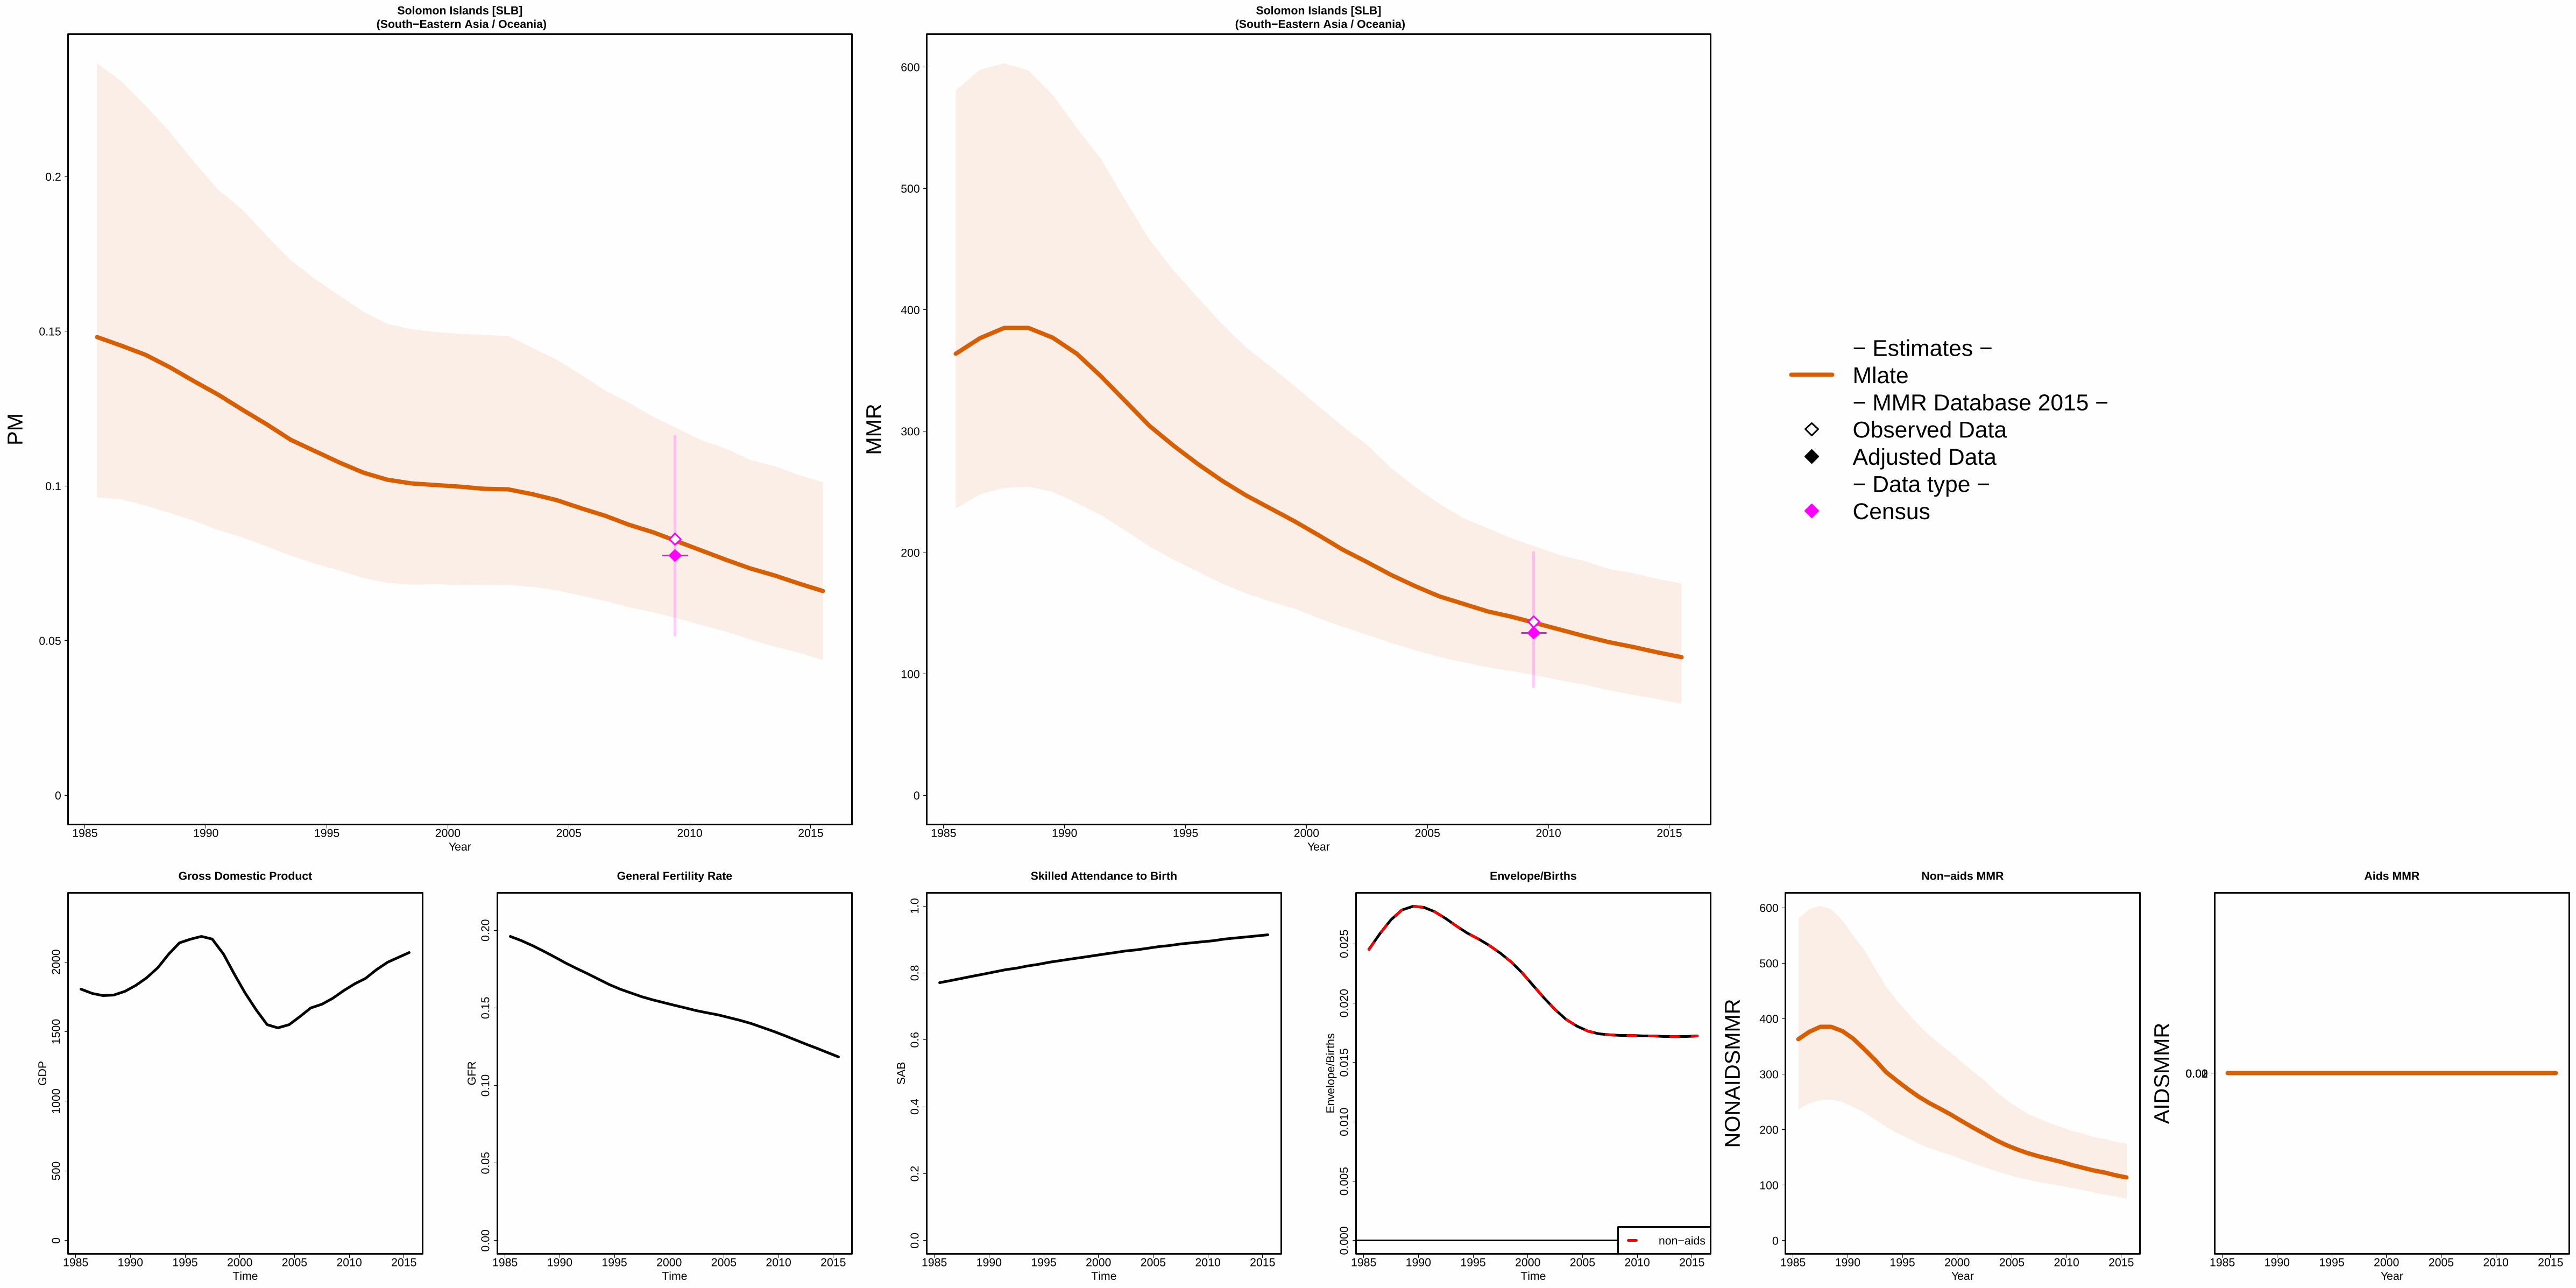
1985 1990 1995 2000 2005 2010 2015
Solomon Islands [SLB] (South−Eastern Asia / Oceania)
Year
0
0.05
0.1
0.15
0.2
PM
1985 1990 1995 2000 2005 2010 2015
Solomon Islands [SLB] (South−Eastern Asia / Oceania)
Year
0
100
200
300
400
500
600
MM
R
− Estimates −Mlate− MMR Database 2015 −Observed DataAdjusted Data− Data type −Census
1985 1990 1995 2000 2005 2010 2015
050
010
0015
0020
00
Gross Domestic Product
Time
GD
P
1985 1990 1995 2000 2005 2010 2015
0.00
0.05
0.10
0.15
0.20
General Fertility Rate
Time
GF
R
1985 1990 1995 2000 2005 2010 2015
0.0
0.2
0.4
0.6
0.8
1.0
Skilled Attendance to Birth
Time
SA
B
1985 1990 1995 2000 2005 2010 2015
0.00
00.
005
0.01
00.
015
0.02
00.
025
Envelope/Births
Time
Env
elop
e/B
irth
s
non−aids
1985 1990 1995 2000 2005 2010 2015
Non−aids MMR
Year
0
100
200
300
400
500
600
NO
NA
IDS
MM
R
1985 1990 1995 2000 2005 2010 2015
Aids MMR
Year
00.010.02
AID
SM
MR

1985 1990 1995 2000 2005 2010 2015
Somalia [SOM] (Eastern Africa)
Year
0
0.1
0.2
0.3
0.4
0.5
0.6
0.7
PM
1985 1990 1995 2000 2005 2010 2015
Somalia [SOM] (Eastern Africa)
Year
0
500
1000
1500
2000
MM
R − Estimates −Mlate− MMR Database 2015 −
1985 1990 1995 2000 2005 2010 2015
020
040
060
080
010
00
Gross Domestic Product
Time
GD
P
1985 1990 1995 2000 2005 2010 2015
0.00
0.05
0.10
0.15
0.20
0.25
General Fertility Rate
Time
GF
R
1985 1990 1995 2000 2005 2010 2015
0.0
0.2
0.4
0.6
0.8
1.0
Skilled Attendance to Birth
Time
SA
B
1985 1990 1995 2000 2005 2010 2015
0.00
00.
005
0.01
00.
015
0.02
00.
025
0.03
00.
035
Envelope/Births
Time
Env
elop
e/B
irth
s
non−aids
1985 1990 1995 2000 2005 2010 2015
Non−aids MMR
Year
0
500
1000
1500
2000
NO
NA
IDS
MM
R
1985 1990 1995 2000 2005 2010 2015
Aids MMR
Year
AID
SM
MR

1985 1990 1995 2000 2005 2010 2015
South Africa [ZAF] (Southern Africa)
Year
0
0.05
0.1
PM
●● ●
●
●
● ●● ●
● ●● ●
●
● ●● ●
●● ●
1985 1990 1995 2000 2005 2010 2015
South Africa [ZAF] (Southern Africa)
Year
0
100
200
300
400
500
600
MM
R
●
− Estimates −
Mlate
− MMR Database 2015 −
Observed Data
Adjusted Data
− Data type −
Spec. studies
DHS
CensusExcluded VR data (data quality issues)
1985 1990 1995 2000 2005 2010 2015
020
0040
0060
0080
0010
000
1200
014
000
Gross Domestic Product
Time
GD
P
1985 1990 1995 2000 2005 2010 2015
0.00
0.05
0.10
0.15
General Fertility Rate
Time
GF
R
1985 1990 1995 2000 2005 2010 2015
0.0
0.2
0.4
0.6
0.8
1.0
Skilled Attendance to Birth
Time
SA
B
1985 1990 1995 2000 2005 2010 2015
0.00
0.02
0.04
0.06
0.08
0.10
0.12
Envelope/Births
Time
Env
elop
e/B
irth
s
non−aids
1985 1990 1995 2000 2005 2010 2015
Non−aids MMR
Year
0
50
100
150
200
250
NO
NA
IDS
MM
R
1985 1990 1995 2000 2005 2010 2015
Aids MMR
Year
0
10
20
30
40
50
60
70
80
AID
SM
MR
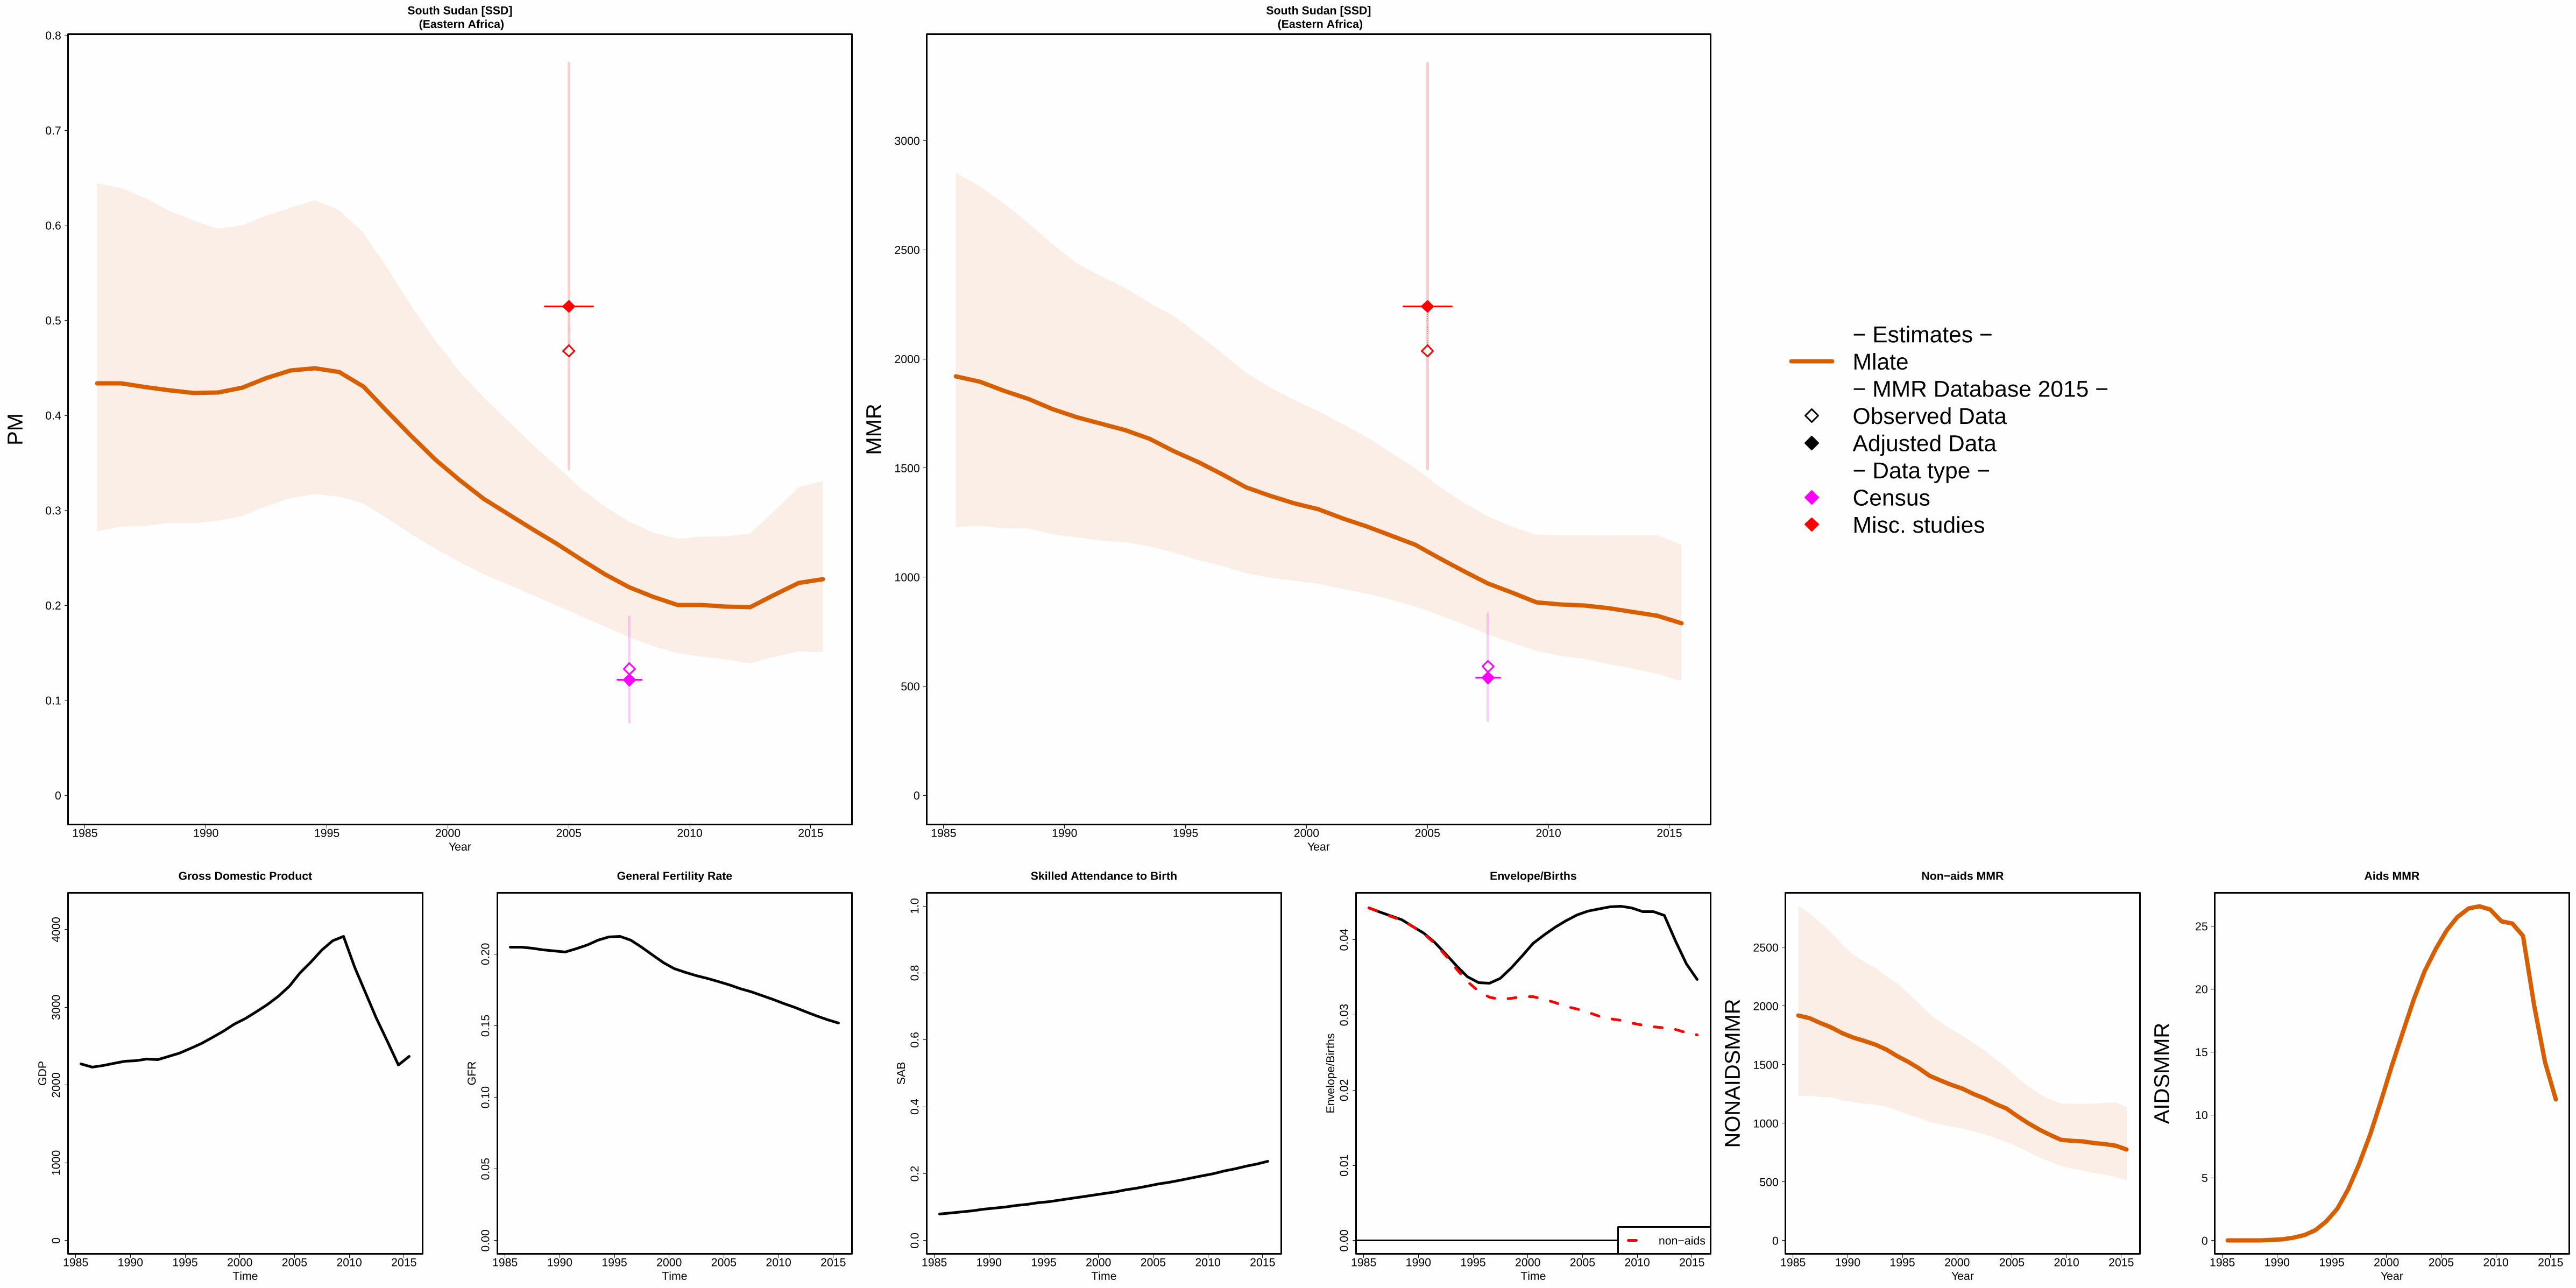
1985 1990 1995 2000 2005 2010 2015
South Sudan [SSD] (Eastern Africa)
Year
0
0.1
0.2
0.3
0.4
0.5
0.6
0.7
0.8
PM
1985 1990 1995 2000 2005 2010 2015
South Sudan [SSD] (Eastern Africa)
Year
0
500
1000
1500
2000
2500
3000
MM
R
− Estimates −Mlate− MMR Database 2015 −Observed DataAdjusted Data− Data type −CensusMisc. studies
1985 1990 1995 2000 2005 2010 2015
010
0020
0030
0040
00
Gross Domestic Product
Time
GD
P
1985 1990 1995 2000 2005 2010 2015
0.00
0.05
0.10
0.15
0.20
General Fertility Rate
Time
GF
R
1985 1990 1995 2000 2005 2010 2015
0.0
0.2
0.4
0.6
0.8
1.0
Skilled Attendance to Birth
Time
SA
B
1985 1990 1995 2000 2005 2010 2015
0.00
0.01
0.02
0.03
0.04
Envelope/Births
Time
Env
elop
e/B
irth
s
non−aids
1985 1990 1995 2000 2005 2010 2015
Non−aids MMR
Year
0
500
1000
1500
2000
2500
NO
NA
IDS
MM
R
1985 1990 1995 2000 2005 2010 2015
Aids MMR
Year
0
5
10
15
20
25
AID
SM
MR

1985 1990 1995 2000 2005 2010 2015
Spain [ESP] (Developed regions)
Year
0
PM
1985 1990 1995 2000 2005 2010 2015
Spain [ESP] (Developed regions)
Year
0
5
10
MM
R
− Estimates −Mlate− MMR Database 2015 −Observed DataAdjusted Data− Data type −VR
1985 1990 1995 2000 2005 2010 2015
010
000
2000
030
000
Gross Domestic Product
Time
GD
P
1985 1990 1995 2000 2005 2010 2015
0.00
0.01
0.02
0.03
0.04
0.05
General Fertility Rate
Time
GF
R
1985 1990 1995 2000 2005 2010 2015
0.0
0.2
0.4
0.6
0.8
1.0
Skilled Attendance to Birth
Time
SA
B
1985 1990 1995 2000 2005 2010 2015
0.00
00.
005
0.01
00.
015
0.02
0
Envelope/Births
Time
Env
elop
e/B
irth
s
non−aids
1985 1990 1995 2000 2005 2010 2015
Non−aids MMR
Year
NO
NA
IDS
MM
R
1985 1990 1995 2000 2005 2010 2015
Aids MMR
Year
0
0.1
0.2
0.3
0.4
0.5
0.6
0.7
AID
SM
MR

1985 1990 1995 2000 2005 2010 2015
Sri Lanka [LKA] (Southern Asia)
Year
0
0.02
0.04
0.06
PM
1985 1990 1995 2000 2005 2010 2015
Sri Lanka [LKA] (Southern Asia)
Year
0
50
100
MM
R
− Estimates −Mlate− MMR Database 2015 −Observed DataAdjusted Data− Data type −VRMisc. studies
1985 1990 1995 2000 2005 2010 2015
020
0040
0060
0080
0010
000
Gross Domestic Product
Time
GD
P
1985 1990 1995 2000 2005 2010 2015
0.00
0.02
0.04
0.06
0.08
0.10
General Fertility Rate
Time
GF
R
1985 1990 1995 2000 2005 2010 2015
0.0
0.2
0.4
0.6
0.8
1.0
Skilled Attendance to Birth
Time
SA
B
1985 1990 1995 2000 2005 2010 2015
0.00
00.
005
0.01
00.
015
0.02
00.
025
Envelope/Births
Time
Env
elop
e/B
irth
s
non−aids
1985 1990 1995 2000 2005 2010 2015
Non−aids MMR
Year
0
50
100
NO
NA
IDS
MM
R
1985 1990 1995 2000 2005 2010 2015
Aids MMR
Year
0
0.05
0.1
AID
SM
MR
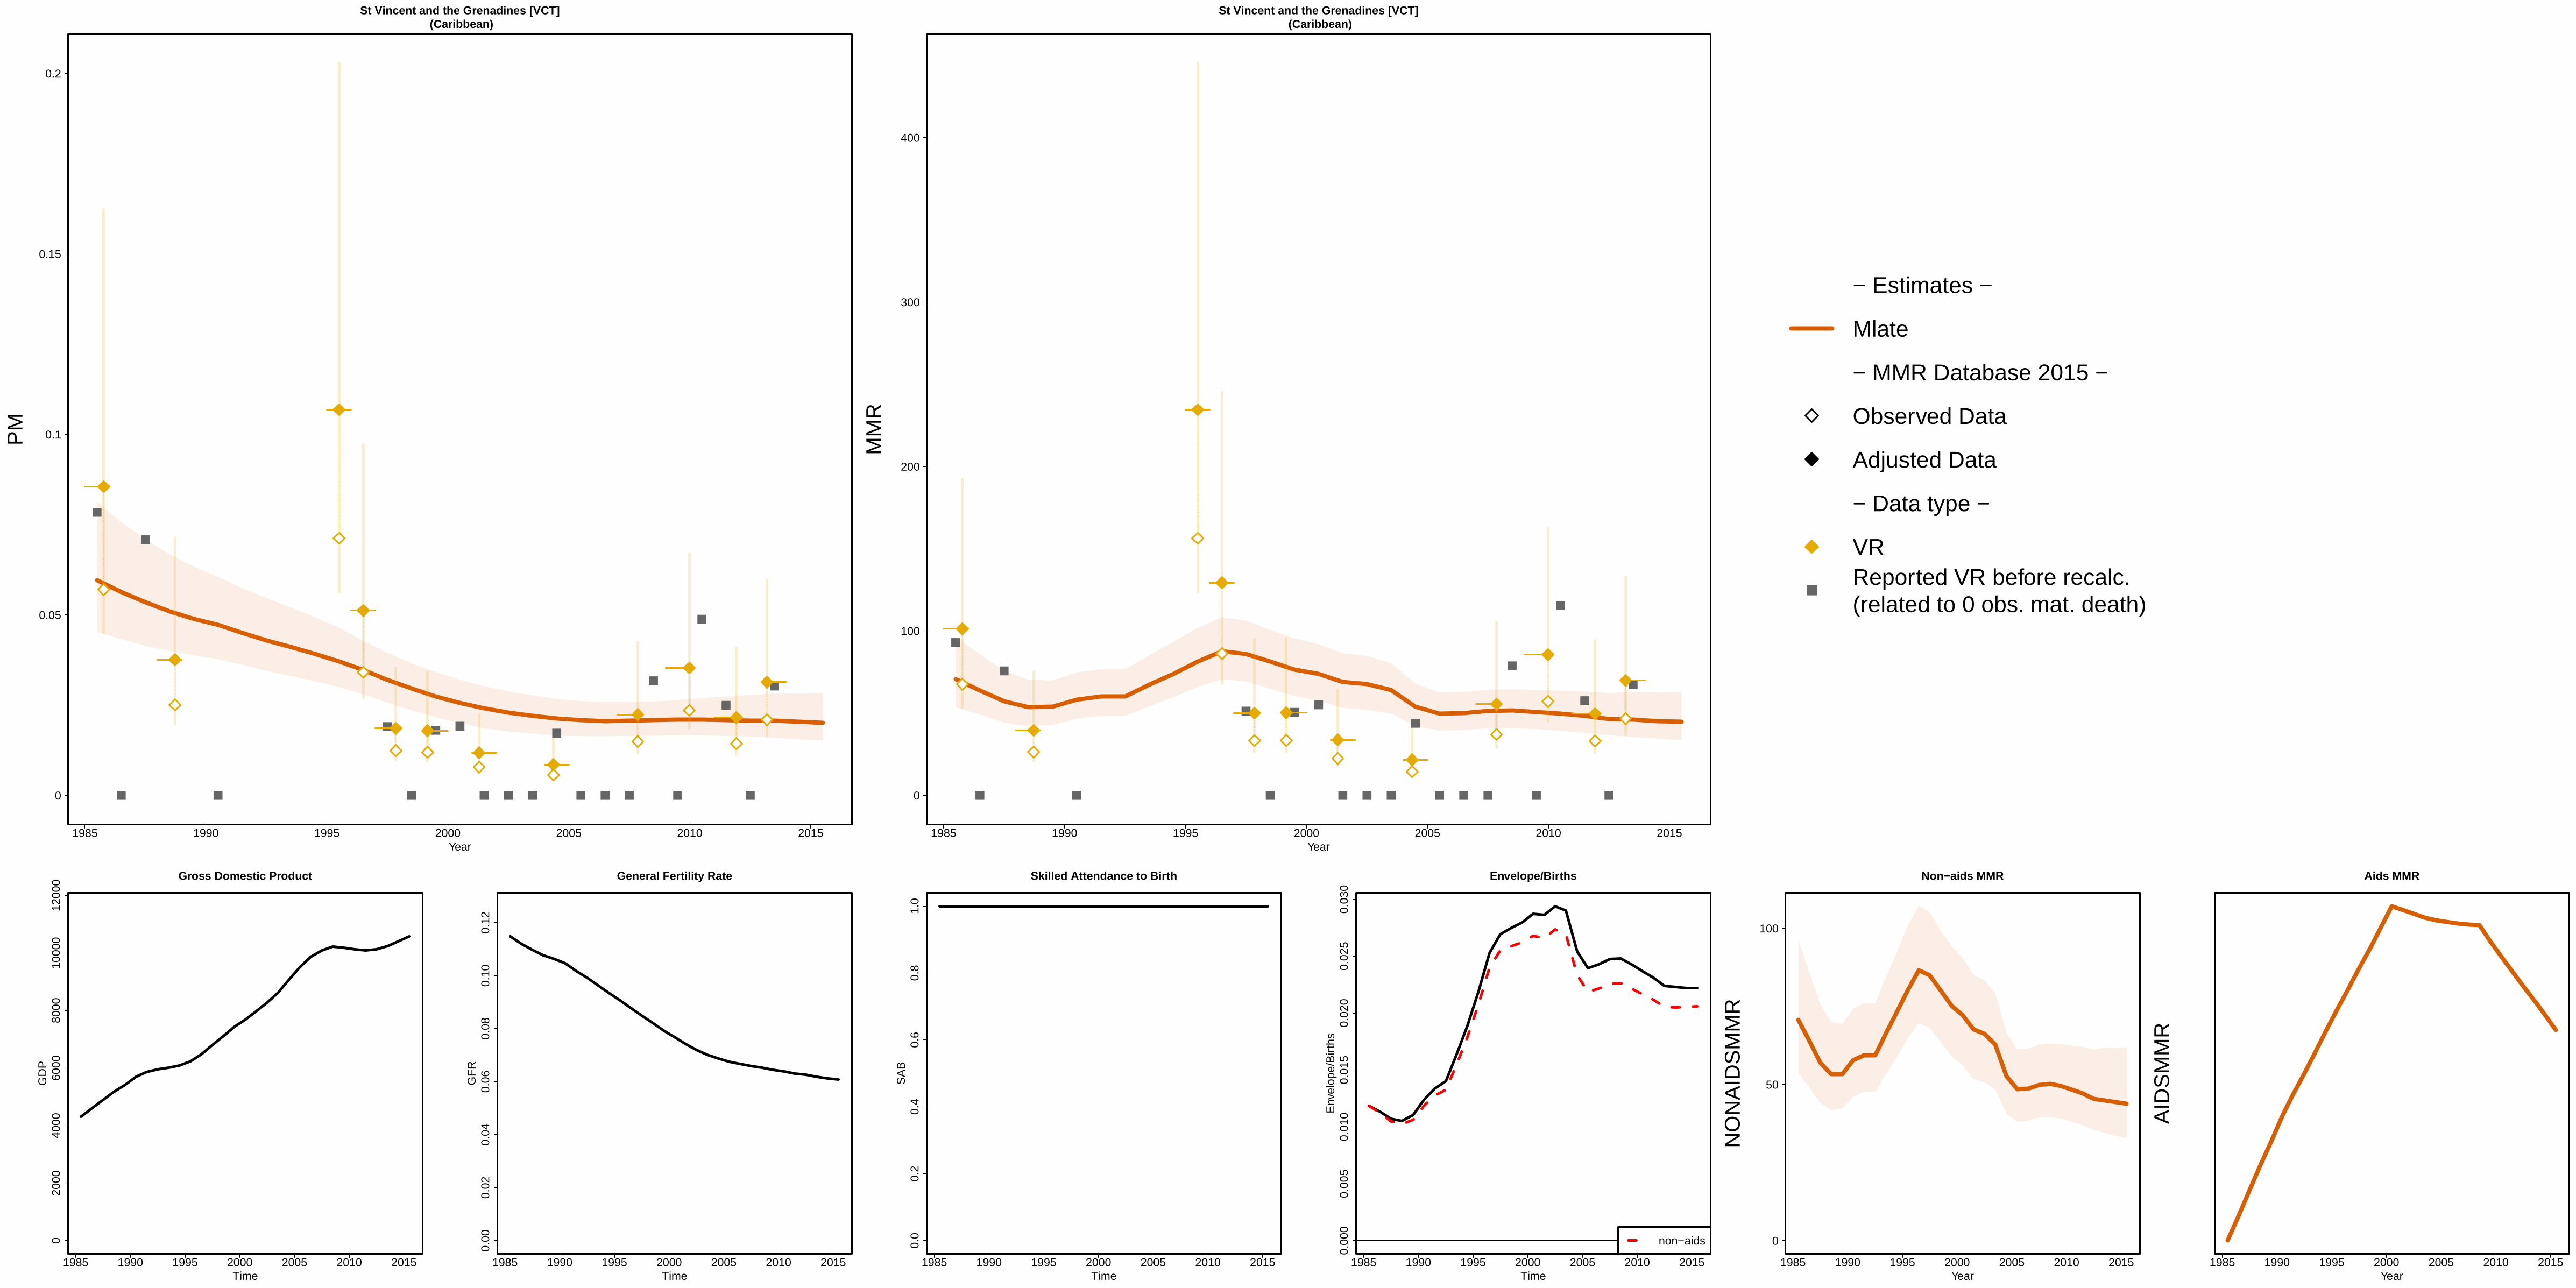
1985 1990 1995 2000 2005 2010 2015
St Vincent and the Grenadines [VCT] (Caribbean)
Year
0
0.05
0.1
0.15
0.2
PM
1985 1990 1995 2000 2005 2010 2015
St Vincent and the Grenadines [VCT] (Caribbean)
Year
0
100
200
300
400
MM
R
− Estimates −
Mlate
− MMR Database 2015 −
Observed Data
Adjusted Data
− Data type −
VRReported VR before recalc.(related to 0 obs. mat. death)
1985 1990 1995 2000 2005 2010 2015
020
0040
0060
0080
0010
000
1200
0 Gross Domestic Product
Time
GD
P
1985 1990 1995 2000 2005 2010 2015
0.00
0.02
0.04
0.06
0.08
0.10
0.12
General Fertility Rate
Time
GF
R
1985 1990 1995 2000 2005 2010 2015
0.0
0.2
0.4
0.6
0.8
1.0
Skilled Attendance to Birth
Time
SA
B
1985 1990 1995 2000 2005 2010 2015
0.00
00.
005
0.01
00.
015
0.02
00.
025
0.03
0
Envelope/Births
Time
Env
elop
e/B
irth
s
non−aids
1985 1990 1995 2000 2005 2010 2015
Non−aids MMR
Year
0
50
100
NO
NA
IDS
MM
R
1985 1990 1995 2000 2005 2010 2015
Aids MMR
Year
AID
SM
MR
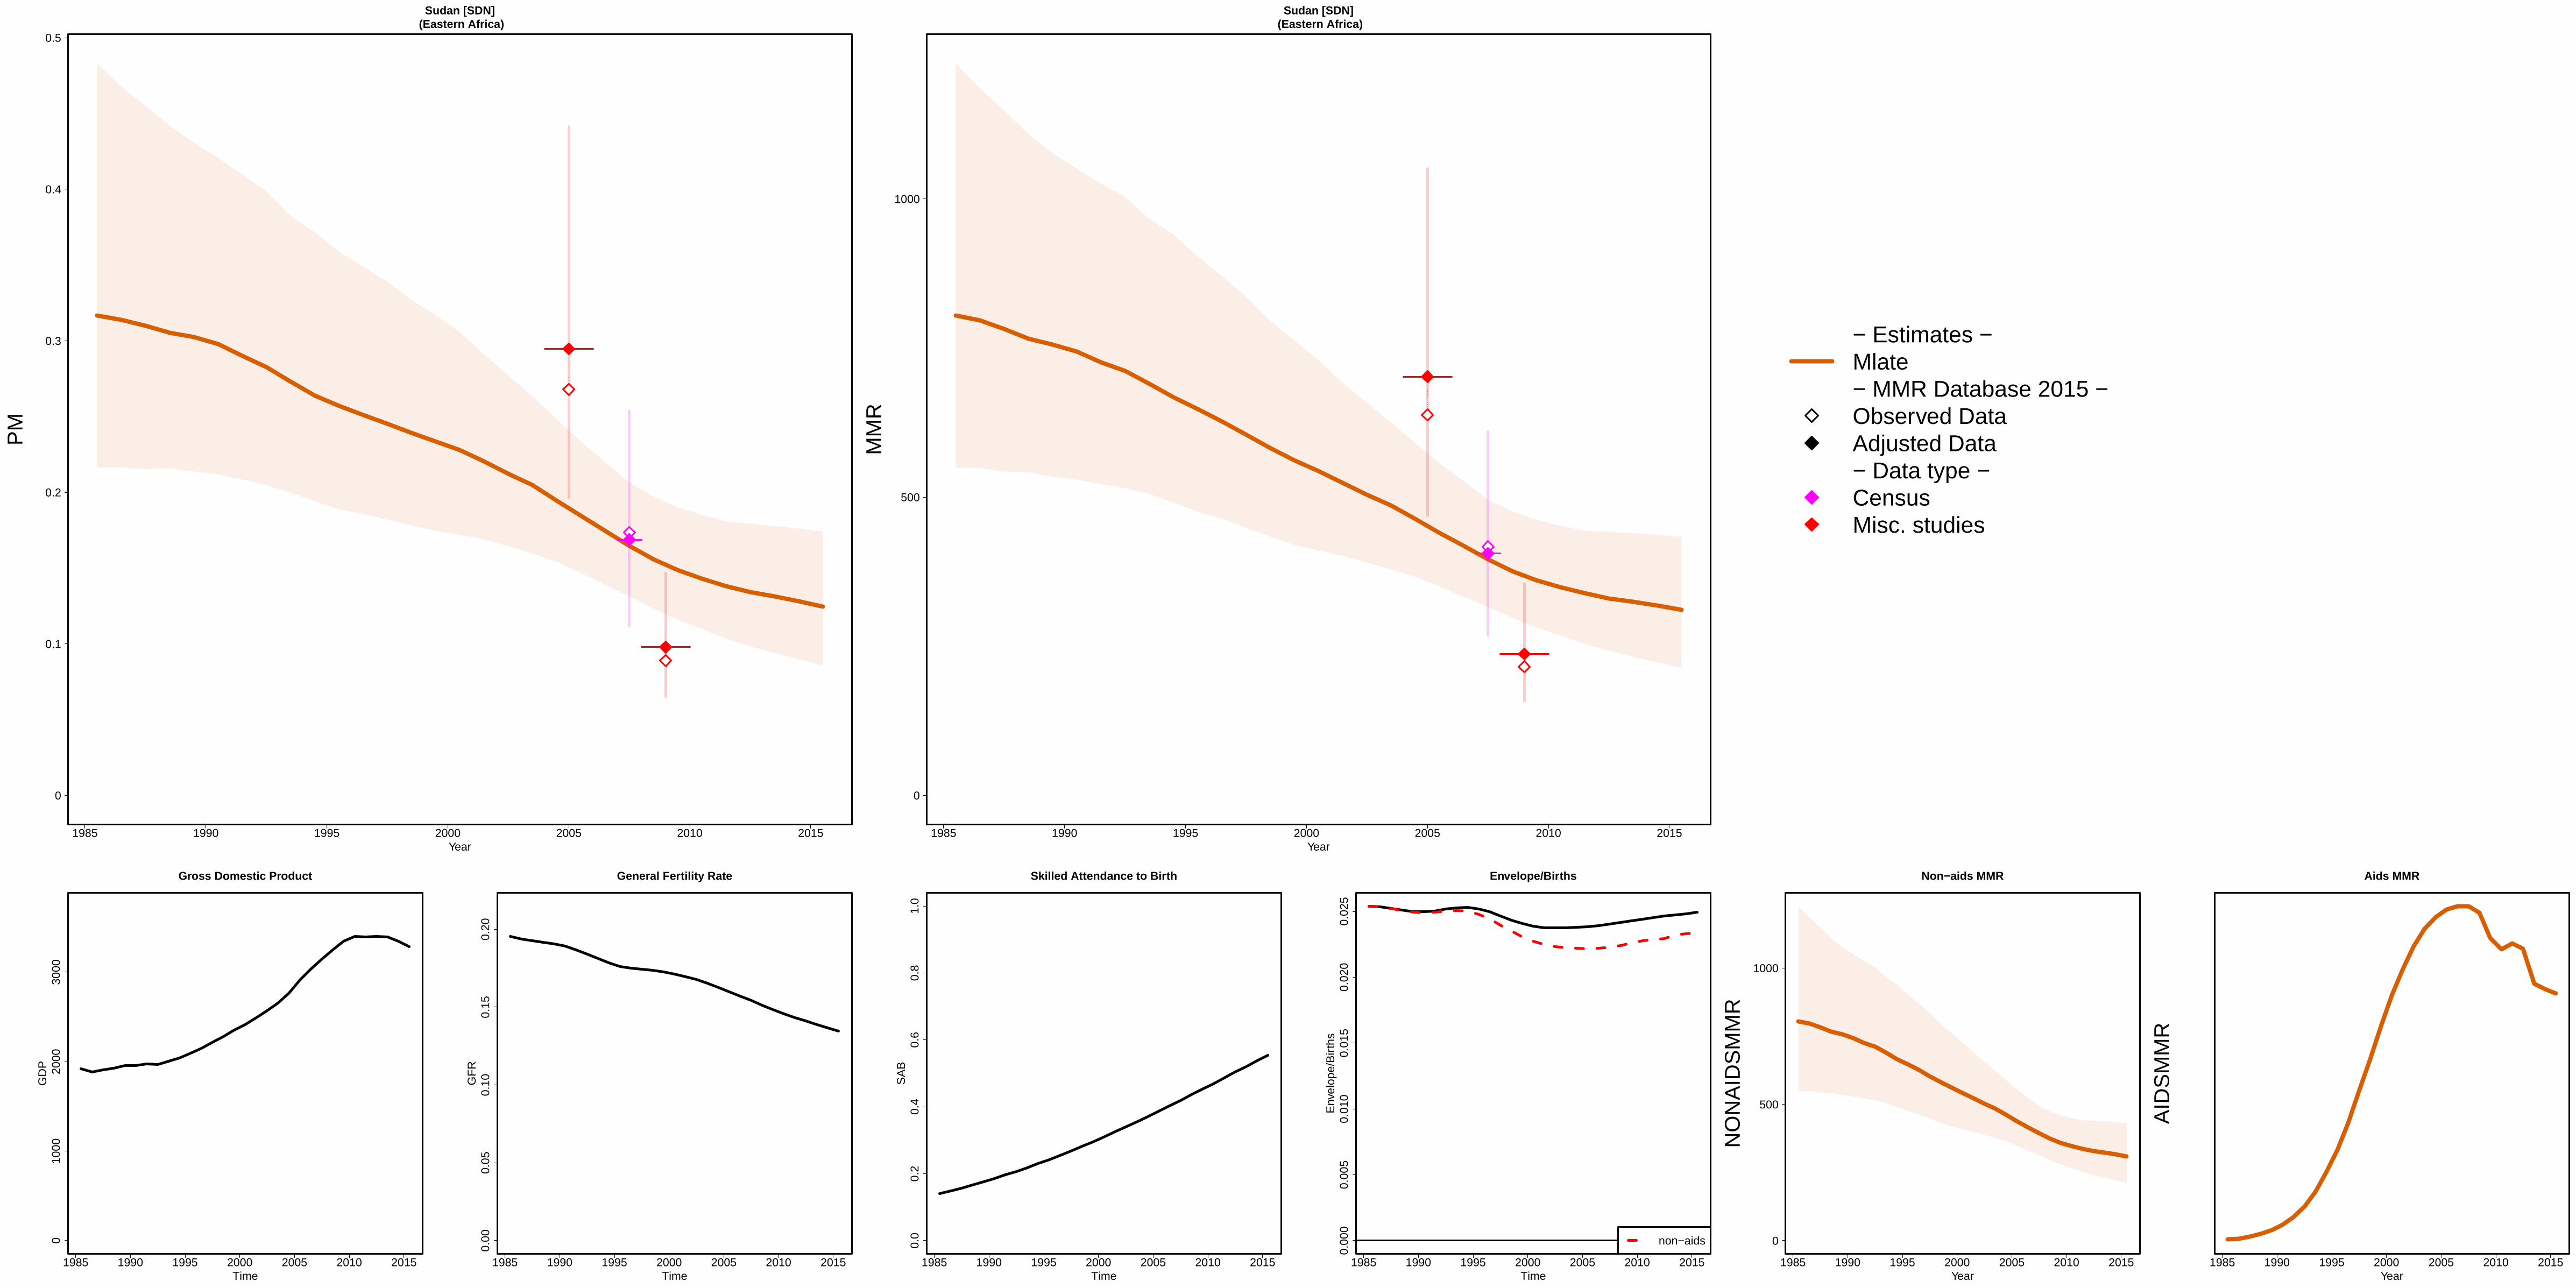
1985 1990 1995 2000 2005 2010 2015
Sudan [SDN] (Eastern Africa)
Year
0
0.1
0.2
0.3
0.4
0.5
PM
1985 1990 1995 2000 2005 2010 2015
Sudan [SDN] (Eastern Africa)
Year
0
500
1000
MM
R
− Estimates −Mlate− MMR Database 2015 −Observed DataAdjusted Data− Data type −CensusMisc. studies
1985 1990 1995 2000 2005 2010 2015
010
0020
0030
00
Gross Domestic Product
Time
GD
P
1985 1990 1995 2000 2005 2010 2015
0.00
0.05
0.10
0.15
0.20
General Fertility Rate
Time
GF
R
1985 1990 1995 2000 2005 2010 2015
0.0
0.2
0.4
0.6
0.8
1.0
Skilled Attendance to Birth
Time
SA
B
1985 1990 1995 2000 2005 2010 2015
0.00
00.
005
0.01
00.
015
0.02
00.
025
Envelope/Births
Time
Env
elop
e/B
irth
s
non−aids
1985 1990 1995 2000 2005 2010 2015
Non−aids MMR
Year
0
500
1000
NO
NA
IDS
MM
R
1985 1990 1995 2000 2005 2010 2015
Aids MMR
Year
AID
SM
MR

1985 1990 1995 2000 2005 2010 2015
Suriname [SUR] (South America)
Year
0
0.05
0.1
0.15
0.2
0.25
PM
1985 1990 1995 2000 2005 2010 2015
Suriname [SUR] (South America)
Year
0
100
200
300
400
500
600
700
MM
R
− Estimates −
Mlate
− MMR Database 2015 −
Observed Data
Adjusted Data
− Data type −
VR
Spec. studiesExcluded VR data (overlap with specialized study)
1985 1990 1995 2000 2005 2010 2015
050
0010
000
1500
0
Gross Domestic Product
Time
GD
P
1985 1990 1995 2000 2005 2010 2015
0.00
0.02
0.04
0.06
0.08
0.10
0.12
General Fertility Rate
Time
GF
R
1985 1990 1995 2000 2005 2010 2015
0.0
0.2
0.4
0.6
0.8
1.0
Skilled Attendance to Birth
Time
SA
B
1985 1990 1995 2000 2005 2010 2015
0.00
00.
005
0.01
00.
015
0.02
00.
025
0.03
0
Envelope/Births
Time
Env
elop
e/B
irth
s
non−aids
1985 1990 1995 2000 2005 2010 2015
Non−aids MMR
Year
0
50
100
150
200
250
300
NO
NA
IDS
MM
R
1985 1990 1995 2000 2005 2010 2015
Aids MMR
Year
AID
SM
MR

1985 1990 1995 2000 2005 2010 2015
Swaziland [SWZ] (Southern Africa)
Year
0
0.1
0.2
0.3
0.4
0.5
PM
1985 1990 1995 2000 2005 2010 2015
Swaziland [SWZ] (Southern Africa)
Year
0
500
1000
1500
MM
R
− Estimates −Mlate− MMR Database 2015 −Observed DataAdjusted Data− Data type −DHSCensus
1985 1990 1995 2000 2005 2010 2015
010
0020
0030
0040
0050
0060
0070
00
Gross Domestic Product
Time
GD
P
1985 1990 1995 2000 2005 2010 2015
0.00
0.05
0.10
0.15
0.20
General Fertility Rate
Time
GF
R
1985 1990 1995 2000 2005 2010 2015
0.0
0.2
0.4
0.6
0.8
1.0
Skilled Attendance to Birth
Time
SA
B
1985 1990 1995 2000 2005 2010 2015
0.00
0.05
0.10
0.15
Envelope/Births
Time
Env
elop
e/B
irth
s
non−aids
1985 1990 1995 2000 2005 2010 2015
Non−aids MMR
Year
0
500
1000
NO
NA
IDS
MM
R
1985 1990 1995 2000 2005 2010 2015
Aids MMR
Year
0
50
100
150
AID
SM
MR

1985 1990 1995 2000 2005 2010 2015
Sweden [SWE] (Developed regions)
Year
0
0.01
PM
1985 1990 1995 2000 2005 2010 2015
Sweden [SWE] (Developed regions)
Year
0
5
10
15
MM
R
− Estimates −
Mlate
− MMR Database 2015 −
Observed Data
Adjusted Data
− Data type −
VR
Spec. studiesExcluded VR data (overlap with specialized study)
1985 1990 1995 2000 2005 2010 2015
010
000
2000
030
000
4000
050
000
Gross Domestic Product
Time
GD
P
1985 1990 1995 2000 2005 2010 2015
0.00
0.01
0.02
0.03
0.04
0.05
0.06
General Fertility Rate
Time
GF
R
1985 1990 1995 2000 2005 2010 2015
0.0
0.2
0.4
0.6
0.8
1.0
Skilled Attendance to Birth
Time
SA
B
1985 1990 1995 2000 2005 2010 2015
0.00
00.
005
0.01
00.
015
Envelope/Births
Time
Env
elop
e/B
irth
s
non−aids
1985 1990 1995 2000 2005 2010 2015
Non−aids MMR
Year
NO
NA
IDS
MM
R
1985 1990 1995 2000 2005 2010 2015
Aids MMR
Year
0
0.05
0.1
0.15
0.2
AID
SM
MR
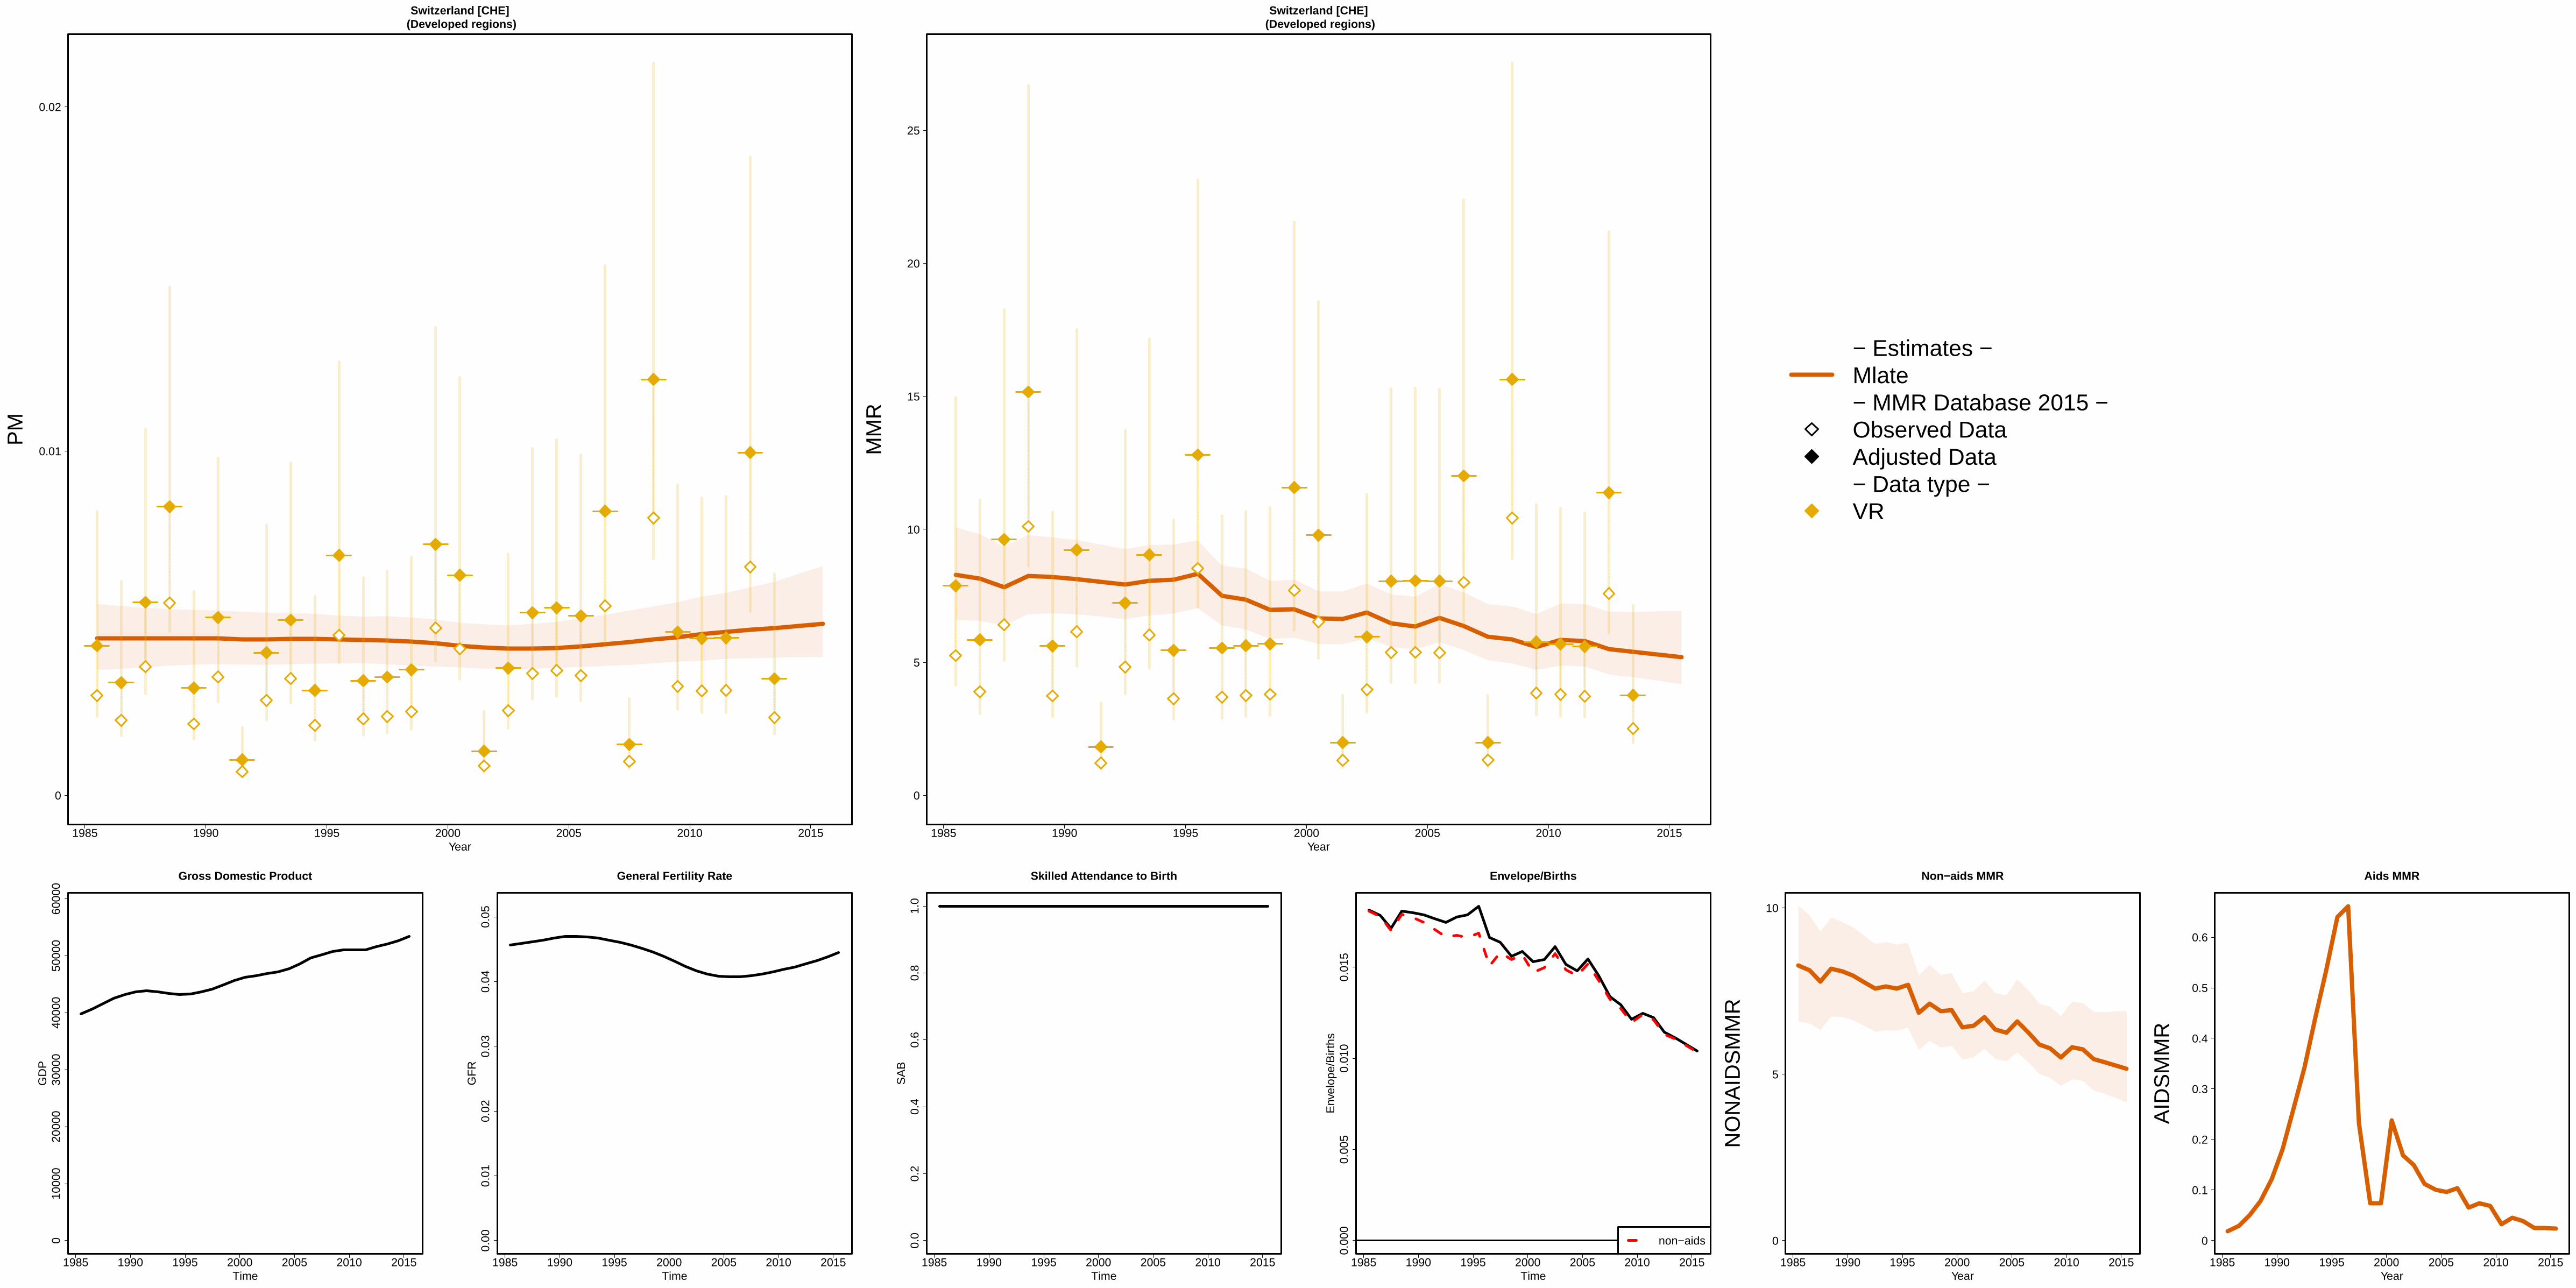
1985 1990 1995 2000 2005 2010 2015
Switzerland [CHE] (Developed regions)
Year
0
0.01
0.02
PM
1985 1990 1995 2000 2005 2010 2015
Switzerland [CHE] (Developed regions)
Year
0
5
10
15
20
25
MM
R
− Estimates −Mlate− MMR Database 2015 −Observed DataAdjusted Data− Data type −VR
1985 1990 1995 2000 2005 2010 2015
010
000
2000
030
000
4000
050
000
6000
0
Gross Domestic Product
Time
GD
P
1985 1990 1995 2000 2005 2010 2015
0.00
0.01
0.02
0.03
0.04
0.05
General Fertility Rate
Time
GF
R
1985 1990 1995 2000 2005 2010 2015
0.0
0.2
0.4
0.6
0.8
1.0
Skilled Attendance to Birth
Time
SA
B
1985 1990 1995 2000 2005 2010 2015
0.00
00.
005
0.01
00.
015
Envelope/Births
Time
Env
elop
e/B
irth
s
non−aids
1985 1990 1995 2000 2005 2010 2015
Non−aids MMR
Year
0
5
10
NO
NA
IDS
MM
R
1985 1990 1995 2000 2005 2010 2015
Aids MMR
Year
0
0.1
0.2
0.3
0.4
0.5
0.6
AID
SM
MR

1985 1990 1995 2000 2005 2010 2015
Syrian Arab Republic [SYR] (Western Asia)
Year
0
0.05
0.1
0.15
0.2
0.25
PM
●
1985 1990 1995 2000 2005 2010 2015
Syrian Arab Republic [SYR] (Western Asia)
Year
0
50
100
150
200
250
MM
R
●
●
− Estimates −
Mlate
− MMR Database 2015 −
Observed Data
Adjusted Data
− Data type −
Misc. studiesExcluded VR data (data quality issues)
1985 1990 1995 2000 2005 2010 2015
020
0040
0060
0080
00
Gross Domestic Product
Time
GD
P
1985 1990 1995 2000 2005 2010 2015
0.00
0.05
0.10
0.15
0.20
General Fertility Rate
Time
GF
R
1985 1990 1995 2000 2005 2010 2015
0.0
0.2
0.4
0.6
0.8
1.0
Skilled Attendance to Birth
Time
SA
B
1985 1990 1995 2000 2005 2010 2015
0.00
00.
002
0.00
40.
006
0.00
80.
010
Envelope/Births
Time
Env
elop
e/B
irth
s
non−aids
1985 1990 1995 2000 2005 2010 2015
Non−aids MMR
Year
0
50
100
150
200
250
NO
NA
IDS
MM
R
1985 1990 1995 2000 2005 2010 2015
Aids MMR
Year
00.010.02
AID
SM
MR
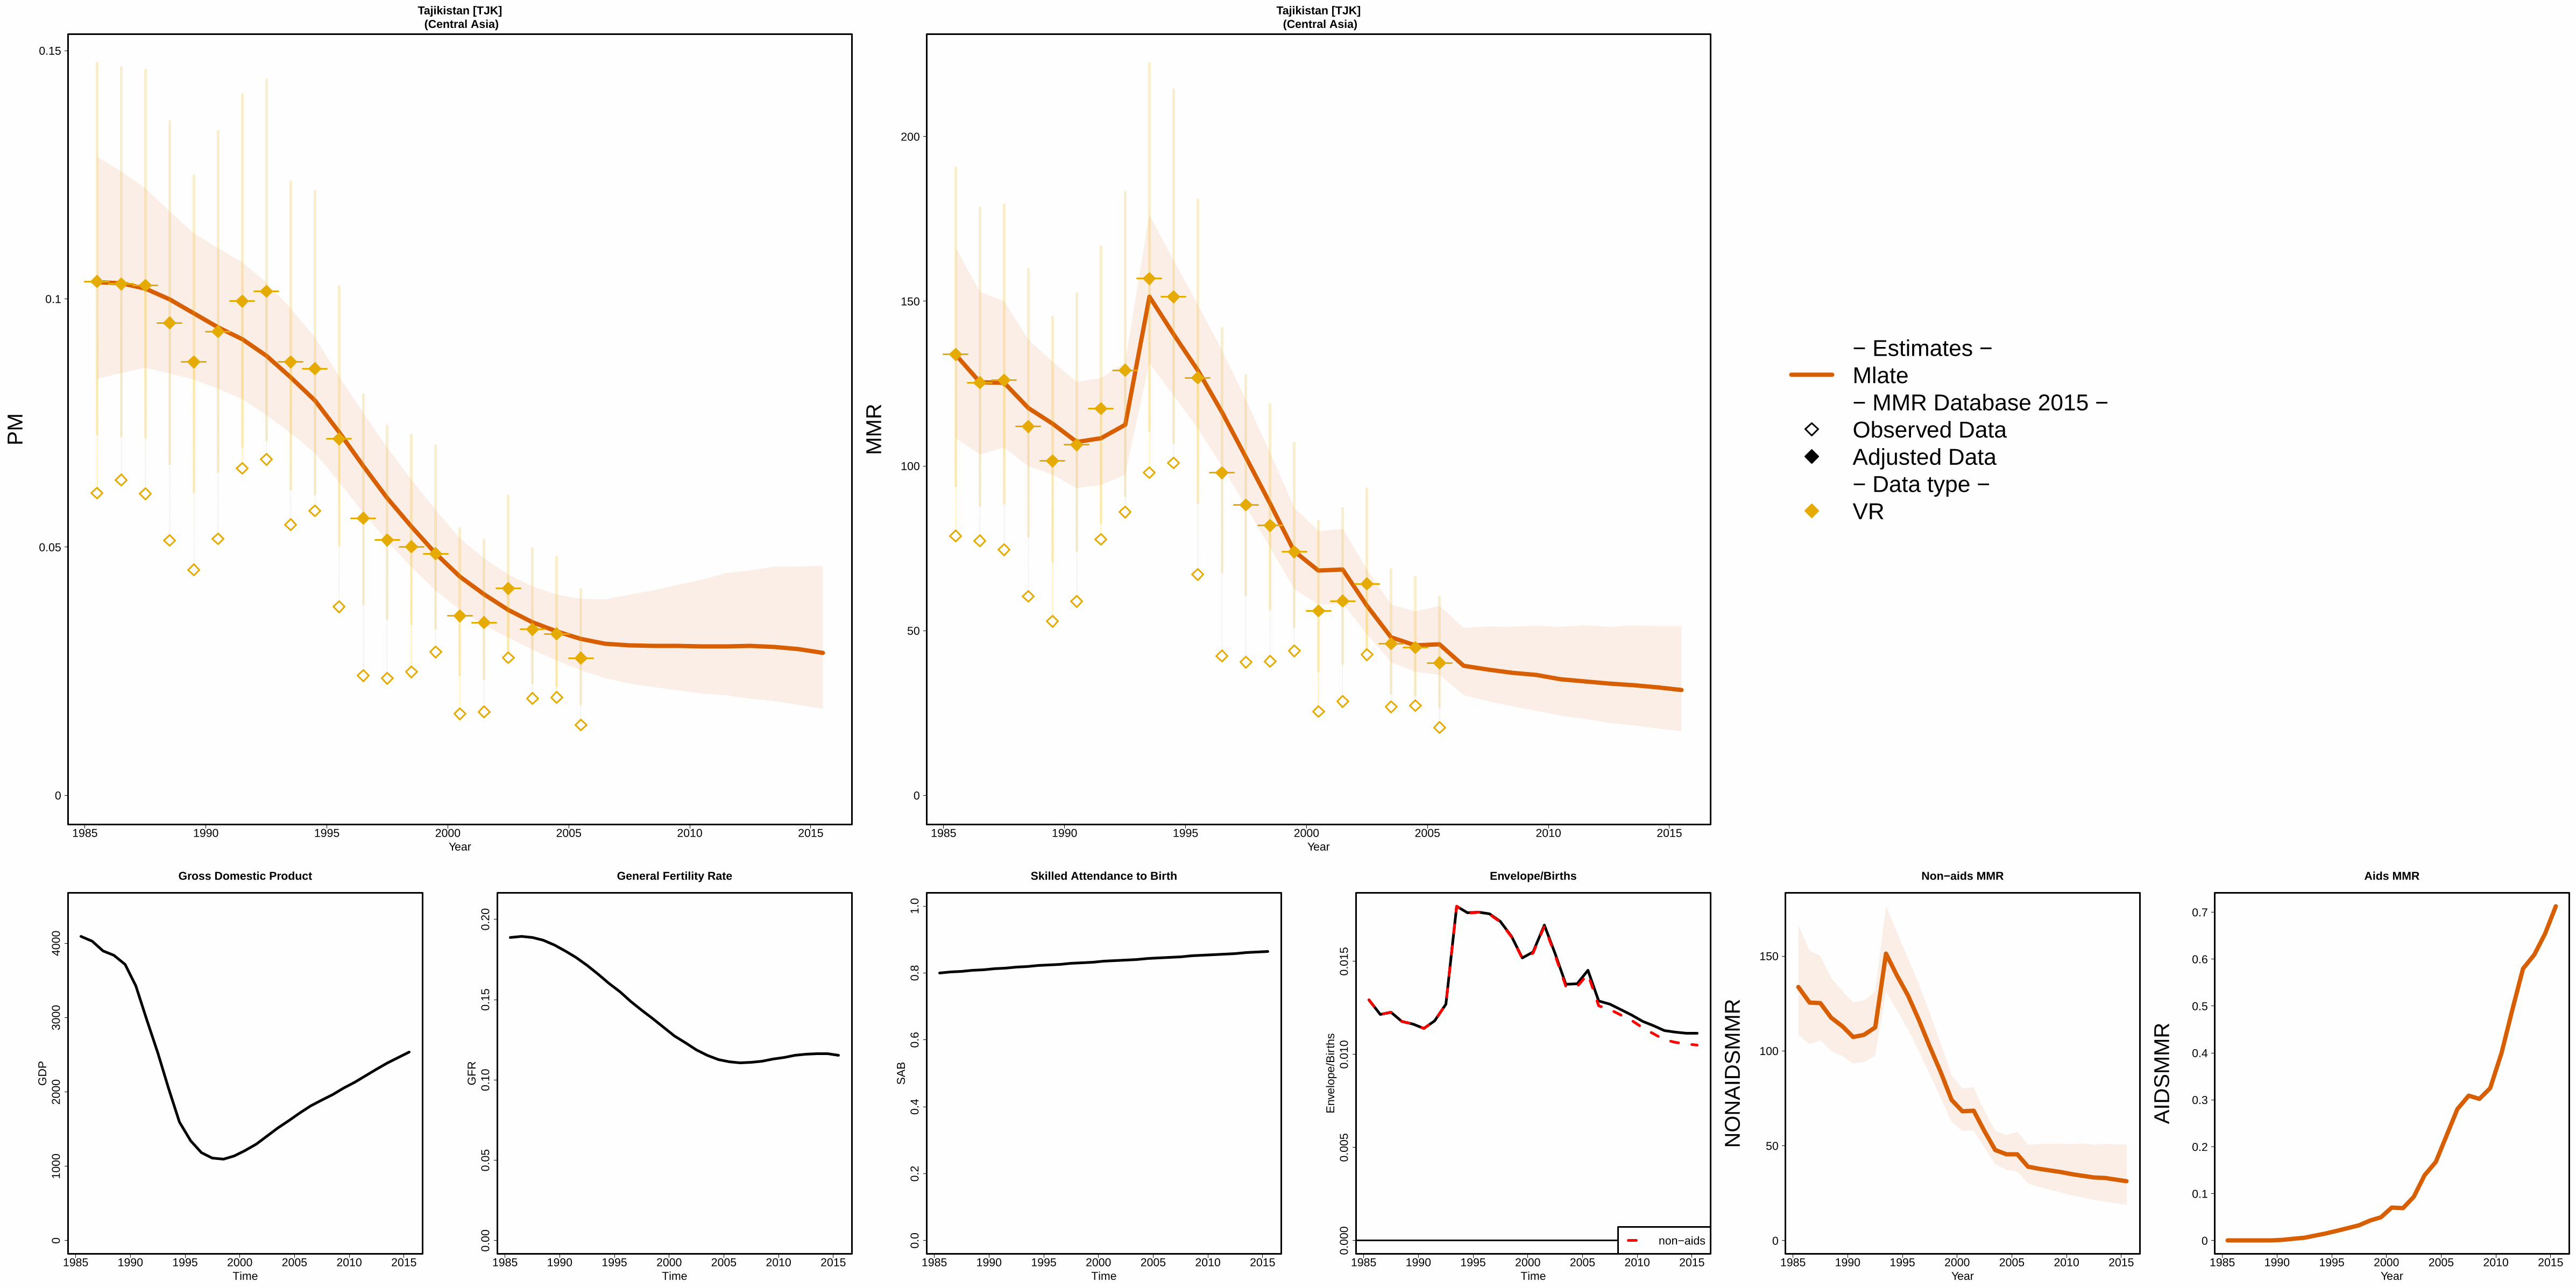
1985 1990 1995 2000 2005 2010 2015
Tajikistan [TJK] (Central Asia)
Year
0
0.05
0.1
0.15
PM
1985 1990 1995 2000 2005 2010 2015
Tajikistan [TJK] (Central Asia)
Year
0
50
100
150
200
MM
R
− Estimates −Mlate− MMR Database 2015 −Observed DataAdjusted Data− Data type −VR
1985 1990 1995 2000 2005 2010 2015
010
0020
0030
0040
00
Gross Domestic Product
Time
GD
P
1985 1990 1995 2000 2005 2010 2015
0.00
0.05
0.10
0.15
0.20
General Fertility Rate
Time
GF
R
1985 1990 1995 2000 2005 2010 2015
0.0
0.2
0.4
0.6
0.8
1.0
Skilled Attendance to Birth
Time
SA
B
1985 1990 1995 2000 2005 2010 2015
0.00
00.
005
0.01
00.
015
Envelope/Births
Time
Env
elop
e/B
irth
s
non−aids
1985 1990 1995 2000 2005 2010 2015
Non−aids MMR
Year
0
50
100
150
NO
NA
IDS
MM
R
1985 1990 1995 2000 2005 2010 2015
Aids MMR
Year
0
0.1
0.2
0.3
0.4
0.5
0.6
0.7
AID
SM
MR
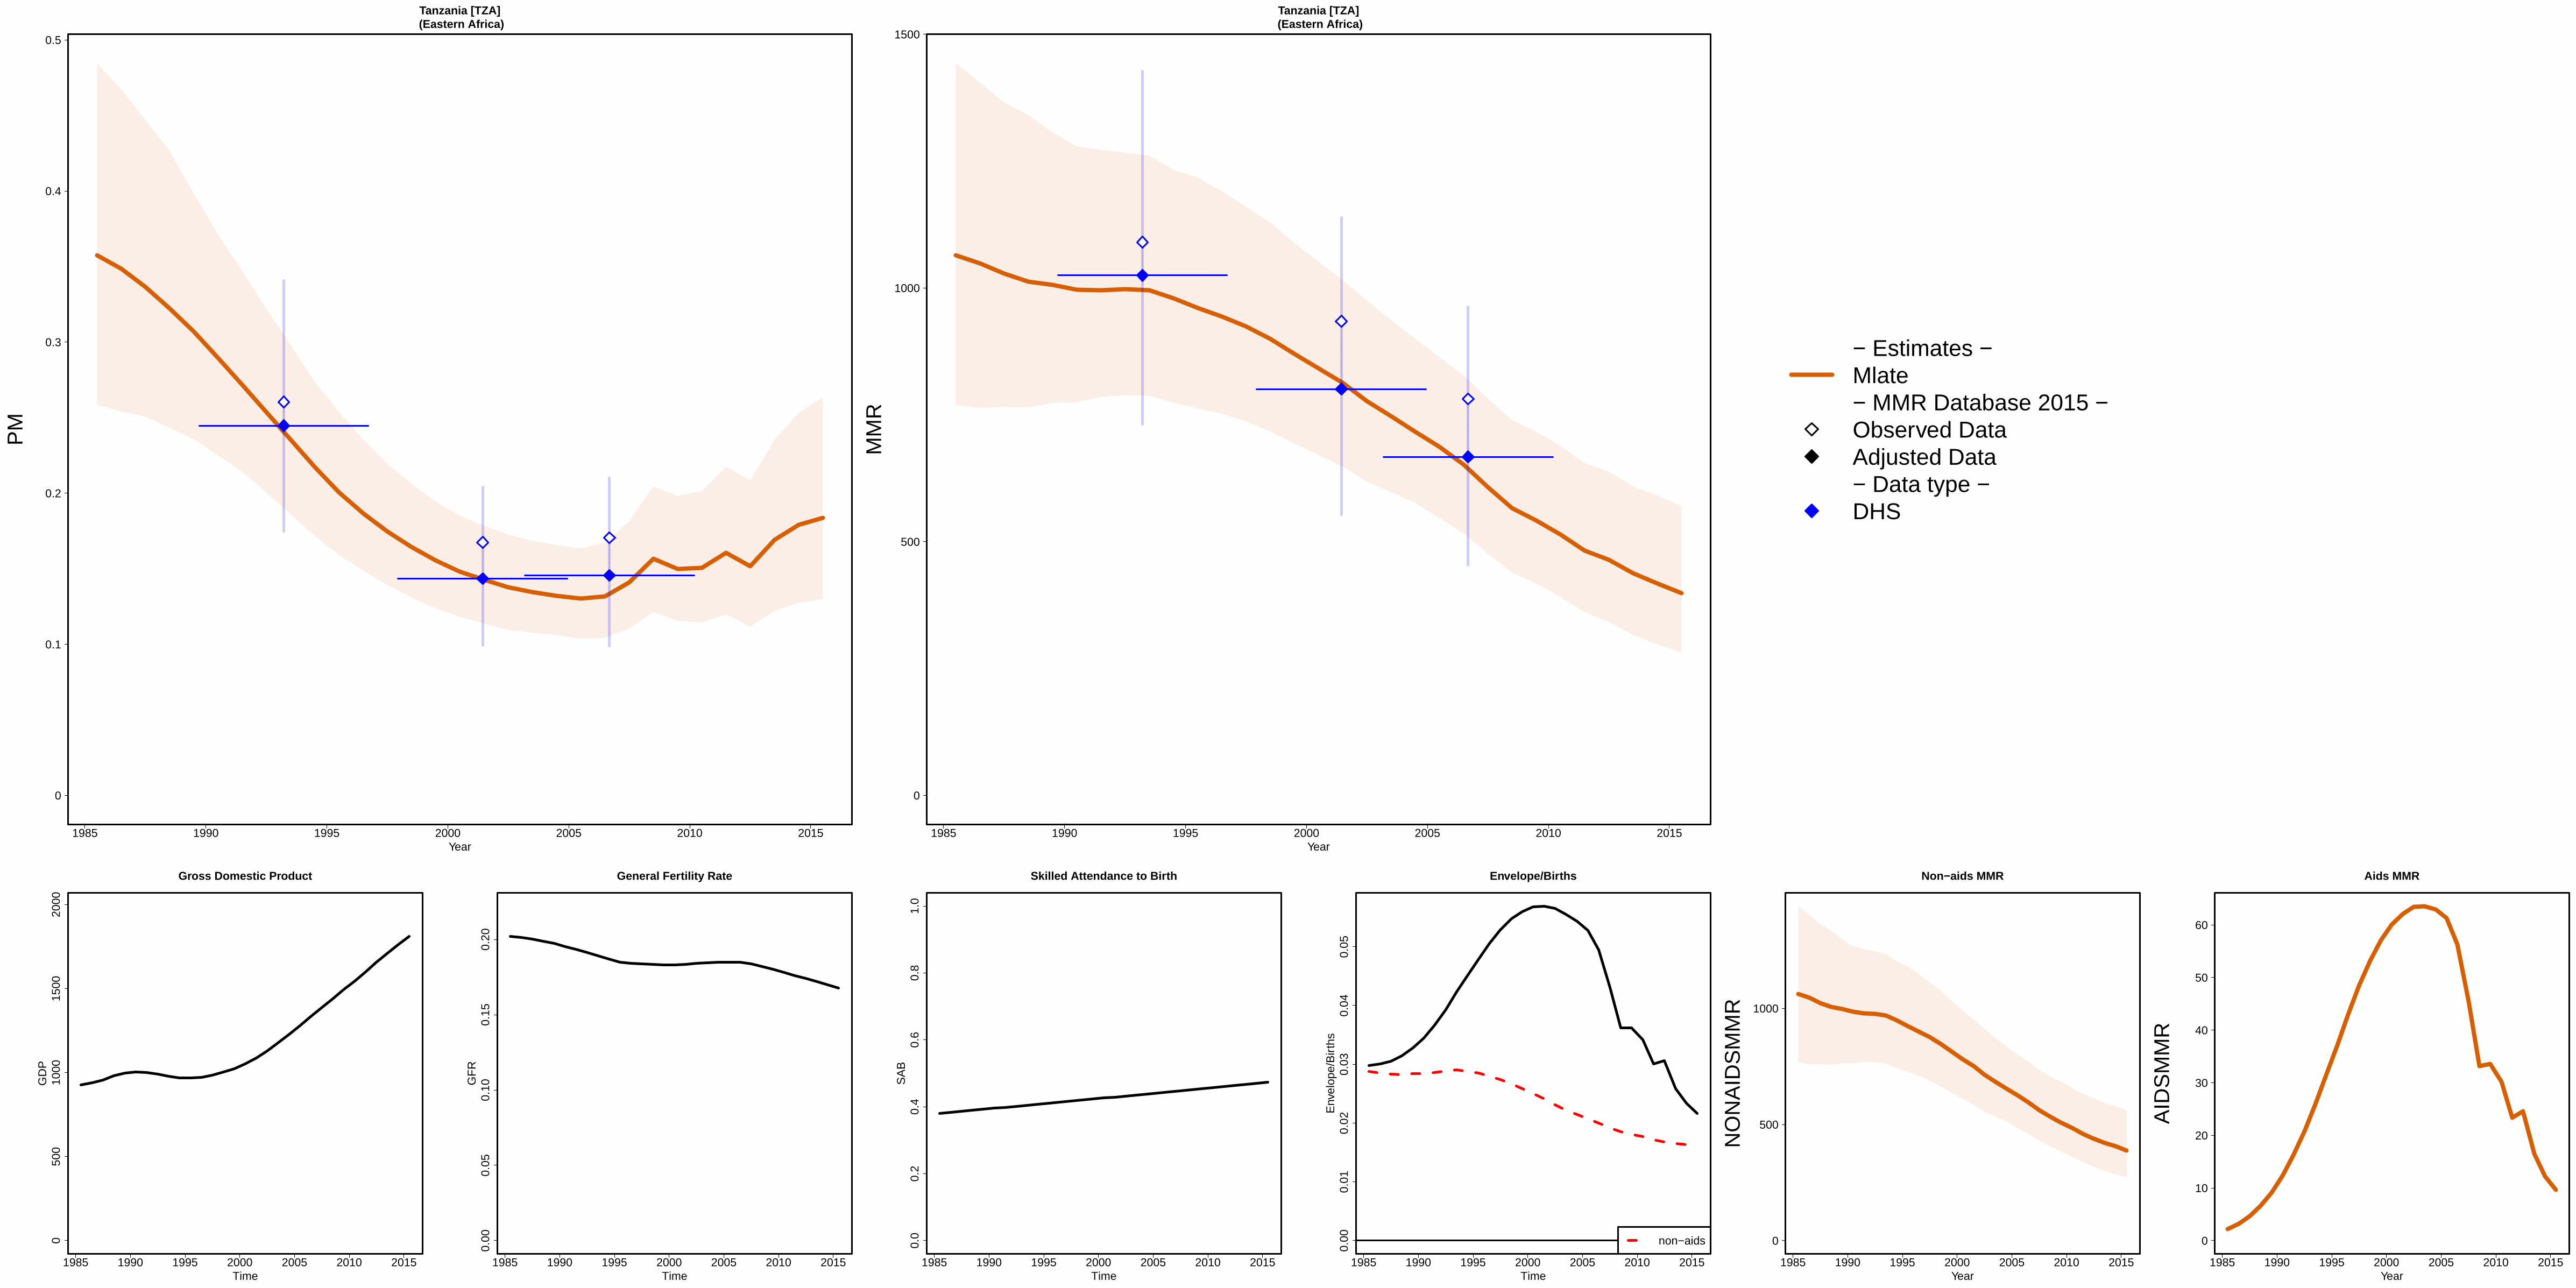
1985 1990 1995 2000 2005 2010 2015
Tanzania [TZA] (Eastern Africa)
Year
0
0.1
0.2
0.3
0.4
0.5
PM
1985 1990 1995 2000 2005 2010 2015
Tanzania [TZA] (Eastern Africa)
Year
0
500
1000
1500
MM
R
− Estimates −Mlate− MMR Database 2015 −Observed DataAdjusted Data− Data type −DHS
1985 1990 1995 2000 2005 2010 2015
050
010
0015
0020
00
Gross Domestic Product
Time
GD
P
1985 1990 1995 2000 2005 2010 2015
0.00
0.05
0.10
0.15
0.20
General Fertility Rate
Time
GF
R
1985 1990 1995 2000 2005 2010 2015
0.0
0.2
0.4
0.6
0.8
1.0
Skilled Attendance to Birth
Time
SA
B
1985 1990 1995 2000 2005 2010 2015
0.00
0.01
0.02
0.03
0.04
0.05
Envelope/Births
Time
Env
elop
e/B
irth
s
non−aids
1985 1990 1995 2000 2005 2010 2015
Non−aids MMR
Year
0
500
1000
NO
NA
IDS
MM
R
1985 1990 1995 2000 2005 2010 2015
Aids MMR
Year
0
10
20
30
40
50
60
AID
SM
MR

1985 1990 1995 2000 2005 2010 2015
TFYR Macedonia [MKD] (Transition countries of South−Eastern Europe)
Year
0
0.01
0.02
PM
1985 1990 1995 2000 2005 2010 2015
TFYR Macedonia [MKD] (Transition countries of South−Eastern Europe)
Year
0
10
20
30
40
MM
R
− Estimates −
Mlate
− MMR Database 2015 −
Observed Data
Adjusted Data
− Data type −
VRReported VR before recalc.(related to 0 obs. mat. death)
1985 1990 1995 2000 2005 2010 2015
020
0040
0060
0080
0010
000
1200
014
000 Gross Domestic Product
Time
GD
P
1985 1990 1995 2000 2005 2010 2015
0.00
0.02
0.04
0.06
0.08
General Fertility Rate
Time
GF
R
1985 1990 1995 2000 2005 2010 2015
0.0
0.2
0.4
0.6
0.8
1.0
Skilled Attendance to Birth
Time
SA
B
1985 1990 1995 2000 2005 2010 2015
0.00
00.
005
0.01
00.
015
0.02
0
Envelope/Births
Time
Env
elop
e/B
irth
s
non−aids
1985 1990 1995 2000 2005 2010 2015
Non−aids MMR
Year
0
5
10
15
20
NO
NA
IDS
MM
R
1985 1990 1995 2000 2005 2010 2015
Aids MMR
Year
0
0.01
0.02
0.03
0.04
AID
SM
MR

1985 1990 1995 2000 2005 2010 2015
Thailand [THA] (South−Eastern Asia / Oceania)
Year
0
0.01
0.02
0.03
0.04
PM
1985 1990 1995 2000 2005 2010 2015
Thailand [THA] (South−Eastern Asia / Oceania)
Year
0
50
100
MM
R
− Estimates −Mlate− MMR Database 2015 −Observed DataAdjusted Data− Data type −VRMisc. studies
1985 1990 1995 2000 2005 2010 2015
050
0010
000
1500
0
Gross Domestic Product
Time
GD
P
1985 1990 1995 2000 2005 2010 2015
0.00
0.02
0.04
0.06
0.08
General Fertility Rate
Time
GF
R
1985 1990 1995 2000 2005 2010 2015
0.0
0.2
0.4
0.6
0.8
1.0
Skilled Attendance to Birth
Time
SA
B
1985 1990 1995 2000 2005 2010 2015
0.00
0.01
0.02
0.03
0.04
Envelope/Births
Time
Env
elop
e/B
irth
s
non−aids
1985 1990 1995 2000 2005 2010 2015
Non−aids MMR
Year
0
10
20
30
40
50
60
70
80
90
NO
NA
IDS
MM
R
1985 1990 1995 2000 2005 2010 2015
Aids MMR
Year
AID
SM
MR

1985 1990 1995 2000 2005 2010 2015
Timor−Leste [TLS] (South−Eastern Asia / Oceania)
Year
0
0.1
0.2
0.3
0.4
0.5
PM
1985 1990 1995 2000 2005 2010 2015
Timor−Leste [TLS] (South−Eastern Asia / Oceania)
Year
0
500
1000
1500
2000
MM
R
− Estimates −Mlate− MMR Database 2015 −Observed DataAdjusted Data− Data type −DHSCensus
1985 1990 1995 2000 2005 2010 2015
050
010
0015
0020
0025
00
Gross Domestic Product
Time
GD
P
1985 1990 1995 2000 2005 2010 2015
0.00
0.05
0.10
0.15
0.20
0.25
General Fertility Rate
Time
GF
R
1985 1990 1995 2000 2005 2010 2015
0.0
0.2
0.4
0.6
0.8
1.0
Skilled Attendance to Birth
Time
SA
B
1985 1990 1995 2000 2005 2010 2015
0.00
0.01
0.02
0.03
0.04
0.05
Envelope/Births
Time
Env
elop
e/B
irth
s
non−aids
1985 1990 1995 2000 2005 2010 2015
Non−aids MMR
Year
0
500
1000
1500
2000
NO
NA
IDS
MM
R
1985 1990 1995 2000 2005 2010 2015
Aids MMR
Year
00.010.02
AID
SM
MR

1985 1990 1995 2000 2005 2010 2015
Togo [TGO] (Western Africa)
Year
0
0.05
0.1
0.15
0.2
0.25
0.3
0.35
0.4
PM
1985 1990 1995 2000 2005 2010 2015
Togo [TGO] (Western Africa)
Year
0
100
200
300
400
500
600
700
800
900
MM
R
− Estimates −Mlate− MMR Database 2015 −Observed DataAdjusted Data− Data type −DHSMisc. studies
1985 1990 1995 2000 2005 2010 2015
050
010
0015
00
Gross Domestic Product
Time
GD
P
1985 1990 1995 2000 2005 2010 2015
0.00
0.05
0.10
0.15
0.20
General Fertility Rate
Time
GF
R
1985 1990 1995 2000 2005 2010 2015
0.0
0.2
0.4
0.6
0.8
1.0
Skilled Attendance to Birth
Time
SA
B
1985 1990 1995 2000 2005 2010 2015
0.00
0.01
0.02
0.03
0.04
Envelope/Births
Time
Env
elop
e/B
irth
s
non−aids
1985 1990 1995 2000 2005 2010 2015
Non−aids MMR
Year
0
100
200
300
400
500
600
700
800
900
NO
NA
IDS
MM
R
1985 1990 1995 2000 2005 2010 2015
Aids MMR
Year
0
5
10
15
20
25
30
AID
SM
MR

1985 1990 1995 2000 2005 2010 2015
Tonga [TON] (South−Eastern Asia / Oceania)
Year
0
0.05
0.1
0.15
PM
1985 1990 1995 2000 2005 2010 2015
Tonga [TON] (South−Eastern Asia / Oceania)
Year
0
50
100
150
200
250
MM
R − Estimates −Mlate− MMR Database 2015 −
1985 1990 1995 2000 2005 2010 2015
010
0020
0030
0040
0050
0060
00
Gross Domestic Product
Time
GD
P
1985 1990 1995 2000 2005 2010 2015
0.00
0.05
0.10
0.15
General Fertility Rate
Time
GF
R
1985 1990 1995 2000 2005 2010 2015
0.0
0.2
0.4
0.6
0.8
1.0
Skilled Attendance to Birth
Time
SA
B
1985 1990 1995 2000 2005 2010 2015
0.00
00.
005
0.01
00.
015
0.02
0
Envelope/Births
Time
Env
elop
e/B
irth
s
non−aids
1985 1990 1995 2000 2005 2010 2015
Non−aids MMR
Year
0
50
100
150
200
250
NO
NA
IDS
MM
R
1985 1990 1995 2000 2005 2010 2015
Aids MMR
Year
00.010.02
AID
SM
MR

1985 1990 1995 2000 2005 2010 2015
Trinidad and Tobago [TTO] (Caribbean)
Year
0
0.05
0.1
PM
1985 1990 1995 2000 2005 2010 2015
Trinidad and Tobago [TTO] (Caribbean)
Year
0
50
100
150
200
MM
R
− Estimates −Mlate− MMR Database 2015 −Observed DataAdjusted Data− Data type −VR
1985 1990 1995 2000 2005 2010 2015
050
0010
000
1500
020
000
2500
030
000
Gross Domestic Product
Time
GD
P
1985 1990 1995 2000 2005 2010 2015
0.00
0.02
0.04
0.06
0.08
0.10
General Fertility Rate
Time
GF
R
1985 1990 1995 2000 2005 2010 2015
0.0
0.2
0.4
0.6
0.8
1.0
Skilled Attendance to Birth
Time
SA
B
1985 1990 1995 2000 2005 2010 2015
0.00
00.
005
0.01
00.
015
0.02
00.
025
0.03
0
Envelope/Births
Time
Env
elop
e/B
irth
s
non−aids
1985 1990 1995 2000 2005 2010 2015
Non−aids MMR
Year
0
50
100
NO
NA
IDS
MM
R
1985 1990 1995 2000 2005 2010 2015
Aids MMR
Year
AID
SM
MR

1985 1990 1995 2000 2005 2010 2015
Tunisia [TUN] (Northern Africa)
Year
0
0.05
0.1
0.15
0.2
PM
●
●
1985 1990 1995 2000 2005 2010 2015
Tunisia [TUN] (Northern Africa)
Year
0
50
100
150
200
MM
R
●
●
●
− Estimates −
Mlate
− MMR Database 2015 −
Observed Data
Adjusted Data
− Data type −
Misc. studiesExcluded VR data (data quality issues)
1985 1990 1995 2000 2005 2010 2015
020
0040
0060
0080
0010
000
1200
0
Gross Domestic Product
Time
GD
P
1985 1990 1995 2000 2005 2010 2015
0.00
0.05
0.10
0.15
General Fertility Rate
Time
GF
R
1985 1990 1995 2000 2005 2010 2015
0.0
0.2
0.4
0.6
0.8
1.0
Skilled Attendance to Birth
Time
SA
B
1985 1990 1995 2000 2005 2010 2015
0.00
00.
005
0.01
00.
015
Envelope/Births
Time
Env
elop
e/B
irth
s
non−aids
1985 1990 1995 2000 2005 2010 2015
Non−aids MMR
Year
0
50
100
150
200
NO
NA
IDS
MM
R
1985 1990 1995 2000 2005 2010 2015
Aids MMR
Year
0
0.02
0.04
0.06
0.08
AID
SM
MR

1985 1990 1995 2000 2005 2010 2015
Turkey [TUR] (Western Asia)
Year
0
0.05
0.1
PM
● ●● ●
●
1985 1990 1995 2000 2005 2010 2015
Turkey [TUR] (Western Asia)
Year
0
50
100
150
200
MM
R
● ●● ●
●●
− Estimates −
Mlate
− MMR Database 2015 −
Observed Data
Adjusted Data
− Data type −
Spec. studies
Misc. studiesExcluded VR data (data quality issues)
1985 1990 1995 2000 2005 2010 2015
050
0010
000
1500
020
000
Gross Domestic Product
Time
GD
P
1985 1990 1995 2000 2005 2010 2015
0.00
0.02
0.04
0.06
0.08
0.10
0.12
0.14
General Fertility Rate
Time
GF
R
1985 1990 1995 2000 2005 2010 2015
0.0
0.2
0.4
0.6
0.8
1.0
Skilled Attendance to Birth
Time
SA
B
1985 1990 1995 2000 2005 2010 2015
0.00
00.
005
0.01
00.
015
Envelope/Births
Time
Env
elop
e/B
irth
s
non−aids
1985 1990 1995 2000 2005 2010 2015
Non−aids MMR
Year
0
50
100
150
200
NO
NA
IDS
MM
R
1985 1990 1995 2000 2005 2010 2015
Aids MMR
Year
0
0.01
AID
SM
MR

1985 1990 1995 2000 2005 2010 2015
Turkmenistan [TKM] (Central Asia)
Year
0
0.05
0.1
PM
●
1985 1990 1995 2000 2005 2010 2015
Turkmenistan [TKM] (Central Asia)
Year
0
50
100
150
MM
R
●
●
− Estimates −
Mlate
− MMR Database 2015 −
Observed Data
Adjusted Data
− Data type −
VRExcluded VR data (data quality issues)
1985 1990 1995 2000 2005 2010 2015
050
0010
000
1500
0
Gross Domestic Product
Time
GD
P
1985 1990 1995 2000 2005 2010 2015
0.00
0.05
0.10
0.15
General Fertility Rate
Time
GF
R
1985 1990 1995 2000 2005 2010 2015
0.0
0.2
0.4
0.6
0.8
1.0
Skilled Attendance to Birth
Time
SA
B
1985 1990 1995 2000 2005 2010 2015
0.00
00.
005
0.01
00.
015
0.02
00.
025
0.03
0
Envelope/Births
Time
Env
elop
e/B
irth
s
non−aids
1985 1990 1995 2000 2005 2010 2015
Non−aids MMR
Year
0
50
100
NO
NA
IDS
MM
R
1985 1990 1995 2000 2005 2010 2015
Aids MMR
Year
00.010.02
AID
SM
MR
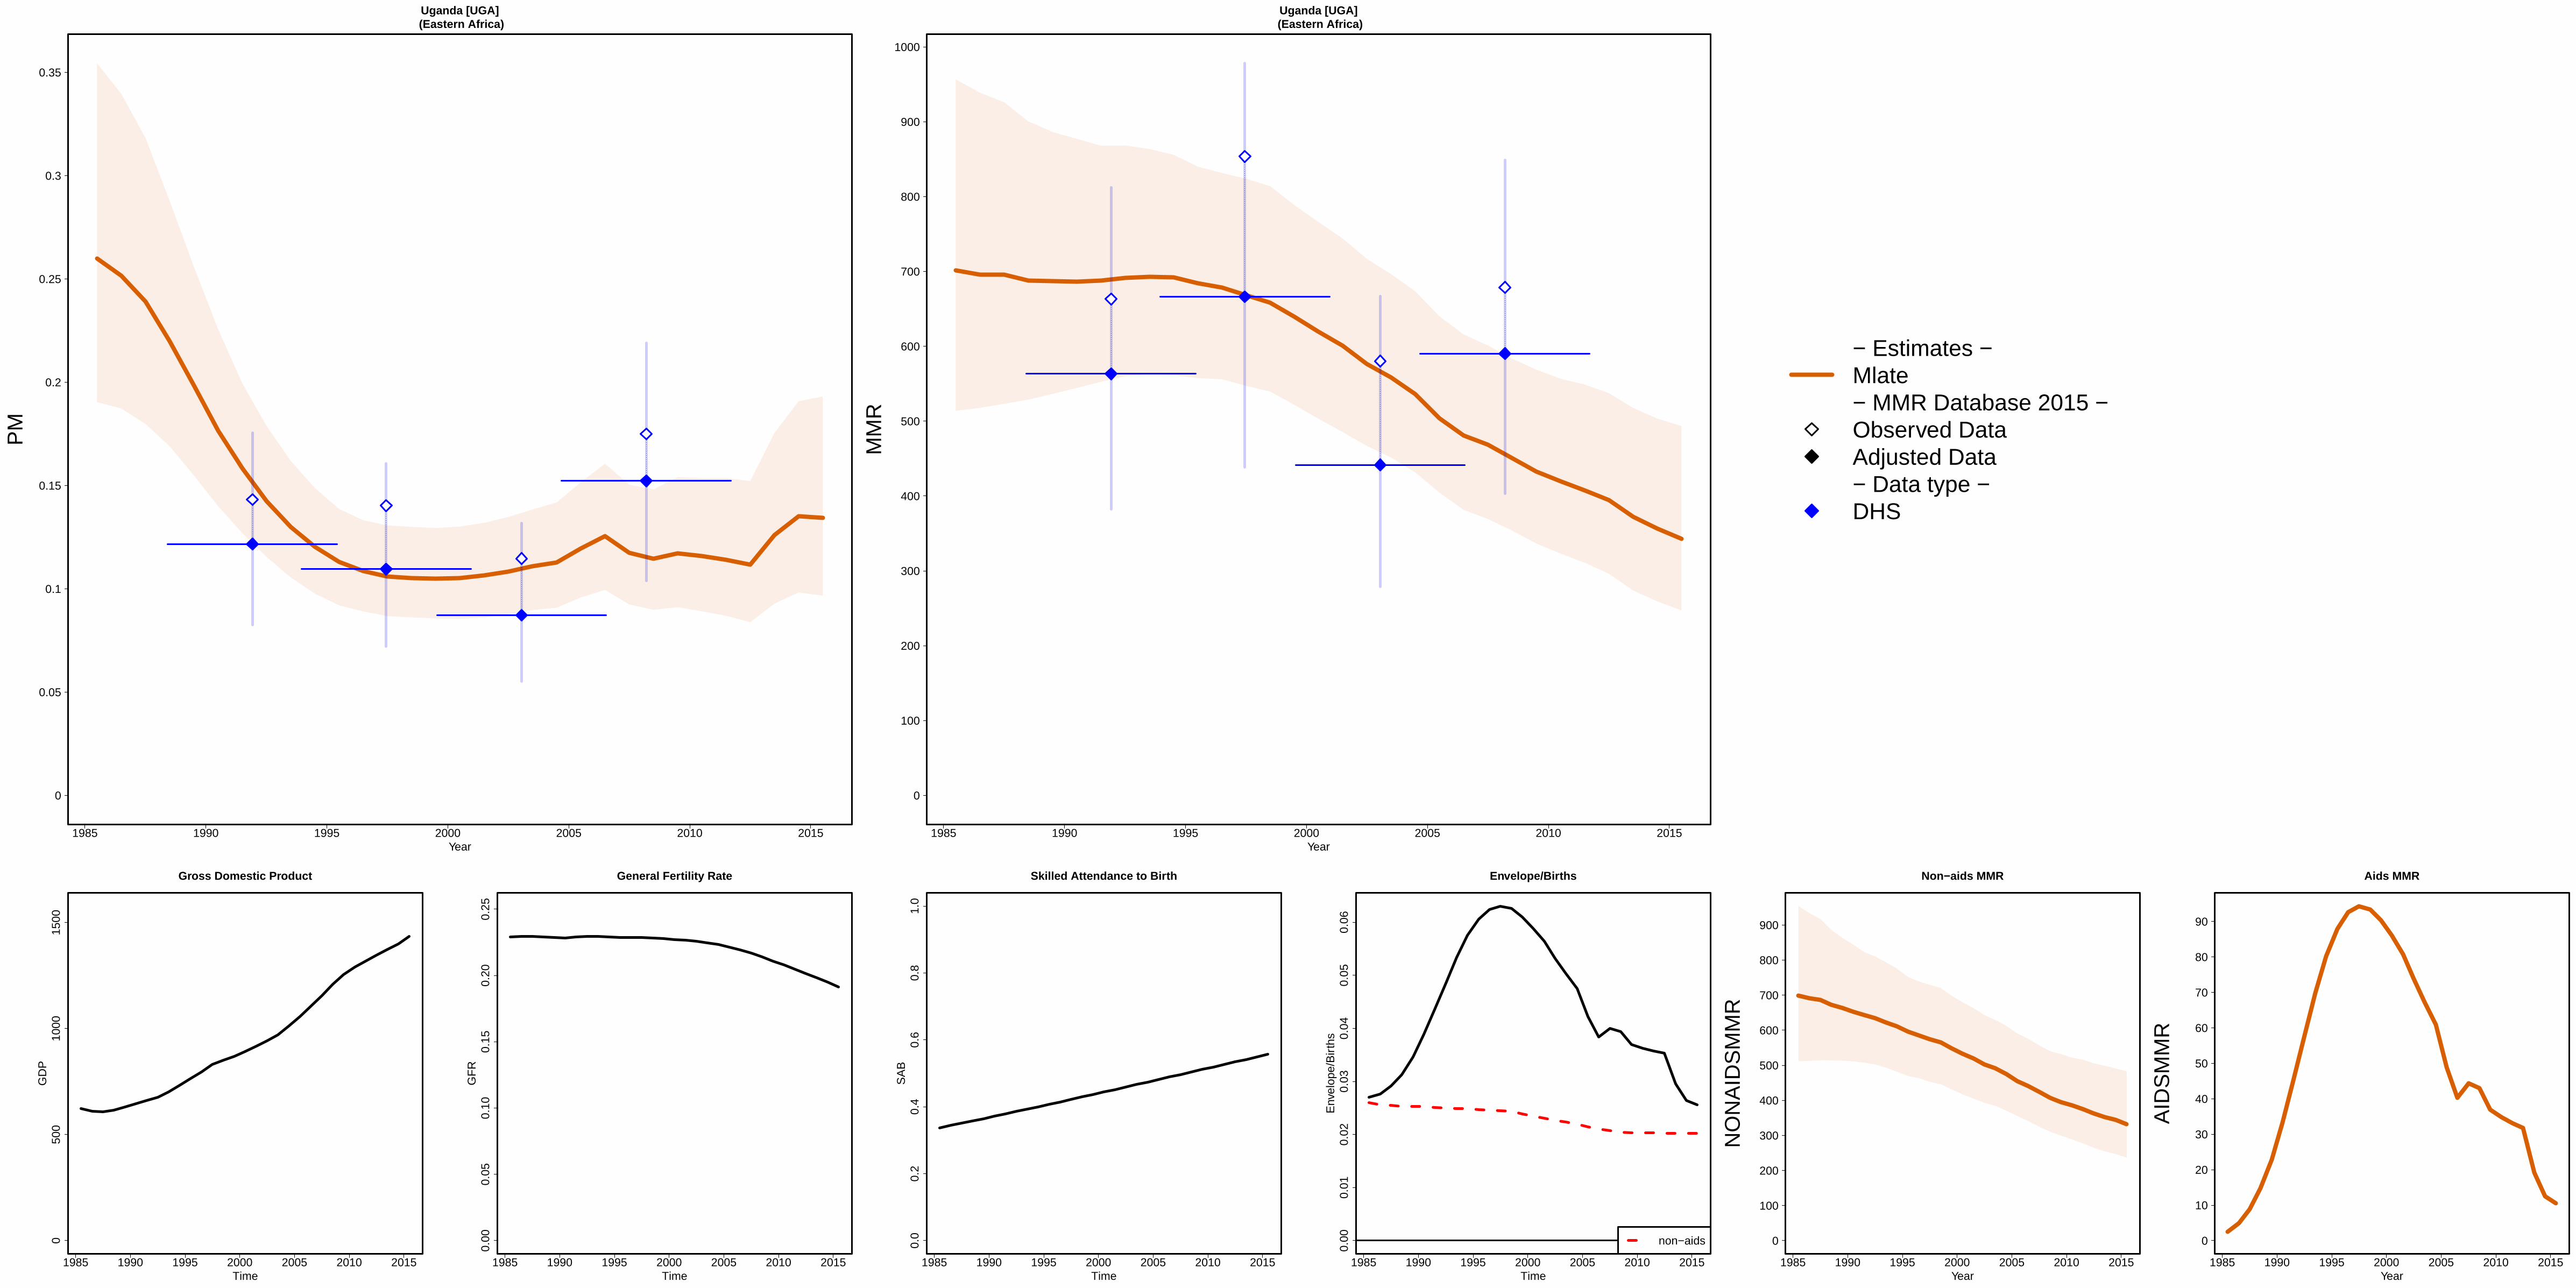
1985 1990 1995 2000 2005 2010 2015
Uganda [UGA] (Eastern Africa)
Year
0
0.05
0.1
0.15
0.2
0.25
0.3
0.35
PM
1985 1990 1995 2000 2005 2010 2015
Uganda [UGA] (Eastern Africa)
Year
0
100
200
300
400
500
600
700
800
900
1000
MM
R
− Estimates −Mlate− MMR Database 2015 −Observed DataAdjusted Data− Data type −DHS
1985 1990 1995 2000 2005 2010 2015
050
010
0015
00
Gross Domestic Product
Time
GD
P
1985 1990 1995 2000 2005 2010 2015
0.00
0.05
0.10
0.15
0.20
0.25
General Fertility Rate
Time
GF
R
1985 1990 1995 2000 2005 2010 2015
0.0
0.2
0.4
0.6
0.8
1.0
Skilled Attendance to Birth
Time
SA
B
1985 1990 1995 2000 2005 2010 2015
0.00
0.01
0.02
0.03
0.04
0.05
0.06
Envelope/Births
Time
Env
elop
e/B
irth
s
non−aids
1985 1990 1995 2000 2005 2010 2015
Non−aids MMR
Year
0
100
200
300
400
500
600
700
800
900
NO
NA
IDS
MM
R
1985 1990 1995 2000 2005 2010 2015
Aids MMR
Year
0
10
20
30
40
50
60
70
80
90
AID
SM
MR

1985 1990 1995 2000 2005 2010 2015
Ukraine [UKR] (Developed regions)
Year
0
0.01
0.02
0.03
PM
1985 1990 1995 2000 2005 2010 2015
Ukraine [UKR] (Developed regions)
Year
0
10
20
30
40
50
60
70
80
90
MM
R
− Estimates −Mlate− MMR Database 2015 −Observed DataAdjusted Data− Data type −VR
1985 1990 1995 2000 2005 2010 2015
020
0040
0060
0080
0010
000
1200
0
Gross Domestic Product
Time
GD
P
1985 1990 1995 2000 2005 2010 2015
0.00
0.01
0.02
0.03
0.04
0.05
0.06
General Fertility Rate
Time
GF
R
1985 1990 1995 2000 2005 2010 2015
0.0
0.2
0.4
0.6
0.8
1.0
Skilled Attendance to Birth
Time
SA
B
1985 1990 1995 2000 2005 2010 2015
0.00
0.01
0.02
0.03
0.04
0.05
0.06
Envelope/Births
Time
Env
elop
e/B
irth
s
non−aids
1985 1990 1995 2000 2005 2010 2015
Non−aids MMR
Year
0
10
20
30
40
50
60
70
80
NO
NA
IDS
MM
R
1985 1990 1995 2000 2005 2010 2015
Aids MMR
Year
AID
SM
MR

1985 1990 1995 2000 2005 2010 2015
United Arab Emirates [ARE] (Western Asia)
Year
0
0.02
0.04
PM
●
●
●
1985 1990 1995 2000 2005 2010 2015
United Arab Emirates [ARE] (Western Asia)
Year
0
5
10
15
20
25
30
35
MM
R
●
●
●
●
− Estimates −
Mlate
− MMR Database 2015 −
Observed Data
Adjusted Data
− Data type −
VRReported VR before recalc.(related to 0 obs. mat. death)Excluded VR data (data quality issues)Excluded misc. studies
1985 1990 1995 2000 2005 2010 2015
020
000
4000
060
000
8000
010
0000
1400
00
Gross Domestic Product
Time
GD
P
1985 1990 1995 2000 2005 2010 2015
0.00
0.05
0.10
0.15
General Fertility Rate
Time
GF
R
1985 1990 1995 2000 2005 2010 2015
0.0
0.2
0.4
0.6
0.8
1.0
Skilled Attendance to Birth
Time
SA
B
1985 1990 1995 2000 2005 2010 2015
0.00
00.
002
0.00
40.
006
0.00
8
Envelope/Births
Time
Env
elop
e/B
irth
s
non−aids
1985 1990 1995 2000 2005 2010 2015
Non−aids MMR
Year
0
5
10
15
20
25
30
35
NO
NA
IDS
MM
R
1985 1990 1995 2000 2005 2010 2015
Aids MMR
Year
00.010.02
AID
SM
MR

1985 1990 1995 2000 2005 2010 2015
United Kingdom [GBR] (Developed regions)
Year
0
0.01
PM
1985 1990 1995 2000 2005 2010 2015
United Kingdom [GBR] (Developed regions)
Year
0
5
10
15
MM
R
− Estimates −
Mlate
− MMR Database 2015 −
Observed Data
Adjusted Data
− Data type −
VR
Spec. studiesExcluded VR data (overlap with specialized study)
1985 1990 1995 2000 2005 2010 2015
010
000
2000
030
000
4000
0
Gross Domestic Product
Time
GD
P
1985 1990 1995 2000 2005 2010 2015
0.00
0.01
0.02
0.03
0.04
0.05
0.06
General Fertility Rate
Time
GF
R
1985 1990 1995 2000 2005 2010 2015
0.0
0.2
0.4
0.6
0.8
1.0
Skilled Attendance to Birth
Time
SA
B
1985 1990 1995 2000 2005 2010 2015
0.00
00.
005
0.01
00.
015
Envelope/Births
Time
Env
elop
e/B
irth
s
non−aids
1985 1990 1995 2000 2005 2010 2015
Non−aids MMR
Year
0
5
10
NO
NA
IDS
MM
R
1985 1990 1995 2000 2005 2010 2015
Aids MMR
Year
0
0.05
0.1
0.15
AID
SM
MR

1985 1990 1995 2000 2005 2010 2015
United States of America [USA] (Developed regions)
Year
0
0.01
PM
1985 1990 1995 2000 2005 2010 2015
United States of America [USA] (Developed regions)
Year
0
5
10
15
20
MM
R
− Estimates −
Mlate
− MMR Database 2015 −
Observed Data
Adjusted Data
− Data type −
VR
Spec. studiesExcluded VR data (overlap with specialized study)
1985 1990 1995 2000 2005 2010 2015
010
000
2000
030
000
4000
050
000
6000
0
Gross Domestic Product
Time
GD
P
1985 1990 1995 2000 2005 2010 2015
0.00
0.01
0.02
0.03
0.04
0.05
0.06
General Fertility Rate
Time
GF
R
1985 1990 1995 2000 2005 2010 2015
0.0
0.2
0.4
0.6
0.8
1.0
Skilled Attendance to Birth
Time
SA
B
1985 1990 1995 2000 2005 2010 2015
0.00
00.
005
0.01
00.
015
0.02
0
Envelope/Births
Time
Env
elop
e/B
irth
s
non−aids
1985 1990 1995 2000 2005 2010 2015
Non−aids MMR
Year
0
5
10
15
NO
NA
IDS
MM
R
1985 1990 1995 2000 2005 2010 2015
Aids MMR
Year
0
0.1
0.2
0.3
0.4
0.5
0.6
AID
SM
MR
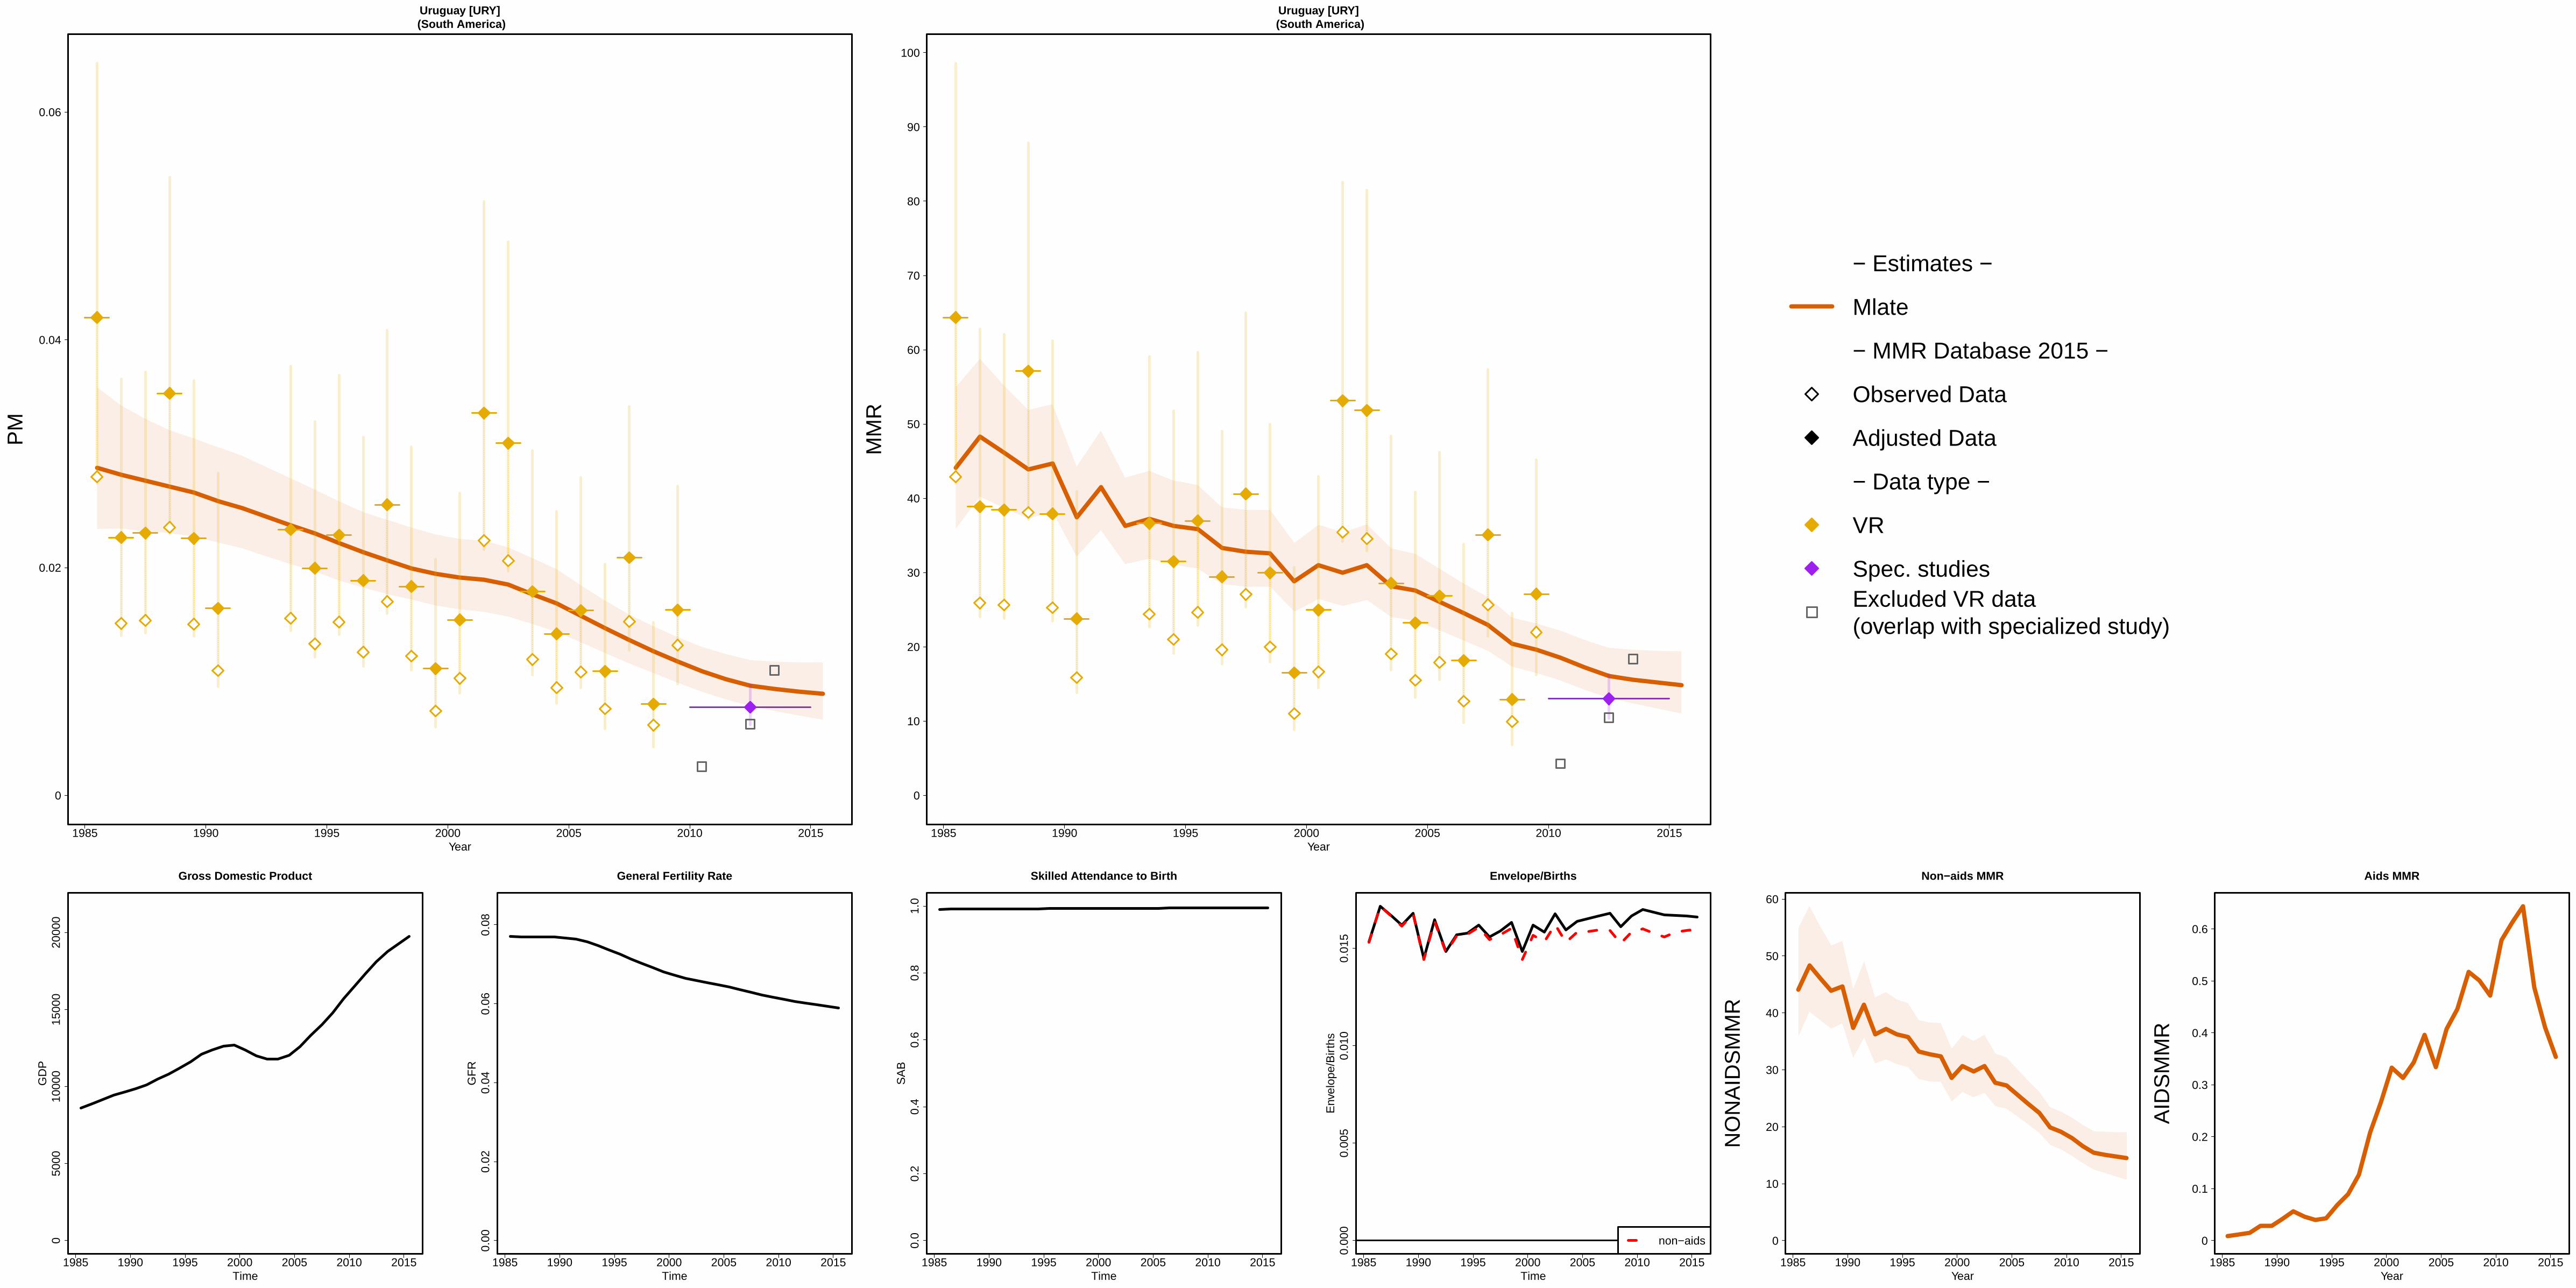
1985 1990 1995 2000 2005 2010 2015
Uruguay [URY] (South America)
Year
0
0.02
0.04
0.06
PM
1985 1990 1995 2000 2005 2010 2015
Uruguay [URY] (South America)
Year
0
10
20
30
40
50
60
70
80
90
100
MM
R
− Estimates −
Mlate
− MMR Database 2015 −
Observed Data
Adjusted Data
− Data type −
VR
Spec. studiesExcluded VR data (overlap with specialized study)
1985 1990 1995 2000 2005 2010 2015
050
0010
000
1500
020
000
Gross Domestic Product
Time
GD
P
1985 1990 1995 2000 2005 2010 2015
0.00
0.02
0.04
0.06
0.08
General Fertility Rate
Time
GF
R
1985 1990 1995 2000 2005 2010 2015
0.0
0.2
0.4
0.6
0.8
1.0
Skilled Attendance to Birth
Time
SA
B
1985 1990 1995 2000 2005 2010 2015
0.00
00.
005
0.01
00.
015
Envelope/Births
Time
Env
elop
e/B
irth
s
non−aids
1985 1990 1995 2000 2005 2010 2015
Non−aids MMR
Year
0
10
20
30
40
50
60
NO
NA
IDS
MM
R
1985 1990 1995 2000 2005 2010 2015
Aids MMR
Year
0
0.1
0.2
0.3
0.4
0.5
0.6
AID
SM
MR

1985 1990 1995 2000 2005 2010 2015
Uzbekistan [UZB] (Central Asia)
Year
0
0.05
0.1
PM
1985 1990 1995 2000 2005 2010 2015
Uzbekistan [UZB] (Central Asia)
Year
0
50
100
MM
R
− Estimates −Mlate− MMR Database 2015 −Observed DataAdjusted Data− Data type −VR
1985 1990 1995 2000 2005 2010 2015
010
0020
0030
0040
0050
0060
00
Gross Domestic Product
Time
GD
P
1985 1990 1995 2000 2005 2010 2015
0.00
0.05
0.10
0.15
General Fertility Rate
Time
GF
R
1985 1990 1995 2000 2005 2010 2015
0.0
0.2
0.4
0.6
0.8
1.0
Skilled Attendance to Birth
Time
SA
B
1985 1990 1995 2000 2005 2010 2015
0.00
00.
005
0.01
00.
015
0.02
0
Envelope/Births
Time
Env
elop
e/B
irth
s
non−aids
1985 1990 1995 2000 2005 2010 2015
Non−aids MMR
Year
0
50
100
NO
NA
IDS
MM
R
1985 1990 1995 2000 2005 2010 2015
Aids MMR
Year
0
0.1
0.2
0.3
0.4
0.5
0.6
0.7
AID
SM
MR

1985 1990 1995 2000 2005 2010 2015
Vanuatu [VUT] (South−Eastern Asia / Oceania)
Year
0
0.05
0.1
0.15
0.2
PM
1985 1990 1995 2000 2005 2010 2015
Vanuatu [VUT] (South−Eastern Asia / Oceania)
Year
0
100
200
300
400
MM
R − Estimates −Mlate− MMR Database 2015 −
1985 1990 1995 2000 2005 2010 2015
050
010
0015
0020
0025
0030
00
Gross Domestic Product
Time
GD
P
1985 1990 1995 2000 2005 2010 2015
0.00
0.05
0.10
0.15
General Fertility Rate
Time
GF
R
1985 1990 1995 2000 2005 2010 2015
0.0
0.2
0.4
0.6
0.8
1.0
Skilled Attendance to Birth
Time
SA
B
1985 1990 1995 2000 2005 2010 2015
0.00
00.
005
0.01
00.
015
0.02
0
Envelope/Births
Time
Env
elop
e/B
irth
s
non−aids
1985 1990 1995 2000 2005 2010 2015
Non−aids MMR
Year
0
100
200
300
400
NO
NA
IDS
MM
R
1985 1990 1995 2000 2005 2010 2015
Aids MMR
Year
00.010.02
AID
SM
MR
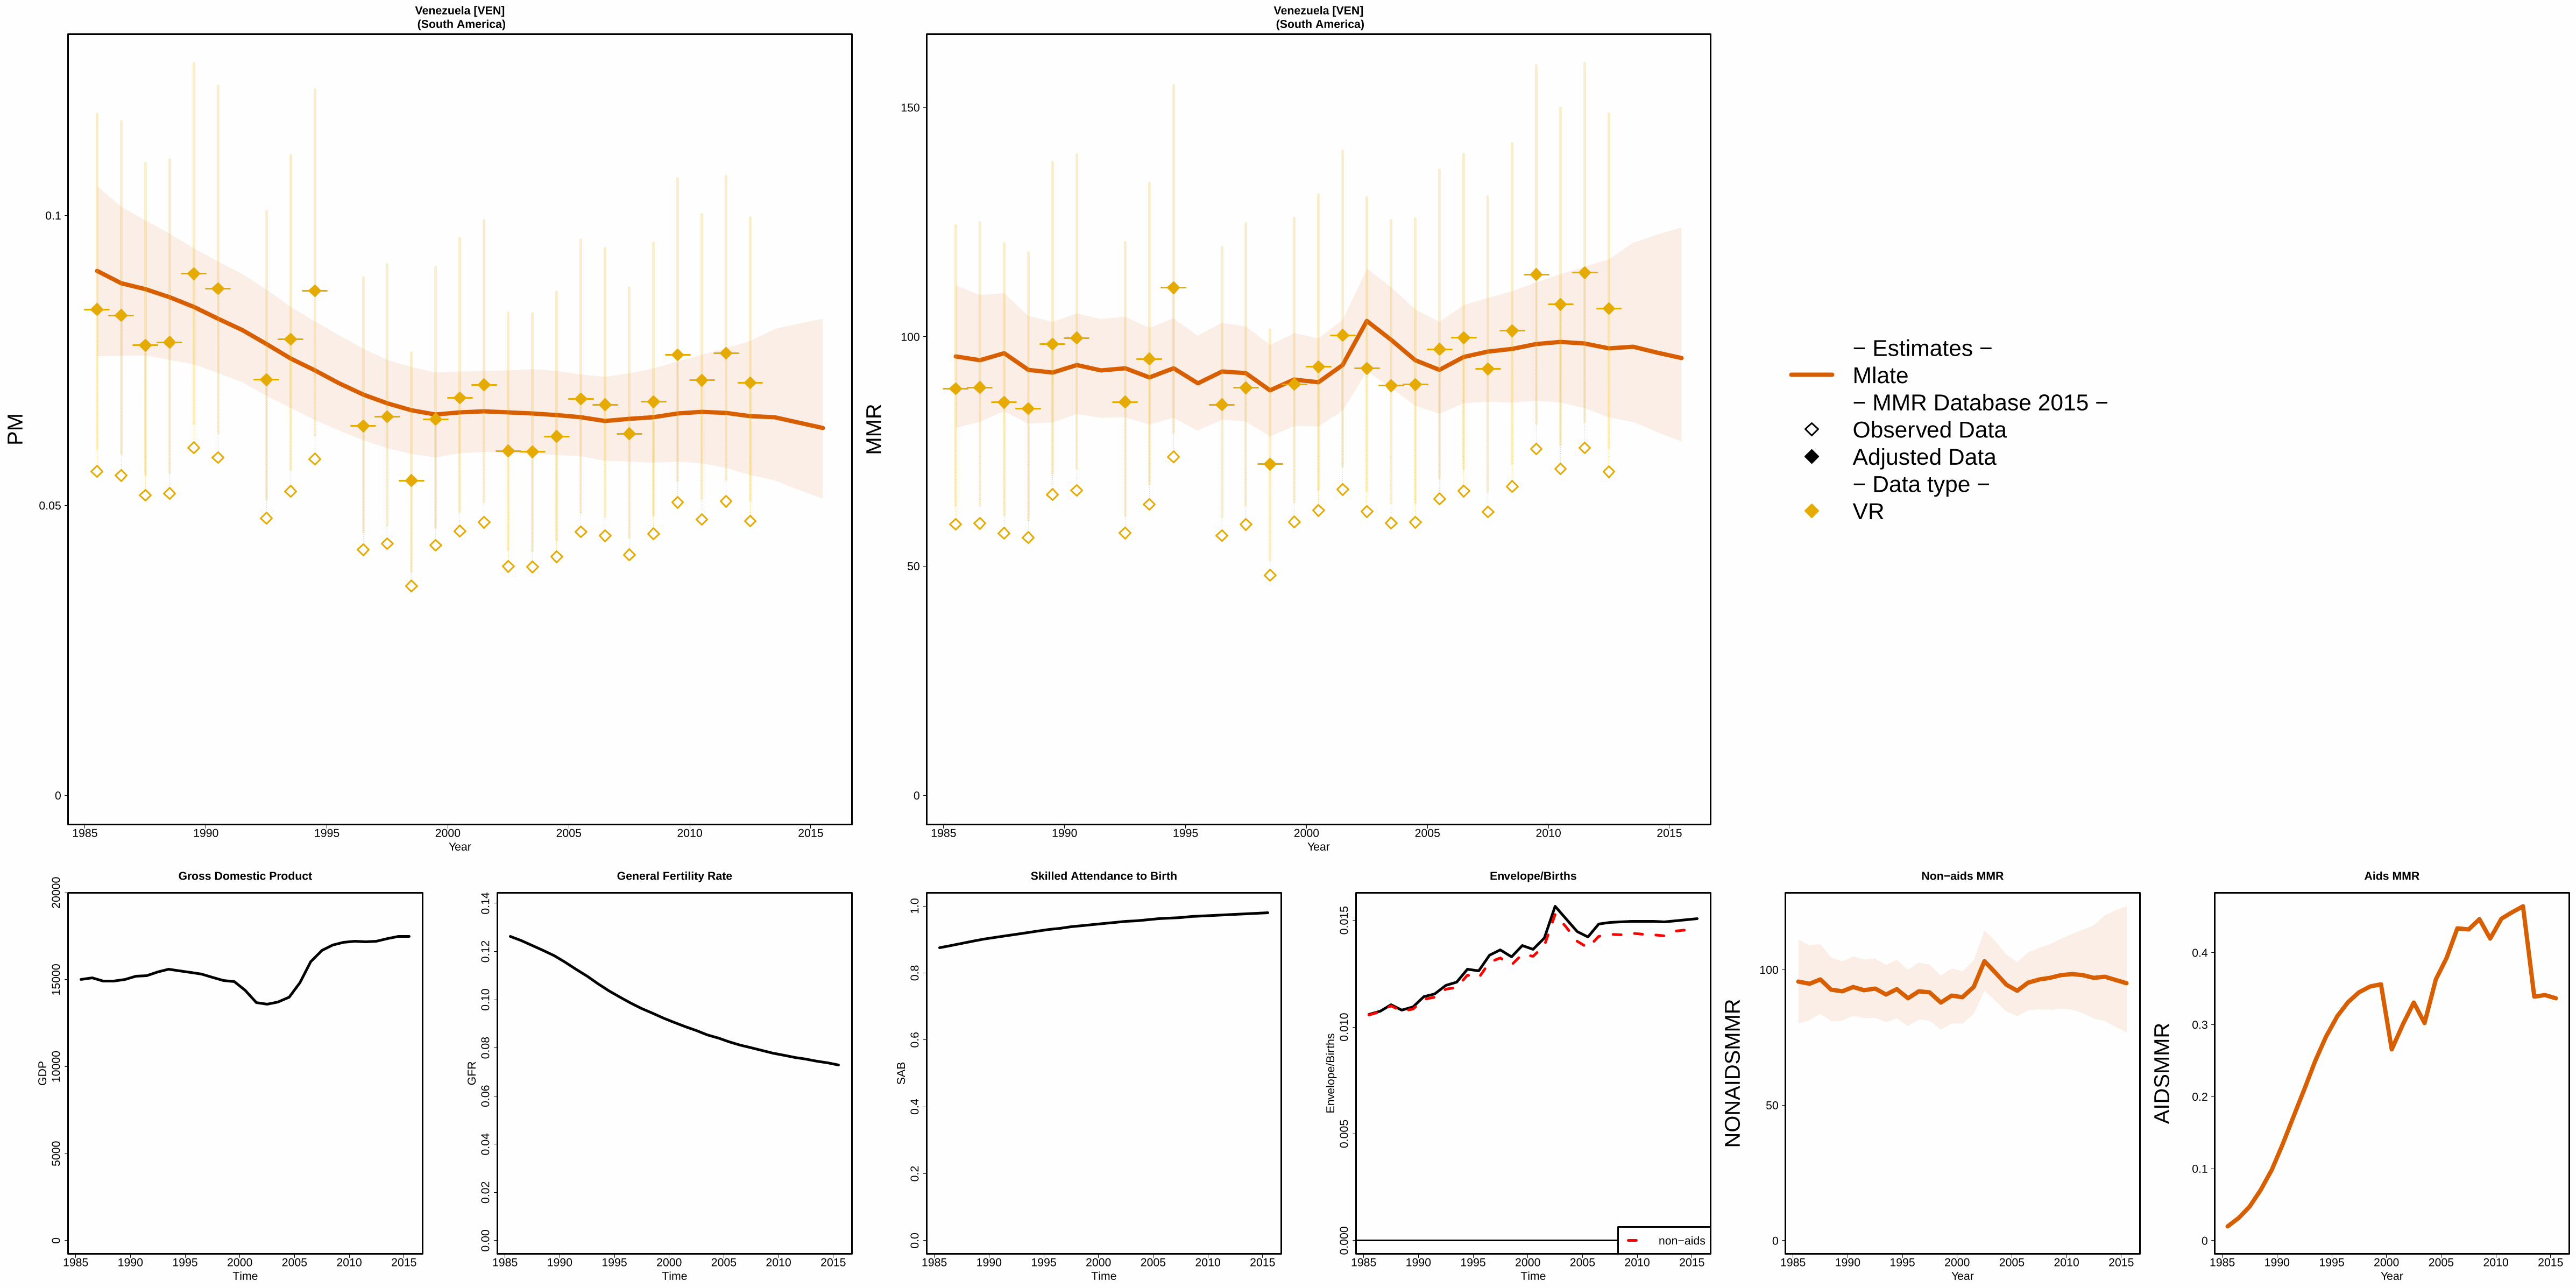
1985 1990 1995 2000 2005 2010 2015
Venezuela [VEN] (South America)
Year
0
0.05
0.1
PM
1985 1990 1995 2000 2005 2010 2015
Venezuela [VEN] (South America)
Year
0
50
100
150
MM
R
− Estimates −Mlate− MMR Database 2015 −Observed DataAdjusted Data− Data type −VR
1985 1990 1995 2000 2005 2010 2015
050
0010
000
1500
020
000 Gross Domestic Product
Time
GD
P
1985 1990 1995 2000 2005 2010 2015
0.00
0.02
0.04
0.06
0.08
0.10
0.12
0.14
General Fertility Rate
Time
GF
R
1985 1990 1995 2000 2005 2010 2015
0.0
0.2
0.4
0.6
0.8
1.0
Skilled Attendance to Birth
Time
SA
B
1985 1990 1995 2000 2005 2010 2015
0.00
00.
005
0.01
00.
015
Envelope/Births
Time
Env
elop
e/B
irth
s
non−aids
1985 1990 1995 2000 2005 2010 2015
Non−aids MMR
Year
0
50
100
NO
NA
IDS
MM
R
1985 1990 1995 2000 2005 2010 2015
Aids MMR
Year
0
0.1
0.2
0.3
0.4
AID
SM
MR

1985 1990 1995 2000 2005 2010 2015
Viet Nam [VNM] (South−Eastern Asia / Oceania)
Year
0
0.05
0.1
0.15
0.2
0.25
PM
1985 1990 1995 2000 2005 2010 2015
Viet Nam [VNM] (South−Eastern Asia / Oceania)
Year
0
50
100
150
200
250
MM
R
− Estimates −Mlate− MMR Database 2015 −Observed DataAdjusted Data− Data type −Spec. studiesCensusExcluded misc. studies
1985 1990 1995 2000 2005 2010 2015
010
0020
0030
0040
0050
0060
00
Gross Domestic Product
Time
GD
P
1985 1990 1995 2000 2005 2010 2015
0.00
0.05
0.10
0.15
General Fertility Rate
Time
GF
R
1985 1990 1995 2000 2005 2010 2015
0.0
0.2
0.4
0.6
0.8
1.0
Skilled Attendance to Birth
Time
SA
B
1985 1990 1995 2000 2005 2010 2015
0.00
00.
005
0.01
00.
015
Envelope/Births
Time
Env
elop
e/B
irth
s
non−aids
1985 1990 1995 2000 2005 2010 2015
Non−aids MMR
Year
0
50
100
150
200
250
NO
NA
IDS
MM
R
1985 1990 1995 2000 2005 2010 2015
Aids MMR
Year
AID
SM
MR
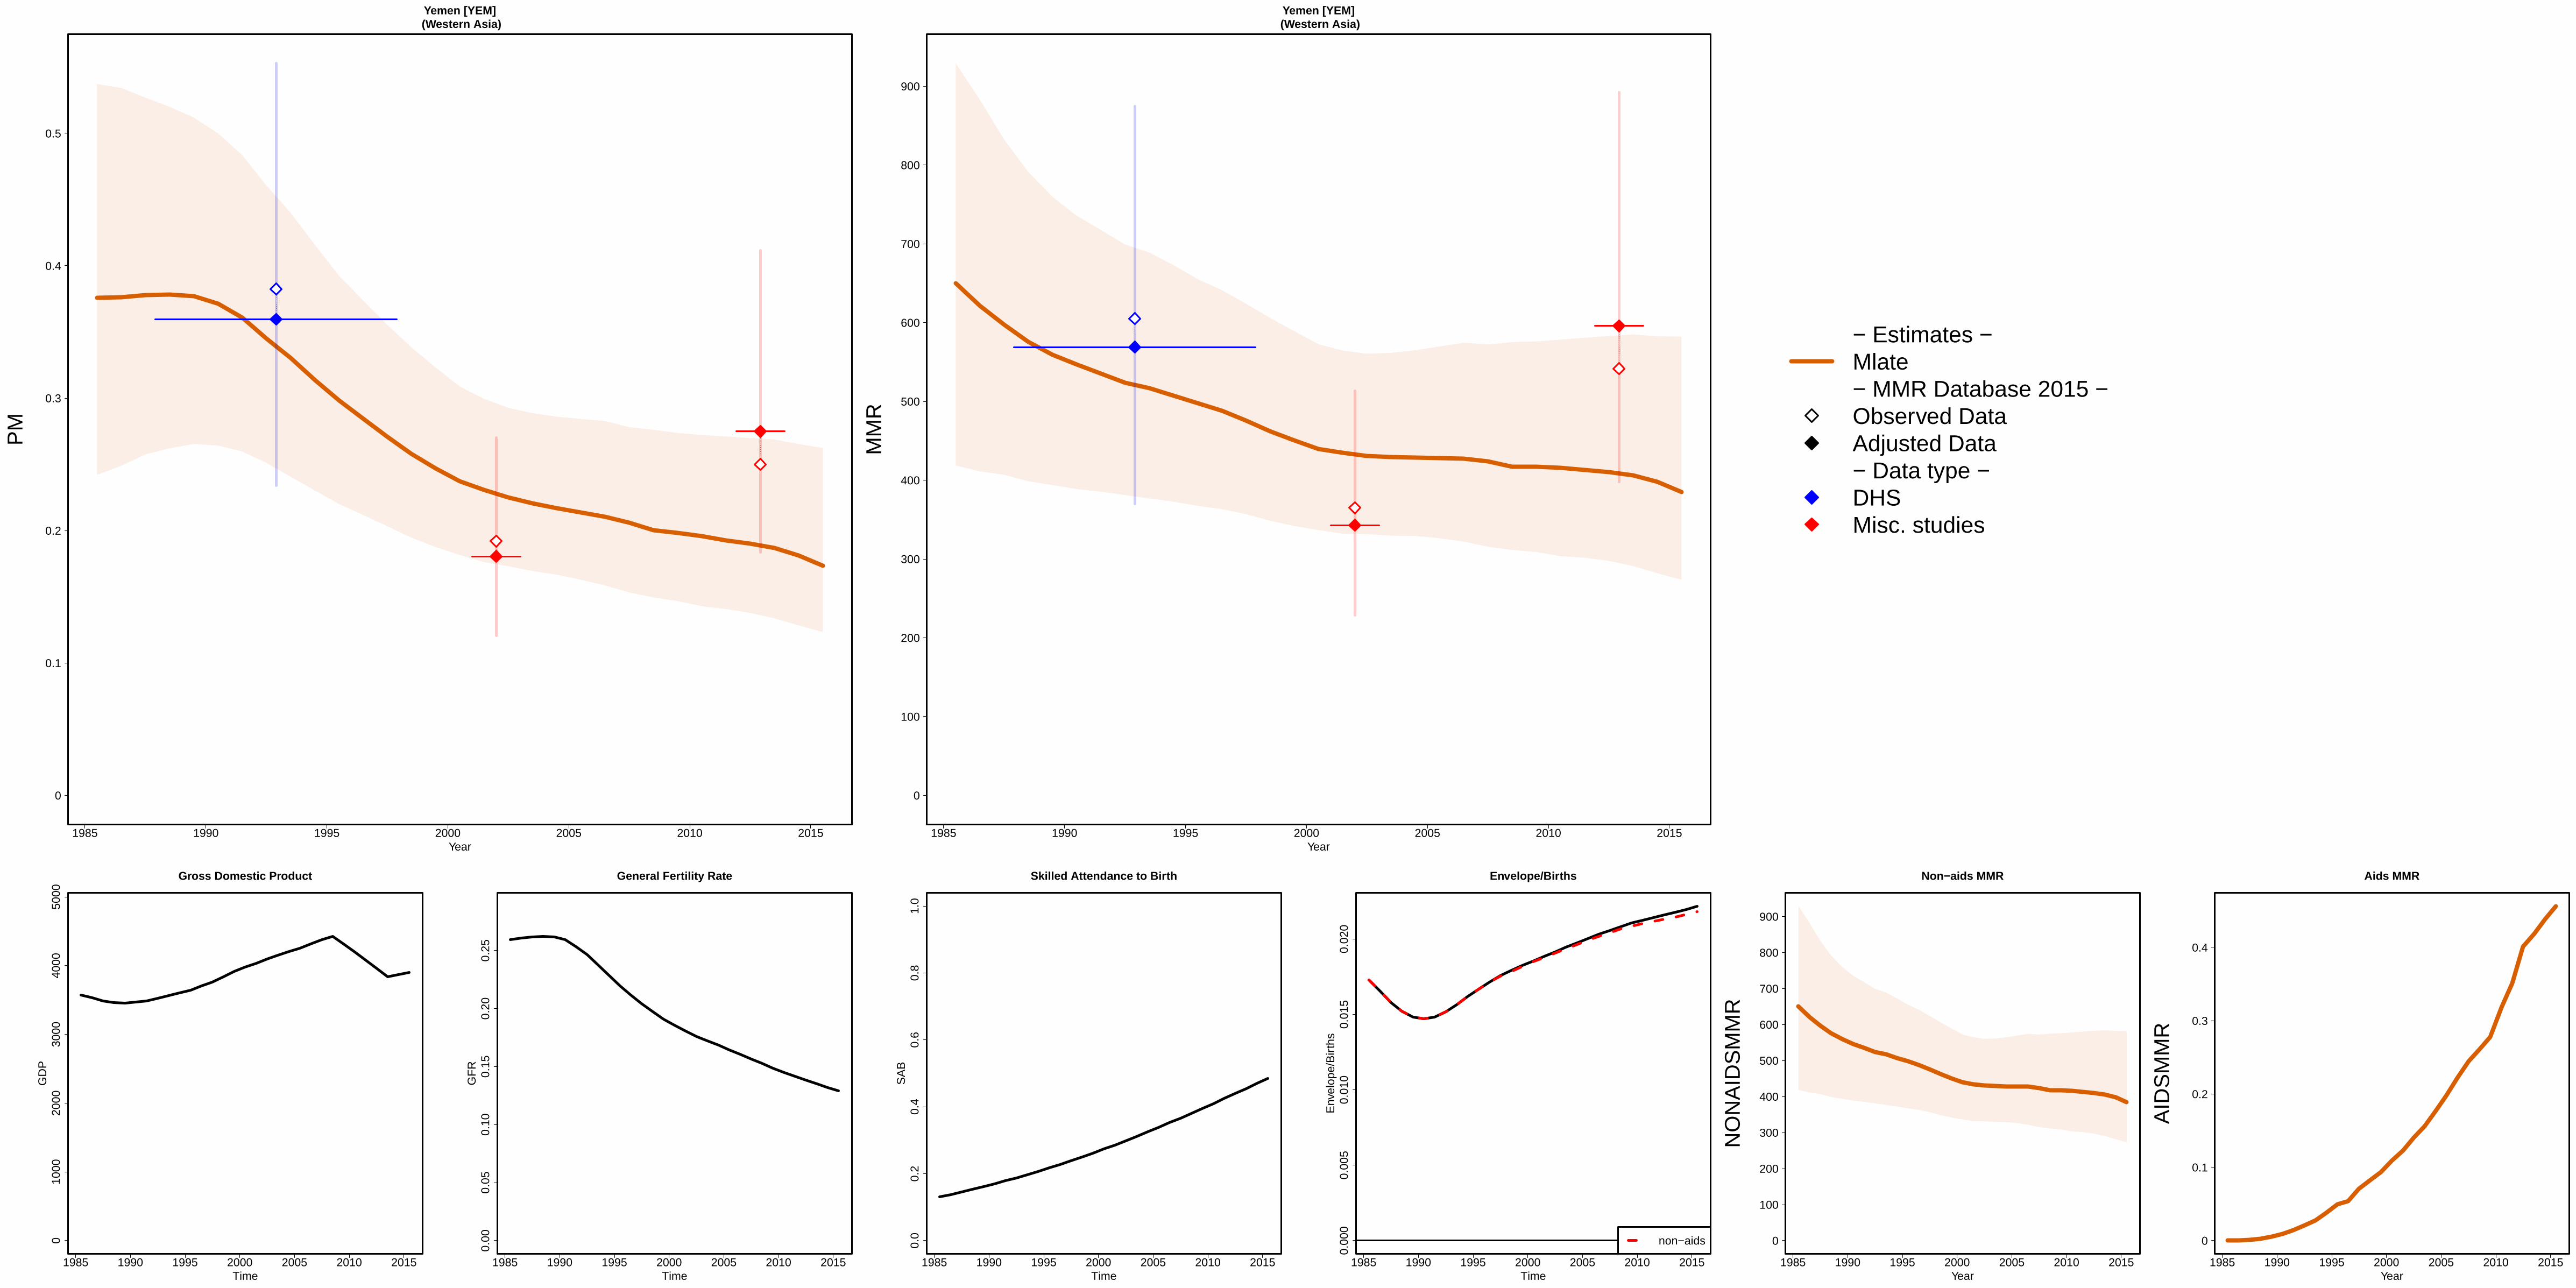
1985 1990 1995 2000 2005 2010 2015
Yemen [YEM] (Western Asia)
Year
0
0.1
0.2
0.3
0.4
0.5
PM
1985 1990 1995 2000 2005 2010 2015
Yemen [YEM] (Western Asia)
Year
0
100
200
300
400
500
600
700
800
900
MM
R
− Estimates −Mlate− MMR Database 2015 −Observed DataAdjusted Data− Data type −DHSMisc. studies
1985 1990 1995 2000 2005 2010 2015
010
0020
0030
0040
0050
00
Gross Domestic Product
Time
GD
P
1985 1990 1995 2000 2005 2010 2015
0.00
0.05
0.10
0.15
0.20
0.25
General Fertility Rate
Time
GF
R
1985 1990 1995 2000 2005 2010 2015
0.0
0.2
0.4
0.6
0.8
1.0
Skilled Attendance to Birth
Time
SA
B
1985 1990 1995 2000 2005 2010 2015
0.00
00.
005
0.01
00.
015
0.02
0
Envelope/Births
Time
Env
elop
e/B
irth
s
non−aids
1985 1990 1995 2000 2005 2010 2015
Non−aids MMR
Year
0
100
200
300
400
500
600
700
800
900
NO
NA
IDS
MM
R
1985 1990 1995 2000 2005 2010 2015
Aids MMR
Year
0
0.1
0.2
0.3
0.4
AID
SM
MR
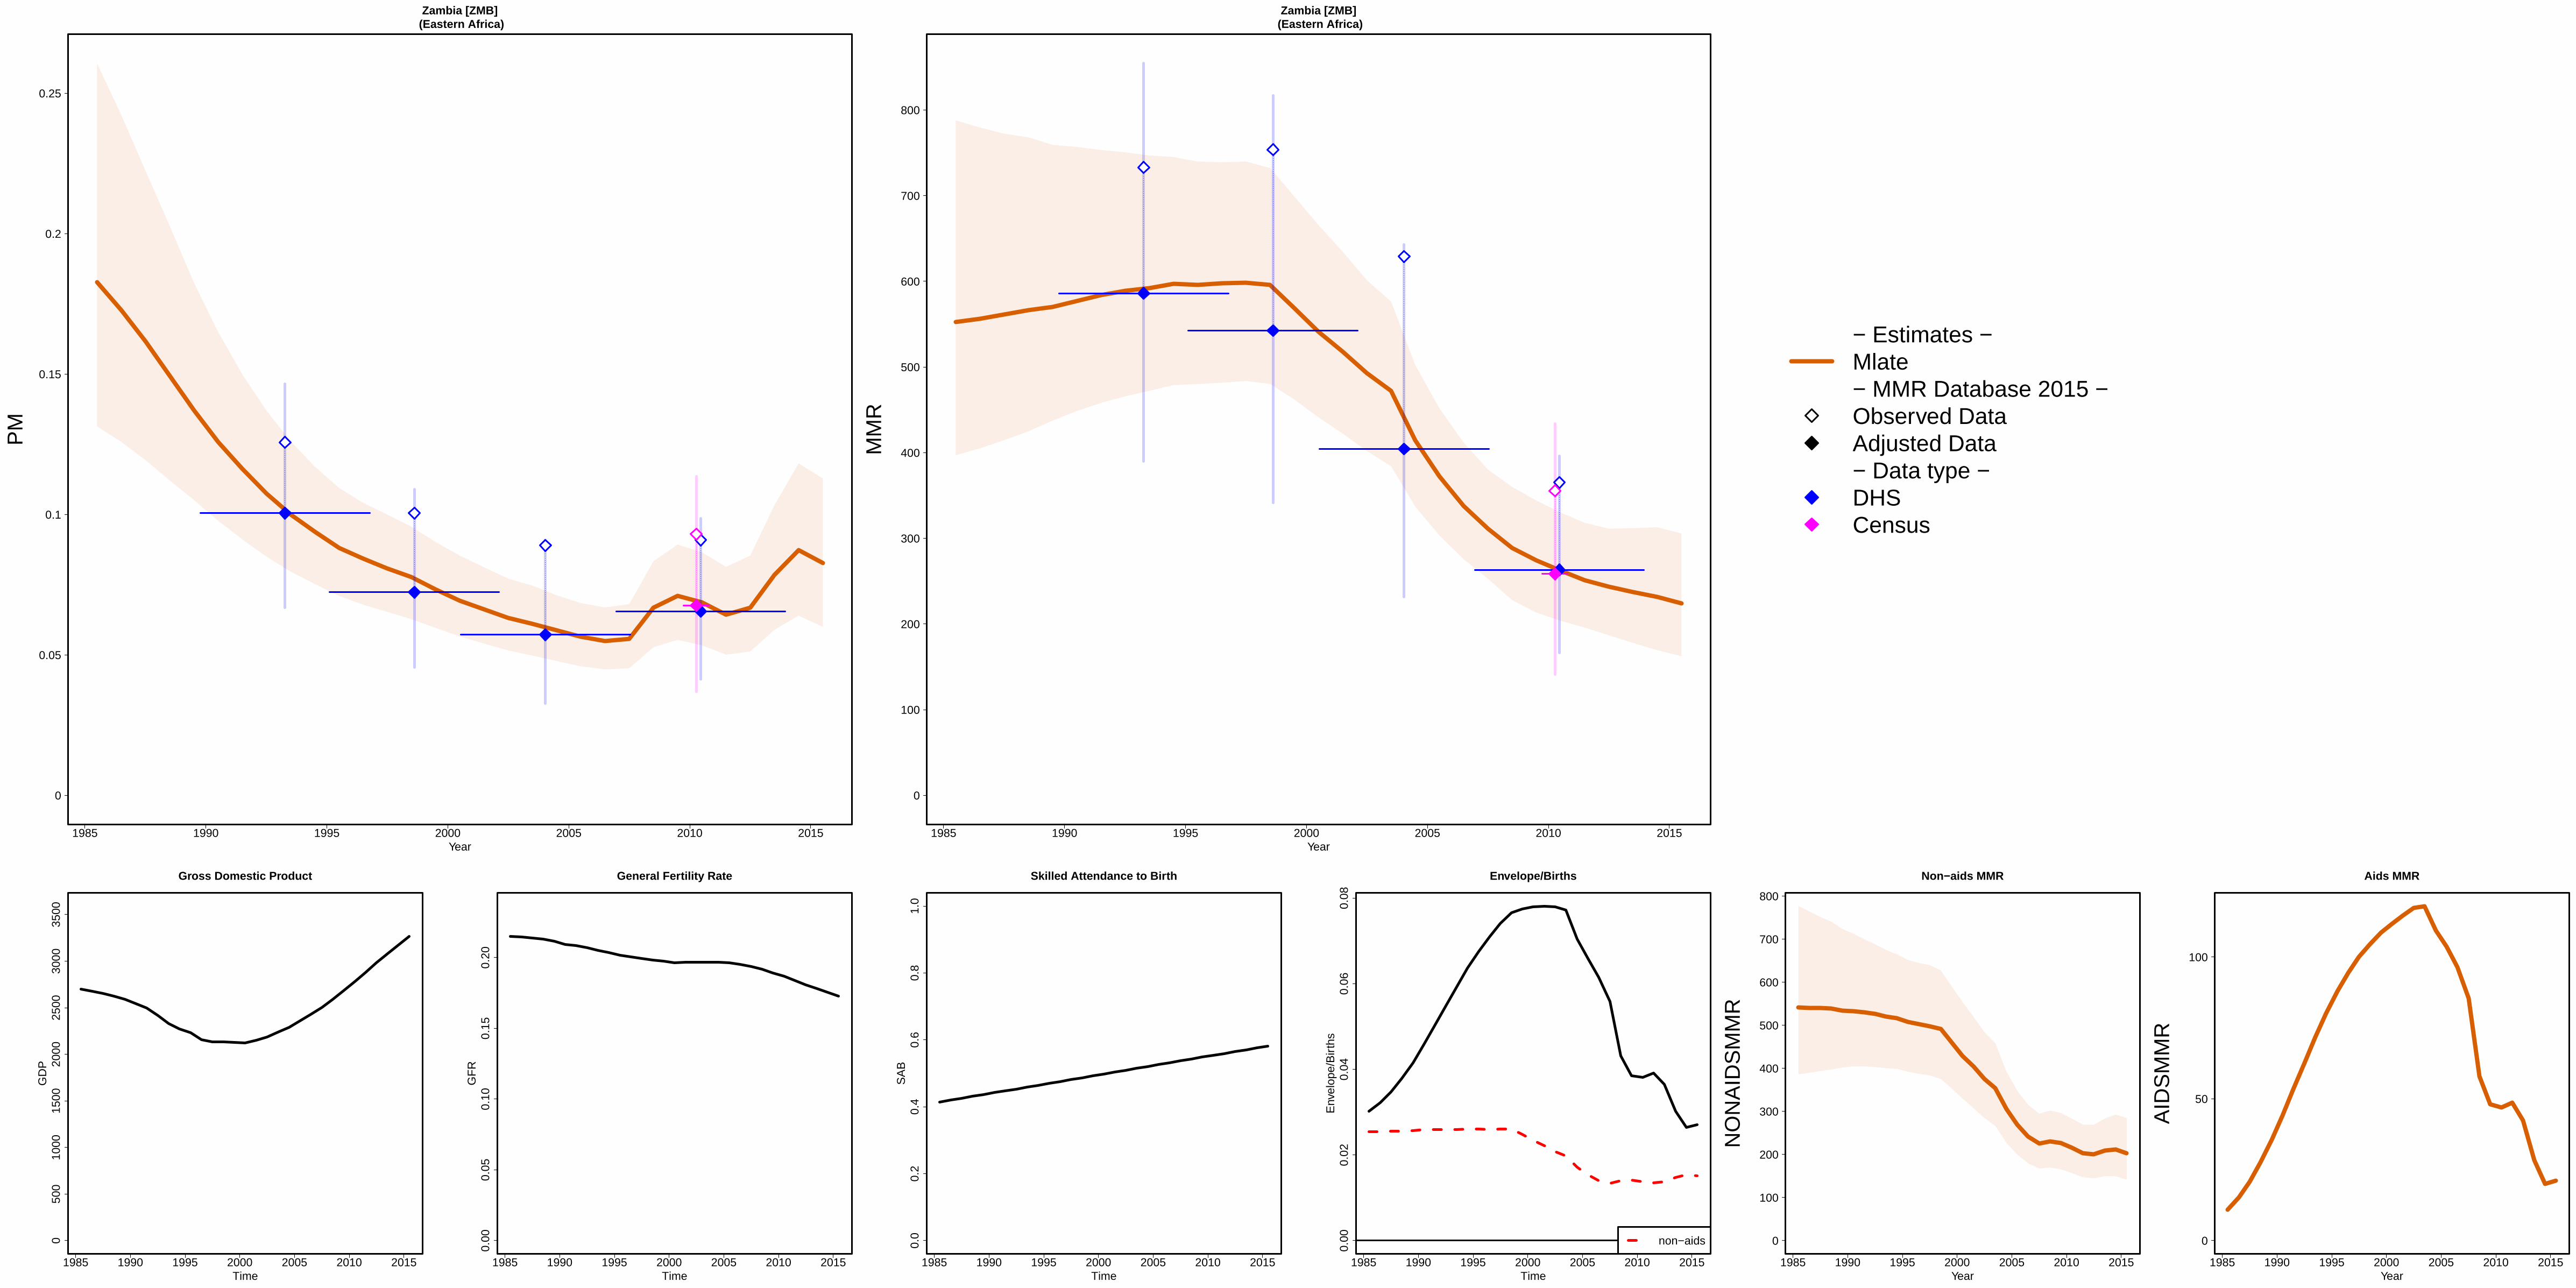
1985 1990 1995 2000 2005 2010 2015
Zambia [ZMB] (Eastern Africa)
Year
0
0.05
0.1
0.15
0.2
0.25
PM
1985 1990 1995 2000 2005 2010 2015
Zambia [ZMB] (Eastern Africa)
Year
0
100
200
300
400
500
600
700
800
MM
R
− Estimates −Mlate− MMR Database 2015 −Observed DataAdjusted Data− Data type −DHSCensus
1985 1990 1995 2000 2005 2010 2015
050
010
0015
0020
0025
0030
0035
00
Gross Domestic Product
Time
GD
P
1985 1990 1995 2000 2005 2010 2015
0.00
0.05
0.10
0.15
0.20
General Fertility Rate
Time
GF
R
1985 1990 1995 2000 2005 2010 2015
0.0
0.2
0.4
0.6
0.8
1.0
Skilled Attendance to Birth
Time
SA
B
1985 1990 1995 2000 2005 2010 2015
0.00
0.02
0.04
0.06
0.08
Envelope/Births
Time
Env
elop
e/B
irth
s
non−aids
1985 1990 1995 2000 2005 2010 2015
Non−aids MMR
Year
0
100
200
300
400
500
600
700
800
NO
NA
IDS
MM
R
1985 1990 1995 2000 2005 2010 2015
Aids MMR
Year
0
50
100
AID
SM
MR

1985 1990 1995 2000 2005 2010 2015
Zimbabwe [ZWE] (Eastern Africa)
Year
0
0.1
0.2
0.3
0.4
PM
●
1985 1990 1995 2000 2005 2010 2015
Zimbabwe [ZWE] (Eastern Africa)
Year
0
500
1000
MM
R
●
●
− Estimates −
Mlate
− MMR Database 2015 −
Observed Data
Adjusted Data
− Data type −
Spec. studies
DHS
CensusExcluded VR data (data quality issues)
1985 1990 1995 2000 2005 2010 2015
050
010
0015
0020
0025
00
Gross Domestic Product
Time
GD
P
1985 1990 1995 2000 2005 2010 2015
0.00
0.05
0.10
0.15
0.20
General Fertility Rate
Time
GF
R
1985 1990 1995 2000 2005 2010 2015
0.0
0.2
0.4
0.6
0.8
1.0
Skilled Attendance to Birth
Time
SA
B
1985 1990 1995 2000 2005 2010 2015
0.00
0.05
0.10
0.15
Envelope/Births
Time
Env
elop
e/B
irth
s
non−aids
1985 1990 1995 2000 2005 2010 2015
Non−aids MMR
Year
0
100
200
300
400
500
600
700
NO
NA
IDS
MM
R
1985 1990 1995 2000 2005 2010 2015
Aids MMR
Year
0
50
100
150
200
AID
SM
MR

1985 1990 1995 2000 2005 2010 2015
Afghanistan [AFG] (Southern Asia)
Year
0
500
1000
1500
2000
2500
MM
R
− Estimates −MMEIG 2015GBD 2013− MMR Database 2015 −Observed DataAdjusted Data− Data type −DHSExcluded misc. studies
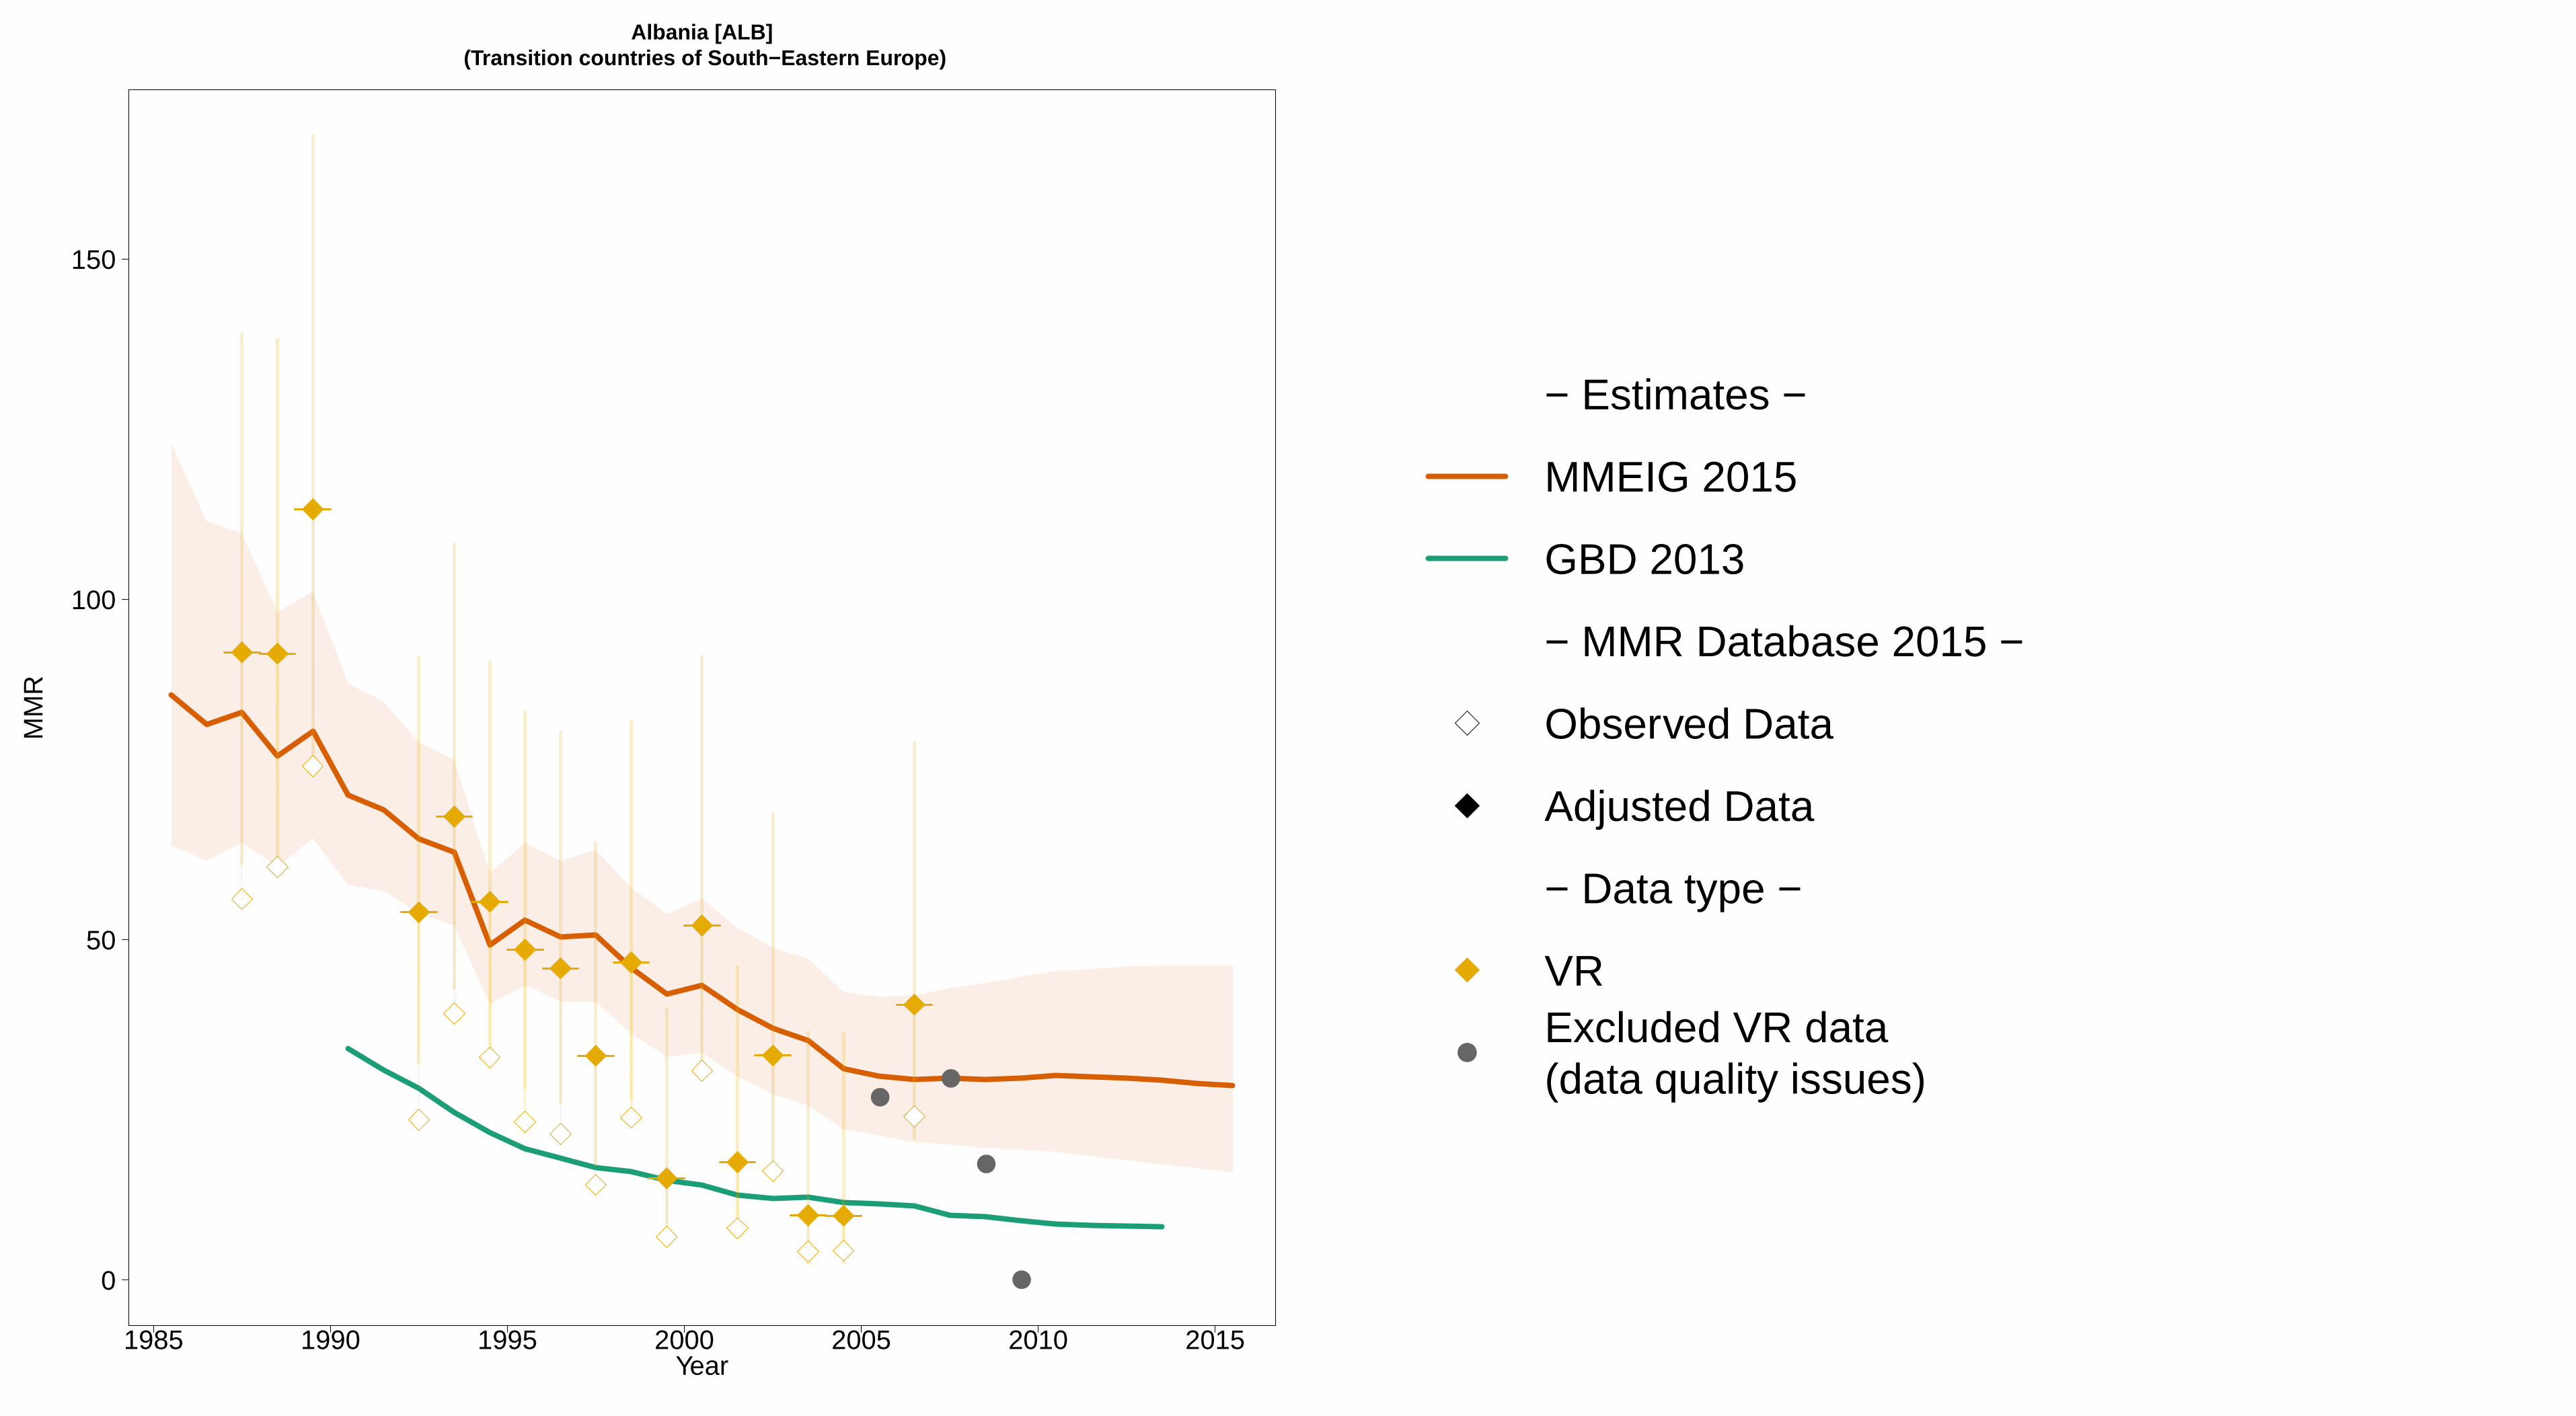
1985 1990 1995 2000 2005 2010 2015
Albania [ALB] (Transition countries of South−Eastern Europe)
Year
0
50
100
150
MM
R
●●
●
●
− Estimates −
MMEIG 2015
GBD 2013
− MMR Database 2015 −
Observed Data
Adjusted Data
− Data type −
VRExcluded VR data (data quality issues)
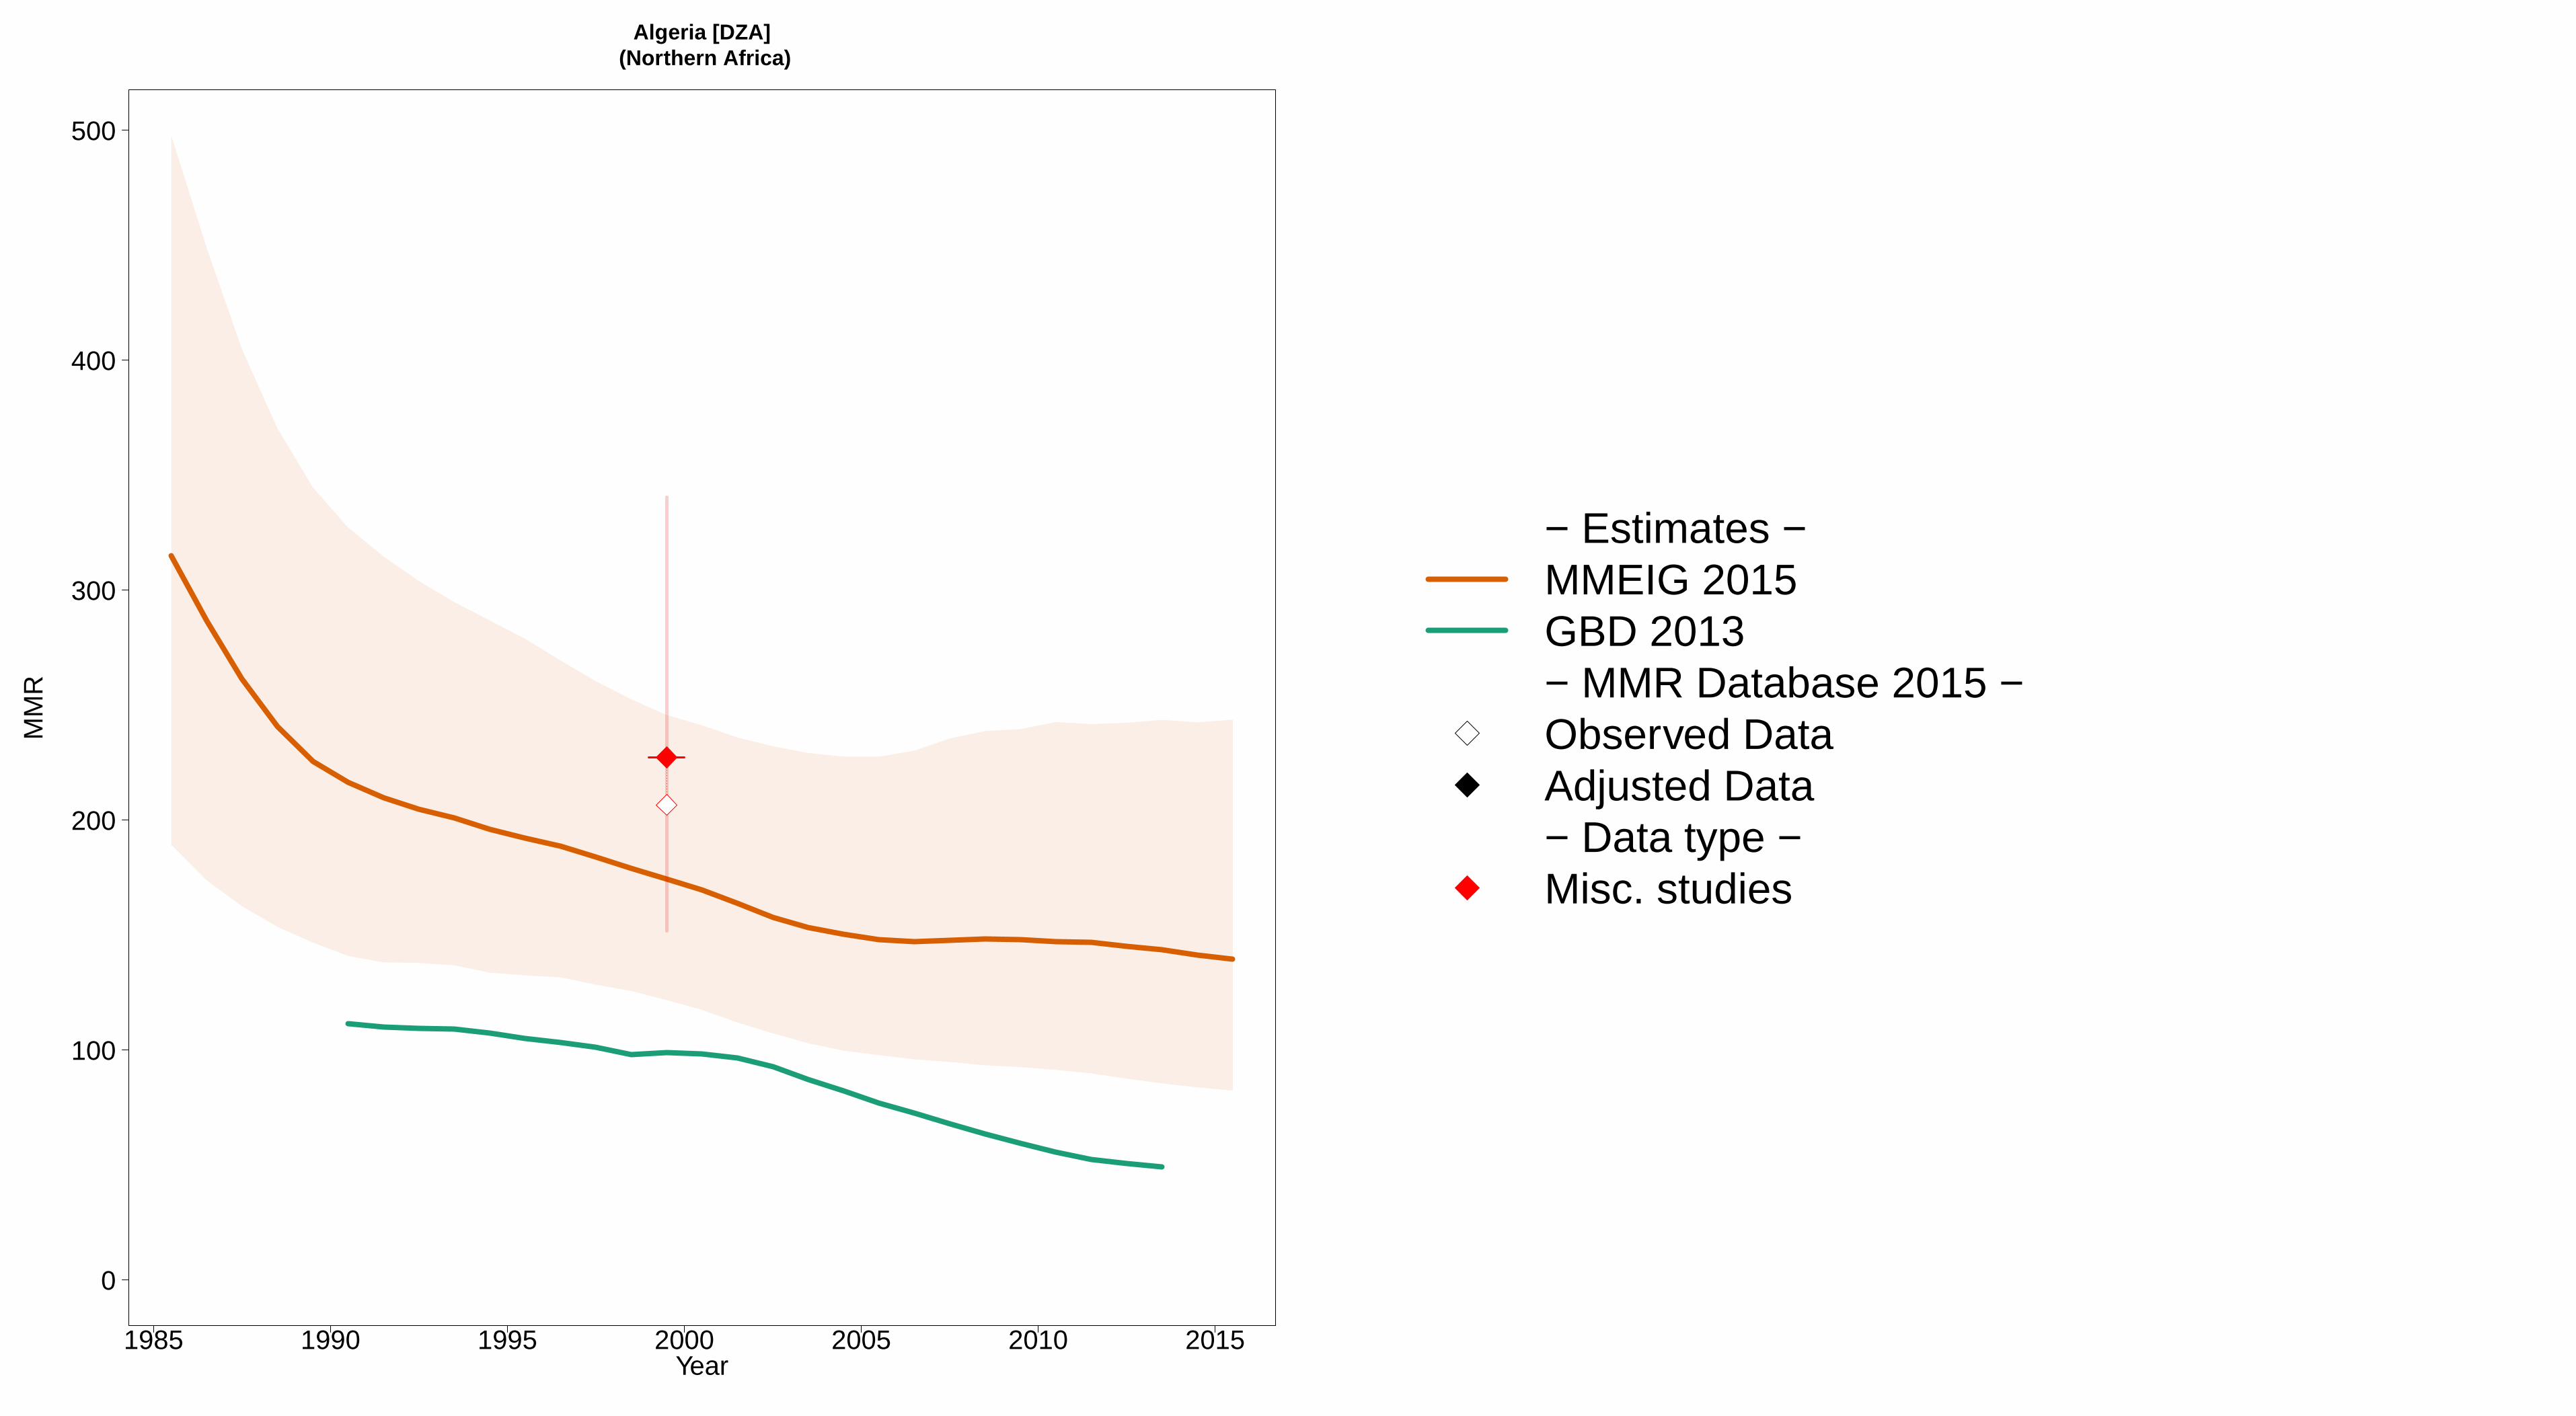
1985 1990 1995 2000 2005 2010 2015
Algeria [DZA] (Northern Africa)
Year
0
100
200
300
400
500
MM
R
− Estimates −MMEIG 2015GBD 2013− MMR Database 2015 −Observed DataAdjusted Data− Data type −Misc. studies

1985 1990 1995 2000 2005 2010 2015
Angola [AGO] (Middle Africa)
Year
0
500
1000
1500
2000
MM
R
− Estimates −MMEIG 2015GBD 2013− MMR Database 2015 −
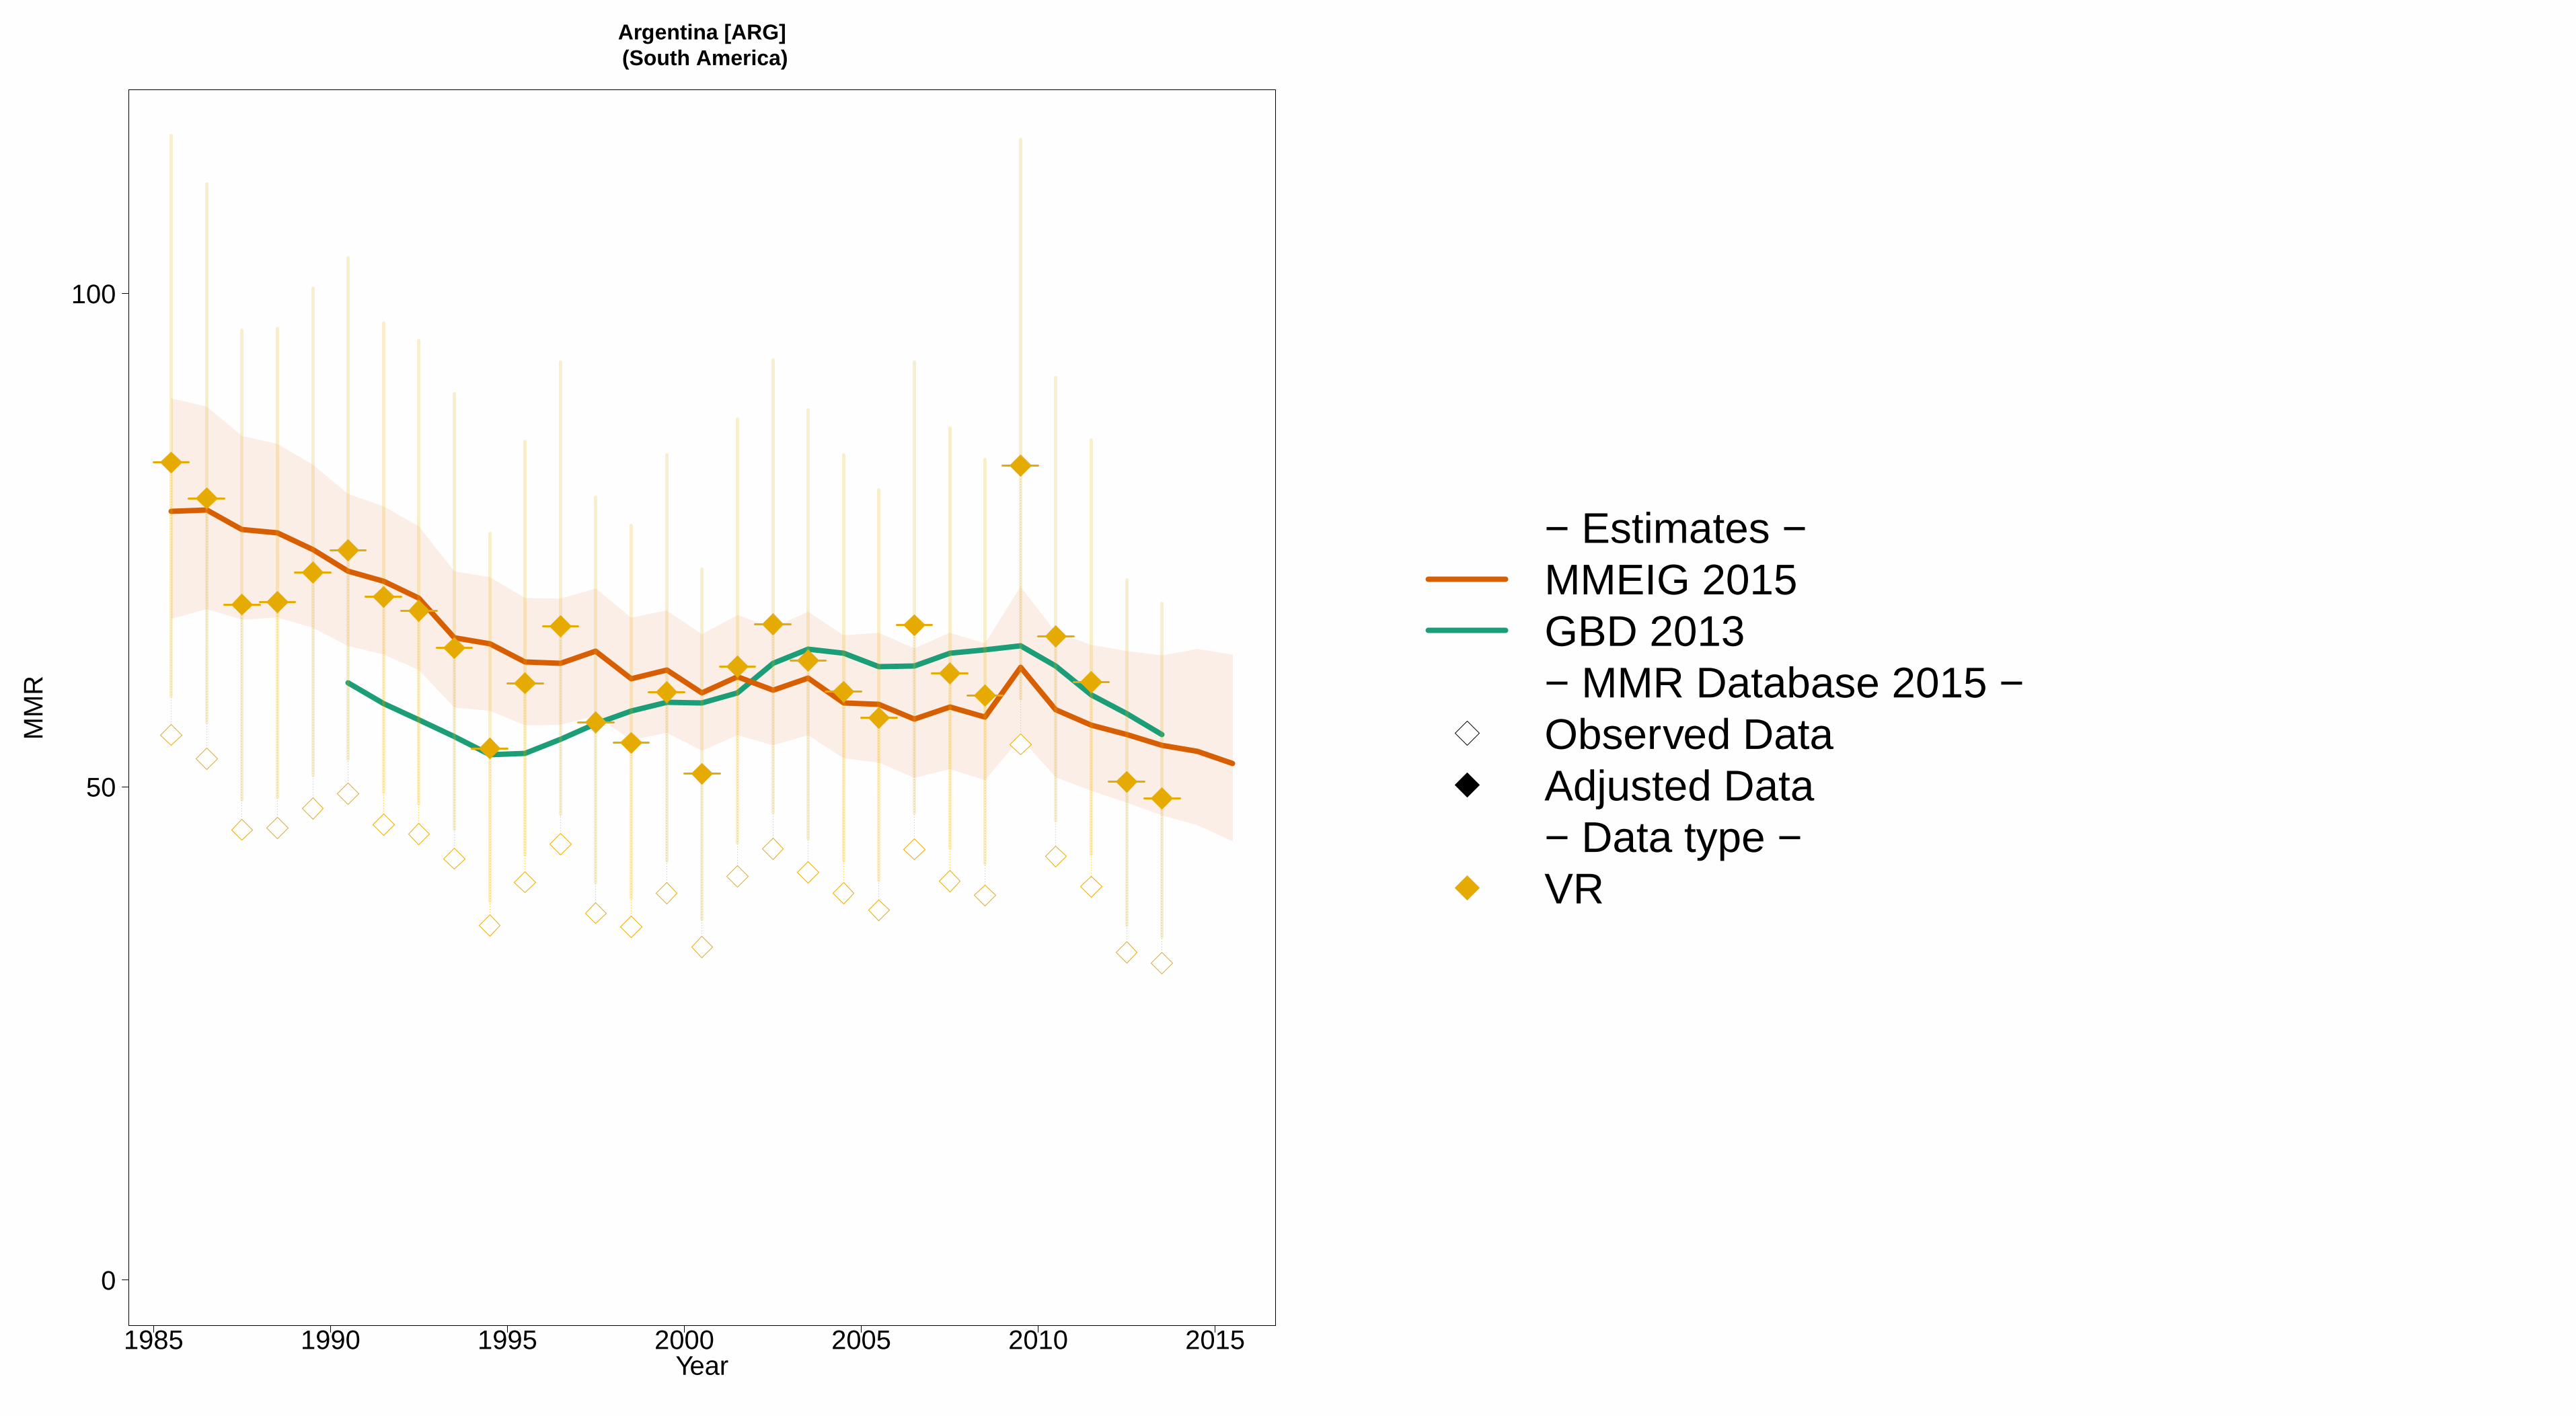
1985 1990 1995 2000 2005 2010 2015
Argentina [ARG] (South America)
Year
0
50
100
MM
R
− Estimates −MMEIG 2015GBD 2013− MMR Database 2015 −Observed DataAdjusted Data− Data type −VR
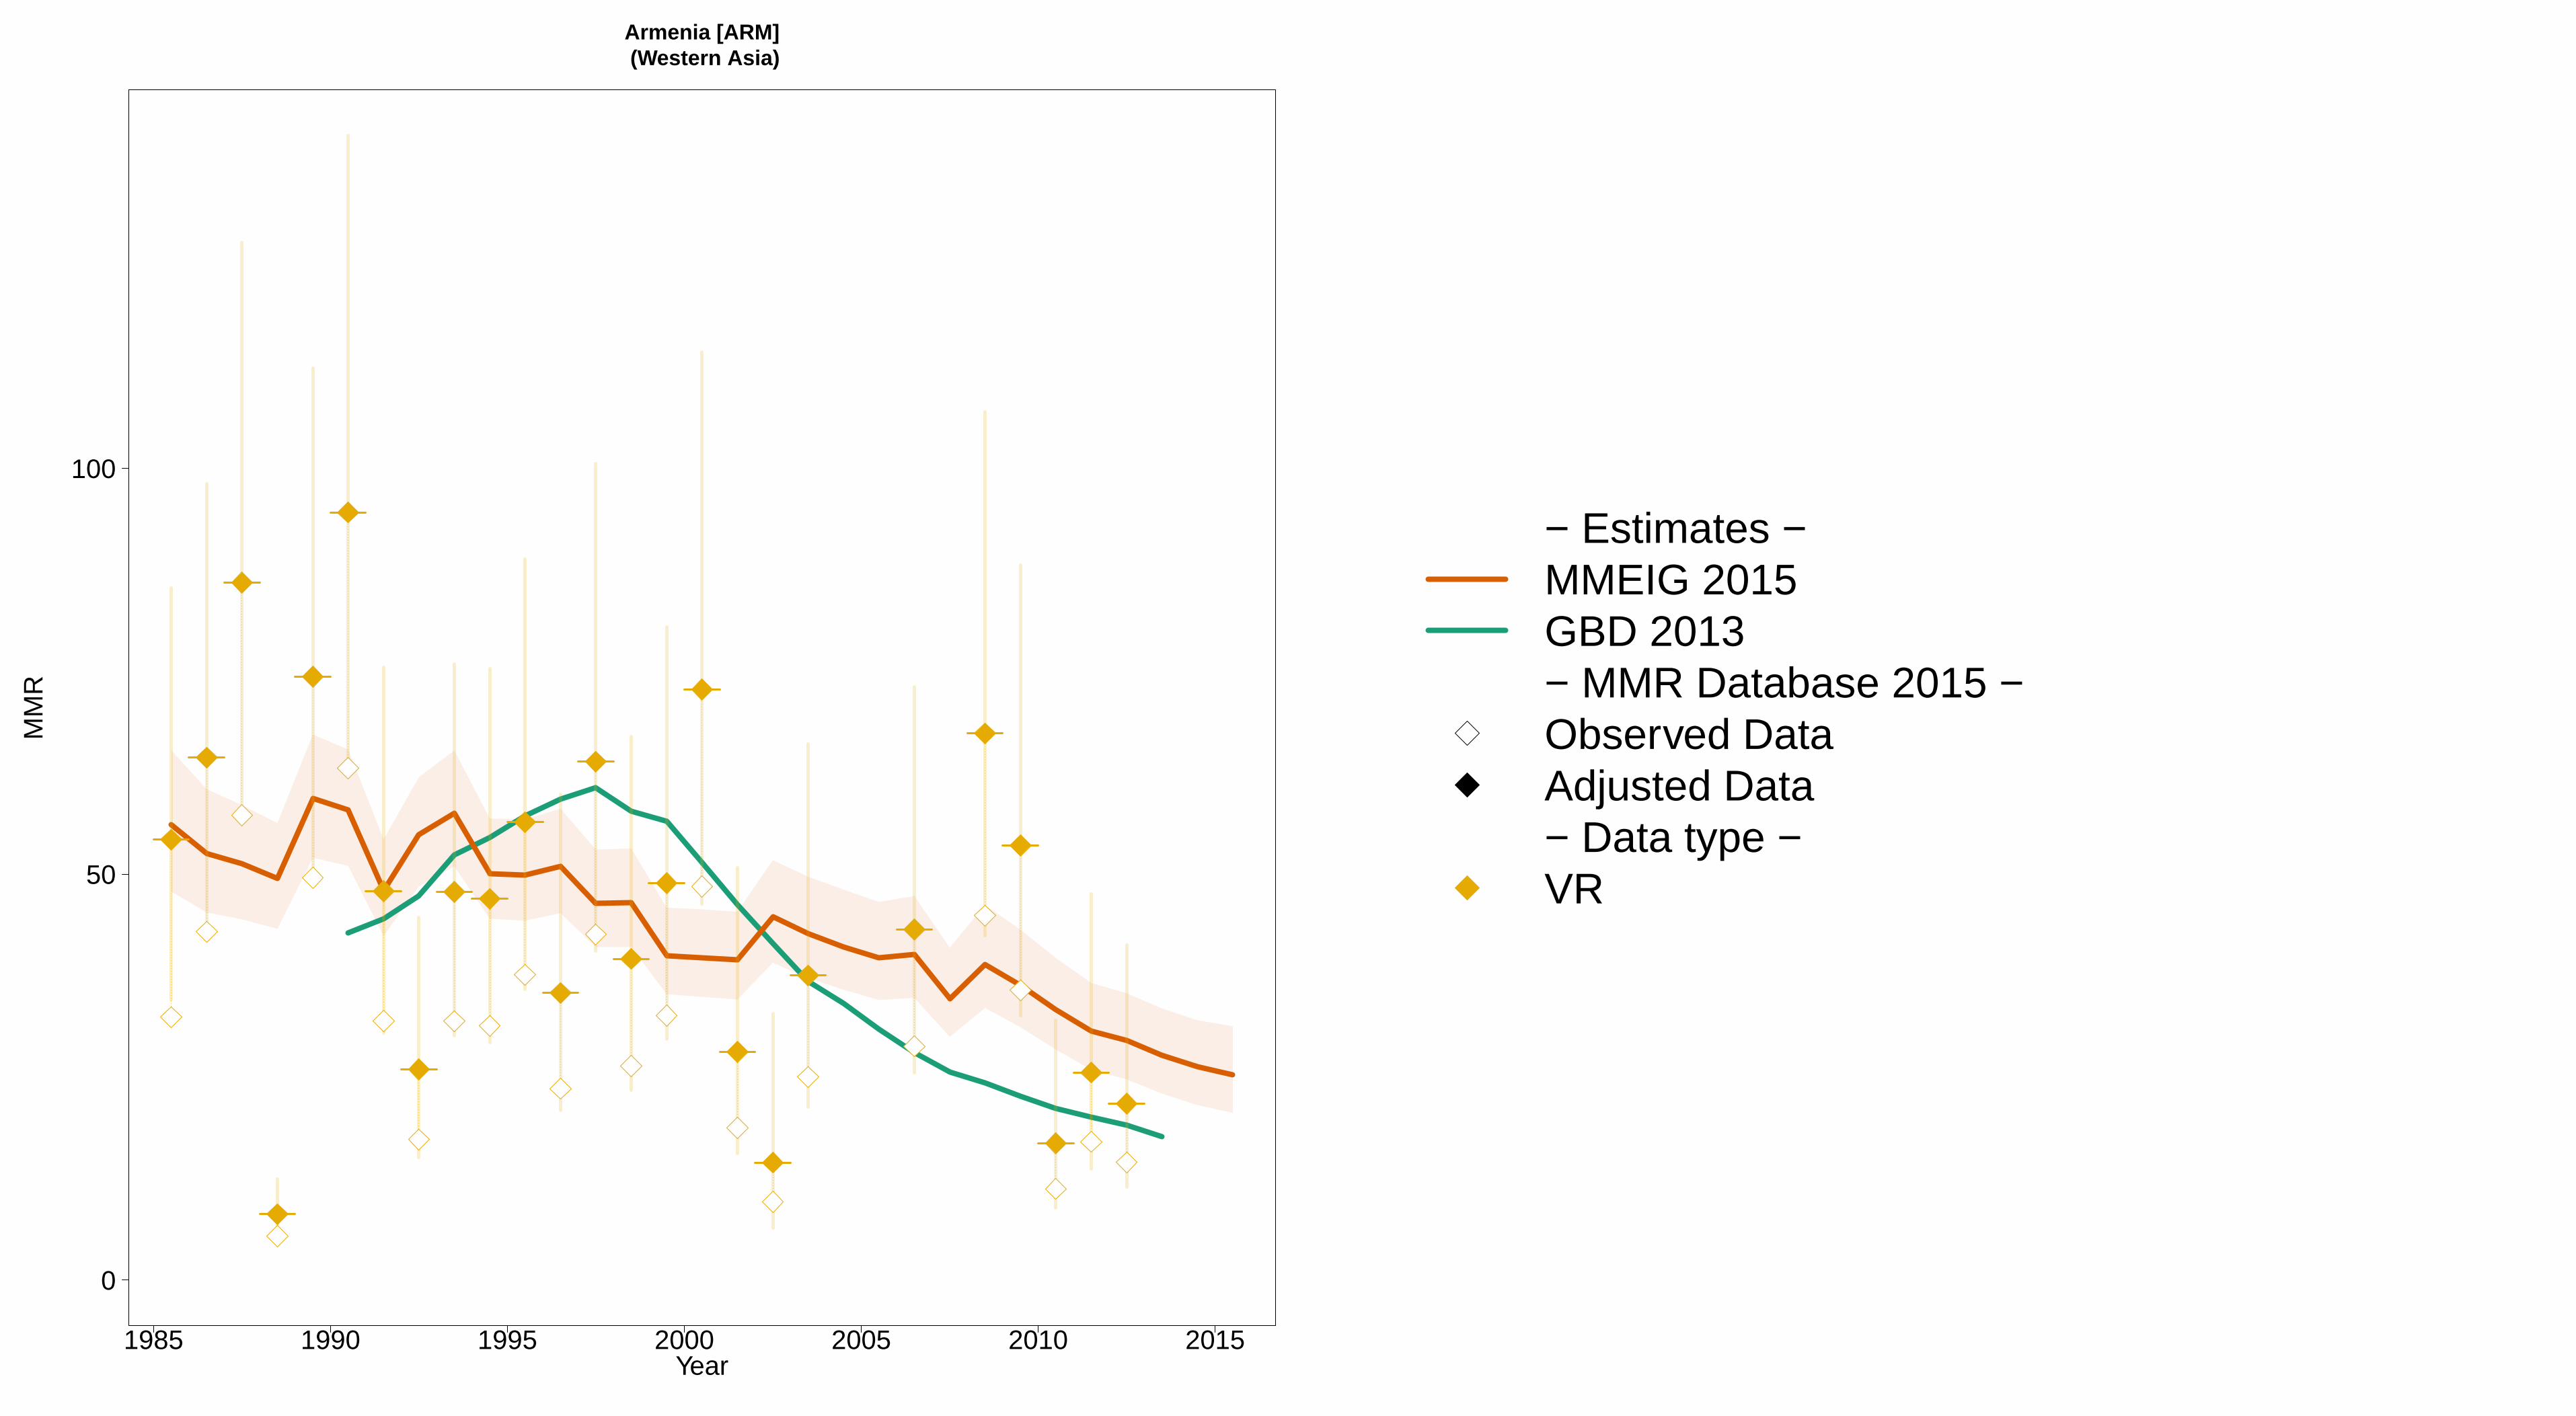
1985 1990 1995 2000 2005 2010 2015
Armenia [ARM] (Western Asia)
Year
0
50
100
MM
R
− Estimates −MMEIG 2015GBD 2013− MMR Database 2015 −Observed DataAdjusted Data− Data type −VR

1985 1990 1995 2000 2005 2010 2015
Australia [AUS] (Developed regions)
Year
0
5
10
15
MM
R
− Estimates −
MMEIG 2015
GBD 2013
− MMR Database 2015 −
Observed Data
Adjusted Data
− Data type −
VR
Spec. studiesExcluded VR data (overlap with specialized study)

1985 1990 1995 2000 2005 2010 2015
Austria [AUT] (Developed regions)
Year
0
5
10
15
20
MM
R
− Estimates −MMEIG 2015GBD 2013− MMR Database 2015 −Observed DataAdjusted Data− Data type −VR

1985 1990 1995 2000 2005 2010 2015
Azerbaijan [AZE] (Western Asia)
Year
0
50
100
MM
R
− Estimates −MMEIG 2015GBD 2013− MMR Database 2015 −Observed DataAdjusted Data− Data type −VR

1985 1990 1995 2000 2005 2010 2015
Bahamas [BHS] (Caribbean)
Year
0
100
200
300
400
MM
R
− Estimates −
MMEIG 2015
GBD 2013
− MMR Database 2015 −
Observed Data
Adjusted Data
− Data type −
VRReported VR before recalc.(related to 0 obs. mat. death)

1985 1990 1995 2000 2005 2010 2015
Bahrain [BHR] (Western Asia)
Year
0
50
100
MM
R
− Estimates −
MMEIG 2015
GBD 2013
− MMR Database 2015 −
Observed Data
Adjusted Data
− Data type −
VRReported VR before recalc.(related to 0 obs. mat. death)

1985 1990 1995 2000 2005 2010 2015
Bangladesh [BGD] (Southern Asia)
Year
0
100
200
300
400
500
600
700
800
900
MM
R
− Estimates −MMEIG 2015GBD 2013− MMR Database 2015 −Observed DataAdjusted Data− Data type −DHSMisc. studies

1985 1990 1995 2000 2005 2010 2015
Barbados [BRB] (Caribbean)
Year
0
100
200
300
400
MM
R
− Estimates −
MMEIG 2015
GBD 2013
− MMR Database 2015 −
Observed Data
Adjusted Data
− Data type −
VRReported VR before recalc.(related to 0 obs. mat. death)
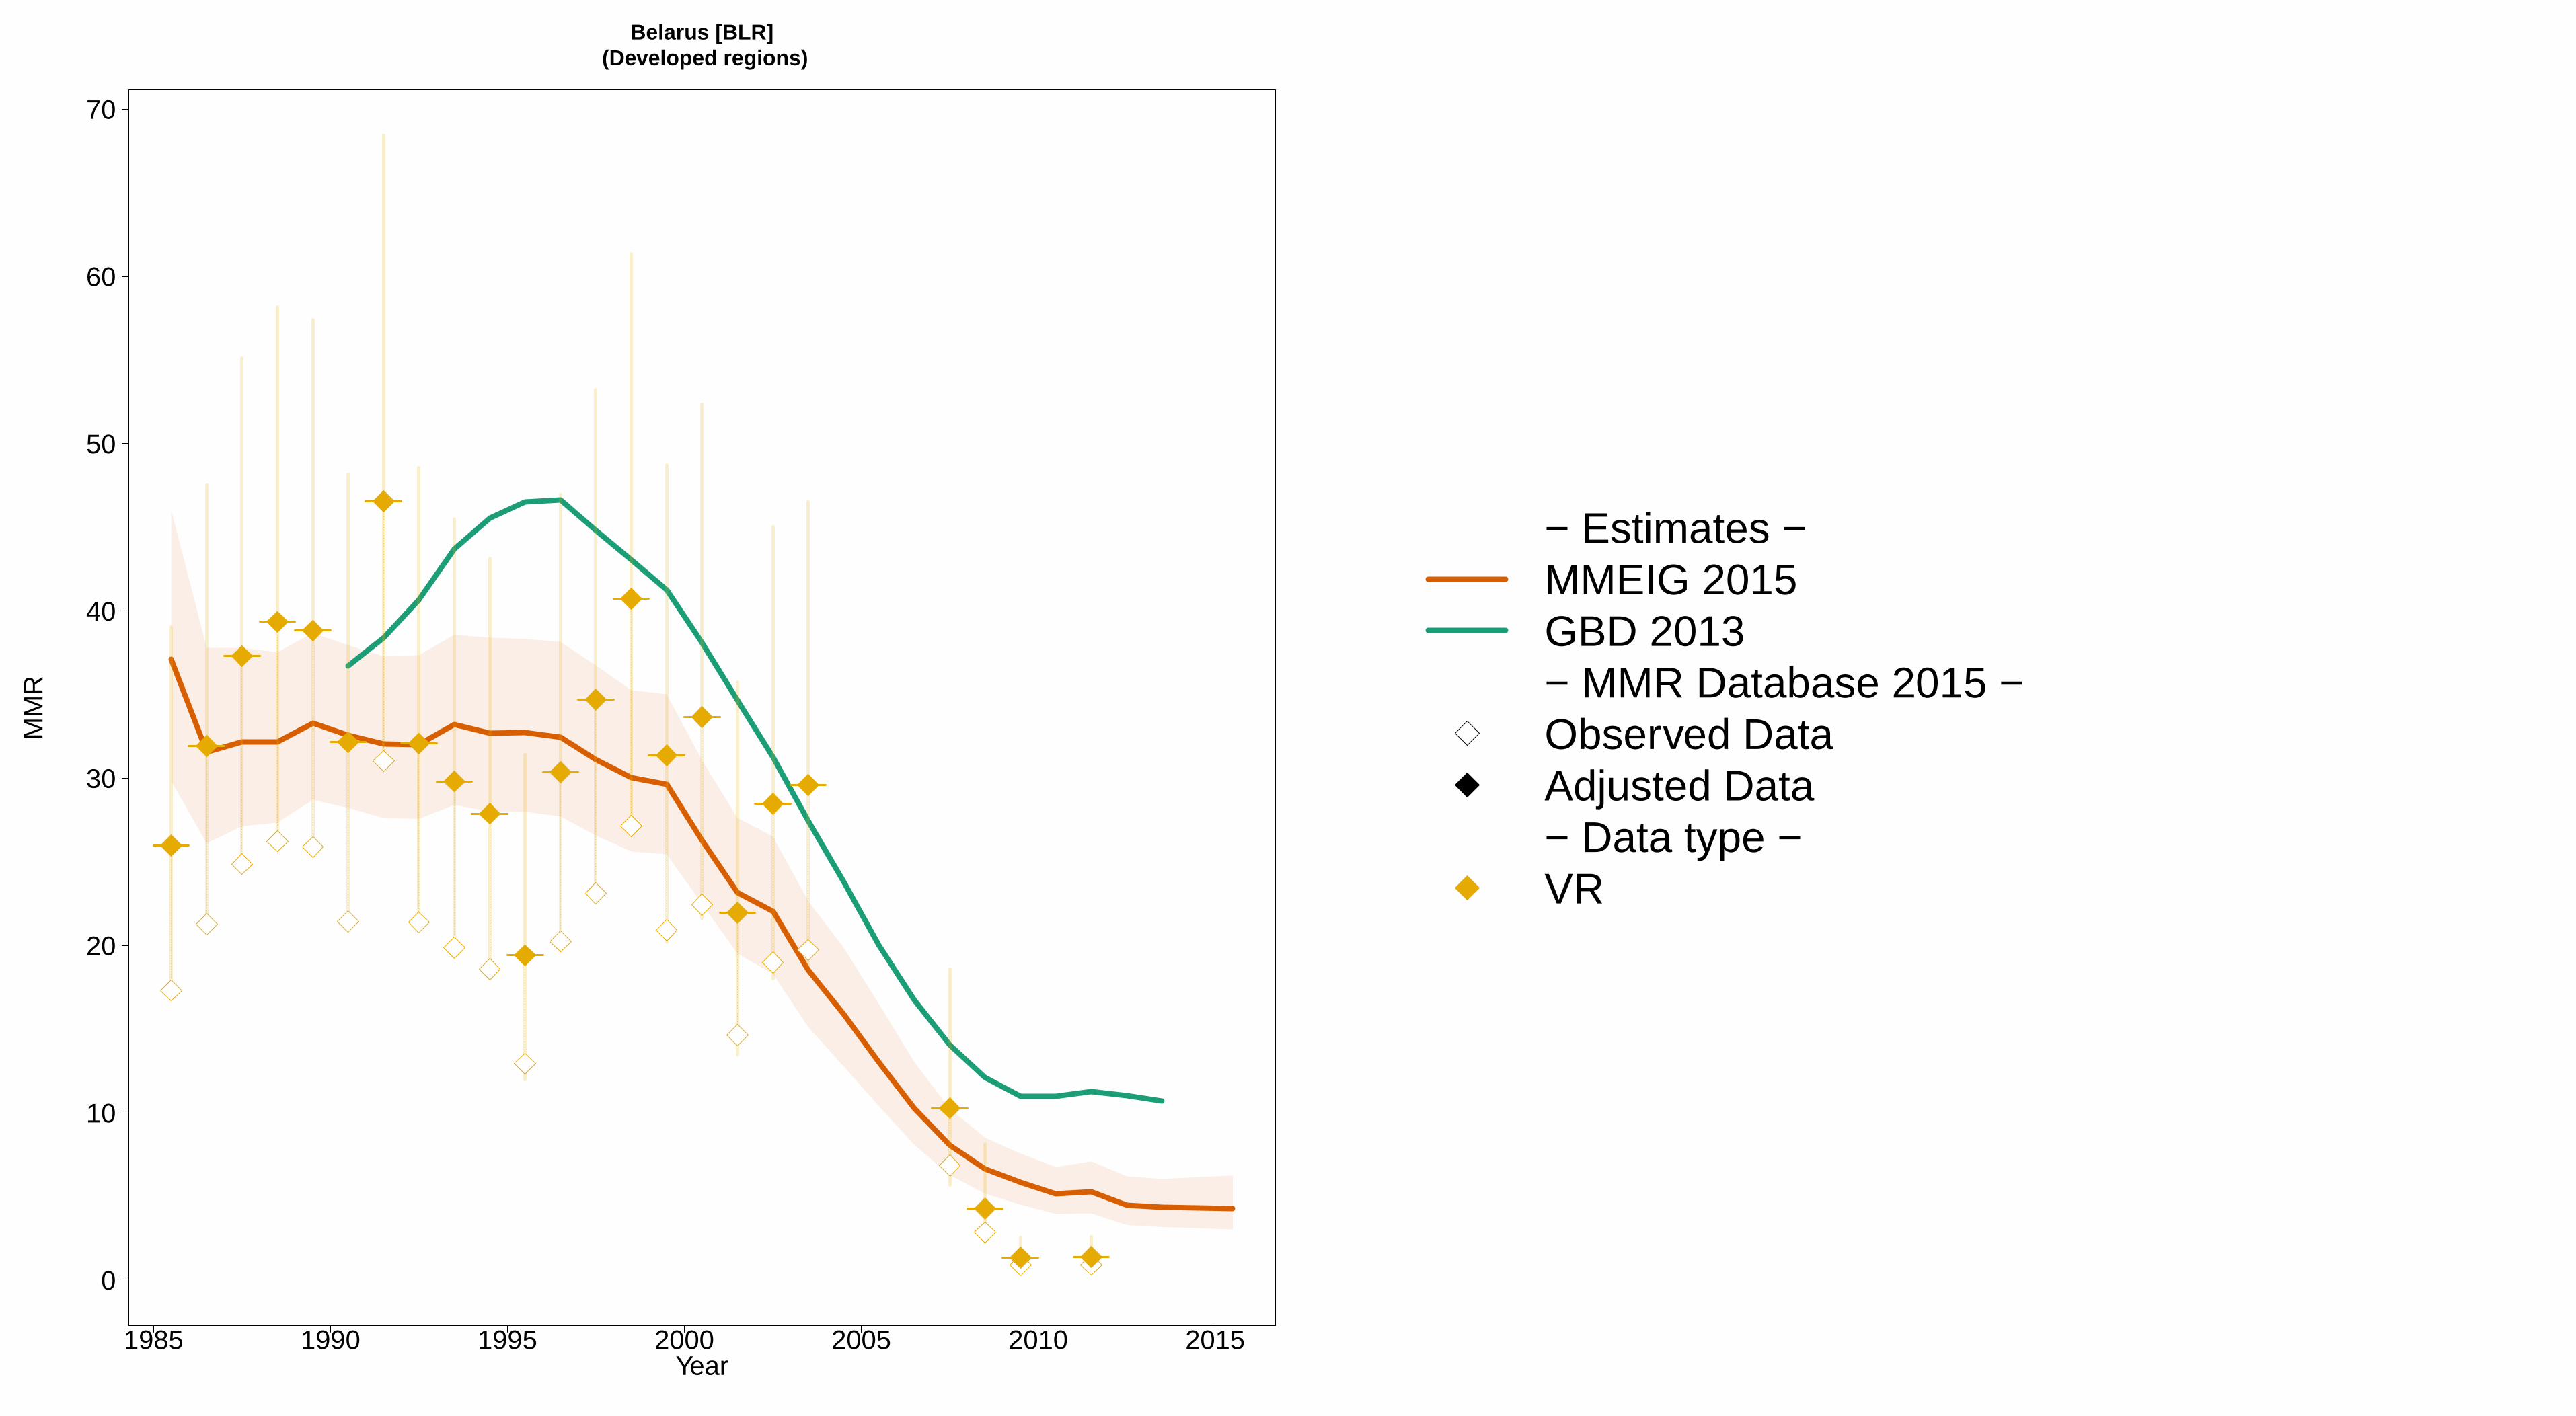
1985 1990 1995 2000 2005 2010 2015
Belarus [BLR] (Developed regions)
Year
0
10
20
30
40
50
60
70
MM
R
− Estimates −MMEIG 2015GBD 2013− MMR Database 2015 −Observed DataAdjusted Data− Data type −VR

1985 1990 1995 2000 2005 2010 2015
Belgium [BEL] (Developed regions)
Year
0
5
10
15
20
25
MM
R
− Estimates −MMEIG 2015GBD 2013− MMR Database 2015 −Observed DataAdjusted Data− Data type −VR

1985 1990 1995 2000 2005 2010 2015
Belize [BLZ] (Central America)
Year
0
50
100
150
200
250
MM
R
− Estimates −
MMEIG 2015
GBD 2013
− MMR Database 2015 −
Observed Data
Adjusted Data
− Data type −
VRReported VR before recalc.(related to 0 obs. mat. death)
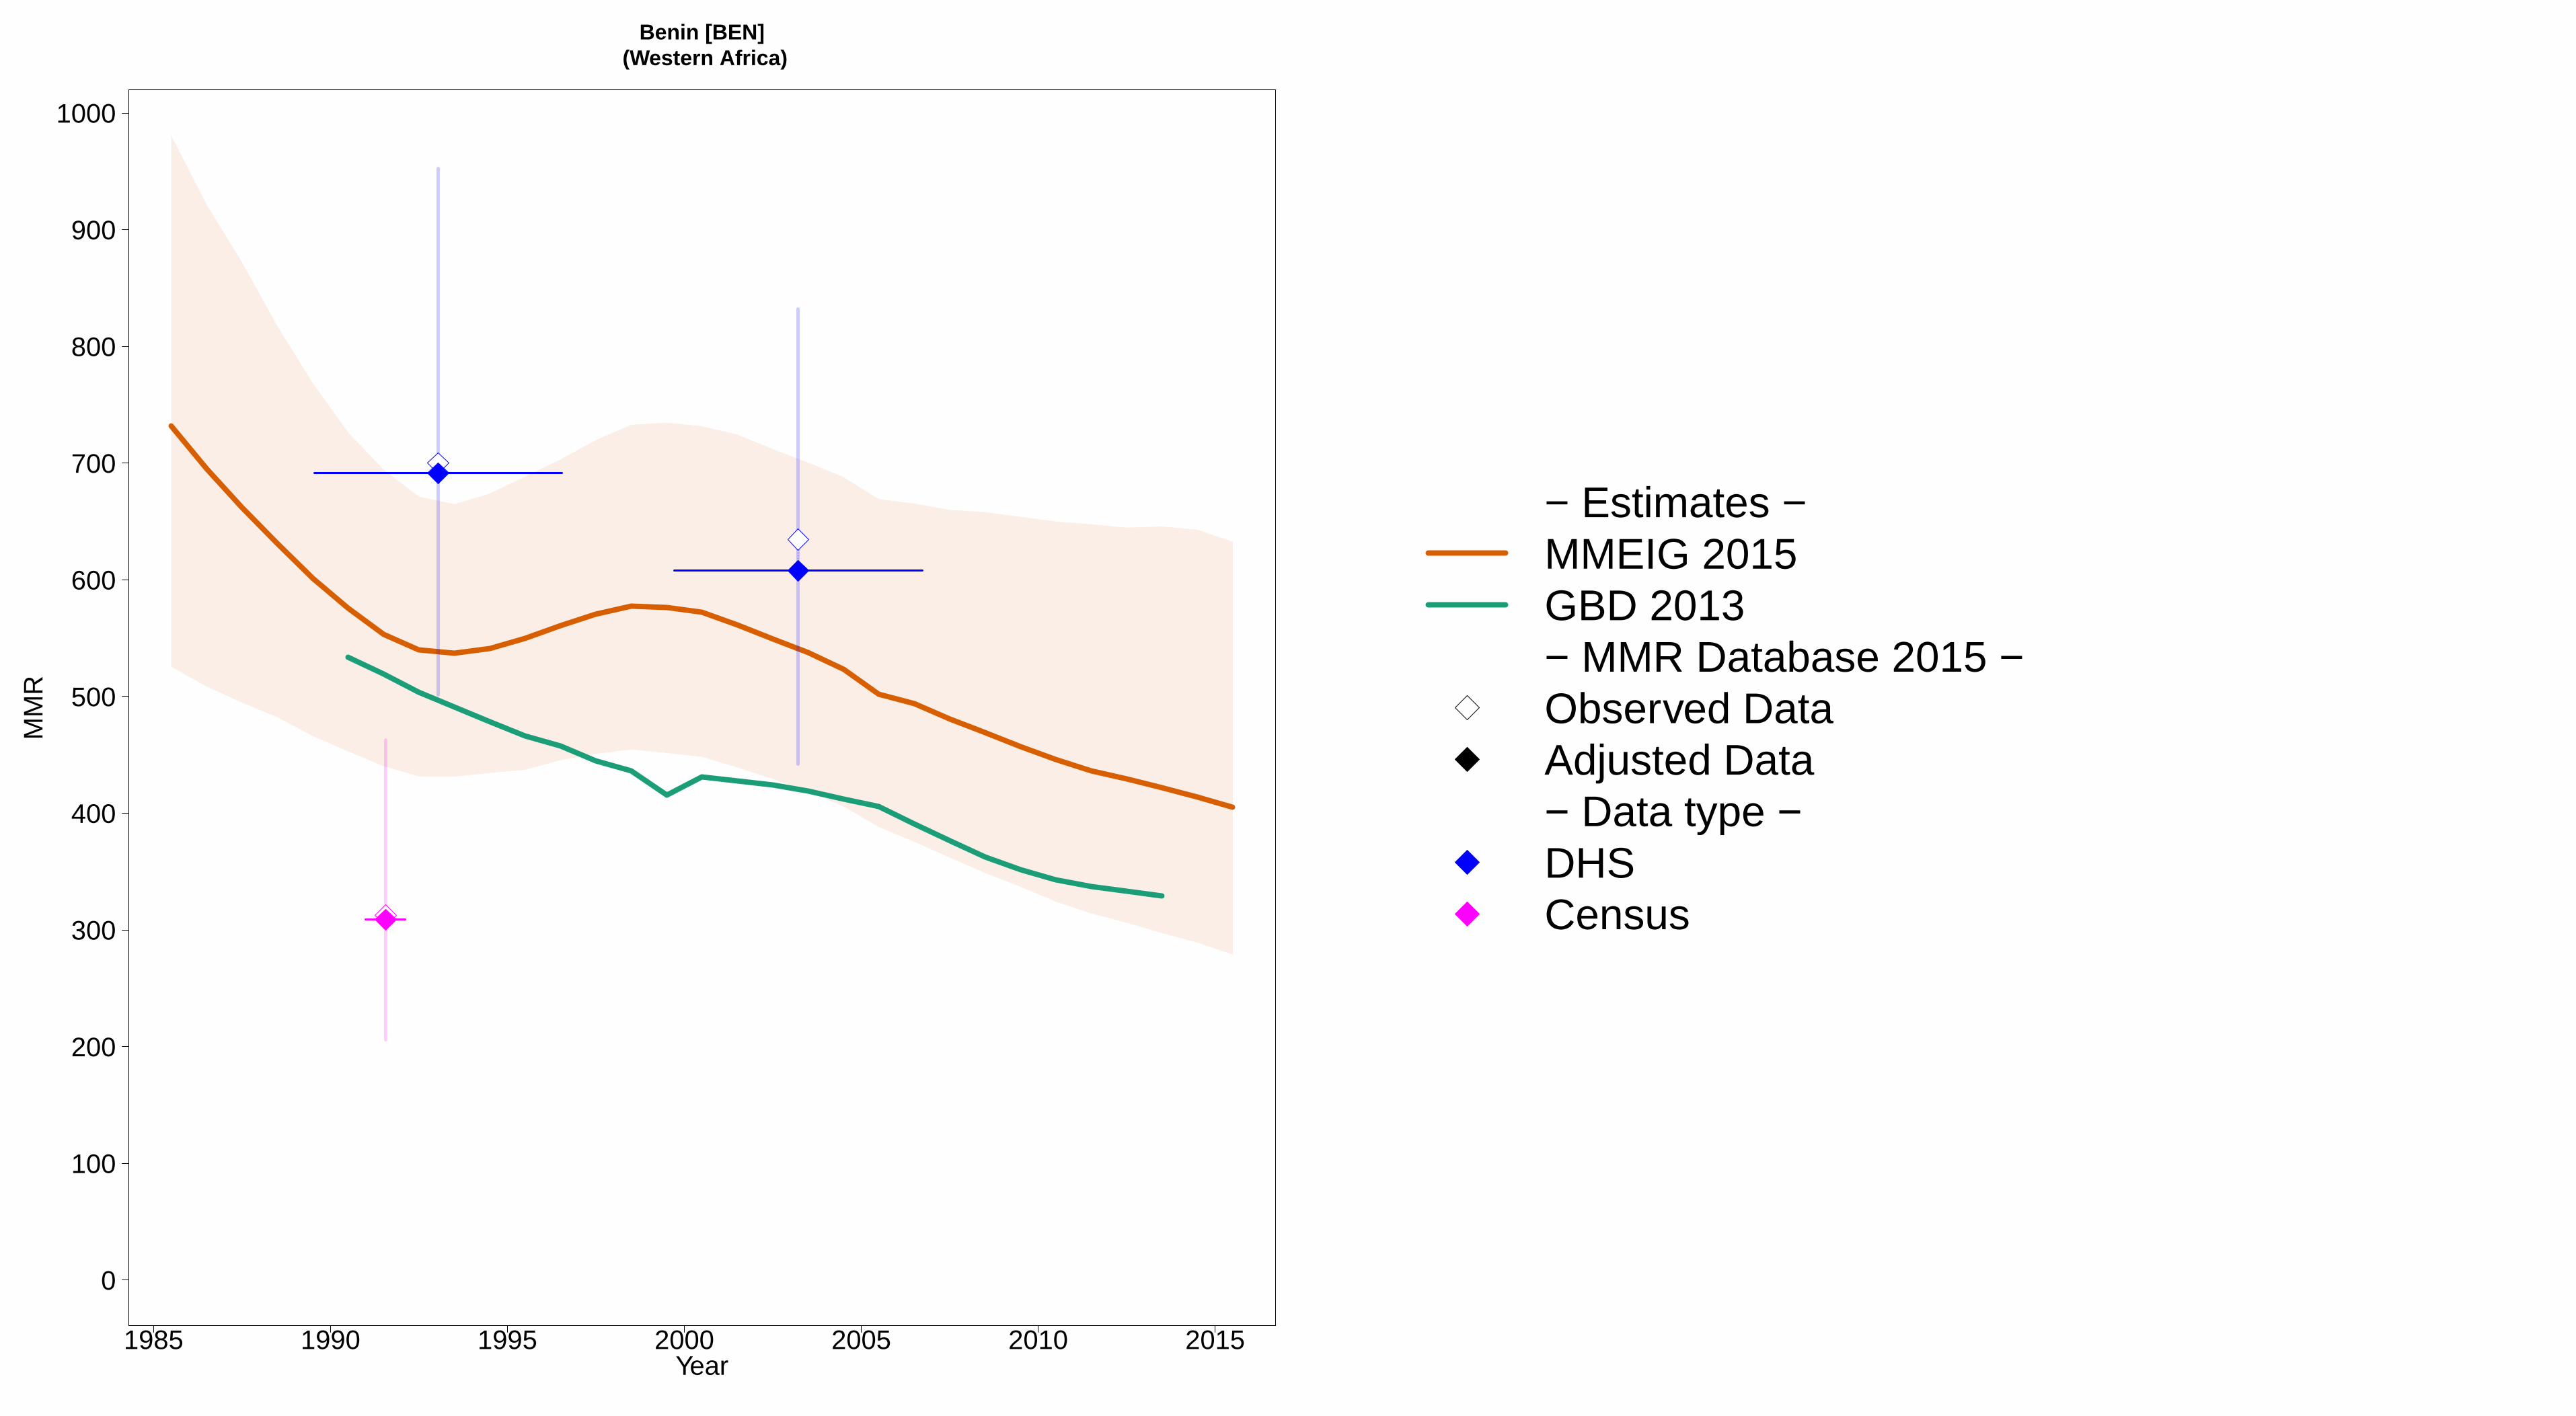
1985 1990 1995 2000 2005 2010 2015
Benin [BEN] (Western Africa)
Year
0
100
200
300
400
500
600
700
800
900
1000
MM
R
− Estimates −MMEIG 2015GBD 2013− MMR Database 2015 −Observed DataAdjusted Data− Data type −DHSCensus
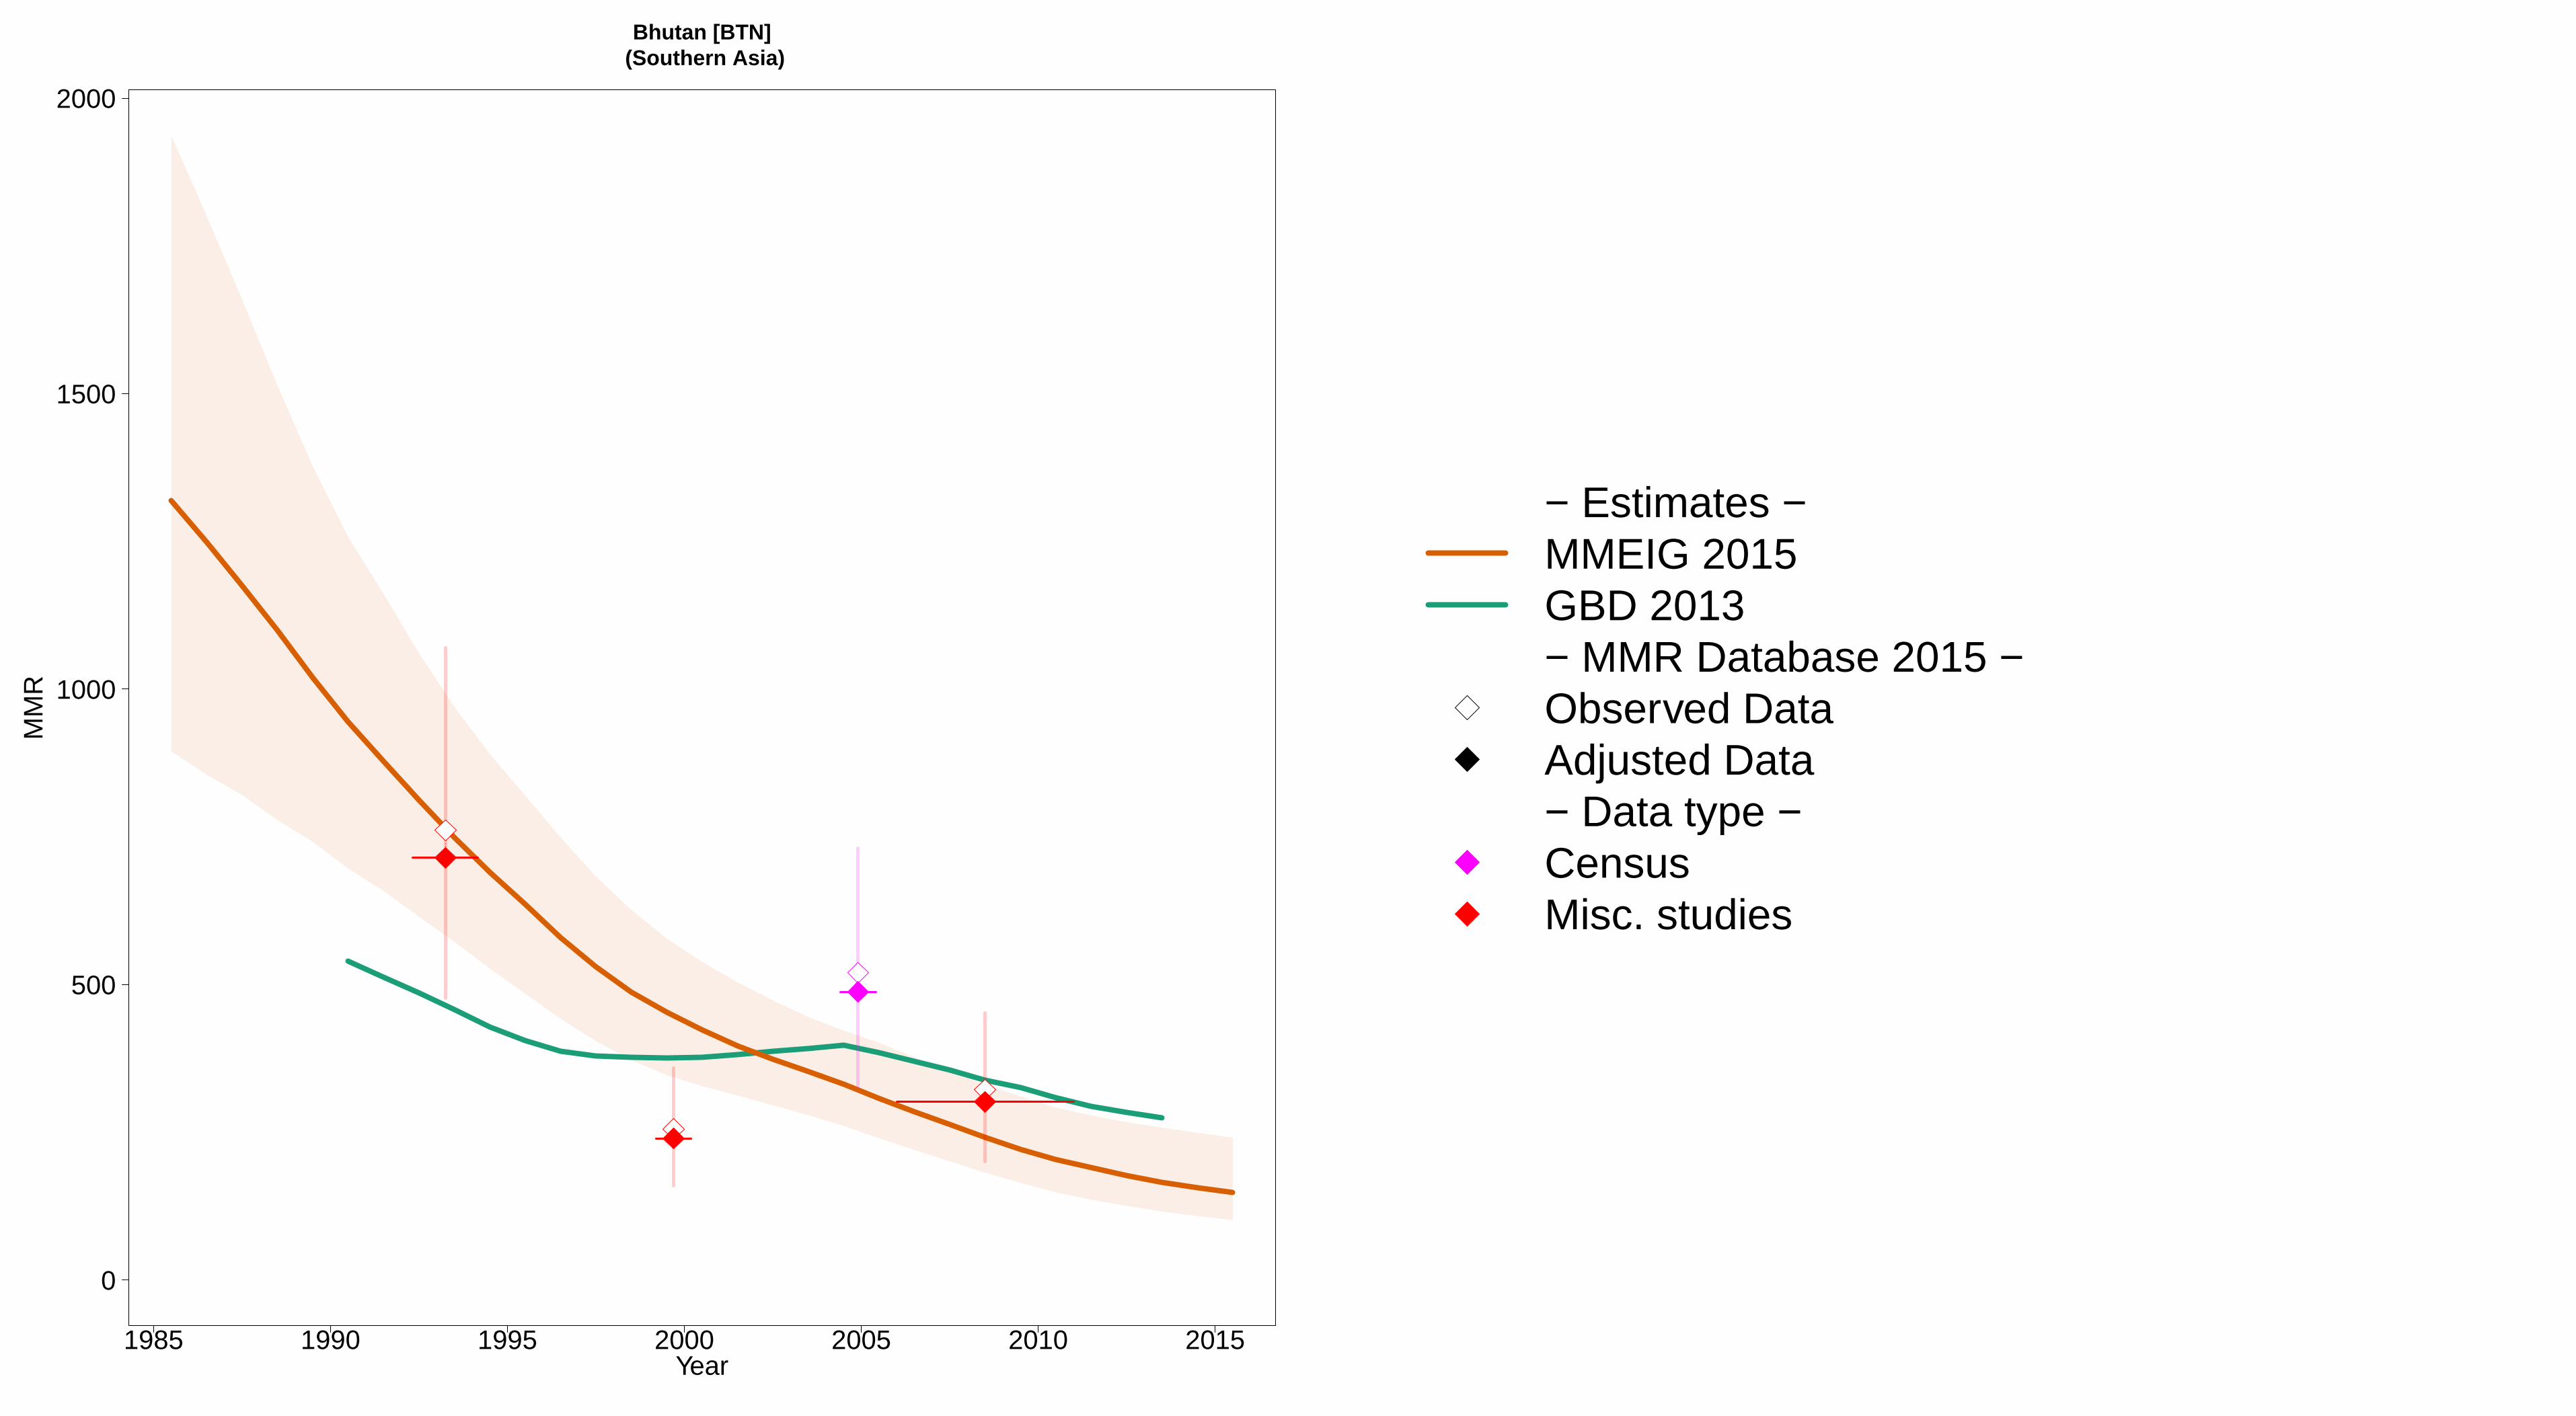
1985 1990 1995 2000 2005 2010 2015
Bhutan [BTN] (Southern Asia)
Year
0
500
1000
1500
2000
MM
R
− Estimates −MMEIG 2015GBD 2013− MMR Database 2015 −Observed DataAdjusted Data− Data type −CensusMisc. studies

1985 1990 1995 2000 2005 2010 2015
Bolivia [BOL] (South America)
Year
0
100
200
300
400
500
600
MM
R
●●
●●
− Estimates −
MMEIG 2015
GBD 2013
− MMR Database 2015 −
Observed Data
Adjusted Data
− Data type −
DHS
Census
Misc. studiesExcluded VR data (data quality issues)

1985 1990 1995 2000 2005 2010 2015
Bosnia and Herzegovina [BIH] (Transition countries of South−Eastern Europe)
Year
0
10
20
30
40
50
60
70
MM
R
− Estimates −MMEIG 2015GBD 2013− MMR Database 2015 −Observed DataAdjusted Data− Data type −VR
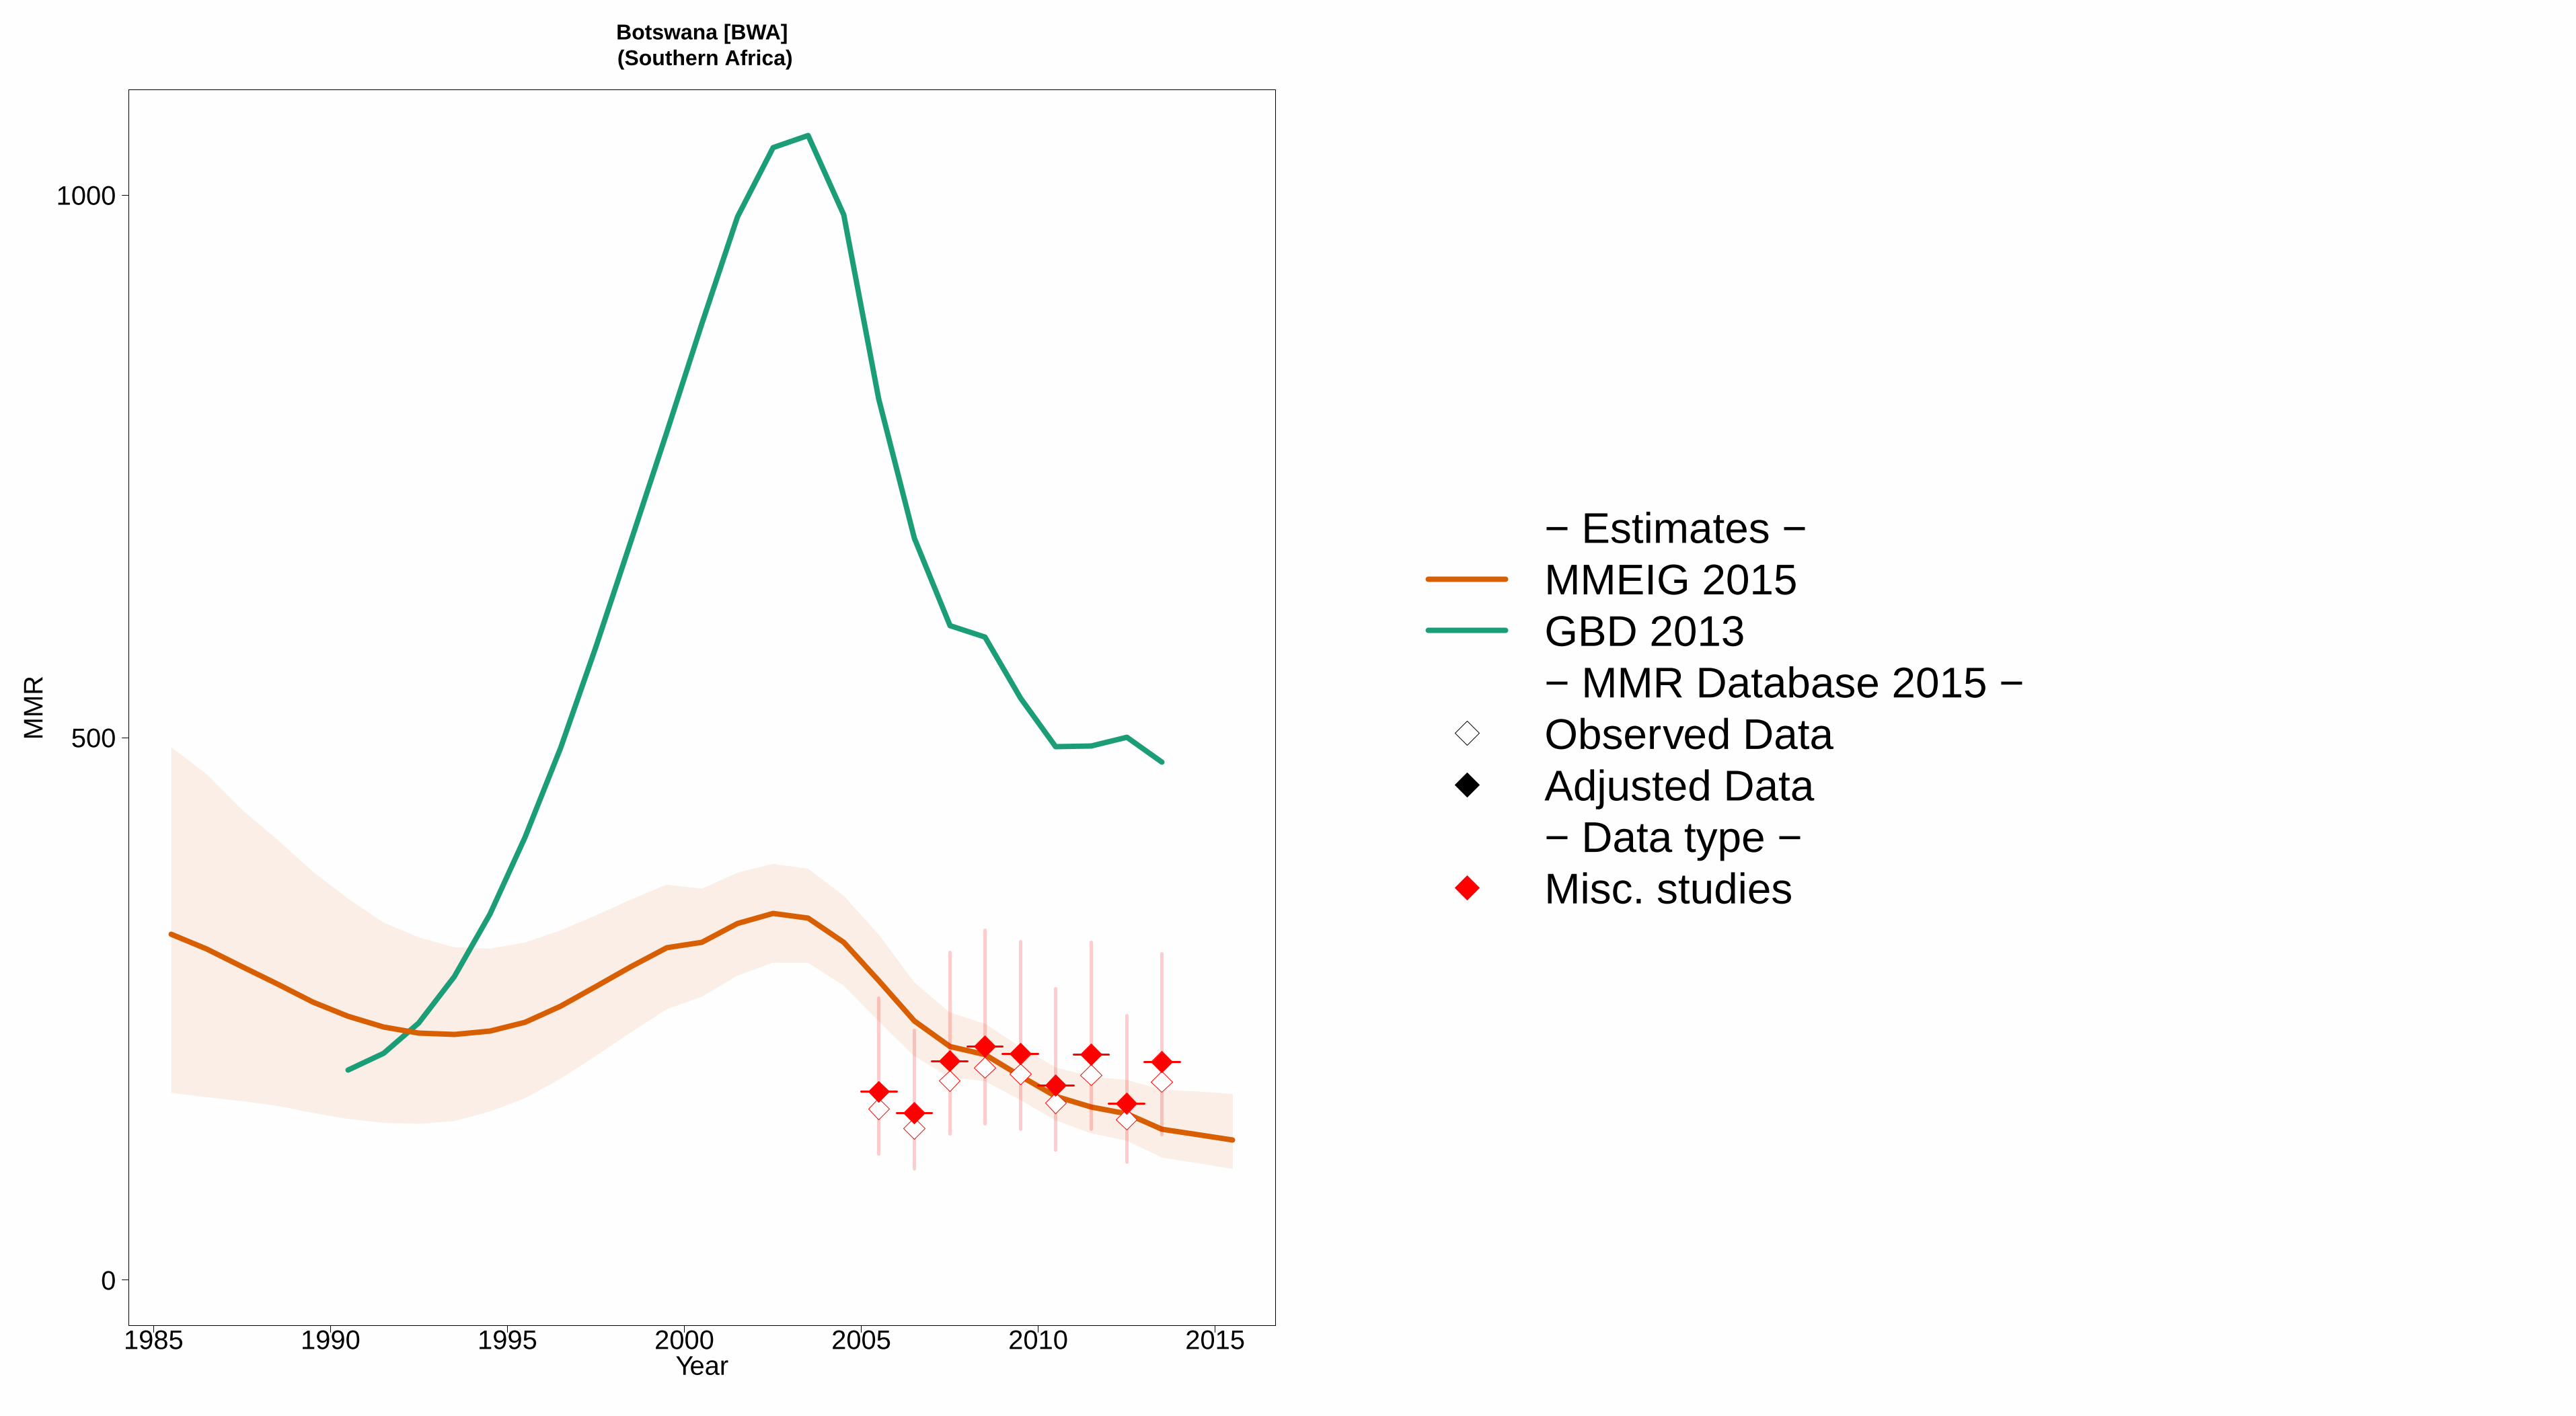
1985 1990 1995 2000 2005 2010 2015
Botswana [BWA] (Southern Africa)
Year
0
500
1000
MM
R
− Estimates −MMEIG 2015GBD 2013− MMR Database 2015 −Observed DataAdjusted Data− Data type −Misc. studies
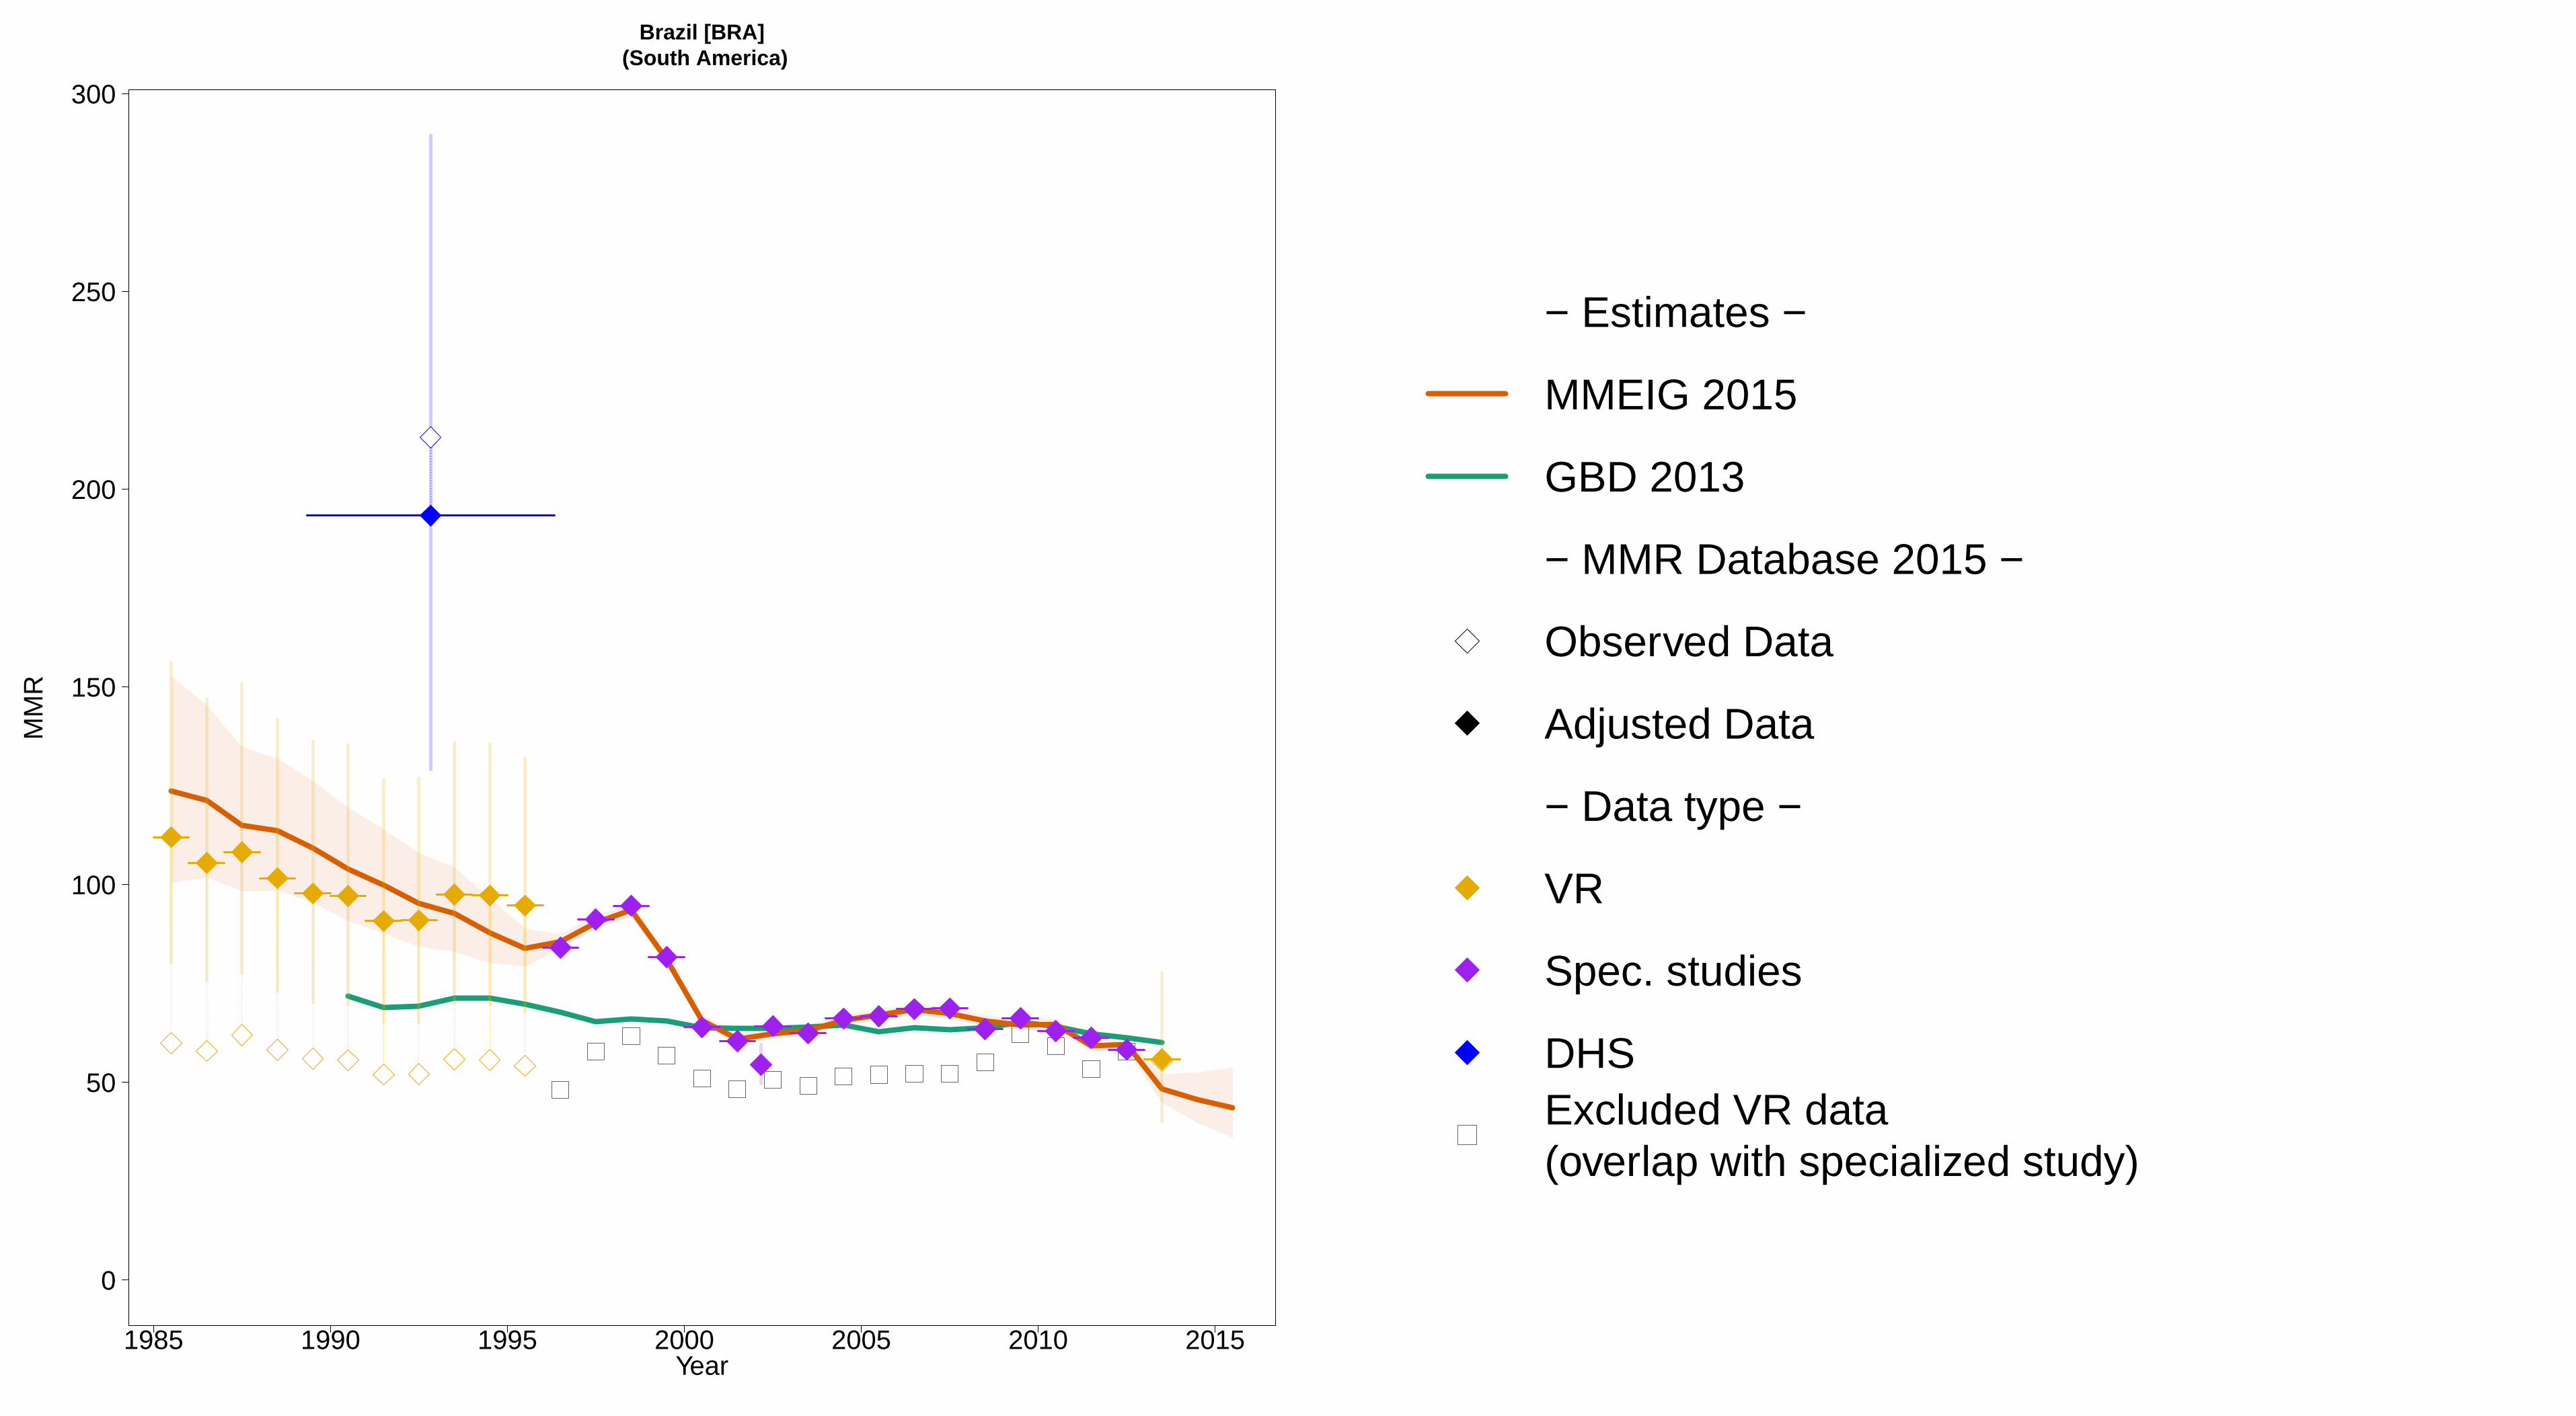
1985 1990 1995 2000 2005 2010 2015
Brazil [BRA] (South America)
Year
0
50
100
150
200
250
300
MM
R
− Estimates −
MMEIG 2015
GBD 2013
− MMR Database 2015 −
Observed Data
Adjusted Data
− Data type −
VR
Spec. studies
DHSExcluded VR data (overlap with specialized study)

1985 1990 1995 2000 2005 2010 2015
Brunei Darussalam [BRN] (South−Eastern Asia / Oceania)
Year
0
50
100
MM
R
− Estimates −
MMEIG 2015
GBD 2013
− MMR Database 2015 −
Observed Data
Adjusted Data
− Data type −
VRReported VR before recalc.(related to 0 obs. mat. death)
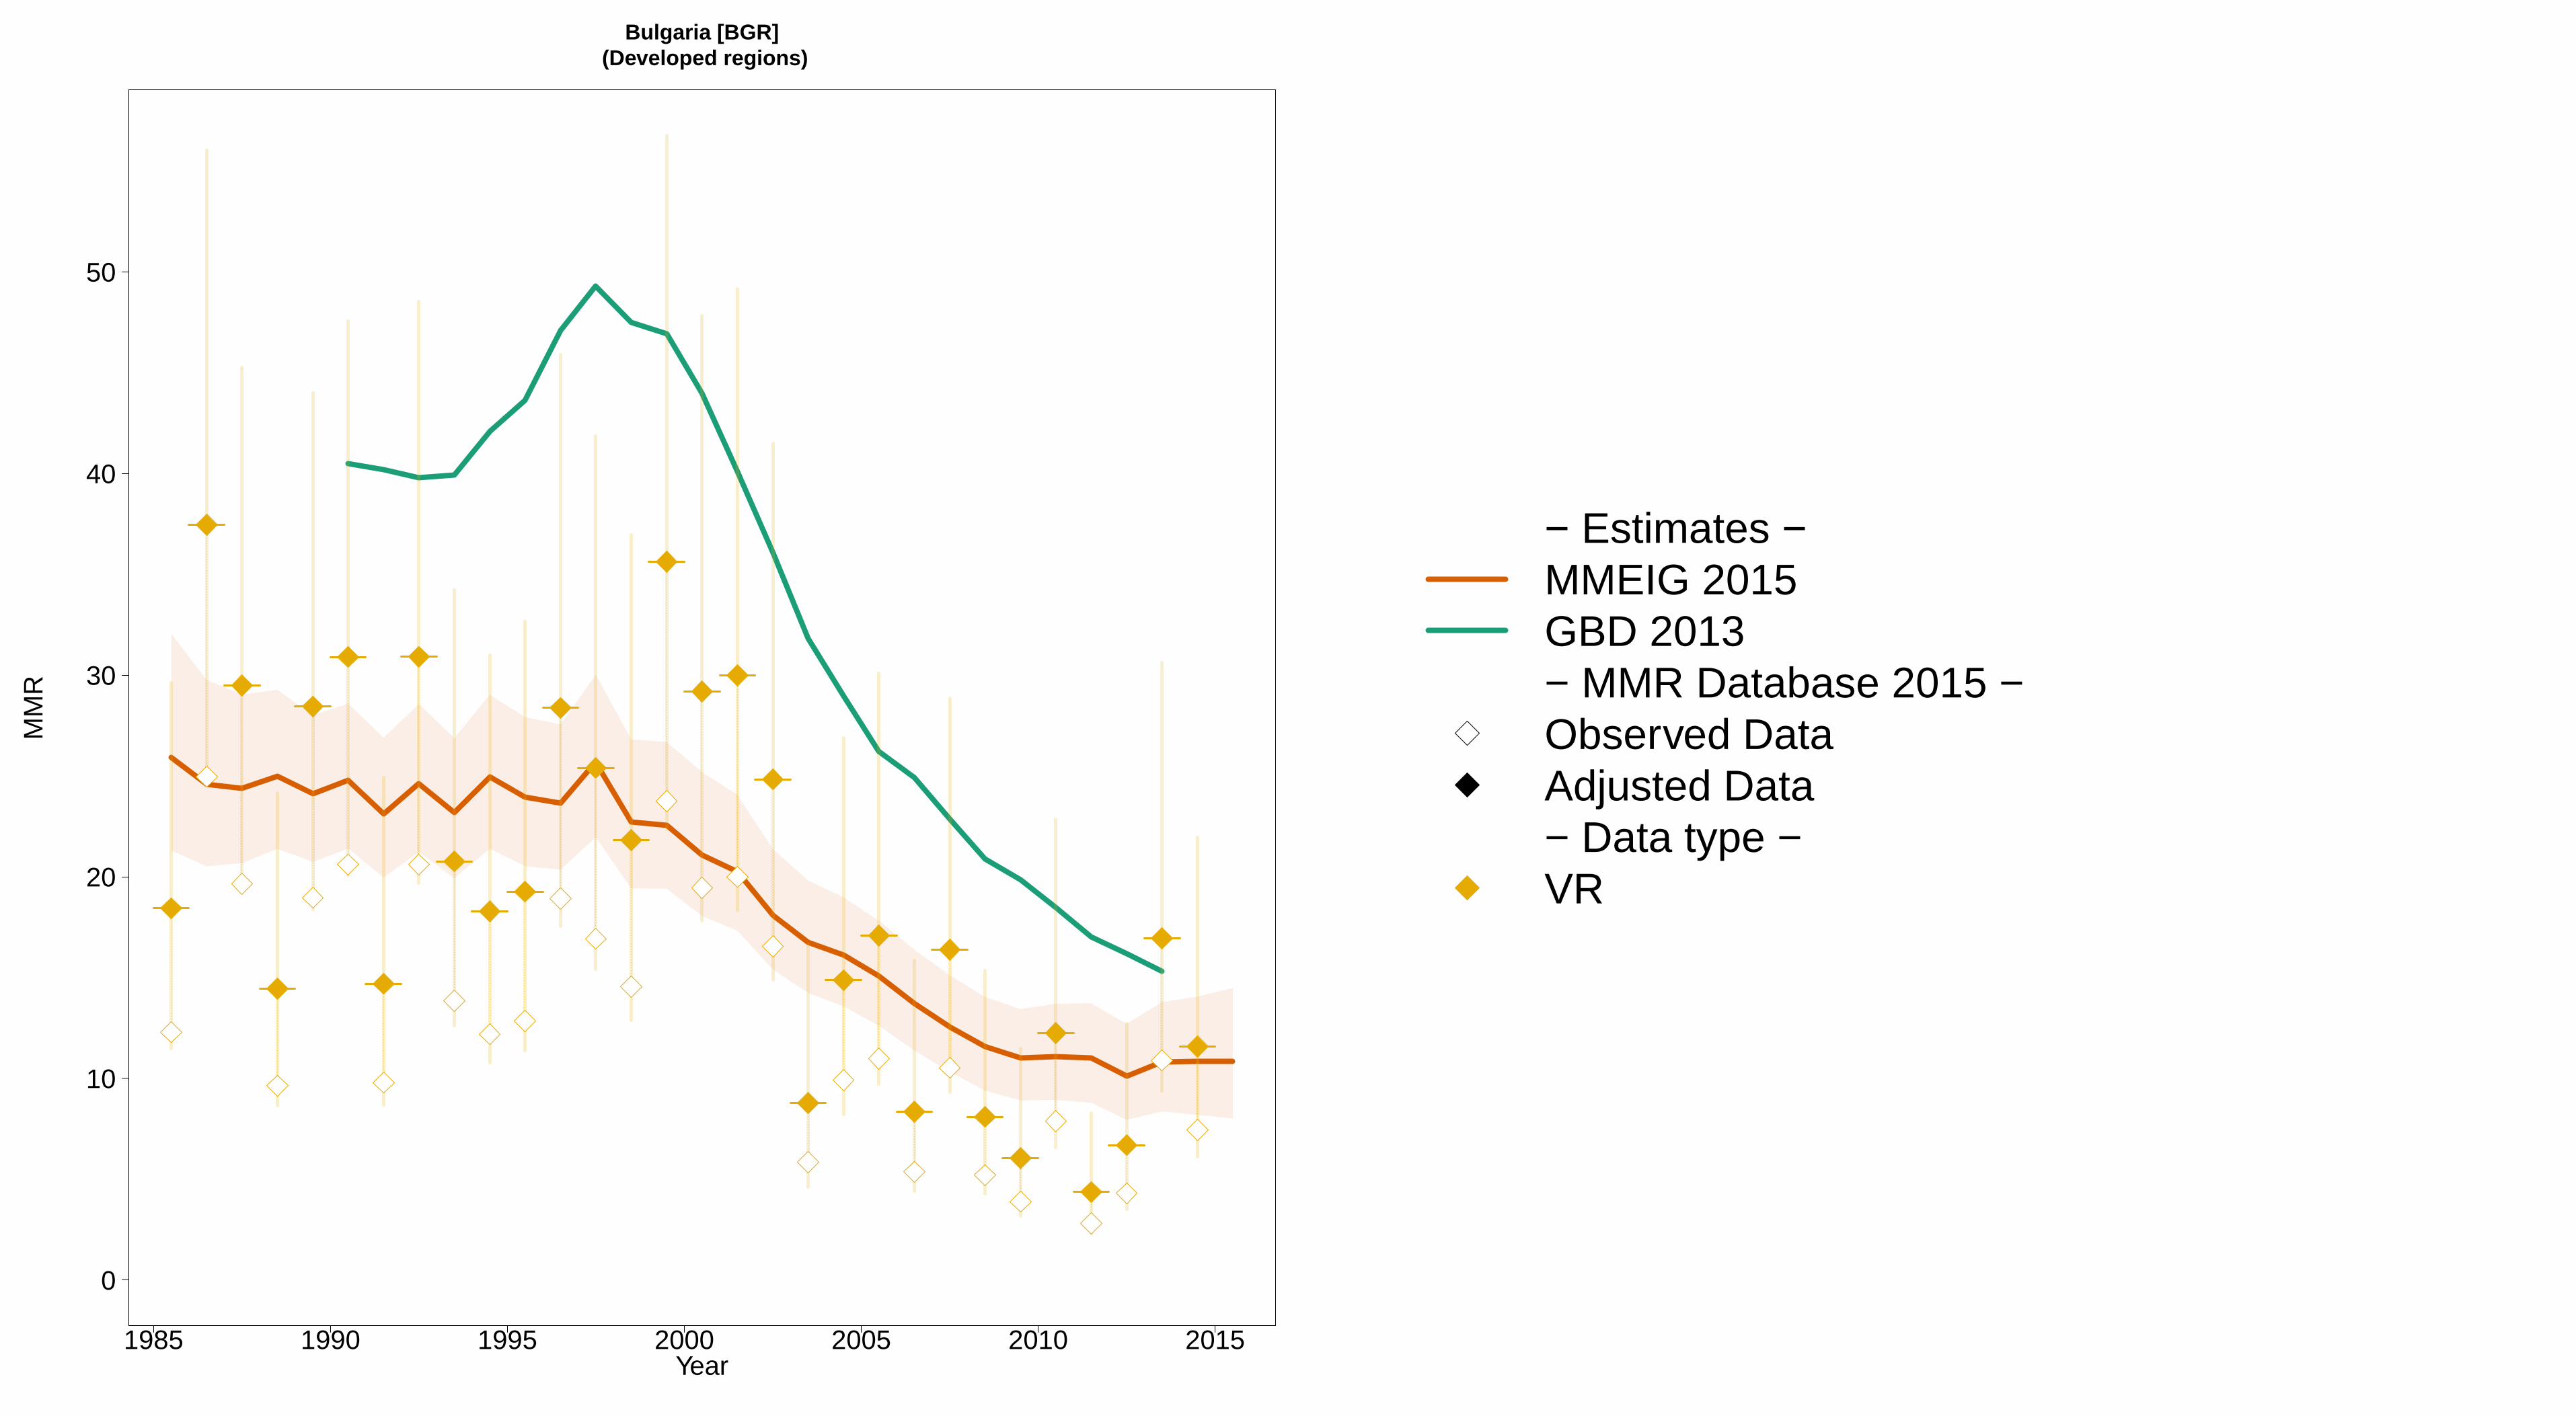
1985 1990 1995 2000 2005 2010 2015
Bulgaria [BGR] (Developed regions)
Year
0
10
20
30
40
50
MM
R
− Estimates −MMEIG 2015GBD 2013− MMR Database 2015 −Observed DataAdjusted Data− Data type −VR

1985 1990 1995 2000 2005 2010 2015
Burkina Faso [BFA] (Western Africa)
Year
0
500
1000
MM
R
− Estimates −MMEIG 2015GBD 2013− MMR Database 2015 −Observed DataAdjusted Data− Data type −DHSCensus

1985 1990 1995 2000 2005 2010 2015
Burundi [BDI] (Eastern Africa)
Year
0
500
1000
1500
MM
R
− Estimates −MMEIG 2015GBD 2013− MMR Database 2015 −Observed DataAdjusted Data− Data type −DHS

1985 1990 1995 2000 2005 2010 2015
Cabo Verde [CPV] (Western Africa)
Year
0
100
200
300
400
500
600
700
MM
R
●
●
− Estimates −
MMEIG 2015
GBD 2013
− MMR Database 2015 −
Observed Data
Adjusted Data
− Data type −Excluded VR data (data quality issues)

1985 1990 1995 2000 2005 2010 2015
Cambodia [KHM] (South−Eastern Asia / Oceania)
Year
0
500
1000
1500
2000
MM
R
− Estimates −MMEIG 2015GBD 2013− MMR Database 2015 −Observed DataAdjusted Data− Data type −DHSCensusMisc. studies

1985 1990 1995 2000 2005 2010 2015
Cameroon [CMR] (Middle Africa)
Year
0
500
1000
MM
R
− Estimates −MMEIG 2015GBD 2013− MMR Database 2015 −Observed DataAdjusted Data− Data type −DHSMisc. studiesExcluded misc. studies
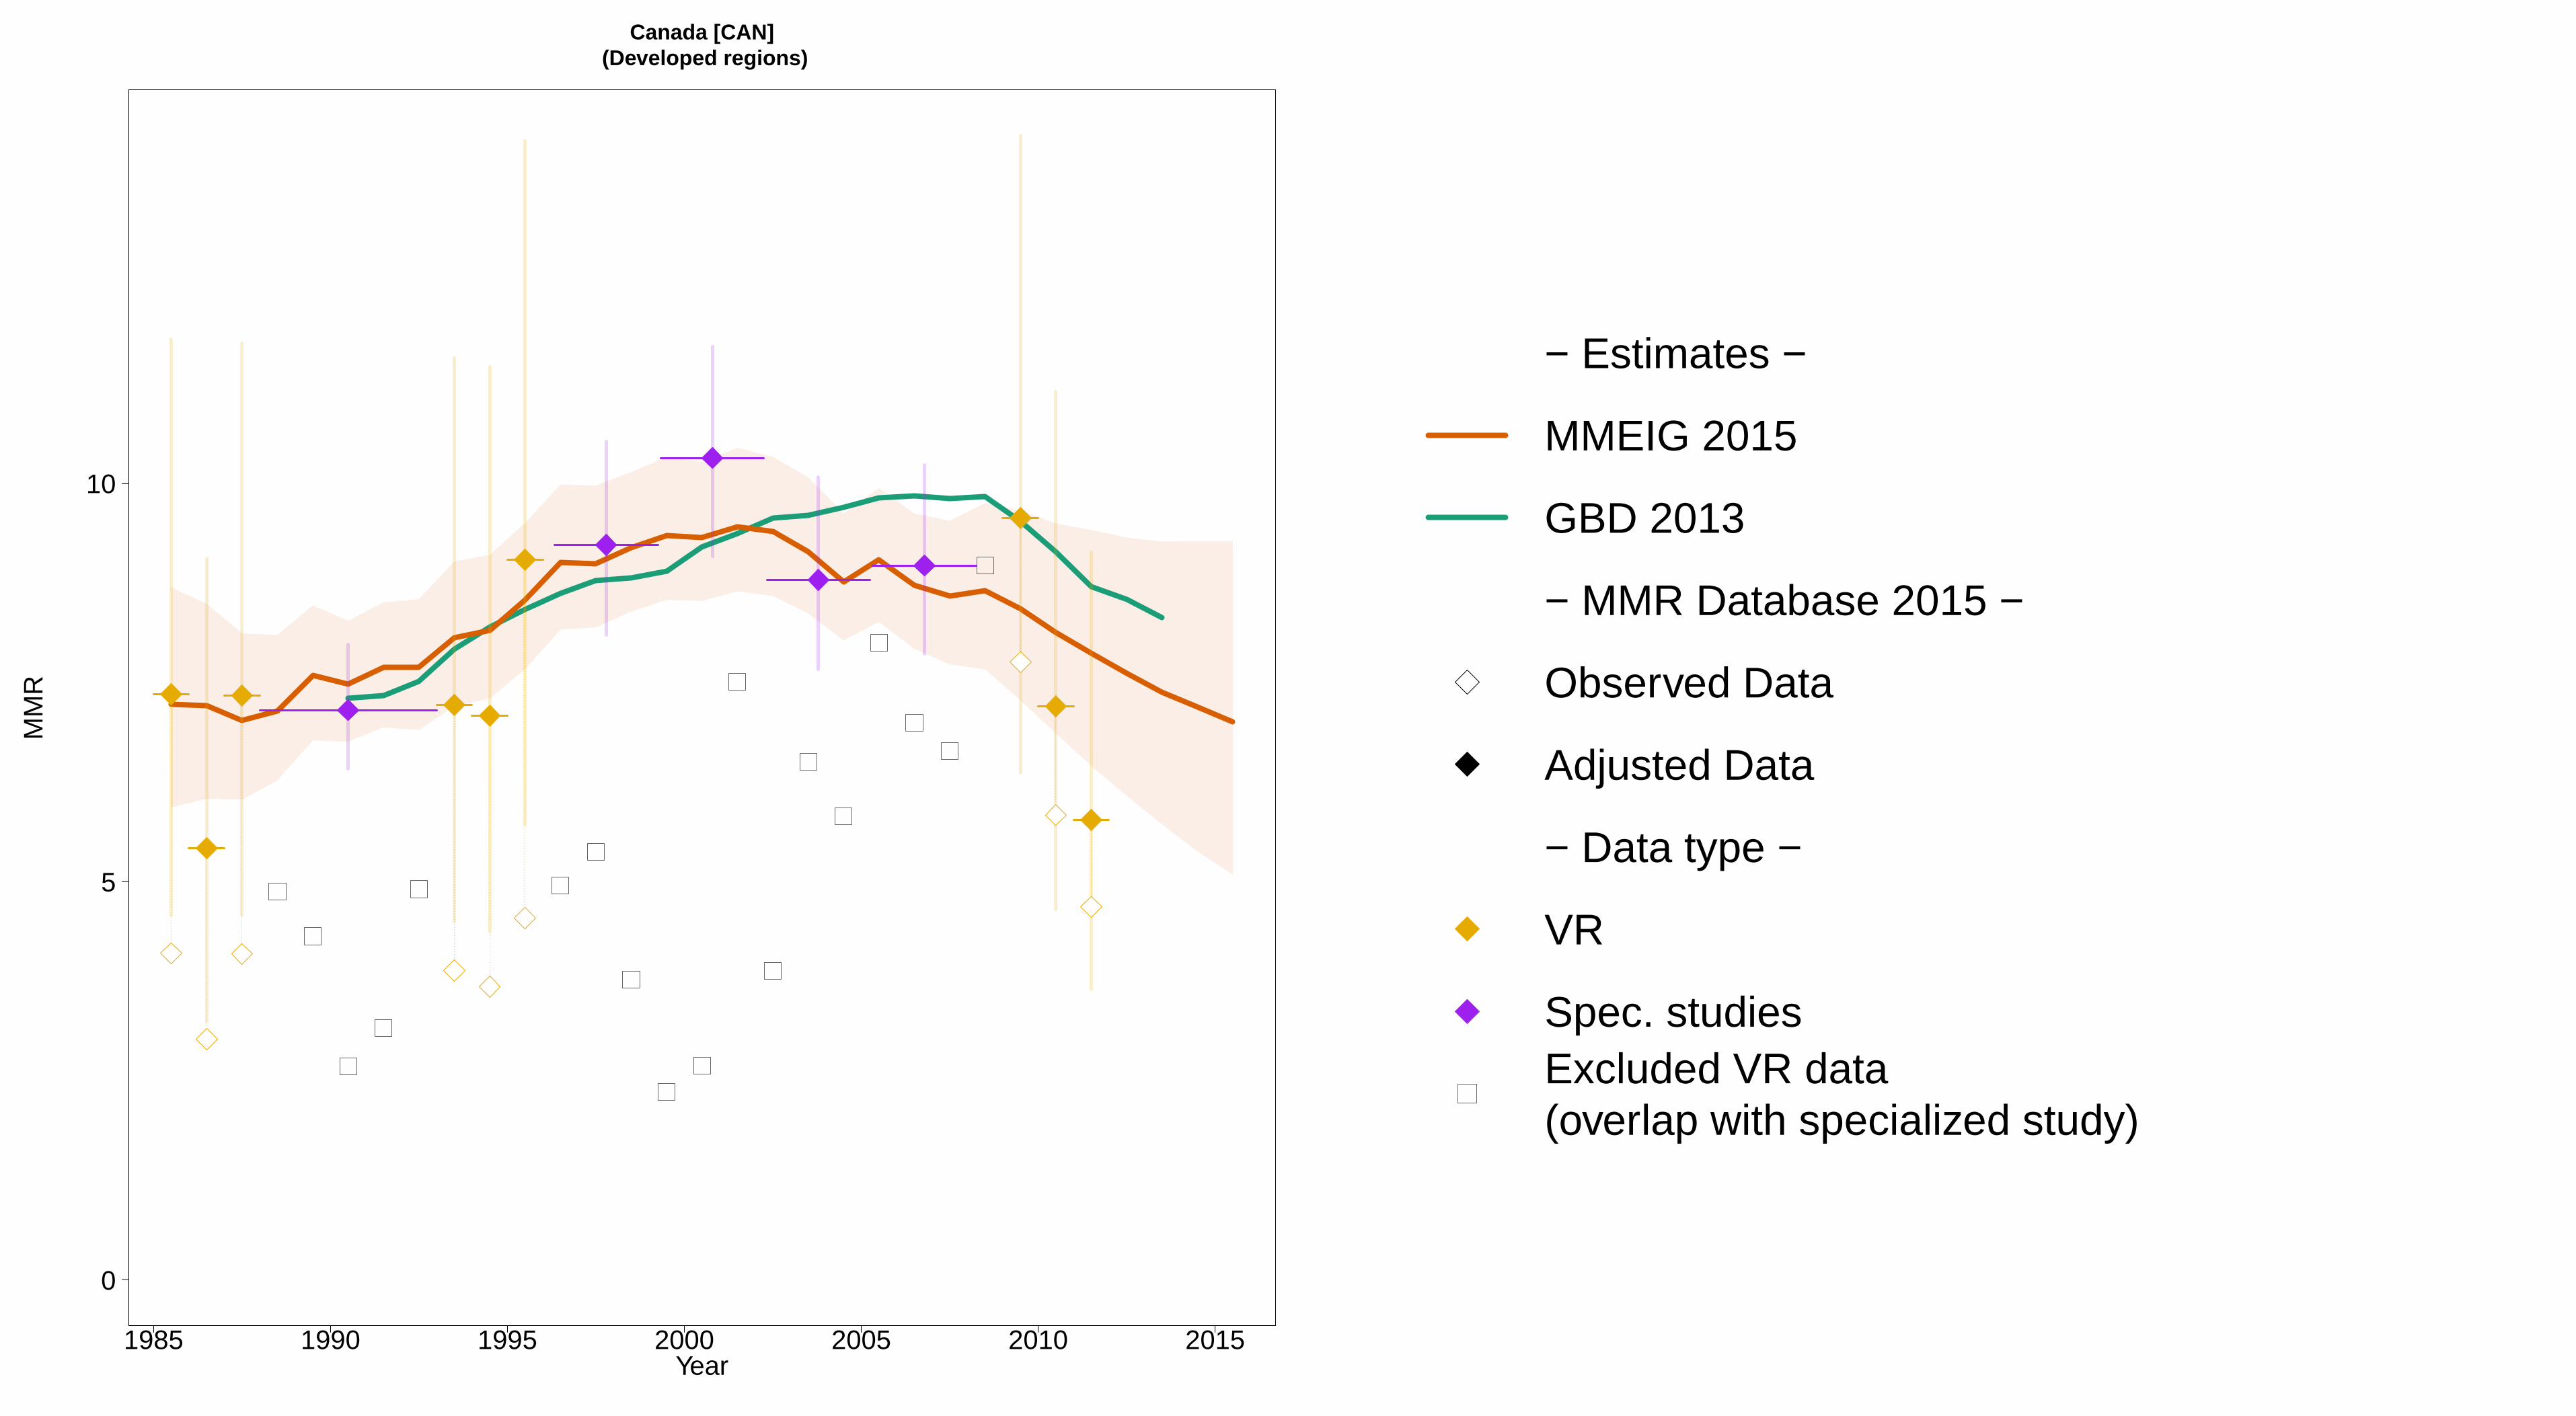
1985 1990 1995 2000 2005 2010 2015
Canada [CAN] (Developed regions)
Year
0
5
10
MM
R
− Estimates −
MMEIG 2015
GBD 2013
− MMR Database 2015 −
Observed Data
Adjusted Data
− Data type −
VR
Spec. studiesExcluded VR data (overlap with specialized study)

1985 1990 1995 2000 2005 2010 2015
Central African Republic [CAF] (Middle Africa)
Year
0
500
1000
1500
MM
R
− Estimates −MMEIG 2015GBD 2013− MMR Database 2015 −Observed DataAdjusted Data− Data type −DHS

1985 1990 1995 2000 2005 2010 2015
Chad [TCD] (Middle Africa)
Year
0
500
1000
1500
2000
MM
R
− Estimates −MMEIG 2015GBD 2013− MMR Database 2015 −Observed DataAdjusted Data− Data type −DHS
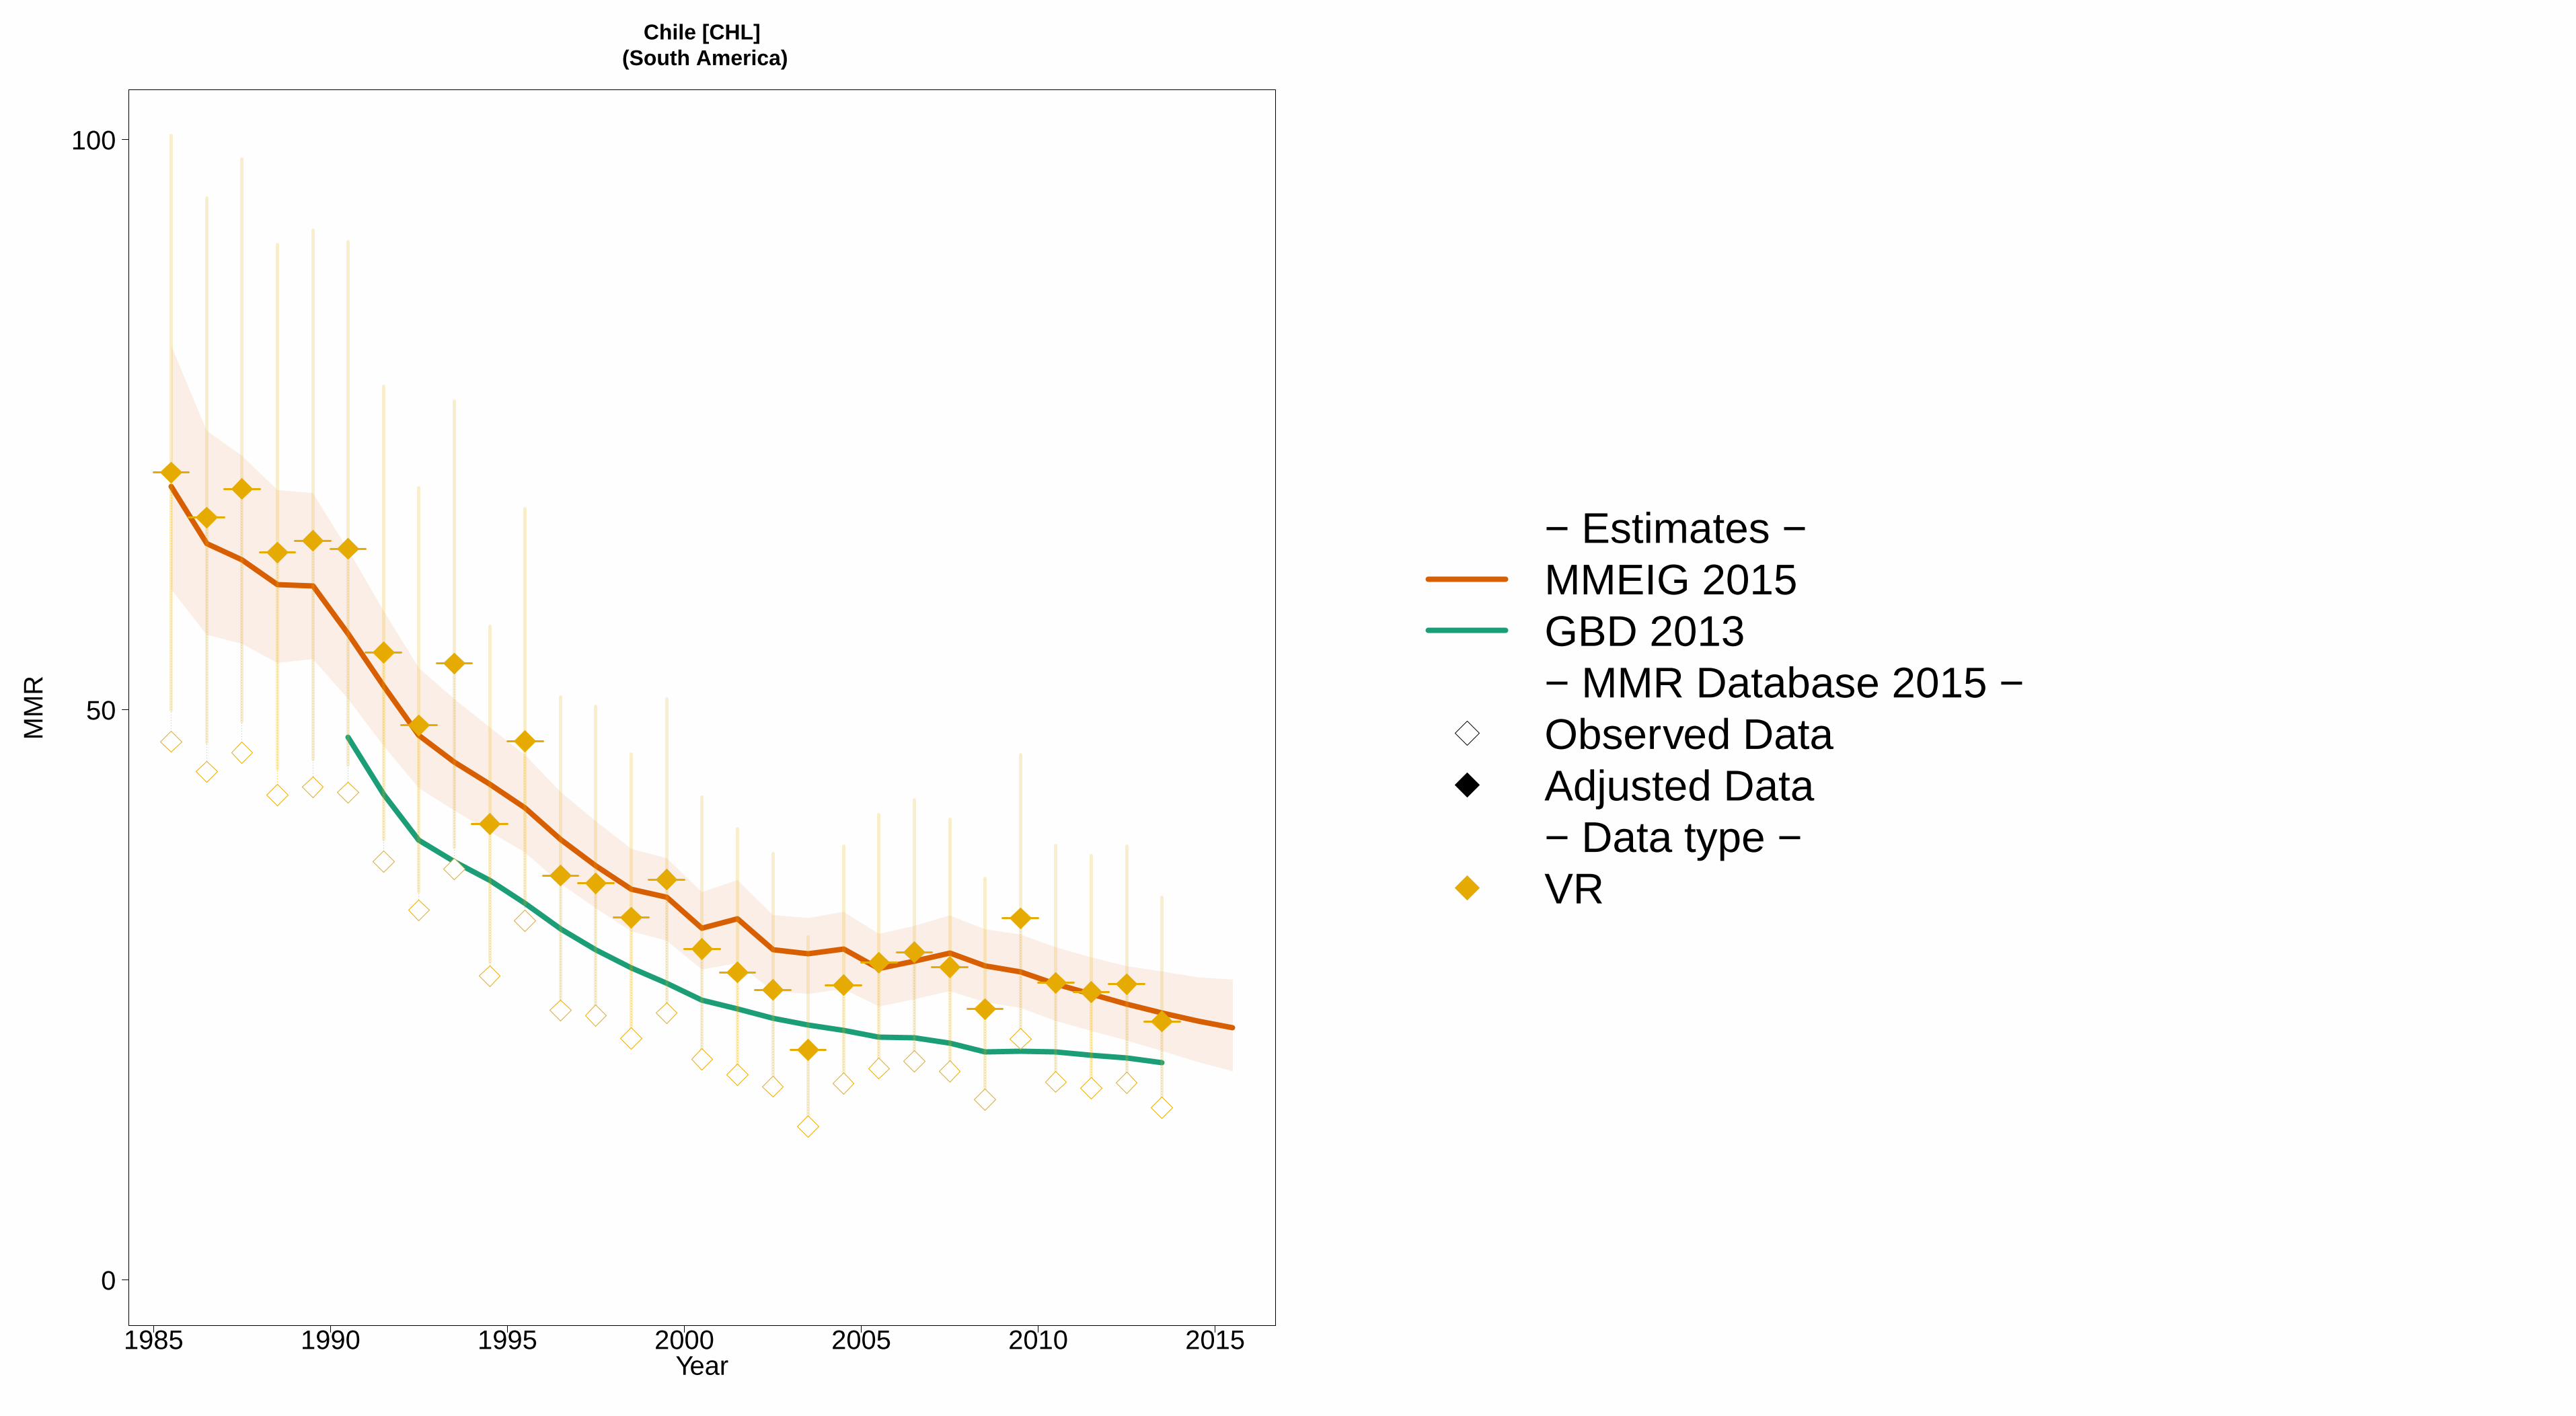
1985 1990 1995 2000 2005 2010 2015
Chile [CHL] (South America)
Year
0
50
100
MM
R
− Estimates −MMEIG 2015GBD 2013− MMR Database 2015 −Observed DataAdjusted Data− Data type −VR
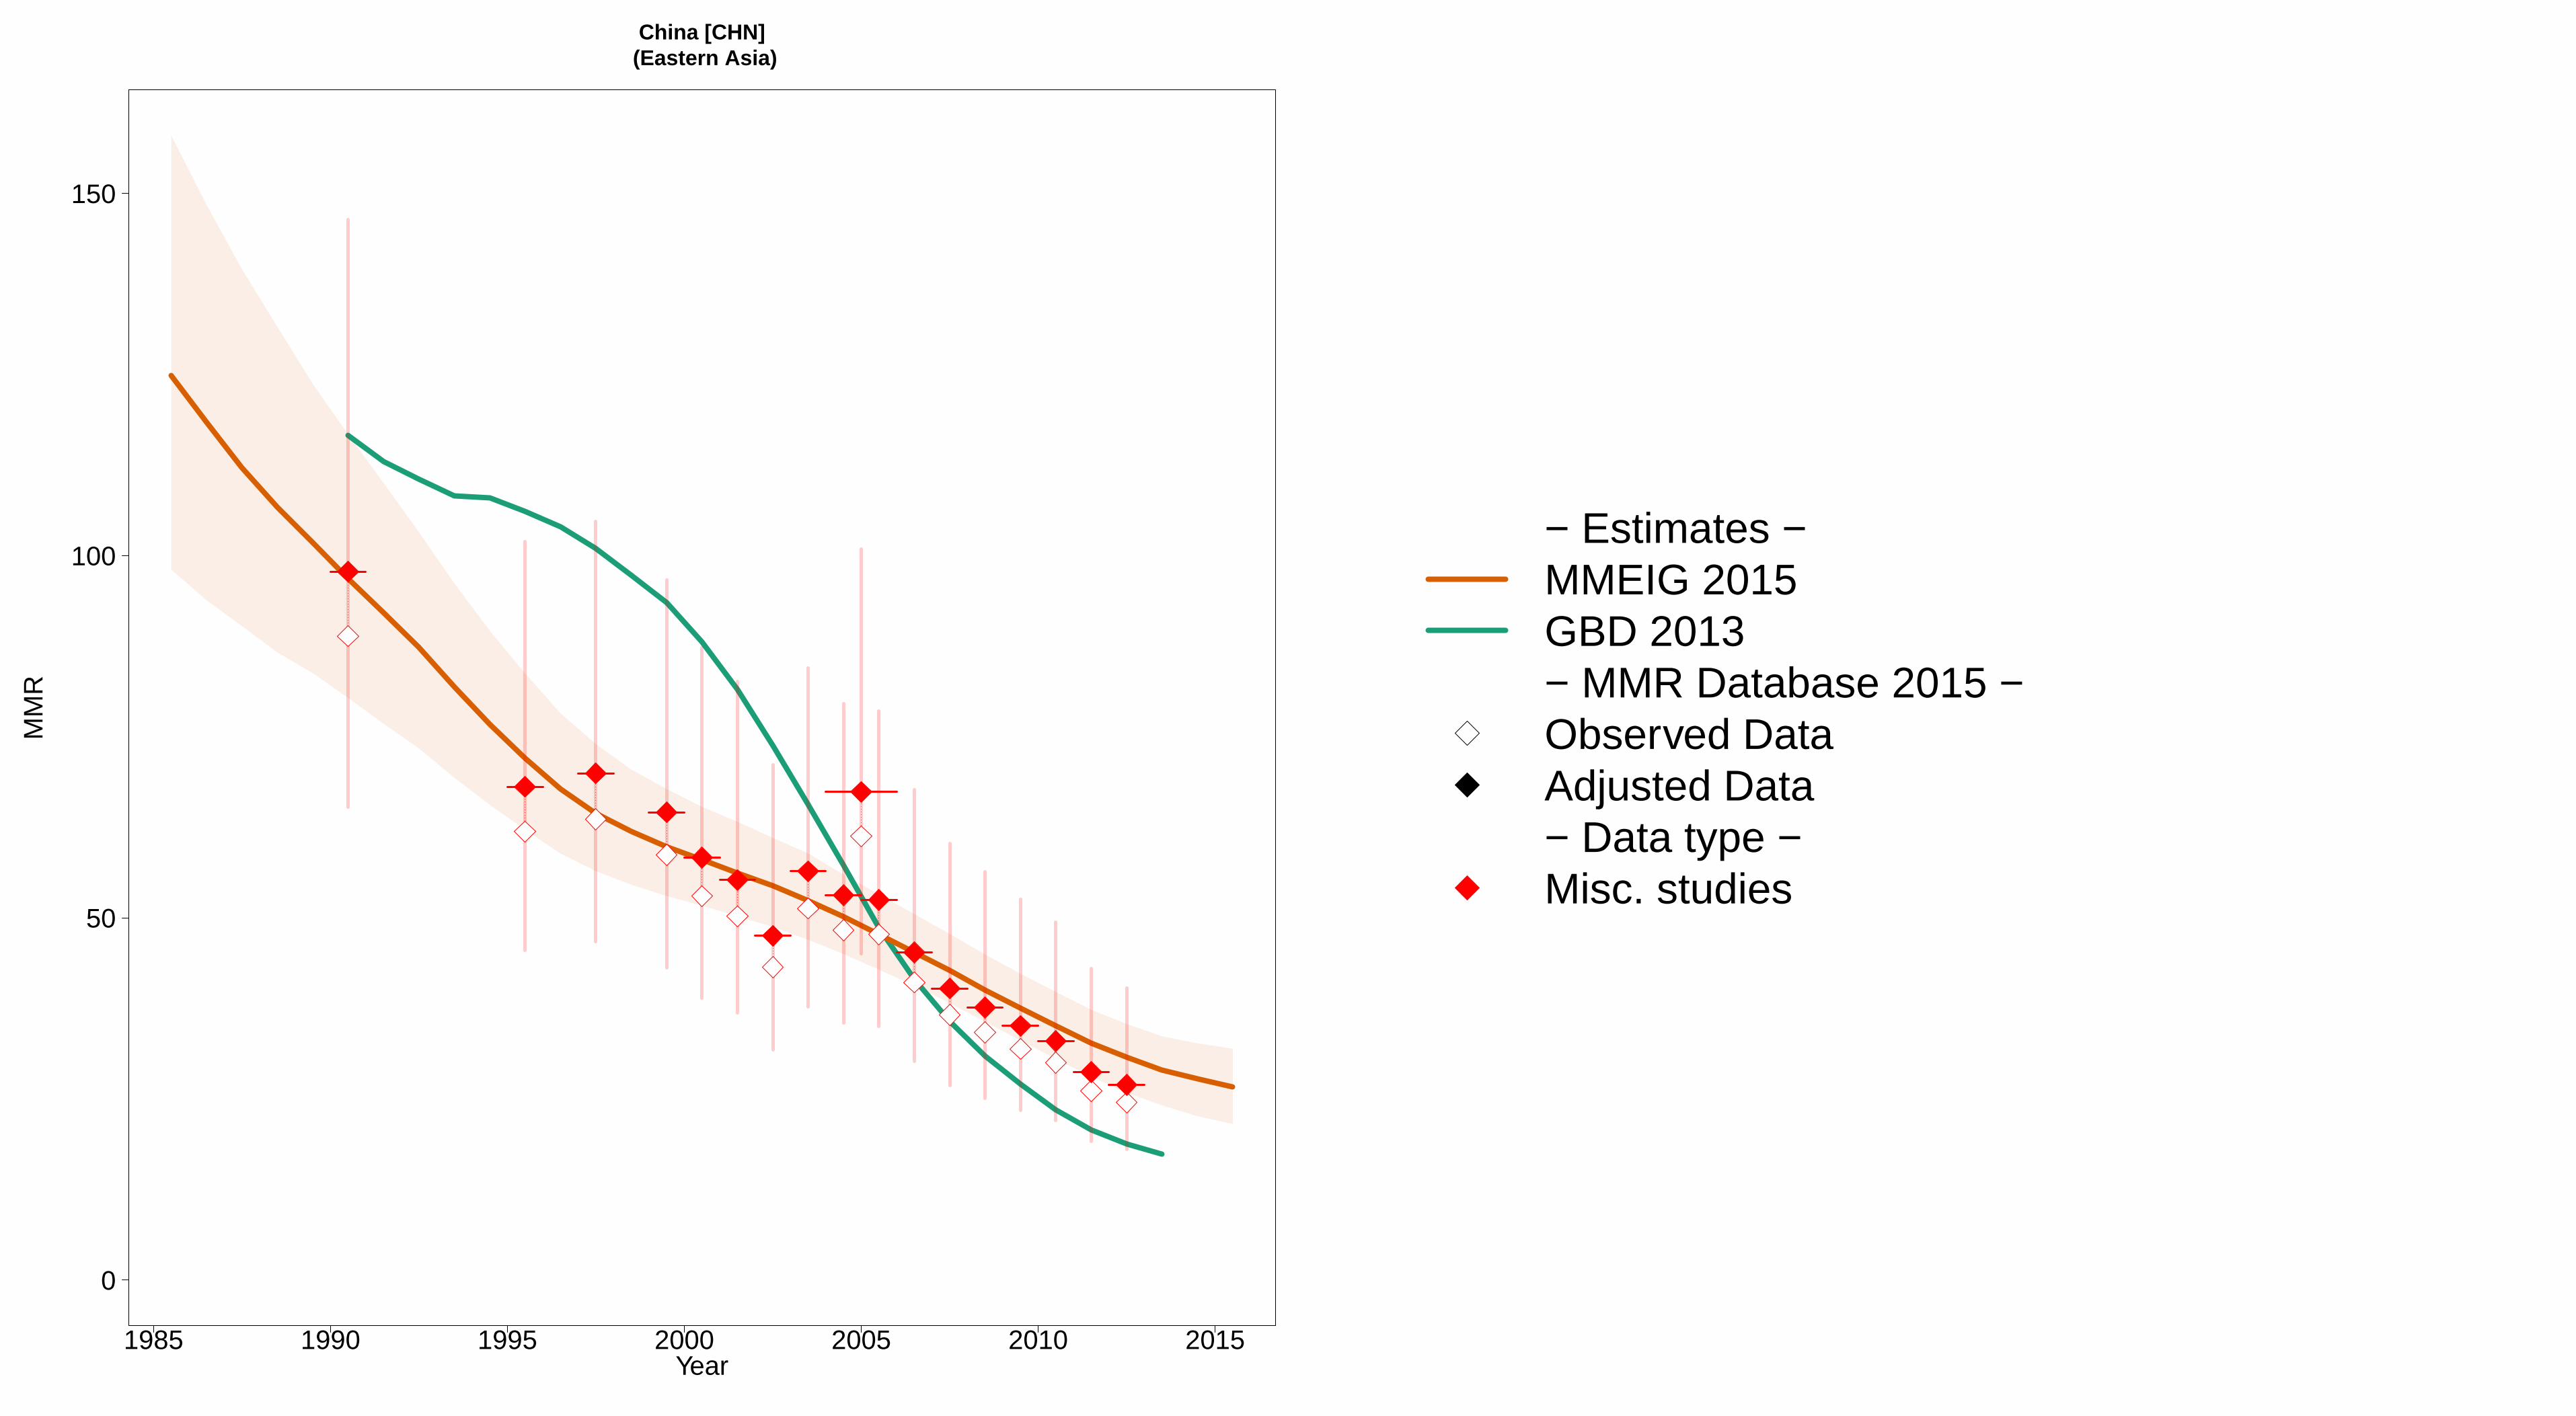
1985 1990 1995 2000 2005 2010 2015
China [CHN] (Eastern Asia)
Year
0
50
100
150
MM
R
− Estimates −MMEIG 2015GBD 2013− MMR Database 2015 −Observed DataAdjusted Data− Data type −Misc. studies

1985 1990 1995 2000 2005 2010 2015
Colombia [COL] (South America)
Year
0
50
100
150
200
MM
R
− Estimates −
MMEIG 2015
GBD 2013
− MMR Database 2015 −
Observed Data
Adjusted Data
− Data type −
VR
Spec. studiesExcluded VR data (data quality issues)Excluded VR data (overlap with specialized study)

1985 1990 1995 2000 2005 2010 2015
Comoros [COM] (Eastern Africa)
Year
0
500
1000
MM
R
− Estimates −MMEIG 2015GBD 2013− MMR Database 2015 −Observed DataAdjusted Data− Data type −DHS

1985 1990 1995 2000 2005 2010 2015
Congo [COG] (Middle Africa)
Year
0
500
1000
MM
R
− Estimates −MMEIG 2015GBD 2013− MMR Database 2015 −Observed DataAdjusted Data− Data type −DHS
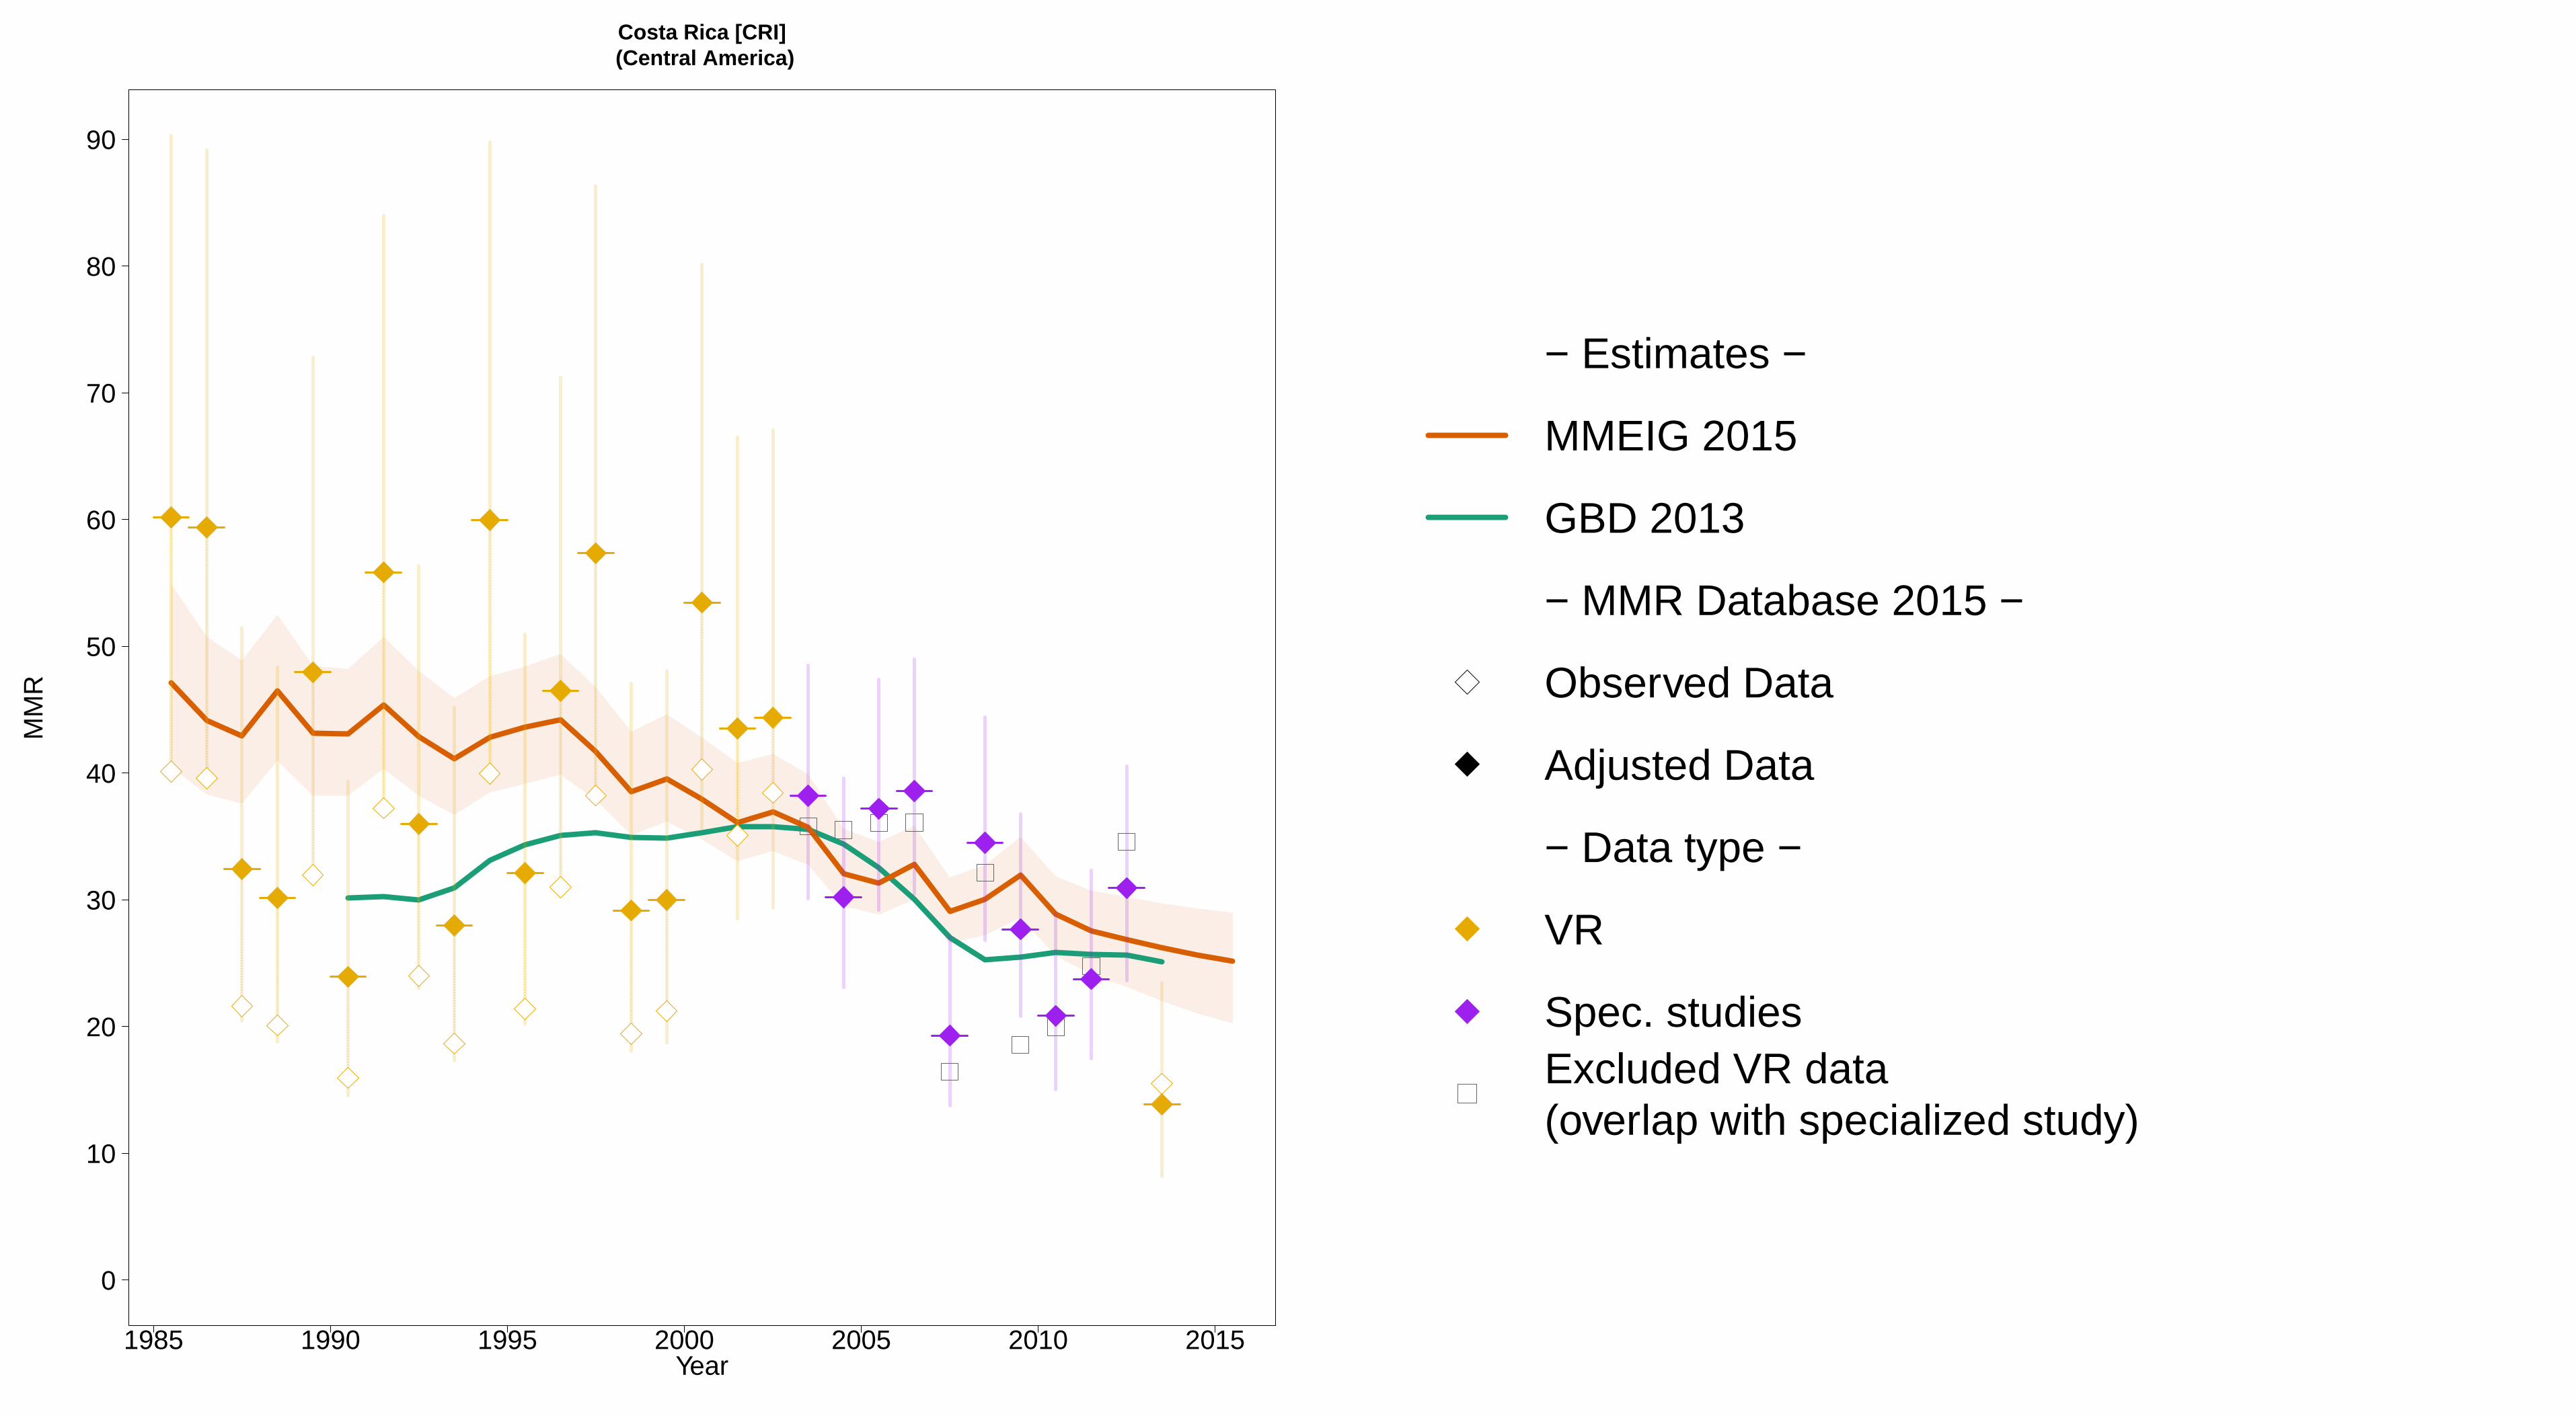
1985 1990 1995 2000 2005 2010 2015
Costa Rica [CRI] (Central America)
Year
0
10
20
30
40
50
60
70
80
90
MM
R
− Estimates −
MMEIG 2015
GBD 2013
− MMR Database 2015 −
Observed Data
Adjusted Data
− Data type −
VR
Spec. studiesExcluded VR data (overlap with specialized study)
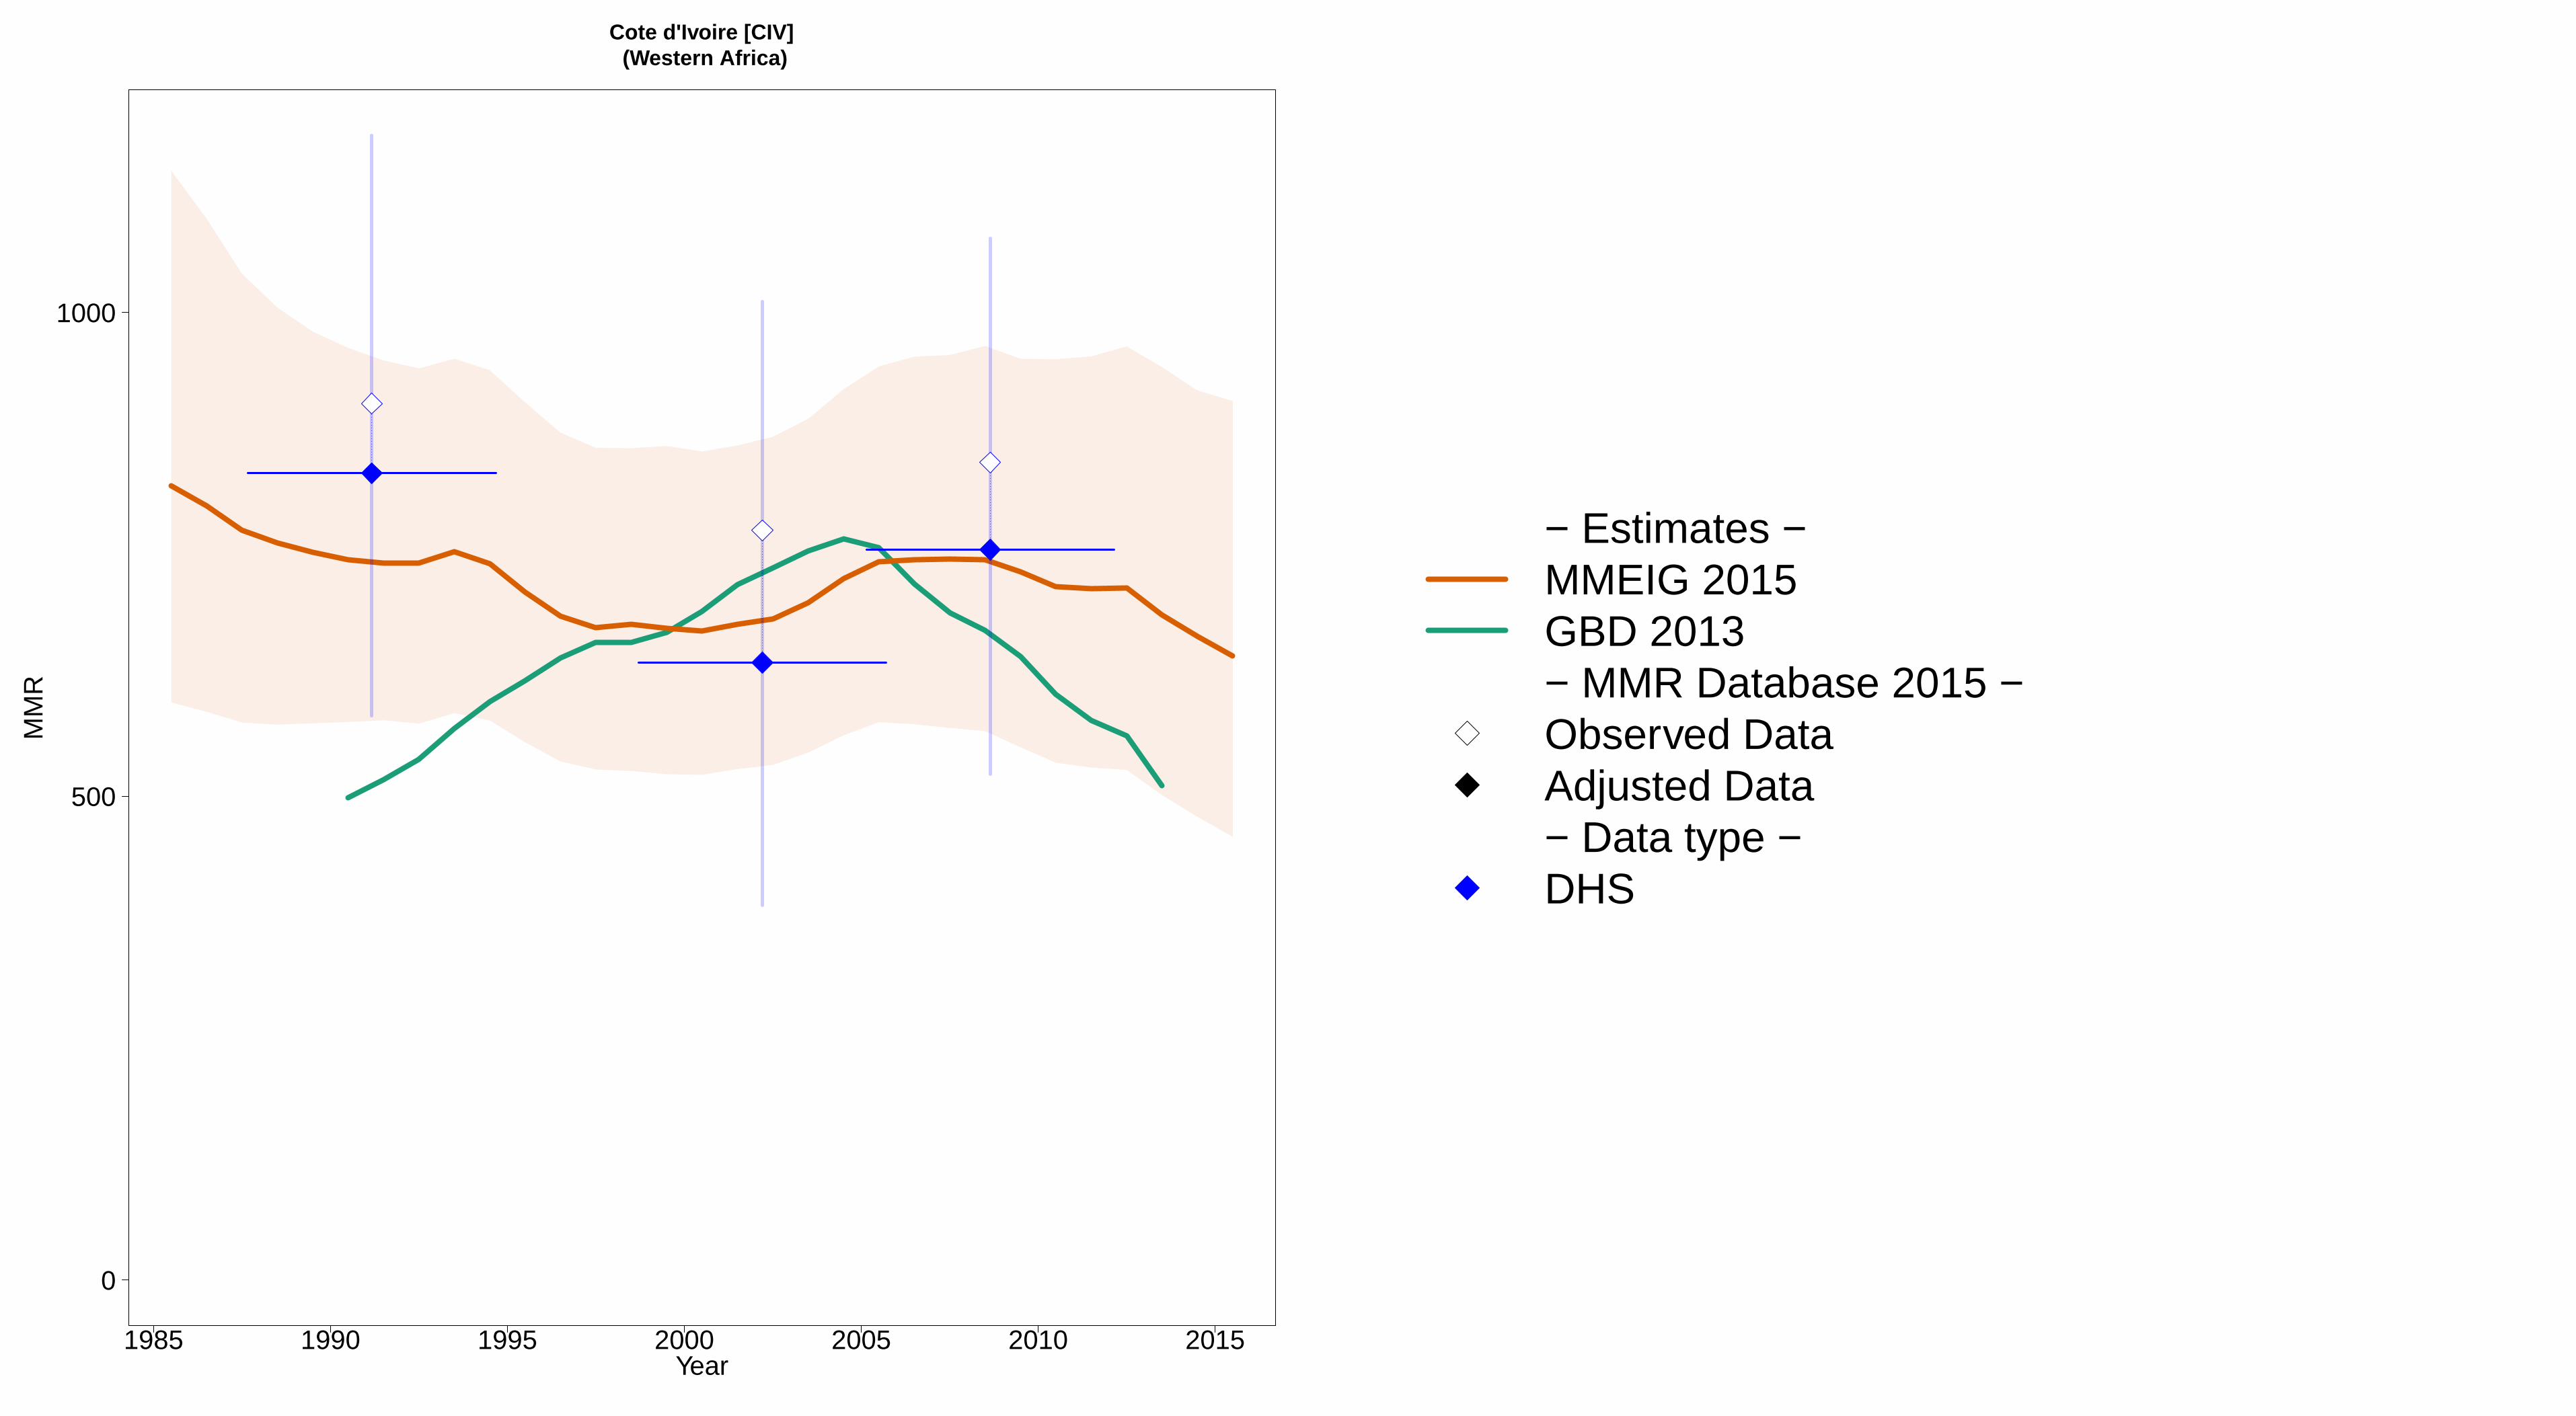
1985 1990 1995 2000 2005 2010 2015
Cote d'Ivoire [CIV] (Western Africa)
Year
0
500
1000
MM
R
− Estimates −MMEIG 2015GBD 2013− MMR Database 2015 −Observed DataAdjusted Data− Data type −DHS

1985 1990 1995 2000 2005 2010 2015
Croatia [HRV] (Transition countries of South−Eastern Europe)
Year
0
5
10
15
20
25
30
35
MM
R
− Estimates −MMEIG 2015GBD 2013− MMR Database 2015 −Observed DataAdjusted Data− Data type −VR
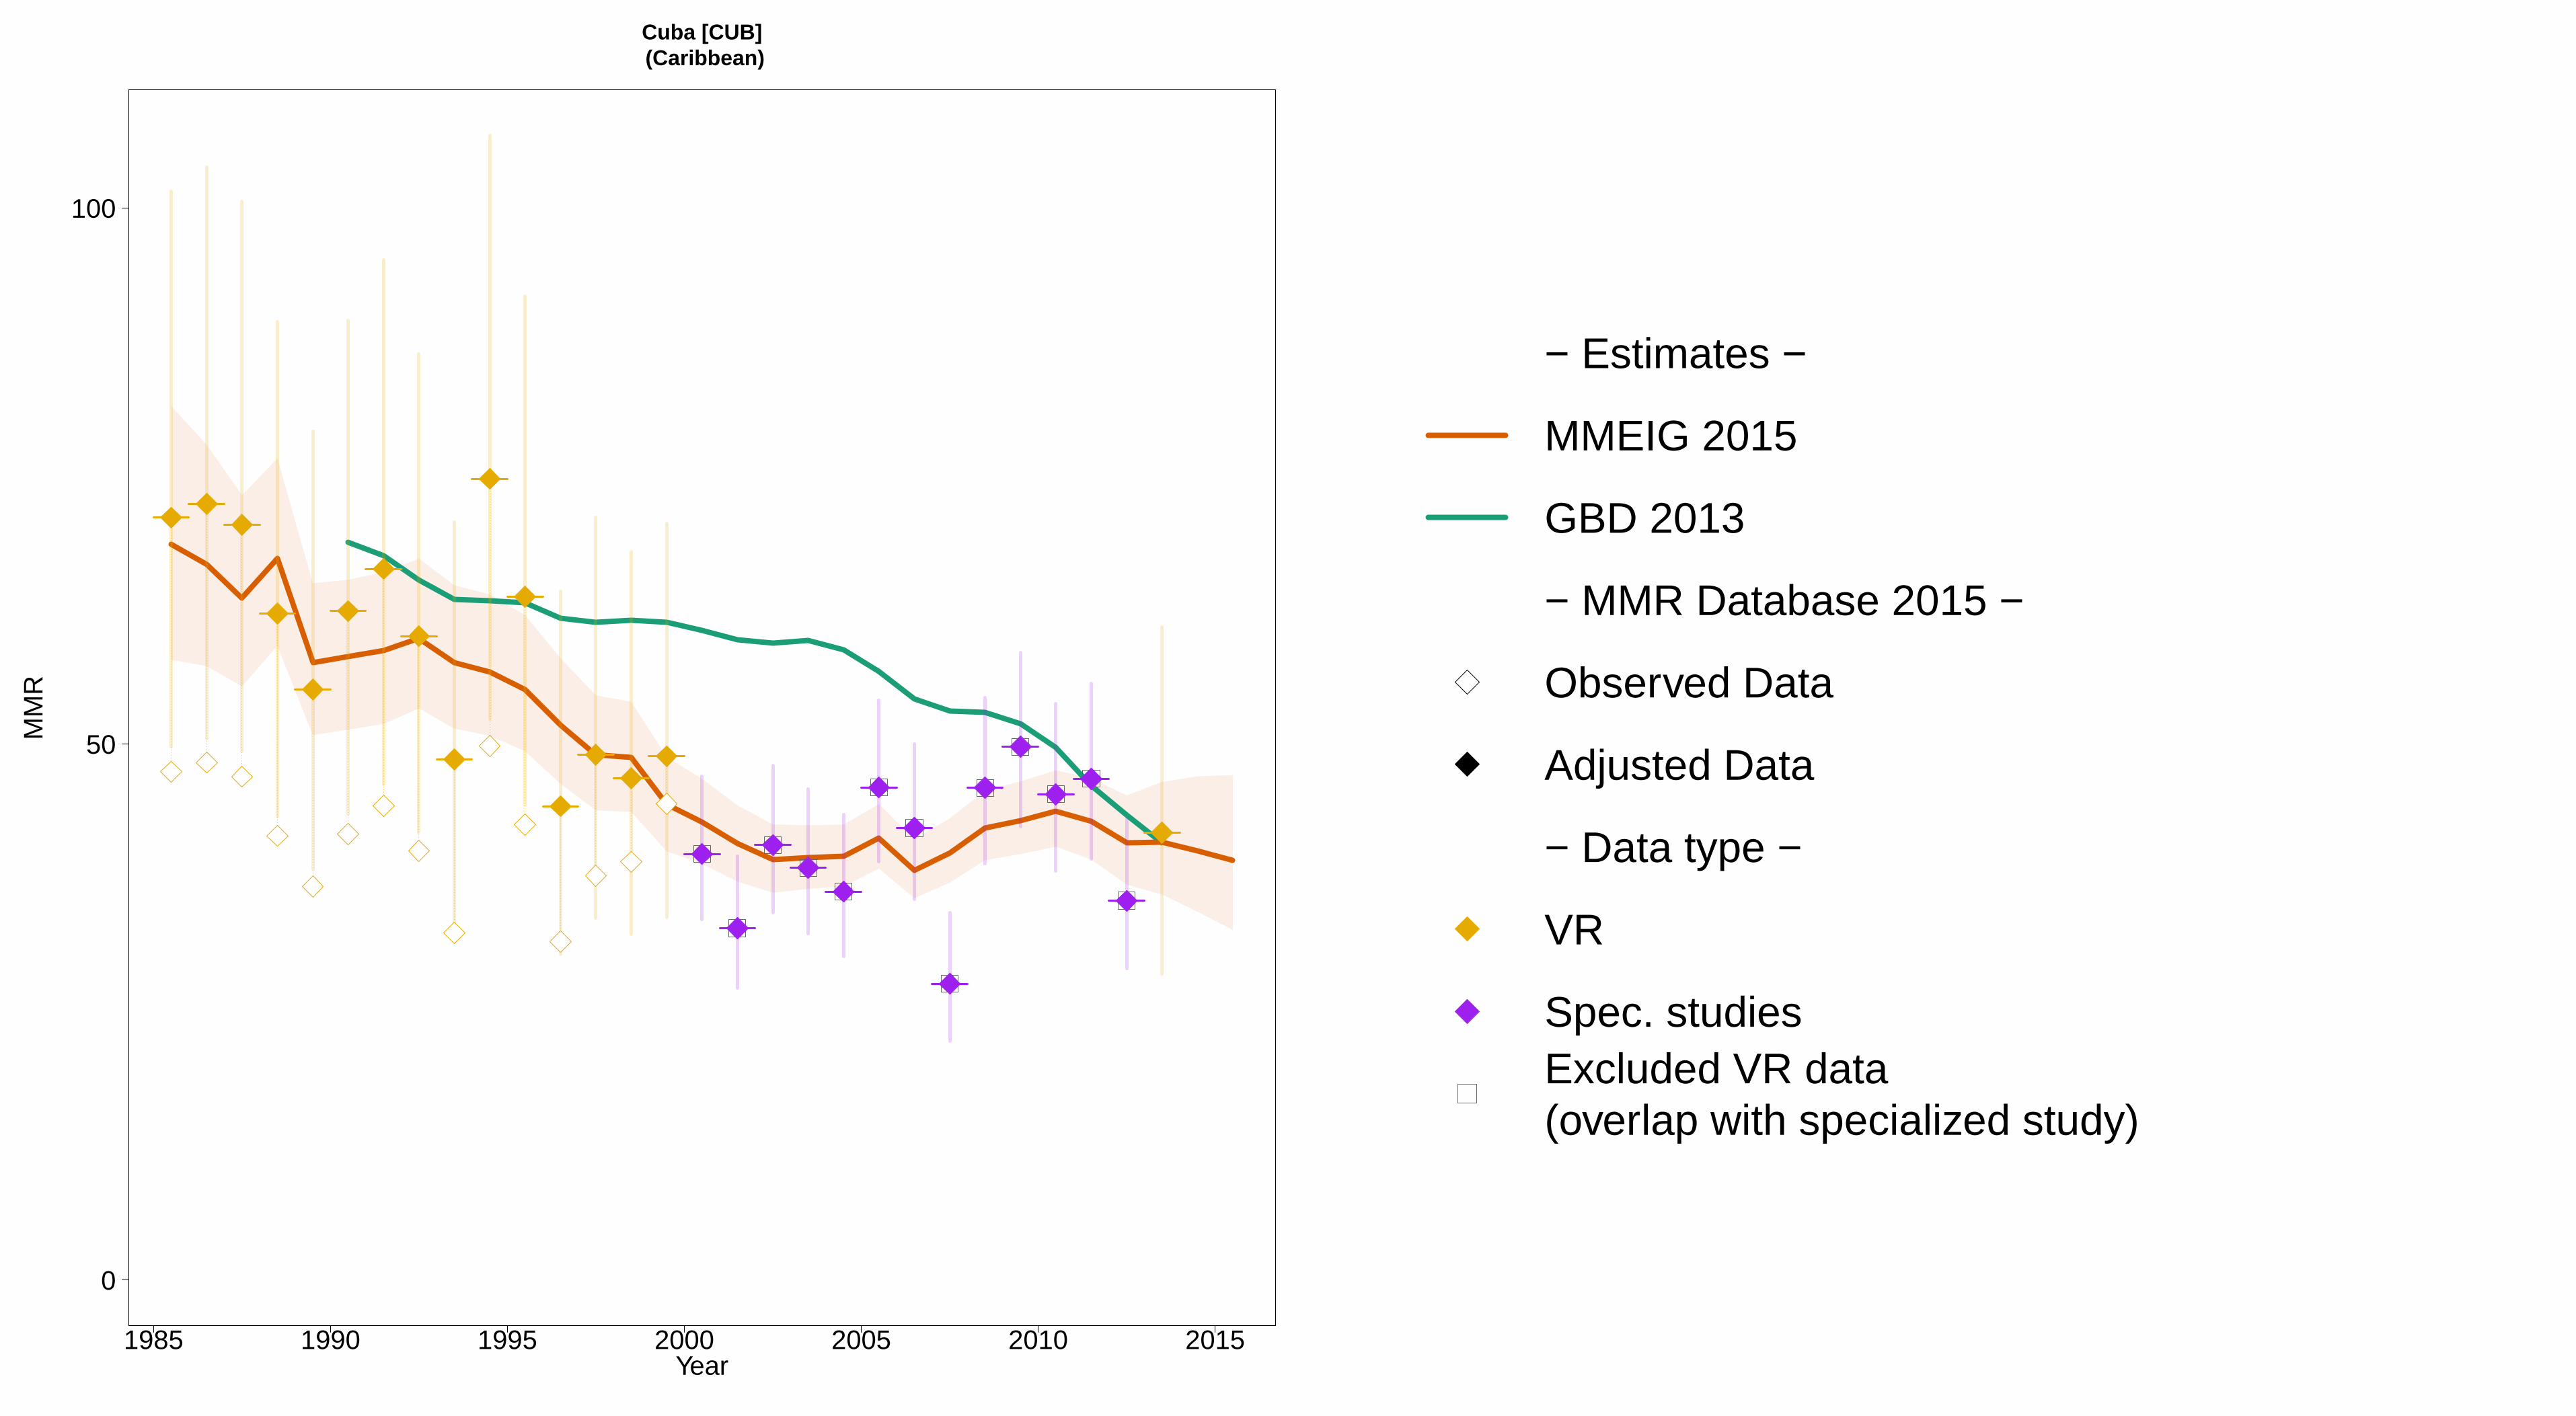
1985 1990 1995 2000 2005 2010 2015
Cuba [CUB] (Caribbean)
Year
0
50
100
MM
R
− Estimates −
MMEIG 2015
GBD 2013
− MMR Database 2015 −
Observed Data
Adjusted Data
− Data type −
VR
Spec. studiesExcluded VR data (overlap with specialized study)

1985 1990 1995 2000 2005 2010 2015
Cyprus [CYP] (Western Asia)
Year
0
5
10
15
20
25
30
35
MM
R
● ●
− Estimates −
MMEIG 2015
GBD 2013
− MMR Database 2015 −
Observed Data
Adjusted Data
− Data type −
VRReported VR before recalc.(related to 0 obs. mat. death)Excluded VR data (data quality issues)

1985 1990 1995 2000 2005 2010 2015
Czech Republic [CZE] (Developed regions)
Year
0
5
10
15
20
25
30
35
MM
R
− Estimates −MMEIG 2015GBD 2013− MMR Database 2015 −Observed DataAdjusted Data− Data type −VR
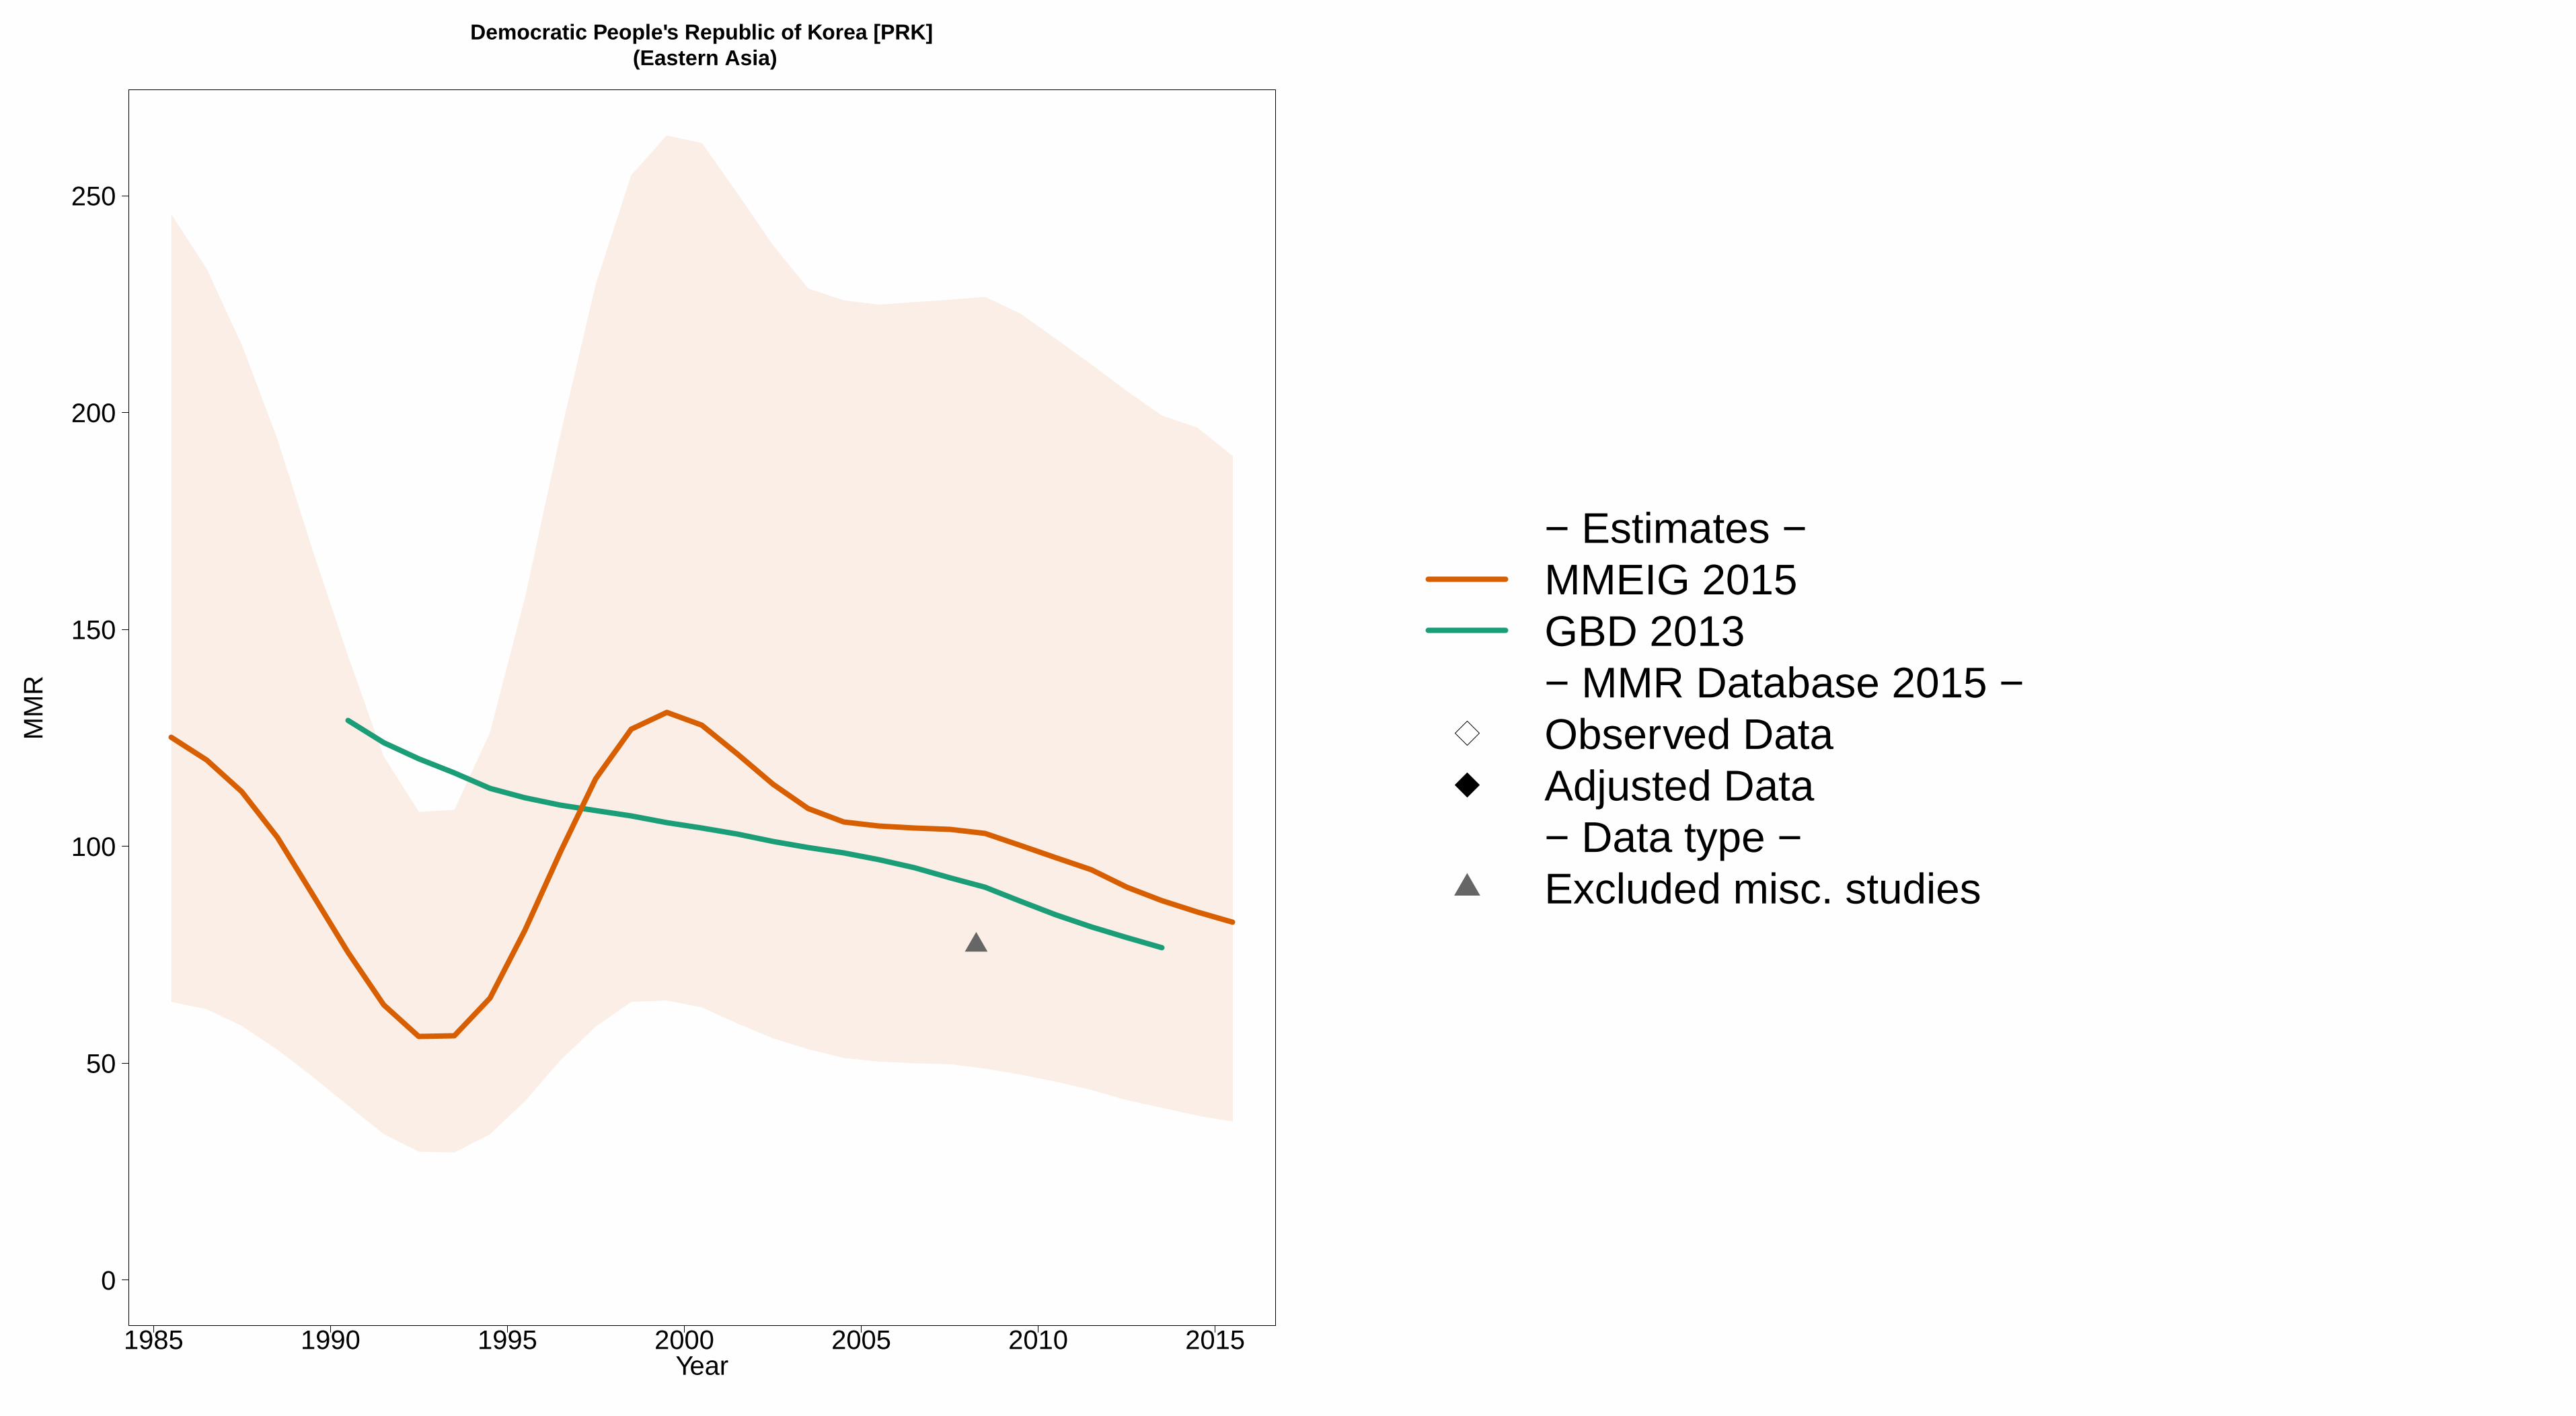
1985 1990 1995 2000 2005 2010 2015
Democratic People's Republic of Korea [PRK] (Eastern Asia)
Year
0
50
100
150
200
250
MM
R
− Estimates −MMEIG 2015GBD 2013− MMR Database 2015 −Observed DataAdjusted Data− Data type −Excluded misc. studies

1985 1990 1995 2000 2005 2010 2015
Democratic Republic of the Congo [COD] (Middle Africa)
Year
0
500
1000
MM
R
− Estimates −MMEIG 2015GBD 2013− MMR Database 2015 −Observed DataAdjusted Data− Data type −DHS

1985 1990 1995 2000 2005 2010 2015
Denmark [DNK] (Developed regions)
Year
0
10
20
30
40
MM
R
− Estimates −
MMEIG 2015
GBD 2013
− MMR Database 2015 −
Observed Data
Adjusted Data
− Data type −
VR
Spec. studiesReported VR before recalc.(related to 0 obs. mat. death)Excluded VR data (overlap with specialized study)

1985 1990 1995 2000 2005 2010 2015
Djibouti [DJI] (Eastern Africa)
Year
0
500
1000
MM
R
− Estimates −MMEIG 2015GBD 2013− MMR Database 2015 −
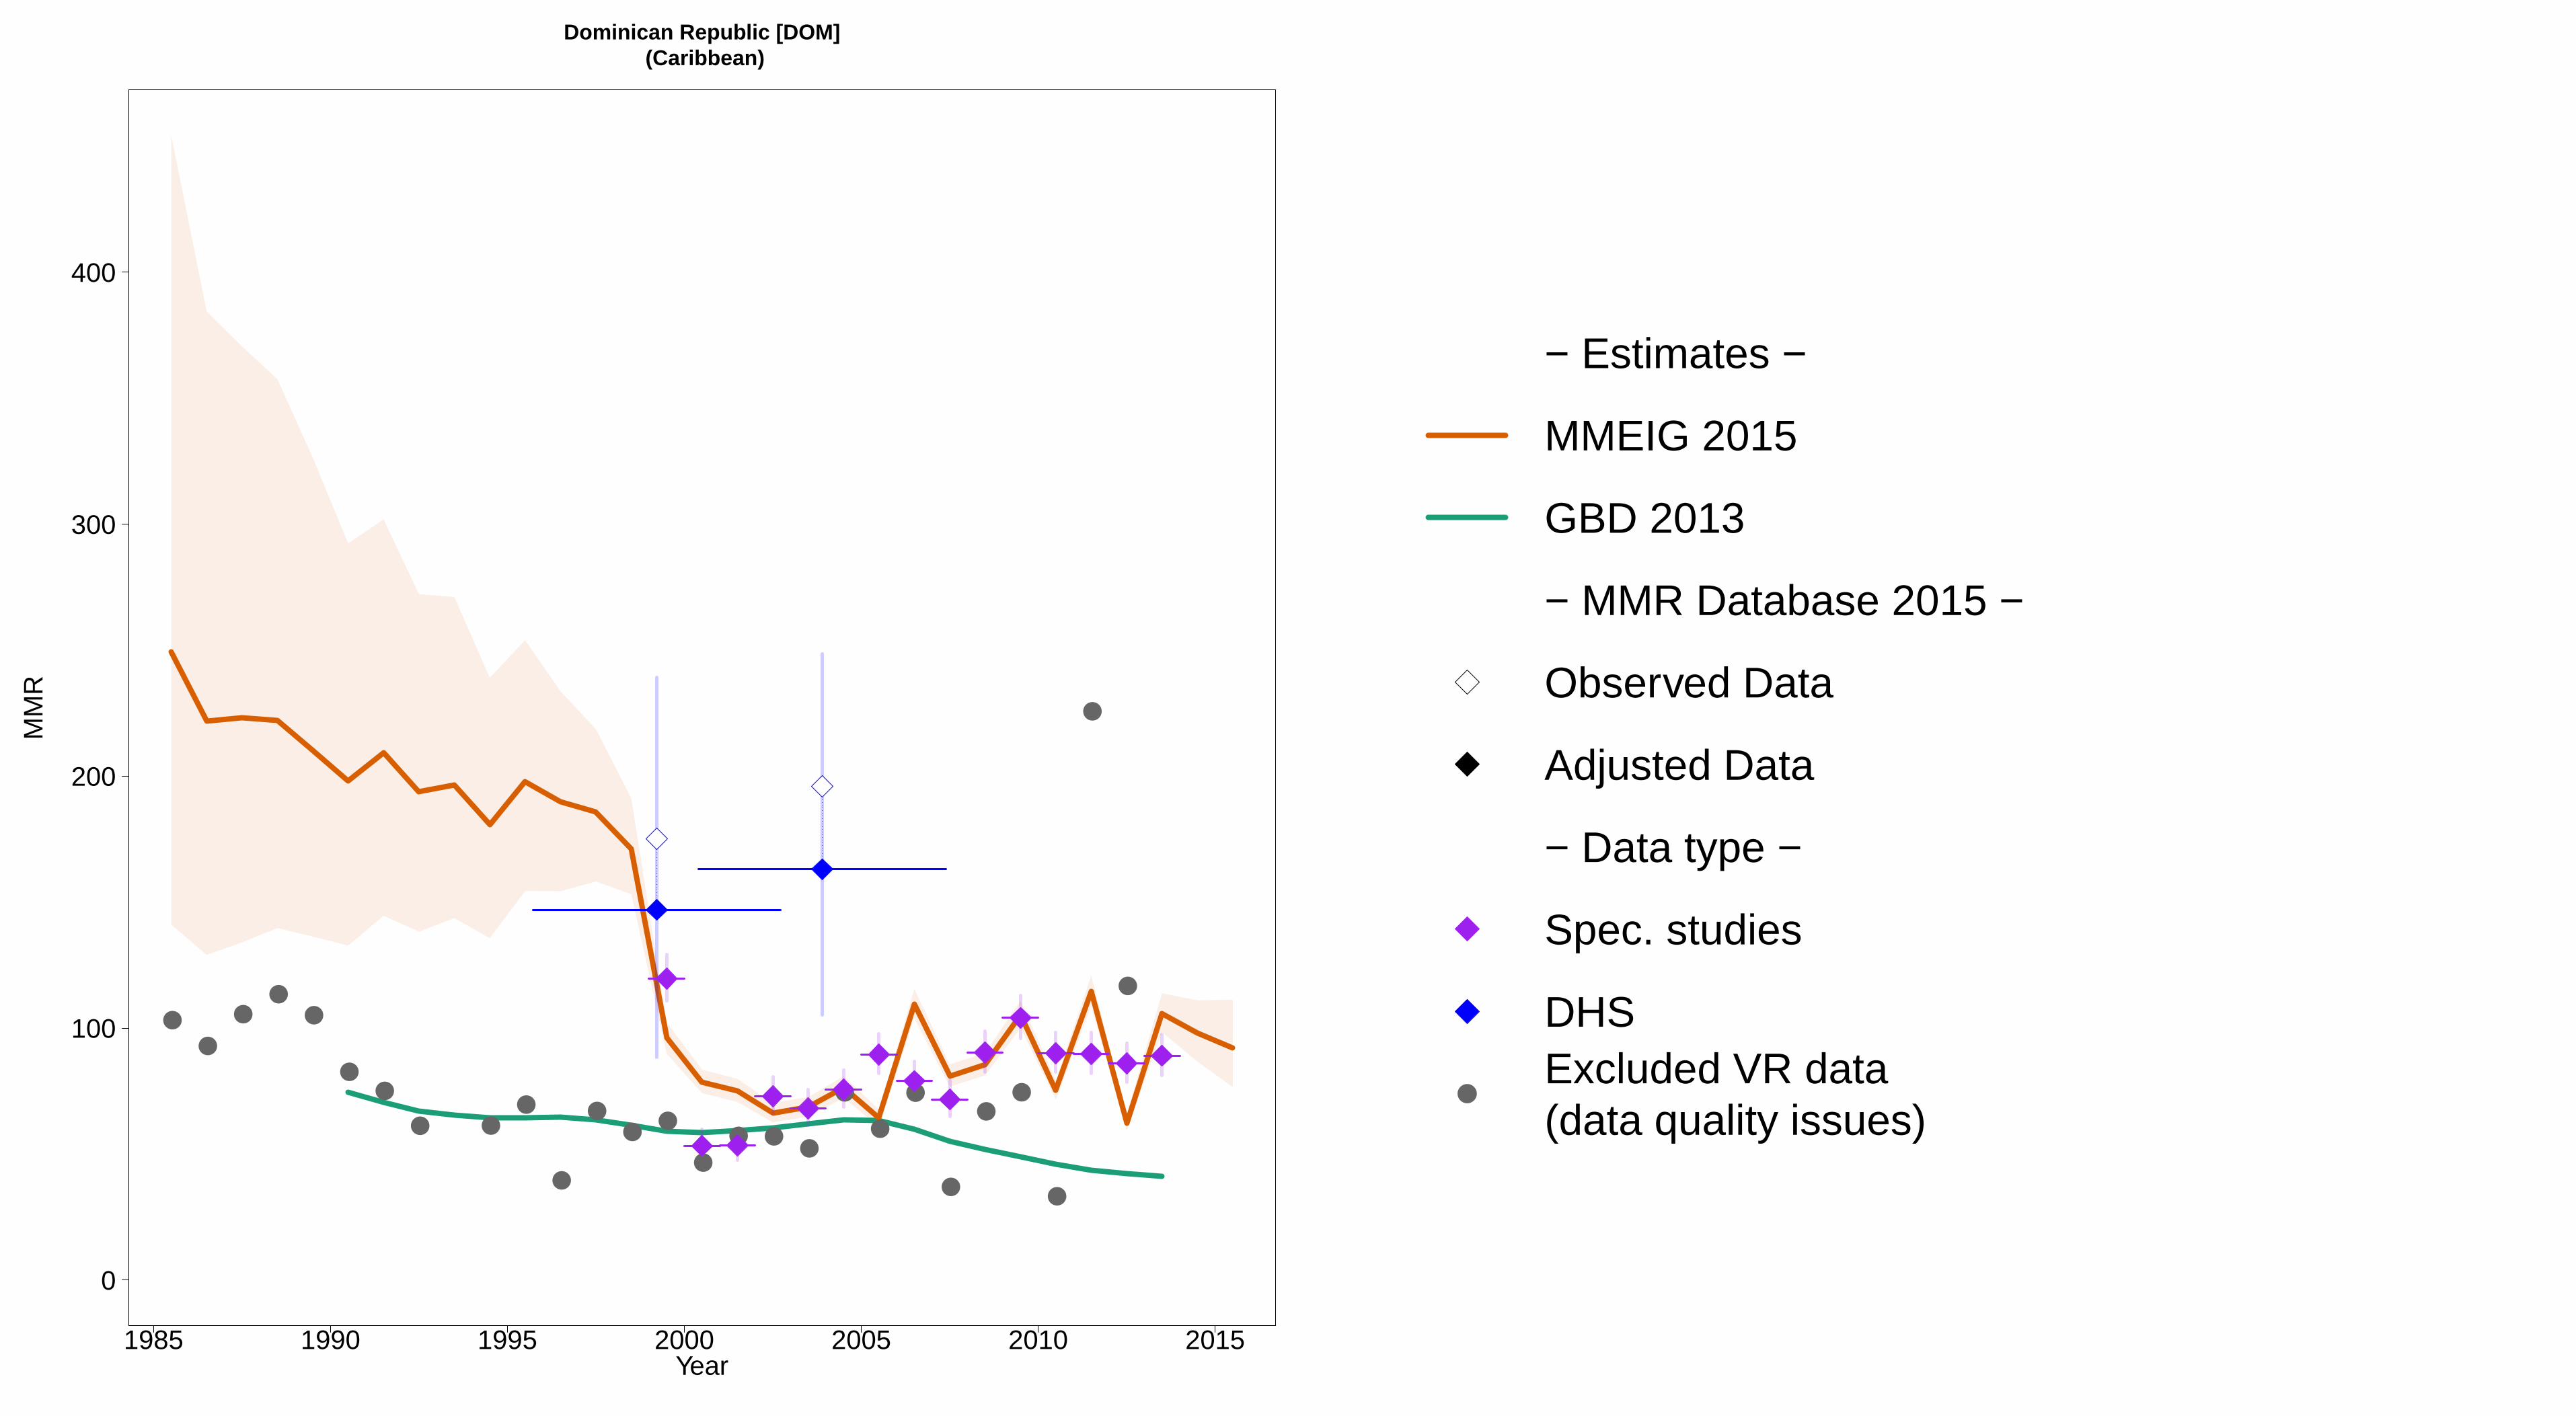
1985 1990 1995 2000 2005 2010 2015
Dominican Republic [DOM] (Caribbean)
Year
0
100
200
300
400
MM
R
●●
●●
●
●●
● ●●
●
●● ●
●● ●
●
●
●
●
●
●●
●
●
●
− Estimates −
MMEIG 2015
GBD 2013
− MMR Database 2015 −
Observed Data
Adjusted Data
− Data type −
Spec. studies
DHSExcluded VR data (data quality issues)

1985 1990 1995 2000 2005 2010 2015
Ecuador [ECU] (South America)
Year
0
50
100
150
200
250
300
350
MM
R
− Estimates −
MMEIG 2015
GBD 2013
− MMR Database 2015 −
Observed Data
Adjusted Data
− Data type −
VR
Spec. studies
DHSExcluded VR data (overlap with specialized study)
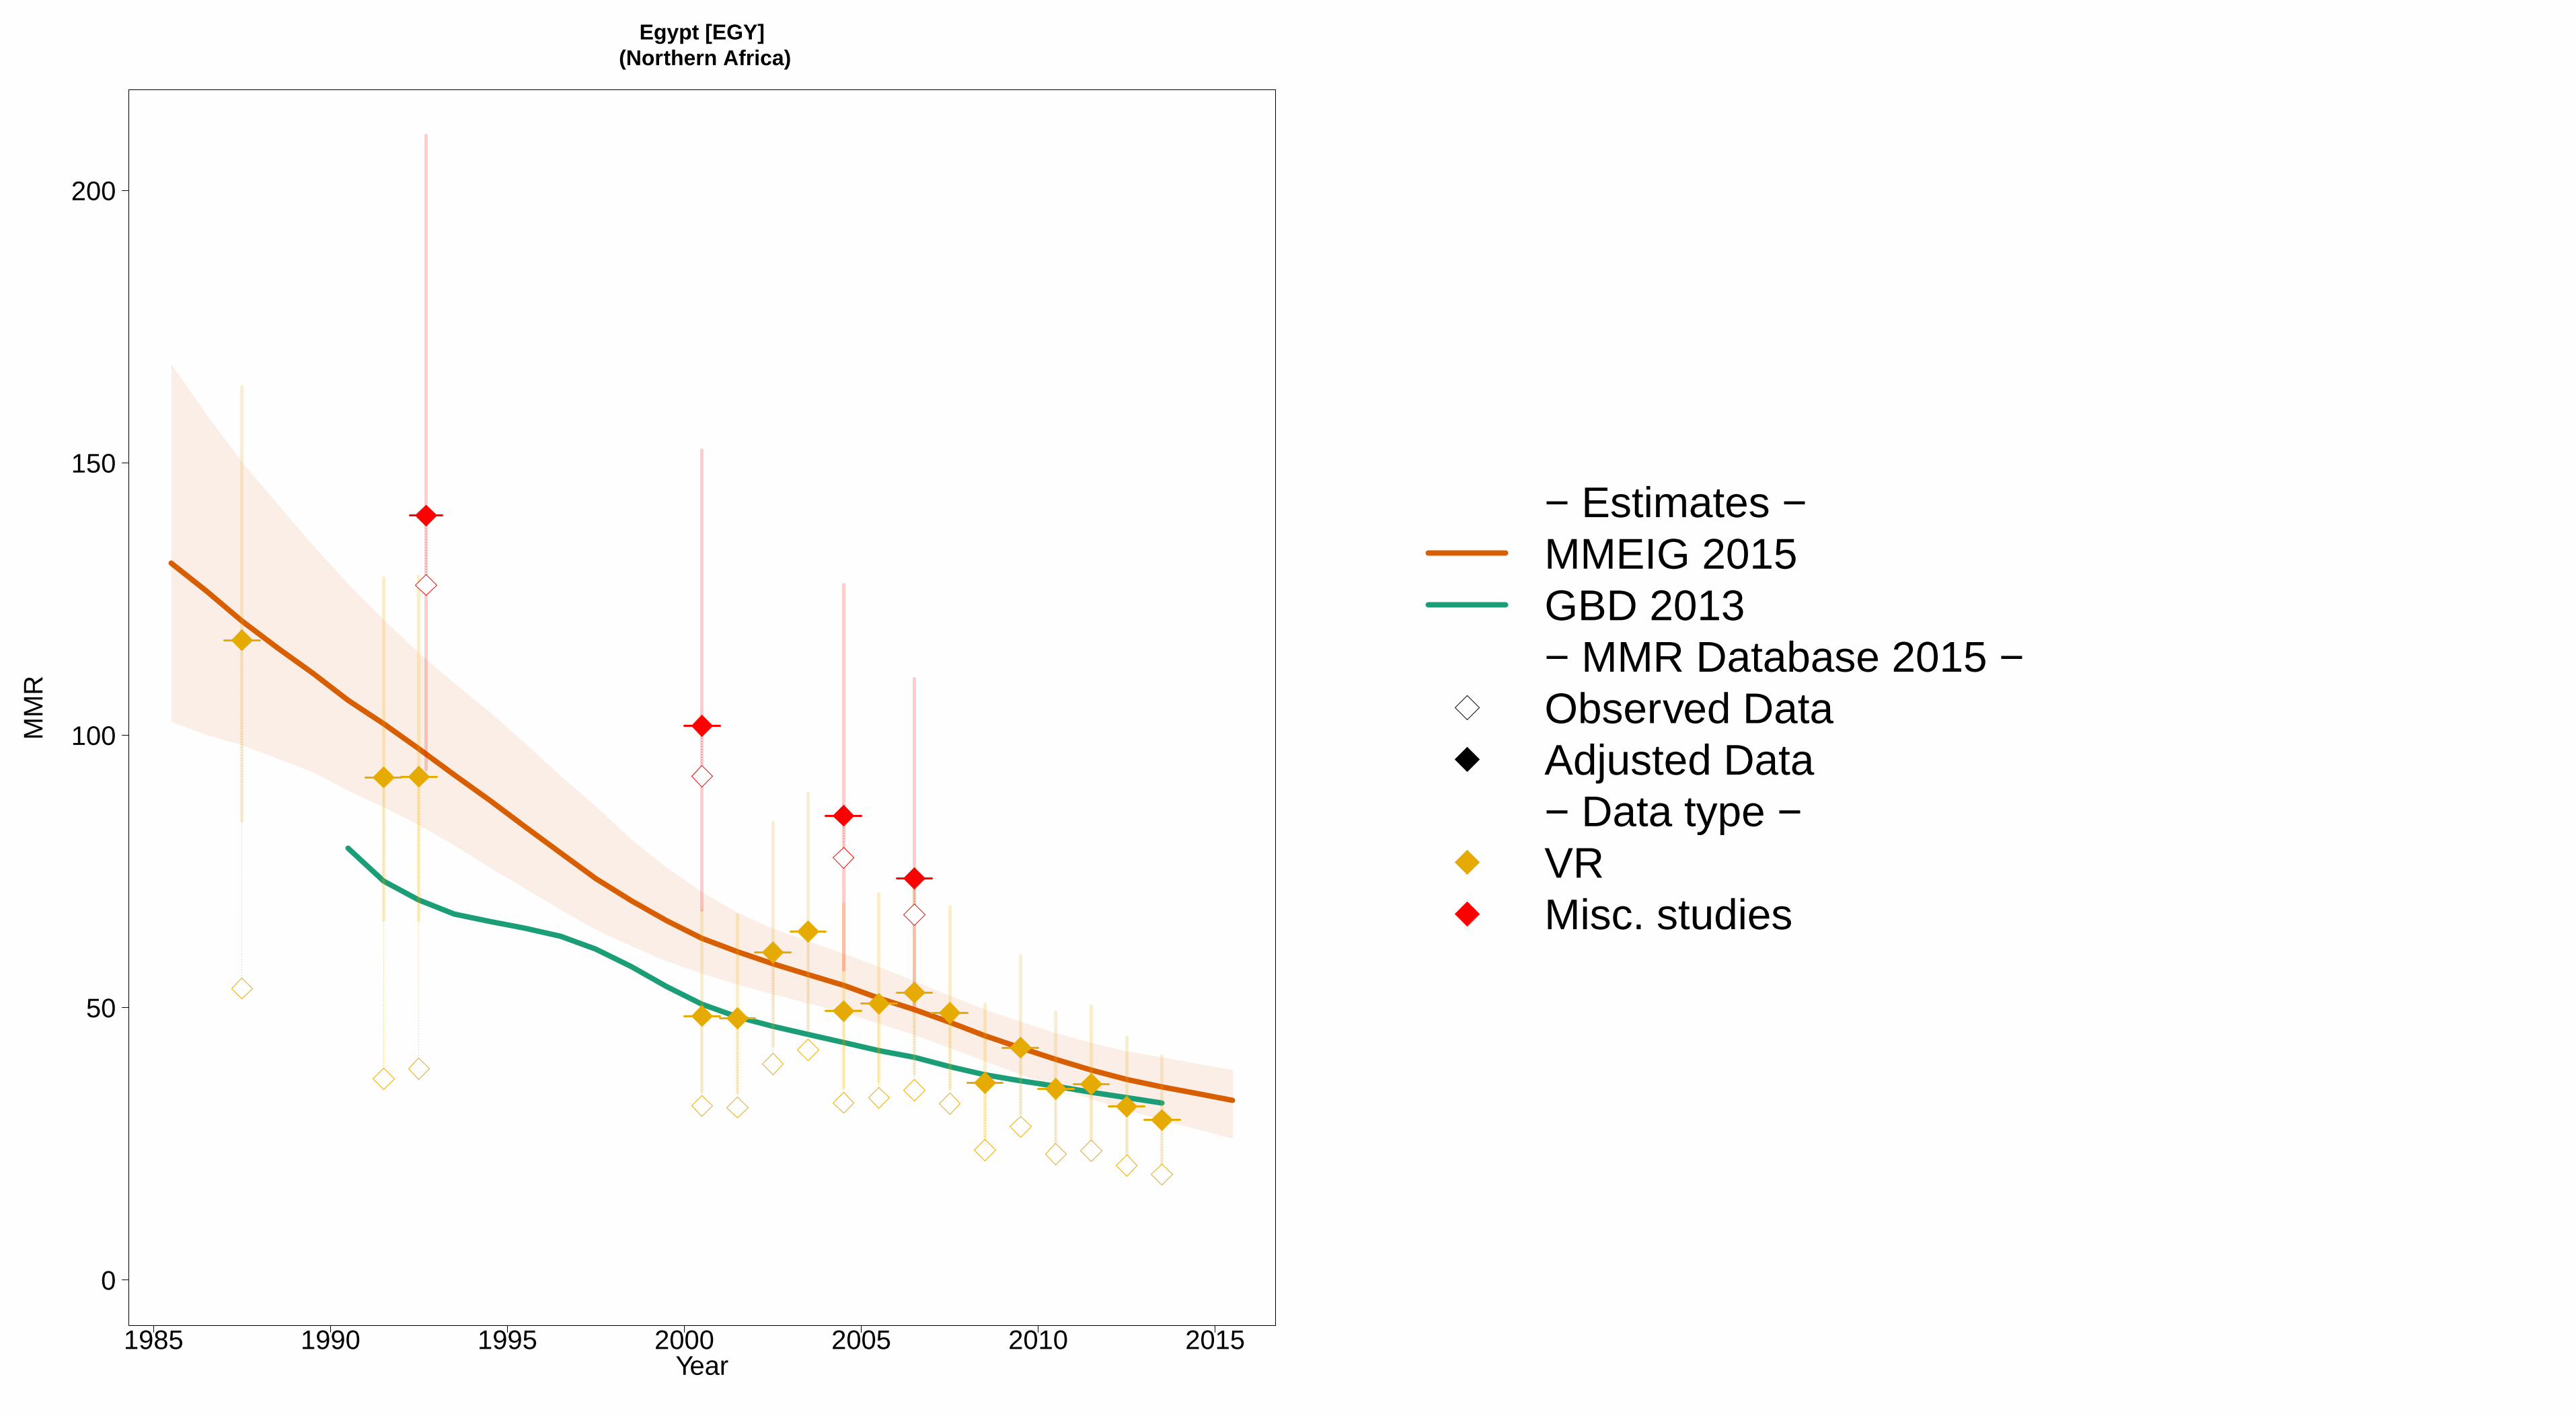
1985 1990 1995 2000 2005 2010 2015
Egypt [EGY] (Northern Africa)
Year
0
50
100
150
200
MM
R
− Estimates −MMEIG 2015GBD 2013− MMR Database 2015 −Observed DataAdjusted Data− Data type −VRMisc. studies
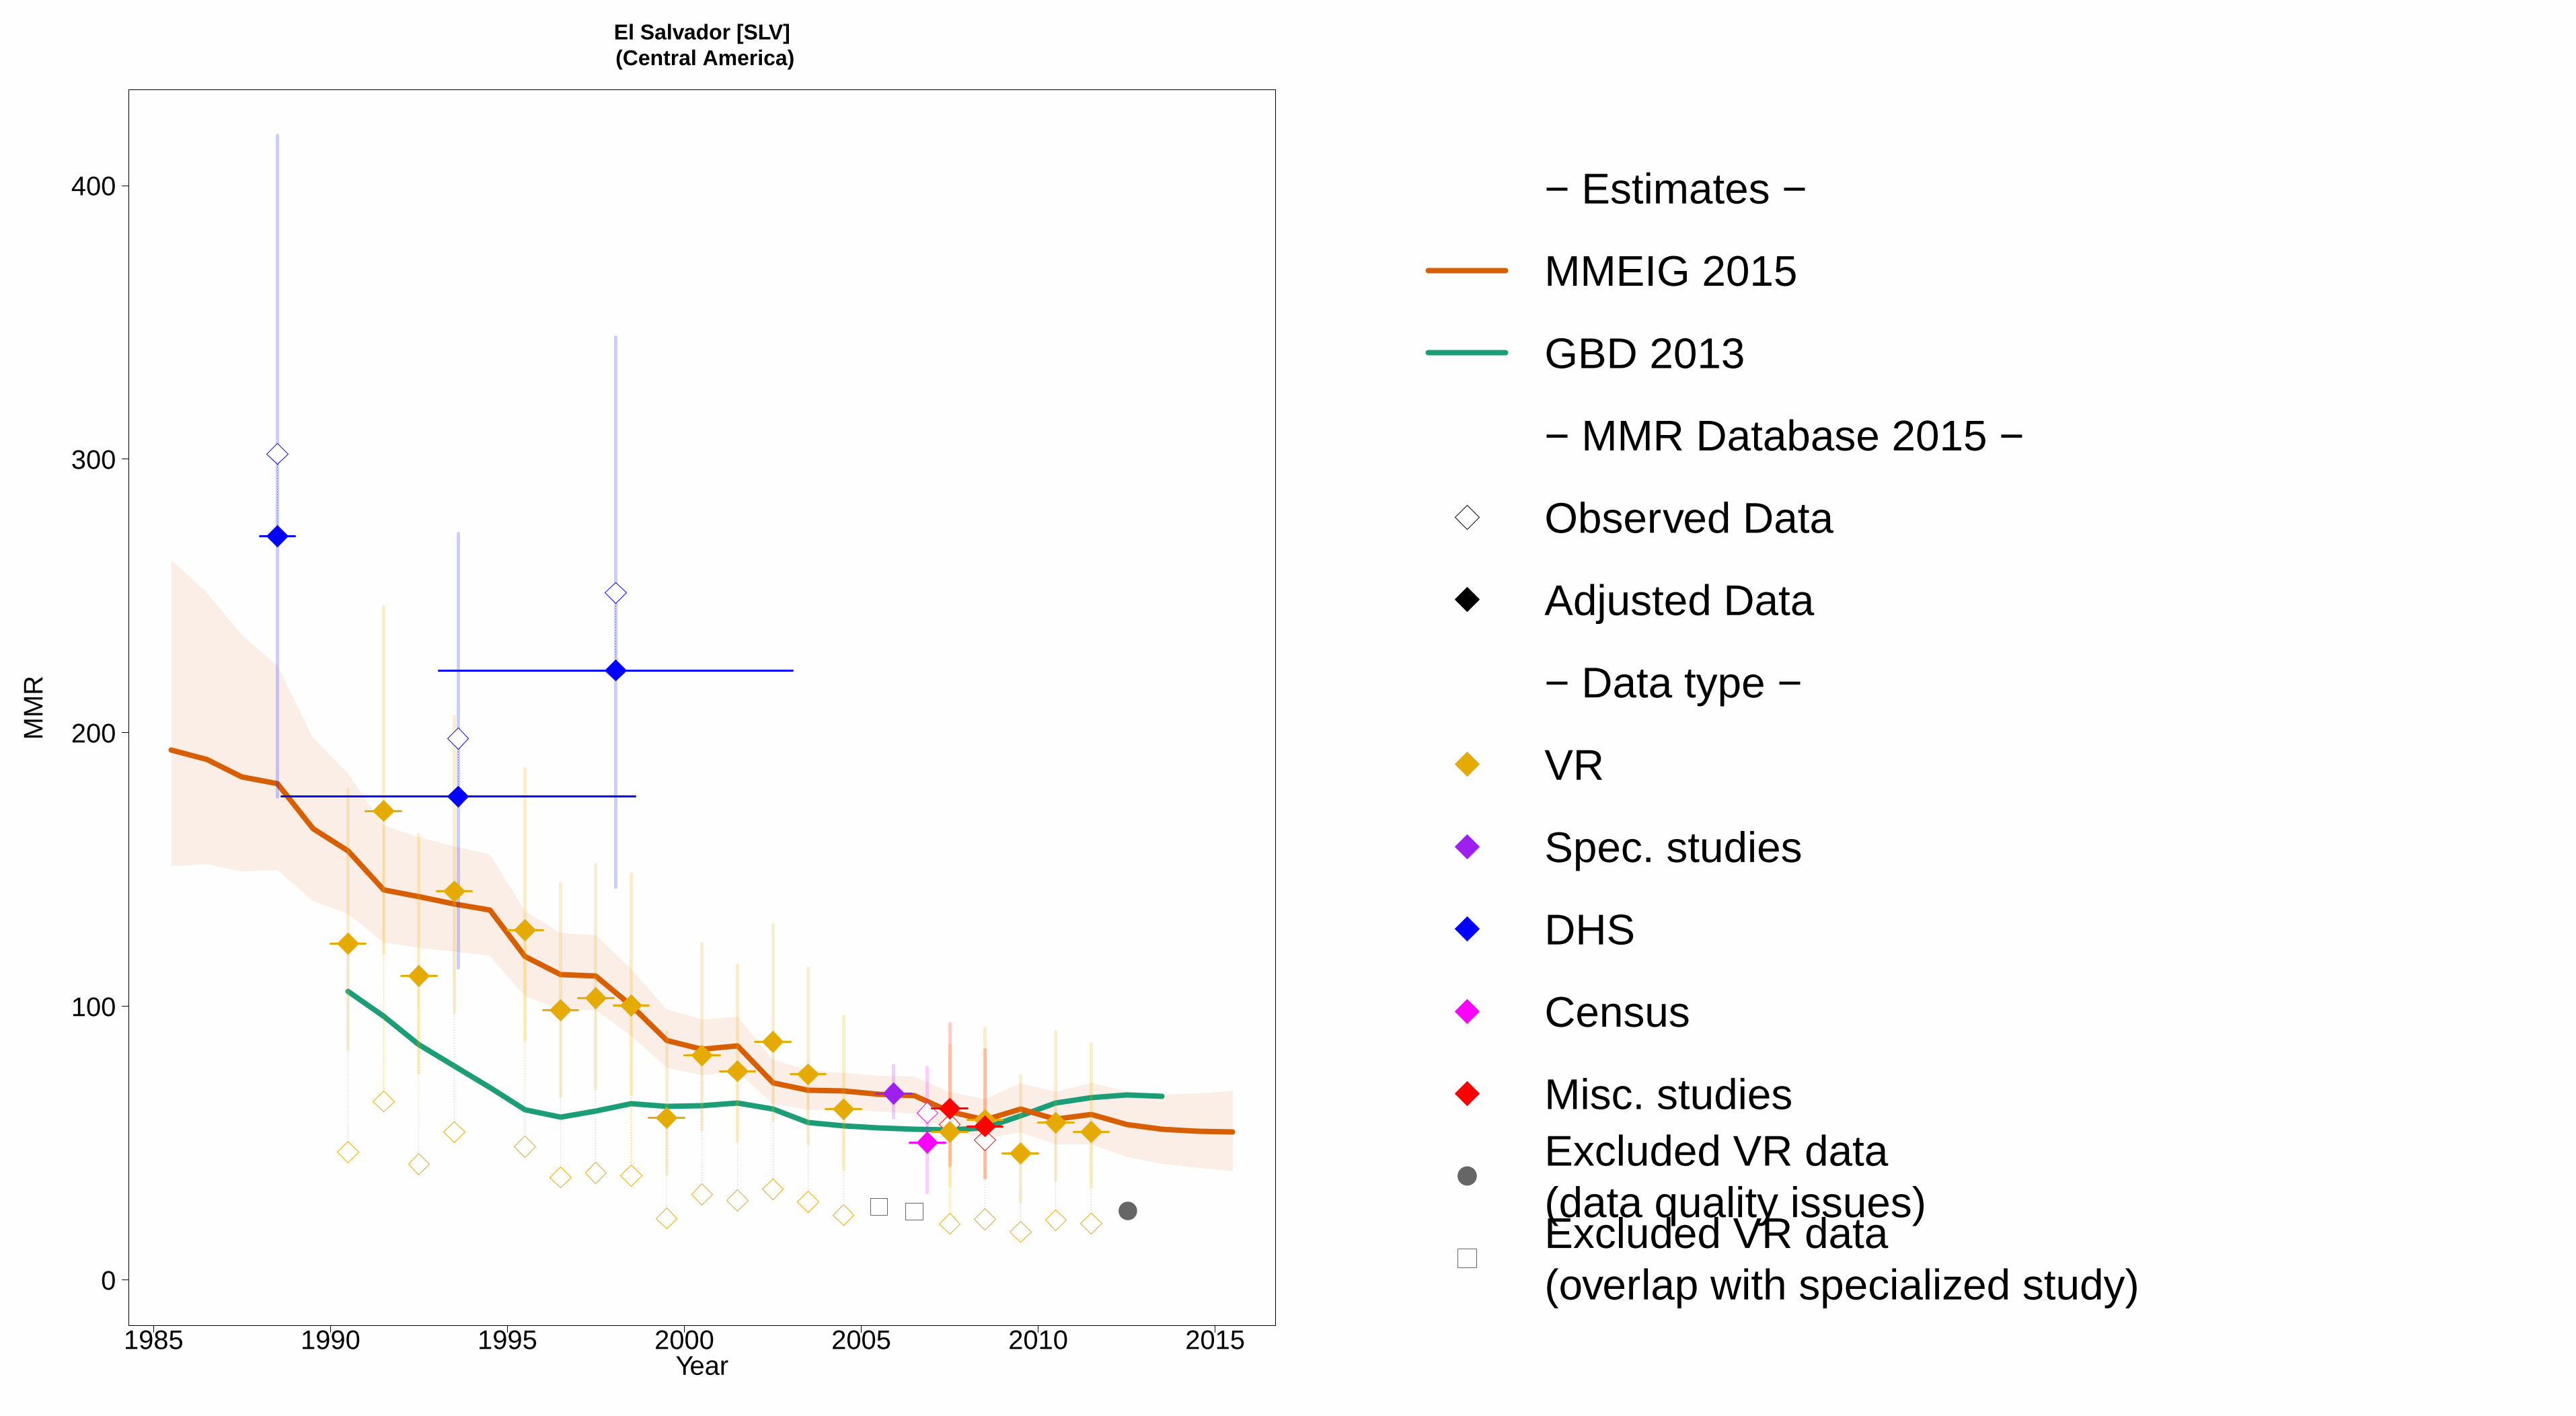
1985 1990 1995 2000 2005 2010 2015
El Salvador [SLV] (Central America)
Year
0
100
200
300
400
MM
R
●
− Estimates −
MMEIG 2015
GBD 2013
− MMR Database 2015 −
Observed Data
Adjusted Data
− Data type −
VR
Spec. studies
DHS
Census
Misc. studiesExcluded VR data (data quality issues)Excluded VR data (overlap with specialized study)
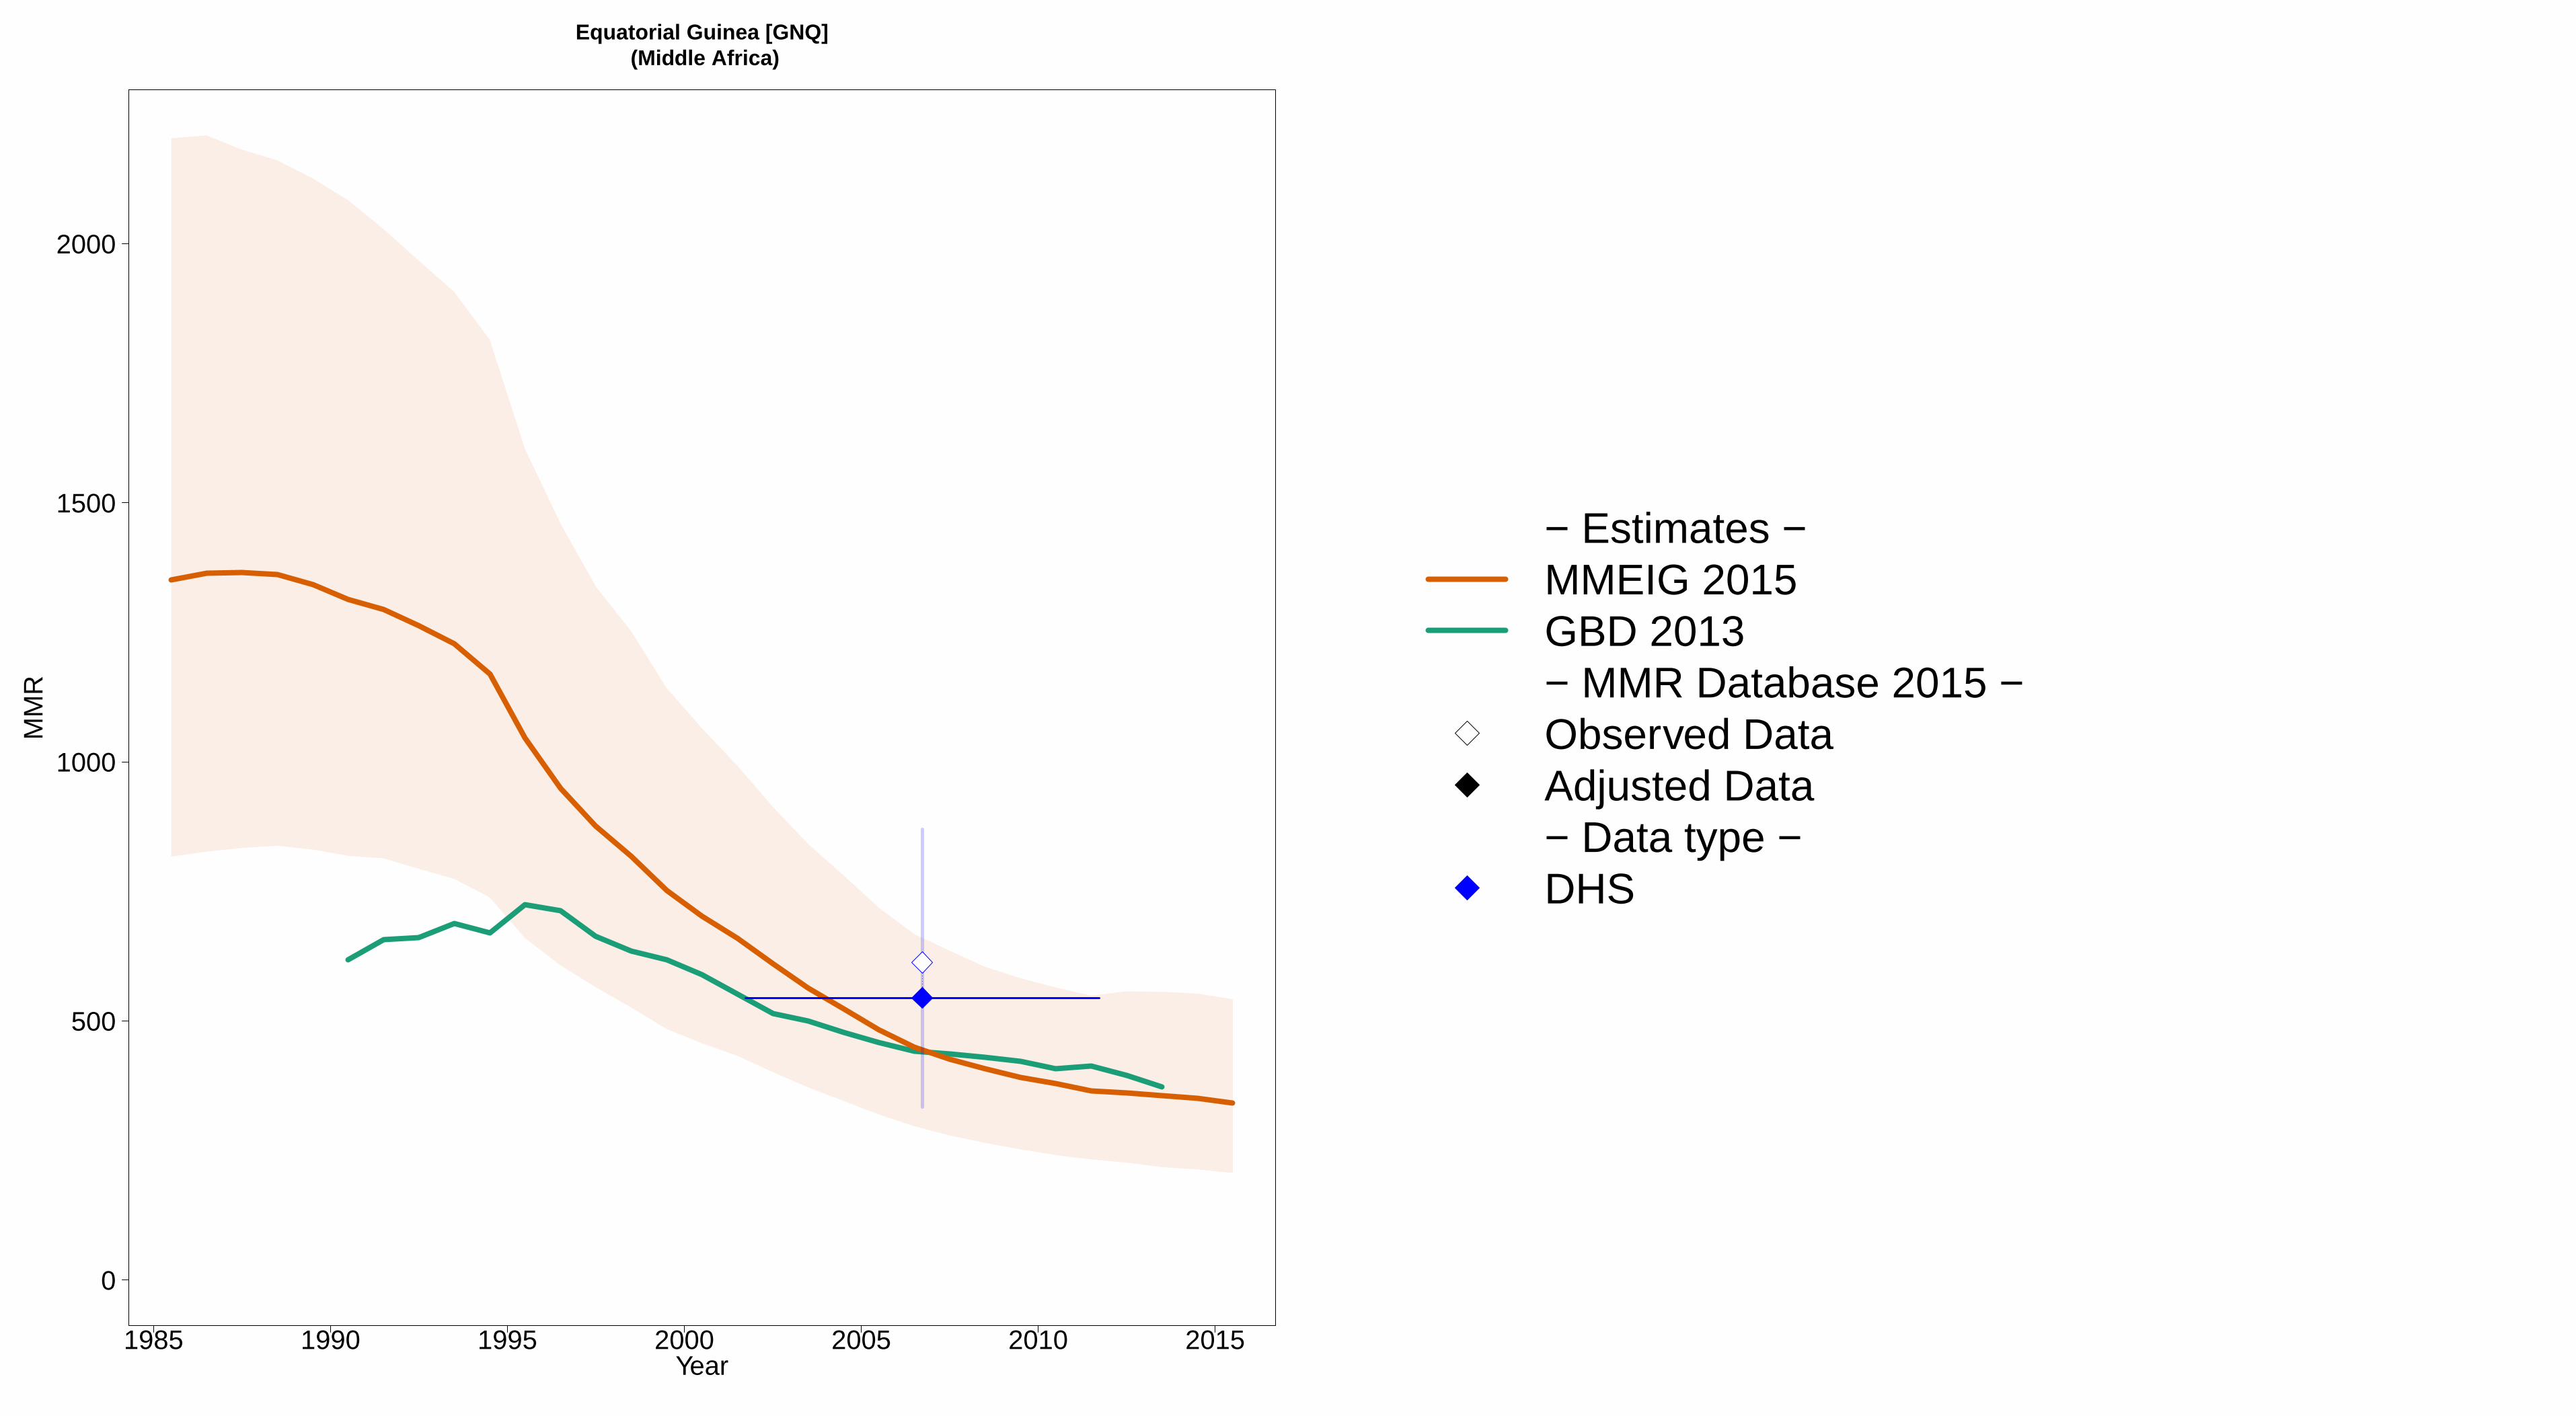
1985 1990 1995 2000 2005 2010 2015
Equatorial Guinea [GNQ] (Middle Africa)
Year
0
500
1000
1500
2000
MM
R
− Estimates −MMEIG 2015GBD 2013− MMR Database 2015 −Observed DataAdjusted Data− Data type −DHS

1985 1990 1995 2000 2005 2010 2015
Eritrea [ERI] (Eastern Africa)
Year
0
500
1000
1500
2000
2500
MM
R
− Estimates −MMEIG 2015GBD 2013− MMR Database 2015 −Observed DataAdjusted Data− Data type −DHS

1985 1990 1995 2000 2005 2010 2015
Estonia [EST] (Developed regions)
Year
0
50
100
MM
R
− Estimates −
MMEIG 2015
GBD 2013
− MMR Database 2015 −
Observed Data
Adjusted Data
− Data type −
VRReported VR before recalc.(related to 0 obs. mat. death)
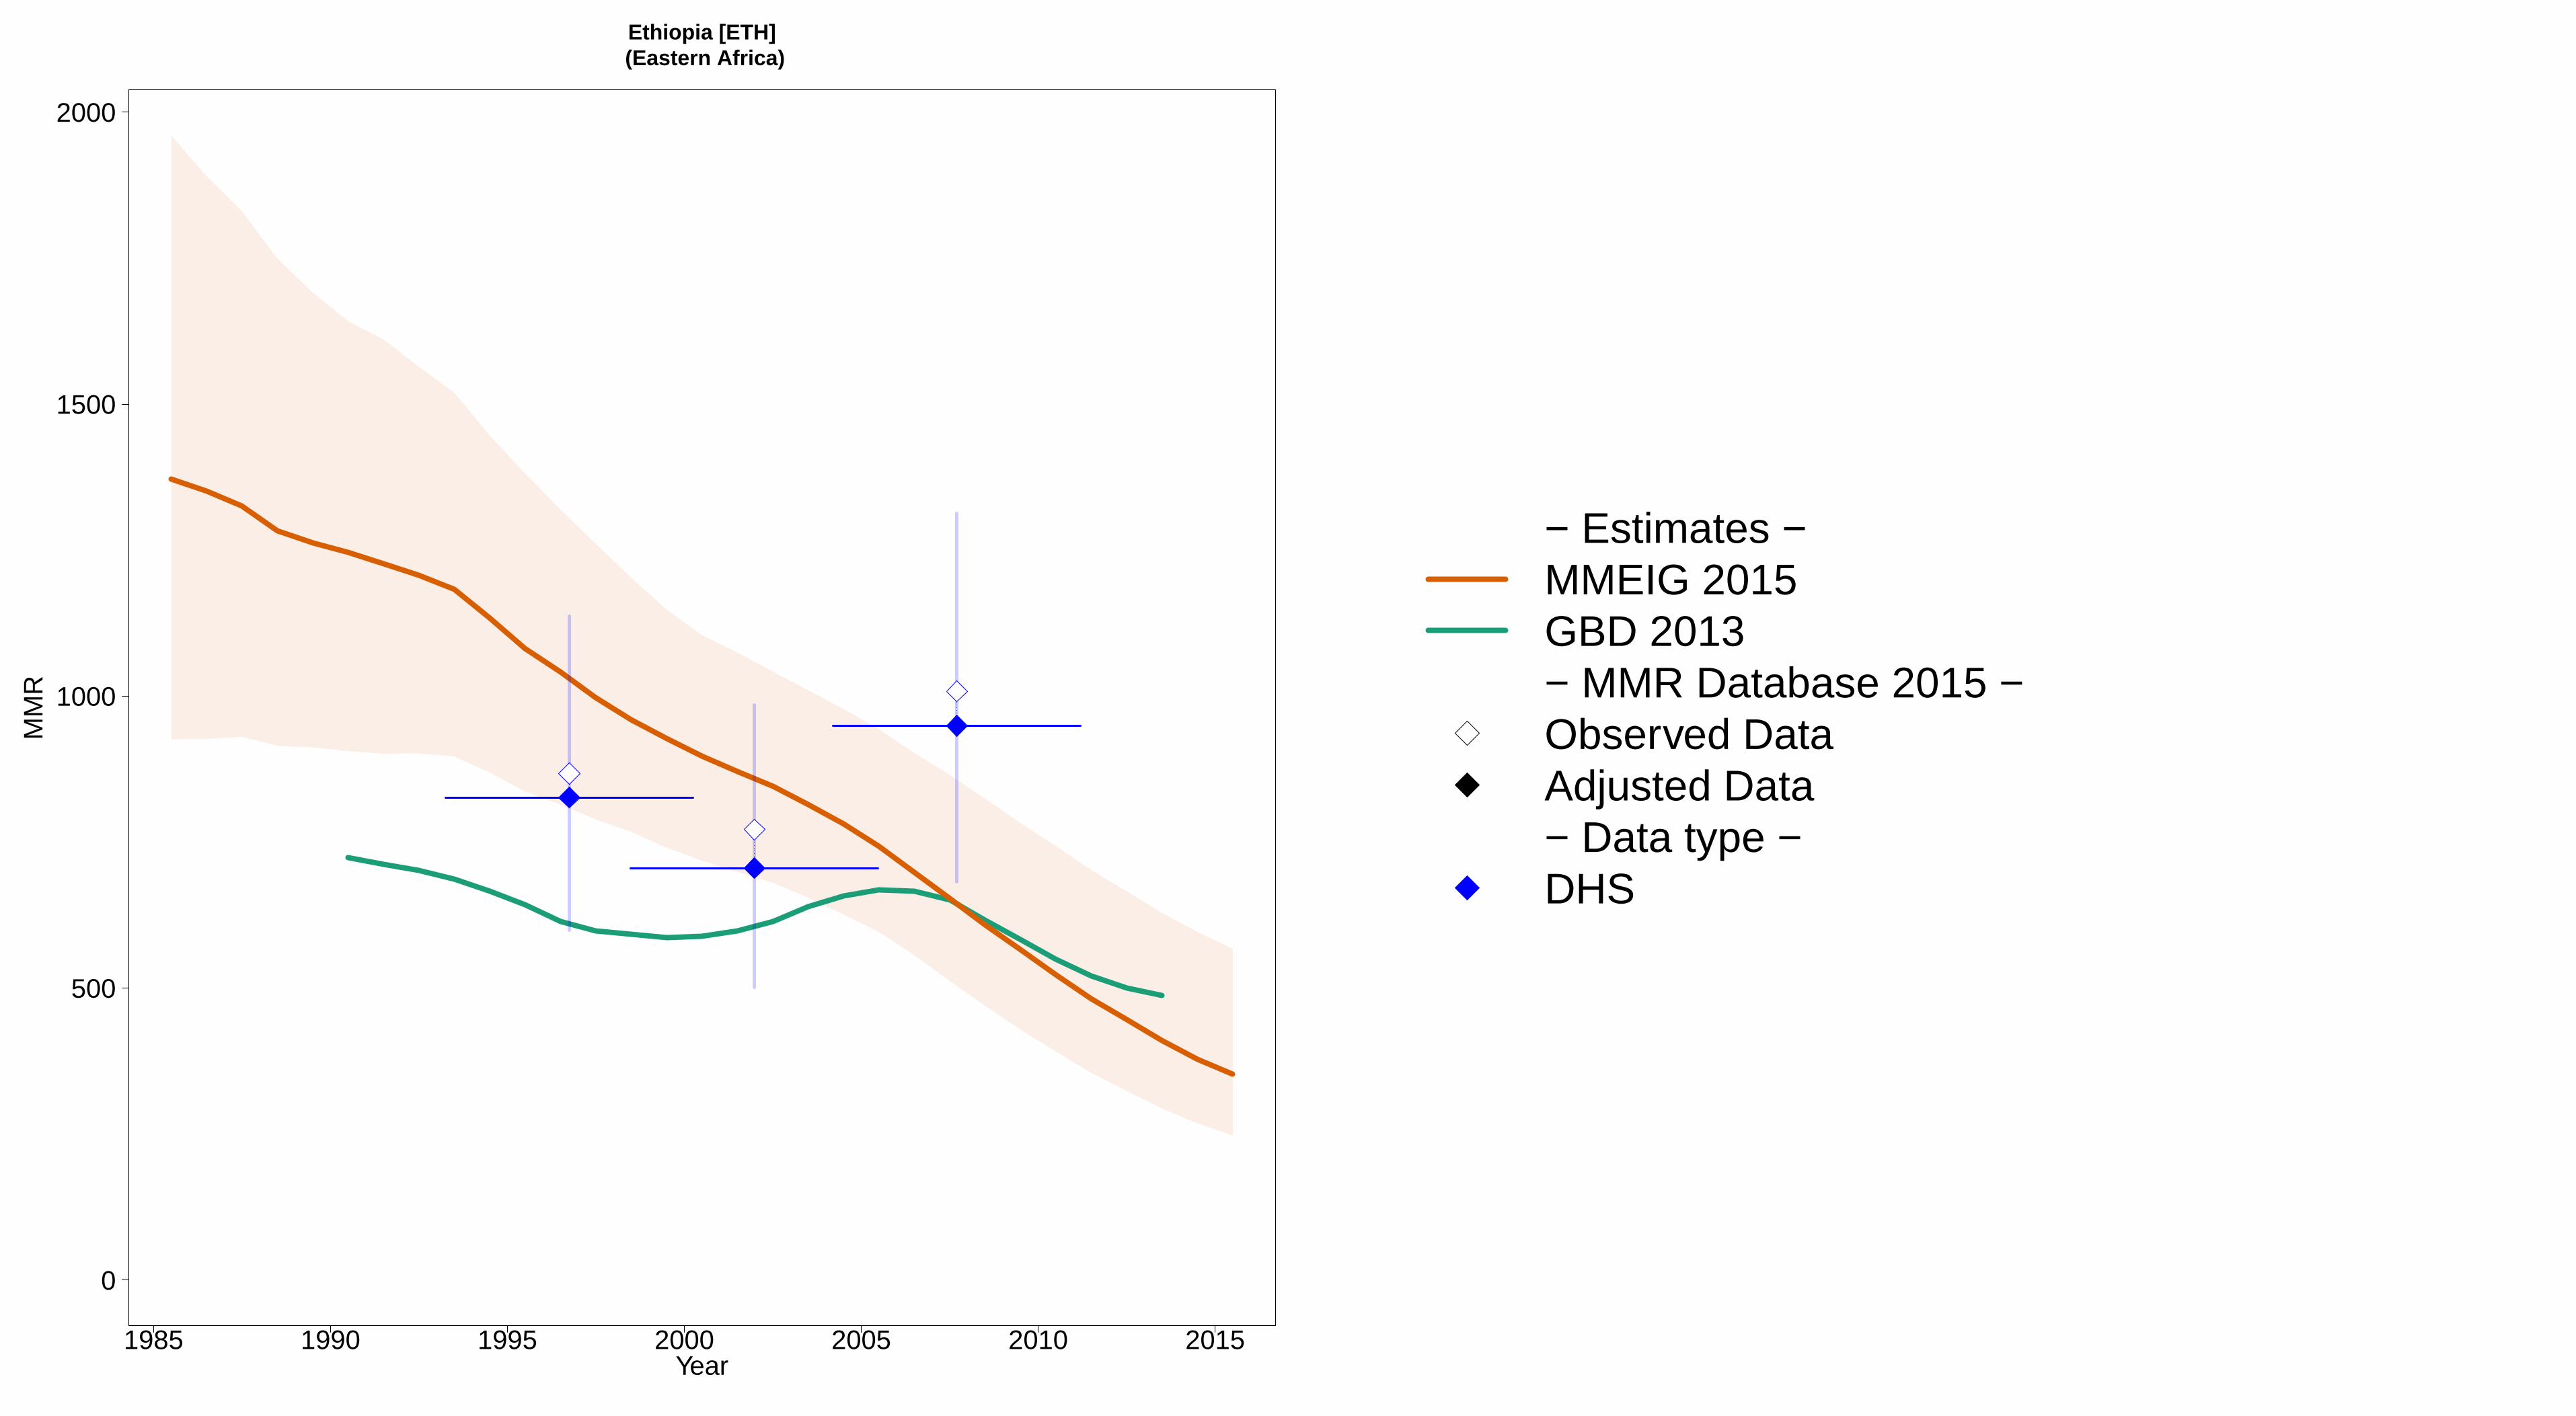
1985 1990 1995 2000 2005 2010 2015
Ethiopia [ETH] (Eastern Africa)
Year
0
500
1000
1500
2000
MM
R
− Estimates −MMEIG 2015GBD 2013− MMR Database 2015 −Observed DataAdjusted Data− Data type −DHS
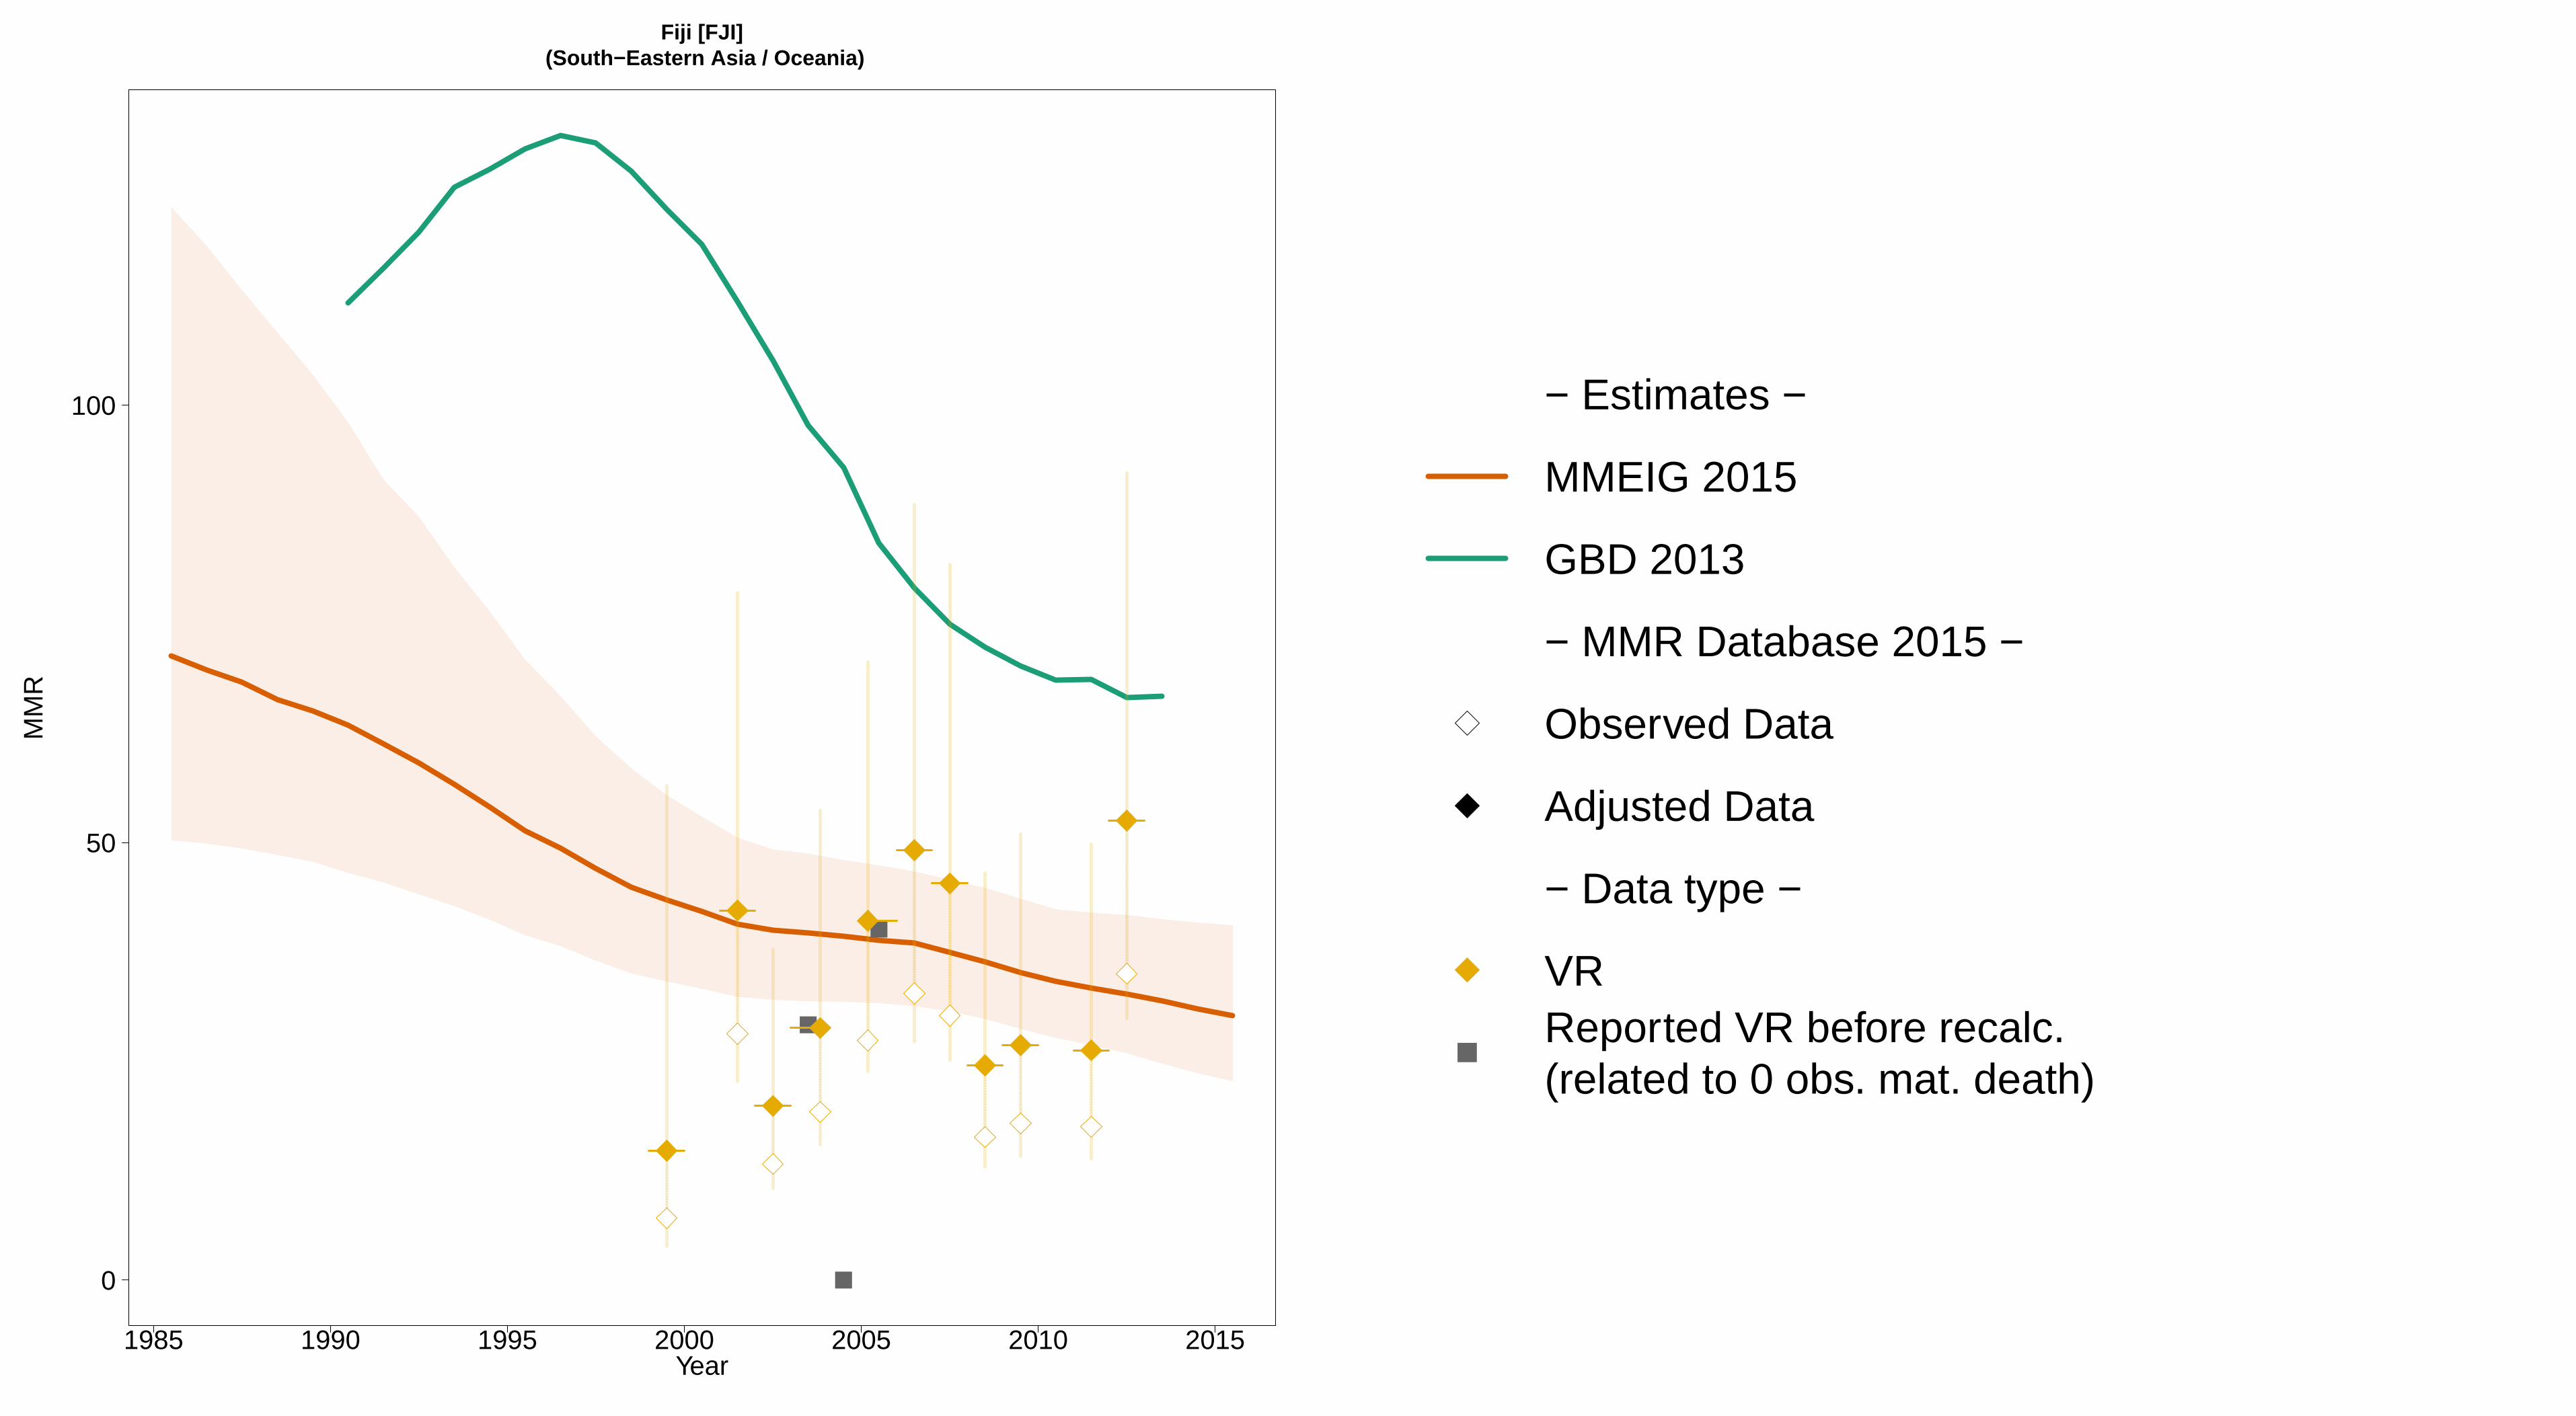
1985 1990 1995 2000 2005 2010 2015
Fiji [FJI] (South−Eastern Asia / Oceania)
Year
0
50
100
MM
R
− Estimates −
MMEIG 2015
GBD 2013
− MMR Database 2015 −
Observed Data
Adjusted Data
− Data type −
VRReported VR before recalc.(related to 0 obs. mat. death)
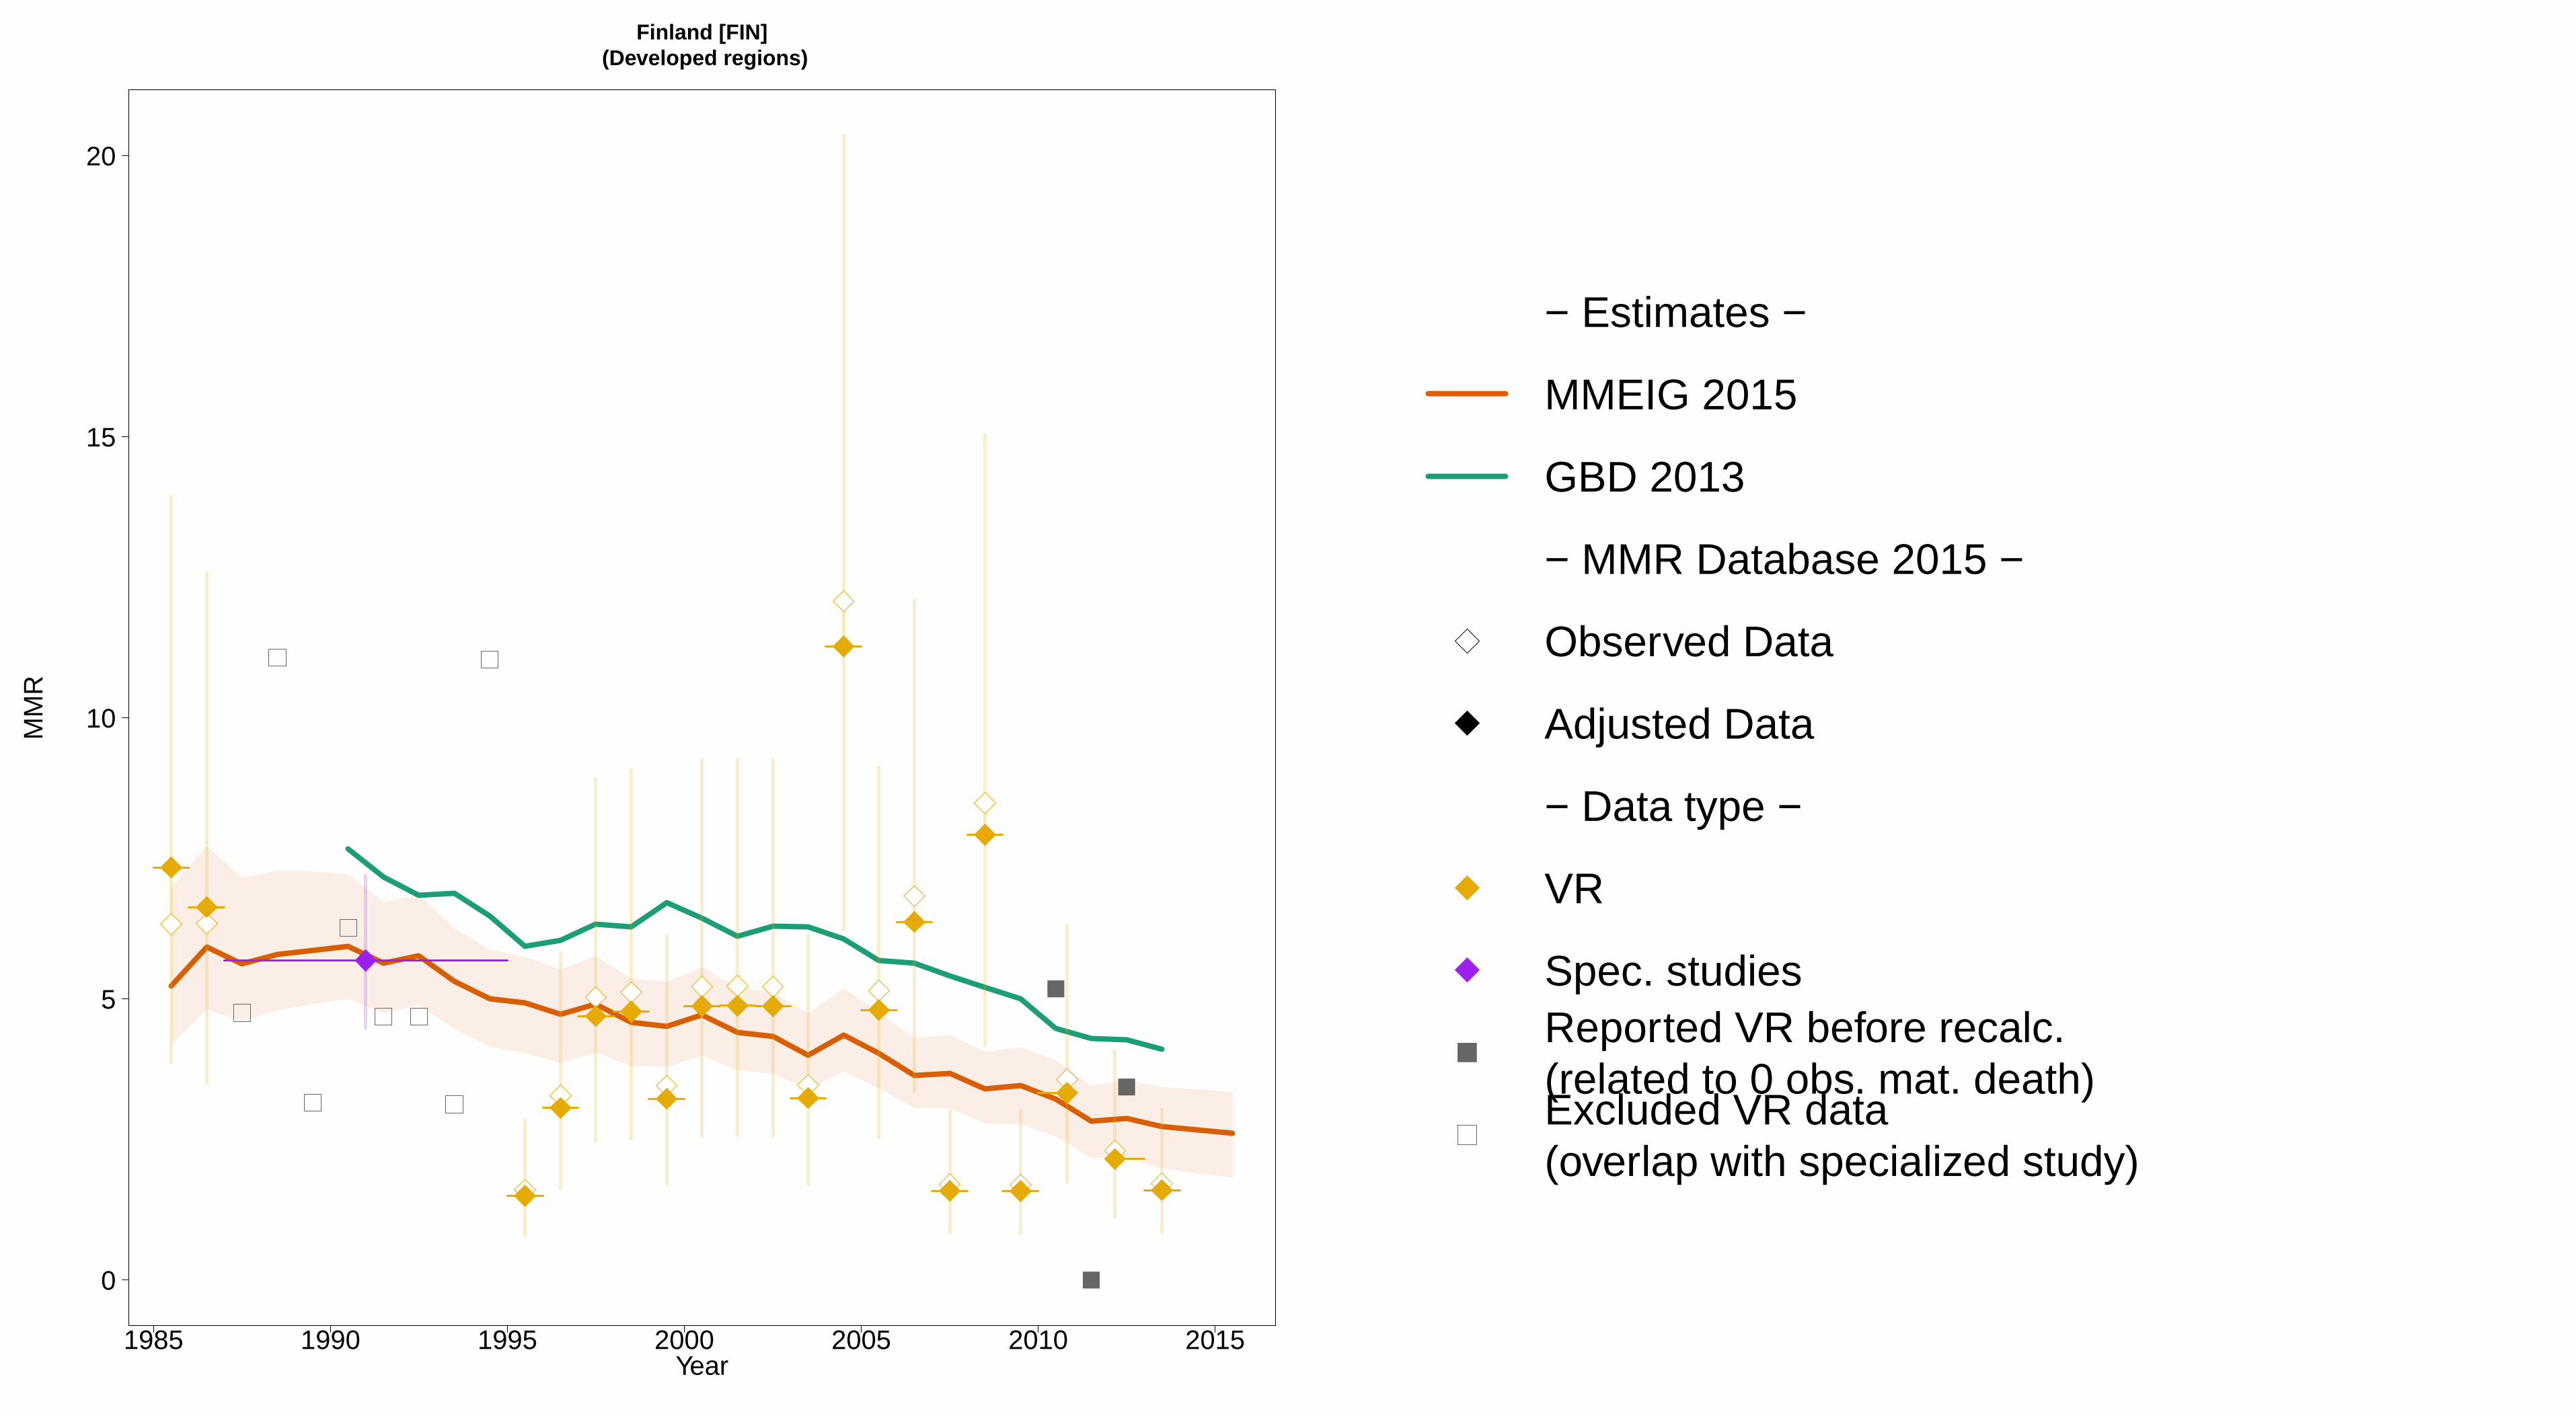
1985 1990 1995 2000 2005 2010 2015
Finland [FIN] (Developed regions)
Year
0
5
10
15
20
MM
R
− Estimates −
MMEIG 2015
GBD 2013
− MMR Database 2015 −
Observed Data
Adjusted Data
− Data type −
VR
Spec. studiesReported VR before recalc.(related to 0 obs. mat. death)Excluded VR data (overlap with specialized study)

1985 1990 1995 2000 2005 2010 2015
France [FRA] (Developed regions)
Year
0
5
10
15
20
25
MM
R
− Estimates −
MMEIG 2015
GBD 2013
− MMR Database 2015 −
Observed Data
Adjusted Data
− Data type −
VR
Spec. studiesExcluded VR data (overlap with specialized study)

1985 1990 1995 2000 2005 2010 2015
Gabon [GAB] (Middle Africa)
Year
0
100
200
300
400
500
600
700
MM
R
− Estimates −MMEIG 2015GBD 2013− MMR Database 2015 −Observed DataAdjusted Data− Data type −DHS

1985 1990 1995 2000 2005 2010 2015
Gambia [GMB] (Western Africa)
Year
0
500
1000
1500
MM
R
− Estimates −MMEIG 2015GBD 2013− MMR Database 2015 −Observed DataAdjusted Data− Data type −DHS

1985 1990 1995 2000 2005 2010 2015
Georgia [GEO] (Western Asia)
Year
0
50
100
150
MM
R
●
− Estimates −
MMEIG 2015
GBD 2013
− MMR Database 2015 −
Observed Data
Adjusted Data
− Data type −
VR
Spec. studiesExcluded VR data (data quality issues)Excluded VR data (overlap with specialized study)
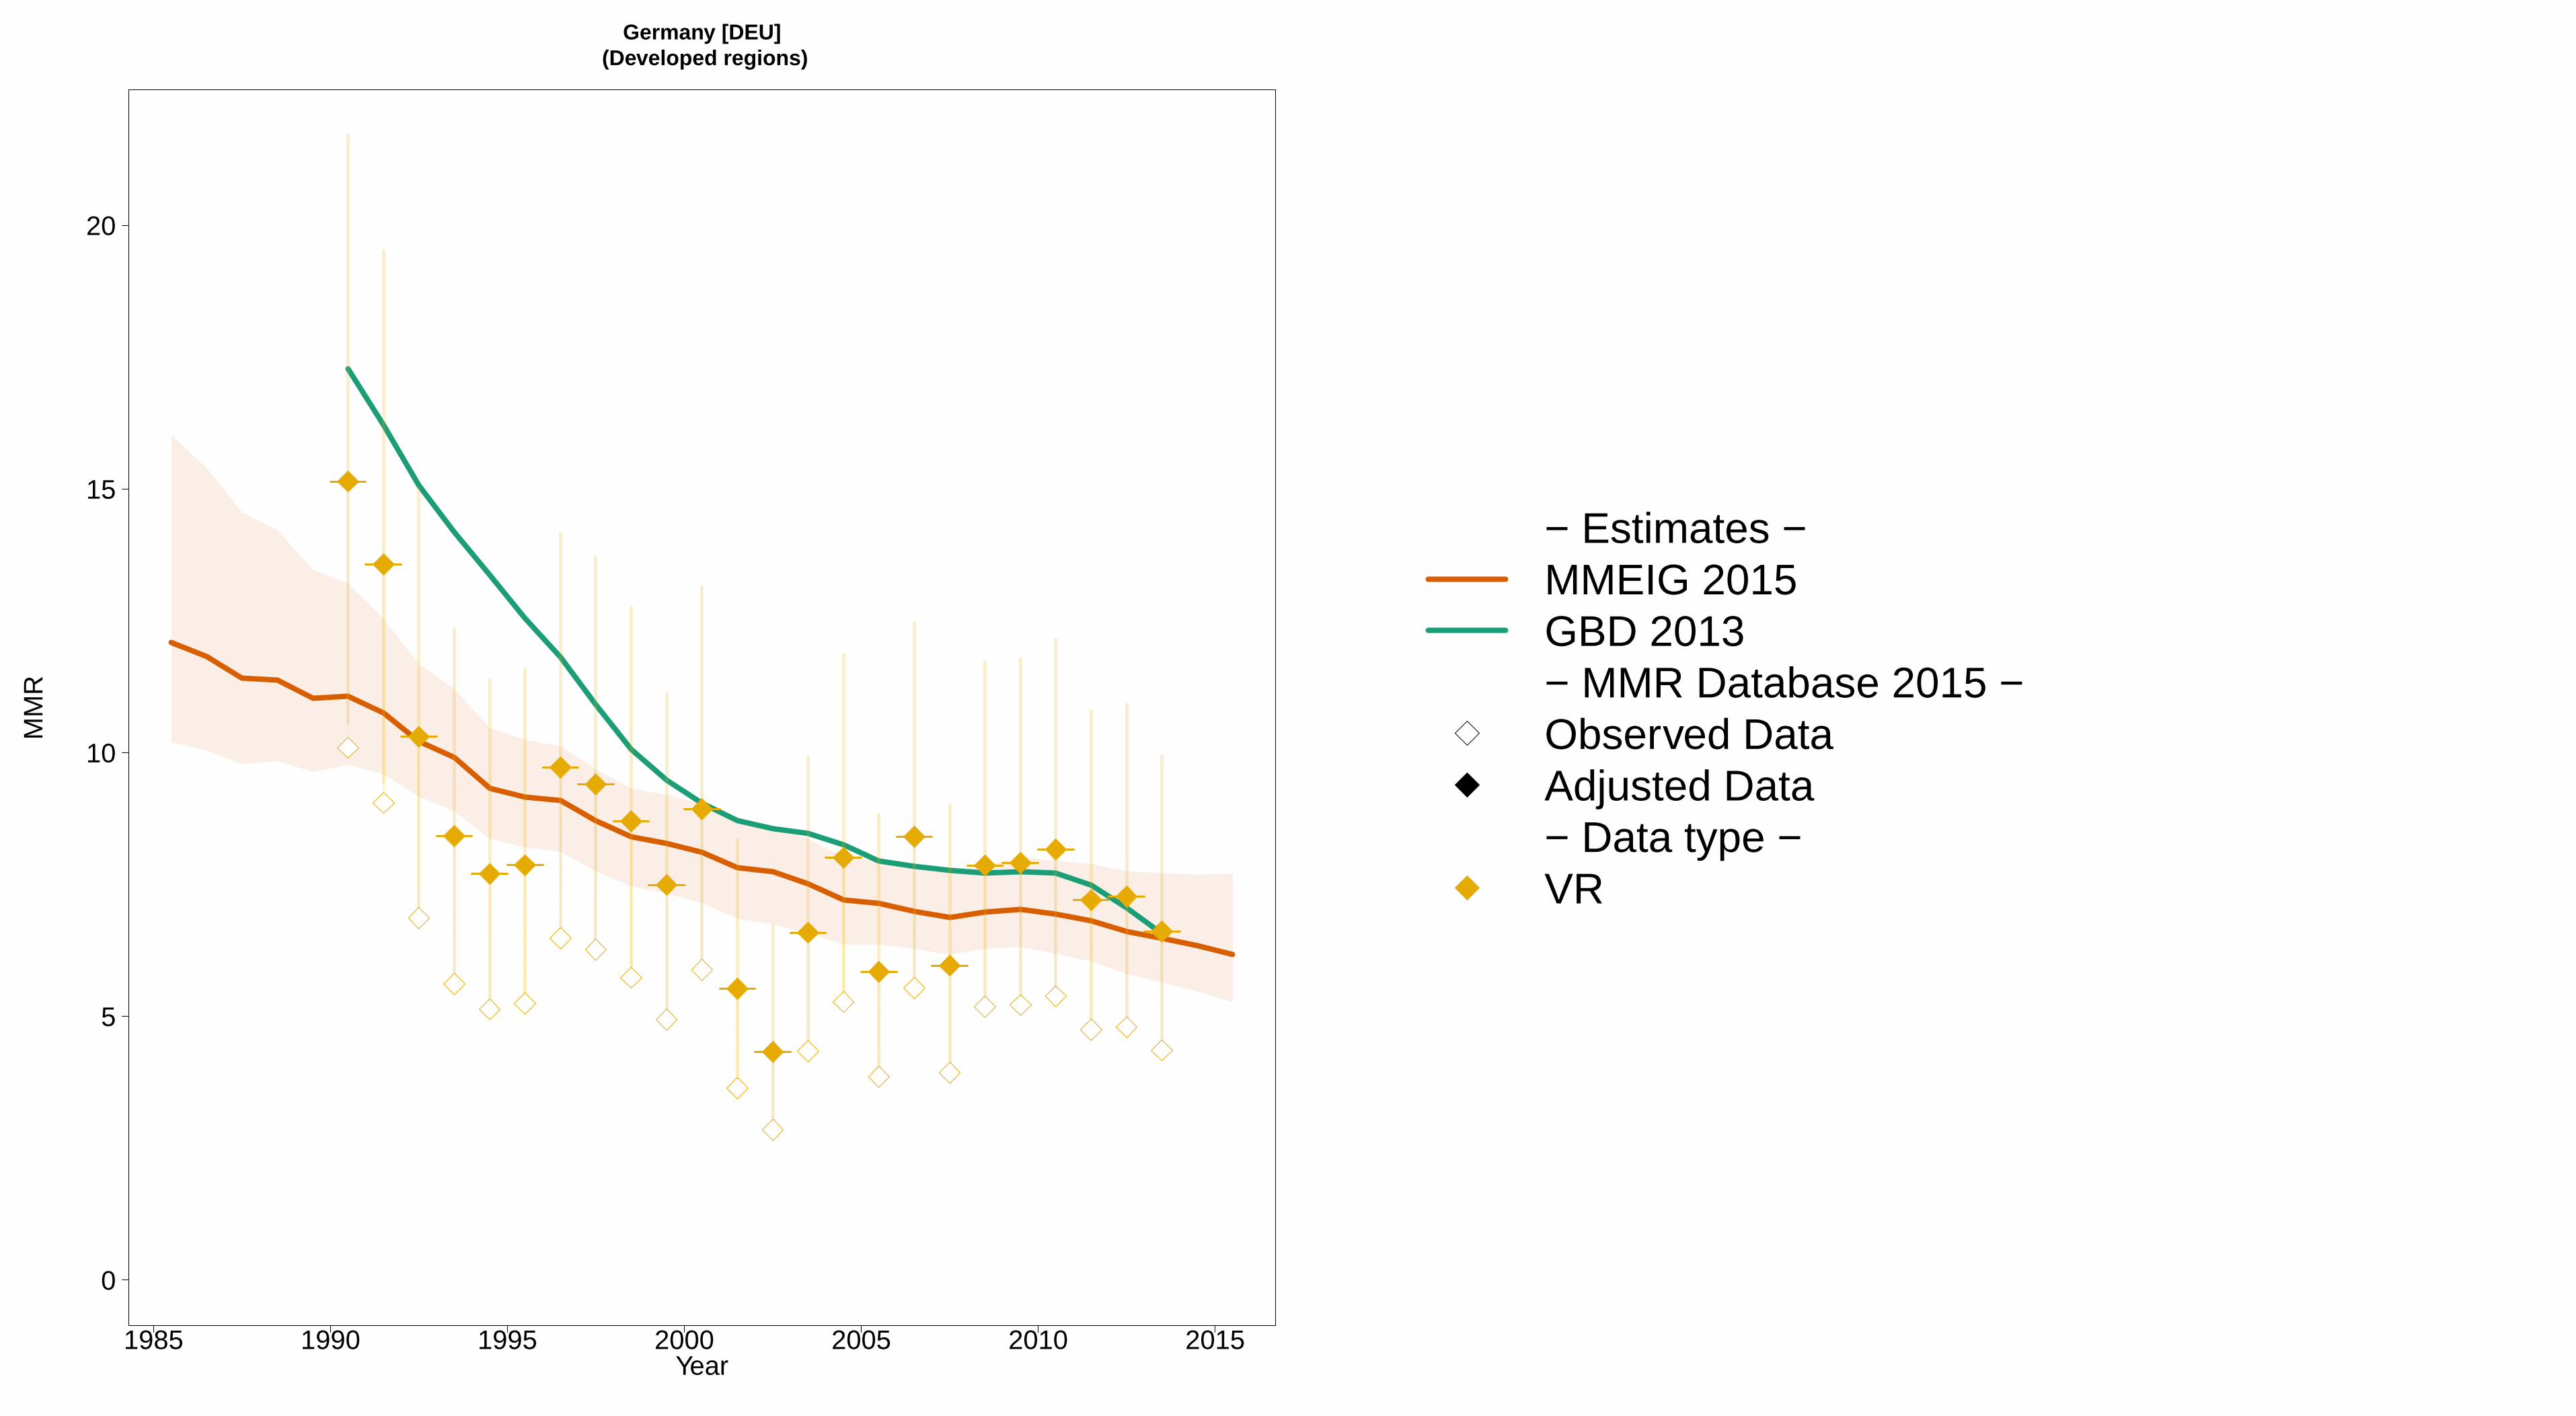
1985 1990 1995 2000 2005 2010 2015
Germany [DEU] (Developed regions)
Year
0
5
10
15
20
MM
R
− Estimates −MMEIG 2015GBD 2013− MMR Database 2015 −Observed DataAdjusted Data− Data type −VR

1985 1990 1995 2000 2005 2010 2015
Ghana [GHA] (Western Africa)
Year
0
500
1000
MM
R
− Estimates −MMEIG 2015GBD 2013− MMR Database 2015 −Observed DataAdjusted Data− Data type −DHSCensus

1985 1990 1995 2000 2005 2010 2015
Greece [GRC] (Developed regions)
Year
0
5
10
15
20
MM
R
− Estimates −
MMEIG 2015
GBD 2013
− MMR Database 2015 −
Observed Data
Adjusted Data
− Data type −
VRReported VR before recalc.(related to 0 obs. mat. death)

1985 1990 1995 2000 2005 2010 2015
Grenada [GRD] (Caribbean)
Year
0
50
100
150
200
250
MM
R
− Estimates −
MMEIG 2015
GBD 2013
− MMR Database 2015 −
Observed Data
Adjusted Data
− Data type −
VRReported VR before recalc.(related to 0 obs. mat. death)

1985 1990 1995 2000 2005 2010 2015
Guatemala [GTM] (Central America)
Year
0
50
100
150
200
250
300
350
MM
R
− Estimates −
MMEIG 2015
GBD 2013
− MMR Database 2015 −
Observed Data
Adjusted Data
− Data type −
VR
Spec. studies
Misc. studiesExcluded VR data (overlap with specialized study)
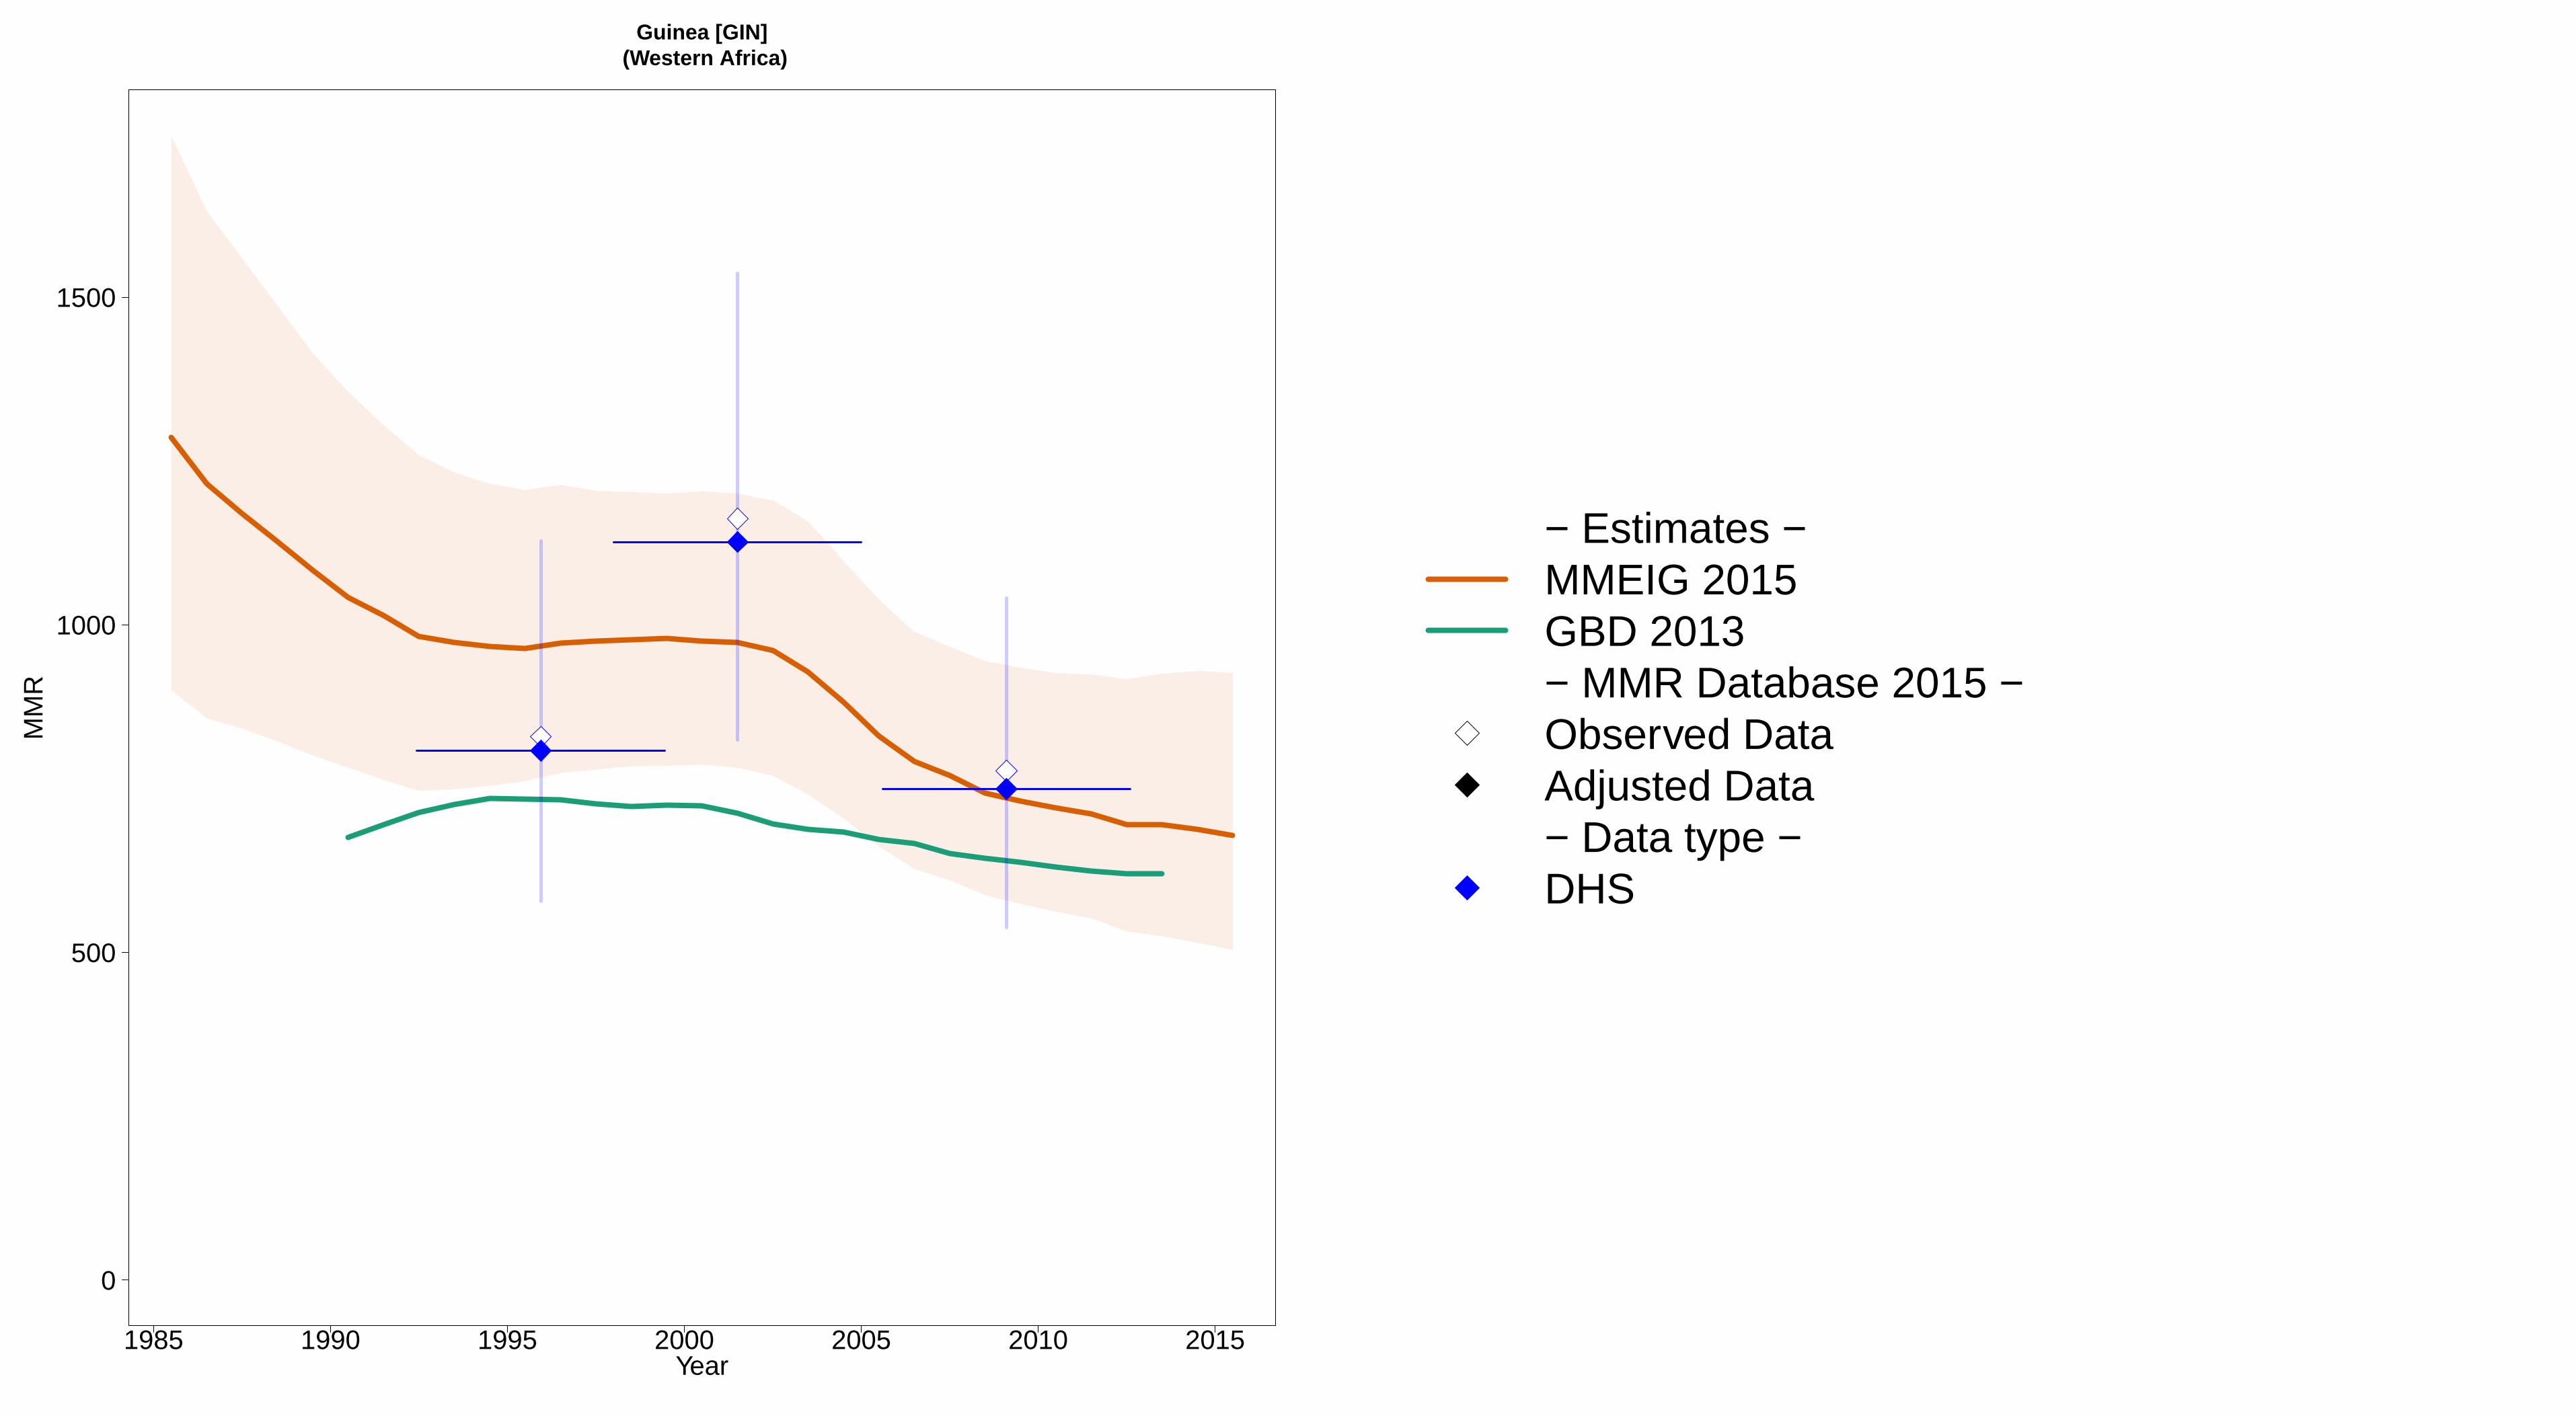
1985 1990 1995 2000 2005 2010 2015
Guinea [GIN] (Western Africa)
Year
0
500
1000
1500
MM
R
− Estimates −MMEIG 2015GBD 2013− MMR Database 2015 −Observed DataAdjusted Data− Data type −DHS

1985 1990 1995 2000 2005 2010 2015
Guinea−Bissau [GNB] (Western Africa)
Year
0
500
1000
1500
MM
R
− Estimates −MMEIG 2015GBD 2013− MMR Database 2015 −Observed DataAdjusted Data− Data type −Excluded misc. studies

1985 1990 1995 2000 2005 2010 2015
Guyana [GUY] (South America)
Year
0
100
200
300
400
MM
R
− Estimates −MMEIG 2015GBD 2013− MMR Database 2015 −Observed DataAdjusted Data− Data type −VR

1985 1990 1995 2000 2005 2010 2015
Haiti [HTI] (Caribbean)
Year
0
500
1000
MM
R
●● ●
●
●
●
− Estimates −
MMEIG 2015
GBD 2013
− MMR Database 2015 −
Observed Data
Adjusted Data
− Data type −
DHSExcluded VR data (data quality issues)

1985 1990 1995 2000 2005 2010 2015
Honduras [HND] (Central America)
Year
0
100
200
300
400
500
MM
R
●
●
●
●
●
●●
●
●
●
− Estimates −
MMEIG 2015
GBD 2013
− MMR Database 2015 −
Observed Data
Adjusted Data
− Data type −
Spec. studies
Census
Misc. studiesExcluded VR data (data quality issues)

1985 1990 1995 2000 2005 2010 2015
Hungary [HUN] (Developed regions)
Year
0
10
20
30
40
50
60
MM
R
− Estimates −MMEIG 2015GBD 2013− MMR Database 2015 −Observed DataAdjusted Data− Data type −VR
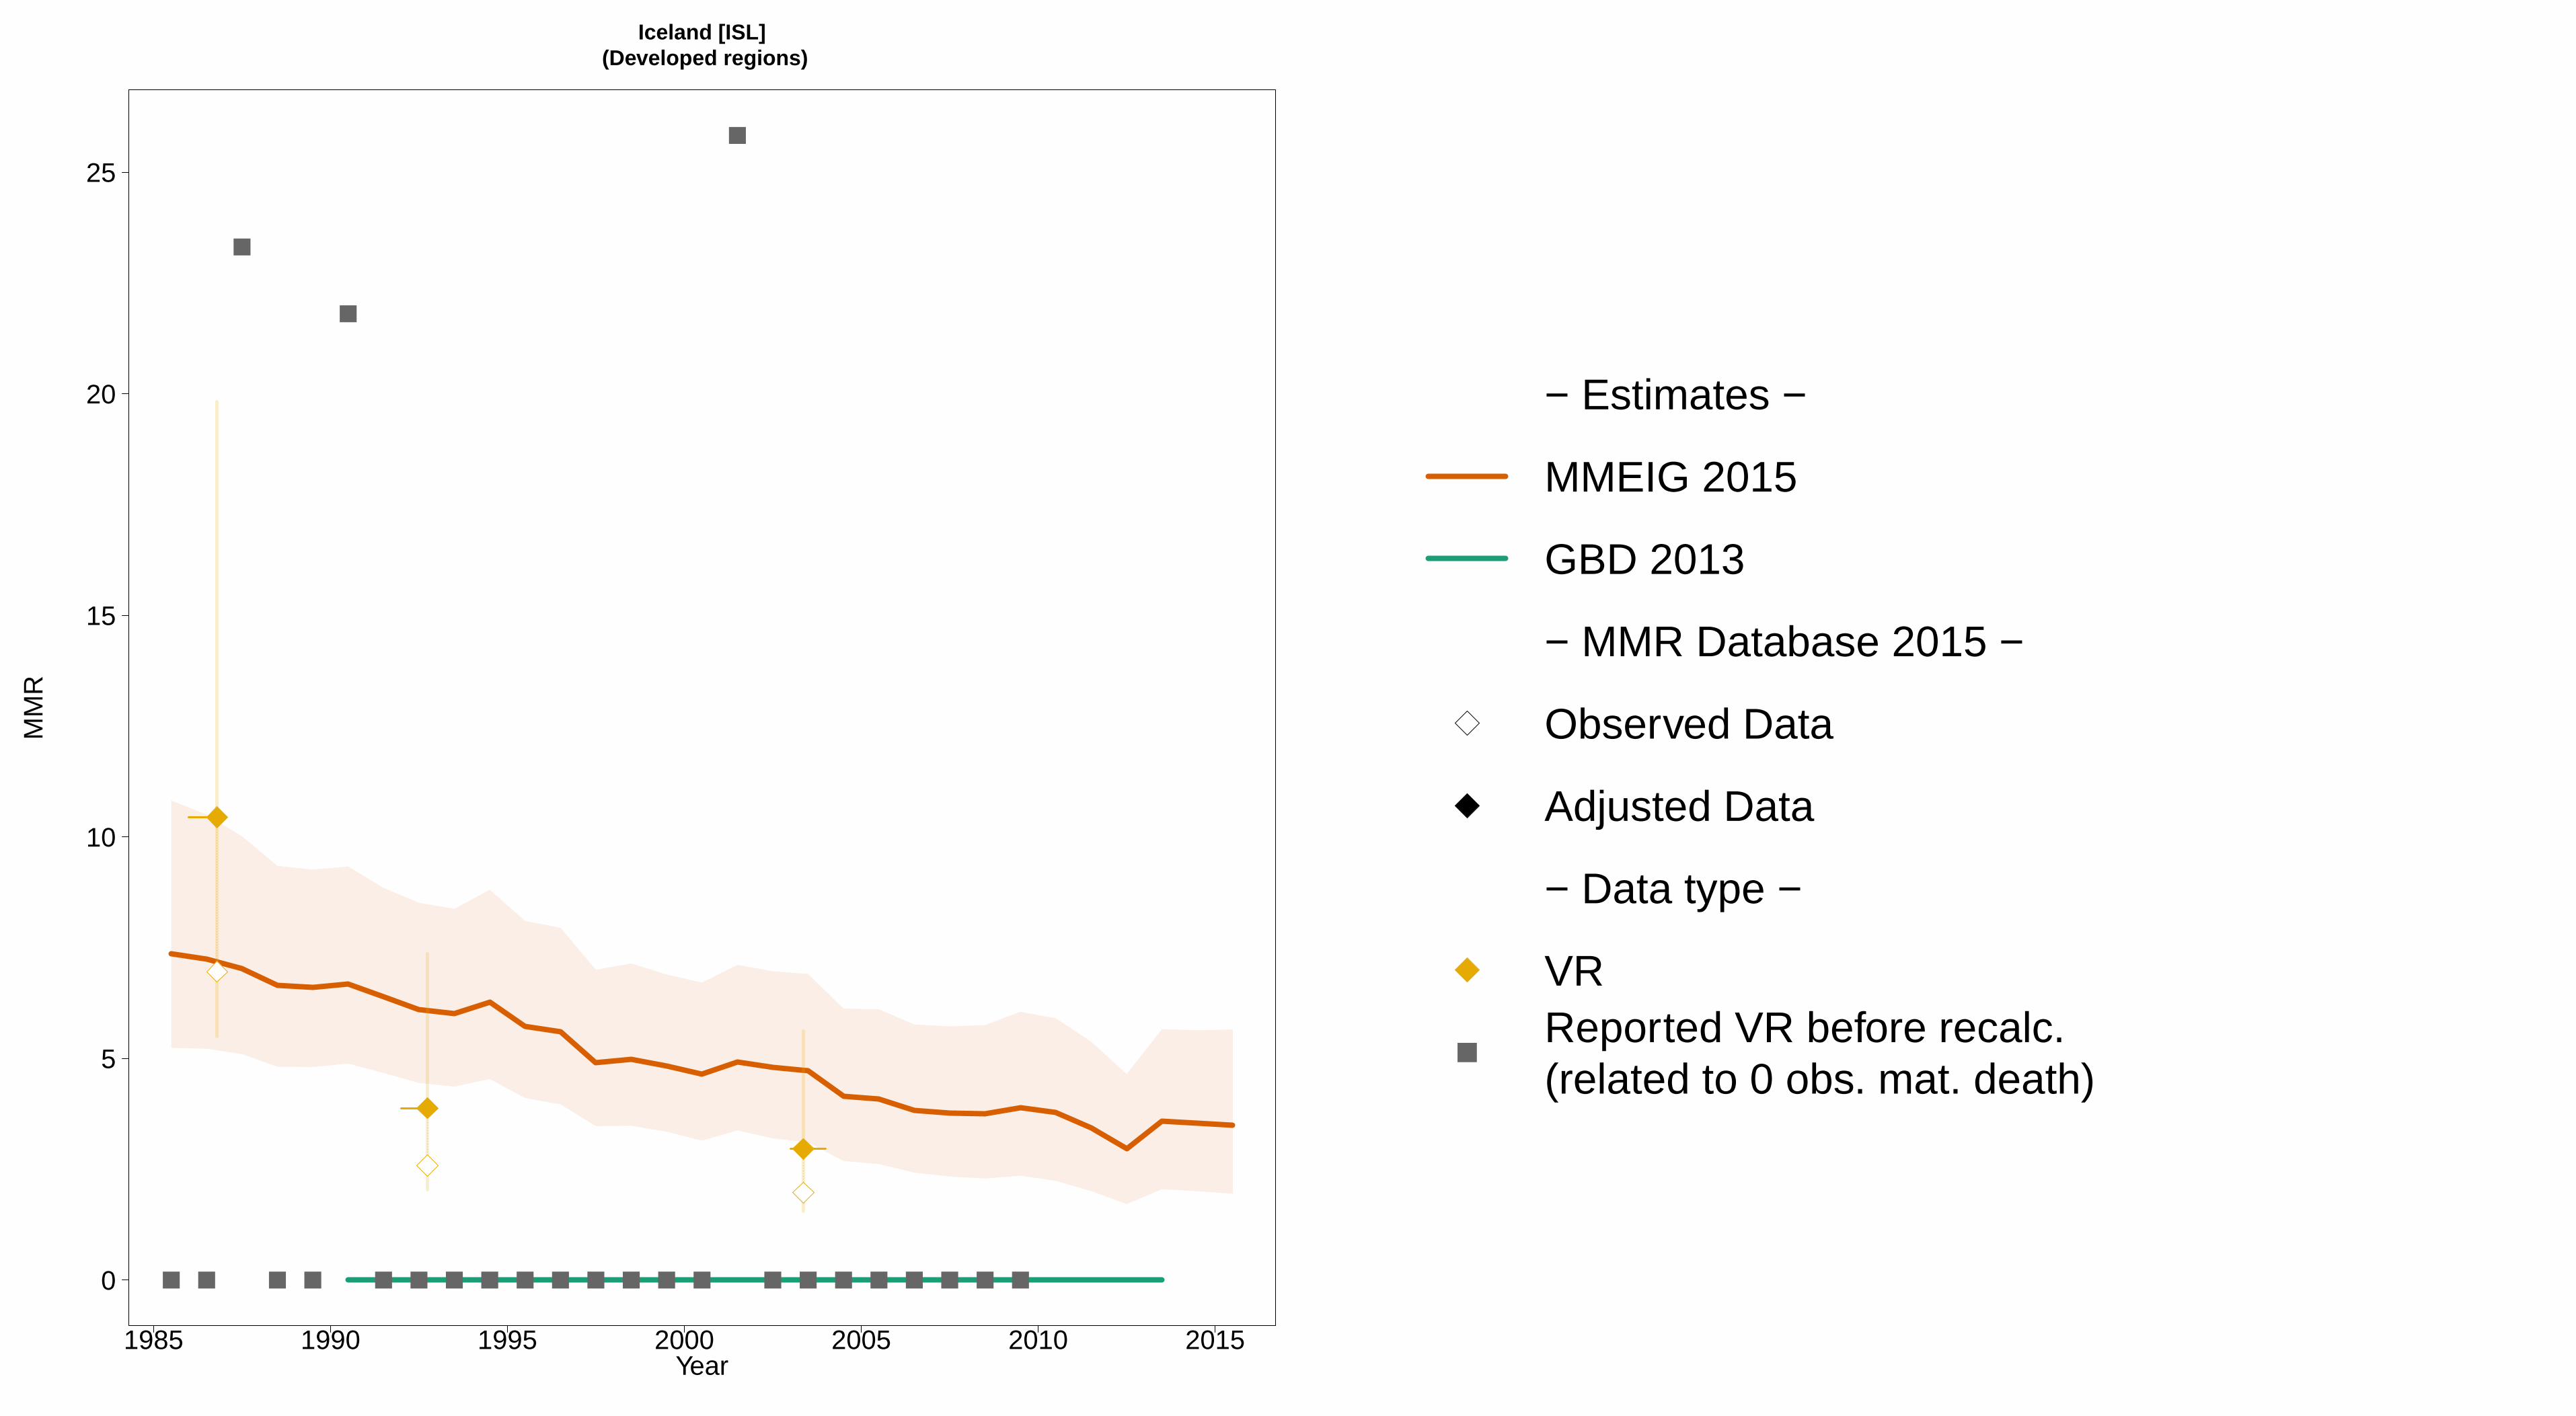
1985 1990 1995 2000 2005 2010 2015
Iceland [ISL] (Developed regions)
Year
0
5
10
15
20
25
MM
R
− Estimates −
MMEIG 2015
GBD 2013
− MMR Database 2015 −
Observed Data
Adjusted Data
− Data type −
VRReported VR before recalc.(related to 0 obs. mat. death)

1985 1990 1995 2000 2005 2010 2015
India [IND] (Southern Asia)
Year
0
100
200
300
400
500
600
700
800
900
MM
R
− Estimates −MMEIG 2015GBD 2013− MMR Database 2015 −Observed DataAdjusted Data− Data type −Misc. studies

1985 1990 1995 2000 2005 2010 2015
Indonesia [IDN] (South−Eastern Asia / Oceania)
Year
0
100
200
300
400
500
600
700
800
MM
R
− Estimates −MMEIG 2015GBD 2013− MMR Database 2015 −Observed DataAdjusted Data− Data type −DHS

1985 1990 1995 2000 2005 2010 2015
Iran [IRN] (Southern Asia)
Year
0
50
100
150
200
250
MM
R
− Estimates −MMEIG 2015GBD 2013− MMR Database 2015 −Observed DataAdjusted Data− Data type −CensusMisc. studies

1985 1990 1995 2000 2005 2010 2015
Iraq [IRQ] (Western Asia)
Year
0
50
100
150
200
250
300
MM
R
●
− Estimates −
MMEIG 2015
GBD 2013
− MMR Database 2015 −
Observed Data
Adjusted Data
− Data type −
DHS
Misc. studiesExcluded VR data (data quality issues)

1985 1990 1995 2000 2005 2010 2015
Ireland [IRL] (Developed regions)
Year
0
10
20
30
40
MM
R
− Estimates −
MMEIG 2015
GBD 2013
− MMR Database 2015 −
Observed Data
Adjusted Data
− Data type −
VR
Spec. studiesReported VR before recalc.(related to 0 obs. mat. death)Excluded VR data (overlap with specialized study)

1985 1990 1995 2000 2005 2010 2015
Israel [ISR] (Western Asia)
Year
0
5
10
15
20
25
30
MM
R
− Estimates −MMEIG 2015GBD 2013− MMR Database 2015 −Observed DataAdjusted Data− Data type −VR

1985 1990 1995 2000 2005 2010 2015
Italy [ITA] (Developed regions)
Year
0
5
10
15
20
MM
R
− Estimates −MMEIG 2015GBD 2013− MMR Database 2015 −Observed DataAdjusted Data− Data type −VR
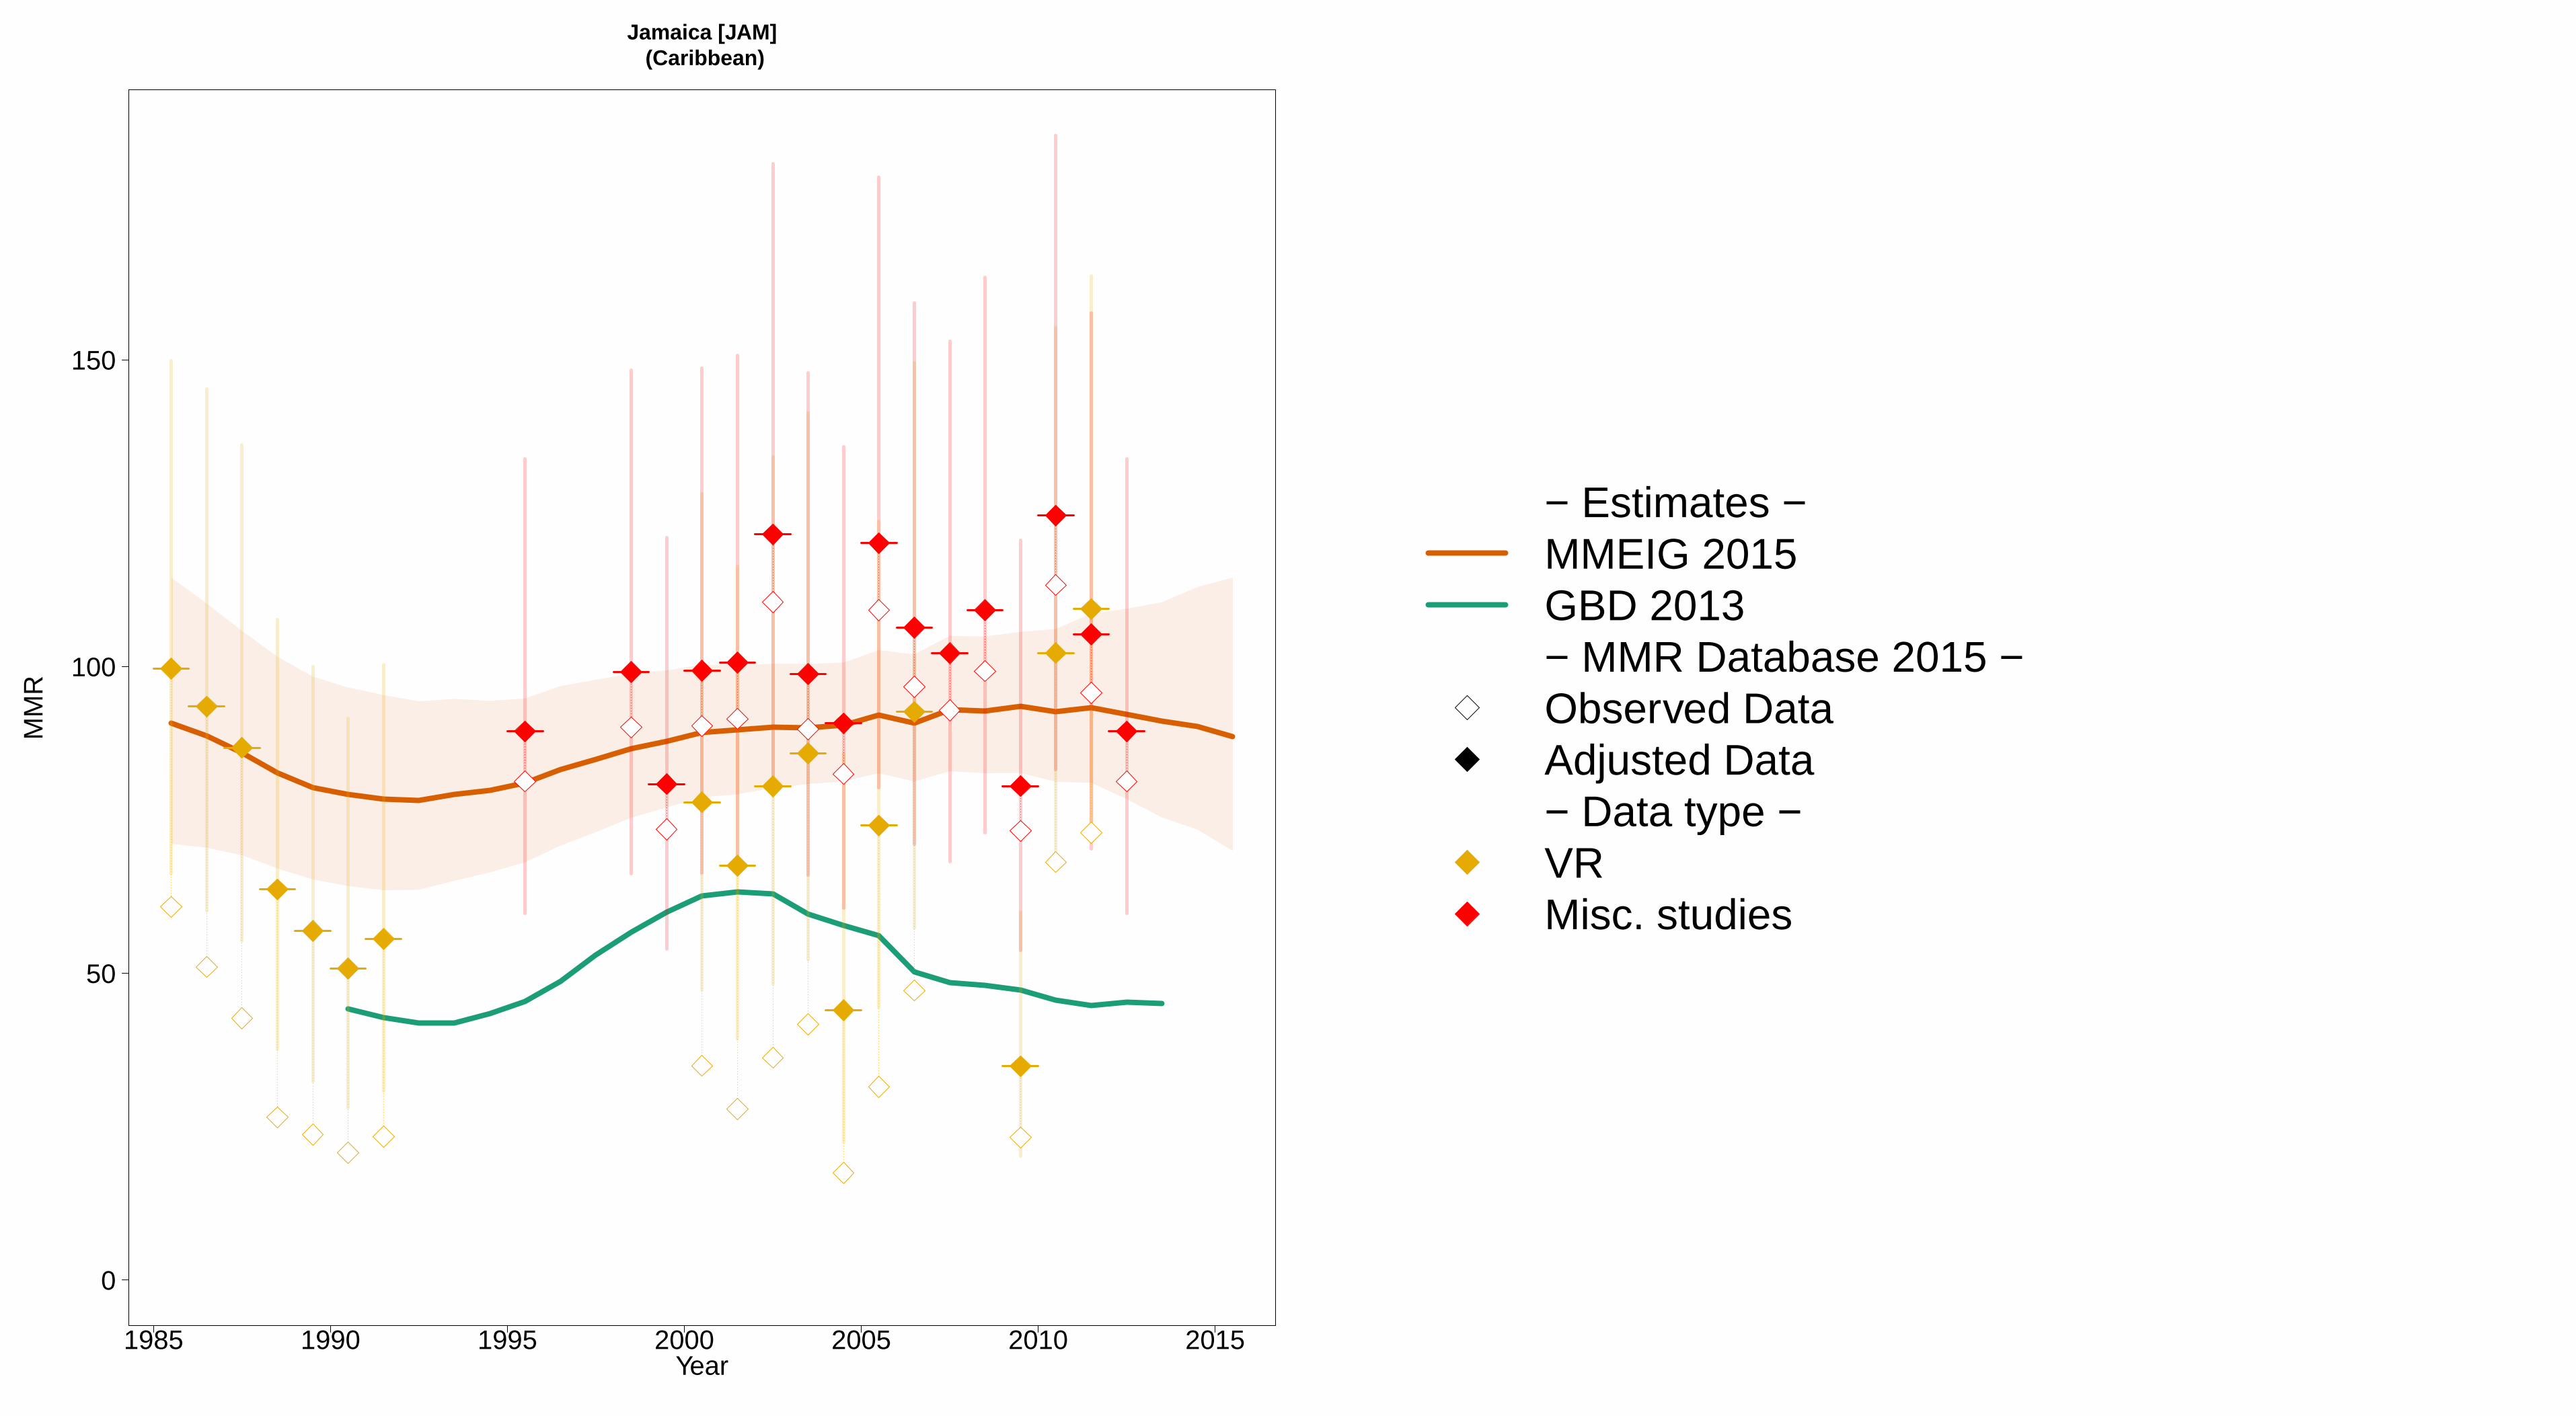
1985 1990 1995 2000 2005 2010 2015
Jamaica [JAM] (Caribbean)
Year
0
50
100
150
MM
R
− Estimates −MMEIG 2015GBD 2013− MMR Database 2015 −Observed DataAdjusted Data− Data type −VRMisc. studies

1985 1990 1995 2000 2005 2010 2015
Japan [JPN] (Developed regions)
Year
0
5
10
15
20
25
30
MM
R
− Estimates −
MMEIG 2015
GBD 2013
− MMR Database 2015 −
Observed Data
Adjusted Data
− Data type −
VR
Spec. studiesExcluded VR data (overlap with specialized study)

1985 1990 1995 2000 2005 2010 2015
Jordan [JOR] (Western Asia)
Year
0
50
100
150
200
MM
R
●
− Estimates −
MMEIG 2015
GBD 2013
− MMR Database 2015 −
Observed Data
Adjusted Data
− Data type −
VR
Spec. studiesExcluded VR data (data quality issues)

1985 1990 1995 2000 2005 2010 2015
Kazakhstan [KAZ] (Central Asia)
Year
0
50
100
MM
R
− Estimates −
MMEIG 2015
GBD 2013
− MMR Database 2015 −
Observed Data
Adjusted Data
− Data type −
VR
Spec. studiesExcluded VR data (overlap with specialized study)
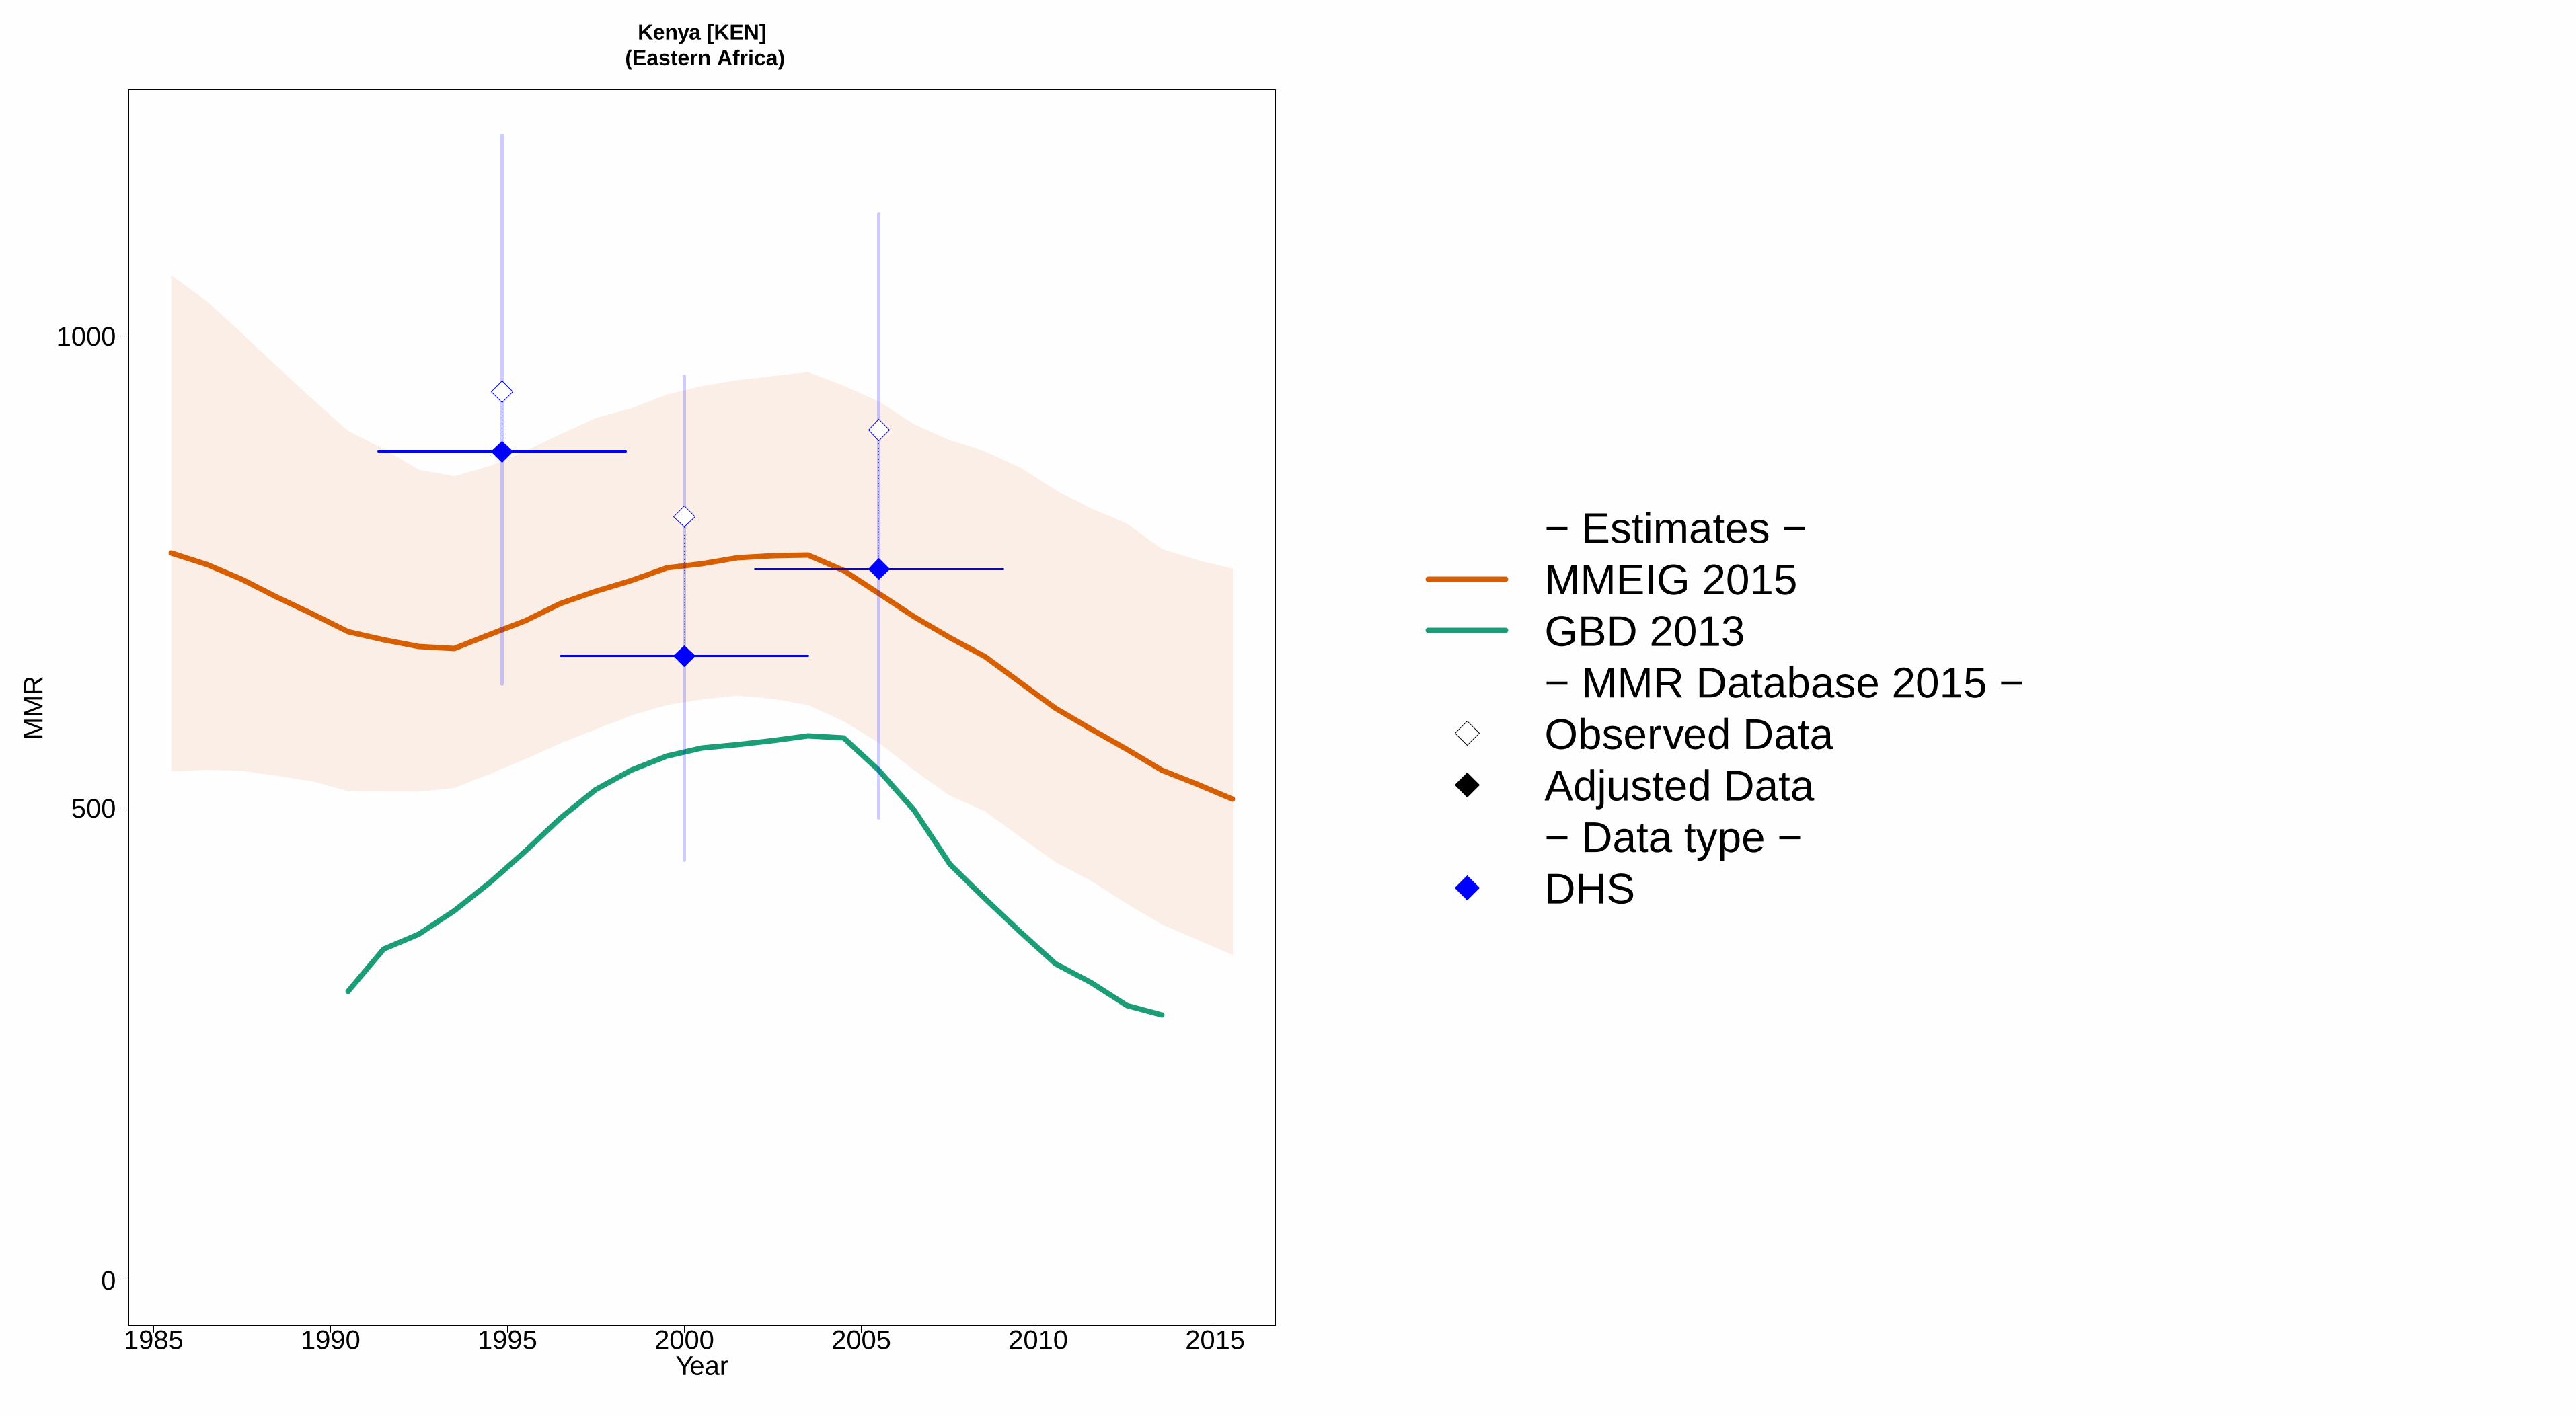
1985 1990 1995 2000 2005 2010 2015
Kenya [KEN] (Eastern Africa)
Year
0
500
1000
MM
R
− Estimates −MMEIG 2015GBD 2013− MMR Database 2015 −Observed DataAdjusted Data− Data type −DHS

1985 1990 1995 2000 2005 2010 2015
Kiribati [KIR] (South−Eastern Asia / Oceania)
Year
0
100
200
300
400
500
600
700
MM
R
●
●
●
− Estimates −
MMEIG 2015
GBD 2013
− MMR Database 2015 −
Observed Data
Adjusted Data
− Data type −
VRReported VR before recalc.(related to 0 obs. mat. death)Excluded VR data (data quality issues)

1985 1990 1995 2000 2005 2010 2015
Kuwait [KWT] (Western Asia)
Year
0
10
20
30
40
MM
R
− Estimates −
MMEIG 2015
GBD 2013
− MMR Database 2015 −
Observed Data
Adjusted Data
− Data type −
VRReported VR before recalc.(related to 0 obs. mat. death)

1985 1990 1995 2000 2005 2010 2015
Kyrgyzstan [KGZ] (Central Asia)
Year
0
50
100
150
MM
R
− Estimates −MMEIG 2015GBD 2013− MMR Database 2015 −Observed DataAdjusted Data− Data type −VR

1985 1990 1995 2000 2005 2010 2015
Lao [LAO] (South−Eastern Asia / Oceania)
Year
0
500
1000
1500
MM
R
− Estimates −MMEIG 2015GBD 2013− MMR Database 2015 −Observed DataAdjusted Data− Data type −DHSCensus

1985 1990 1995 2000 2005 2010 2015
Latvia [LVA] (Developed regions)
Year
0
50
100
MM
R
− Estimates −
MMEIG 2015
GBD 2013
− MMR Database 2015 −
Observed Data
Adjusted Data
− Data type −
VRReported VR before recalc.(related to 0 obs. mat. death)

1985 1990 1995 2000 2005 2010 2015
Lebanon [LBN] (Western Asia)
Year
0
50
100
MM
R
− Estimates −MMEIG 2015GBD 2013− MMR Database 2015 −Observed DataAdjusted Data− Data type −Spec. studies

1985 1990 1995 2000 2005 2010 2015
Lesotho [LSO] (Southern Africa)
Year
0
500
1000
1500
MM
R
− Estimates −MMEIG 2015GBD 2013− MMR Database 2015 −Observed DataAdjusted Data− Data type −DHSCensus
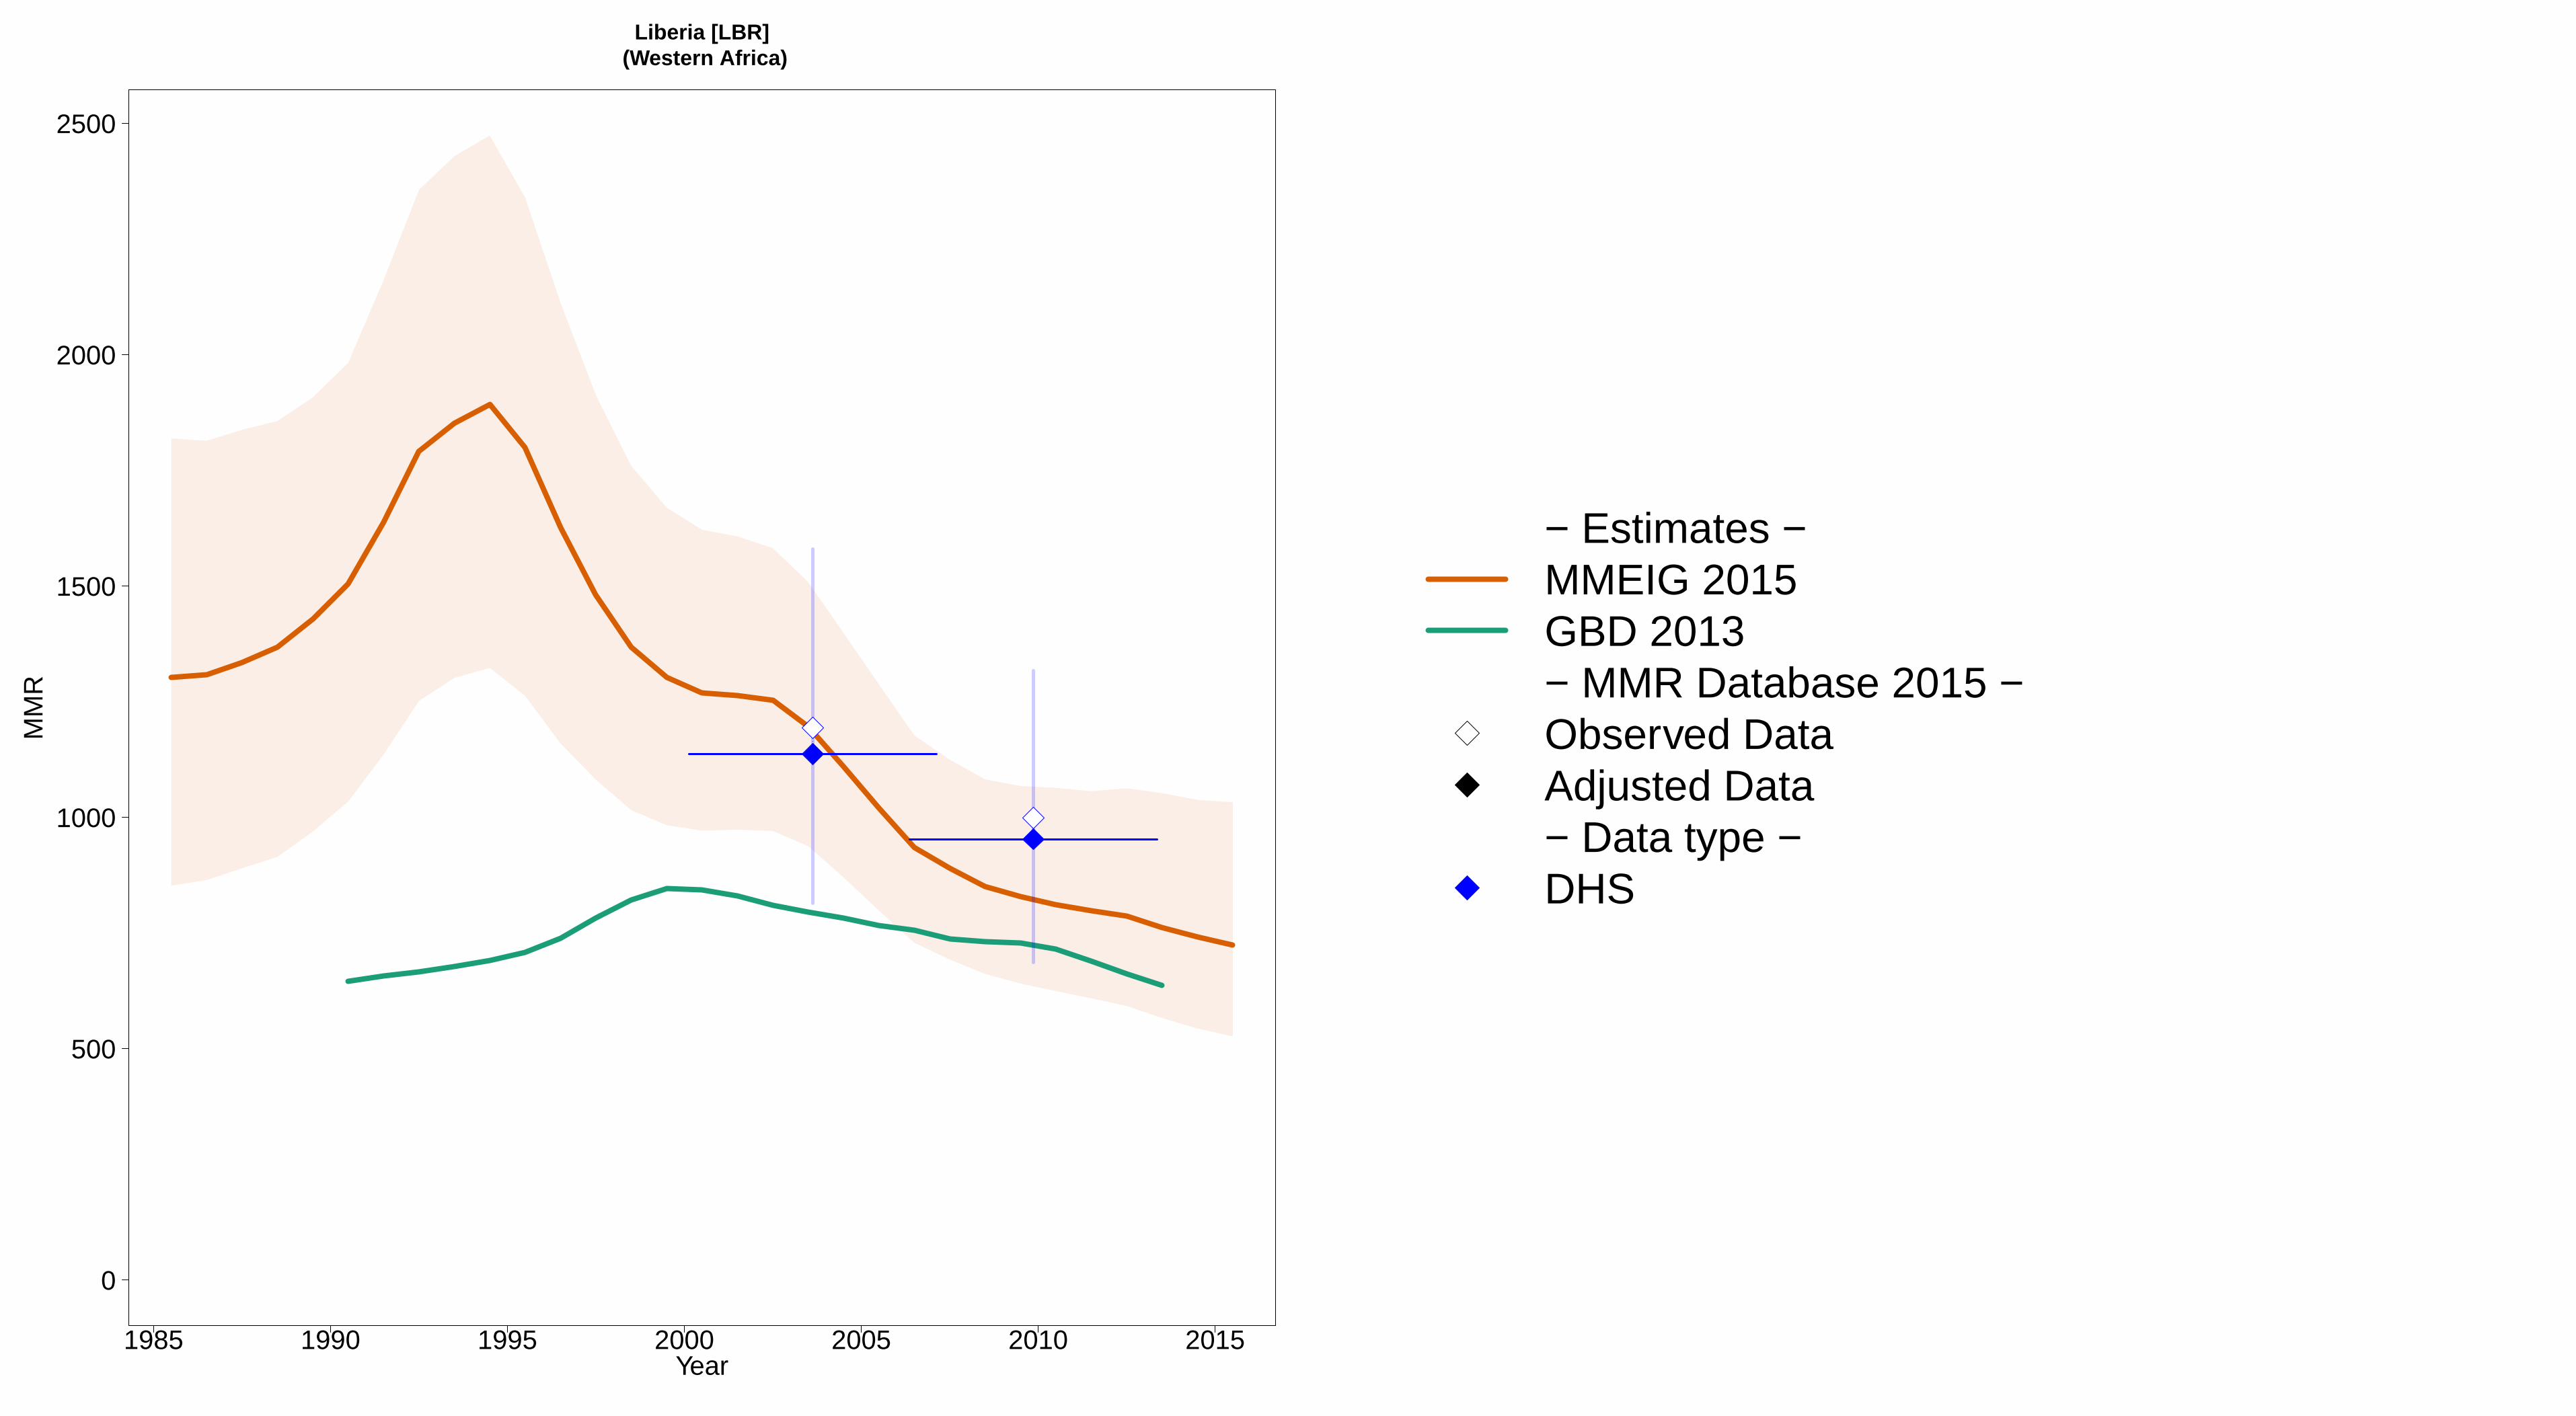
1985 1990 1995 2000 2005 2010 2015
Liberia [LBR] (Western Africa)
Year
0
500
1000
1500
2000
2500
MM
R
− Estimates −MMEIG 2015GBD 2013− MMR Database 2015 −Observed DataAdjusted Data− Data type −DHS

1985 1990 1995 2000 2005 2010 2015
Libya [LBY] (Northern Africa)
Year
0
50
100
MM
R
− Estimates −MMEIG 2015GBD 2013− MMR Database 2015 −Observed DataAdjusted Data− Data type −Misc. studies

1985 1990 1995 2000 2005 2010 2015
Lithuania [LTU] (Developed regions)
Year
0
10
20
30
40
50
60
70
MM
R
− Estimates −
MMEIG 2015
GBD 2013
− MMR Database 2015 −
Observed Data
Adjusted Data
− Data type −
VRReported VR before recalc.(related to 0 obs. mat. death)

1985 1990 1995 2000 2005 2010 2015
Luxembourg [LUX] (Developed regions)
Year
0
10
20
30
40
50
60
70
80
90
MM
R
− Estimates −
MMEIG 2015
GBD 2013
− MMR Database 2015 −
Observed Data
Adjusted Data
− Data type −
VRReported VR before recalc.(related to 0 obs. mat. death)

1985 1990 1995 2000 2005 2010 2015
Madagascar [MDG] (Eastern Africa)
Year
0
500
1000
MM
R
− Estimates −MMEIG 2015GBD 2013− MMR Database 2015 −Observed DataAdjusted Data− Data type −DHS
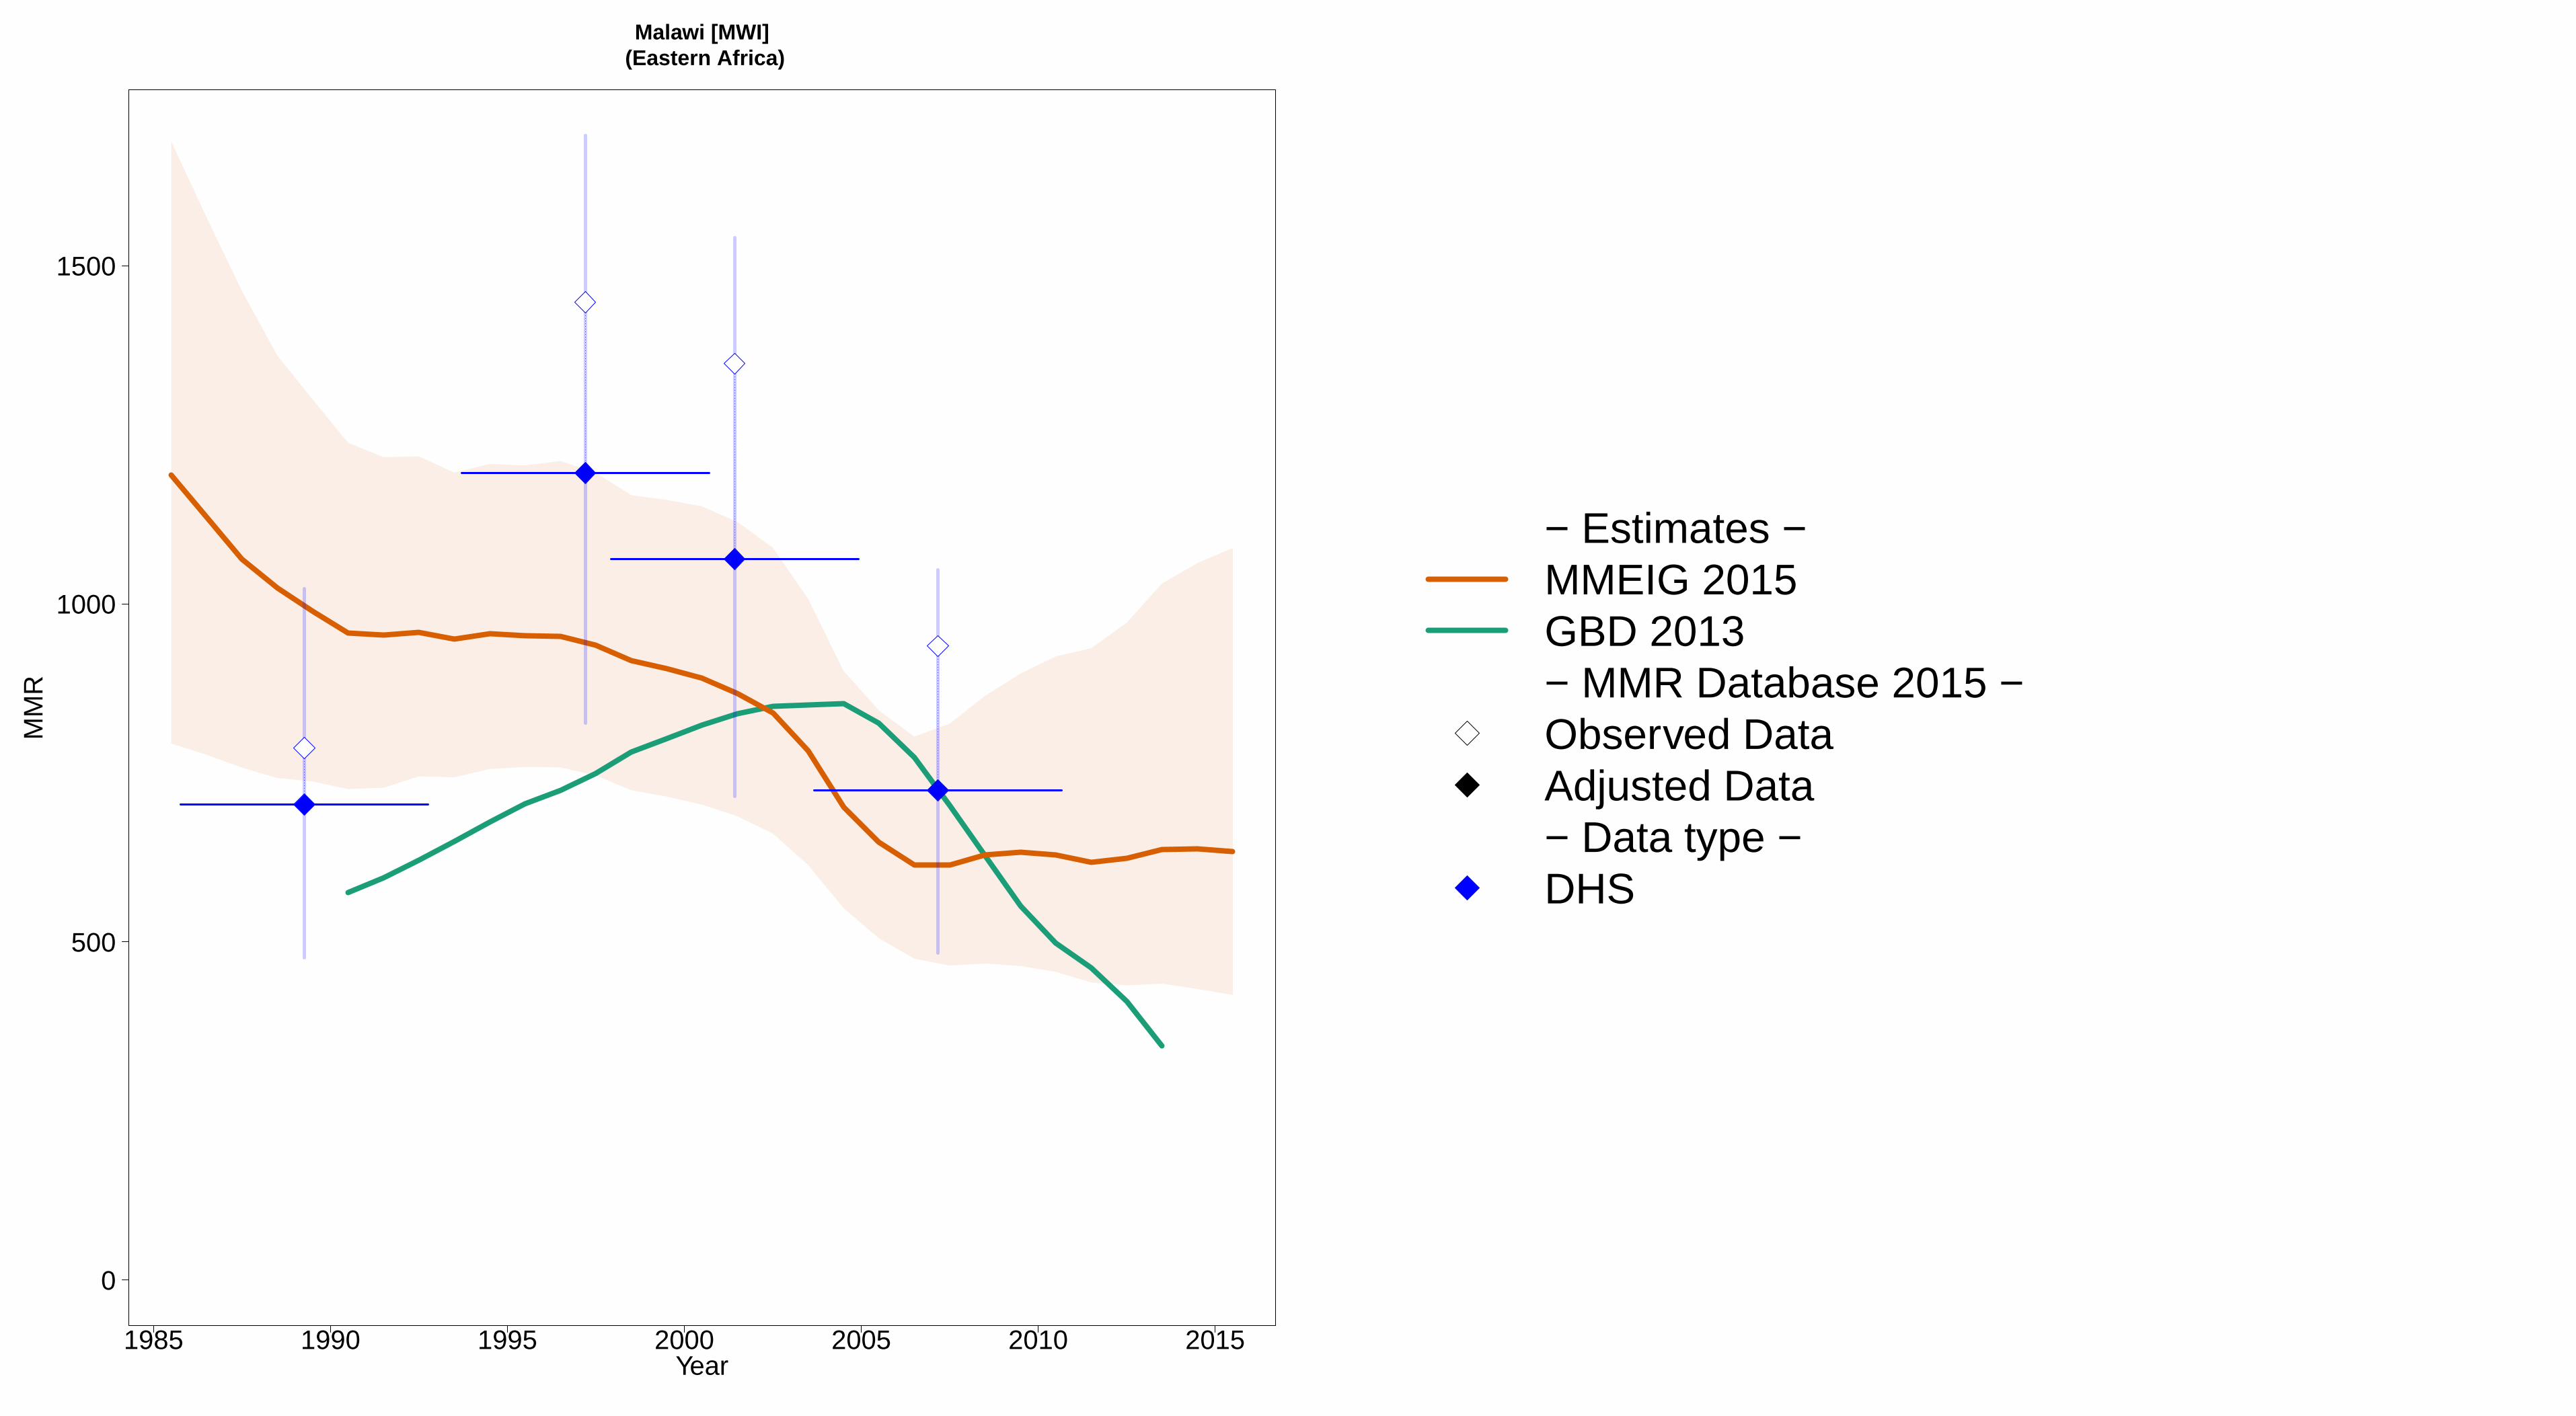
1985 1990 1995 2000 2005 2010 2015
Malawi [MWI] (Eastern Africa)
Year
0
500
1000
1500
MM
R
− Estimates −MMEIG 2015GBD 2013− MMR Database 2015 −Observed DataAdjusted Data− Data type −DHS
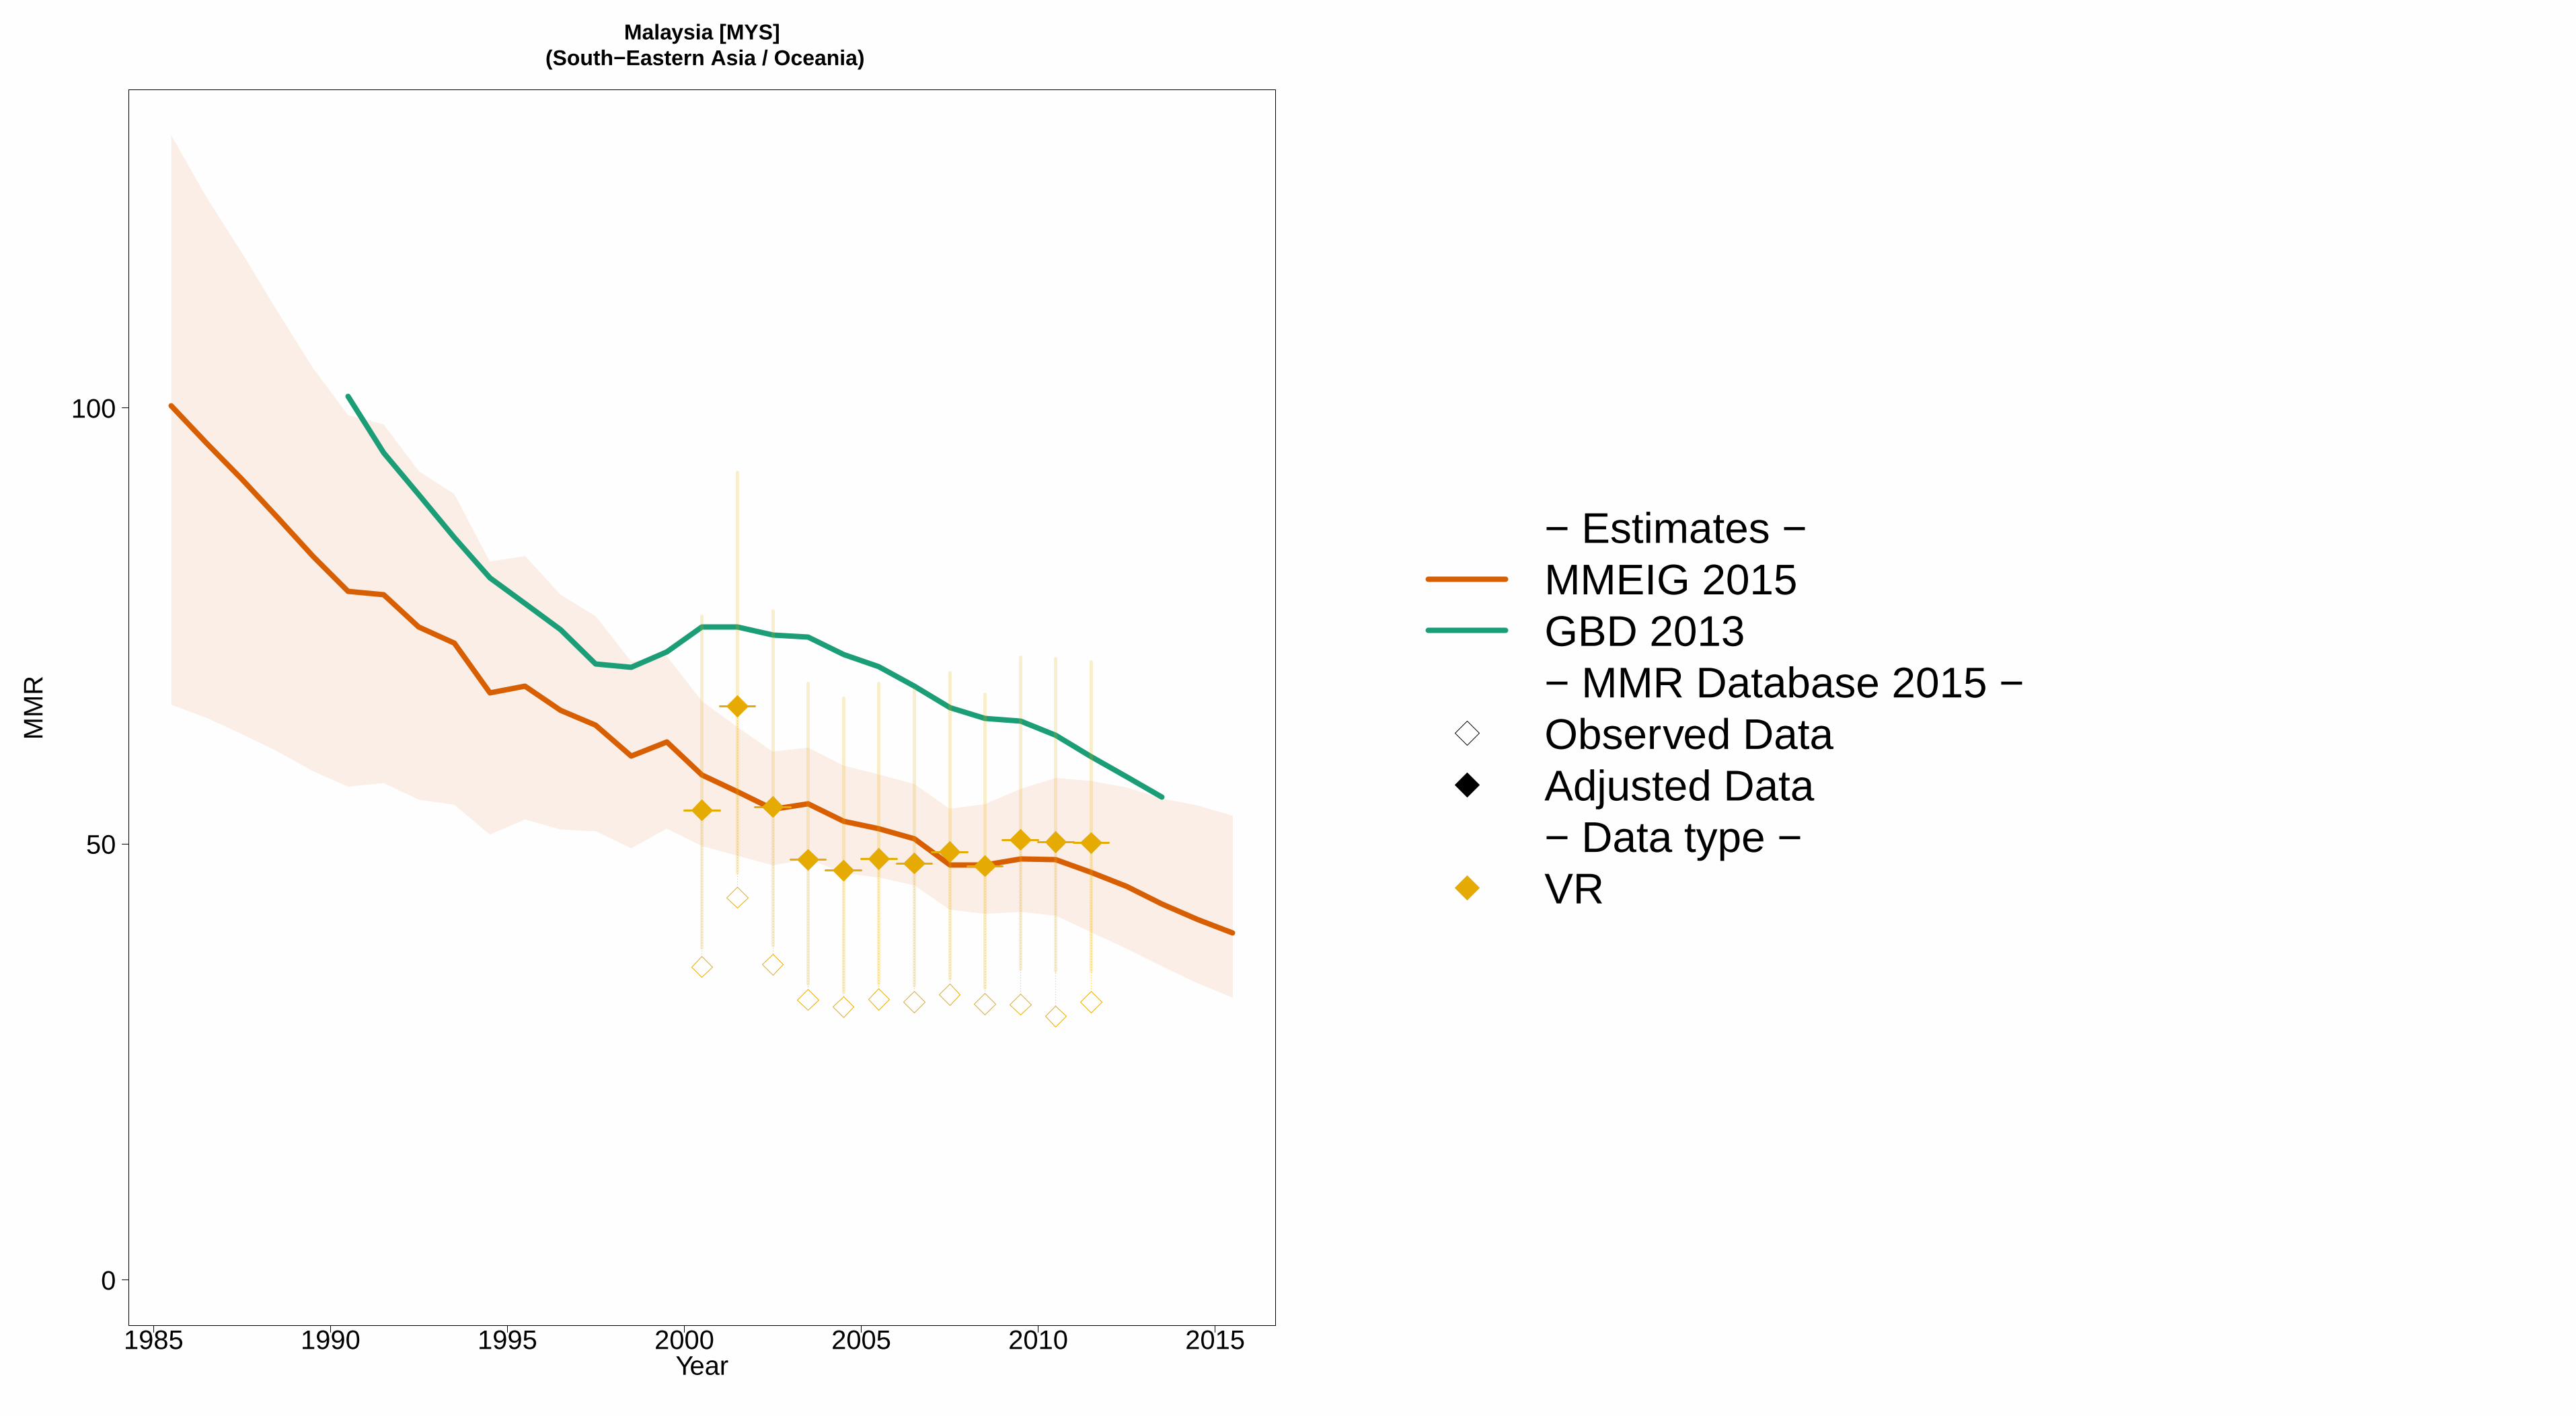
1985 1990 1995 2000 2005 2010 2015
Malaysia [MYS] (South−Eastern Asia / Oceania)
Year
0
50
100
MM
R
− Estimates −MMEIG 2015GBD 2013− MMR Database 2015 −Observed DataAdjusted Data− Data type −VR

1985 1990 1995 2000 2005 2010 2015
Maldives [MDV] (Southern Asia)
Year
0
500
1000
1500
MM
R
− Estimates −
MMEIG 2015
GBD 2013
− MMR Database 2015 −
Observed Data
Adjusted Data
− Data type −
VRReported VR before recalc.(related to 0 obs. mat. death)

1985 1990 1995 2000 2005 2010 2015
Mali [MLI] (Western Africa)
Year
0
500
1000
1500
MM
R
− Estimates −MMEIG 2015GBD 2013− MMR Database 2015 −Observed DataAdjusted Data− Data type −DHSCensus

1985 1990 1995 2000 2005 2010 2015
Malta [MLT] (Developed regions)
Year
0
10
20
30
40
50
60
70
80
90
100
MM
R
− Estimates −
MMEIG 2015
GBD 2013
− MMR Database 2015 −
Observed Data
Adjusted Data
− Data type −
VRReported VR before recalc.(related to 0 obs. mat. death)

1985 1990 1995 2000 2005 2010 2015
Mauritania [MRT] (Western Africa)
Year
0
500
1000
1500
MM
R
− Estimates −MMEIG 2015GBD 2013− MMR Database 2015 −Observed DataAdjusted Data− Data type −DHSMisc. studies

1985 1990 1995 2000 2005 2010 2015
Mauritius [MUS] (Eastern Africa)
Year
0
50
100
150
200
250
MM
R
− Estimates −MMEIG 2015GBD 2013− MMR Database 2015 −Observed DataAdjusted Data− Data type −VR

1985 1990 1995 2000 2005 2010 2015
Mexico [MEX] (Central America)
Year
0
50
100
150
MM
R
− Estimates −
MMEIG 2015
GBD 2013
− MMR Database 2015 −
Observed Data
Adjusted Data
− Data type −
VR
Spec. studiesExcluded VR data (overlap with specialized study)

1985 1990 1995 2000 2005 2010 2015
Micronesia [FSM] (South−Eastern Asia / Oceania)
Year
0
50
100
150
200
250
300
350
MM
R
− Estimates −MMEIG 2015GBD 2013− MMR Database 2015 −

1985 1990 1995 2000 2005 2010 2015
Mongolia [MNG] (Eastern Asia)
Year
0
100
200
300
400
MM
R
●
− Estimates −
MMEIG 2015
GBD 2013
− MMR Database 2015 −
Observed Data
Adjusted Data
− Data type −
Misc. studiesExcluded VR data (data quality issues)

1985 1990 1995 2000 2005 2010 2015
Montenegro [MNE] (Transition countries of South−Eastern Europe)
Year
0
5
10
15
20
MM
R
− Estimates −
MMEIG 2015
GBD 2013
− MMR Database 2015 −
Observed Data
Adjusted Data
− Data type −
VRReported VR before recalc.(related to 0 obs. mat. death)

1985 1990 1995 2000 2005 2010 2015
Morocco [MAR] (Northern Africa)
Year
0
100
200
300
400
500
MM
R
●
●
●
● ●
− Estimates −
MMEIG 2015
GBD 2013
− MMR Database 2015 −
Observed Data
Adjusted Data
− Data type −
Spec. studies
DHS
Misc. studiesExcluded VR data (data quality issues)

1985 1990 1995 2000 2005 2010 2015
Mozambique [MOZ] (Eastern Africa)
Year
0
500
1000
1500
2000
MM
R
− Estimates −MMEIG 2015GBD 2013− MMR Database 2015 −Observed DataAdjusted Data− Data type −DHSCensus

1985 1990 1995 2000 2005 2010 2015
Myanmar [MMR] (South−Eastern Asia / Oceania)
Year
0
100
200
300
400
500
600
700
800
MM
R
− Estimates −MMEIG 2015GBD 2013− MMR Database 2015 −Observed DataAdjusted Data− Data type −Misc. studies

1985 1990 1995 2000 2005 2010 2015
Namibia [NAM] (Southern Africa)
Year
0
100
200
300
400
500
600
700
800
MM
R
− Estimates −MMEIG 2015GBD 2013− MMR Database 2015 −Observed DataAdjusted Data− Data type −DHSCensus

1985 1990 1995 2000 2005 2010 2015
Nepal [NPL] (Southern Asia)
Year
0
500
1000
1500
MM
R
− Estimates −MMEIG 2015GBD 2013− MMR Database 2015 −Observed DataAdjusted Data− Data type −DHSCensusExcluded misc. studies

1985 1990 1995 2000 2005 2010 2015
Netherlands [NLD] (Developed regions)
Year
0
5
10
15
20
25
MM
R
− Estimates −
MMEIG 2015
GBD 2013
− MMR Database 2015 −
Observed Data
Adjusted Data
− Data type −
VR
Spec. studiesExcluded VR data (overlap with specialized study)

1985 1990 1995 2000 2005 2010 2015
New Zealand [NZL] (Developed regions)
Year
0
10
20
30
40
50
MM
R
− Estimates −
MMEIG 2015
GBD 2013
− MMR Database 2015 −
Observed Data
Adjusted Data
− Data type −
VR
Spec. studiesExcluded VR data (overlap with specialized study)

1985 1990 1995 2000 2005 2010 2015
Nicaragua [NIC] (Central America)
Year
0
50
100
150
200
250
300
MM
R
− Estimates −MMEIG 2015GBD 2013− MMR Database 2015 −Observed DataAdjusted Data− Data type −VRCensus

1985 1990 1995 2000 2005 2010 2015
Niger [NER] (Western Africa)
Year
0
500
1000
MM
R
− Estimates −MMEIG 2015GBD 2013− MMR Database 2015 −Observed DataAdjusted Data− Data type −DHS

1985 1990 1995 2000 2005 2010 2015
Nigeria [NGA] (Western Africa)
Year
0
500
1000
1500
2000
MM
R
− Estimates −MMEIG 2015GBD 2013− MMR Database 2015 −Observed DataAdjusted Data− Data type −DHS

1985 1990 1995 2000 2005 2010 2015
Norway [NOR] (Developed regions)
Year
0
5
10
15
20
25
MM
R
− Estimates −
MMEIG 2015
GBD 2013
− MMR Database 2015 −
Observed Data
Adjusted Data
− Data type −
VR
Spec. studiesReported VR before recalc.(related to 0 obs. mat. death)Excluded VR data (overlap with specialized study)

1985 1990 1995 2000 2005 2010 2015
Occupied Palestinian Territory [PSE] (Western Asia)
Year
0
50
100
150
200
250
MM
R
− Estimates −MMEIG 2015GBD 2013− MMR Database 2015 −

1985 1990 1995 2000 2005 2010 2015
Oman [OMN] (Western Asia)
Year
0
10
20
30
40
50
60
70
MM
R
●
●
− Estimates −
MMEIG 2015
GBD 2013
− MMR Database 2015 −
Observed Data
Adjusted Data
− Data type −
Misc. studiesExcluded VR data (data quality issues)

1985 1990 1995 2000 2005 2010 2015
Pakistan [PAK] (Southern Asia)
Year
0
100
200
300
400
500
600
700
800
MM
R
− Estimates −MMEIG 2015GBD 2013− MMR Database 2015 −Observed DataAdjusted Data− Data type −DHS

1985 1990 1995 2000 2005 2010 2015
Panama [PAN] (Central America)
Year
0
50
100
150
200
MM
R
− Estimates −MMEIG 2015GBD 2013− MMR Database 2015 −Observed DataAdjusted Data− Data type −VR

1985 1990 1995 2000 2005 2010 2015
Papua New Guinea [PNG] (South−Eastern Asia / Oceania)
Year
0
500
1000
MM
R
− Estimates −MMEIG 2015GBD 2013− MMR Database 2015 −

1985 1990 1995 2000 2005 2010 2015
Paraguay [PRY] (South America)
Year
0
50
100
150
200
250
300
MM
R
− Estimates −MMEIG 2015GBD 2013− MMR Database 2015 −Observed DataAdjusted Data− Data type −VRDHSCensusMisc. studiesExcluded misc. studies

1985 1990 1995 2000 2005 2010 2015
Peru [PER] (South America)
Year
0
100
200
300
400
MM
R
● ●
●●
●● ● ●
●●
●● ● ●
− Estimates −
MMEIG 2015
GBD 2013
− MMR Database 2015 −
Observed Data
Adjusted Data
− Data type −
VR
DHS
Misc. studiesExcluded VR data (data quality issues)
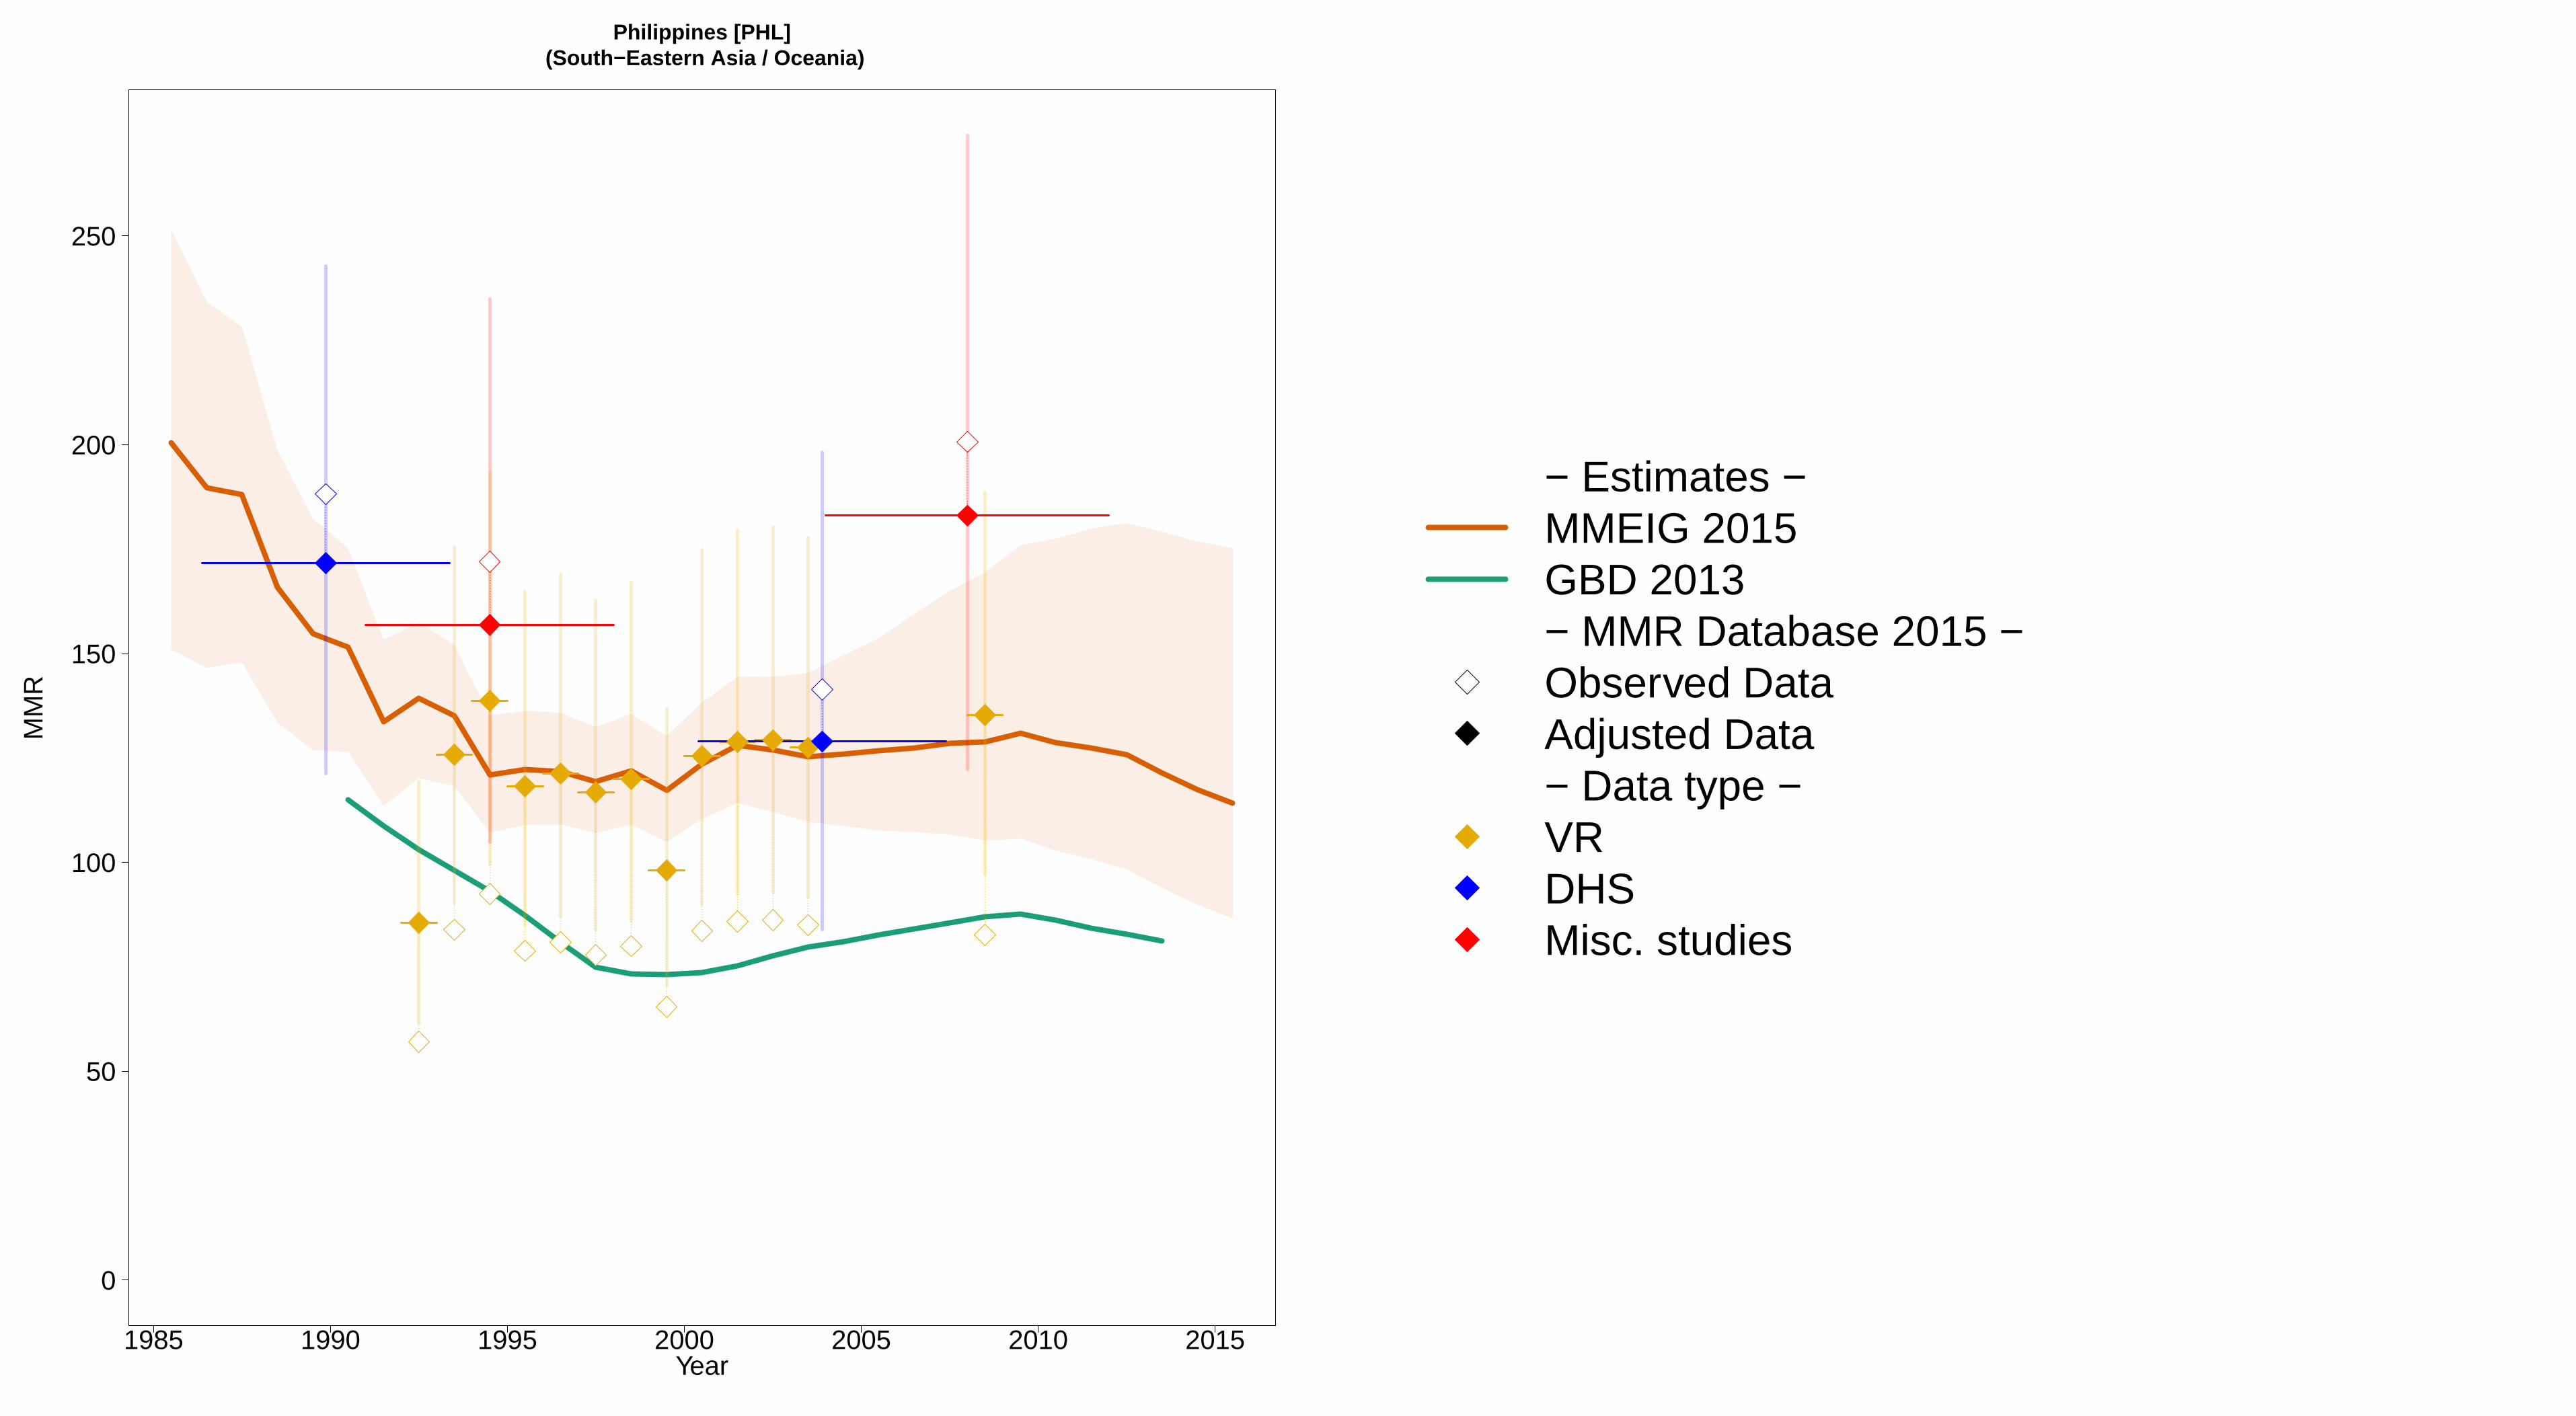
1985 1990 1995 2000 2005 2010 2015
Philippines [PHL] (South−Eastern Asia / Oceania)
Year
0
50
100
150
200
250
MM
R
− Estimates −MMEIG 2015GBD 2013− MMR Database 2015 −Observed DataAdjusted Data− Data type −VRDHSMisc. studies
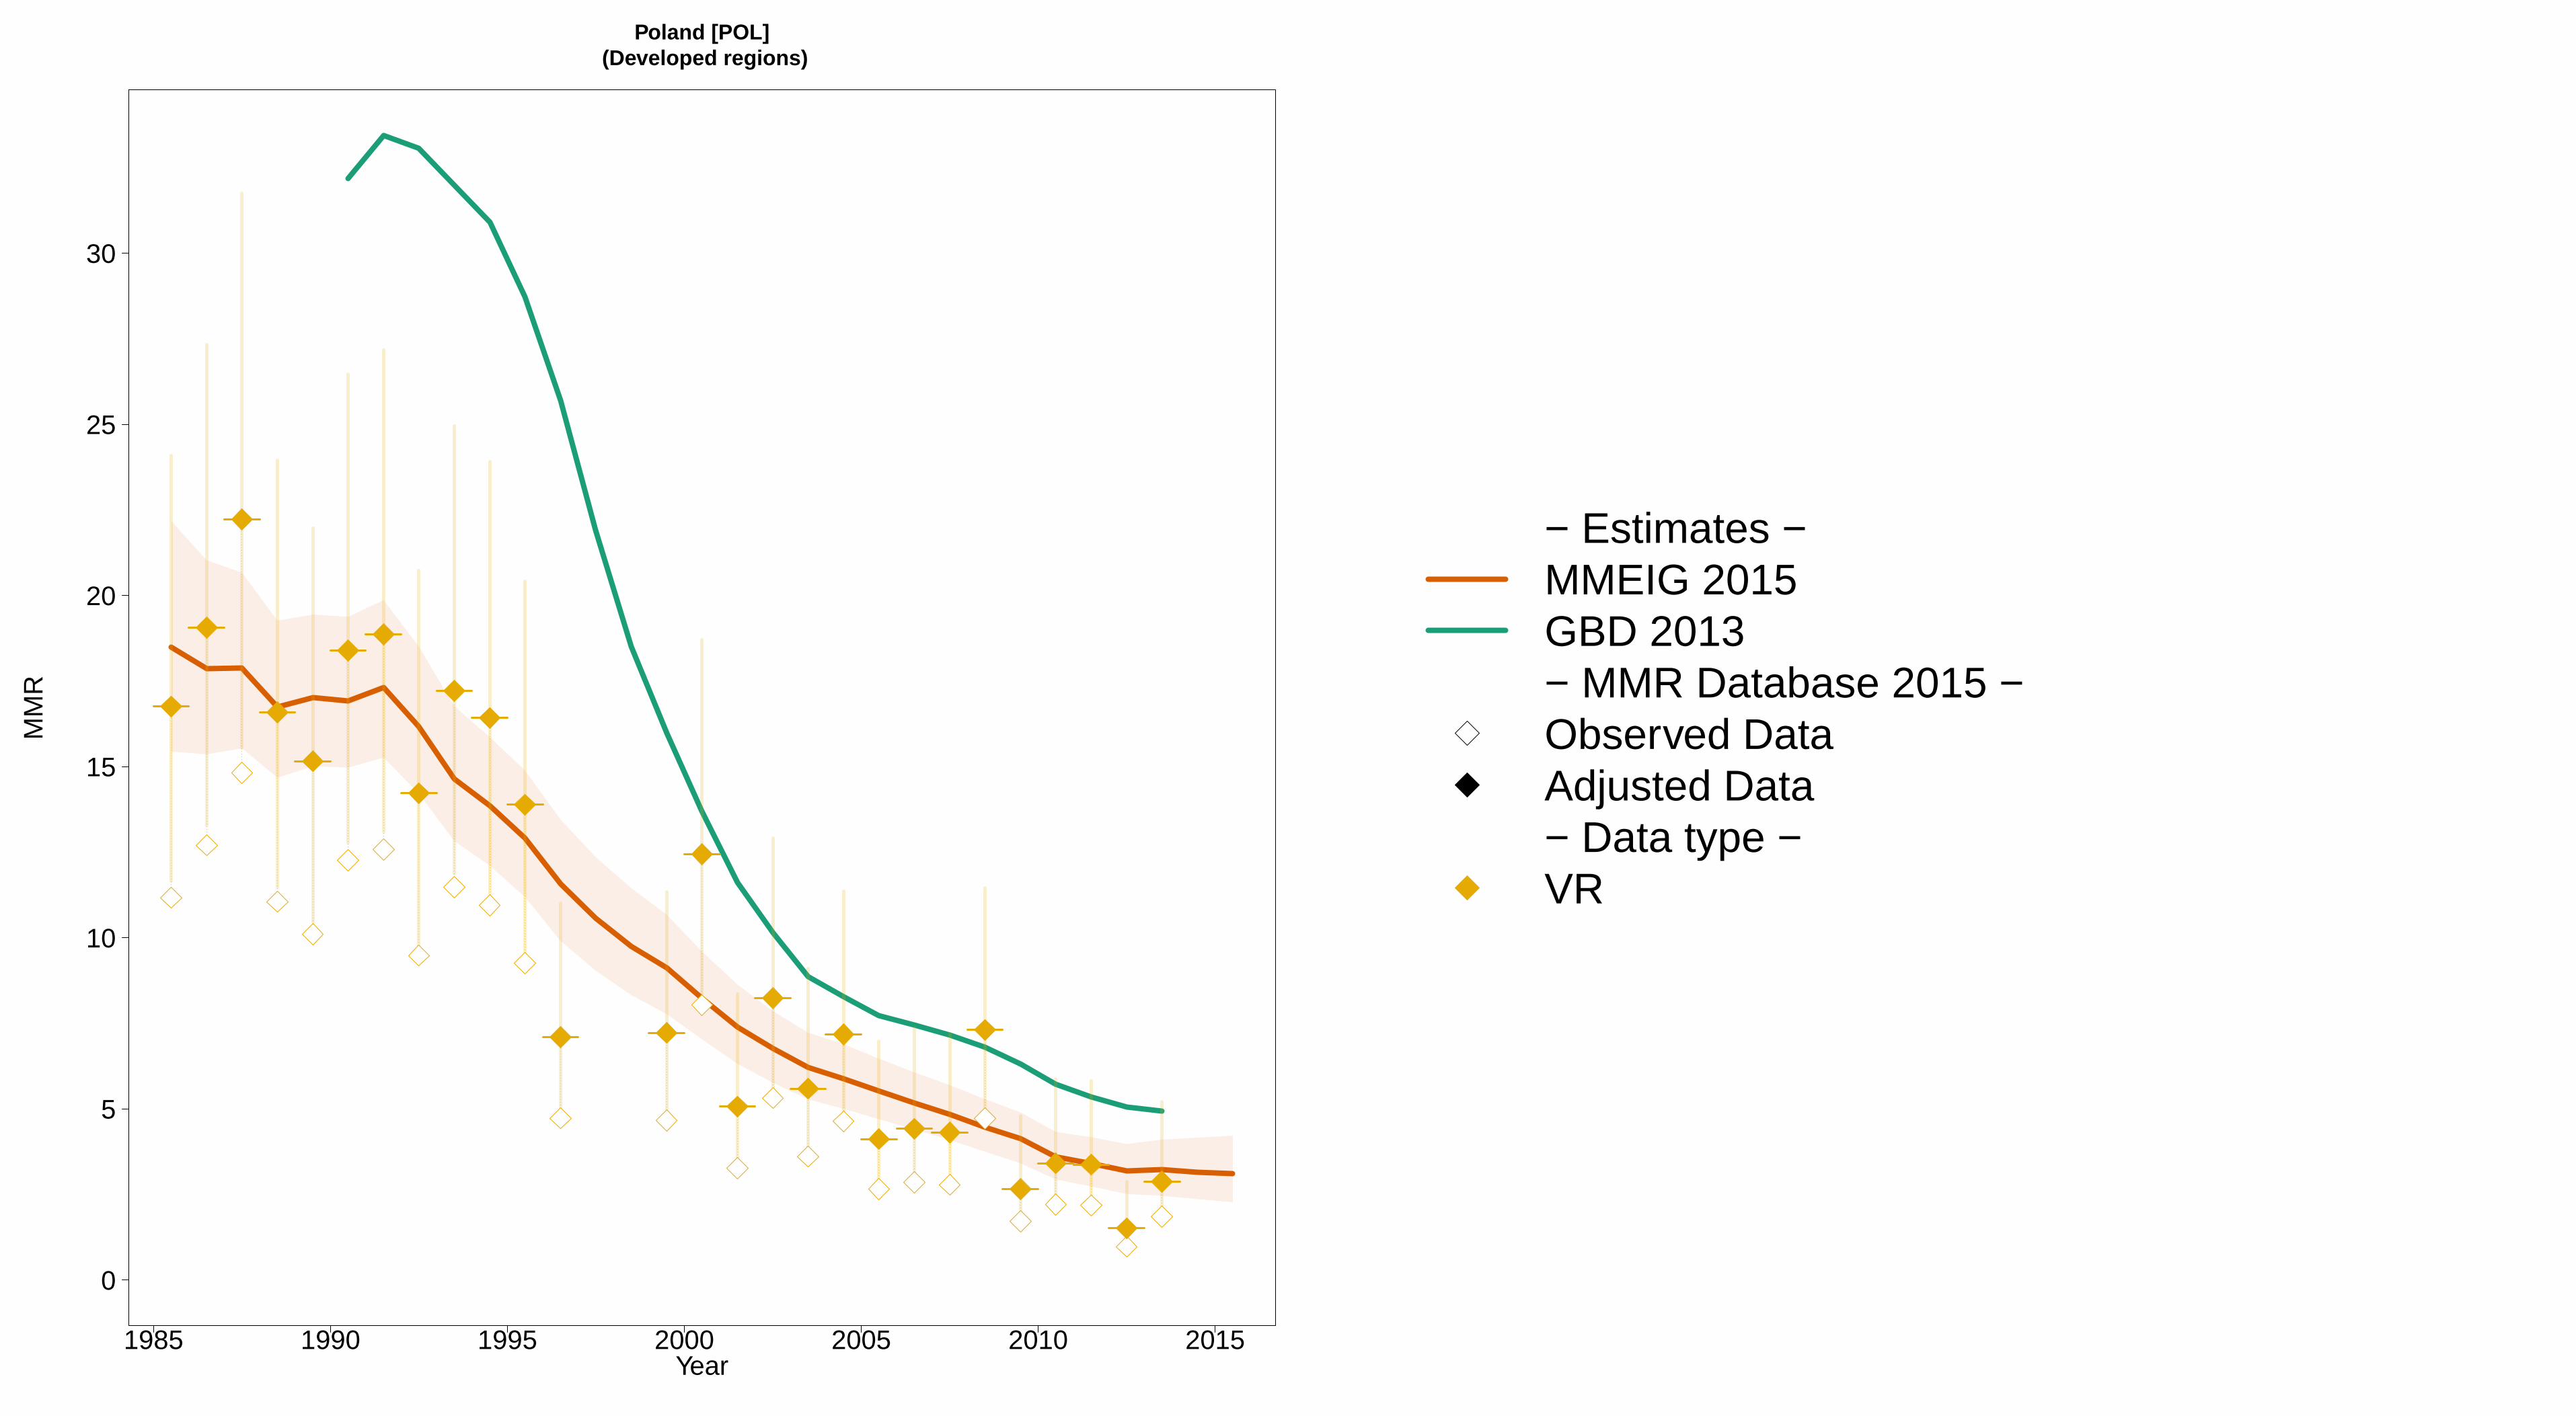
1985 1990 1995 2000 2005 2010 2015
Poland [POL] (Developed regions)
Year
0
5
10
15
20
25
30
MM
R
− Estimates −MMEIG 2015GBD 2013− MMR Database 2015 −Observed DataAdjusted Data− Data type −VR
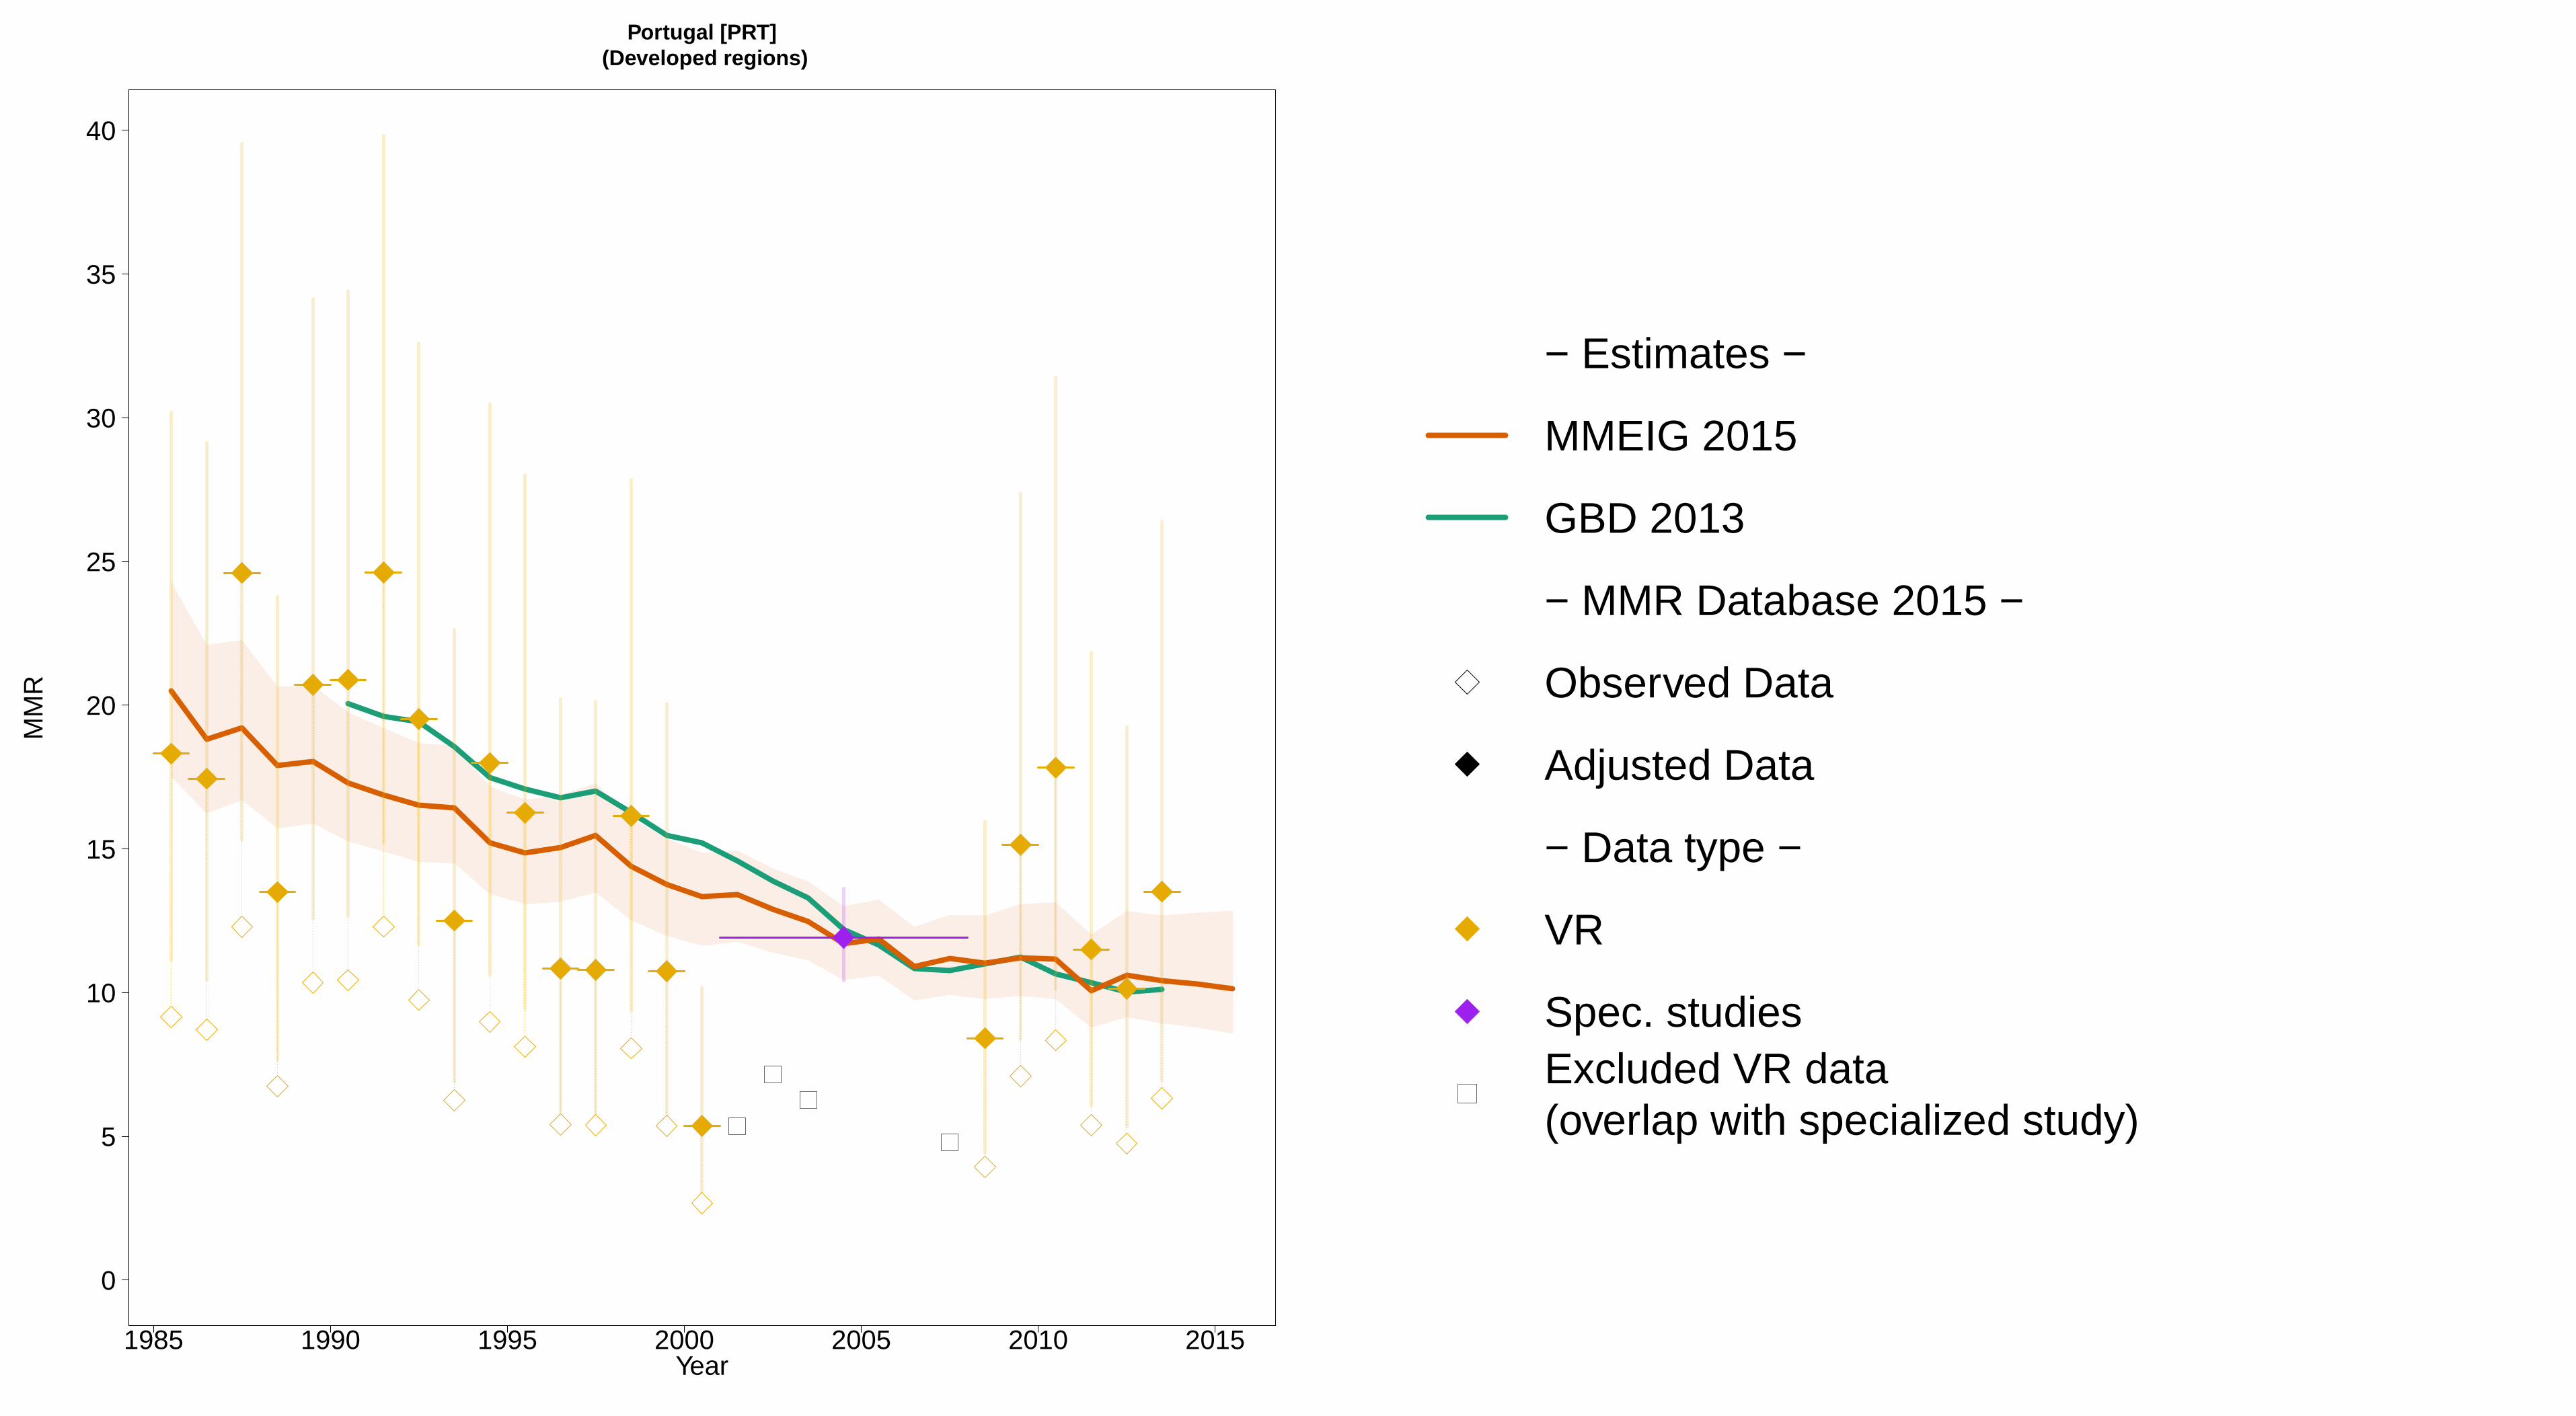
1985 1990 1995 2000 2005 2010 2015
Portugal [PRT] (Developed regions)
Year
0
5
10
15
20
25
30
35
40
MM
R
− Estimates −
MMEIG 2015
GBD 2013
− MMR Database 2015 −
Observed Data
Adjusted Data
− Data type −
VR
Spec. studiesExcluded VR data (overlap with specialized study)

1985 1990 1995 2000 2005 2010 2015
Puerto Rico [PRI] (Caribbean)
Year
0
10
20
30
40
50
60
MM
R
− Estimates −MMEIG 2015GBD 2013− MMR Database 2015 −Observed DataAdjusted Data− Data type −VR
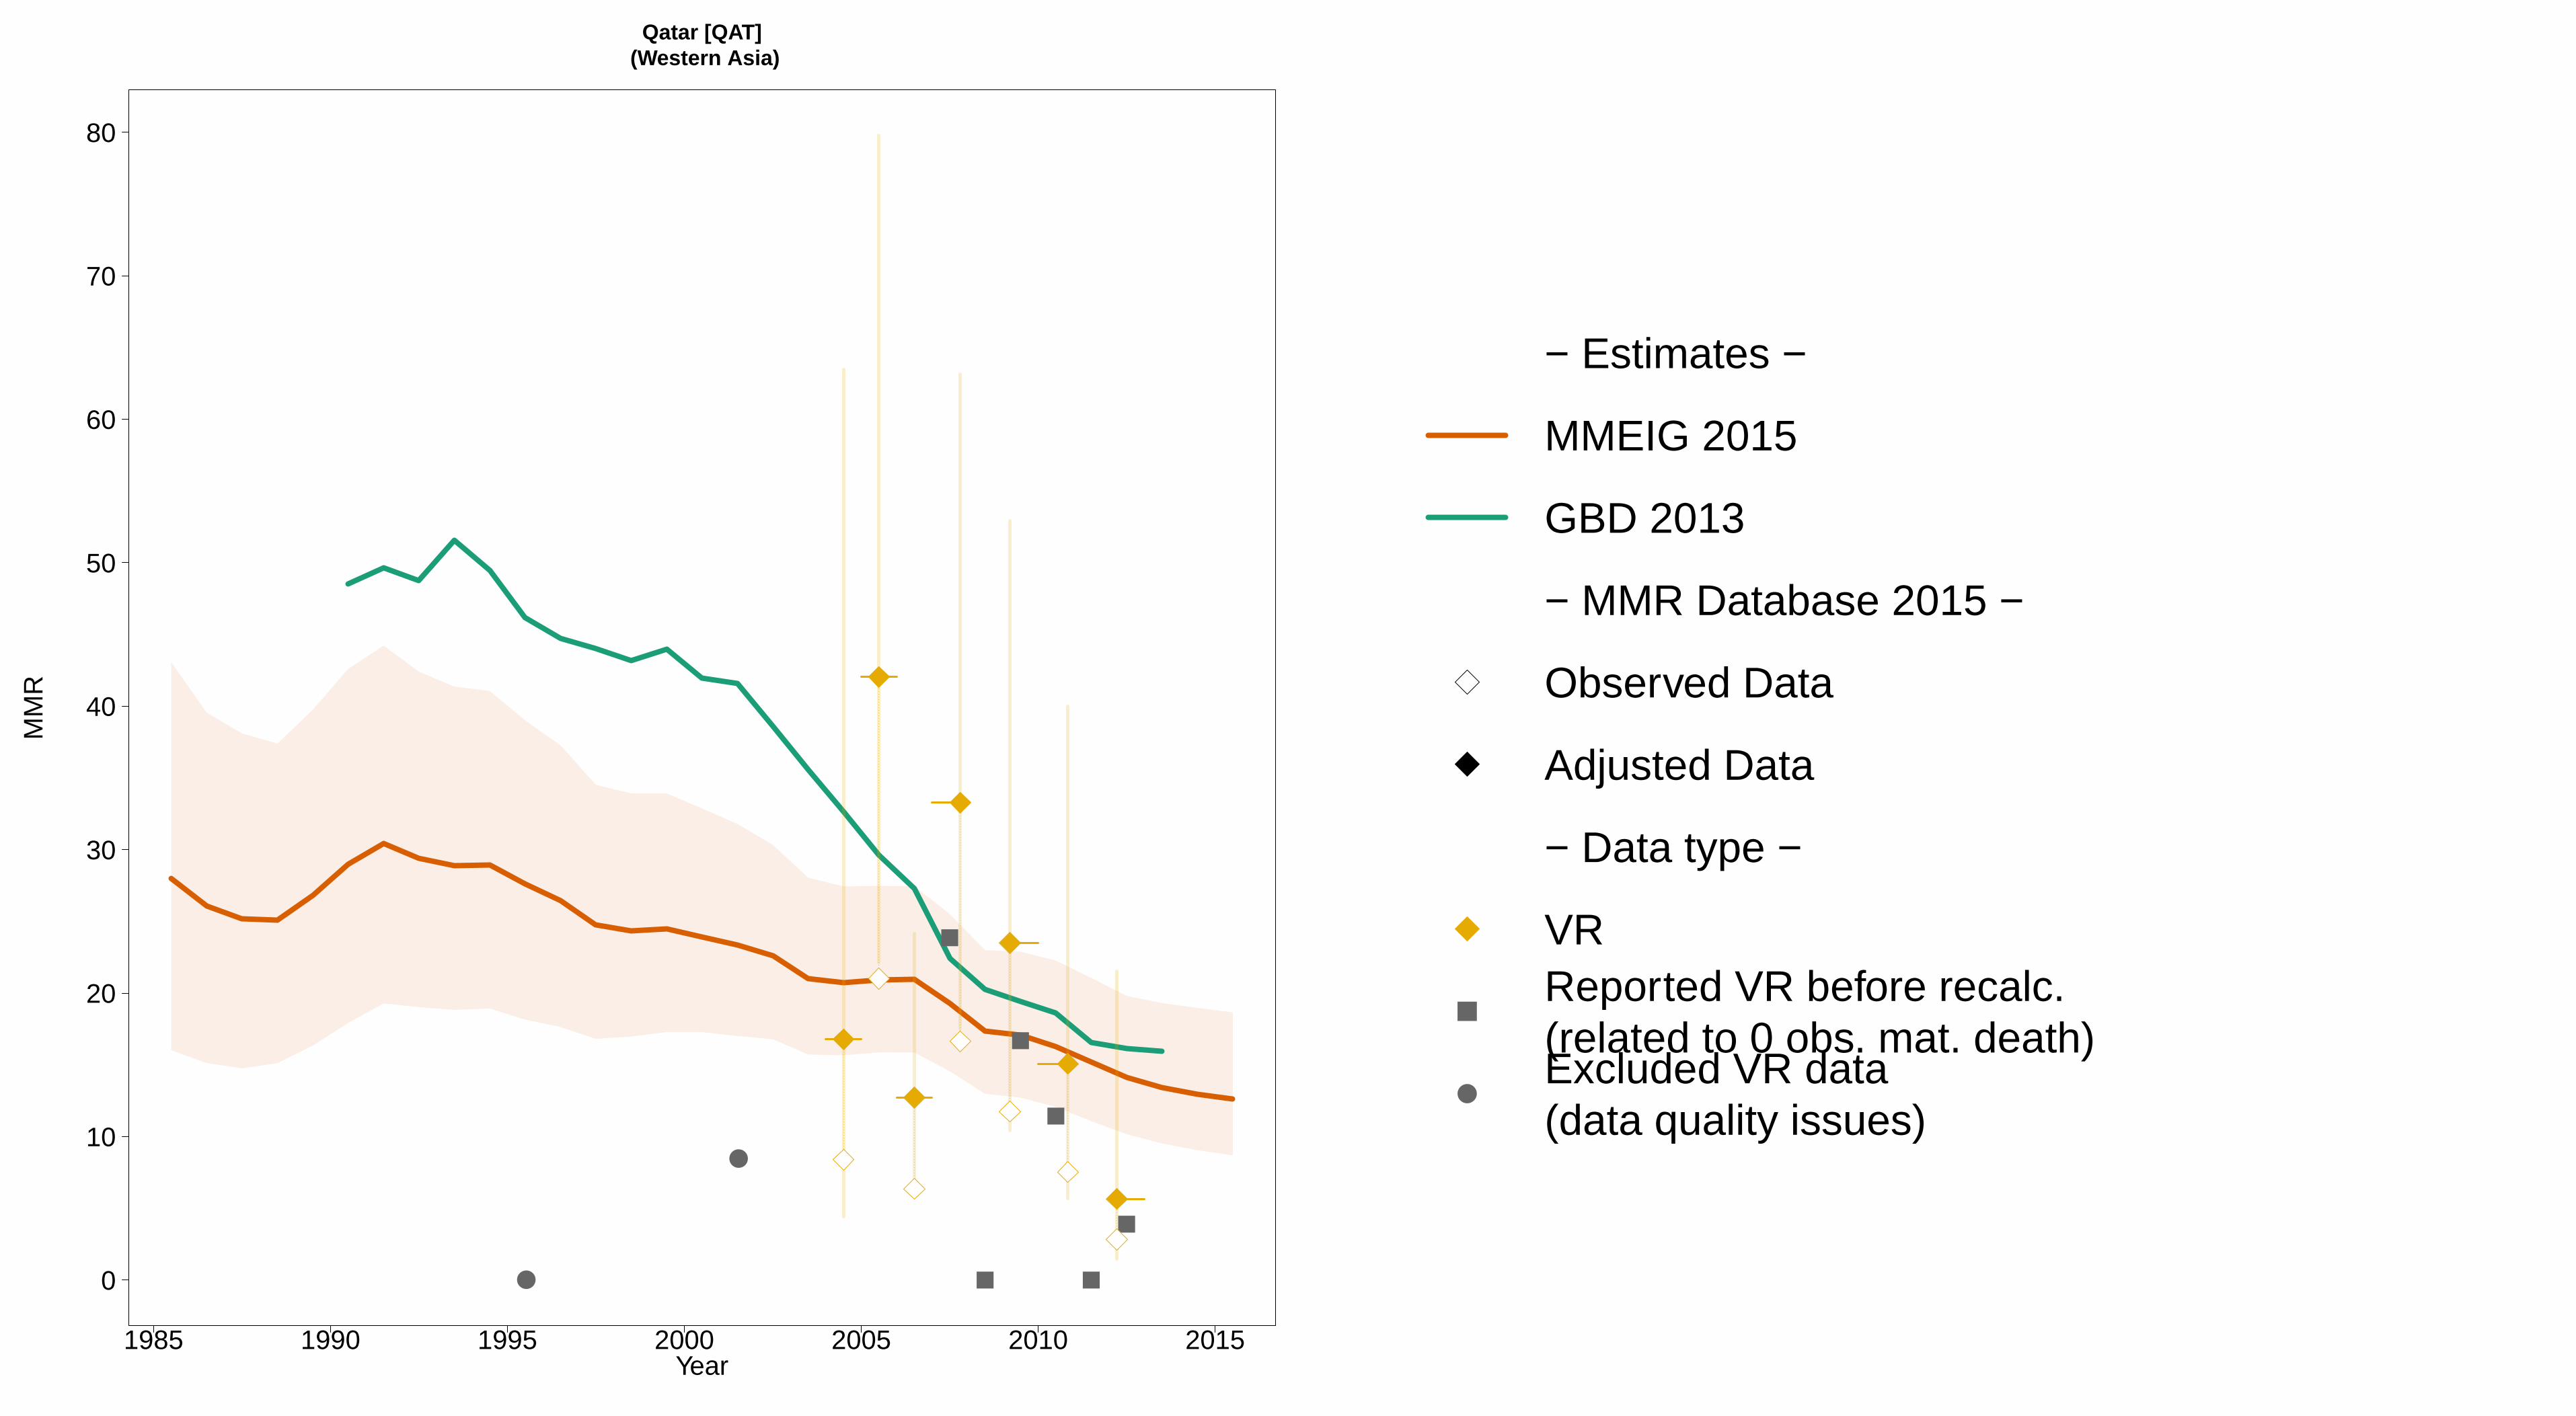
1985 1990 1995 2000 2005 2010 2015
Qatar [QAT] (Western Asia)
Year
0
10
20
30
40
50
60
70
80
MM
R
●
●
− Estimates −
MMEIG 2015
GBD 2013
− MMR Database 2015 −
Observed Data
Adjusted Data
− Data type −
VRReported VR before recalc.(related to 0 obs. mat. death)Excluded VR data (data quality issues)

1985 1990 1995 2000 2005 2010 2015
Republic of Korea [KOR] (Eastern Asia)
Year
0
5
10
15
20
25
30
35
MM
R
− Estimates −
MMEIG 2015
GBD 2013
− MMR Database 2015 −
Observed Data
Adjusted Data
− Data type −
VR
Spec. studiesExcluded VR data (overlap with specialized study)

1985 1990 1995 2000 2005 2010 2015
Republic of Moldova [MDA] (Developed regions)
Year
0
50
100
MM
R
− Estimates −MMEIG 2015GBD 2013− MMR Database 2015 −Observed DataAdjusted Data− Data type −VR

1985 1990 1995 2000 2005 2010 2015
Romania [ROU] (Developed regions)
Year
0
50
100
150
200
250
300
350
MM
R
− Estimates −MMEIG 2015GBD 2013− MMR Database 2015 −Observed DataAdjusted Data− Data type −VR
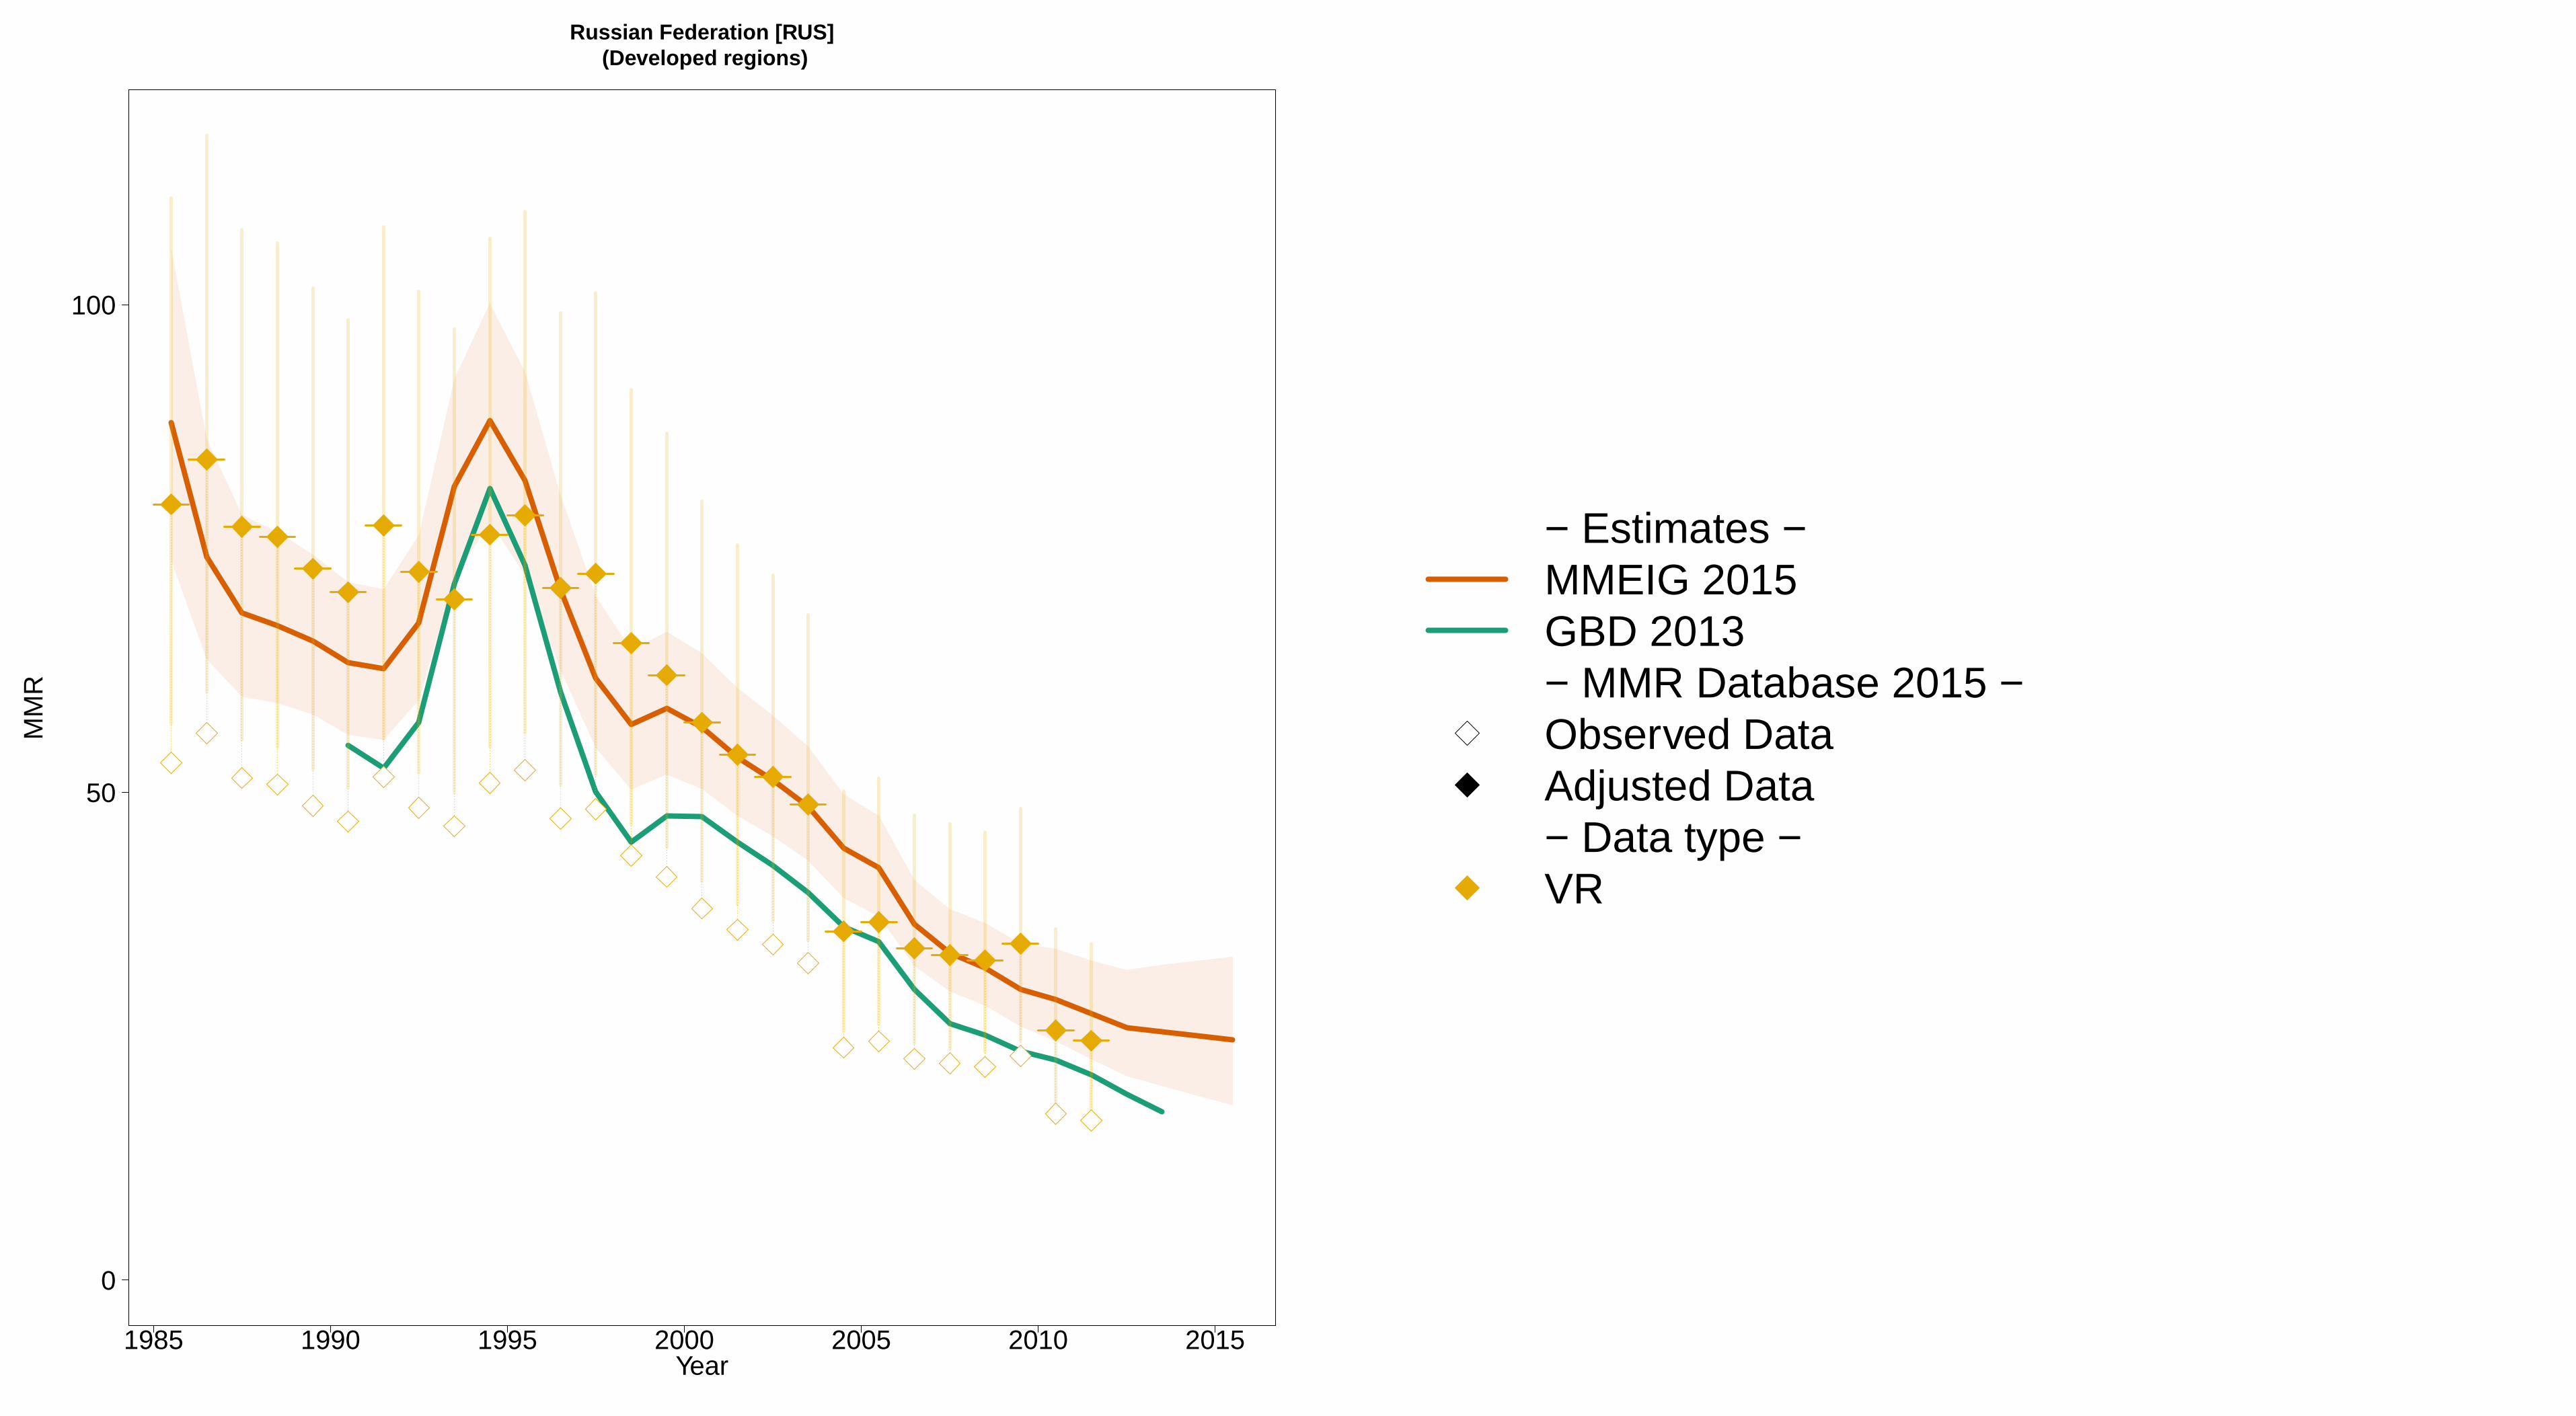
1985 1990 1995 2000 2005 2010 2015
Russian Federation [RUS] (Developed regions)
Year
0
50
100
MM
R
− Estimates −MMEIG 2015GBD 2013− MMR Database 2015 −Observed DataAdjusted Data− Data type −VR

1985 1990 1995 2000 2005 2010 2015
Rwanda [RWA] (Eastern Africa)
Year
0
500
1000
1500
2000
MM
R
− Estimates −MMEIG 2015GBD 2013− MMR Database 2015 −Observed DataAdjusted Data− Data type −DHSMisc. studiesExcluded misc. studies

1985 1990 1995 2000 2005 2010 2015
Saint Lucia [LCA] (Caribbean)
Year
0
100
200
300
400
MM
R
− Estimates −
MMEIG 2015
GBD 2013
− MMR Database 2015 −
Observed Data
Adjusted Data
− Data type −
VRReported VR before recalc.(related to 0 obs. mat. death)
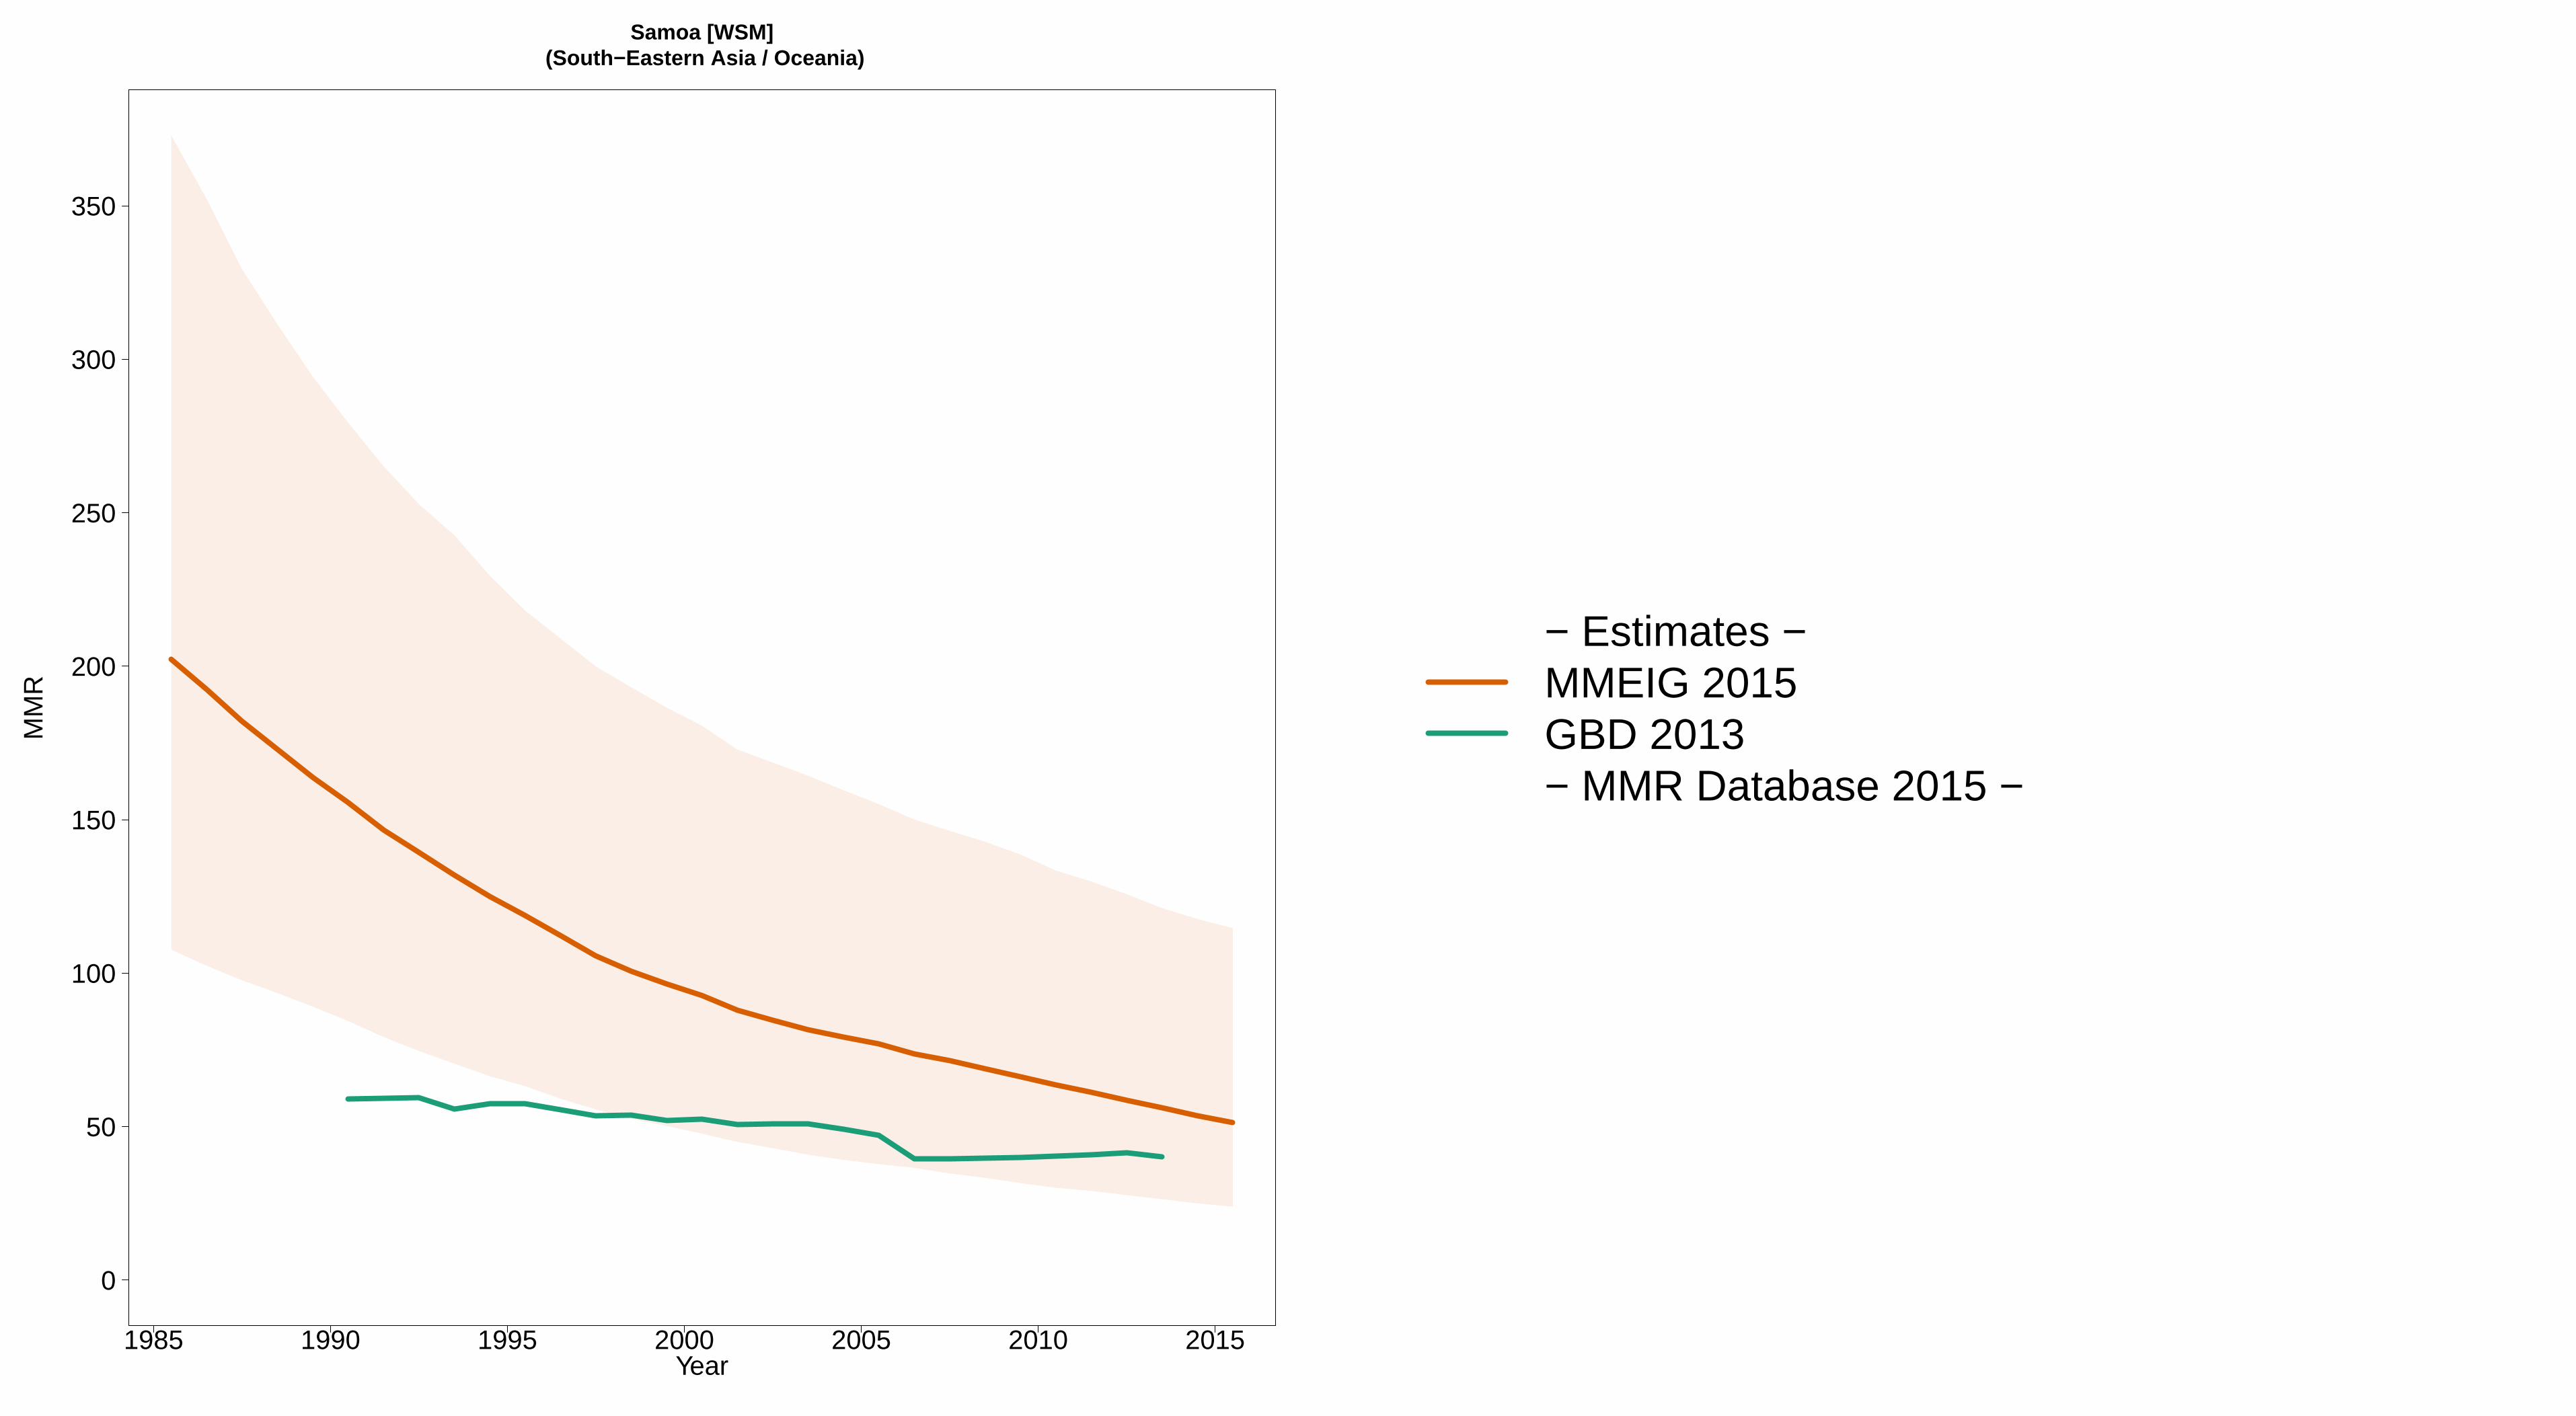
1985 1990 1995 2000 2005 2010 2015
Samoa [WSM] (South−Eastern Asia / Oceania)
Year
0
50
100
150
200
250
300
350
MM
R
− Estimates −MMEIG 2015GBD 2013− MMR Database 2015 −
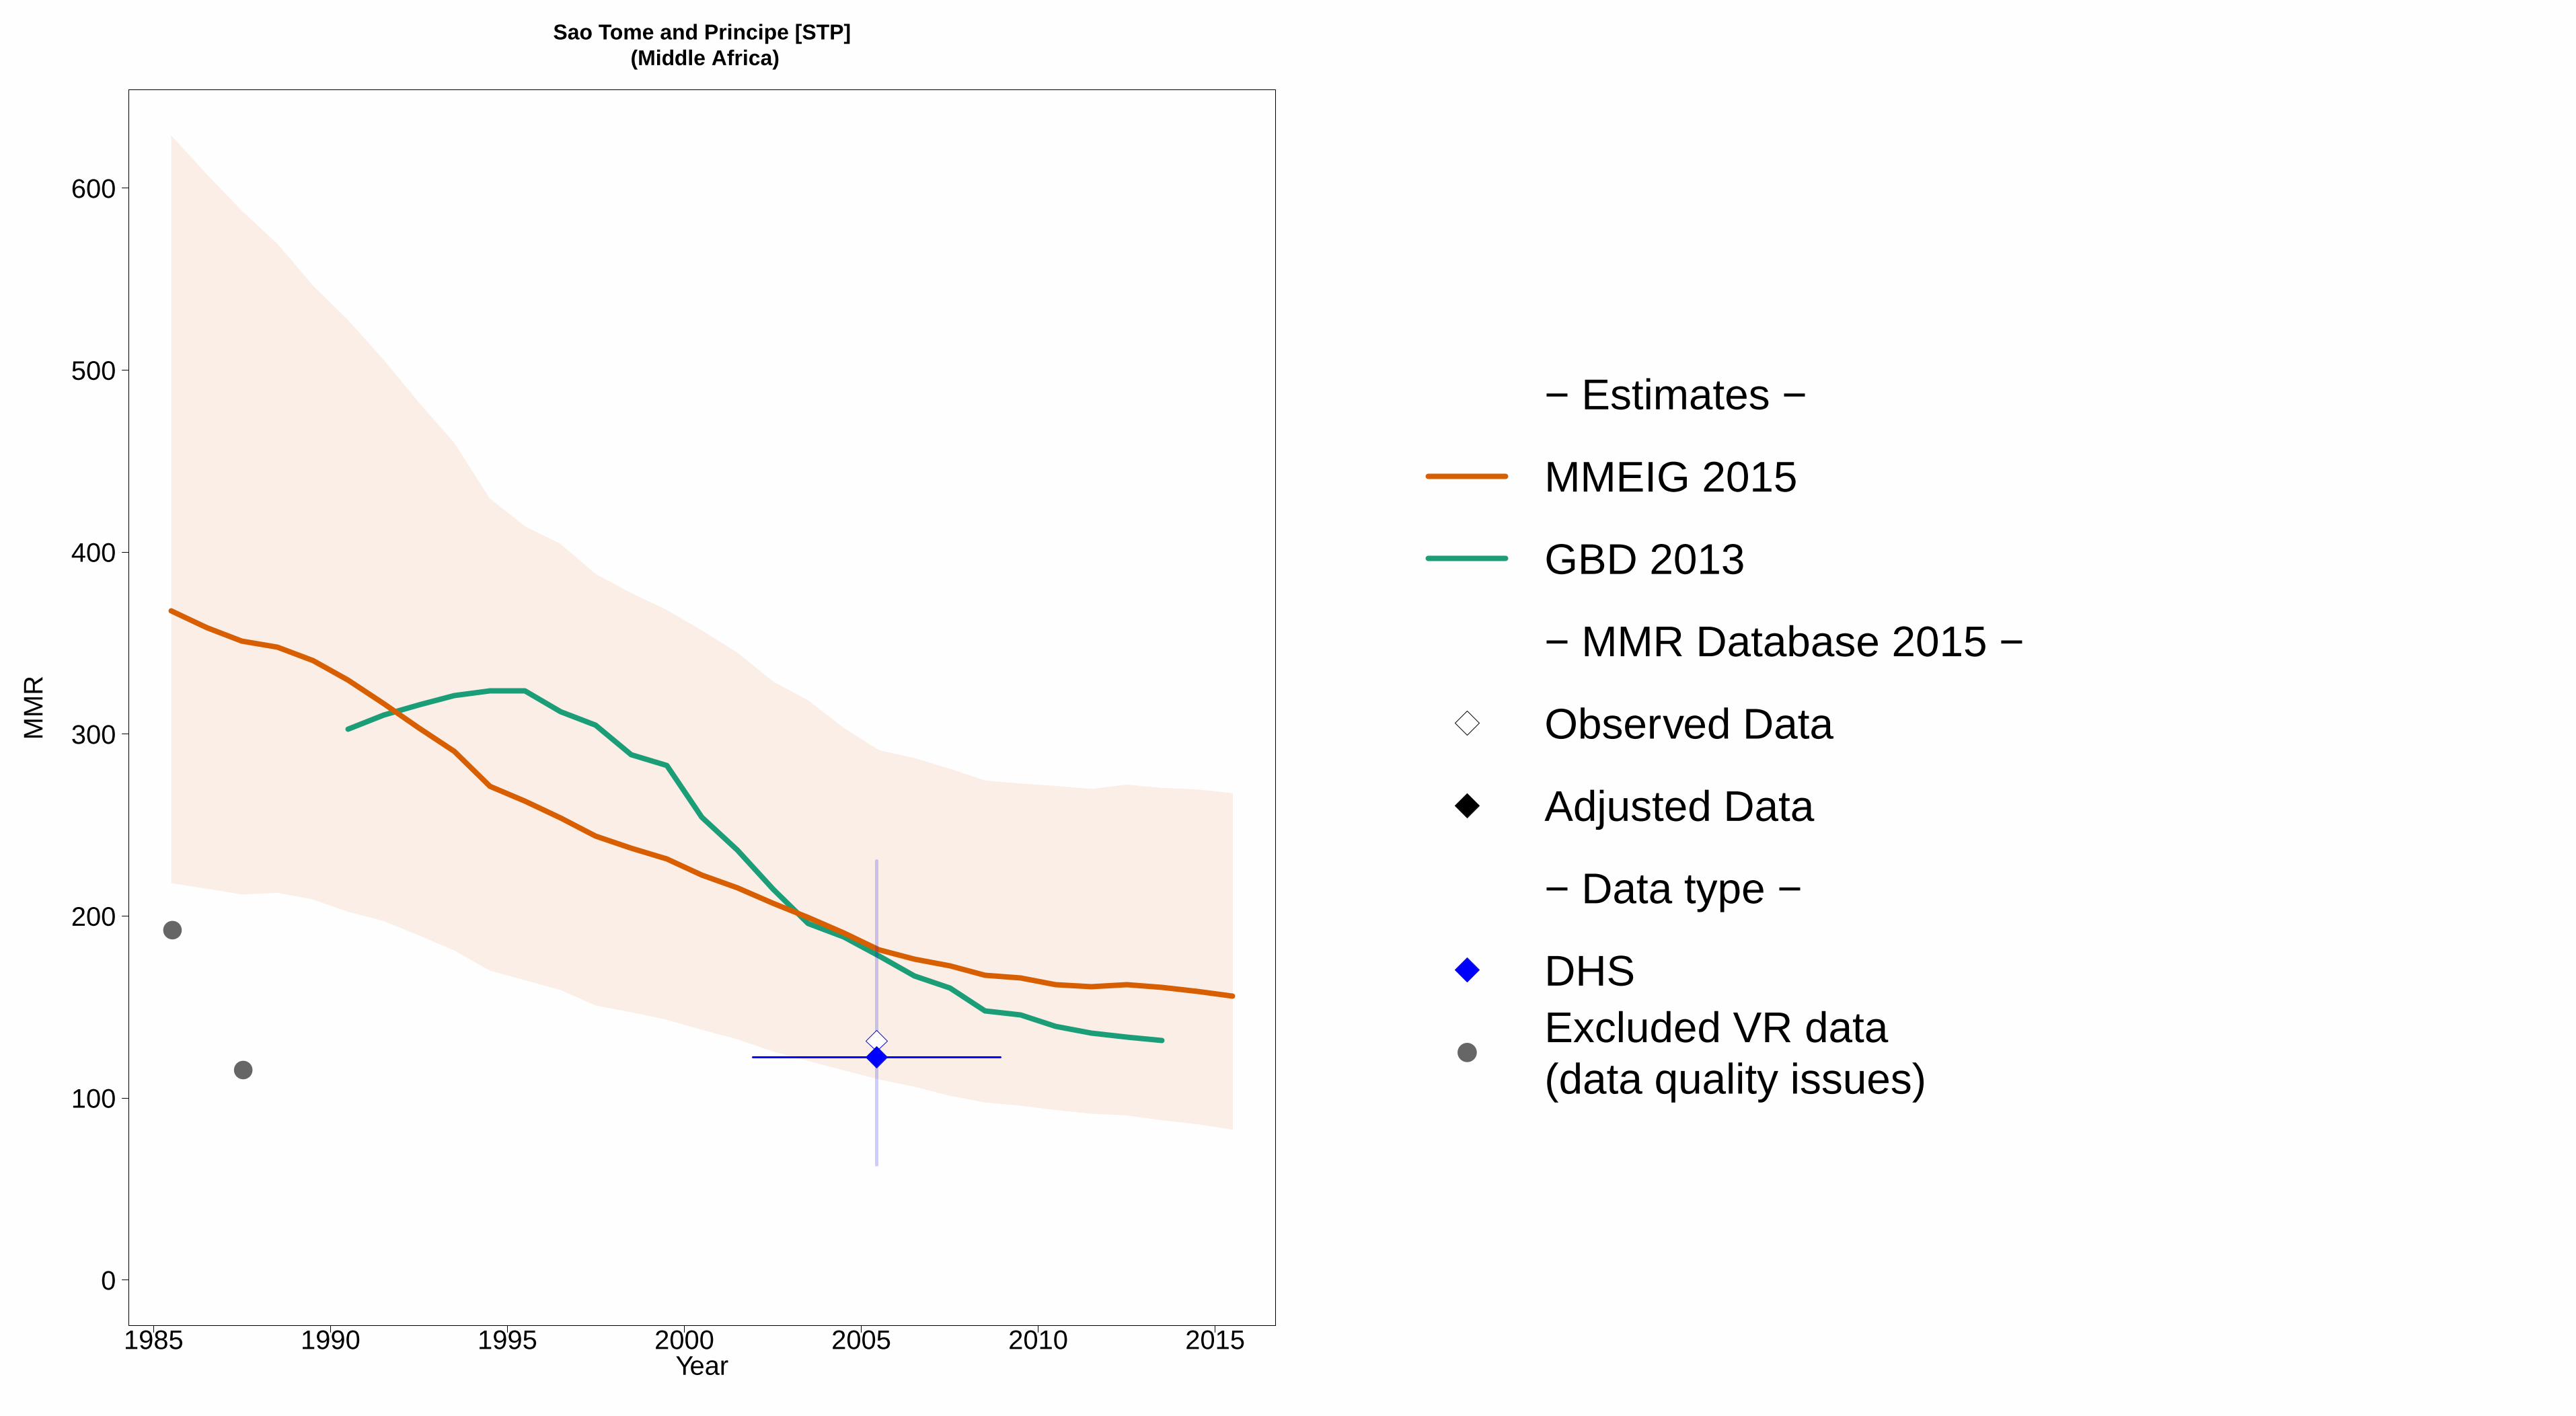
1985 1990 1995 2000 2005 2010 2015
Sao Tome and Principe [STP] (Middle Africa)
Year
0
100
200
300
400
500
600
MM
R
●
●
− Estimates −
MMEIG 2015
GBD 2013
− MMR Database 2015 −
Observed Data
Adjusted Data
− Data type −
DHSExcluded VR data (data quality issues)

1985 1990 1995 2000 2005 2010 2015
Saudi Arabia [SAU] (Western Asia)
Year
0
10
20
30
40
50
60
70
80
90
100
MM
R
● ●
− Estimates −
MMEIG 2015
GBD 2013
− MMR Database 2015 −
Observed Data
Adjusted Data
− Data type −
Misc. studiesExcluded VR data (data quality issues)

1985 1990 1995 2000 2005 2010 2015
Senegal [SEN] (Western Africa)
Year
0
100
200
300
400
500
600
700
800
900
MM
R
− Estimates −MMEIG 2015GBD 2013− MMR Database 2015 −Observed DataAdjusted Data− Data type −DHS

1985 1990 1995 2000 2005 2010 2015
Serbia [SRB] (Transition countries of South−Eastern Europe)
Year
0
10
20
30
40
MM
R
− Estimates −
MMEIG 2015
GBD 2013
− MMR Database 2015 −
Observed Data
Adjusted Data
− Data type −
VR
Spec. studiesReported VR before recalc.(related to 0 obs. mat. death)
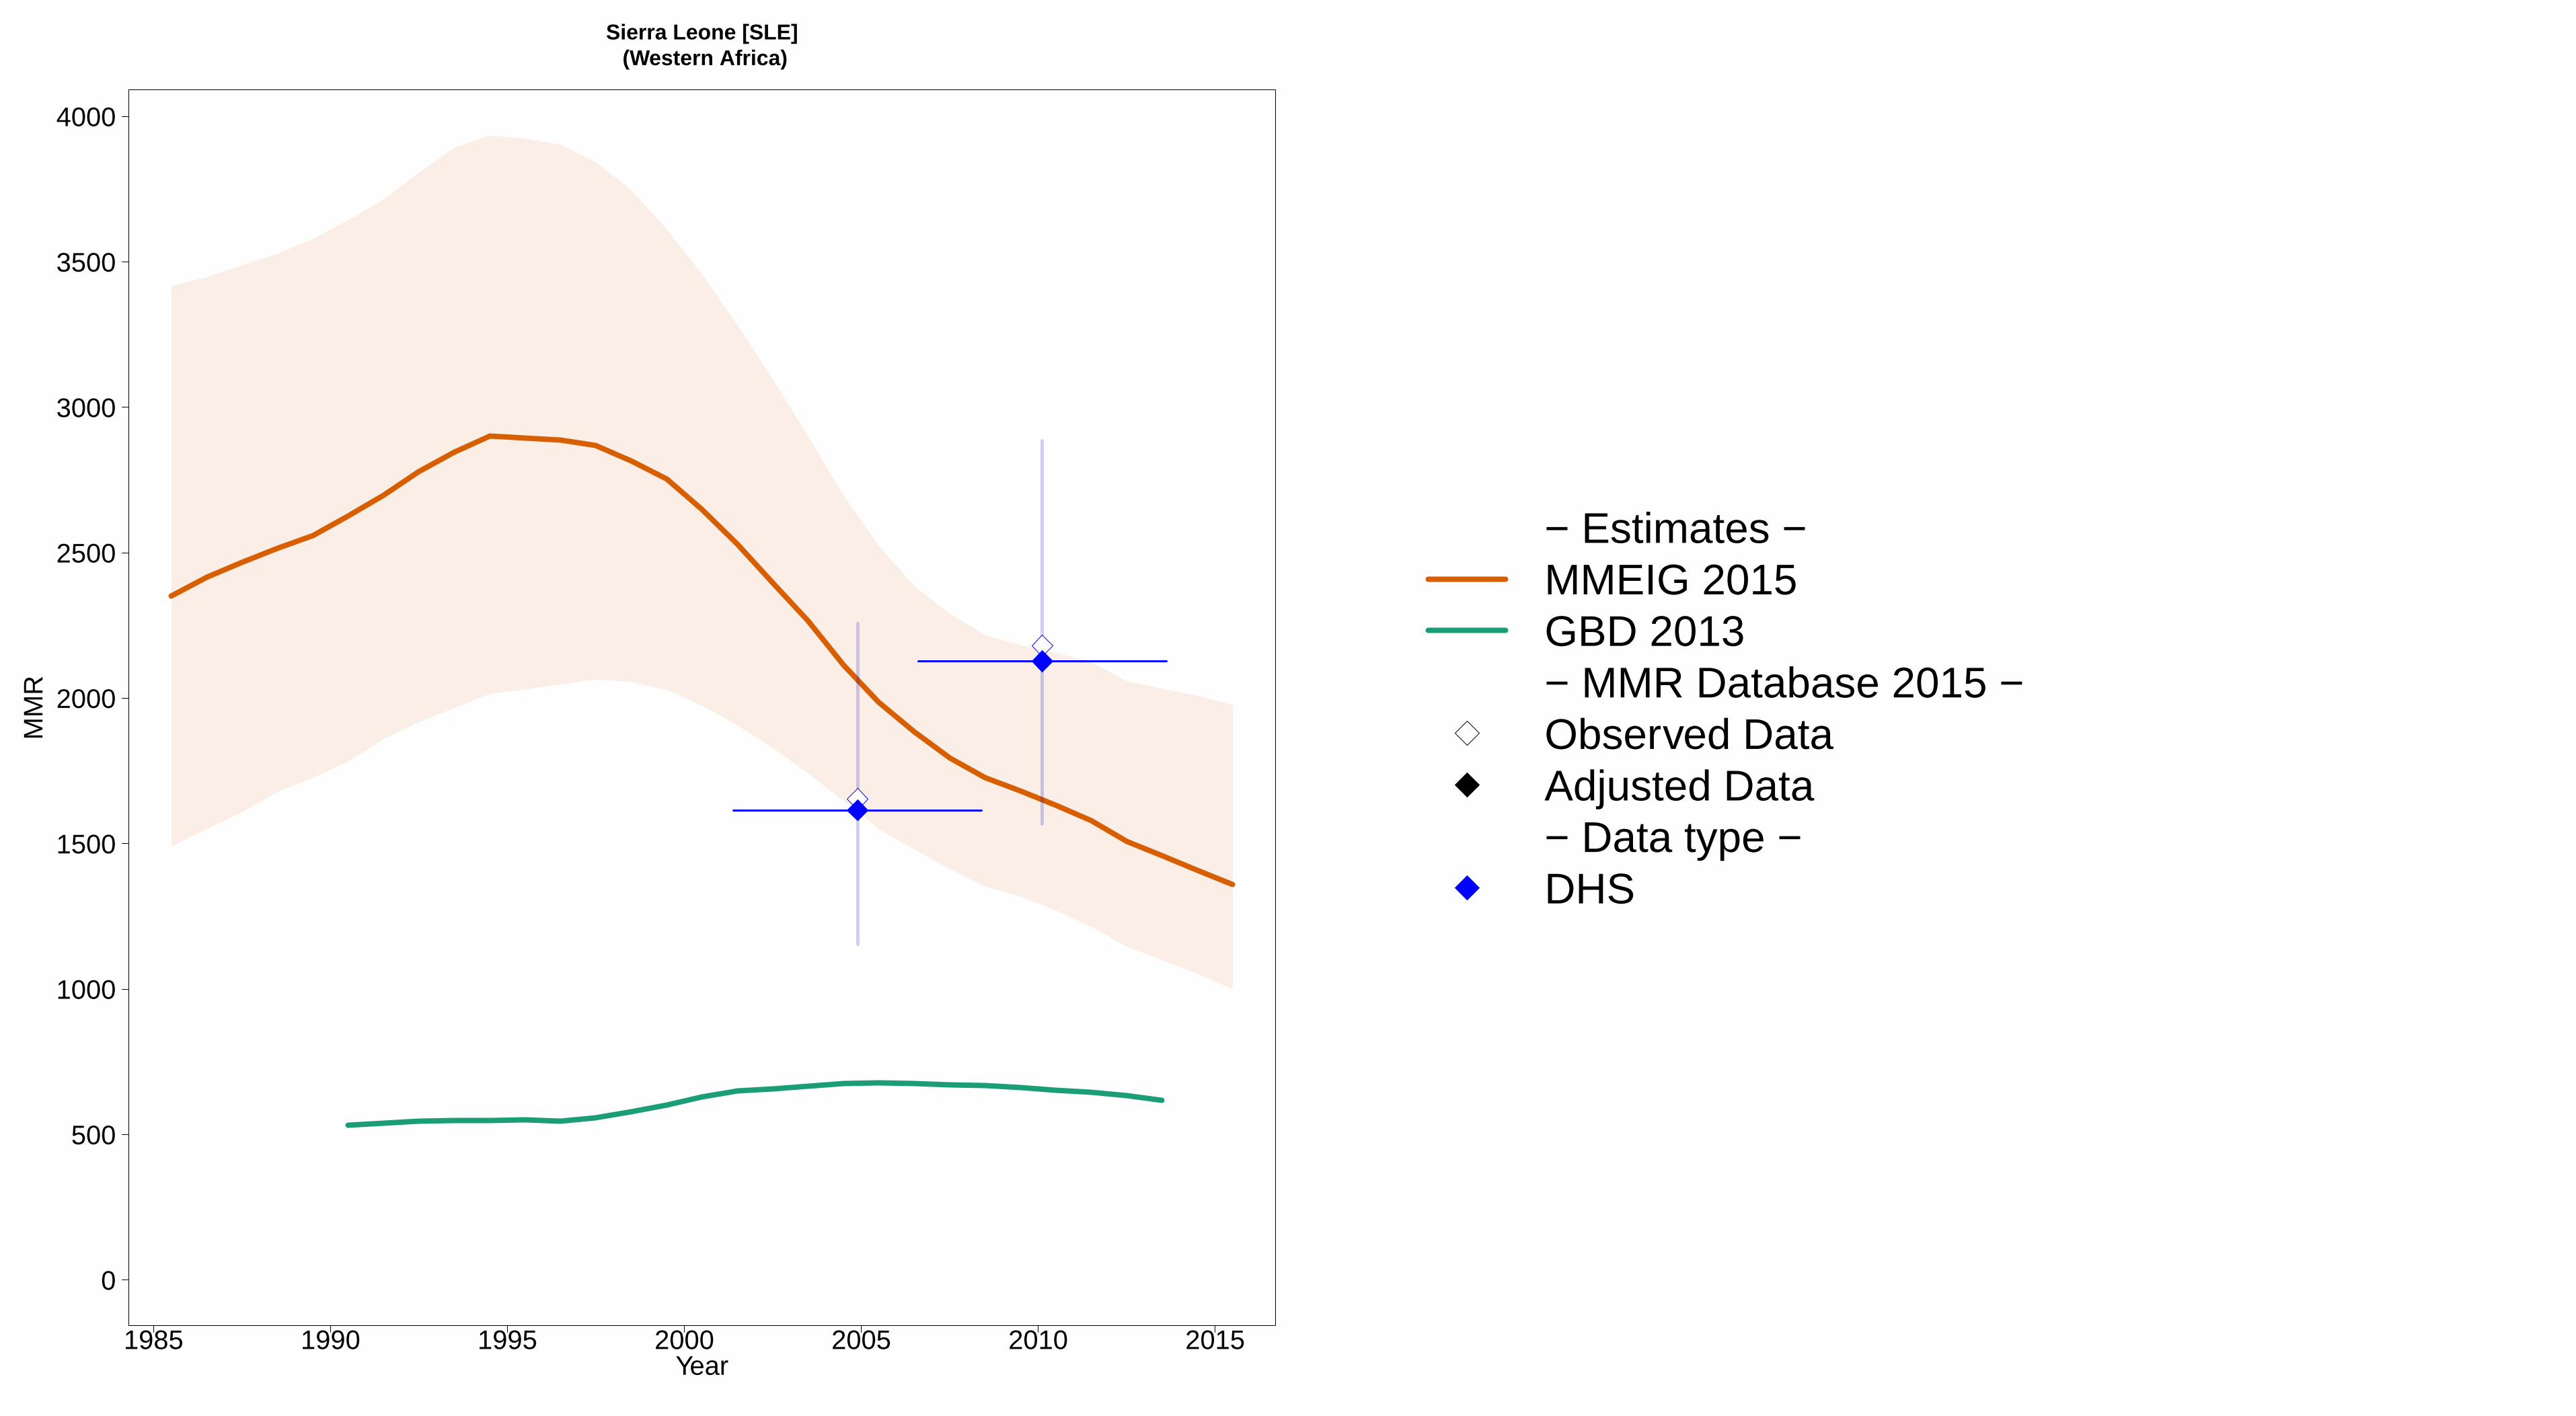
1985 1990 1995 2000 2005 2010 2015
Sierra Leone [SLE] (Western Africa)
Year
0
500
1000
1500
2000
2500
3000
3500
4000
MM
R
− Estimates −MMEIG 2015GBD 2013− MMR Database 2015 −Observed DataAdjusted Data− Data type −DHS
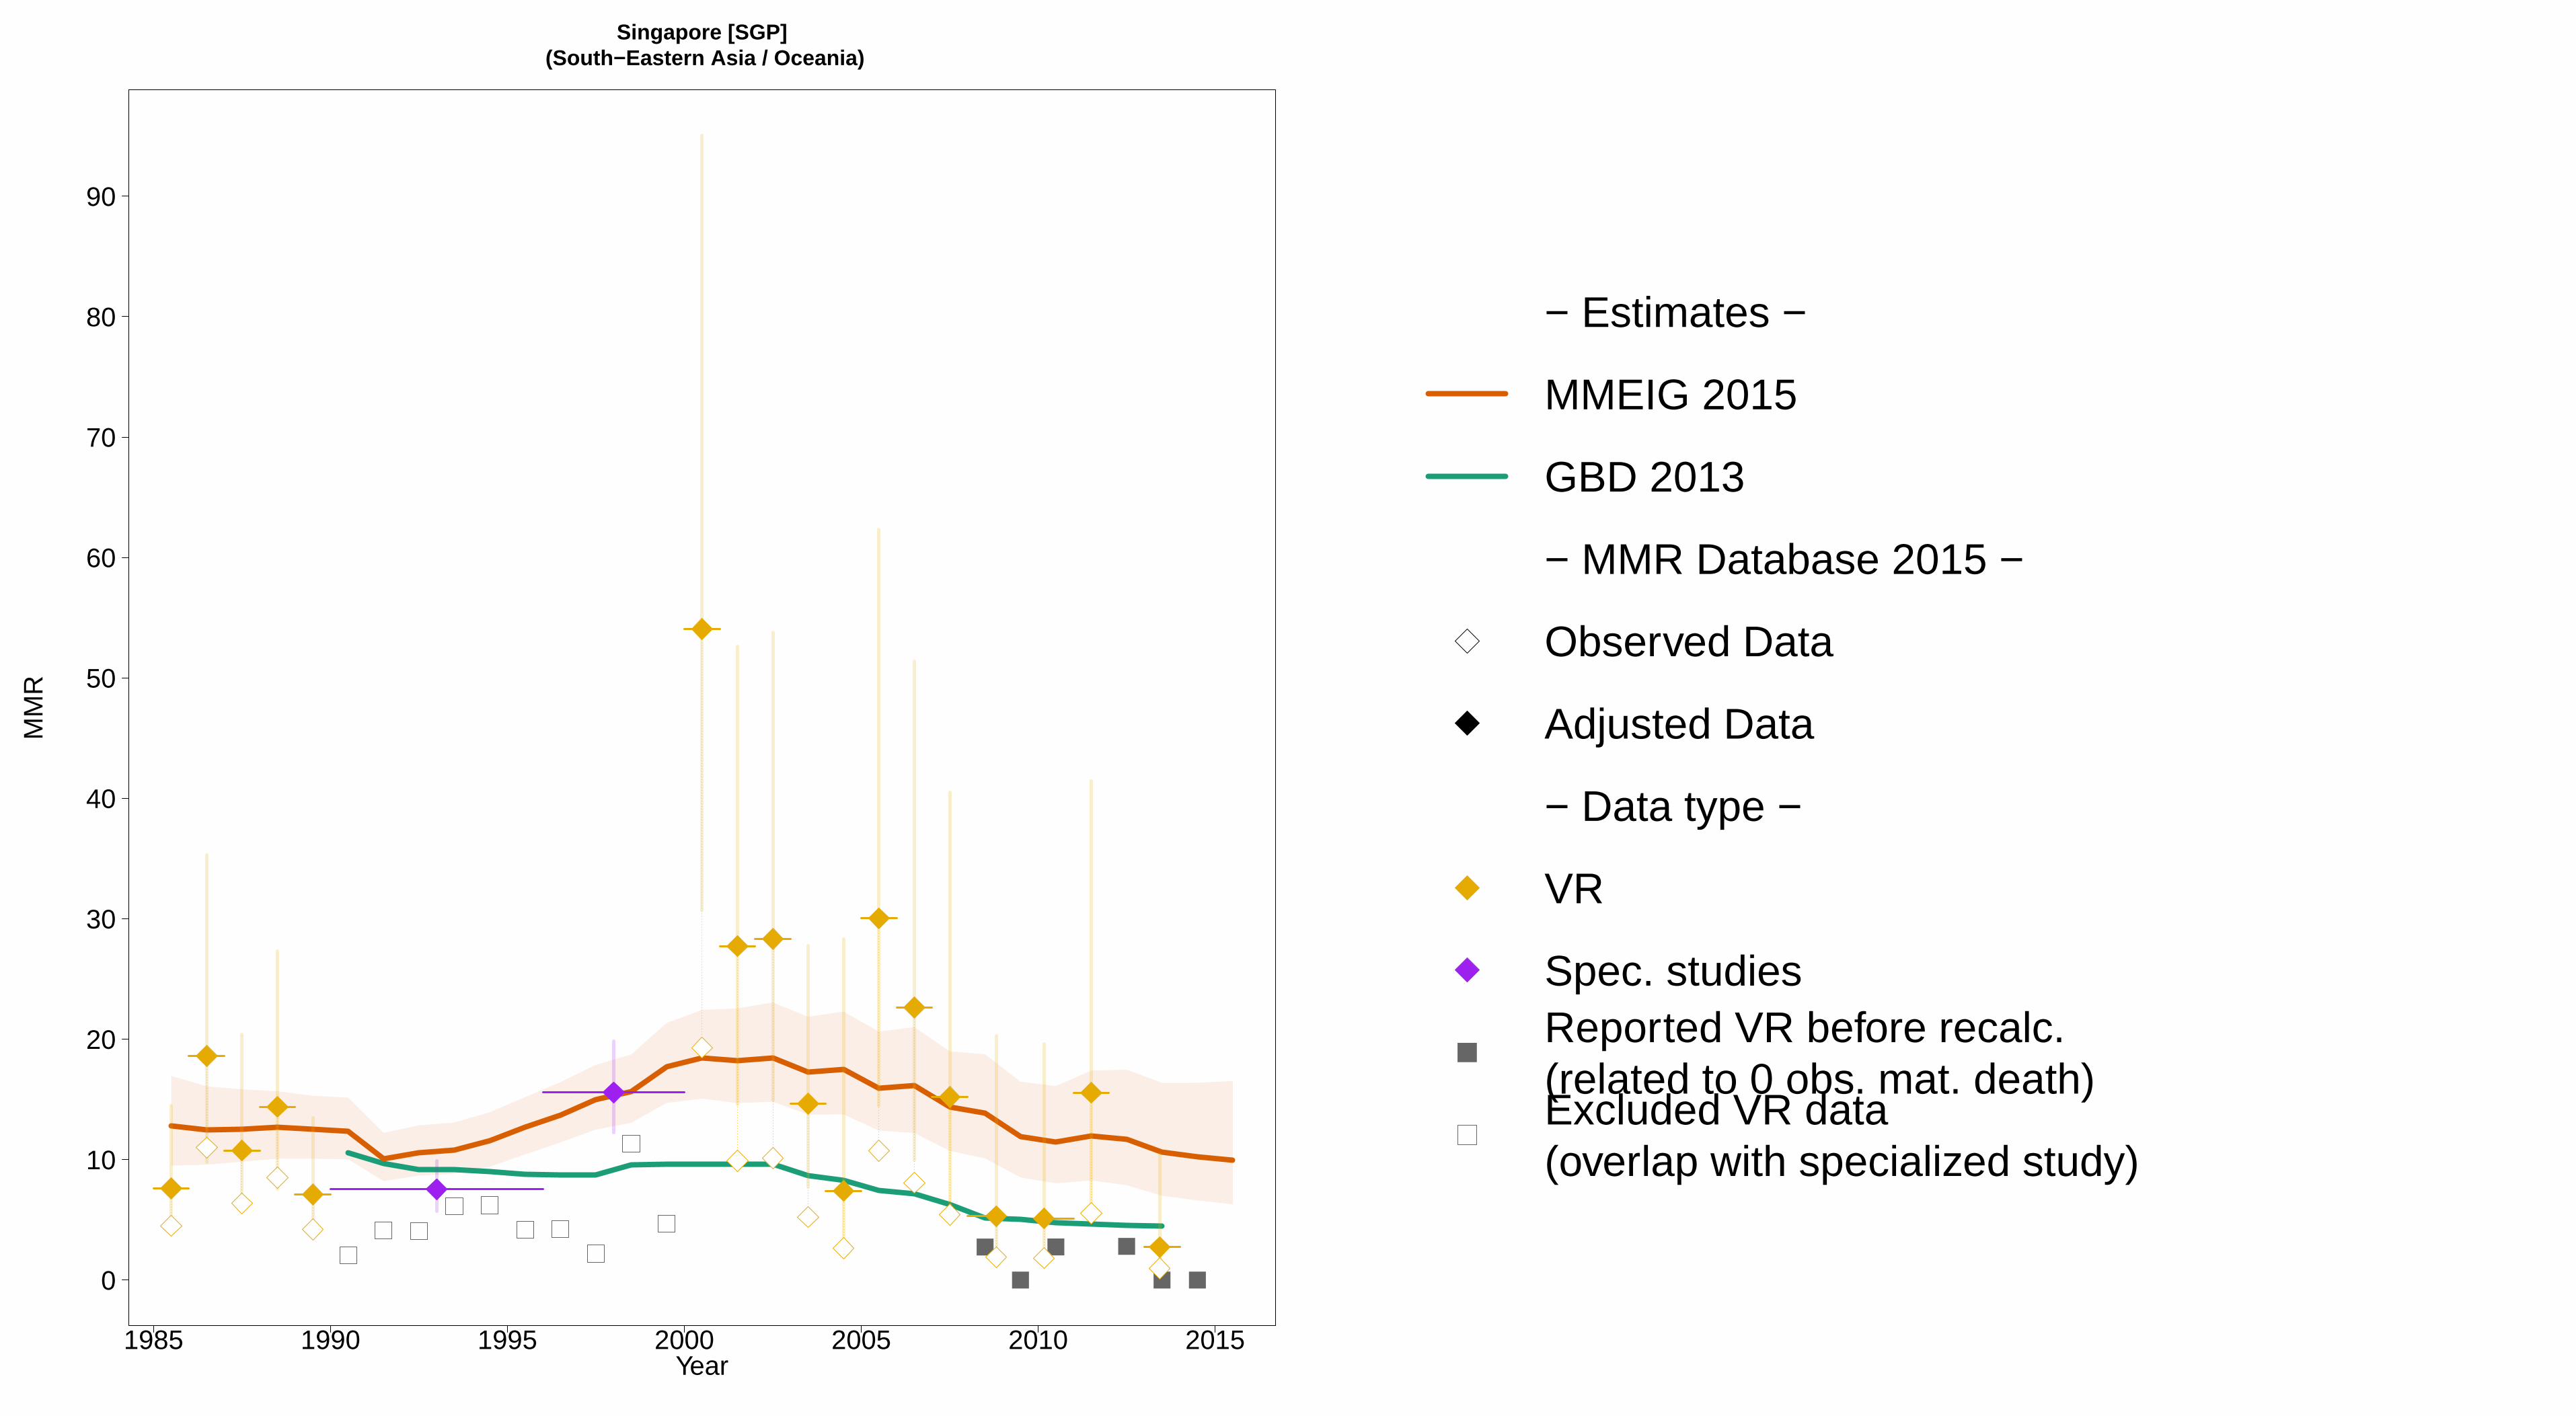
1985 1990 1995 2000 2005 2010 2015
Singapore [SGP] (South−Eastern Asia / Oceania)
Year
0
10
20
30
40
50
60
70
80
90
MM
R
− Estimates −
MMEIG 2015
GBD 2013
− MMR Database 2015 −
Observed Data
Adjusted Data
− Data type −
VR
Spec. studiesReported VR before recalc.(related to 0 obs. mat. death)Excluded VR data (overlap with specialized study)
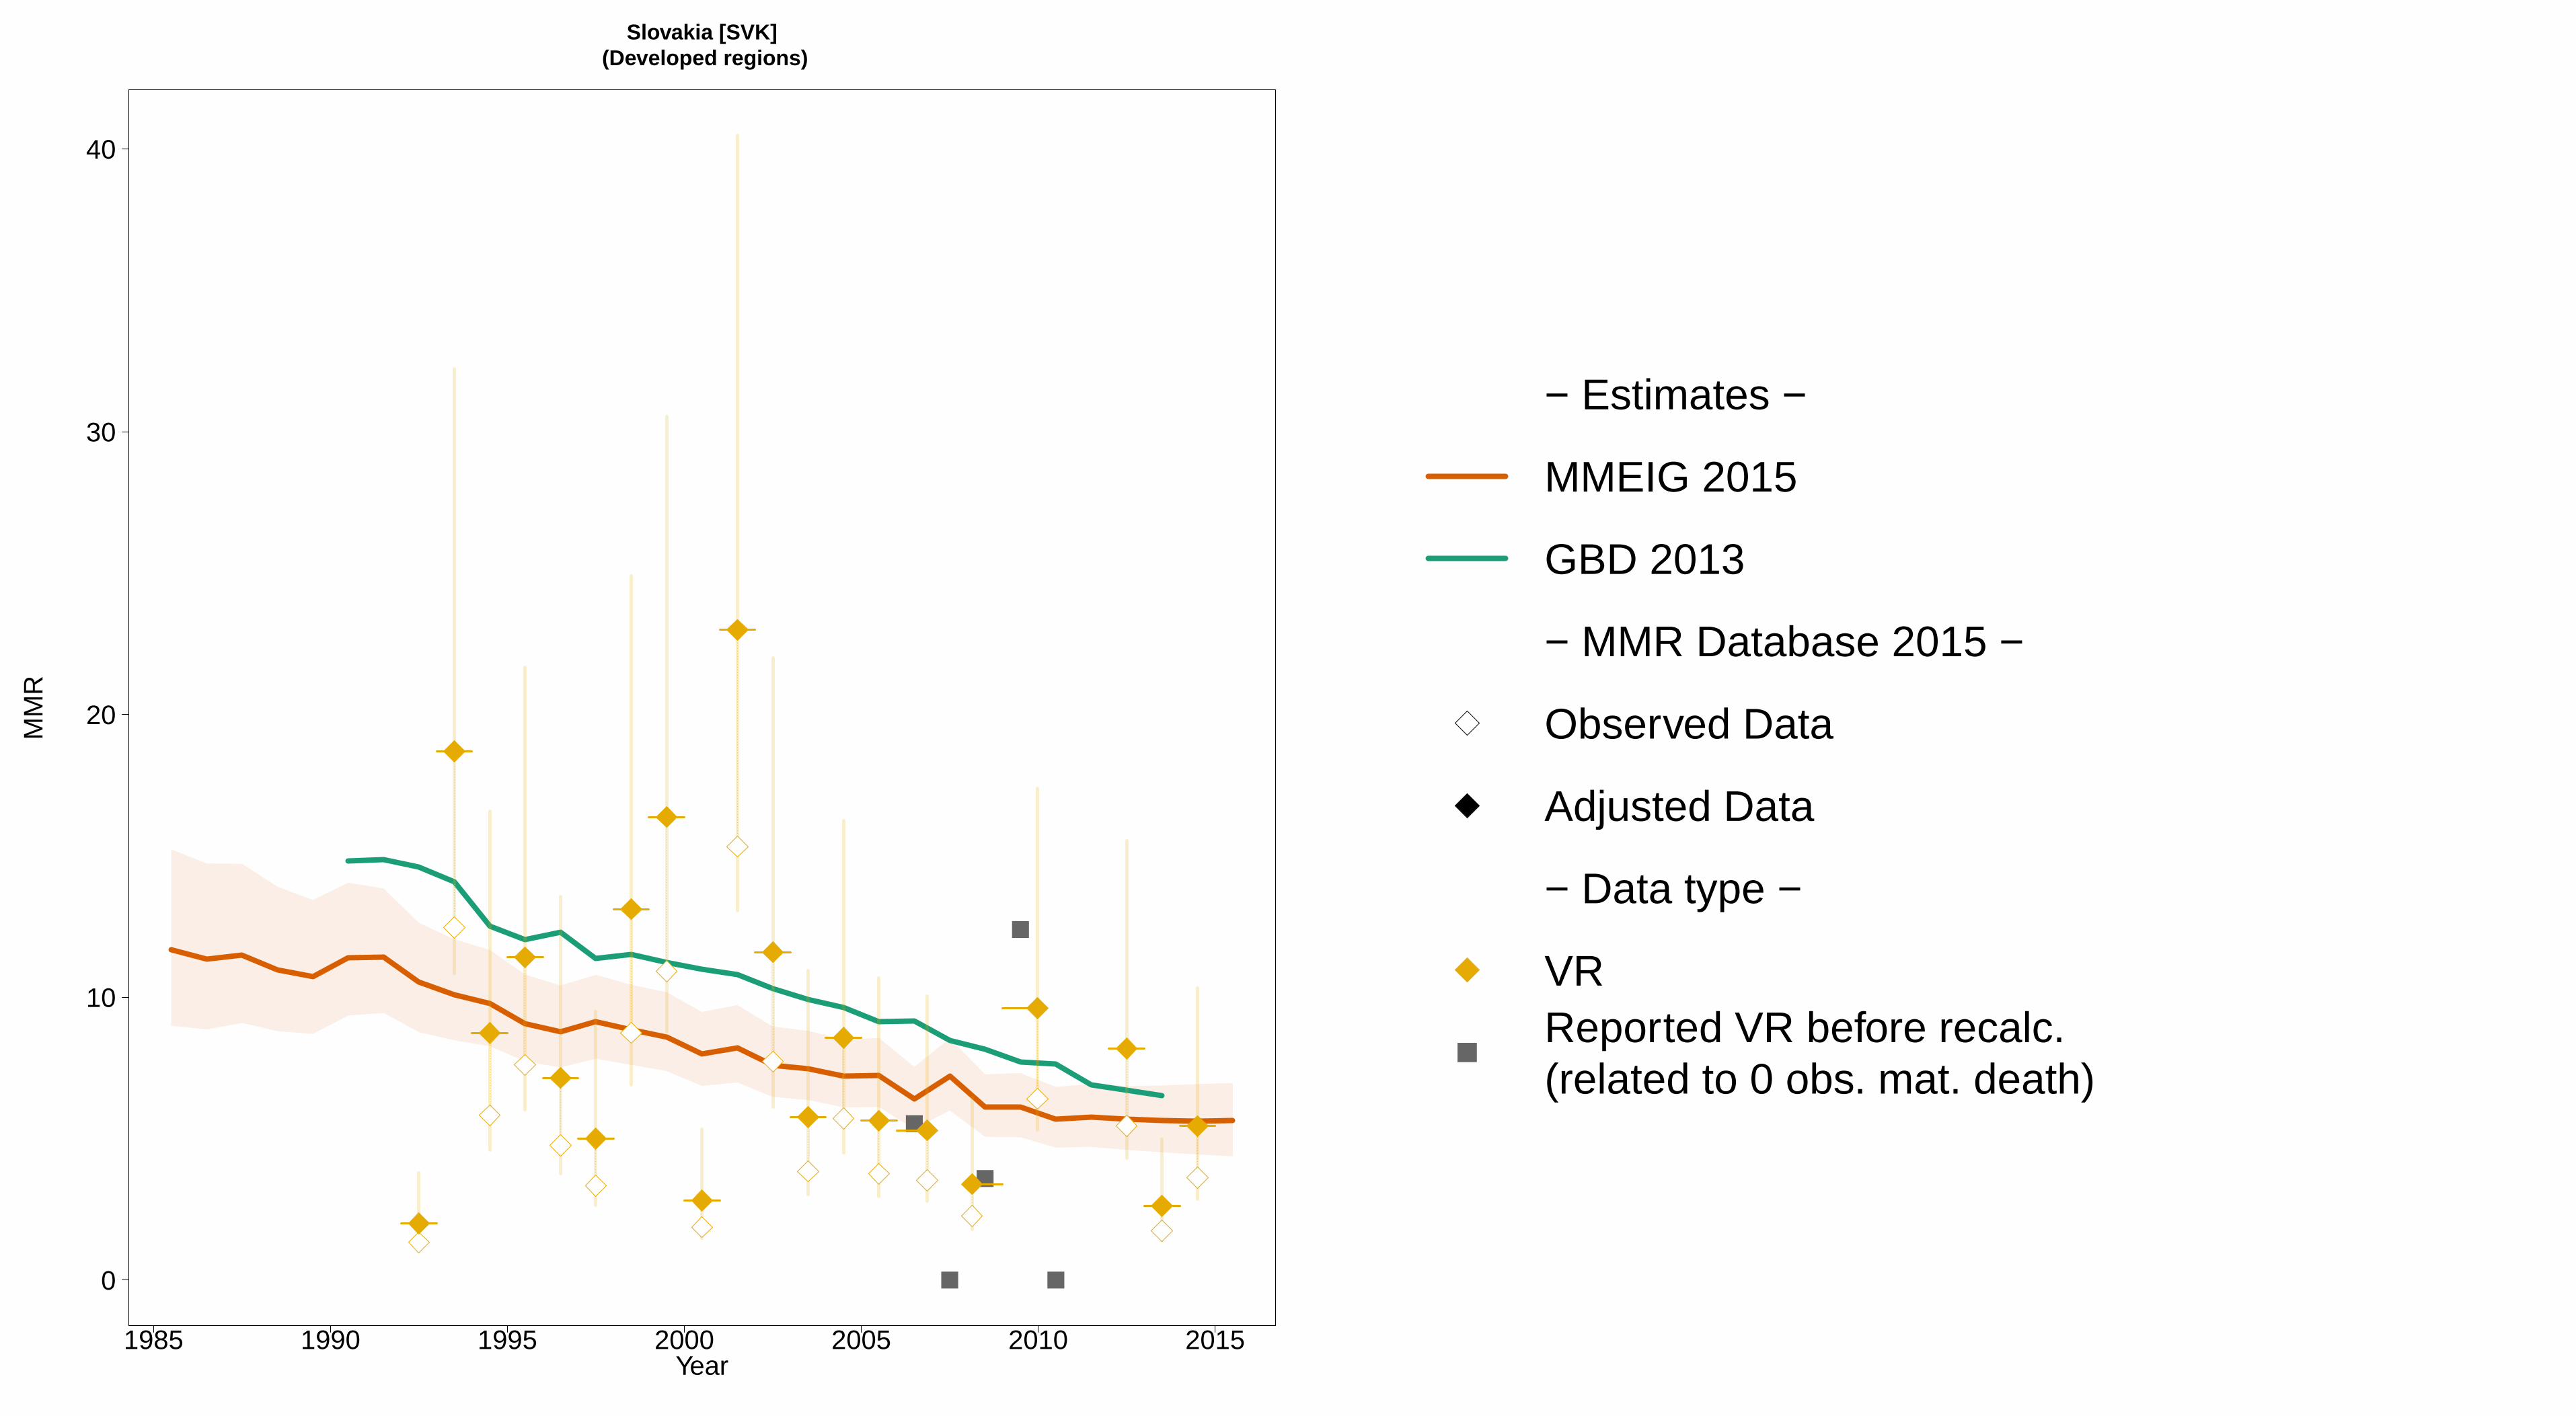
1985 1990 1995 2000 2005 2010 2015
Slovakia [SVK] (Developed regions)
Year
0
10
20
30
40
MM
R
− Estimates −
MMEIG 2015
GBD 2013
− MMR Database 2015 −
Observed Data
Adjusted Data
− Data type −
VRReported VR before recalc.(related to 0 obs. mat. death)

1985 1990 1995 2000 2005 2010 2015
Slovenia [SVN] (Developed regions)
Year
0
10
20
30
40
50
60
MM
R
− Estimates −
MMEIG 2015
GBD 2013
− MMR Database 2015 −
Observed Data
Adjusted Data
− Data type −
VR
Spec. studiesReported VR before recalc.(related to 0 obs. mat. death)Excluded VR data (overlap with specialized study)

1985 1990 1995 2000 2005 2010 2015
Solomon Islands [SLB] (South−Eastern Asia / Oceania)
Year
0
100
200
300
400
500
600
MM
R
− Estimates −MMEIG 2015GBD 2013− MMR Database 2015 −Observed DataAdjusted Data− Data type −Census

1985 1990 1995 2000 2005 2010 2015
Somalia [SOM] (Eastern Africa)
Year
0
500
1000
1500
2000
MM
R
− Estimates −MMEIG 2015GBD 2013− MMR Database 2015 −
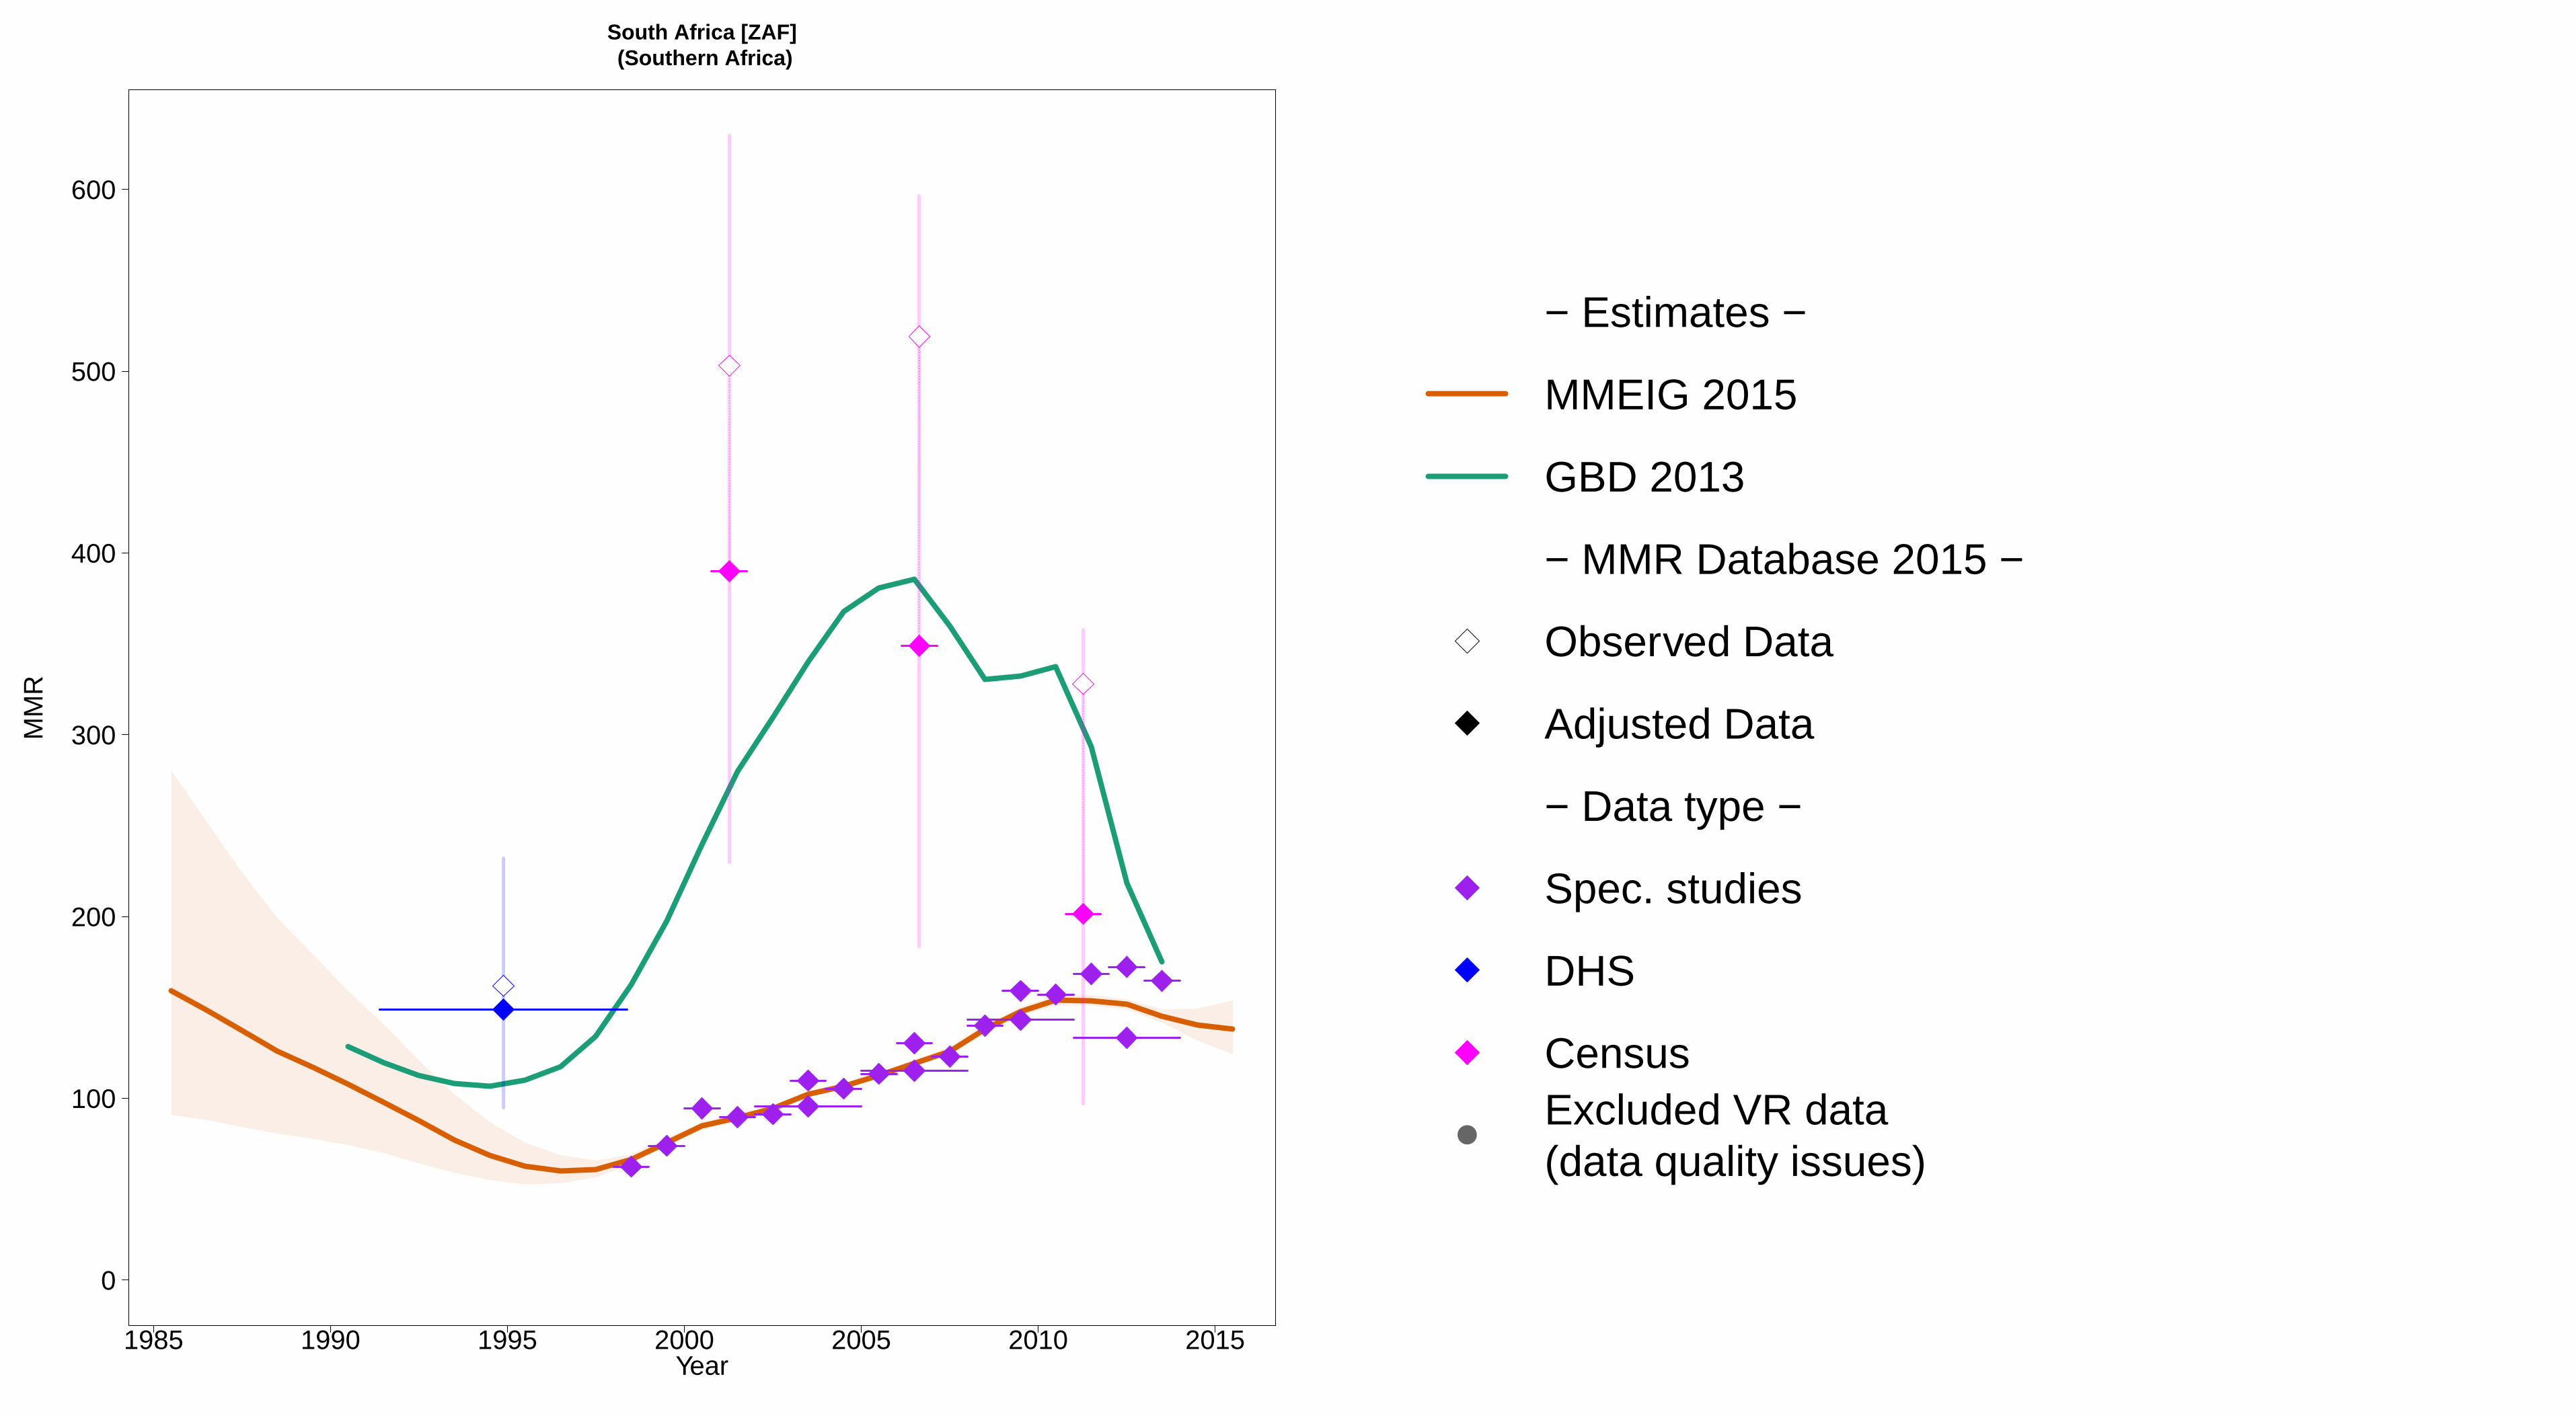
1985 1990 1995 2000 2005 2010 2015
South Africa [ZAF] (Southern Africa)
Year
0
100
200
300
400
500
600
MM
R
− Estimates −
MMEIG 2015
GBD 2013
− MMR Database 2015 −
Observed Data
Adjusted Data
− Data type −
Spec. studies
DHS
CensusExcluded VR data (data quality issues)

1985 1990 1995 2000 2005 2010 2015
South Sudan [SSD] (Eastern Africa)
Year
0
500
1000
1500
2000
2500
3000
MM
R
− Estimates −MMEIG 2015GBD 2013− MMR Database 2015 −Observed DataAdjusted Data− Data type −CensusMisc. studies
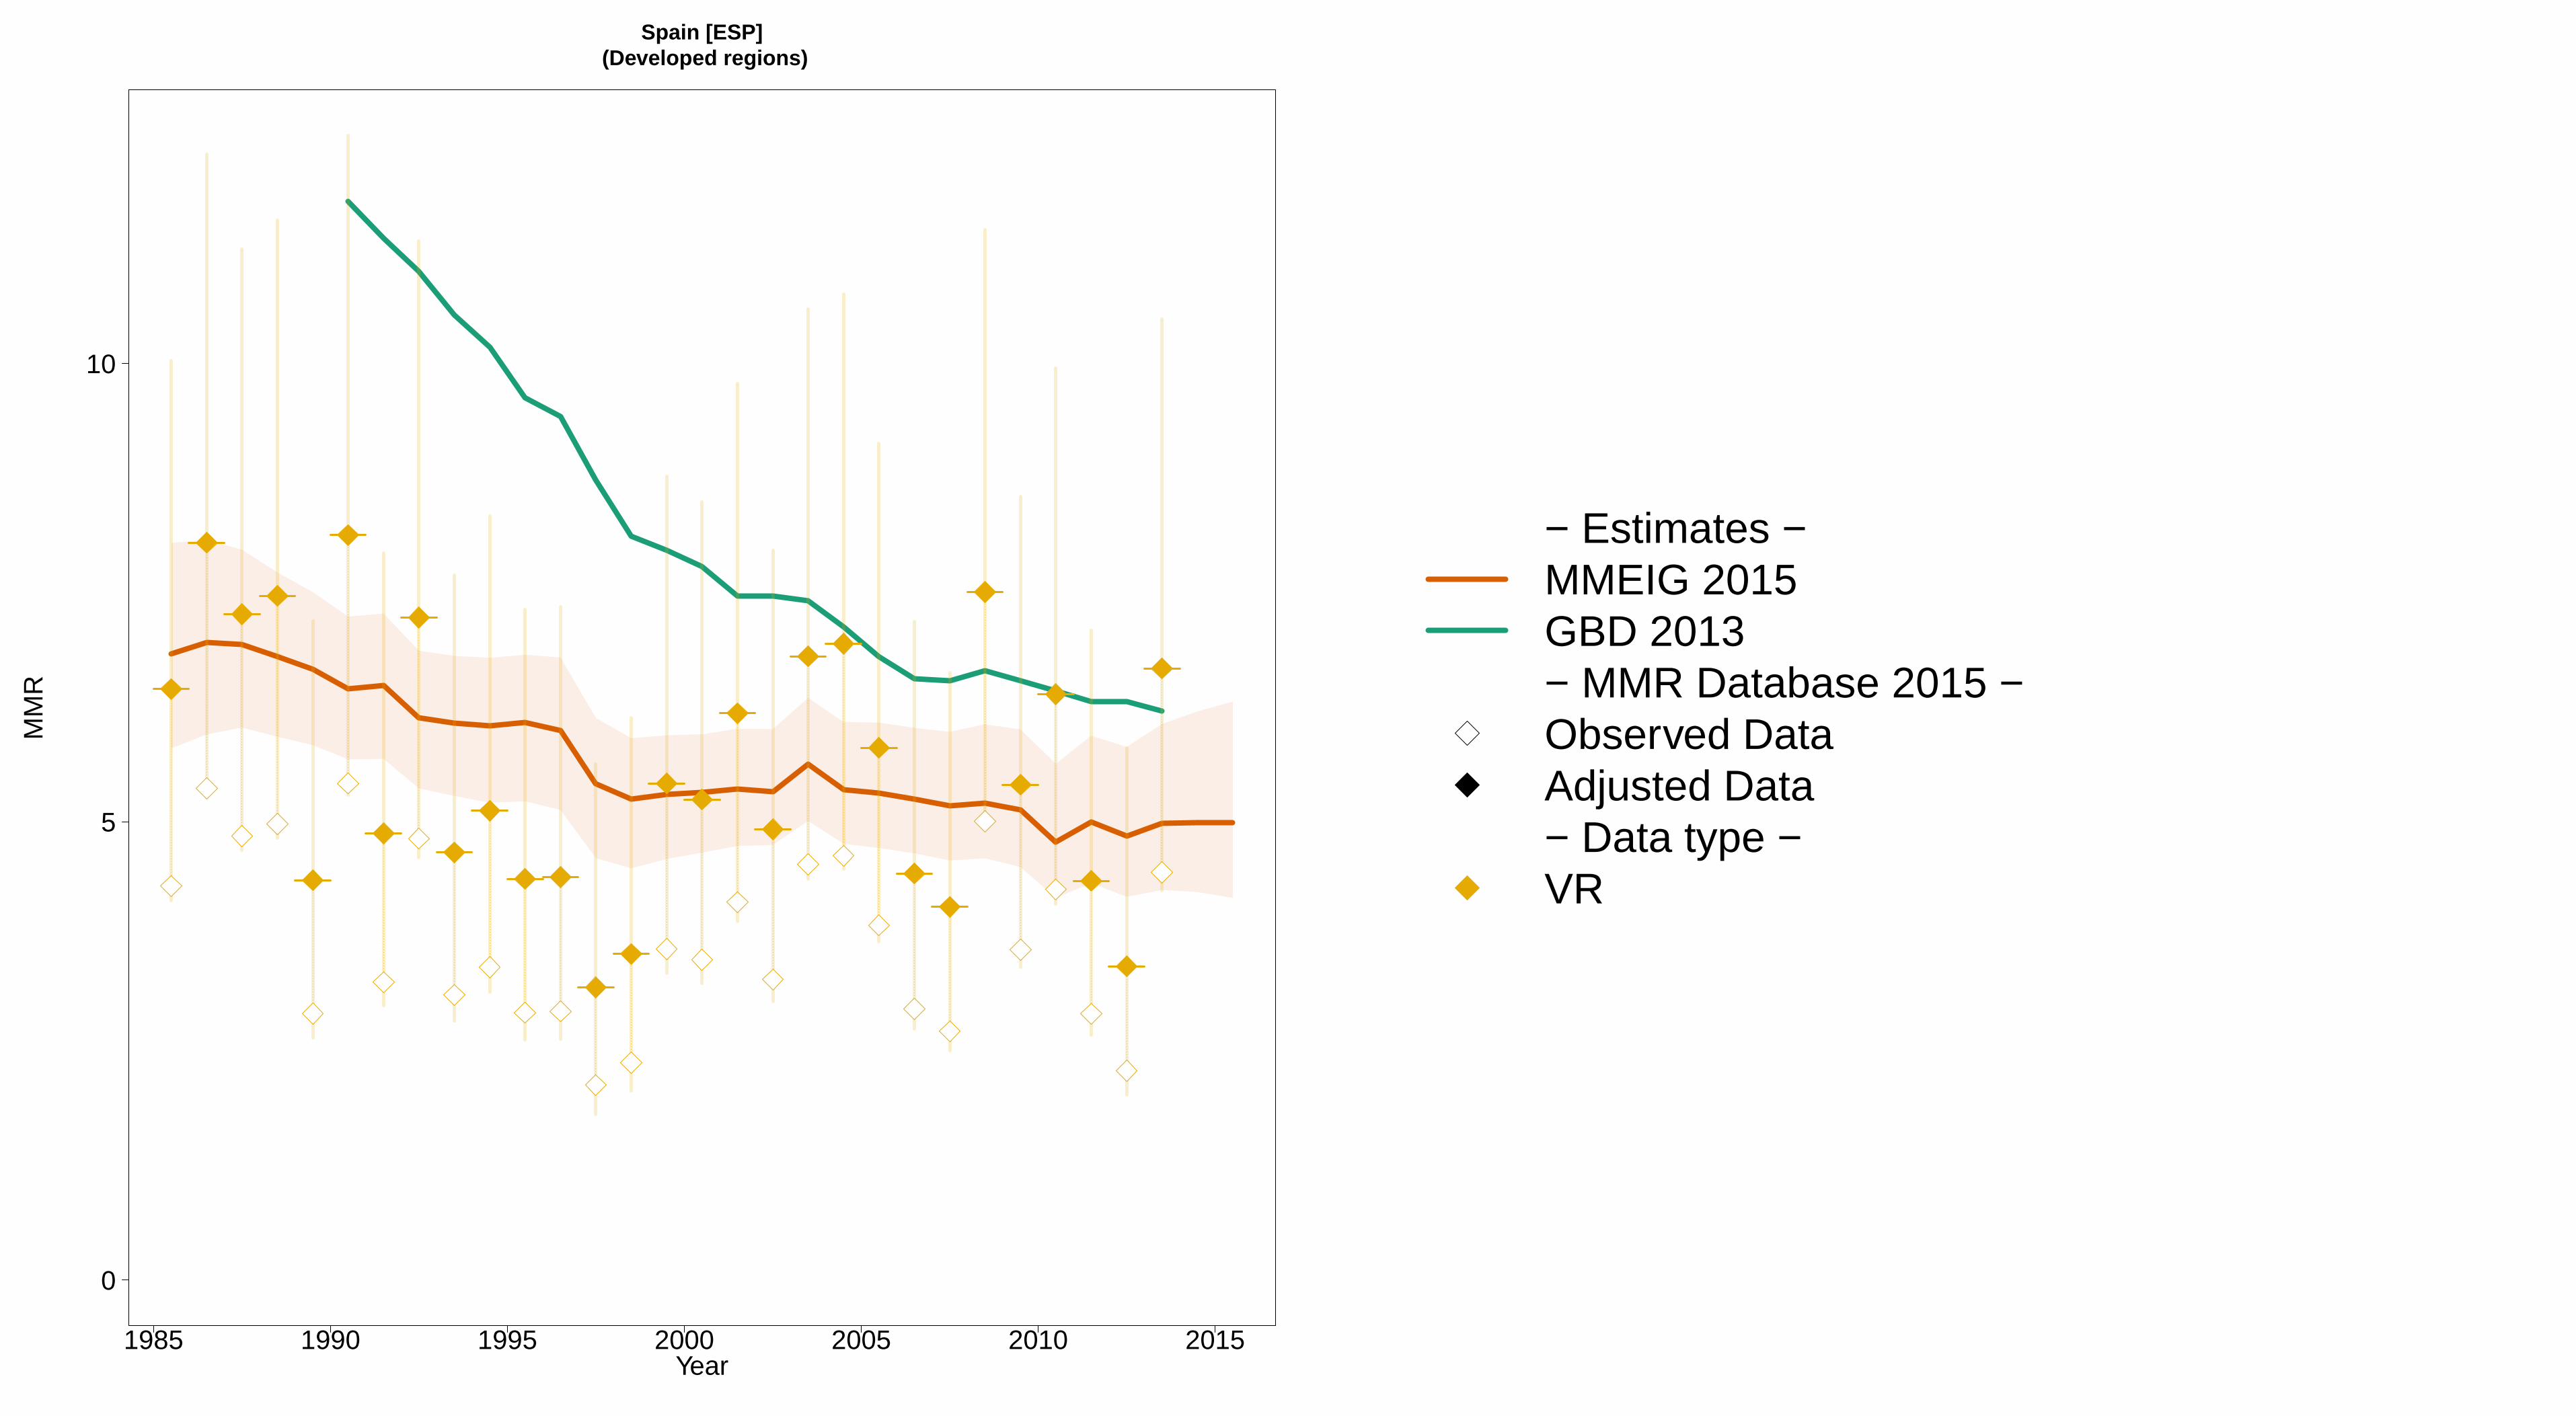
1985 1990 1995 2000 2005 2010 2015
Spain [ESP] (Developed regions)
Year
0
5
10
MM
R
− Estimates −MMEIG 2015GBD 2013− MMR Database 2015 −Observed DataAdjusted Data− Data type −VR

1985 1990 1995 2000 2005 2010 2015
Sri Lanka [LKA] (Southern Asia)
Year
0
50
100
MM
R
− Estimates −MMEIG 2015GBD 2013− MMR Database 2015 −Observed DataAdjusted Data− Data type −VRMisc. studies

1985 1990 1995 2000 2005 2010 2015
St Vincent and the Grenadines [VCT] (Caribbean)
Year
0
100
200
300
400
MM
R
− Estimates −
MMEIG 2015
GBD 2013
− MMR Database 2015 −
Observed Data
Adjusted Data
− Data type −
VRReported VR before recalc.(related to 0 obs. mat. death)

1985 1990 1995 2000 2005 2010 2015
Sudan [SDN] (Eastern Africa)
Year
0
500
1000
MM
R
− Estimates −MMEIG 2015GBD 2013− MMR Database 2015 −Observed DataAdjusted Data− Data type −CensusMisc. studies

1985 1990 1995 2000 2005 2010 2015
Suriname [SUR] (South America)
Year
0
100
200
300
400
500
600
700
MM
R
− Estimates −
MMEIG 2015
GBD 2013
− MMR Database 2015 −
Observed Data
Adjusted Data
− Data type −
VR
Spec. studiesExcluded VR data (overlap with specialized study)

1985 1990 1995 2000 2005 2010 2015
Swaziland [SWZ] (Southern Africa)
Year
0
500
1000
1500
MM
R
− Estimates −MMEIG 2015GBD 2013− MMR Database 2015 −Observed DataAdjusted Data− Data type −DHSCensus
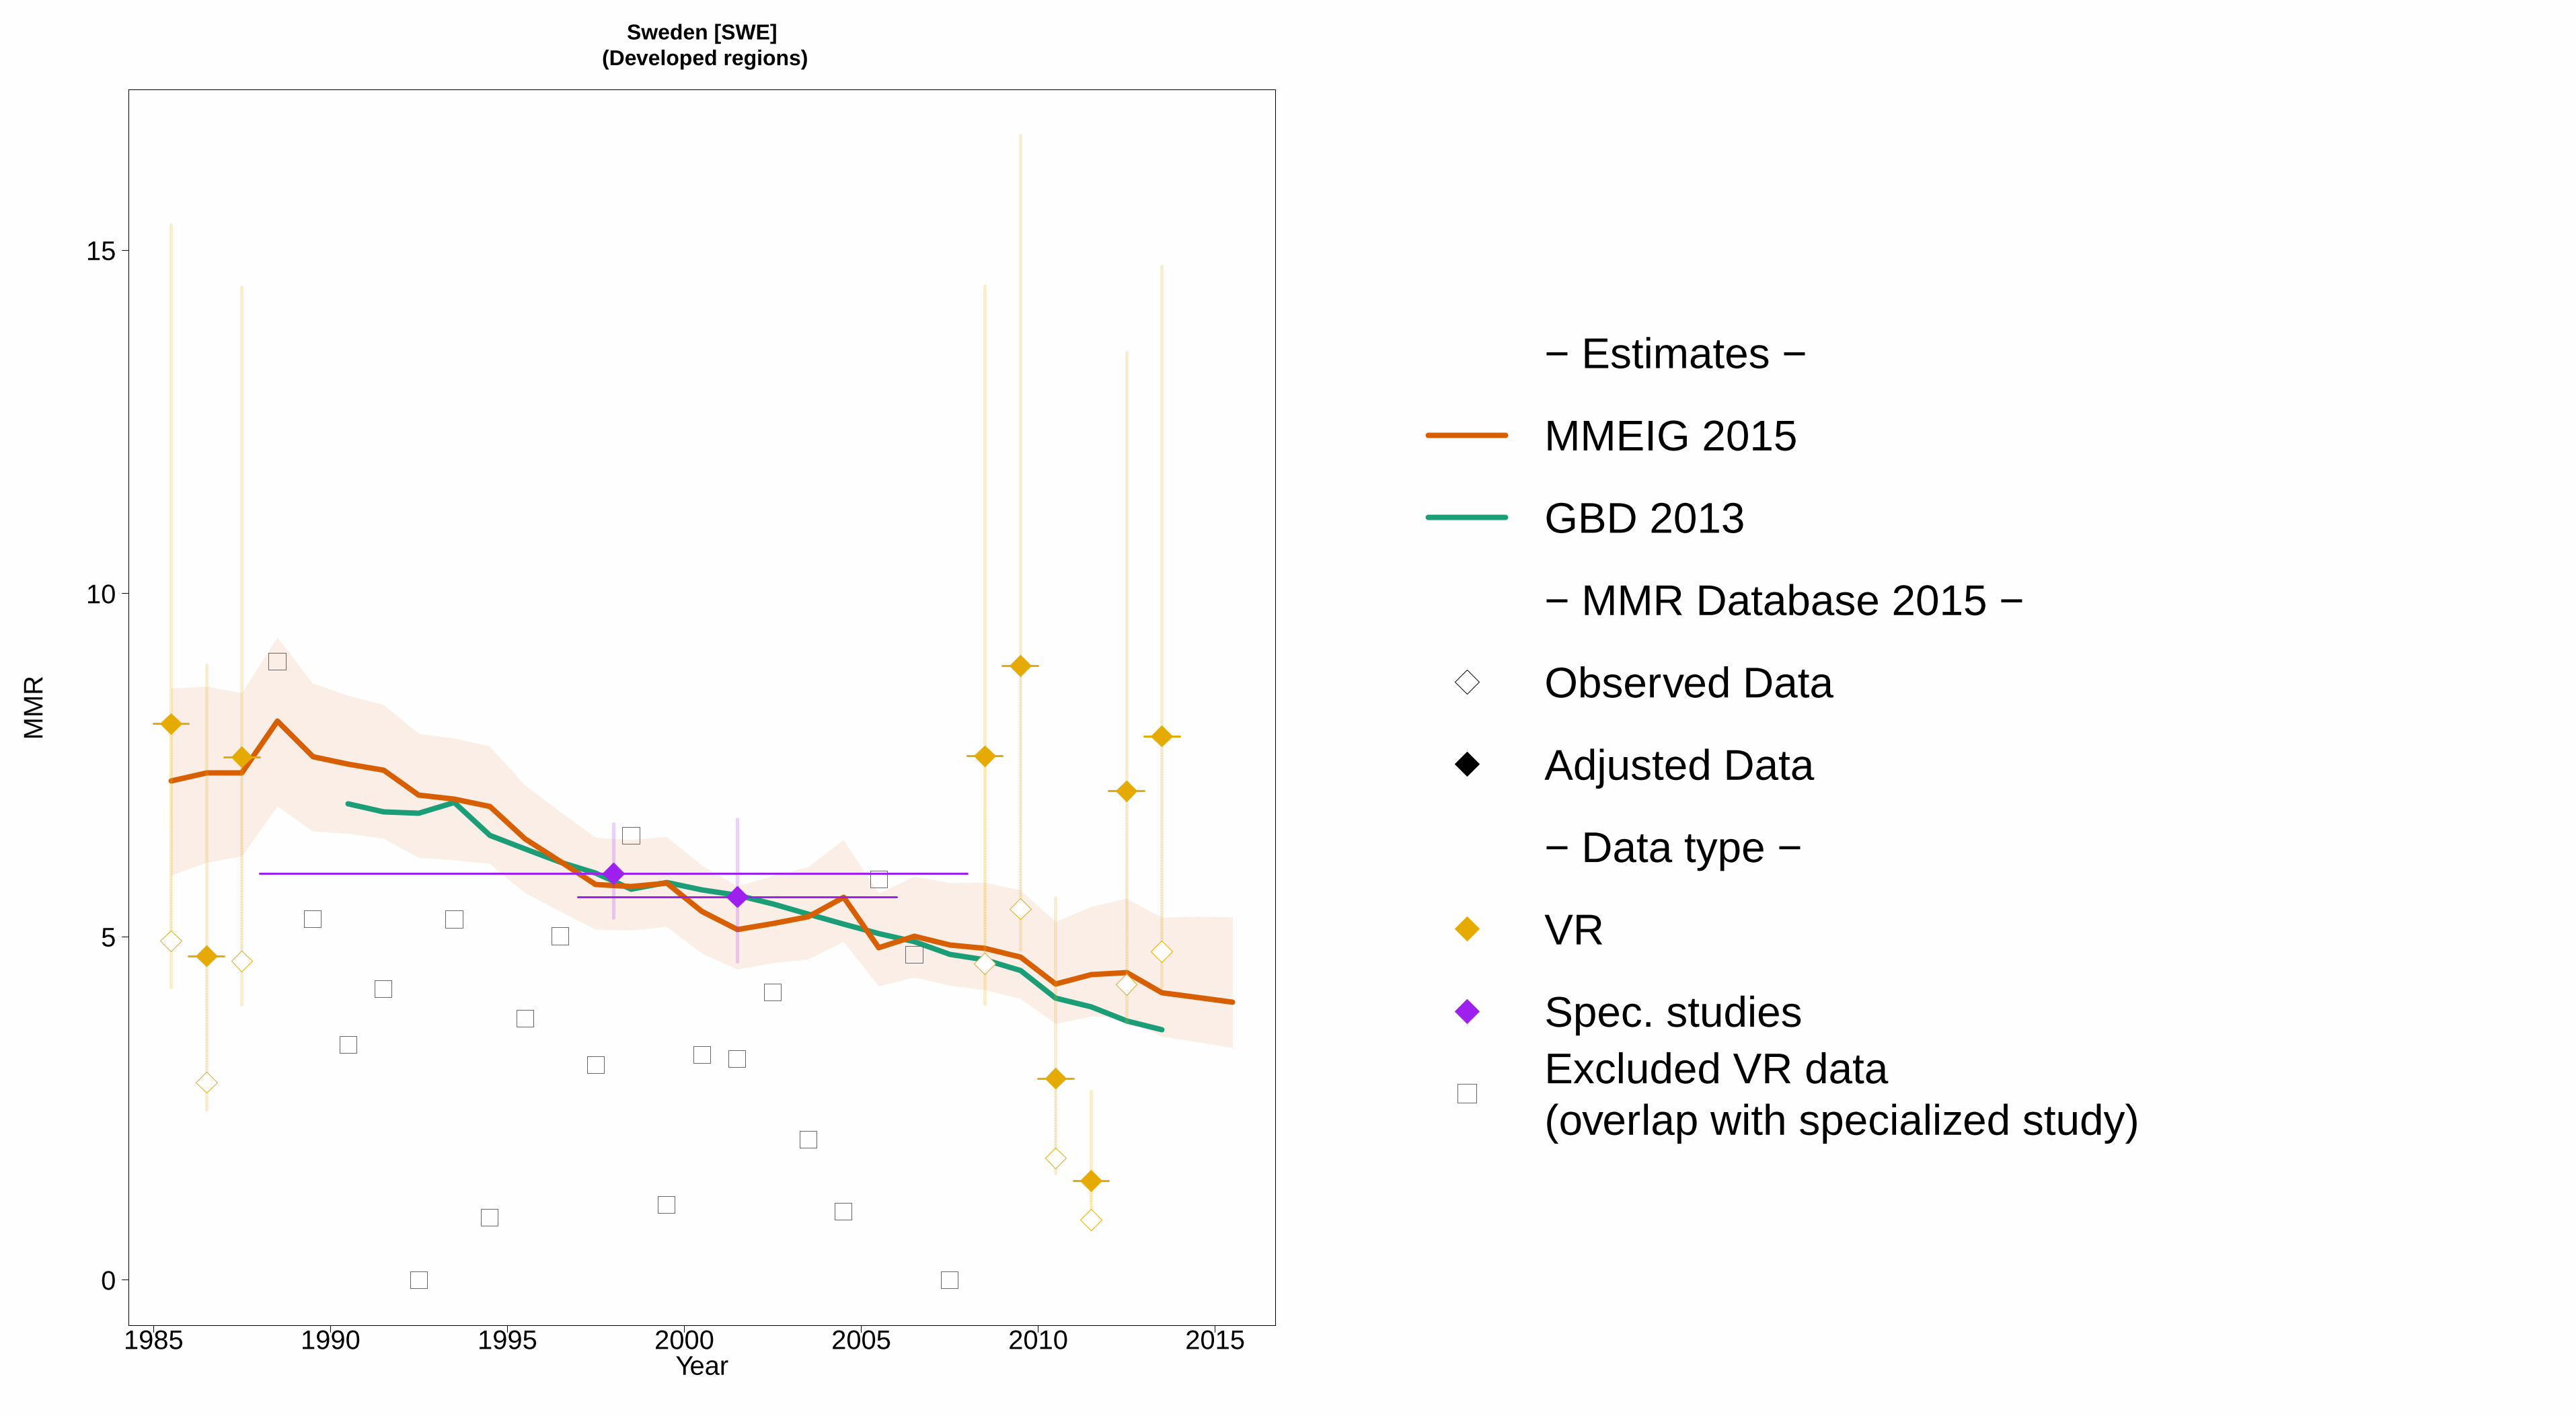
1985 1990 1995 2000 2005 2010 2015
Sweden [SWE] (Developed regions)
Year
0
5
10
15
MM
R
− Estimates −
MMEIG 2015
GBD 2013
− MMR Database 2015 −
Observed Data
Adjusted Data
− Data type −
VR
Spec. studiesExcluded VR data (overlap with specialized study)

1985 1990 1995 2000 2005 2010 2015
Switzerland [CHE] (Developed regions)
Year
0
5
10
15
20
25
MM
R
− Estimates −MMEIG 2015GBD 2013− MMR Database 2015 −Observed DataAdjusted Data− Data type −VR

1985 1990 1995 2000 2005 2010 2015
Syrian Arab Republic [SYR] (Western Asia)
Year
0
50
100
150
200
250
MM
R
●
− Estimates −
MMEIG 2015
GBD 2013
− MMR Database 2015 −
Observed Data
Adjusted Data
− Data type −
Misc. studiesExcluded VR data (data quality issues)
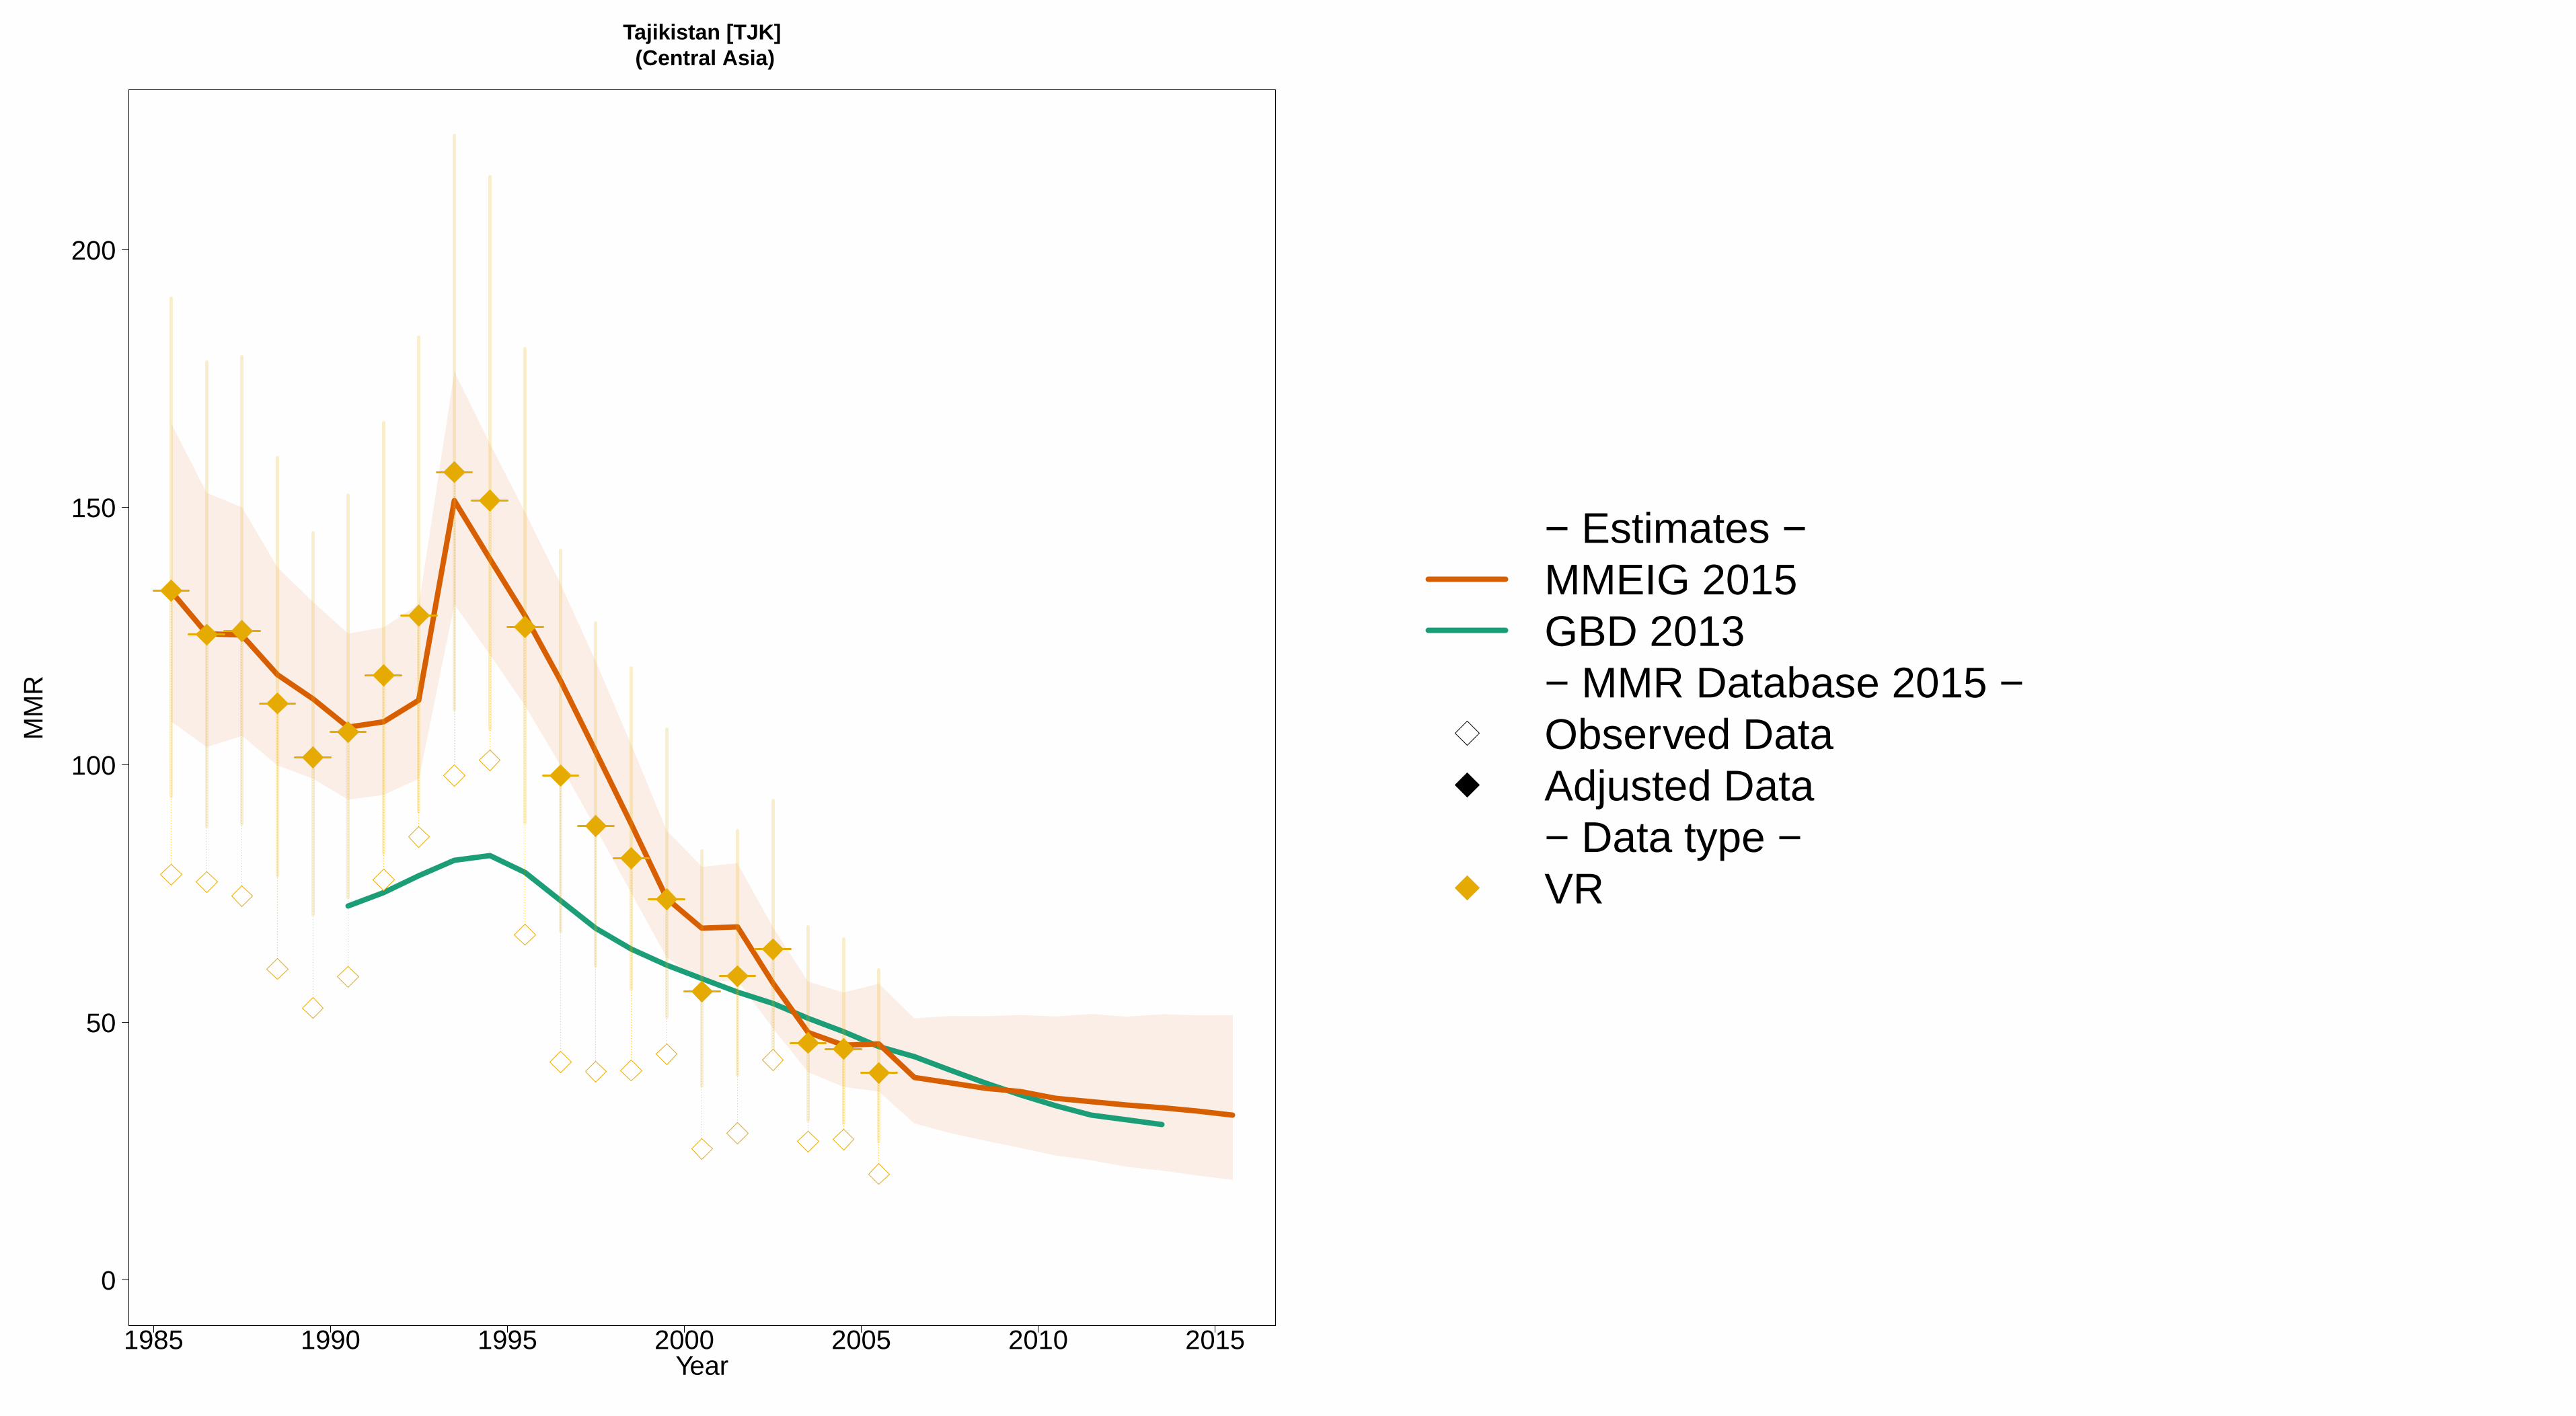
1985 1990 1995 2000 2005 2010 2015
Tajikistan [TJK] (Central Asia)
Year
0
50
100
150
200
MM
R
− Estimates −MMEIG 2015GBD 2013− MMR Database 2015 −Observed DataAdjusted Data− Data type −VR

1985 1990 1995 2000 2005 2010 2015
Tanzania [TZA] (Eastern Africa)
Year
0
500
1000
1500
MM
R
− Estimates −MMEIG 2015GBD 2013− MMR Database 2015 −Observed DataAdjusted Data− Data type −DHS

1985 1990 1995 2000 2005 2010 2015
TFYR Macedonia [MKD] (Transition countries of South−Eastern Europe)
Year
0
10
20
30
40
MM
R
− Estimates −
MMEIG 2015
GBD 2013
− MMR Database 2015 −
Observed Data
Adjusted Data
− Data type −
VRReported VR before recalc.(related to 0 obs. mat. death)

1985 1990 1995 2000 2005 2010 2015
Thailand [THA] (South−Eastern Asia / Oceania)
Year
0
50
100
MM
R
− Estimates −MMEIG 2015GBD 2013− MMR Database 2015 −Observed DataAdjusted Data− Data type −VRMisc. studies

1985 1990 1995 2000 2005 2010 2015
Timor−Leste [TLS] (South−Eastern Asia / Oceania)
Year
0
500
1000
1500
2000
MM
R
− Estimates −MMEIG 2015GBD 2013− MMR Database 2015 −Observed DataAdjusted Data− Data type −DHSCensus

1985 1990 1995 2000 2005 2010 2015
Togo [TGO] (Western Africa)
Year
0
100
200
300
400
500
600
700
800
900
MM
R
− Estimates −MMEIG 2015GBD 2013− MMR Database 2015 −Observed DataAdjusted Data− Data type −DHSMisc. studies

1985 1990 1995 2000 2005 2010 2015
Tonga [TON] (South−Eastern Asia / Oceania)
Year
0
50
100
150
200
250
MM
R
− Estimates −MMEIG 2015GBD 2013− MMR Database 2015 −
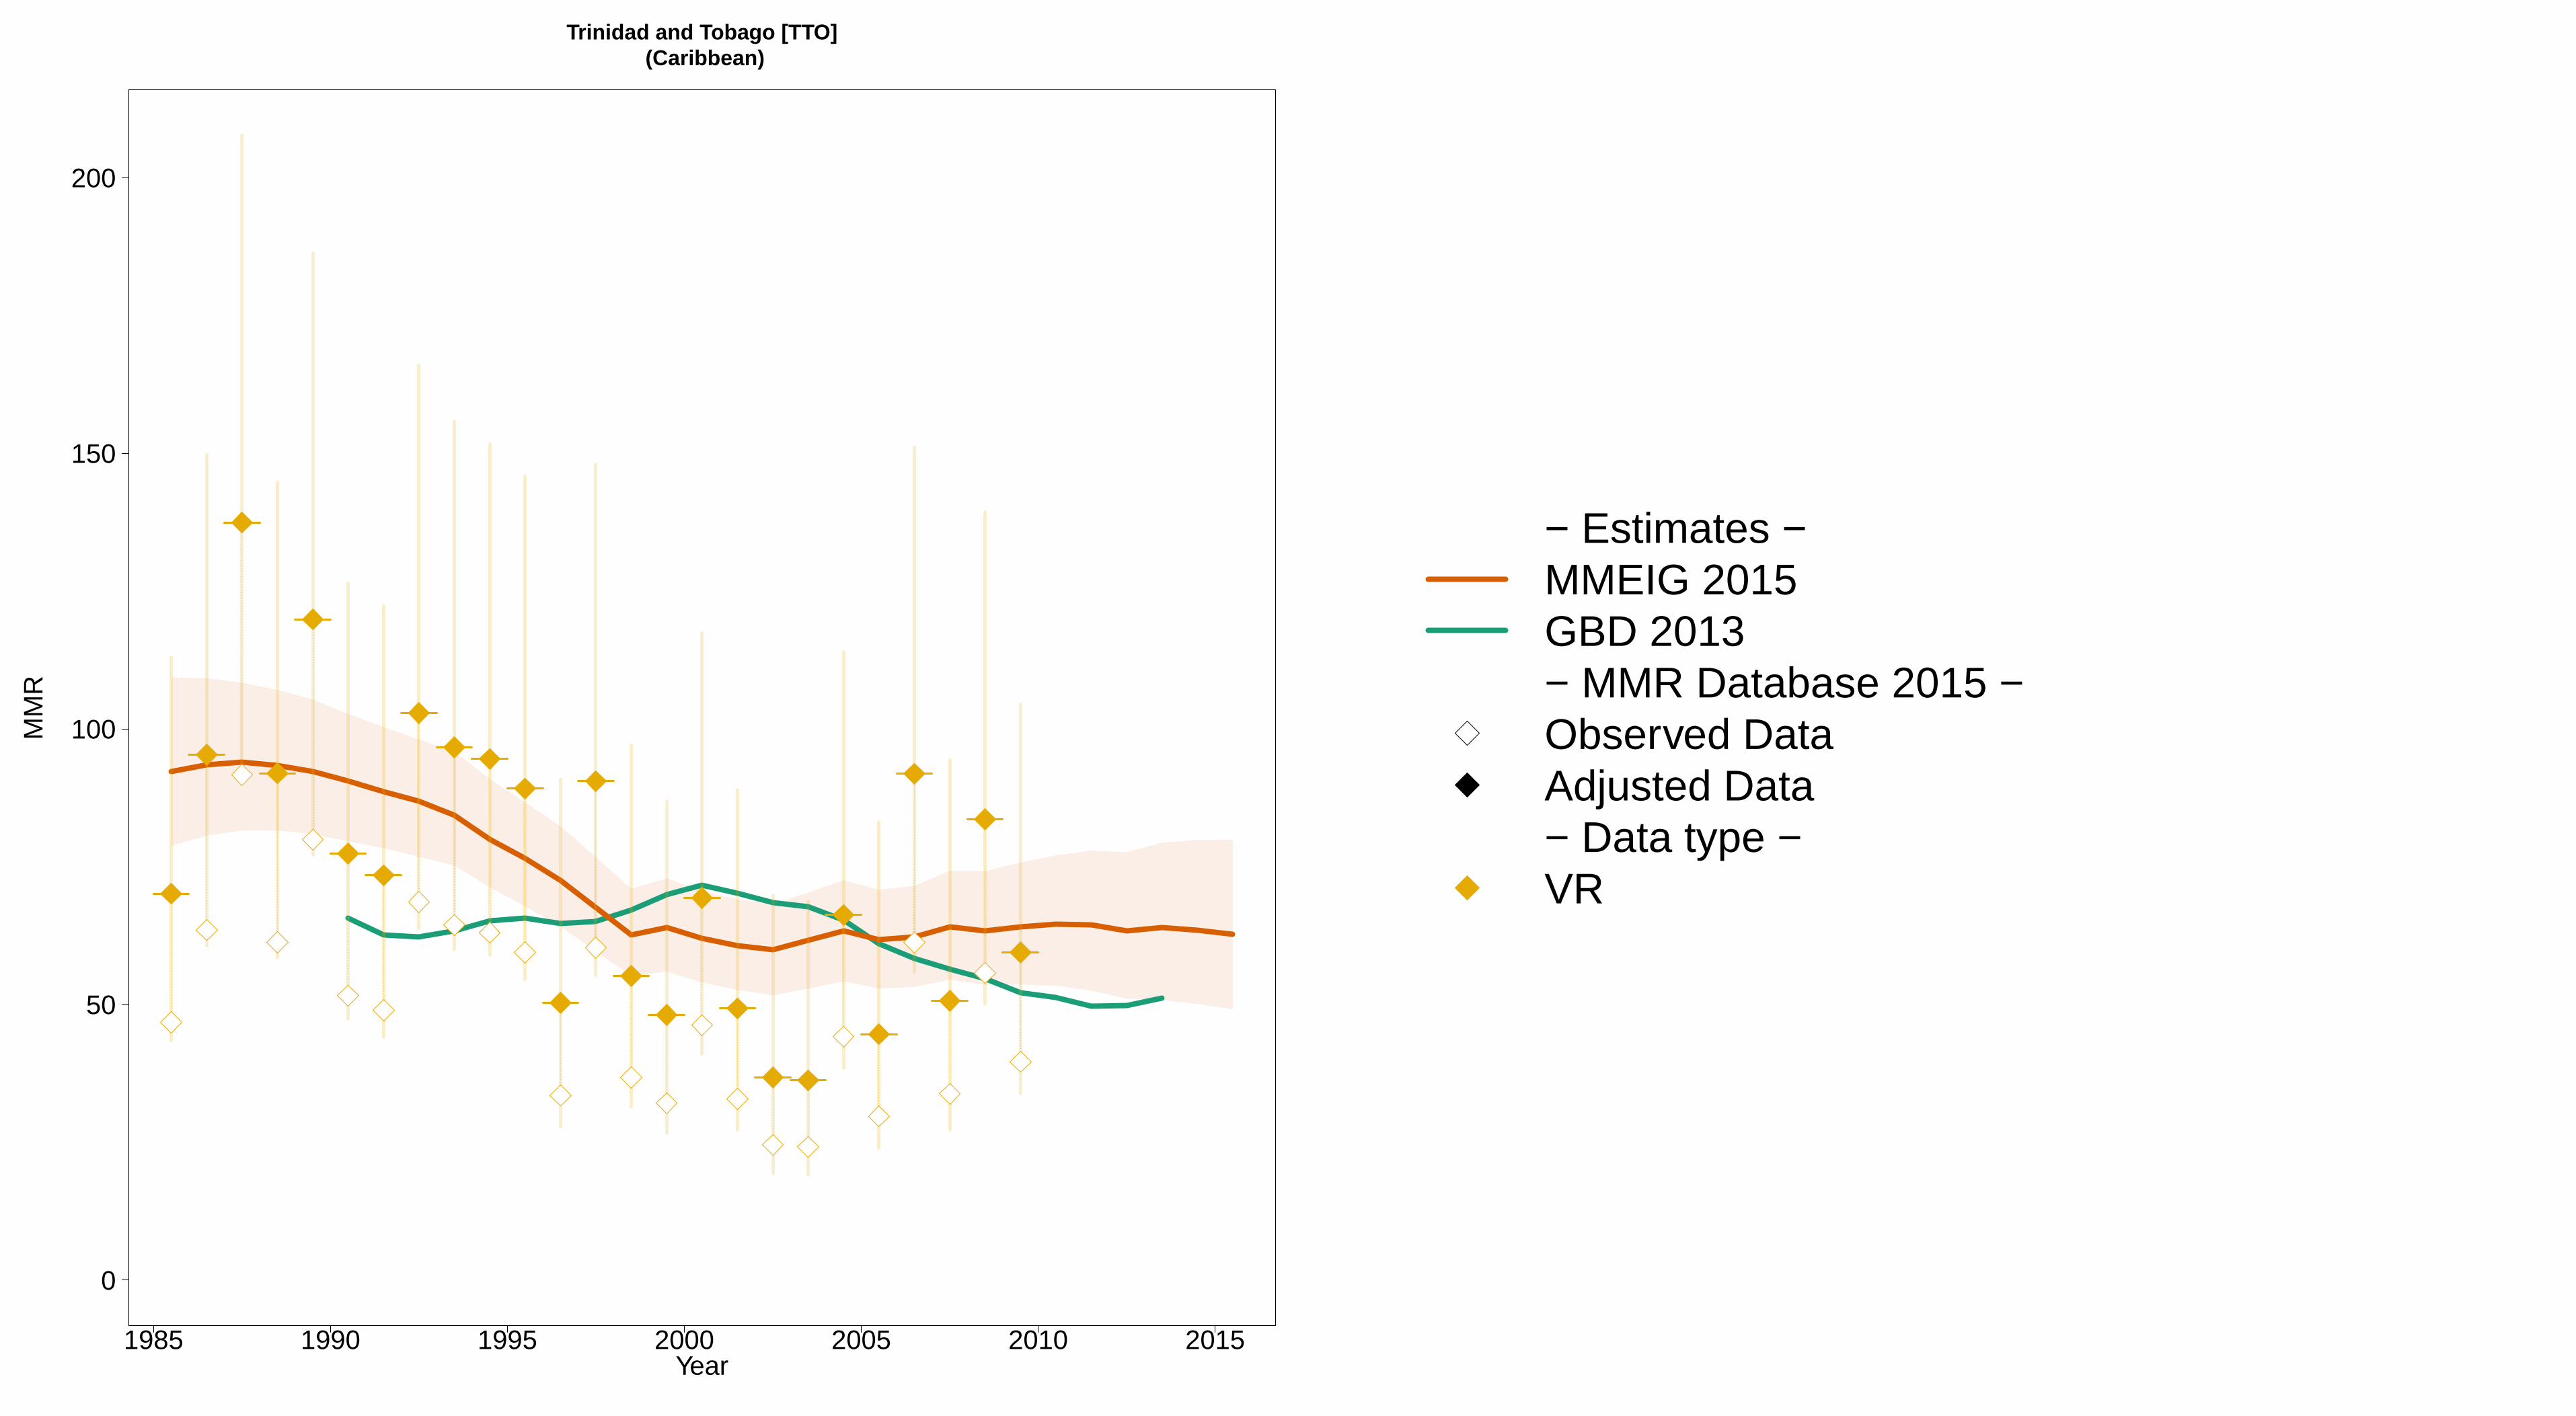
1985 1990 1995 2000 2005 2010 2015
Trinidad and Tobago [TTO] (Caribbean)
Year
0
50
100
150
200
MM
R
− Estimates −MMEIG 2015GBD 2013− MMR Database 2015 −Observed DataAdjusted Data− Data type −VR
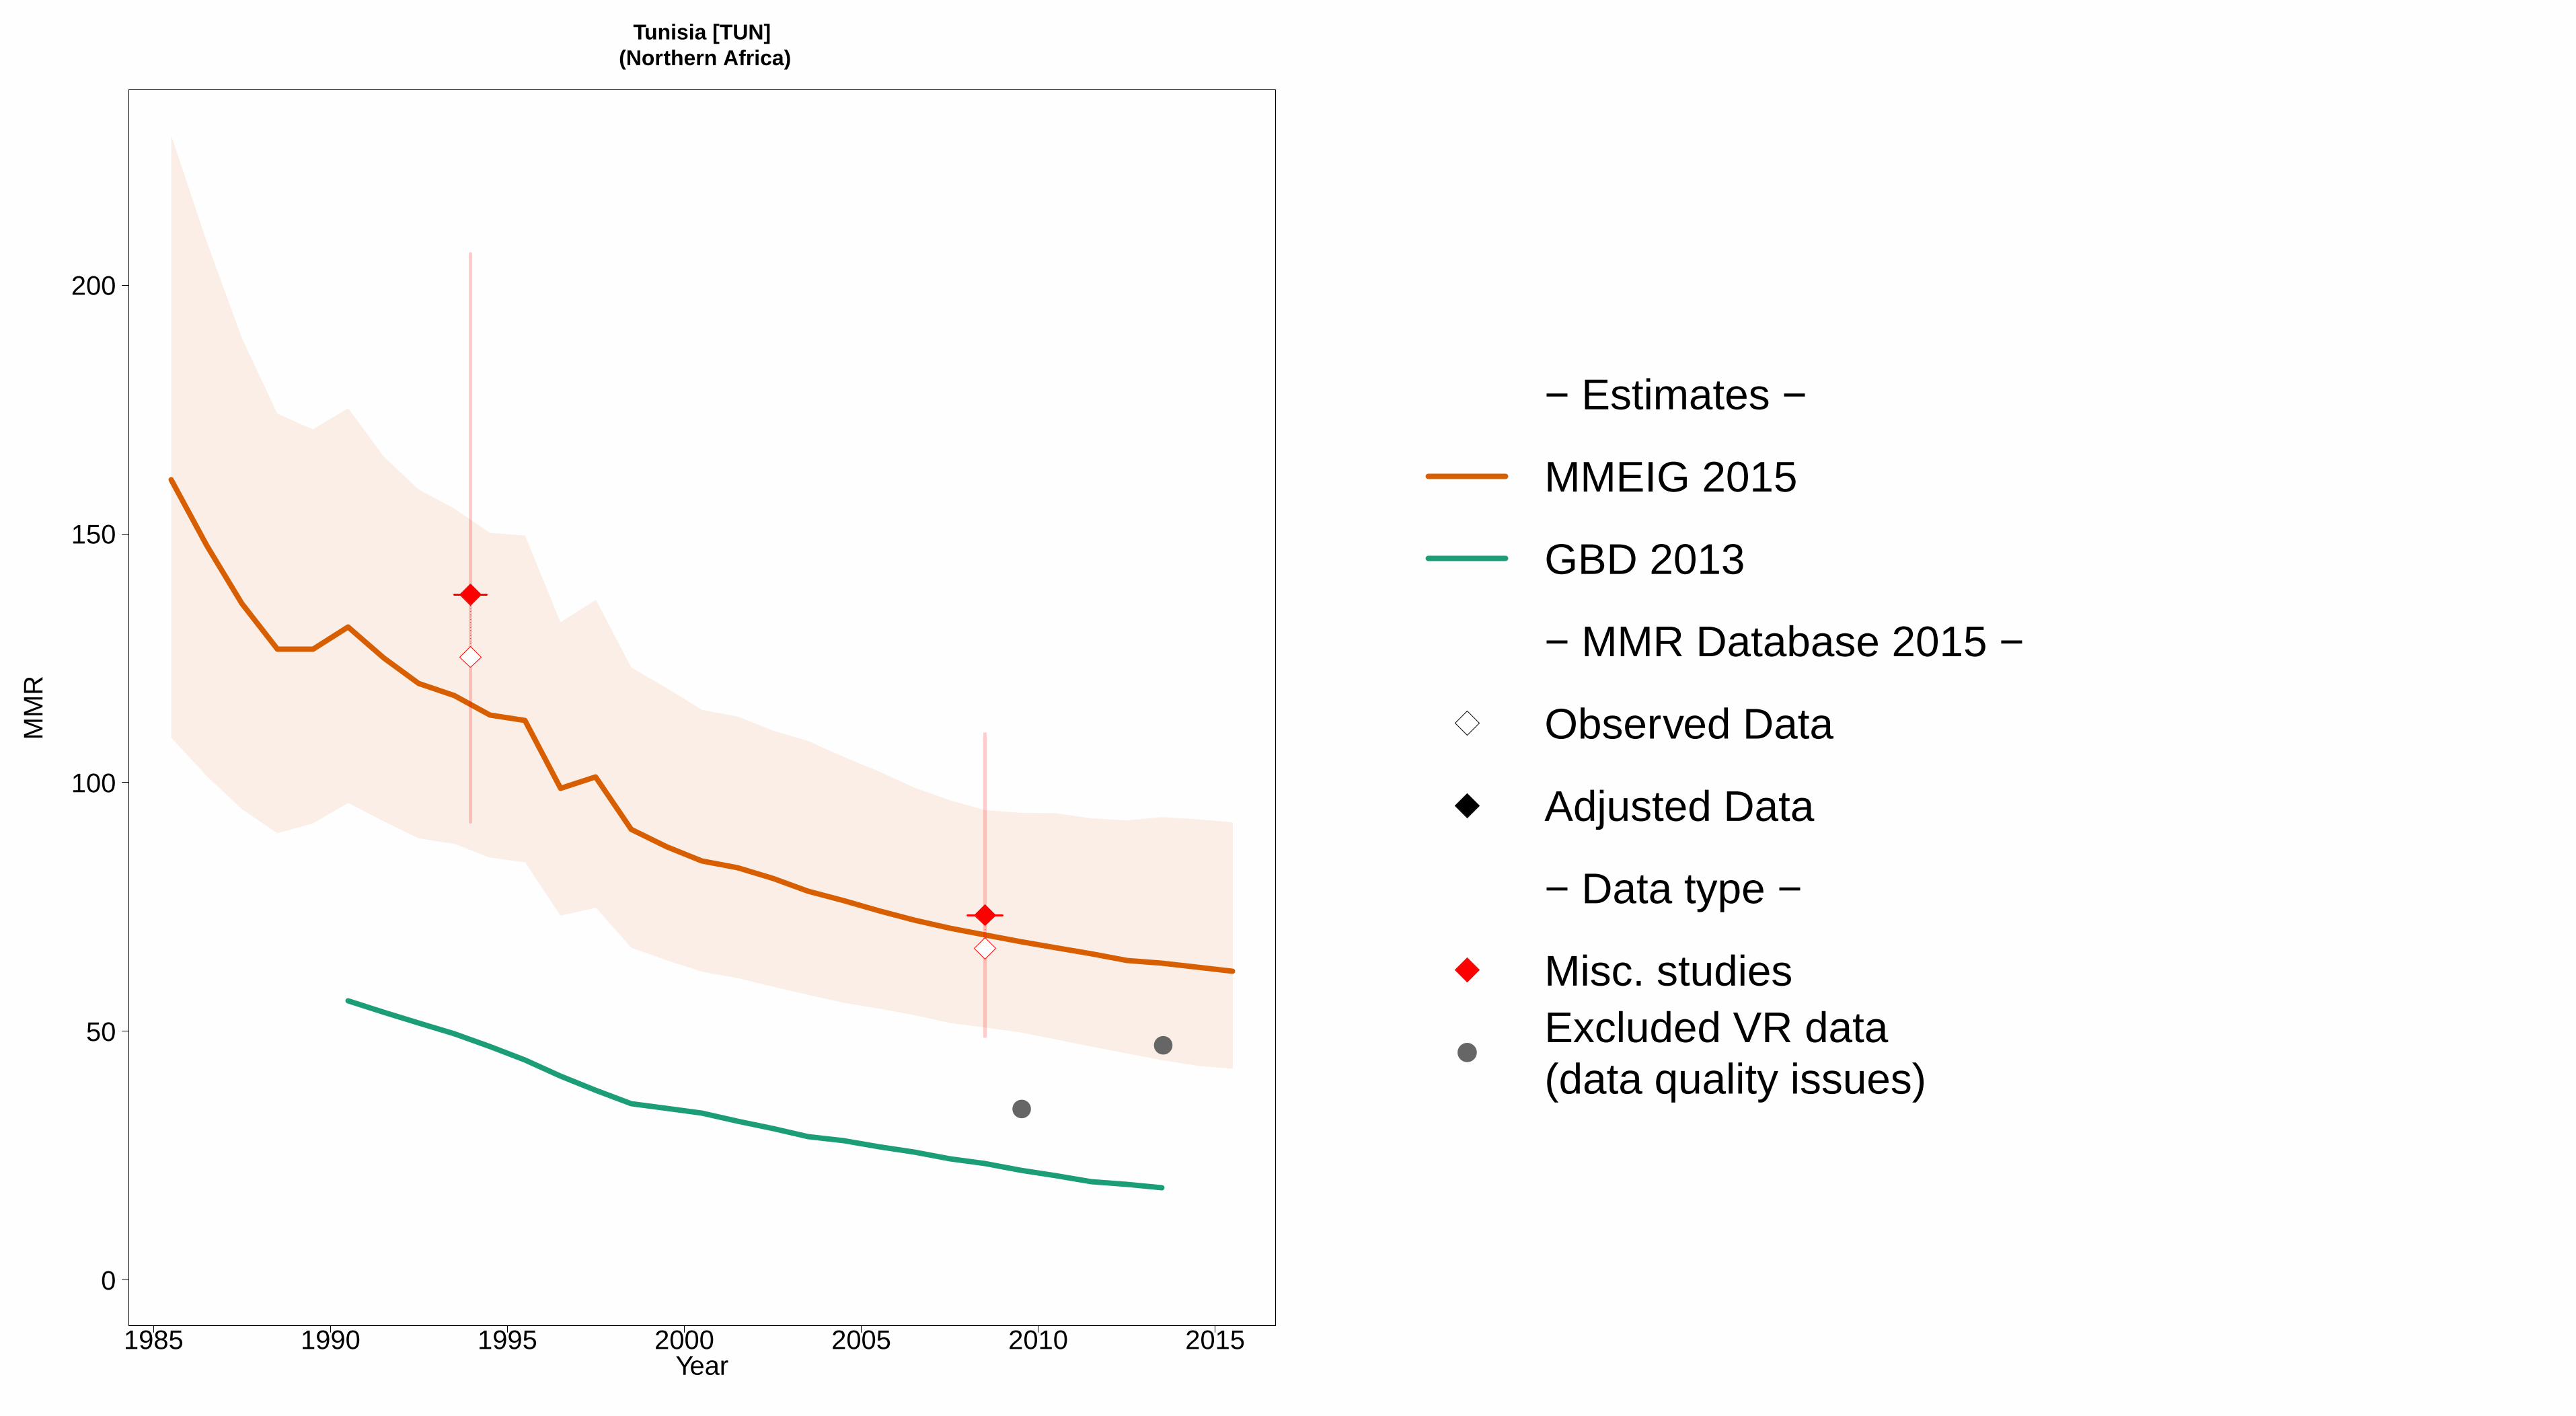
1985 1990 1995 2000 2005 2010 2015
Tunisia [TUN] (Northern Africa)
Year
0
50
100
150
200
MM
R
●
●
− Estimates −
MMEIG 2015
GBD 2013
− MMR Database 2015 −
Observed Data
Adjusted Data
− Data type −
Misc. studiesExcluded VR data (data quality issues)

1985 1990 1995 2000 2005 2010 2015
Turkey [TUR] (Western Asia)
Year
0
50
100
150
200
MM
R
● ●● ●
●
− Estimates −
MMEIG 2015
GBD 2013
− MMR Database 2015 −
Observed Data
Adjusted Data
− Data type −
Spec. studies
Misc. studiesExcluded VR data (data quality issues)

1985 1990 1995 2000 2005 2010 2015
Turkmenistan [TKM] (Central Asia)
Year
0
50
100
150
MM
R
●
− Estimates −
MMEIG 2015
GBD 2013
− MMR Database 2015 −
Observed Data
Adjusted Data
− Data type −
VRExcluded VR data (data quality issues)

1985 1990 1995 2000 2005 2010 2015
Uganda [UGA] (Eastern Africa)
Year
0
100
200
300
400
500
600
700
800
900
1000
MM
R
− Estimates −MMEIG 2015GBD 2013− MMR Database 2015 −Observed DataAdjusted Data− Data type −DHS
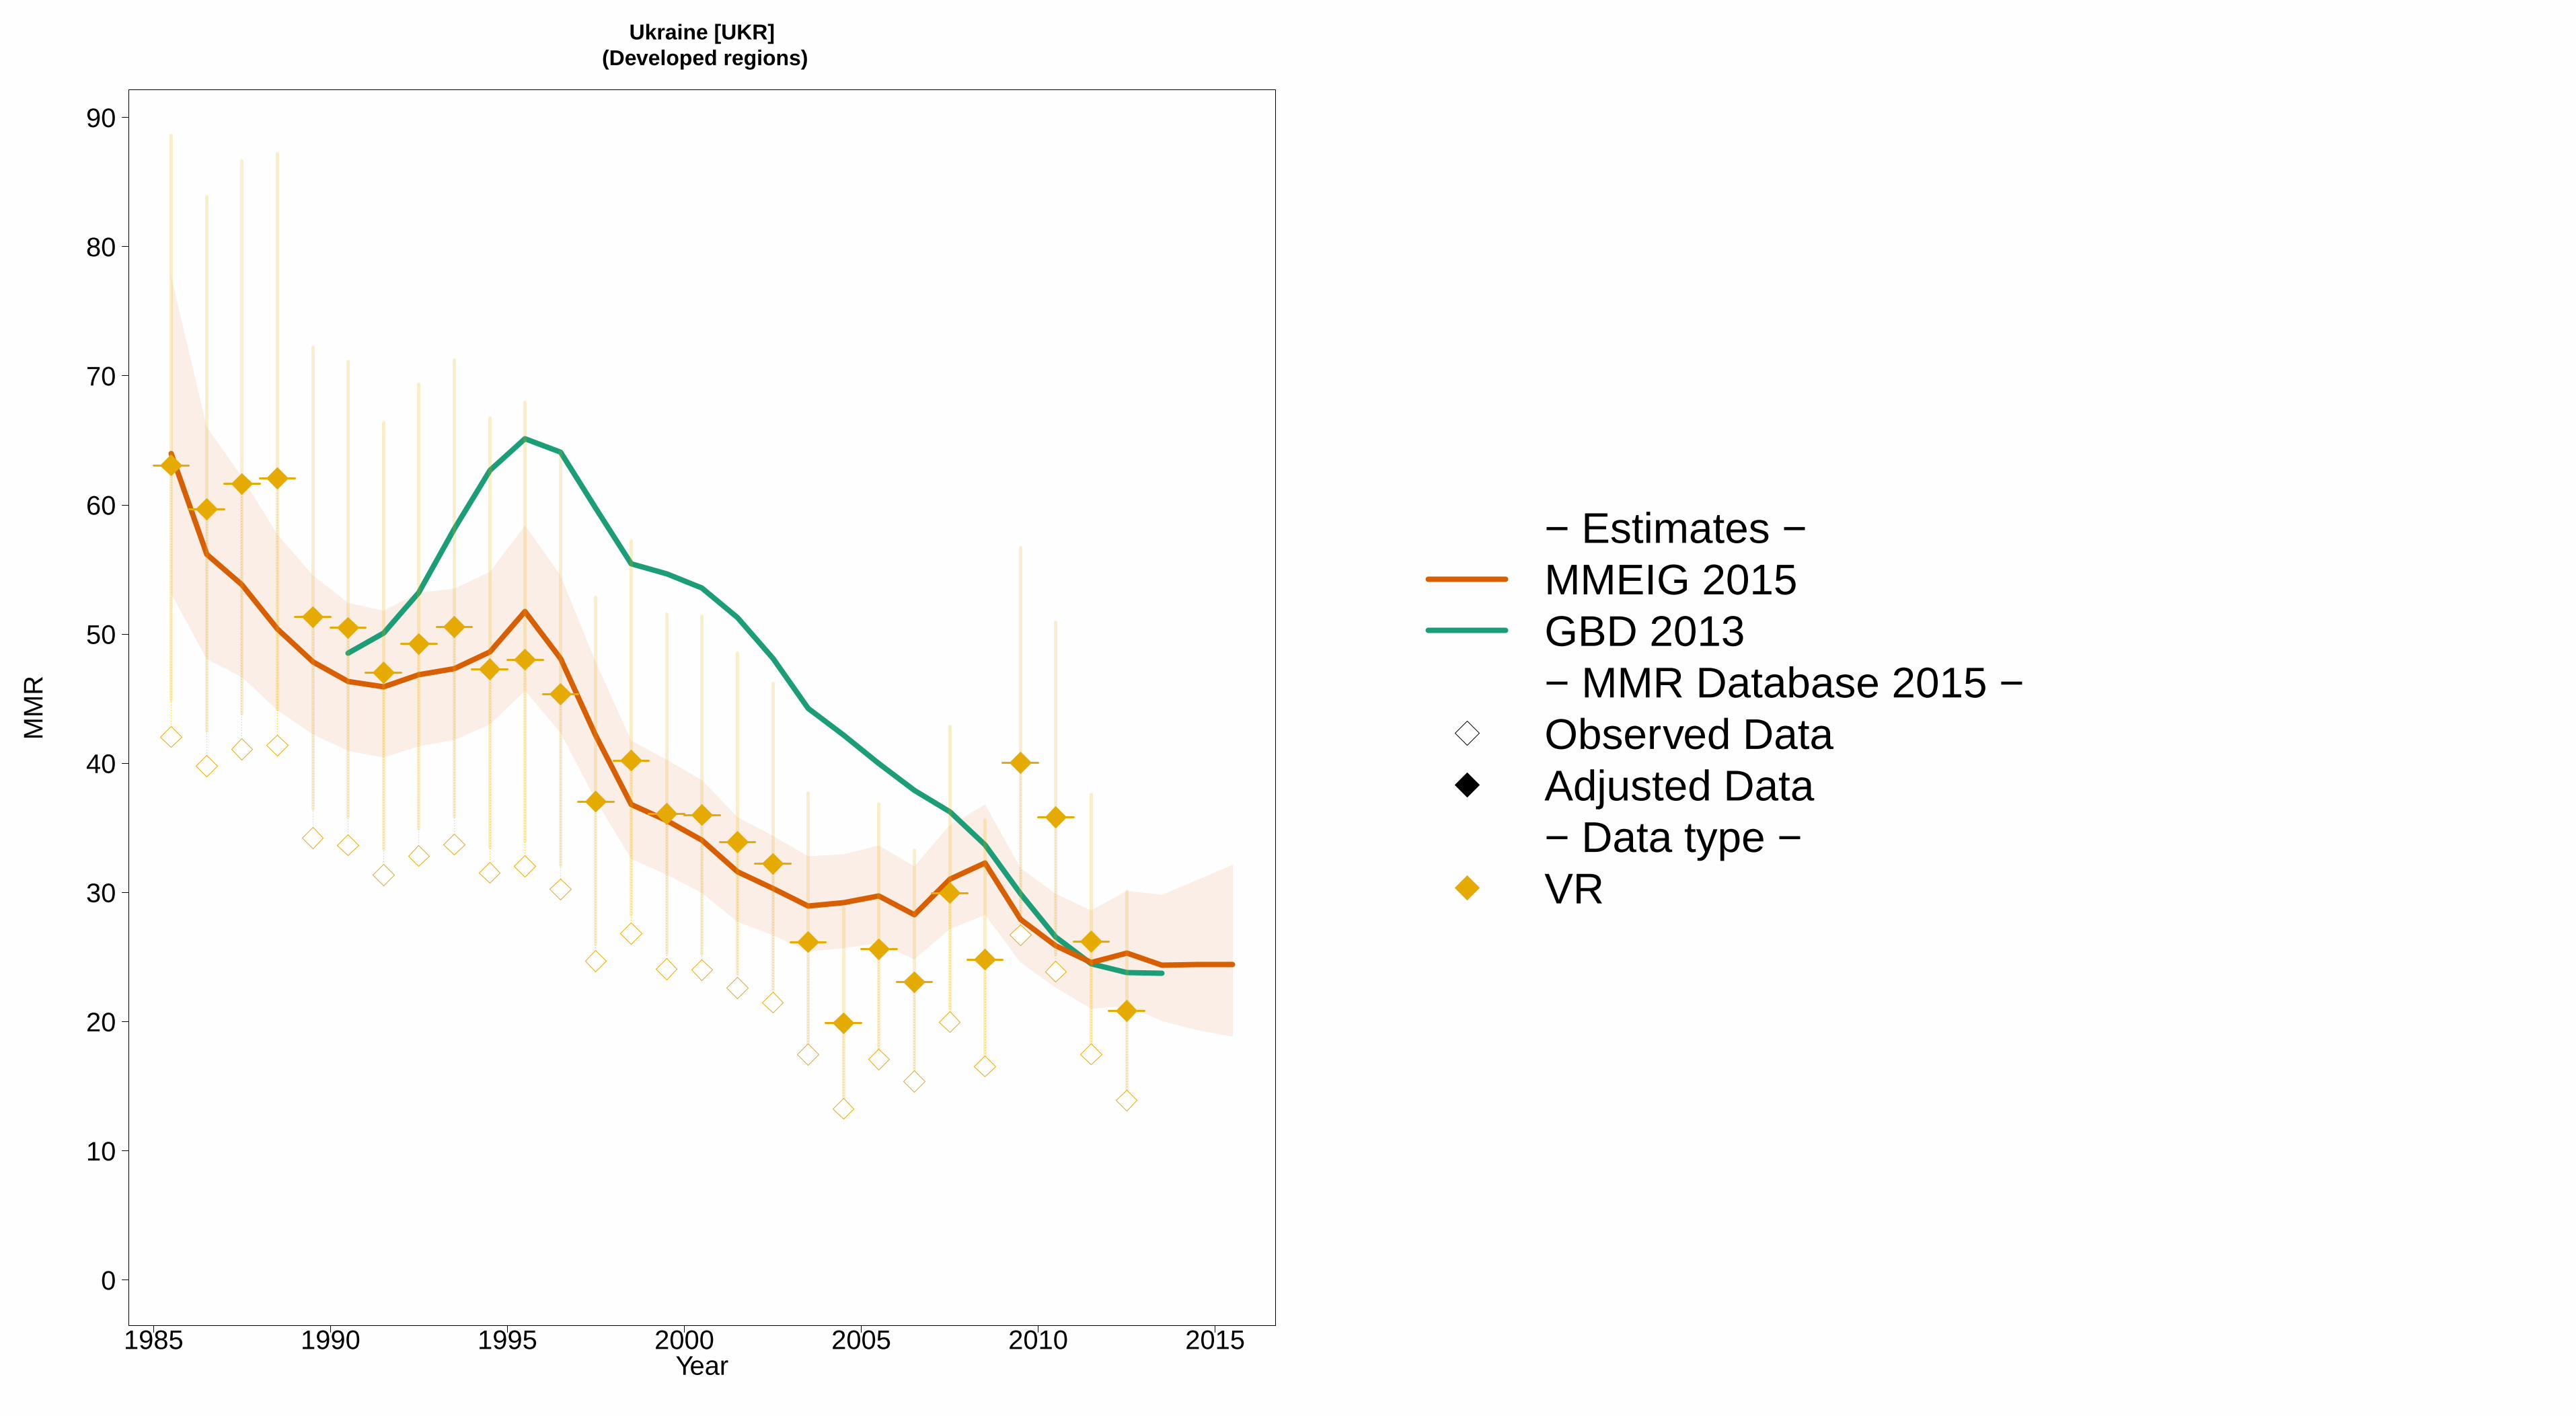
1985 1990 1995 2000 2005 2010 2015
Ukraine [UKR] (Developed regions)
Year
0
10
20
30
40
50
60
70
80
90
MM
R
− Estimates −MMEIG 2015GBD 2013− MMR Database 2015 −Observed DataAdjusted Data− Data type −VR
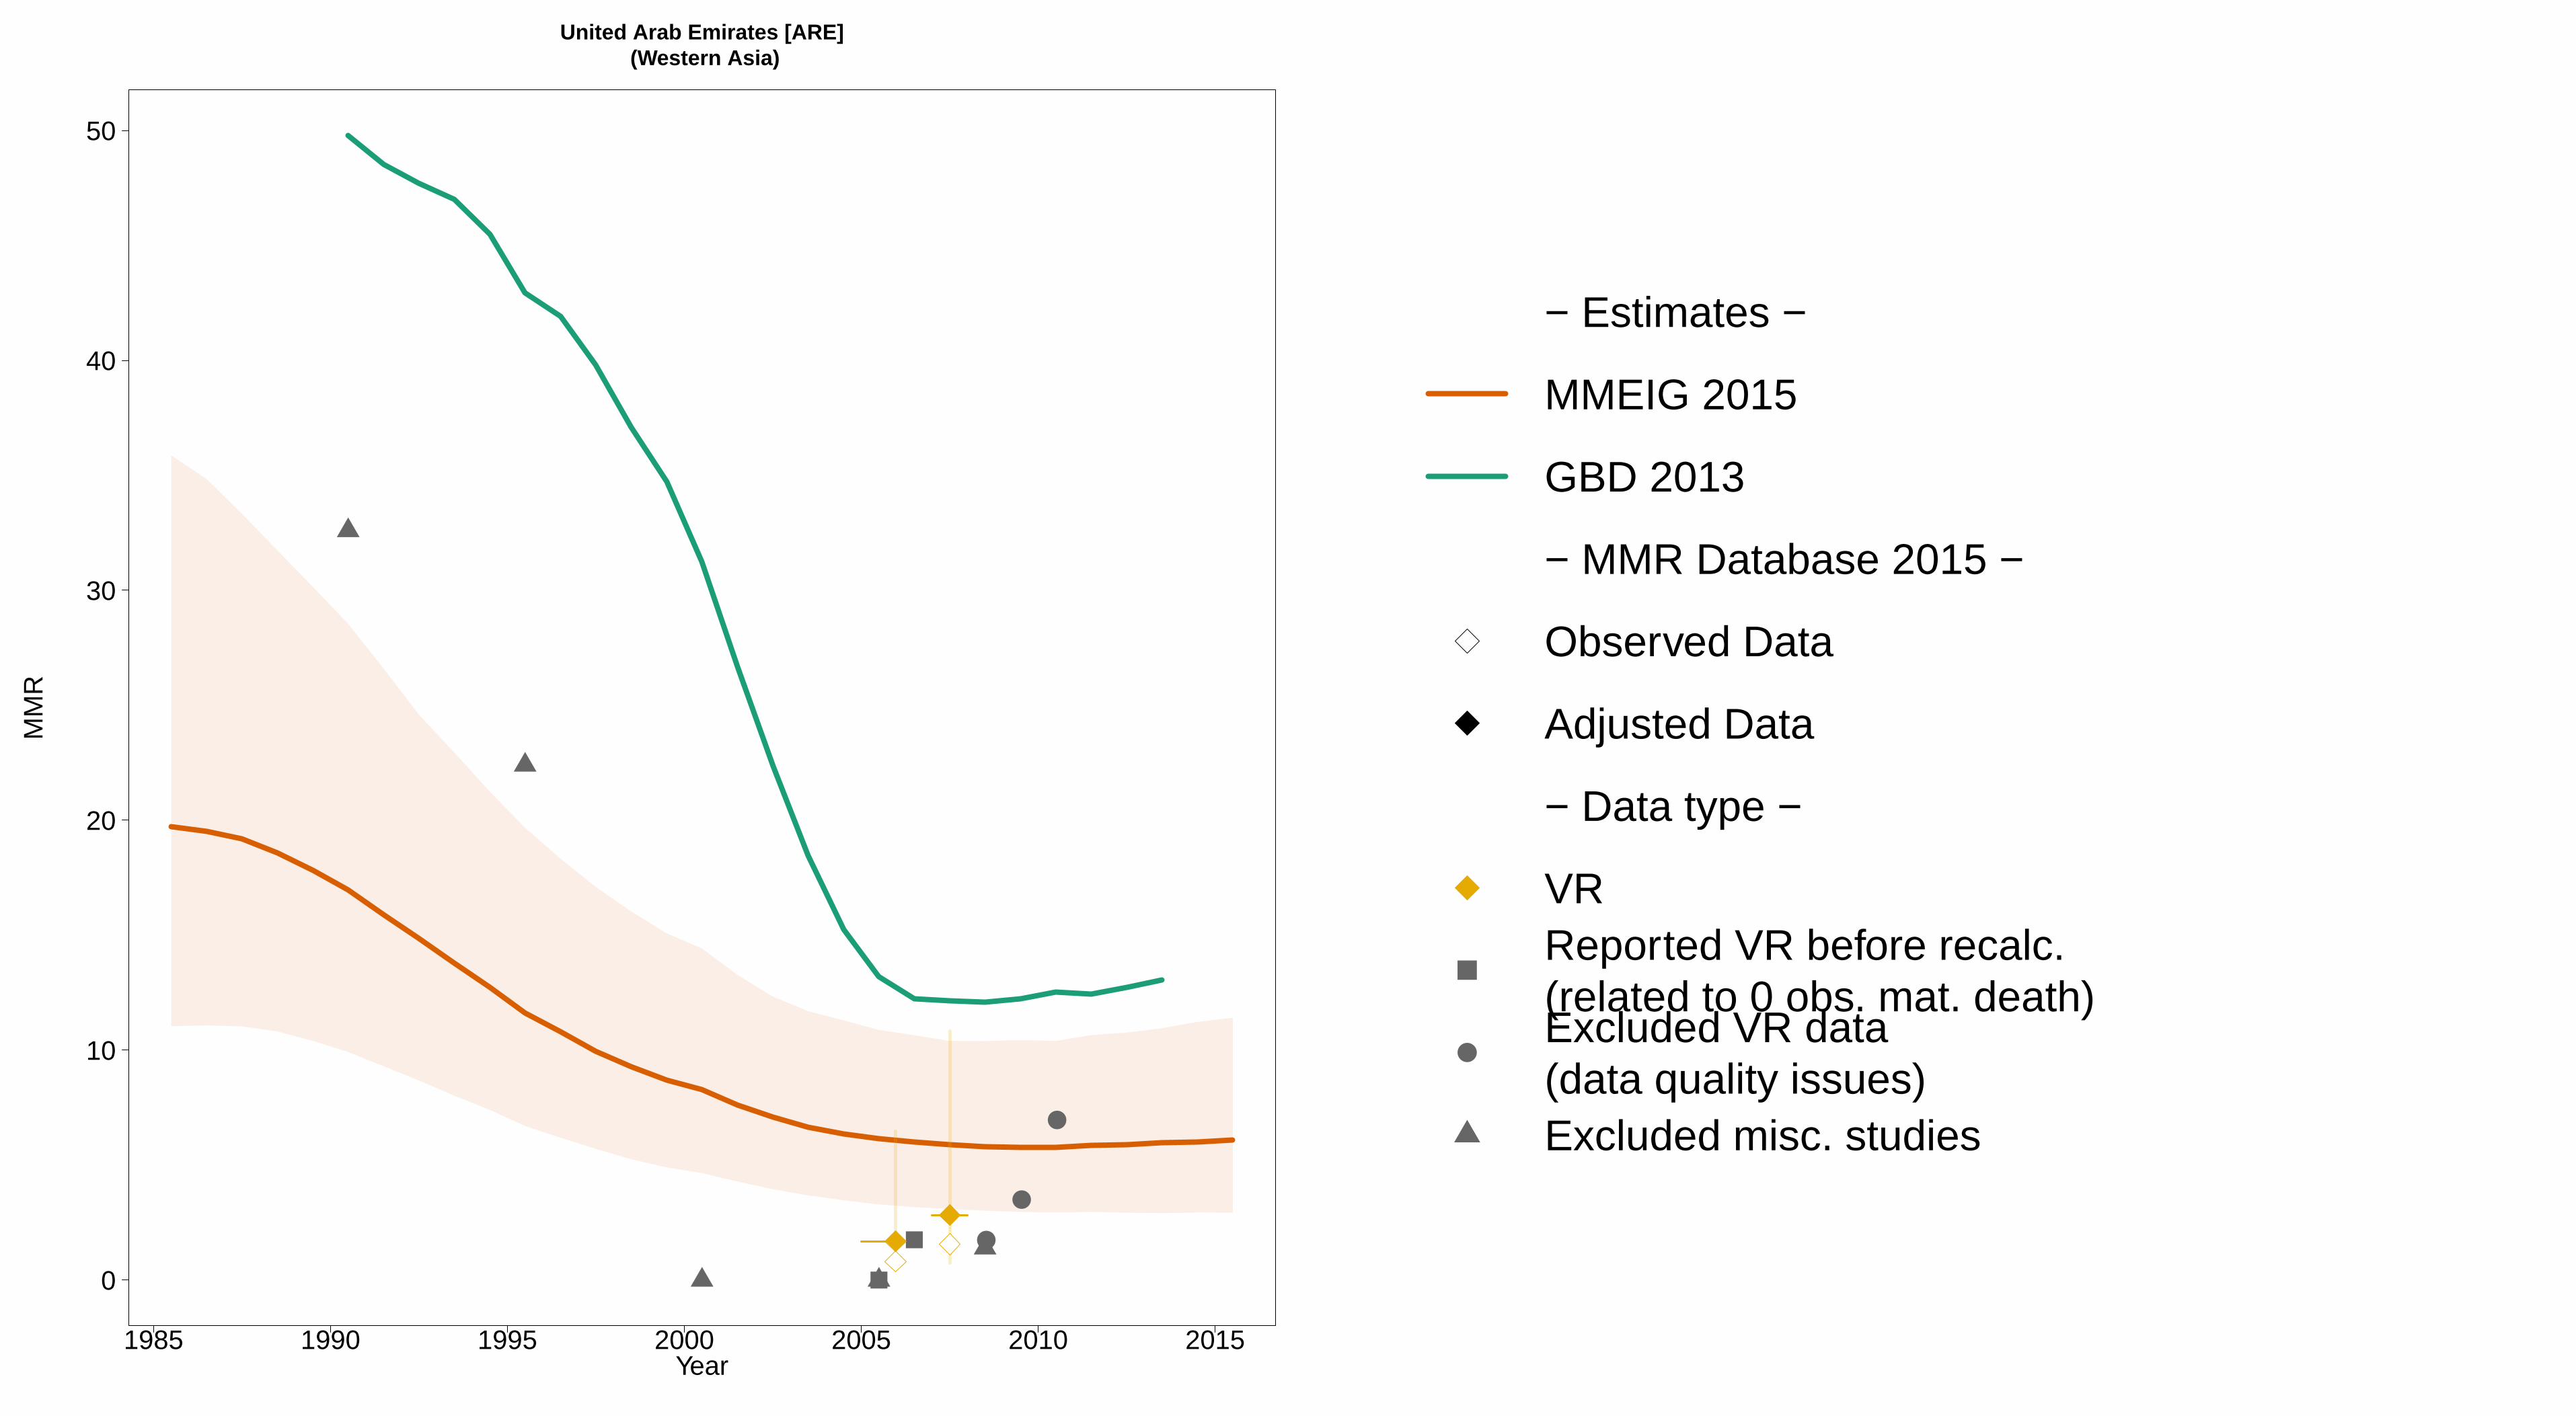
1985 1990 1995 2000 2005 2010 2015
United Arab Emirates [ARE] (Western Asia)
Year
0
10
20
30
40
50
MM
R
●
●
●
− Estimates −
MMEIG 2015
GBD 2013
− MMR Database 2015 −
Observed Data
Adjusted Data
− Data type −
VRReported VR before recalc.(related to 0 obs. mat. death)Excluded VR data (data quality issues)Excluded misc. studies

1985 1990 1995 2000 2005 2010 2015
United Kingdom [GBR] (Developed regions)
Year
0
5
10
15
MM
R
− Estimates −
MMEIG 2015
GBD 2013
− MMR Database 2015 −
Observed Data
Adjusted Data
− Data type −
VR
Spec. studiesExcluded VR data (overlap with specialized study)

1985 1990 1995 2000 2005 2010 2015
United States of America [USA] (Developed regions)
Year
0
5
10
15
20
MM
R
− Estimates −
MMEIG 2015
GBD 2013
− MMR Database 2015 −
Observed Data
Adjusted Data
− Data type −
VR
Spec. studiesExcluded VR data (overlap with specialized study)
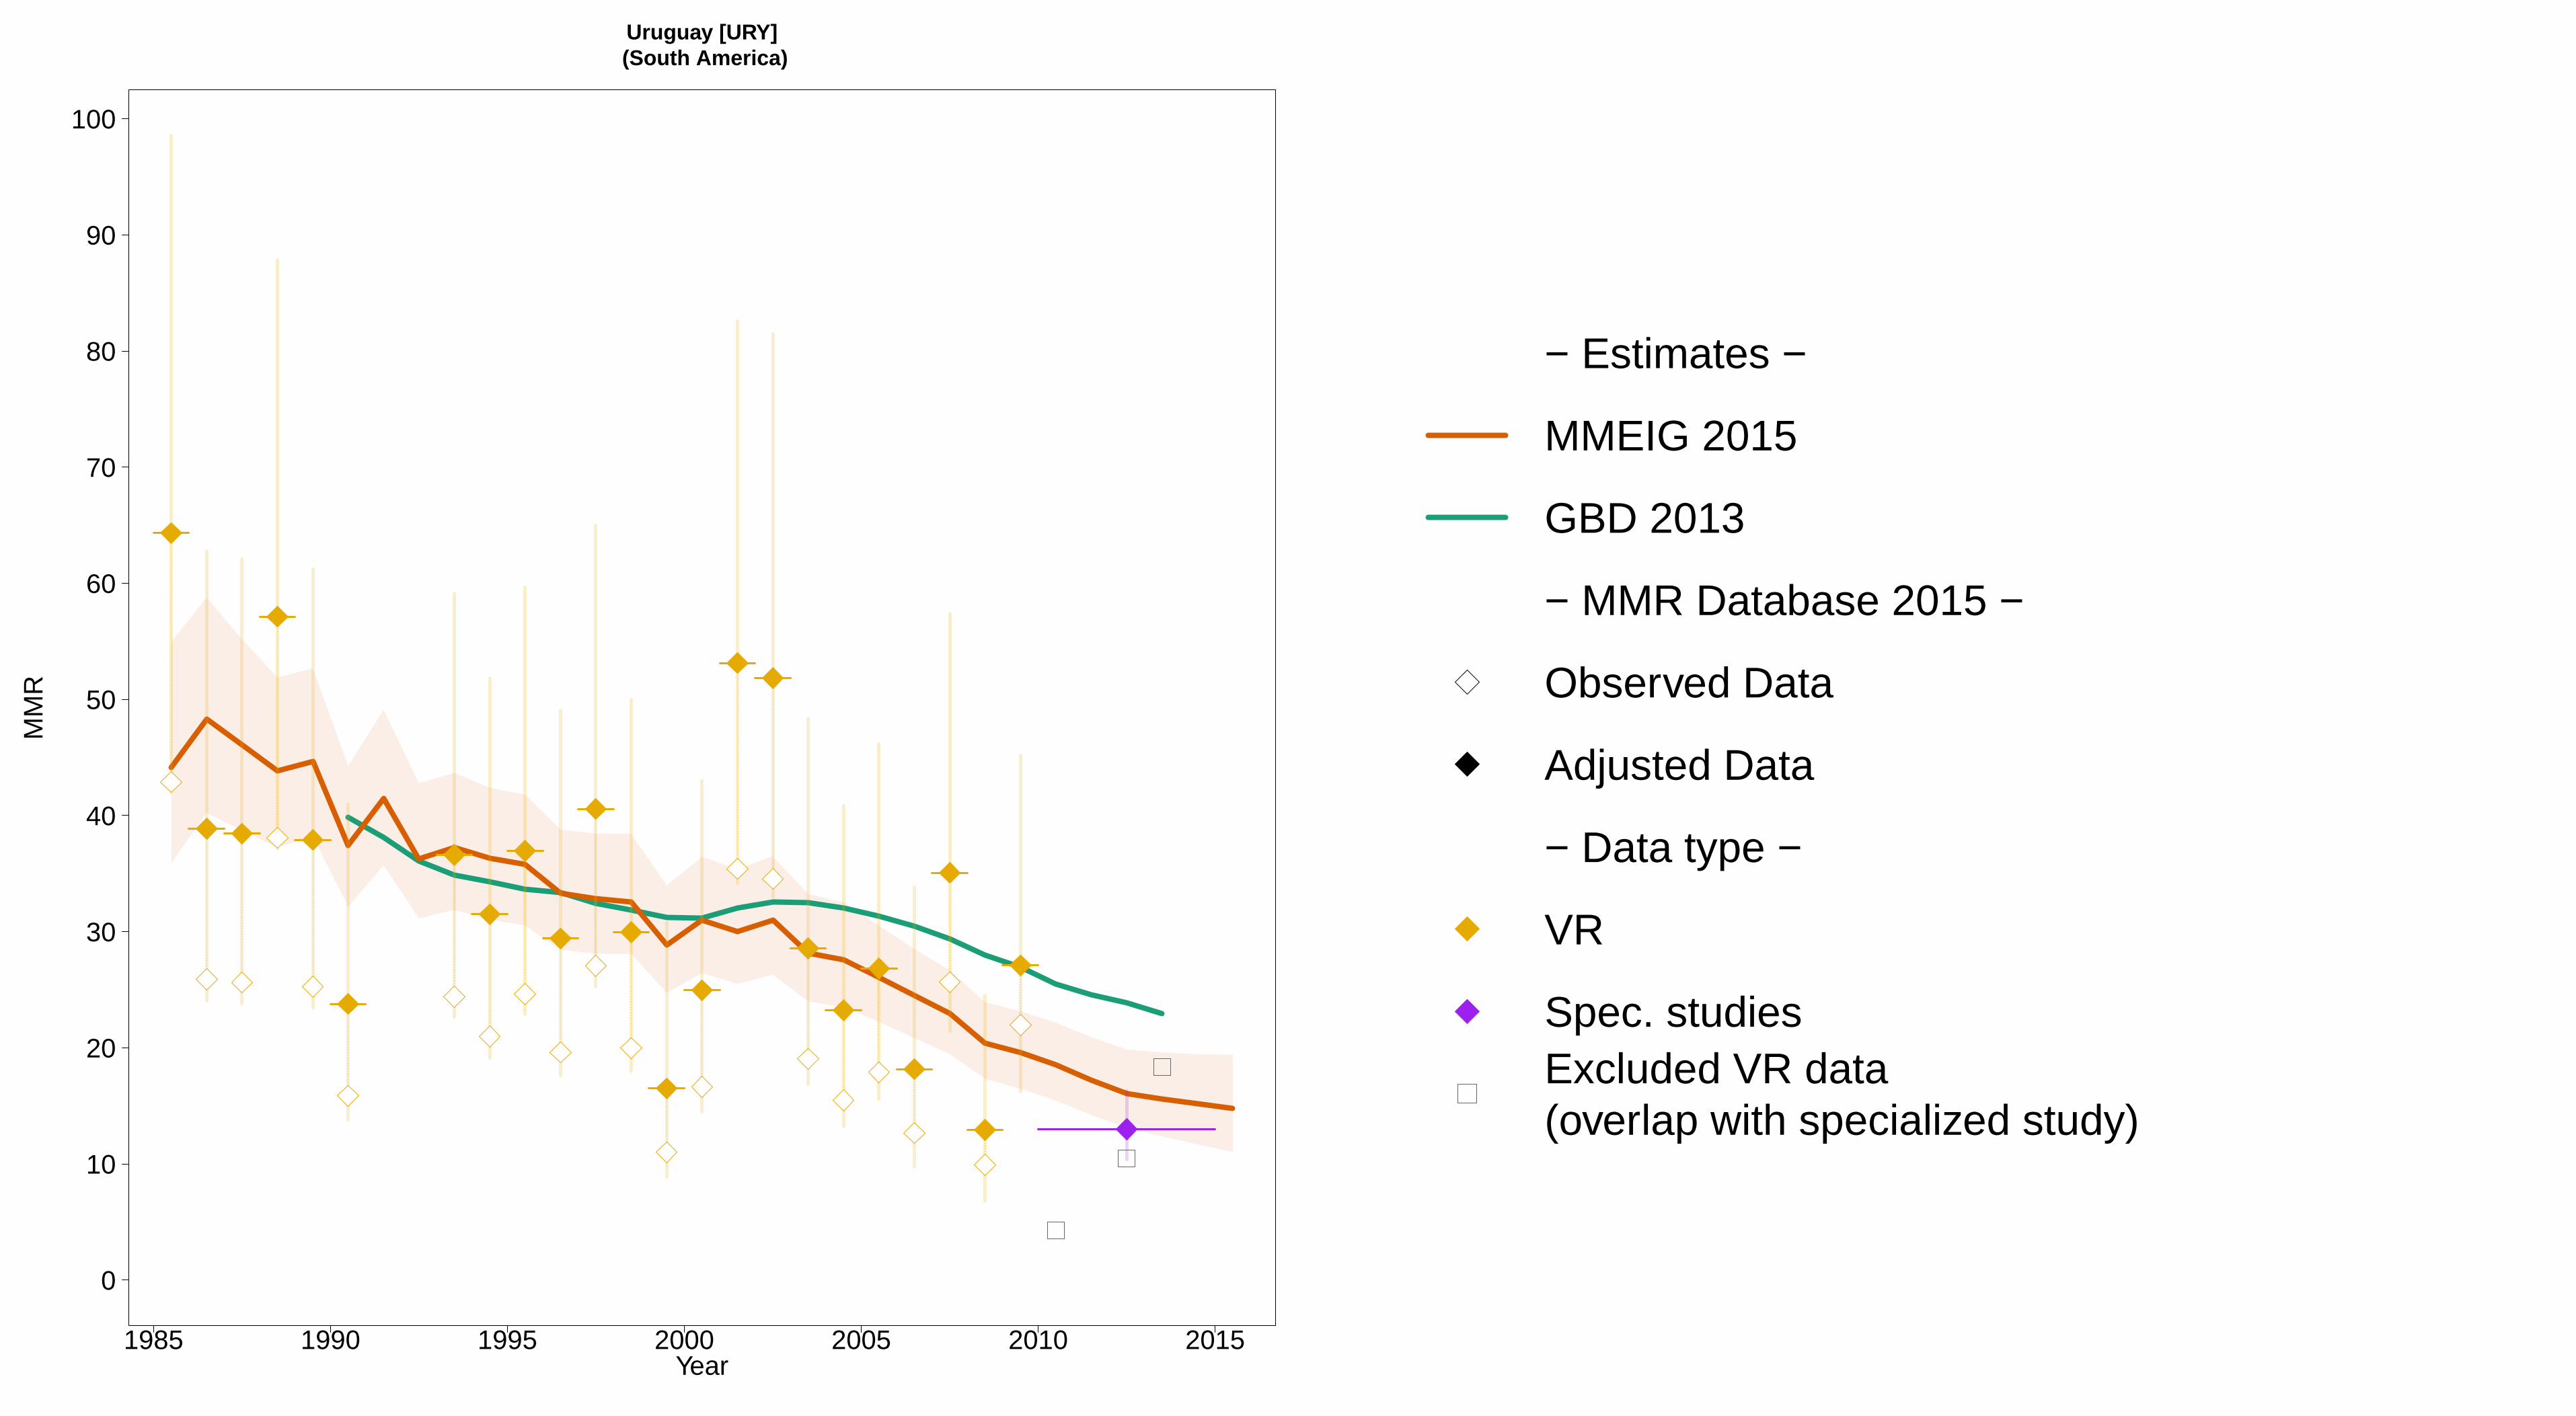
1985 1990 1995 2000 2005 2010 2015
Uruguay [URY] (South America)
Year
0
10
20
30
40
50
60
70
80
90
100
MM
R
− Estimates −
MMEIG 2015
GBD 2013
− MMR Database 2015 −
Observed Data
Adjusted Data
− Data type −
VR
Spec. studiesExcluded VR data (overlap with specialized study)
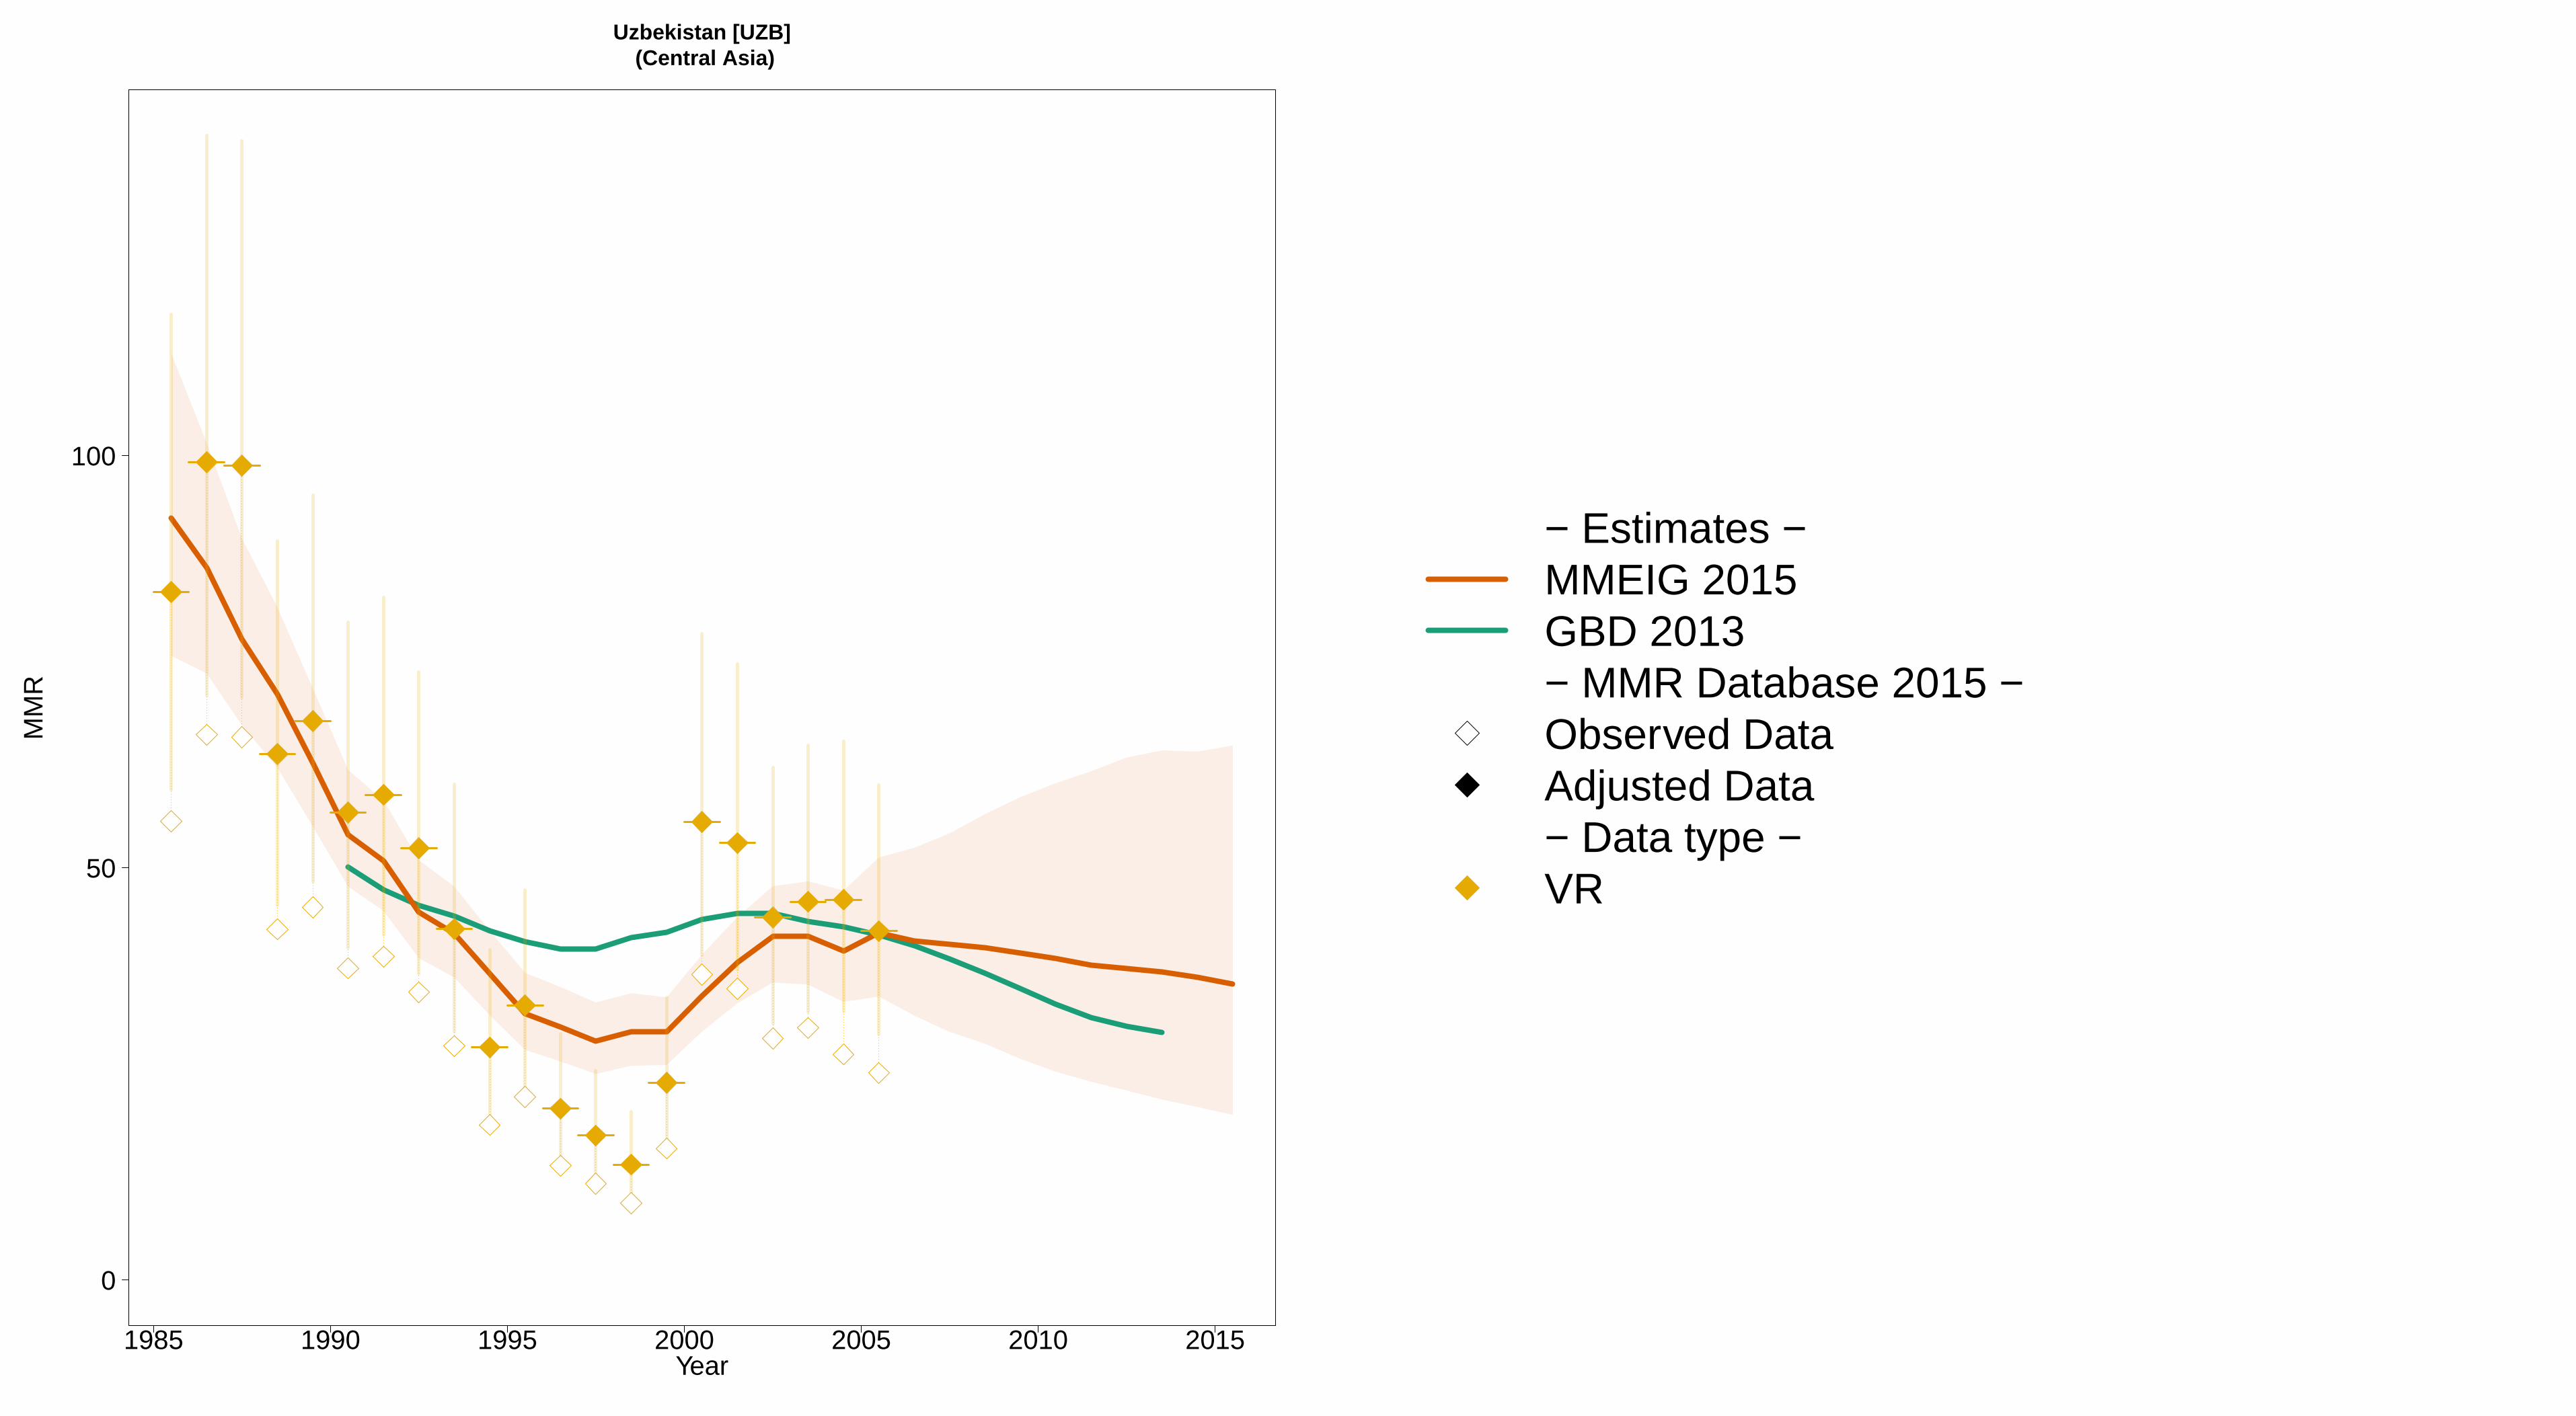
1985 1990 1995 2000 2005 2010 2015
Uzbekistan [UZB] (Central Asia)
Year
0
50
100
MM
R
− Estimates −MMEIG 2015GBD 2013− MMR Database 2015 −Observed DataAdjusted Data− Data type −VR
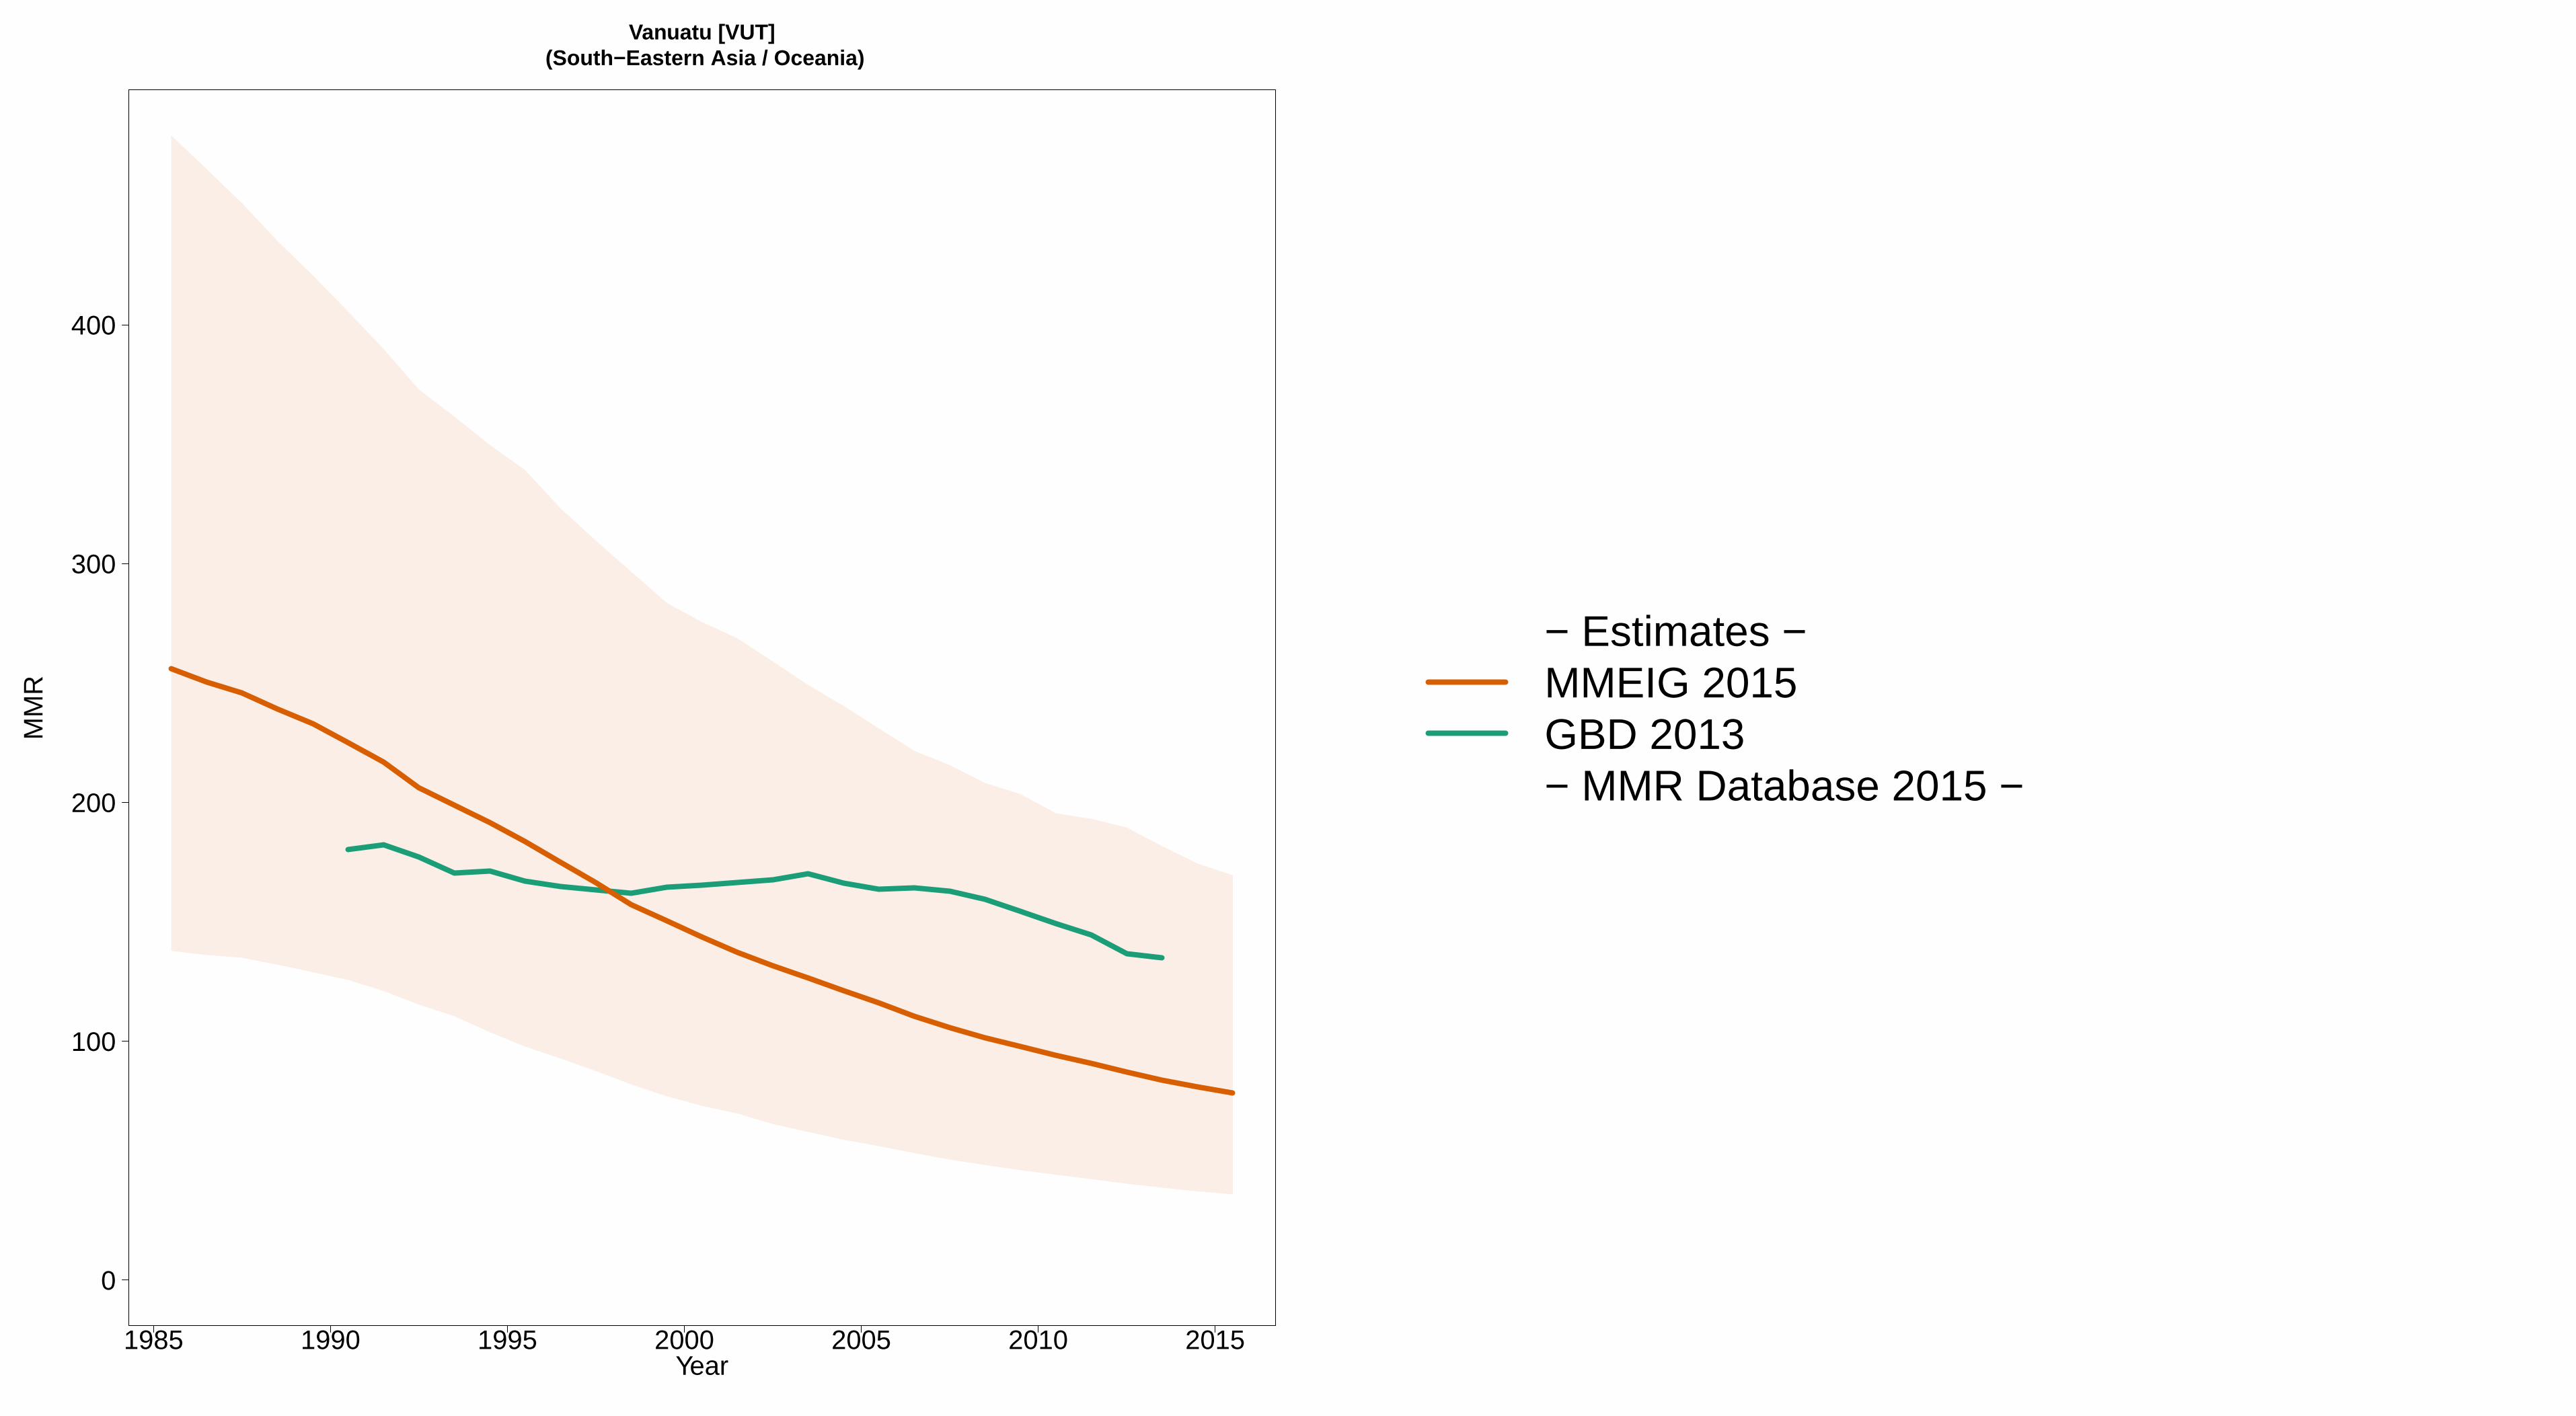
1985 1990 1995 2000 2005 2010 2015
Vanuatu [VUT] (South−Eastern Asia / Oceania)
Year
0
100
200
300
400
MM
R
− Estimates −MMEIG 2015GBD 2013− MMR Database 2015 −

1985 1990 1995 2000 2005 2010 2015
Venezuela [VEN] (South America)
Year
0
50
100
150
MM
R
− Estimates −MMEIG 2015GBD 2013− MMR Database 2015 −Observed DataAdjusted Data− Data type −VR

1985 1990 1995 2000 2005 2010 2015
Viet Nam [VNM] (South−Eastern Asia / Oceania)
Year
0
50
100
150
200
250
MM
R
− Estimates −MMEIG 2015GBD 2013− MMR Database 2015 −Observed DataAdjusted Data− Data type −Spec. studiesCensusExcluded misc. studies
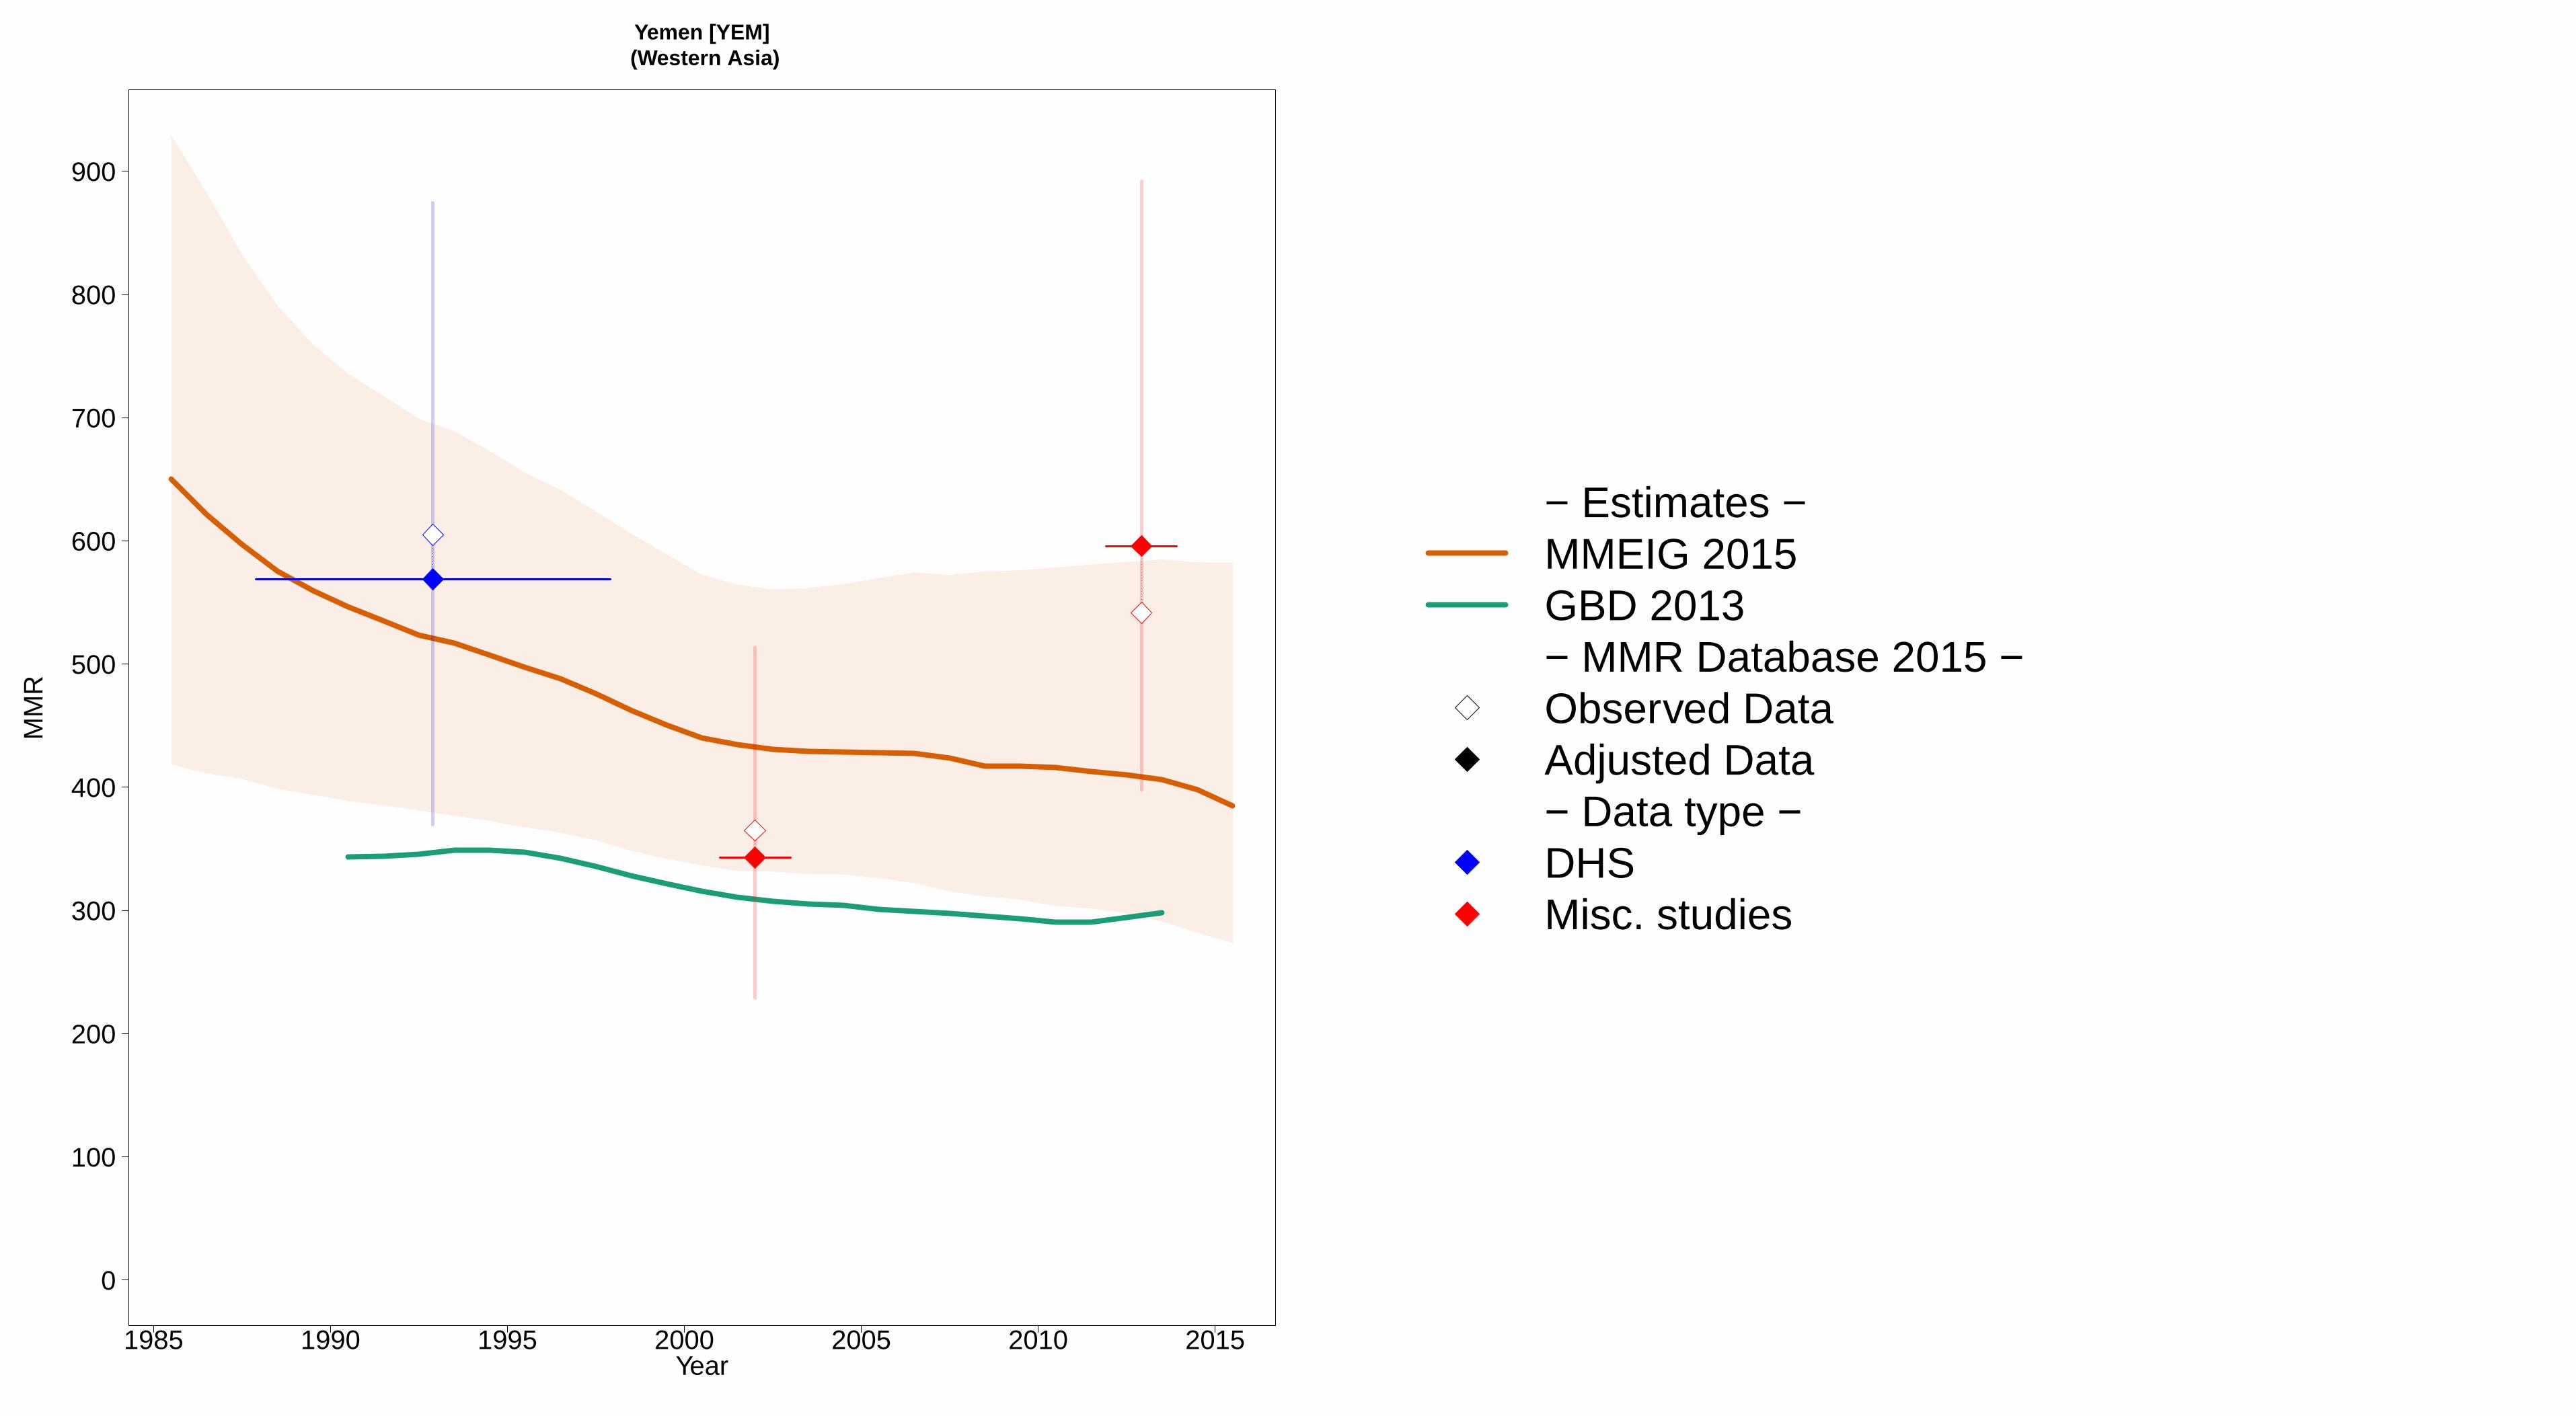
1985 1990 1995 2000 2005 2010 2015
Yemen [YEM] (Western Asia)
Year
0
100
200
300
400
500
600
700
800
900
MM
R
− Estimates −MMEIG 2015GBD 2013− MMR Database 2015 −Observed DataAdjusted Data− Data type −DHSMisc. studies
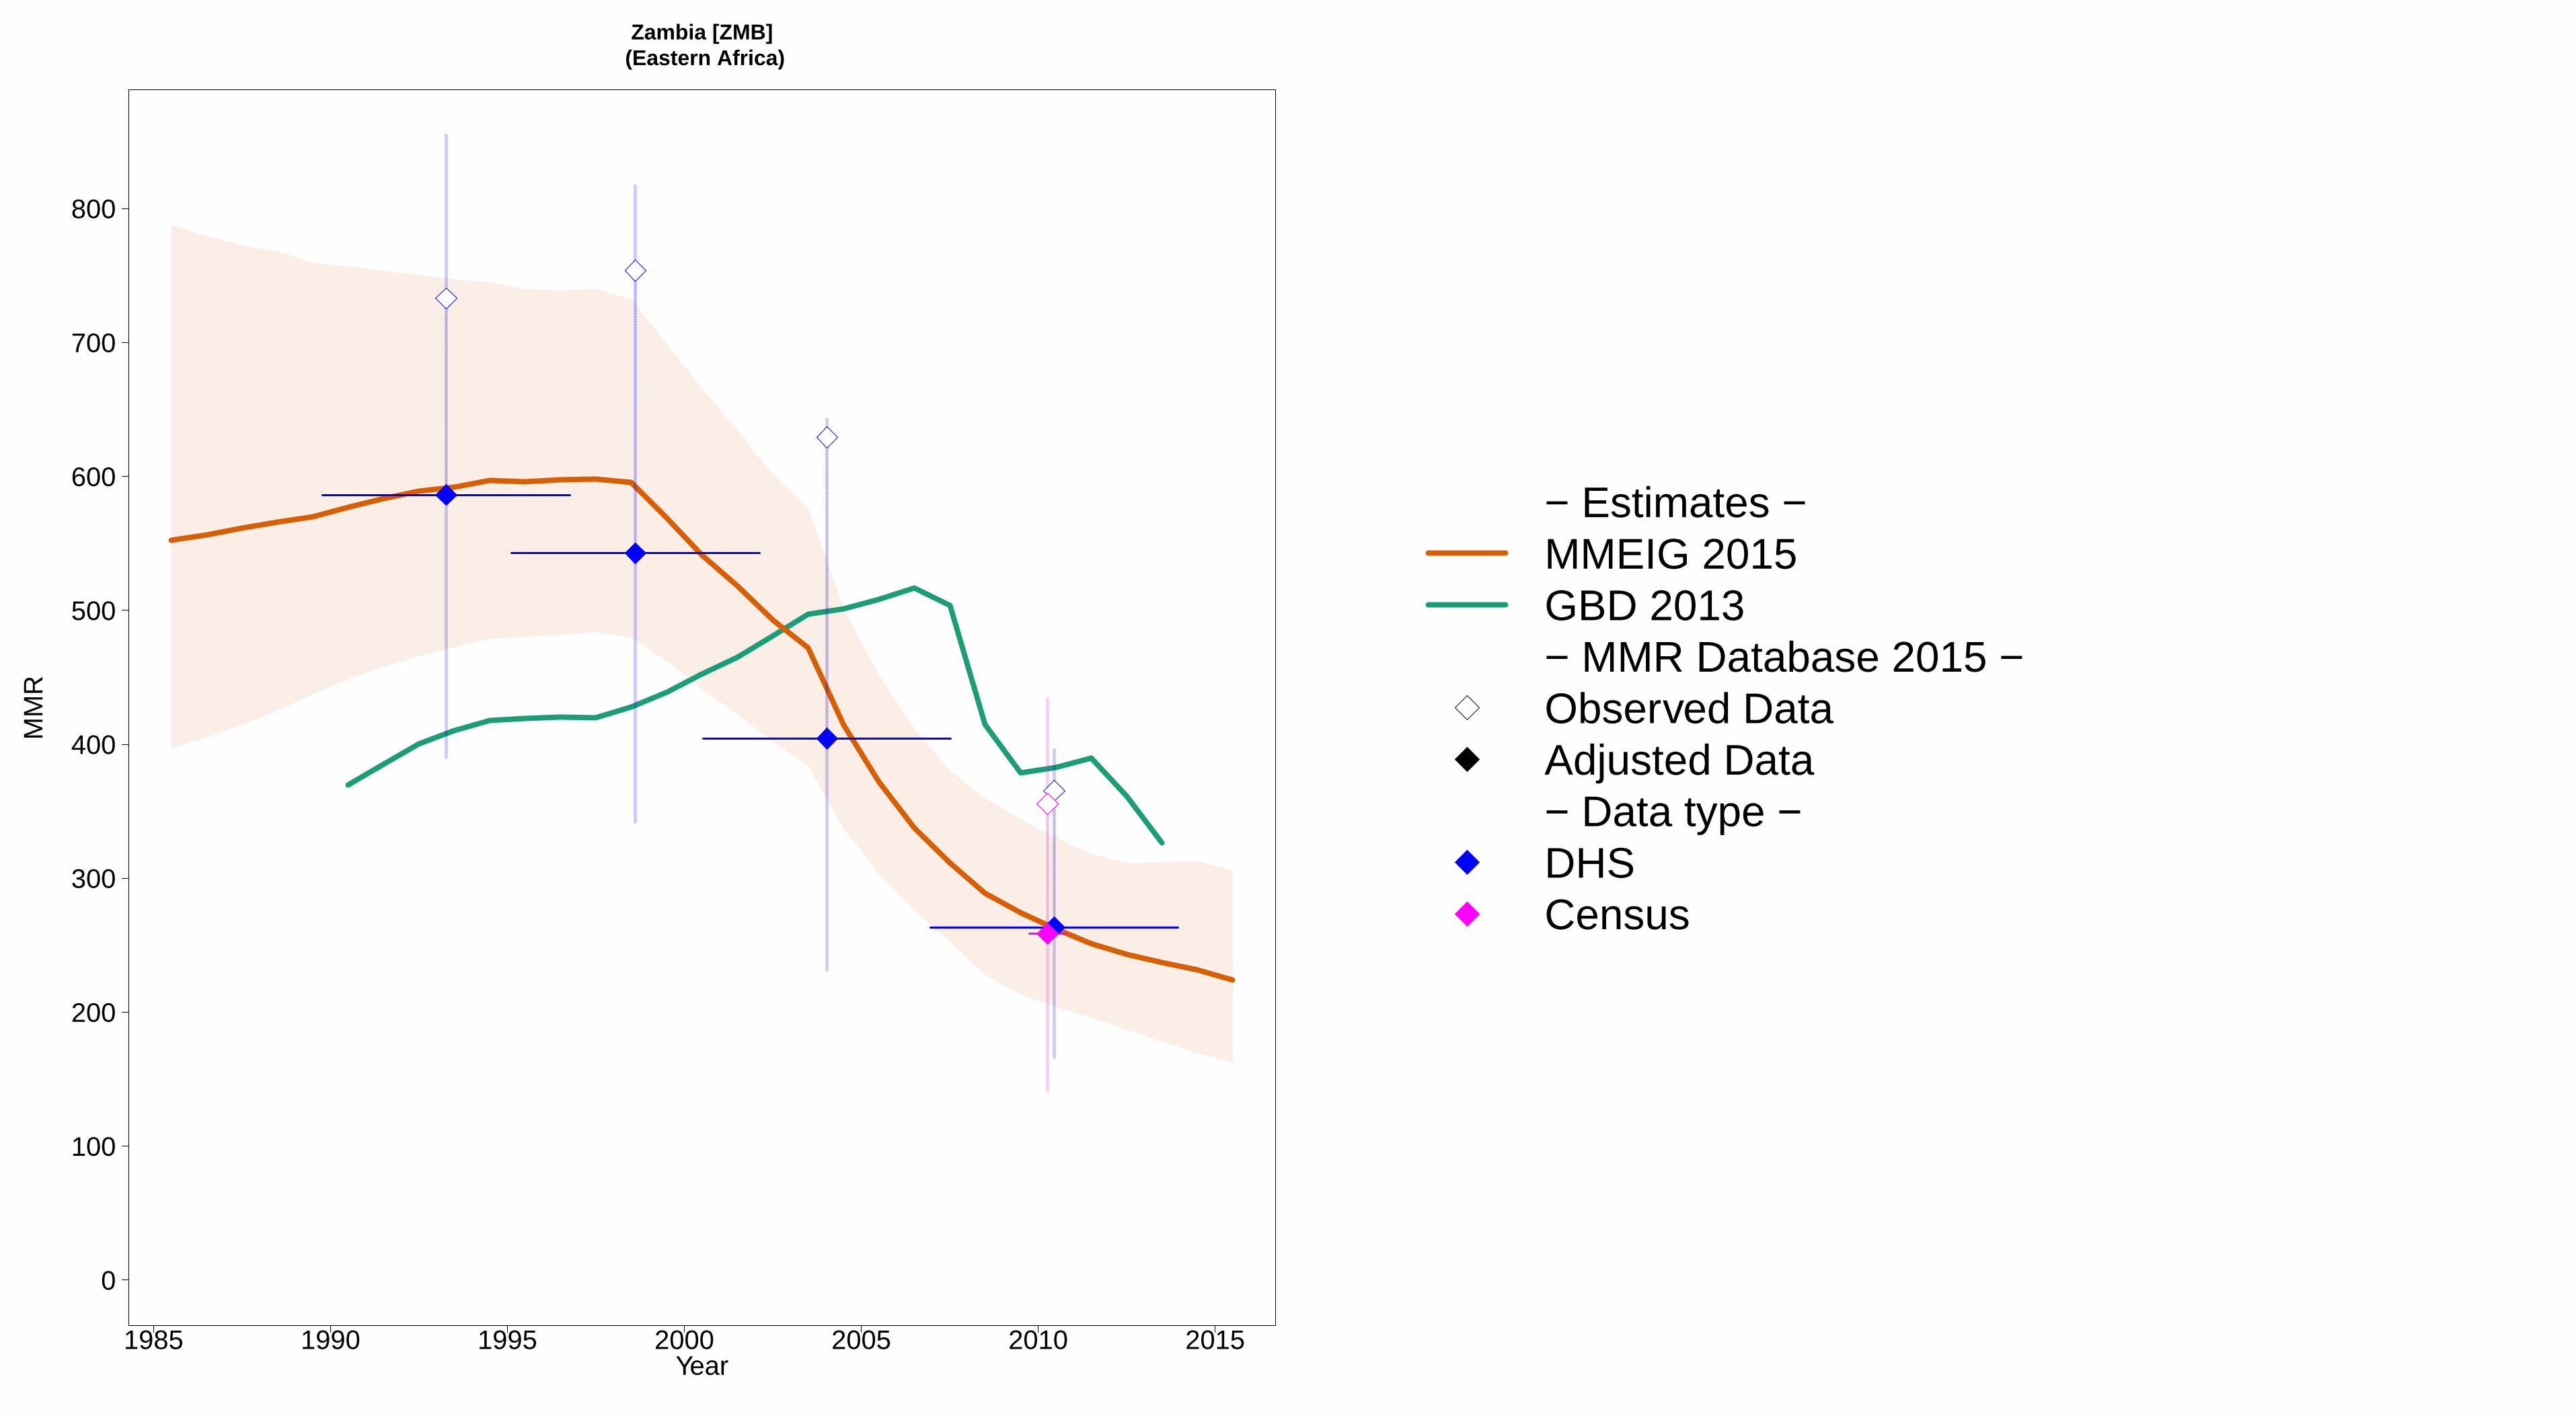
1985 1990 1995 2000 2005 2010 2015
Zambia [ZMB] (Eastern Africa)
Year
0
100
200
300
400
500
600
700
800
MM
R
− Estimates −MMEIG 2015GBD 2013− MMR Database 2015 −Observed DataAdjusted Data− Data type −DHSCensus

1985 1990 1995 2000 2005 2010 2015
Zimbabwe [ZWE] (Eastern Africa)
Year
0
500
1000
MM
R
●
− Estimates −
MMEIG 2015
GBD 2013
− MMR Database 2015 −
Observed Data
Adjusted Data
− Data type −
Spec. studies
DHS
CensusExcluded VR data (data quality issues)