
Supplemental Report 4 - ibiblio.org
102
.% MSC-G-R-66-2 Supplemental Report 4 _d by Issued as: To: By: Supplemental Report 4 Gemini Program Mission Report Gemini VI-A MSC-G-R-66-2 Gemini VI-A Mission Evaluation Team National Aeronautics and Space Administration Manned Spacecraft Center Houston, Texas MISSION PLANN NATIONAL AERONAUT MANNED H, (NASA-CR-89_26) GEMINI 6 INERTIAL GUIDANCE SYSTEM EVA_UATION AND TRAJECTCE¥ BECONSTRUCTION (TEW Systems, Redondo Beach, Calif.) 110 p 00/18 _79-76297 Unclas 11033
Transcript of Supplemental Report 4 - ibiblio.org

.%
MSC-G-R-66-2
Supplemental Report 4
_d by
Issued as:
To:
By:
Supplemental Report 4
Gemini Program Mission ReportGemini VI-A
MSC-G-R-66-2
Gemini VI-A Mission Evaluation Team
National Aeronautics and SpaceAdministration
Manned Spacecraft CenterHouston, Texas
MISSION PLANNNATIONAL AERONAUT
MANNEDH,
(NASA-CR-89_26) GEMINI 6 INERTIAL GUIDANCESYSTEM EVA_UATION AND TRAJECTCE¥
BECONSTRUCTION (TEW Systems, Redondo Beach,
Calif.) 110 p00/18
_79-76297
Unclas
11033

TRW NOTE NO. 66 FMT-230
PROJECT GEMINI
TASK MSC/TRW G-14
3150-6027-R8-000
Pages: 101
MSC-G-R-66-2
Supplemental Report 4
GEMINI 6 INERTIAL GUIDANCE SYSTEM EVALUATION
AND TRAJECTORY RECONSTRUCTION(U)
3 0 JUNE 1966
Issued as:
To:
By:
Prepared forMISSION PLANNING AND ANALYSIS DIVISION
NATIONAL AERONAUTICS AND SPACE ADMINISTRATION
MANNED SPACECRAFT CENTER
HOUSTON, TEXAS
Supplemental Report 4 NAS 9-4810
Gemini Program Mission ReportGemini VI-A
MSC-G-R-66-2
Gemini VI-A Mission Evaluation Team
National Aeronautics and SpaceAdministration
Manned Spacecraft CenterHouston, Texas Approved
R.J.Boyles, Task Manager
_te_/_ "
Approved by C_A_ _')__
J. _. M¢Carthy,-Mana_
Sys}ems Engineering DeJuirtment
C.W. Plttman, Manager
Mission Planning and Operations
Mission Trajectory Control Program
TRWsi'STEMS oo* ORAO 'NTERVA.*,DECI-ASS_ER 12 YEARS
This document contoins ;niormation_ __d States w;thin the mea ;ng of the Espionoge Laws,
Tade 18, U. $.C., Secl;on 793 @nd 794_ner to on unouthor;zed person is prohibited by Jaw.
3150-6027-R8-000Page ill
ABSTRACT
This report contains a detailed accuracy
evaluation of the Gemini 6 inertial guidance sys-
tem during the ascent and reentry phases of the
mission. An analysis of the external tracking
instrumentation accuracy is also included. The
results of the error analyses are used to con-
struct reference Gemini 6 ascent and reentry
trajectories.
(Reverse of this page blank)

3150-60Z7-R8-000
Page v
CONTENTS
1. INTRODUCTION AND SUMMARY ....................
Z. INERTIAL GUIDANCE SYSTEMPERFORMANCE ANALYSIS .......................
g. l Summary of Data Used in Analysis ..............
Z. Z Inertial Guidance System Error .................
Z. Z. ! Free Flight Fix ......................
Z. 3 Inertial Measurement Unit Error Analysis .........
2.3. 1 IMU Error ..........................
2.3.2 Honeywell Preflight ErrorCoefficient Prediction ..................
2.3.3 Accelerometer Bias Updating .............2.3.4 Error Coefficient Recovery ..............
2.3.5 December 12 Gemini 6 AttemptedLaunch Data Analysis ..................
2.4 Azimuth Update ...........................
2.5 Conclusions ..............................
3. REENTRY ...................................
3. 1 Reentry Simulation Results ....................
4. TRACKING SYSTEM PERFORMANCE ................
4. I GE Mod HI ...............................
4. 2 MISTRAM Data ............................
4.2. l MISTRAM I Quick Look Data ..............4.2.2 MISTRAM II (Passive Mode) ..............
4.2.3 MJSTRAM Final ......................
4. 3 Range BET ..............................
4. 4 Discussion of Tracking Data Evaluations ..........
5. TRAJECTORY RECONSTRUCTION ..................
5. 1 Reentry Trajectory Reconstruction ..............
6. ONBOARD RADAR PERFORMANCE ..................
6. I Trajectory Reconstruction ....................
6.2 Conclusion ...............................
Page
1-I
Z-I
Z-I
Z-6
Z-7
Z-9
Z-9
Z-II
2-12Z-16
Z-19
Z-ZZ
Z-Z4
3-1
3-Z
4-1
4-Z
4-Z
4-2
4-4
4-4
4-5
4-5
5-1
5-I
6-1
6-1
6-Z

3150-6027-R8-000
Page vi
CONTENTS (Continued)
APPENDIXES
A. Trajectory Reconstruction ..................
B. TRW Regression Program (REMP)Modifications ..........................
C. Preflight Calibration History Plots ............
REFERENCES ..................................
Page
A-1
B-1
C-1
R-I
Total Pages : 101

:+ _: :, 3150-60Z7-R8-000:; Page vii
ILLUST RATIONS
4
5
6
7
8
9
I0
II
IZ
13
|4
15
16
17
18
19
Z0
Zl
ZZ
Z3
Z4
Page
GE/Final and i00K MISTRAM zlV, Sensed Coordinates ...... Z-Z
GE/Final and I00K MISTRAM AV, Guidance Inertial
Coordinates .................................. 2 -3
GE/Final and 100K MISTRAM _P, Guidance Inertial
Coordinates .................................. Z -4
Navigation Velocity Error ......................... Z-5
Sensed Coordinate AV with IMU Error Source Fit ......... Z-8
Sensed Velocities Revolution 3 RDVZ Phase ............. Z-13
Sensed Velocities Revolution 5 RDVZ Phase ............. Z-14
Sensed Velocities Revolution 8 ...................... 2-15
Gemini 6 Abort Sensed Velocity Error ................ Z-Z0
Gemini 6 MSC Reentry Simulation Minus Radar BET
(IGS Coordinates) .............................. 3-3
GE/Burroughs and Compensated IGS z_V, Sensed
Coordinates .................................. 4-7
GE/Burroughs and Compensated IGS z_P, SensedCoordinates .................................. 4-8
GE/Final and Compensated IGS z_V, Sensed Coordinates ..... 4-9
GE/Final and Compensated IGS z_P, Sensed Coordinates ..... 4-10
MISTRAM I 100K and Compensated IGS AV, SensedCoordinates .................................. 4-11
MISTRAM I 100K and Compensated IGS z_P, SensedCoordinates .................................. 4-1Z
MISTRAM I t0K and Compensated IGS z_V, SensedCoordinates .................................. 4-13
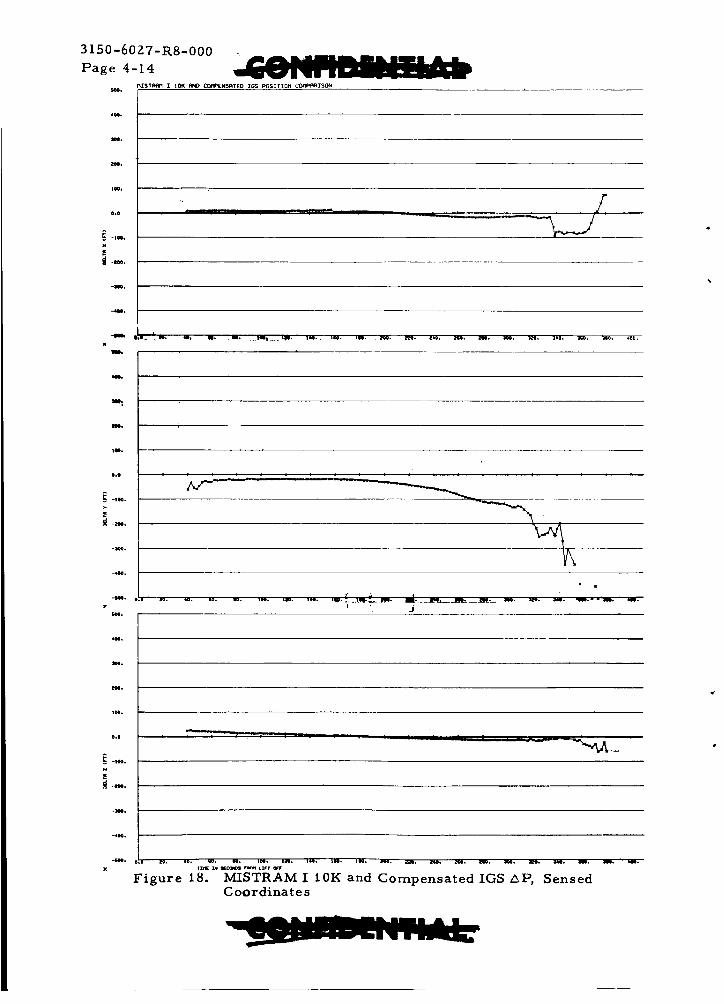
MISTRAM I 10K and Compensated IGS Z_P, SensedCoordinates .................................. 4-14
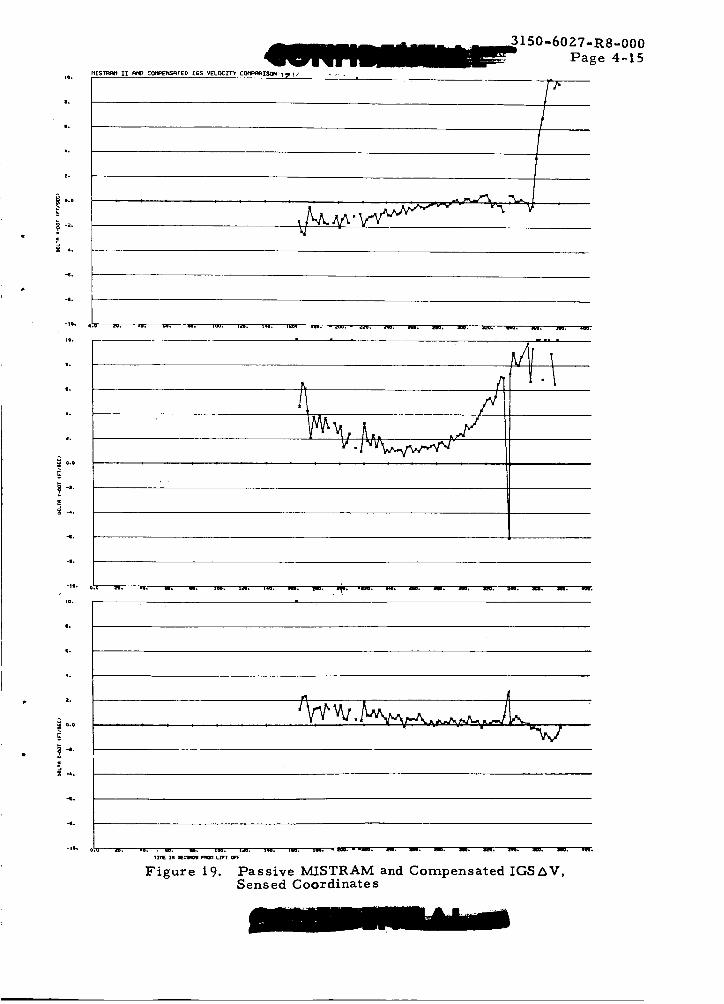
Passive MISTRAM and Compensated IGS z_V, SensedCoordinates .................................. 4-15
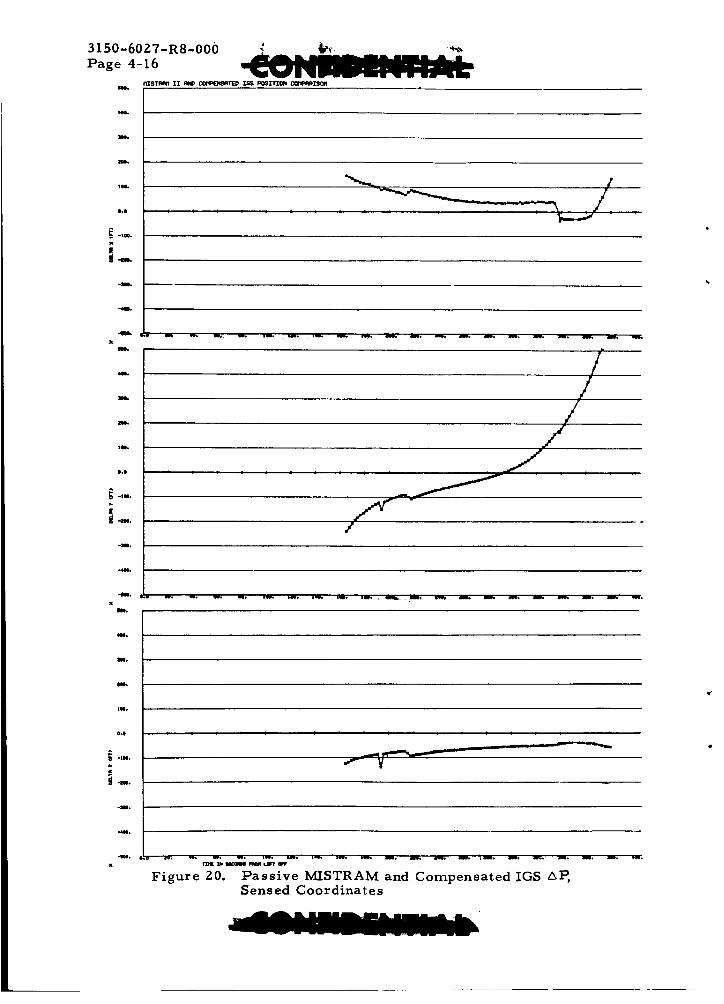
Passive MISTRAM and Compensated IGS z_P, SensedCoordinates .................................. 4-16
MISTRAM Final and Compensated IGS z_V, SensedCoordinate s .................................. 4-17
MISTRAM Final and Compensated IGS _P, SensedCoordinates .................................. 4-18
Range BET and Compensated IGS AV, Sensed Coordinates .... 4-19
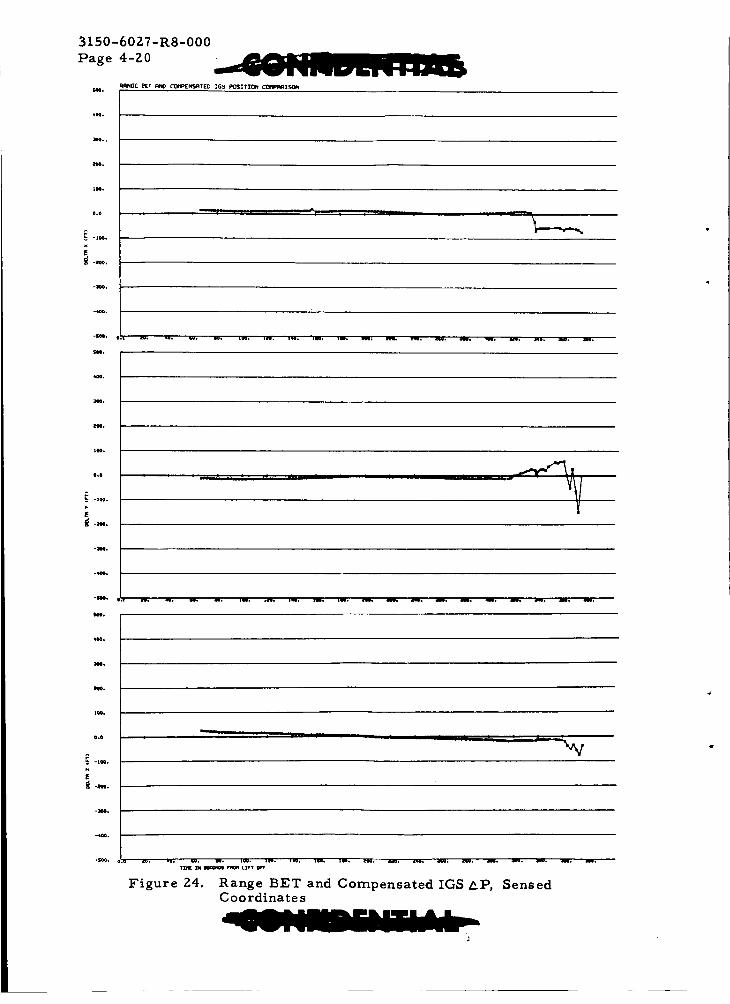
Range BET and CompensatedIGS _P, Sensed Coordinates .... 4-20
t_ +. :.. t: + .

3150-6027-R8-000
Page viii
25
26
27
28
Z9
30
31
32
33
34
35
36
37
38
39
ILLUSTRATIONS (Continued)
Page
TRW Range Comparison (Original Gemini 6 Trajectory) ..... 6-3
TRW Azimuth Comparison (Original Gemini 6 Trajectory) .... 6-4
TRW Elevation Comparison (Original Gemini 6 Trajectory)... 6-5
TRW Range Comparison (Second Gemini 6 Trajectory) ...... 6-6
TRW Azimuth Comparison (Second Gemini 6 Trajectory) ..... 6-7
TRW Elevation Comparison (Second Gemini 6 Trajectory) .... 6-8
NASA Range Comparison (Second Gemini 6 Trajectory ...... 6-9
NASA Azimuth Comparison (Second Gemini 6 Trajectory) .... 6-10
NASA Elevation Comparison (Second Gemini 6 Trajectory) . . . 6-11
Radar PCM Range {230 through 325 Seconds) ............. 6-1Z
Radar PCM Range (330 through 358 Seconds) ............. 6-13
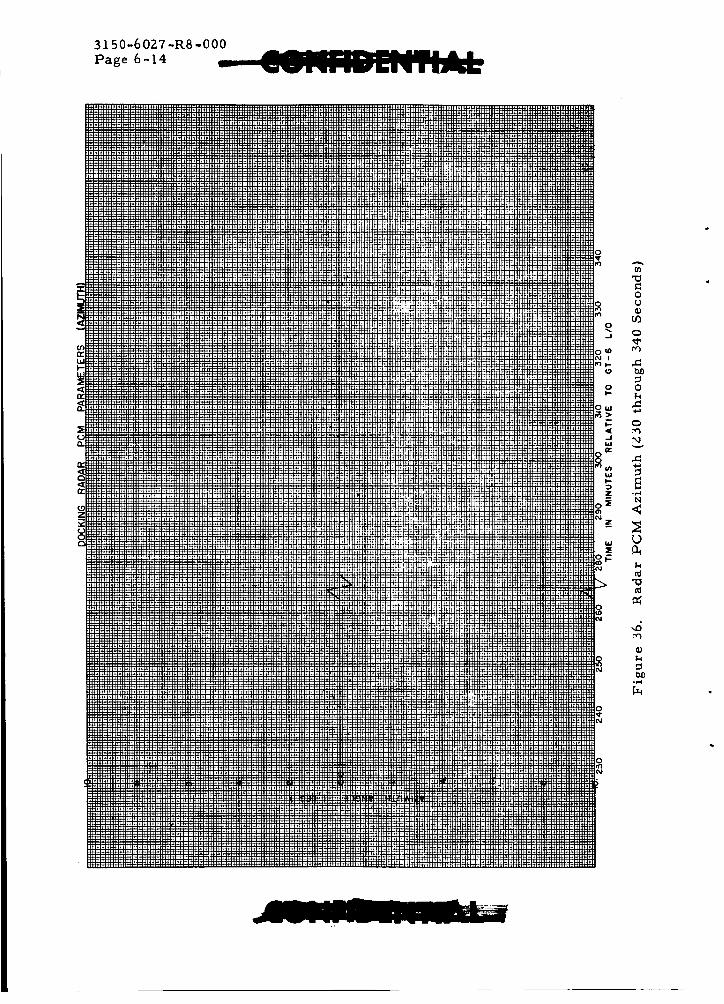
Radar PCM Azimuth {Z30 through 340 Seconds) ........... 6-14
Radar PCM Azimuth (340 through 358 Seconds) ........... 6-15
Radar PCM Elevation {g30 through 340 Seconds) .......... 6-16
Radar PCM Elevation (340 through 358 Seconds) .......... 6-17
i
Z
3
4
5
6
7
8
9
10
TABLES
Inertial Guidance Error at SECO +Z0 Seconds ............ Z-7
Recovered IGS Error Coefficients .................... Z-10
Accelerometer Bias Constants ...................... Z-1Z
Accelerometer Bias Error ......................... Z-1Z
IGS Error Source Comparison ...................... Z-Z1
Azimuth Update ................................ Z-Z3
IGS Error History .............................. Z-25
Reentry Initial Conditions ......................... 3-1
Gemini 6 Reentry Impact Location .................... 3-Z
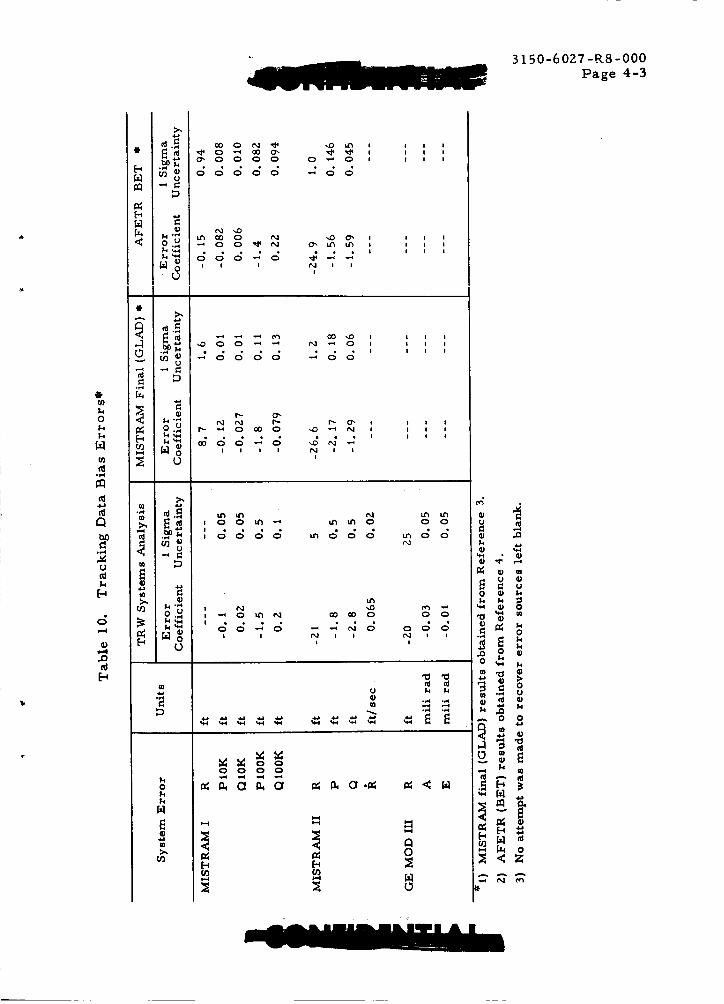
Tracking Data Bias Errors ........................ 4-3
i x , , , ::

3150-60Z7-R8-O00
Page I-I
1. INTRODUCTION AND SUMMARY
Gemini 6 was launched on 15 December 1965 from Complex 19 at Cape
Kennedy, Florida. The primary objective of this flight was to perform a
rendezvous with the orbiting Gemini 7 spacecraft. TRW Systems is sub-
mitting this report to the NASA Manned Spacecraft Center in response to
Task MSC/TRW G- 14 of the Gemini Mission Trajectory Control Program,
Contract NAS 9-4810. This document presents the results obtained from
analysis of the inertial guidance system (IGS) performance during the
ascent and reentry flight phases and provides a reconstruction of the space-
craft trajectory during ascent and reentry.
The following is a brief summary of the analysis results:
a) The IGS performance during ascent was approximatelywithin anticipated uncertainties. Best estimates of IGSerror at insertion (SECO + _0 seconds) are as follows:
AX = +671 ± 100 ft A_ = +0. Z ± 0.5 ft/sec
Z_Y = +856 • 200 ft A_ r = +10.3 ± 3 ft/sec
ZiZ = -449 i 100 ft _Z = -2.3 ± 1 ft/sec
b) Major contributors to the above IGS errors weredetermined by regression and visual analysis to bethe following:
X accelerometer bias
X accelerometer scale factor
Z accelerometer misalignmenttowards X
Y gyro constant drift rate
X gyro input axis unbalance
Platform misalignment about Yaccelerometer axis
= 197 • 10 ppmg
= -76 • 9 ppm
= 84 ± Z4
= O. 34 ± O. 1 deg/hr
= -O. Z3 ± O. 7 deg/hr/g
= -40 • 4Z
Timing errors, both correlation and scale factor (clockrate error), were found to be significant at SECO buthave not been listed as major error sources.
c) The support tracking systems, GE Mod III, MISTRAM Iand MISTRAM II performed within anticipated umcer-tainties with the exception of a P bias in the MISTRAM Idata of -1.5 feet in the 100 K baseline data and -0. 1 feetin the 10 K baseline data.

3150-6027-R8-000Page 1-2
d) No major IGS problems were evident from the available
data during reentry. Loss of. spacecraft telemetry duringthe "blackout" period precluded a more detailed IGSanalysis. The IGS and ship indicated impact pointsare summarized below for comparison with respectto the target.
• Geodetic Latitude" LongitudeSource (deg north) (deg west) Miss (n mi)
Ship 23. 375 67. 875 14.3
IGS 23.7 67. 74 7.3
e)
Target 23.61 67.83| i
Coarse agreement was obtained between a reconstructedGemini 6 to Gemini 7 relative position vector and thetelemetered rendezvous radar value. However, uncer-
tainties in the trajectory reconstructions limited thecalculated vector accuracies to 1 - 3 n mi.
Section 2 of this report discusses the IGS detailed accuracy analysis.
Section 3 describes the IGS performance during reentry, and Section 4
contains the external tracking system performance. The ascent and reentry
trajectory reconstruction is presented in Section 5. Section 6 discusses
the rendezvous radar/trajectory reconstruction comparisons. Appendix A
contains a list of trajectory reconstruction, and Appendix B contains a
mathematical description of the TRW error regression program (REMP).
Appendix C presents the preflight calibration history plots.
3150-60Z7-R8-000
Page 2-i
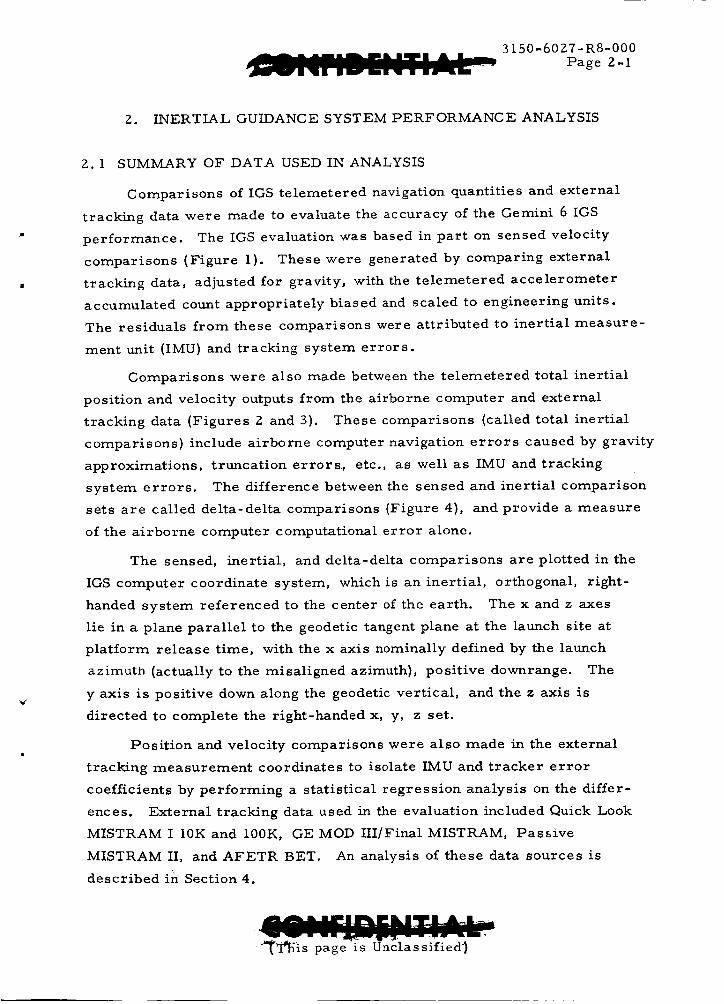
Z. INERTIAL GUIDANCE SYSTEM PERFORMANCE ANALYSIS
"ig'
Z. 1 SUMMARY OF DATA USED IN ANALYSIS
Comparisons of IGS telemetered navigation quantities and external
tracking data were made to evaluate the accuracy of the Gemini 6 IGS
performance. The IGS evaluation was based in part on sensed velocity
comparisons (Figure 1). These were generated by comparing external
tracking data, adjusted for gravity, with the telemetered accelerometer
accumulated count appropriately biased and scaled to engineering units.
The residuals from these comparisons were attributed to inertial measure-
ment unit (IMU) and tracking system errors.
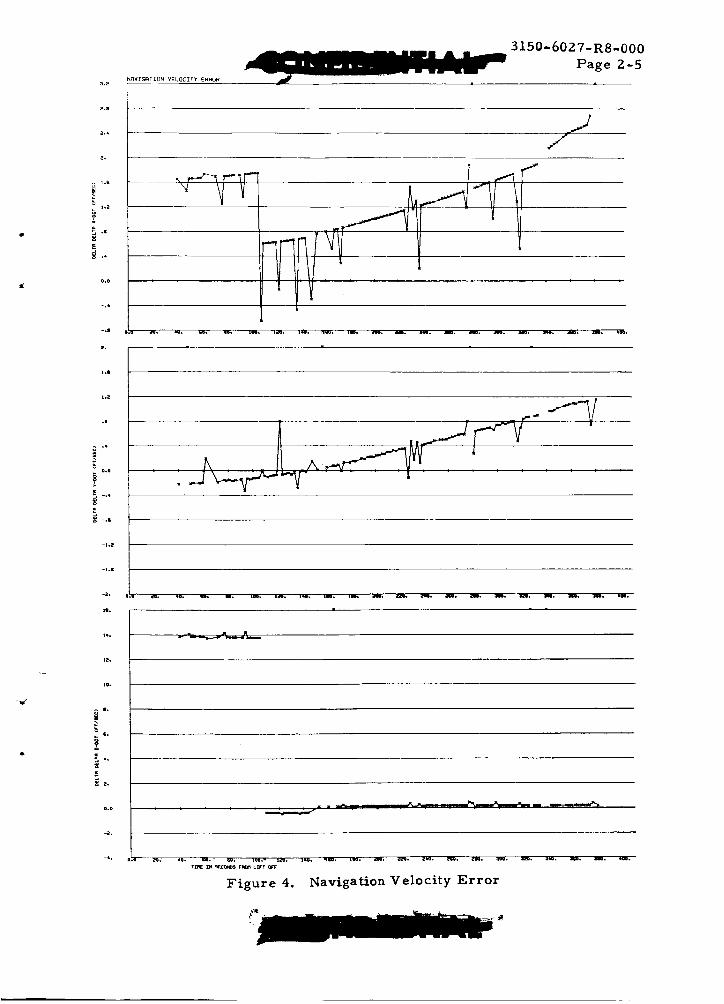
Comparisons were also made between the telemetered total inertial
position and velocity outputs from the airborne computer and external
tracking data (Figures Z and 3). These comparisons (called total inertial
comparisons) include airborne computer navigation errors caused by gravity
approximations, truncation errors, etc., as well as IMU and tracking
system errors. The difference between the sensed and inertial comparison
sets are called delta-delta comparisons (Figure 4), and provide a measure
of the airborne computer computational error alone.
The sensed, inertial, and delta-delta comparisons are plotted in the
IGS computer coordinate system, which is an inertial, orthogonal, right-
handed system referenced to the center of the earth. The x and z axes
lie in a plane parallel to the geodetic tangent plane at the launch site at
platform release time, with the x axis nominally defined by the launch
azimuth (actually to the misaligned azimuth), positive downrange. The
y axis is positive down along the geodetic vertical, and the z axis is
directed to complete the right-handed x, y, z set.
Position and velocity comparisons were also made in the external
tracking measurement coordinates to isolate IMU and tracker error
coefficients by performing a statistical regression analysis on the differ-
ences. External tracking data used in the evaluation included Quick Look
MISTRAM I 10K and 100K, GE MOD I/I/Final MISTRAM, Passive
MISTRAM II, and AFETR BET. An analysis of these data sources is
described in Section 4.
"_is page is UnclassifiedJ
3150-60Z7-R8-000
Page Z-Z
o,o
SENSED VELOCITY COMPARISON IN CO"PUIER COORDINATES
/
s.
, o.a
-s.
-|.
TIrll[ IN _cl_¢s F_ L_:T _F
Figure t. GE/Final and t00K MISTRAMAV, Sensed Coordinates

14,
ii.
Is.
i,
s.
,_o
°4.
:6.
ii1o
ii.
¢o
_ s°0
-i°
°6o
-s,
o
I1o
|.
¢.
-s,
-Io,
TOTAL INERTIAL VELOCTTY COtlPt_CZSON TH COMPUTER C0{_()rNAT£.S
3150-6027-R8-000
Page 2-3
o mlTIIAN II_Z
x _ Fot_tL
.\
T:r_ Xn UC_P_ r_ LZFT a_
Figmre 2. GE/Final and 100K MISTRAMAV, Guidance InertialC oo rdinat e s

3150-6027-R8-000Page 2-4
is_. TOTRL I_RTIAL POSITION COtlP_L_Ol_ IN COflPUTER COOQDINATES
1'09, ....
o M*STRA_ ioo
x a( FINAL
IOOO.
Goo.
._ 2oo.
200.
-400.
JSO0,
1400.
1_00. JI
\
_200. /
, /1ooo. 1
Ioo.
soo.
,oo.
o.o
-_oo.
Imll_ J i i
Figure 3. Gl_./Final and 100K 1VLISTI_M Z_P, Guidance InertialCoordinates
2.2
E
Q,o
-.s
2,
NRVIC_qTION VELOCITY EN_W
3150-6027-R8-000
Page Z-5
I
! I
i.i
1.2
.s
-I .s
is.
-,d
i,.
io.
.w
_*,
o.o
-_°
-_.
yln£ IN ,_c_.iDsF_ L_T
Figure 4. Navigation Velocity Error

3150-6027-R8-000
Page 2-6
The plots enclosed are referenced to liftoff time (13:37:26:471 GMT)
which occurred 3. 279 seconds after IGS "platform release."
Z. Z INERTIAL GUIDANCE SYSTEM ERROR
The indicated inertial guidance system errors following the end of
the powered ascent phase (SECO + Z0, 359 seconds from liftoff) are con-
tained in Table I. These errors were obtained from an analysis of avail-
able tracking and guidance data. For purposes of presentation, Figures 2
and 3 have been included, although the regression analysis which recovers
the I/VIU error was performed in the tracker domain. The column headed
"IMU Error" represents the error contributed by the accelerometer, gyro,
and initial platform alignment sources. The column headed "Navigation
Equation Errors" is the contribution due to various approximations within
the airborne computer as observed from the delta-delta comparisons,
and the column titled "Total Guidance Errors" is the sum of the two and
represents the total IGS error. These total errors result in velocity
magnitude and flight path angle errors at SECO + Z0 seconds of the following
amounts:
Z_ IVl= 1.0 ft/sec
Z_V = -0. OZ deg (indicating the guidance velocityvector is pitched down}
Table 1 also presents simulated navigation errors. # With the excep-
tion of the large x position error, the actual navigation errors approximate
the simulation values. The major contributor to the 1048-foot x error was
an IGS initial x position error of approximately 700 feet (Figure 3). This
error is associated with the airborne computer's detection of platform
release time and suggests that the IGS computer began navigation early by
approximately 0.45 second. The remaining 400 feet of x position naviga-
tion error is due principally to the integration of the x velocity error.
SThe preflight values were determined from simulation results obtained
from IBM. Since no exact simulation of the Gemini 6 trajectory wasavailable, values were obtained by interpolating from a series of simu-lations for similar trajectories with various launch azimuths.
(This page is Unclassified)
3150-6027-R8-000
Page Z-7
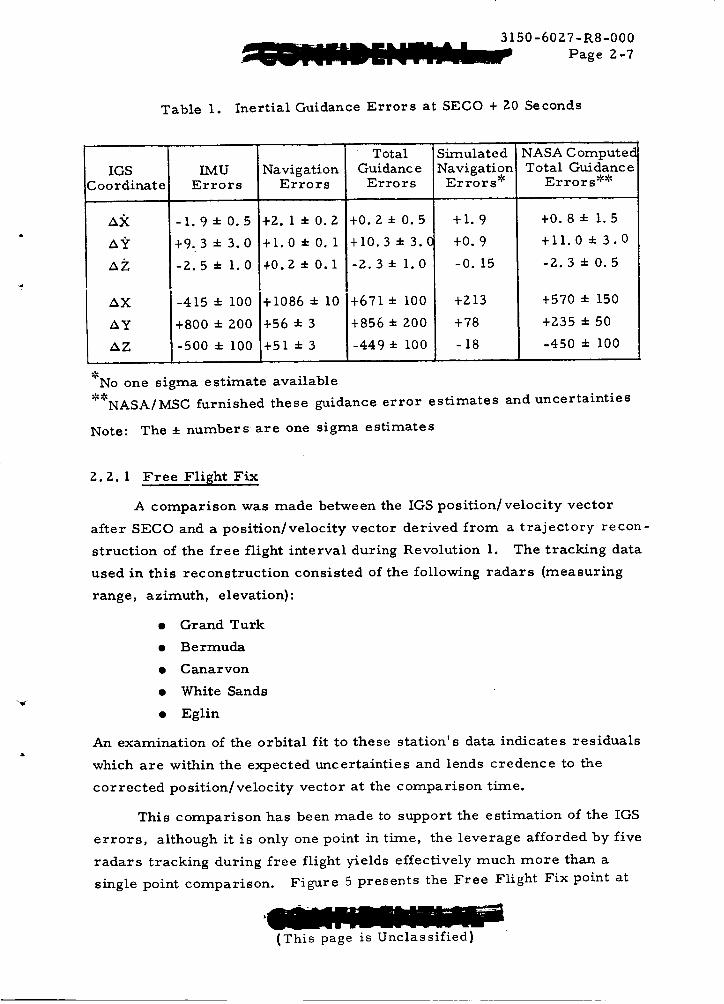
Table I. Inertial Guidance Errors at SECO + Z0 Seconds
IGS
Coordinate
_X
_2
IMU
Errors
-1.9±0.5
+9.3+3.0
-2.5± 1.0
NavigationErrors
+Z. 1 +0. Z
+i.0±0. I
+0.Z • 0. I
TotalGuidanceErrors
+0.2+0.5
+10.3 ± 3. C
-2.3± 1.0
AX -415 ± I00 +1086 ± i0 +671± I00
Ay +800 ± Z00 +56 ± 3 +856± Z00
AZ -500 ± I00 +51 ± 3 -449± I00
Simulated
:NavigationErrors _
+1.9
+0.9
-0. 15
+Z13
+78
-18
NASA ComputedTotal Guidance
Errors _c
+0.8± 1.5
+II.0 ± 3.0
-2.3±0.5
+570 ± 150
+Z35 ± 50
-450 ± i00
*No one sigma estimate available
*$NASA/MSC furnished these guidance error estimates and uncertainties
Note: The ± numbers are one sigma estimates
Z. 2. 1 Free Flight Fix
A comparison was made between the IGS position/velocity vector
after SECO and a position/velocity vector derived from a trajectory recon-
struction of the free flight interval during Revolution 1. The tracking data
used in this reconstruction consisted of the following radars (measuring
range, azimuth, elevation):
• Grand Turk
• Bermuda
• Canarvon
• White Sands
• Eglin
An examination of the orbital fit to these station's data indicates residuals
which are within the expected uncertainties and lends credence to the
corrected position/velocity vector at the comparison time.
This comparison has been made to support the estimation of the IGS
errors, although it is only one point in time, the leverage afforded by five
radars tracking during free flight yields effectively much more than a
single point comparison. Figure 5 presents the Free Flight Fix point at
(This page is Unclassified}
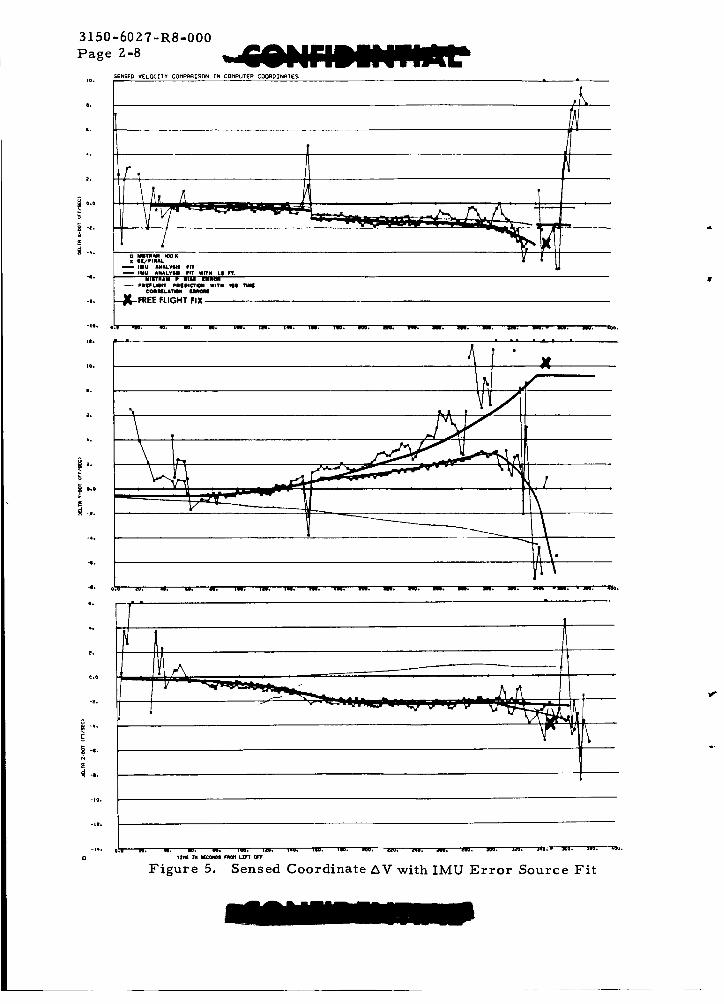
s.
s.
c
-s.
|
-io.
ii.
IOo
I,
_o
_o
a
_.
_ o.o
-_o
omo
s,
4.
eo
¢.o
-eo
_ -s.
¢
-LOo
-14.
El
OMU LmALTWS FIT
¢oemm.A_ m
--I_-FREE FLIGHT FIX
.........Jz...
TXnZ ZWW_OS Pl01 TOUr
Figure 5. Sensed CoordinateAVwithlMU Error Source Fit
3150-60ZY-R8-000
Page 2-9
349 seconds as a heavy X. The most important direction is the vertical,
as evidenced by the diverging tracker comparisons (Figure 5). The
accuracy of the Free Flight Fix point is assumed to be about ±Z ft/sec
in the vertical and downrange directions and about ±5 ft/sec in crossrange.
The GE and MISTRAM uncertainties (including biases) are both about + I0
ft/sec in the vertical direction at the time of comparison.
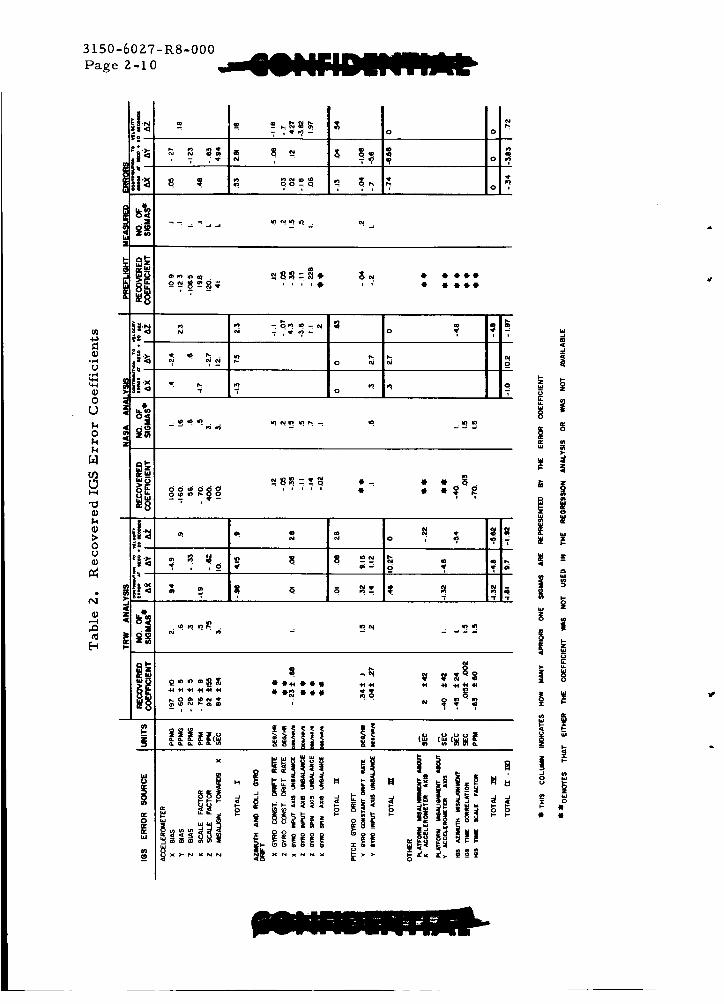
Z. 3 INERTIAL MEASUREMENT UNIT ERROR ANALYSIS
Z. 3. I IIV[U Error
Analyses to recover I_MU error source coefficients were performed
by using procedures and data processing programs as documented in Refer-
ence i with the exception that the Recursive Error Modeling Program
(REMP) was used for regression analysis. The I_A4U error source coeffi-
cients recovered in the analysis are presented in Table Z. These were
recovered as follows:
a) Errors in the accelerometer biases were recovered during
orbit phases of flight, and the ascent comparisons were
precompensated for their effect (Section Z. 3.3).
b) IGS/tracker comparisons were made in the rate domain of
the tracking systems and a regression analysis was per-formed in that domain.
The general effect of IMU errors on the Gemini 6 ascent flight can
be seen in the IGS/GE Mod III final sensed velocity comparison (Figure I).
These show x, y, and z velocity differences that build up to -0.5, I. 0,
and -I. 5 ft/sec at the end of the booster stage (BECO), and -Z, I0, and
-2 ft/sec at SECO, respectively.
The dominant errors that contributed to the x axis residuals were a
time correlation error of 0.015 second, a time scale factor (IGS clock
drift) error of -63 parts per million (ppm), and an X accelerometer scale
factor error of -76 ppm. The timing errors were evidenced by -0.5 and
I. 5 ft/sec jumps in the x velocity residuals at BECO and SECO, respec-
tively. The minus sign associated with the clock drift error indicates that
the onboard clock is running too fast.
The recovered IGS error coefficients presented in Table Z that account
for the maior portion of y axis residuals were the X accelerometer bias
(which results in an initial misalignment error about the Y accelerometer),
(This page is Unclassified) '_
3150-60Z7-R8-000
Page _.-I0
0
L)
0
0
U
bt
m @
_i.._ ,_ _ _;Ii--
"_ -
_|._ _
"T
_-
_ " .,_
m
• -.x
_Nm_0070
W_'_ .
0
"? i , i"
o m,
-: o_ _ -.:_-; ,_" _-
o
o
• • •'1'•
i i
o
.--: ,
u_ I u_
x
! w_
_m
_"N
if°I il_. !i_._
|____
i
ii
z
3150-6027-R8-000
Page Z-I 1
the Z accelerometer misalignment and scale factor, the Y gyro constant
drift rate, and the platform misalignment about the accelerometer Y axis.
The Y gyro drift and platform misalignment also contributed significantly
to the x axis residuals.
The z axis residuals show a velocity error of approximately - 1.0
ft/sec at 140 seconds. This is attributable to an azimuth misalignment of
-45 arc seconds (Section 2.4 discusses the azimuth updating). The residuals
then show a nearly constant -Z. 0 ft/sec error between 180 and 330 seconds.
This trend resulted lrom the iGS azim_G_ L,li_ali s ....... t and the _art__ally
compensating X gyro input axis unbalance drift.
Figure 5 presents the velocity comparisons between IMU and tracking
data in several combinations. The very heavy line denotes the total effect
of the IMU errors recovered in the regression analysis. It is observed that
this heavy line fits all the curves within anticipated bounds except for the
MISTRAM 100K comparison in the y direction. Analysis of the MISTRAM
data revealed a P bias in that system of - 1.5 feet (100K baseline) (Section 4).
When the effect of this bias is accounted for, the fit improves to an accept-
able level. It should be noted that since the regression analysis was
accomplished in the rate domain (1_ 15 Q) of the tracker any strictly DC
bias (i.e., ambiguities) will not affect the regression solution.
2.3. Z Honeywell Preflight Error Coefficient Prediction
A set of predicted IGS error source coefficients was determined by
Honeywell based upon a final instrument calibration. These are presented
in Table 2 along with error sources recovered from both the NASA and TRW
postflight analysis. The most significant observation is that the total X gyro
drift rate (constant plus unbalance) determined postflight equals the sum-
mation of the predicted X gyro drifts. No attempt was made to distinguish
between the types of X gyro drift in the postflight analysis because of the
high correlation between their velocity propagations on the flight. Other-
wise, there is little similarity between the preflight and postflight error
source coefficients. Figure 5 shows a prdpagation of the velocity error
due to the preflight estimated error coefficients on the observed residuals
(combined with actual IGS timing errors). A reasonable fit to the x axis
residuals was obtained, and the z axis discrepancy is for the most part
attributable to the IGS azimuth update error on this flight. However, the

3150-6027-R8-000
Page 2- I2
predicted y error is one-half the magnitude and of the opposite sign to
compensate the TRW proposed flight error. Section 2.3. 5 gives additional
evaluation of the preflight values,-and Appendix C presents calibration
history plots.
2.3.3 Accelerometer Bias Updating
An inflight updating of the X accelerometer bias value was accom-
plished after Revolution 3 of the Gemini 6 orbit. The X bias error was
determined to be approximately 198 ppmg and was corrected onboard for
that amount. The bias values before and after correction are presented
in Table 3. Figures 6 through 8 are plots of IGS sensed velocities during
intervals of Revolutions 3, 5, and 8 when no thrusting was being applied.
The slopes of the velocity plots provide an estimate of the accelerometer
bias errors. Comparisons of the velocity slopes of Revolution 3 (before
bias correction) with those of Revolution 5 and 6 (after bias correction)
show that the X accelerometer bias error calculation was adeguate. Table 4
summarizes the accelerometer bias values determined from the sensed
velocity plots.
Table 3. Accelerometer Bias Constants
Before After Difference
Updating Updating {ppm g)
KX I.8058311 I. 870000 198
KY -0. 07332507 -0. 07332507 0
KZ 0. 08083010 0. 08083010 0
Table 4. Accelerometer Bias Error (Determined fromSensed Velocities)
Revolution No. Accelerometer Bias (ppm g)x y
3 (before update) 198 -24.5 -73
5 (after update) - 13.2 -28.7 -59.5
8 - 14.5 -28.8 -60.2
3150-60ZT-R8-000
Page Z-L3
I-4
>i
tU_U_n"-r
N>_h_E
C_
>W(E
COIp-tO
I
|
| xo
_o
N
_o
(._lS/,
_o
I
I
1M¢
¢
o
i]s
-p
!
F
II
rl
iB
i
i.
i
lk
/,I v
o_
_>
Q¢1- °P!
p..4o
UZ 0m i---4
,,,0
0
1J
k
.el
3150-60Z7-R8-000
Z-14 "Pagepail i mild _ -
lb
tSiJ.I
('_ X ),- N
rr
hirt"
(.0I xQ,,d
I...-
Q.)
N
0
0
Q_
{).)
"U0
r,,.,4
q.)
i>
0,)
kIN z
.r4
=" W, i::d
|
e_ Q m o
_3S l.L:l) ._I.I_X)'I".J_Q]ISI_

3150-6027-R8-000
Page Z-15
w'
ID$
o,
.t
Pi
J_o
JJ
(:_IONI ,I
; I .L.-I)
)O_'_IA (
I
qr
oo
0.I,4
0
t_
u0
t_
o_
°;.-4

3150-6027-R8-000
Page 2-16 i ' •
Z. 3.4 Error Coefficient Recovery
Regression analyses were performed on the residuals between the
tracking data and the IGS data corrected for the free flight recovered
accelerometer bias since these biases were considered to be well estab-
lished. A minimization of the regression error model size is desirable
due to the high correlation among many Gemini IMU error sources. There-
fore, the following representative error model was chosen for the regression.
IGS Sources:
XSF = X accelerometer scale factor error
ZSF = Z accelerometer scale factor error
ZXMSL = Z accelerometer misalignment toward X
YGCDR = Y gyro constant drift rate
XGIAU = X gyro input axis unbalance
YGIAU = Y gyro input axis unbalance
PHIX = Platform misalignment about the X accel_rometer axis
PHIY = Platform misalignment about the Y acceler.ometer axis
PHIZ = Platform misalignment about the Z accelerometer axis
POX = X computer axis position bias
POY = Y computer axis position bias
POZ = Z computer axis position bias
DT = Time correlation error
TSF = Timing scale factor.
Tracker Sources:
MISTRAM II passive range sum rate bias
The regression domain chosen was the following:
10K MISTRAM
100K MISTRAM
GE Final (Mod III)
Passive MISTRAM
RSUM
.strM
The following eight guidance errors were omitted from the regression
solution but their statistical affect is accounted for in the regression
program.
(This page is Unclassified)

3150-60ZT-R8,000
Page Z -17
Z gyro input axis unbalance
X gy.ro spin axis unbalance
Y gyro spin axis unbalance
Z gyro spin axis unbalance
Z gyro constant drift rate
X velocity bias
Y velocity bias
Z velocity bias
Carrying these terms for their statistical affect means the following:
More than likely, these errors are present to some degree in the system,
and since many of them look alike it would be difficult to separate them
from one another mthis dilema usually manifests itself in the form of large
(many sigma) errors which tend to compensate one another. Solving only
for a representative set of errors usually avoids this phenomenon. How-
ever, the accuracy of the resulting error coefficients must reflect the
fact that they are indeed only a representative set. The mathematics of
this procedure is presented in Appendix B.
The results of the regression analysis have been presented, in part,
in Table 2. In addition to the I_A4U errors, a range rate bias error of
-0. 18 • 0.06 ft/sec was found in the MISTRAM II system. This error
is well within the apriori uncertainty of 0.5 ft/sec. No other tracking
errors were considered and none were carried statistically in the solution.
The regression results were not as good as anticipated; the normalized
RMS of the residuals remaining after the regression fit was i. 9, ideally it
would be i. 0. This means that either a total (3 trackers, 9 observations)
effective one sigma error remains in the data or the noise estimates of
the input I_A/[U-tracker comparisons were incorrect (they would have to
have been estimated too small). More than likely, a combination of these
has resulted in this large RMS.
Recovery of the MISTIq.AM I and II and GE Mod III position bias was
accomplished by compensating the IIV[U/tracker position domain residuals
with the errors recovered in the regression analysis and estimating the
bias levels from the remaining position errors (Section 4).
3150-60Z7-R8-000
Page Z-18
The IIVIU model used in the regression analysis was based on engineer-
ing judgement. The preflight model and coefficients did not influence the
regression analysis, and, as it turns out, the preflight values are insufficient
to correct the observed IMU errors. The recovered LIV[U coefficients are
all tolerable (within specification) with the exception of the Z accelerorneter
misalignment toward X. This 3 sigma coefficient (84 s_c) has an _ posteriori
uncertainty of Z4 se'_c,which is slightly less than the specification (30 _c).
This indicates that the flight test did improve the statistical knowledge of
this error somewhat. The following information was obtained about this and
other coefficients from examining the regression computer runs:
a) ZXMSL i$ not excessively correlated with other termsin the fit.
b) Along with the following terms ZXMSL did the most towards
fitting the data.
XSF
XGIAU
(X Accelerometer Scale Factor)
(X Gyro Input Axis Unbalance)
c)
d)
e)
As the regression solution (Recursive Error Modeling
Program) proceeded, solving the least squares solutionagain with the addition of each new error term the ZXMSL
coefficient remained relatively stable--its variationremaining within the a posteriori one sigma level. Thistends to indicate that no serious compensational effectsare occurring with all error coefficients other than G3(4),XSF, DT, TSF, PHIZ, and ZSF which were in the solu-tion ahead of ZXMSL.
Error terms which change significantly when ZXMSLenters the solution change well within their one sigmauncertainty.
Exactly half of the other error sources had more statisticalimprovement from the flight test._ The following tableindicates the order of statistical improvement of therecovered coefficients (best at the top left etc.)
XSF POX POY YGCDR
G3 (4) POZ PHIX YGIAU
DT PHIZ PHIY YGIAU
TSF ZXMSL ZSF
"_;Irnprovement may be defined here as the ratio of the a priori to the
a posteriori uncert_

7-R8-000
Page 2-19
In light of these points it is reasonable to believe that the system
suffers either the indicated ZXMSL error or some very similar error
produced by a combination of the omitted errors. This latter possibly
being less likely than the first.
Z. 3.5 December 12 Gemini 6 Attempted Launch Data Analysis
The Gemini 6 mission schedule for lZ December 1965 was cancelled
just prior to liftoff. However, the IGS was in the ascent mode for approxi-
mately _^ =....... _ _xoJv _=_v,,d_, _,.,, . ._.,. tc!e:netry _o+___.__,,#,'_............. rn11_c't_.cl.
An analysis of the data was conducted in an effort to recover I/VIU
error sources. The IGS sensed velocity error curves of the cancelled
mission are presented in Figure 9. The x and z errors build up proportional
to t z (time squared) indicating a platform drift rate, and the y error builds
up linearly indicating an error source proportional to the integral of gravity.
The IMU error sources that could have caused the velocity errors were:
x Axis
Y gyro constant drift
and/or
Y gyro input axis unbalance
-0.20 deg/hr (/g) (total)
(pitch down drift)
z Axis
X gyro constant drift
and/or
X gyro input axis unbalance
-0.43 deg/hr (/g) (total)
(z axis down drift)
),Axis
IGS time scale factor
and] or
Z accelerometer bias
and/or
Z accelerometer scale factor
276 ppm (g) (total}
No distinction between g dependent and non g dependent drift could be made
since the IMU senses a constant lg input. The true error sources could
have been combinations of the error sources or any one alone, but having
(This page is Unclassified}

3150-6077-R8-000
Page Z-Z 0
I
o
o
o
o x
"'!
i i
_C
I
8
o
0
k
4_
0
0,.Q
",D
0
o:
3150-60ZT-R8-000
Page Z-21
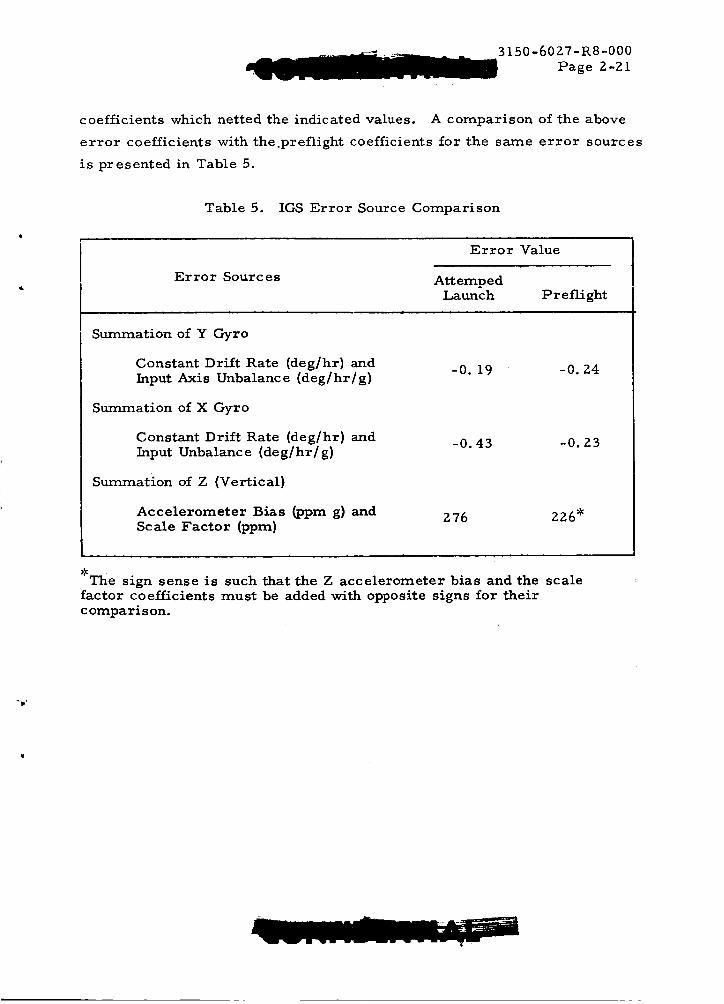
coefficients which netted the indicated values. A comparison of the above
error coefficients with thepreflight coefficients for the same error sources
is presented in Table 5.
Table 5. IGS Error Source Comparison
Error Sources
Error Value
AttempedLaunch Preflight
Summation of Y Gyro
Constant Drift Rate (deg/hr) and
Input Axis Unbalance (deg/hr/g)
Summation of X Gyro
Constant Drift Rate (deg/hr) andInput Unbalance (deg/hr/g)
Summation of Z (Vertical)
Accelerometer Bias (ppm g) andScale Factor (ppm)
-0. 19 -0.24
-0.43 -0.23
276 226"
*The sign sense is such that the Z accelerometer bias and the scale
factor coefficients must be added with opposite signs for theirc ompa ri s on.

3150-6027-R8-000
Page 2-22
When the actual flight test results are considered, Table 5 becomes
rather inconclusive. Both the attempted launch data and preflight data
indicate a positive pitch {up) error whiie the postflight data indicates the
opposite situation. The X gyro errors are different by one sigma speci-
fication (_0.2 deg/hr) and the postflight data supports the preflight value
of -0.23 deg/hr/g.
If it is assumed that the postflight determined onboard clock drift
was correct for the attempted launch, the attempted launch value for the
total of Z bias _ind scale factor should be 339 ppm (g), not 276, indicating
a difference of i00 ppm with the preflight data. Since it is not known what
clock is used, (or its accuracy) in preflight testing, little can be said
regarding the value of the vertical direction comparisons. In light of
all these discrepancies, nothing of real value can be extracted from the
attempted launch data to support or refute the postflight determined errors.
It appears, in fact, that the limited and static test afforded by the can-
celled launch cannot be compared to the dynamic test of the flight either
due to lack of system stability or the severe change of the test environment.
2.4 AZIMUTH UPDATE
An IGS azimuth alignment correction is calculated at three separate
times by the onboard computer. On the first pass through the navigation
equations after platform release, the roll gimbal angle reading is com-
pared with the desired value, and the difference is used as a correction
to the intended flight azimuth. This correction is called A_ x, where a
positive value implies that the platform is rotated clockwise from the
desired azimuth.
Additional azimuth' corrections are made during flight at i00 and
i40 seconds after liftoff. These are calculated by comparing the cross-
range {z direction) velocity as measured by GE/Burroughs with that de-
rived from the airborne system and attributing the residual to a platform
misalignment about the vertical axis.
The calculated updates are not telemetered; however, they are
obtained quite accurately from the data analysis. Table 6 summarizes
the updates determined by the following methods:
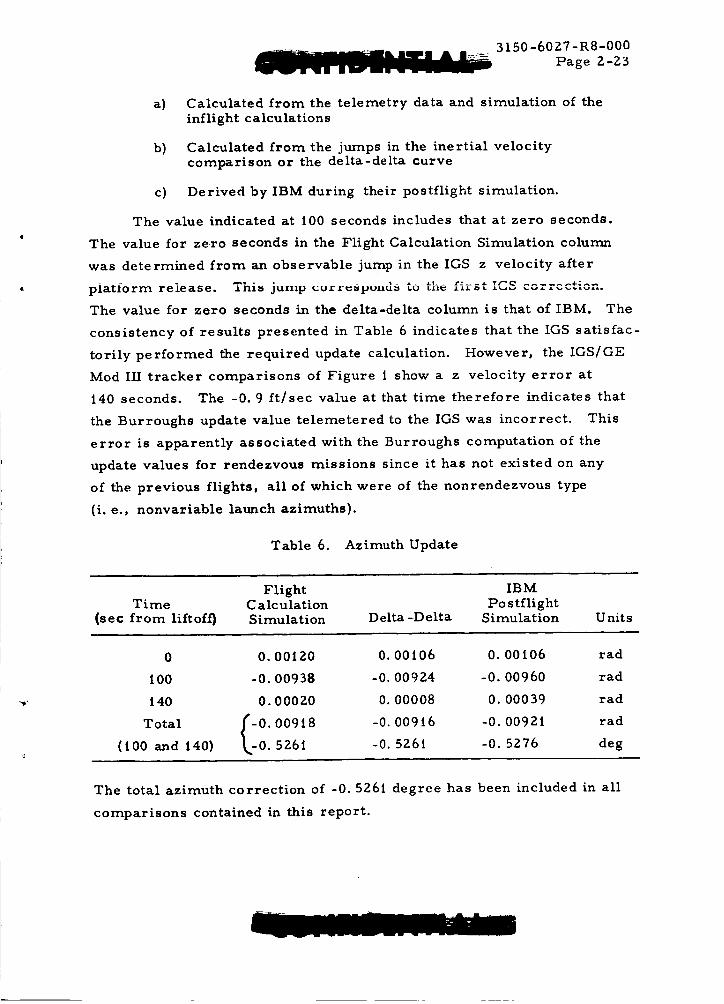
3150-6027-R8-000
Page Z-Z3
a) Calculated from the telemetry data and simulation of the
inflight calculations
b) Calculated from the jumps in the inertial velocity
comparison or the delta-delta curve
c) Derived by IBM during their postflight simulation.
The value indicated at I00 seconds includes that at zero seconds.
The value for zero seconds in the Flight Calculation Simulation column
was determined from an observable jump in the IGS z velocity after
platform release. This jump corr_spo**ds to .... first ,r-e ...... _^_
The value for zero seconds in the delta-delta column is that of IBM. The
consistency of results presented in Table 6 indicates that the IGS satisfac-
torily performed the required update calculation. However, the IGS/GE
Mod III tracker comparisons of Figure ! show a z velocity error at
i40 seconds. The -0.9 ft/sec value at that time therefore indicates that
the Burroughs update value telemetered to the IGS was incorrect. This
error is apparently associated with the Burroughs computation of the
update values for rendezvous missions since it has not existed on any
of the previous flights, all of which were of the nonrendezvous type
(i. e., nonvariable launch azimuths).
Table 6. Azimuth Update
Flight IBM
Time C alculation Po s t flight
(sec from liftoff) Simulation Delta-Delta Simulation Units
0 0.00i20 0. 00106 0. 00i06 rad
100 -0. 00938 -0. 00924 -0. 00960 rad
i40 0. 000Z0 0. 00008 0. 00039 rad
000 ,6000 ,(100 and i40) 526i -0. 5Z61 -0. 5276 deg
The total azimuth correction of -0. 5261 degree has been included in all
comparisons contained in this report.
3150-60Z7-R8-000
Page Z-24
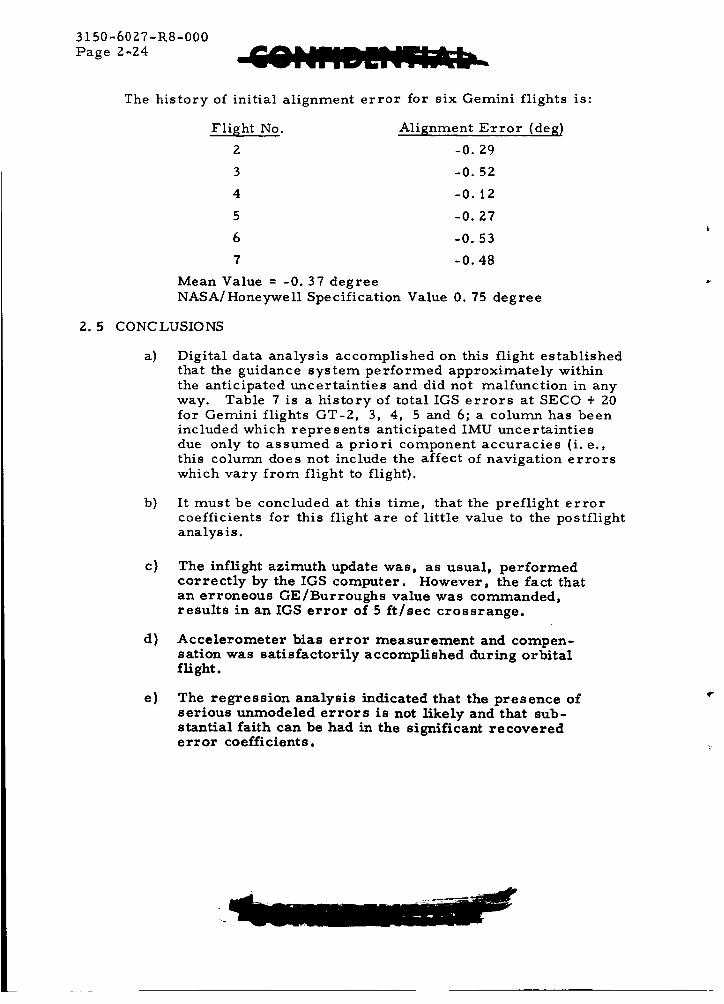
The history of initial alignment error for six Gemini flights is:
Flight No. Alignment Error (deg)
2 -0. Z9
3 -0.52
4 -0. 12
5 -0.27
6 -0.53
7 -0.48
Mean Value = -0.37 degree
NASA/Honeywell Specification Value 0. 75 degree
2. 5 CONCLUSIONS
a) Digital data analysis accomplished on this flight establishedthat the guidance system performed approximately withinthe anticipated uncertainties and did not malfunction in any
way. Table 7 is a history of total IGS errors at SECO + 20for Gemini flights GT-Z, 3, 4, 5 and 6; a column has beenincluded which represents anticipated IMU uncertaintiesdue only to assumed a priori component accuracies (i. e.,this column does not include the affect of navigation errorswhich vary from flight to flight).
h) It must be concluded at this time, that the preflight errorcoefficients for this flight are of little value to the postflightanalys is.
c)
d)
The inflight azimuth update was, as usual, performedcorrectly by the IGS computer. However, the fact thatan erroneous GE/Burroughs value was commanded,
results in an IGS error of 5 ft/sec crossrange.
Accelerometer bias error measurement and compen-sation was satisfactorily accomplished during orbitalflight.
e) The regression analysis indicated that the presence ofserious unmodeled errors is not likely and that sub-stantial faith can be had in the significant recoverederror coefficients.
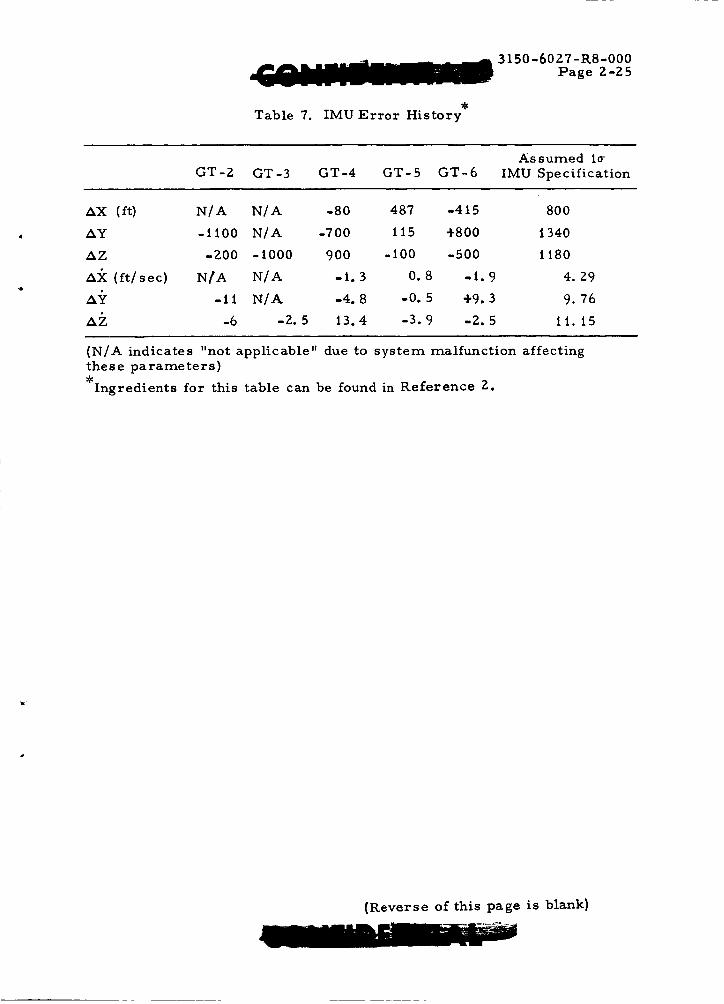
Table 7. IMU Error History
3150-6027-1%8-000
Page 2-25
Assumed 1_
GT-Z GT-3 GT-4 GT-5 GT-6 IMU Specification
_X (ft) N/A N/A -80 487 -415 800
Ay -t100 N/A -700 115 +800 1340
AZ -Z00 -I000 900 -I00 -500 Ii80
AI_ (ft/sec) NEA N/A -I. 3 0.8 -I. 9 4. 29
._Y -II N/A -4. 8 -0.5 +9.3 9. 76
_7 -6 -Z. 5 13.4 -3.9 lZ. 5 1 1 . 15
{N/A indicates "not applicable" due to system malfunction affectingthese parameters}#
Ingredients for this table can be found in Reference Z.
(Reverse of this page is blank)
3150-60ZT-R8-000
Page 3-1
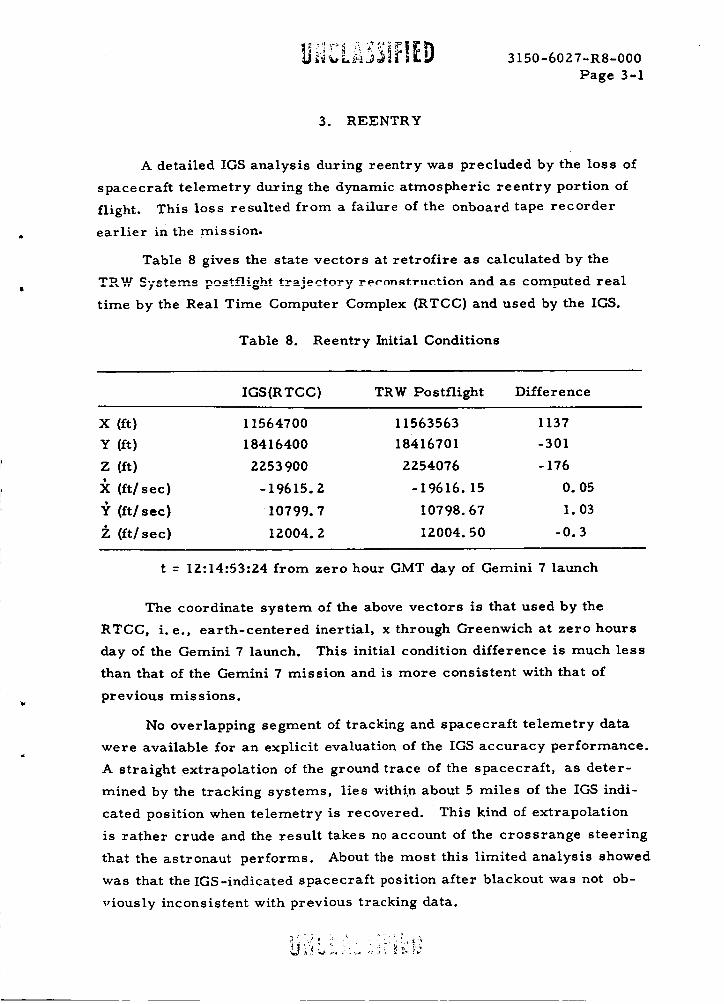
3. REENTRY
A detailed IGS analysis during reentry was precluded by the loss of
spacecraft telemetry during the dynamic atmospheric reentry portion of
flight. This loss resulted from a failure of the onboard tape recorder
earlier in the mission.
Table 8 gives the state vectors at retrofire as calculated by the
"Pz_, ¢..o+o,_o p,_tn_ght h-_ i_e-fn_-v rpcon._truction and as comuuted real
time by the Real Time Computer Complex (RTCC) and used by the IGS.
Table 8. Reentry Initial Conditions
IGS(RTCC) TRW Postflight Difference
X (ft) 11564700 11563563 1137
Y (ft) 18416400 18416701 -301
Z (It) 2253900 ZZ54076 -176
(ft/sec) -19615.2 -19616. 15 O. 05
_' (ft/sec) 10799.7 10798.67 I. 03
7. (ft/sec) IZ004. 2 12004.50 -0.3
t = 12:14:53:24 from zero hour GMT day of Gemini 7 launch
The coordinate system of the above vectors is that used by the
RTCC, i.e., earth-centered inertial, x through Greenwich at zero hours
day of the Gemini 7 launch. This initial condition difference is much less
than that of the Gemini 7 mission and is more consistent with that of
previous missions.
No overlapping segment of tracking and spacecraft telemetry data
were available for an explicit evaluation of the IGS accuracy performance.
A straight extrapolation of the ground trace of the spacecraft, as deter-
mined by the tracking systems, lies within about 5 miles of the IGS indi-
cated position when telemetry is recovered. This kind of extrapolation
is rather crude and the result takes no account of the crossrange steering
that the astronaut performs. About the most this limited analysis showed
was that the IGS-indicated spacecraft position after blackout was not ob-
viously inconsistent with previous tracking data.

3150-60ZT-R8-O00
Page 3-Z
Table 9 summarizes the Gemini 6 impact point determined by the
IGS and by the recovery ship. The target location is also presented.
It was concluded, from an analysis of the available data, that the IGS
estimate of actual impact is probably the more correct of the two.
Table 9. Gemini 6 Reentry Impact Location
Geodetic Latitude Longitude Target MissSource (deg North_ {deg West) (n mi)
Ship Z3. 375 67. 875 14.3
IGS Z3.7-0 67.74 7.3
Target Z3.61 67.83 ---
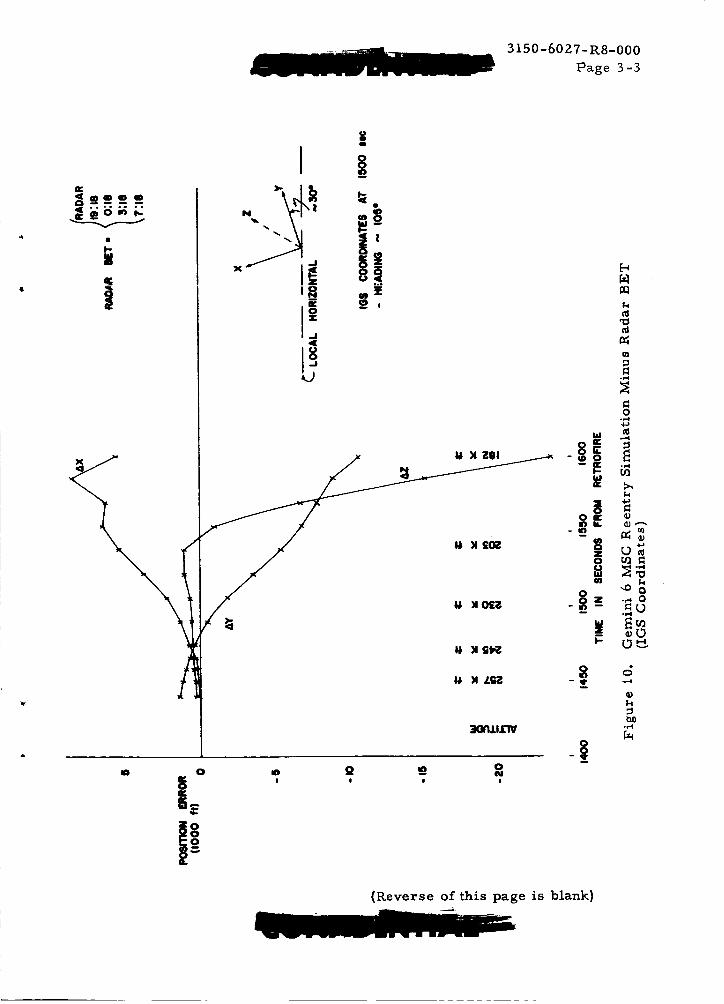
3. 1 REENTRY SIMULATION RESULTS
MSC/MPAD generated a reentry trajectory using a simulation that
had the following boundary conditions:
a) Spacecraft initial conditions were obtained from the White
Sands radar (WHS-16) vector during the free flight portionof reentry.
b) The end point was taken as the ship indicated pickupposition (Z3. 375°N, 67. 875°W).
c) In the absence of IGS telemetry of gimbal angles, spacecraftbank angles were assumed so as to give the ship impact.
The simulation showed reasonably good agreement with the TRW
postflight trajectory above 300,000 feet. Figure 10 is a comparison of
the simulation with the merge of radar tracking data during the high
acceleration atmospheric reentry interval of flight. There are fairly
large errors in the flight path direction (Ax and Ay); however, the most
interesting error is the very large negative trend in the crossrange z
direction. The error curve indicates 'that the simulation has placed the
spacecraft 4 n mi south of the radar estimate.
This comparison lends weight to the argument that the ship-indicated
pickup point is considerably south of the true impact, since at 18Z, 000 feet
a trajectory consistent with the ship value is already 4 miles in error to
the south.
3150-6027-R8-000
Page 3-3
XU )1 _01
U )0 lZ¢_
/
. |o
U )10tZ_ -_
U )1 gt_,
)1 4,,G"_ -q,
:]I01'IJ.I.L"W
l e e e
[.-i
!.1Ill
ii1
.,-,4
o
W _k
If) lL (11, --_
o t/l_
-|
(Reverse of this page is blank)
3150-6027-R8-000
Page 4-1
4. TRACKING SYSTEM PERFORMANCE
Tracking data available for analysis of the Gemini 6 IGS performance
during ascent included the following:
a) GE Mod III/Burroughs
b) GE Mod III/Final
c) MISTRAM I Quick Look 10K and 100K
d) Passive MISTRAM II
e) MISTRAM Final (GLAD)
f) Air Force Eastern Test Range _(AFETR) BET
Each of the above sets were used for position and velocity comparisons as
decribed in Section 2. The GE Mod III/Burroughs data were used for quick
look analyses; however, detailed analyses were subsequently accomplished
with the remaining sources.
An ensemble IMU/tracking system analysis was performed on this
flight and is discussed in Section 2. The tracker error sources recovered
by the analysis are presented in Table 9. Also presented are error sources
obtained by the AFETR, GLAD, and BET programs. Comparisons show
that there was generally good agreement among the recovered coefficients
for the various error source extractions.
The most significant of the recovered error sources were MISTRAM
I Pl0K and PI00K biases of -0.1 and -1.5 feet, respectively. The affects
of the Pl00K bias on IGS coordinate comparisons is discussed in Section 2
and is indicated in Figure 5.
The following sections provide a brief discussion of the tracking data.
To clearly show the tracking data quality, each set of data are compared
with the TRW Systems BET, which is IGS output corrected for the analyzed
error sources {Figures 11 through 24).
3150-6027-R8-000
Page 4-Z
4.1 GE MOD III
The GE Mod III tracking system consists of a rnonopulse radar
tracker that measures position and a doppler, interferometer rate system
that measures range rate, and two lateral rates. The data from this
system are available from two data extraction systems: 1) the Burroughs,
where the data are extracted at a 2 per second rate, and Z) the GE Flight
Data Recording (FDR) unit, where the data are sampled at a 10 per
second rate.
The Burroughs data consist of raw counts recorded on punched paper
tape. The data were transferred to magnetic tape at TRW Systems and
processed in the data reduction programs. The Mod III final data were
processed by GE/Syracuse from the 10 per second FDR output. The data
were available unsmoothed in measurement coordinates and in smoothed
Cartesian coordinates. The final measurement coordinate data
were used in the computer regression analyses discussed in Section 2.
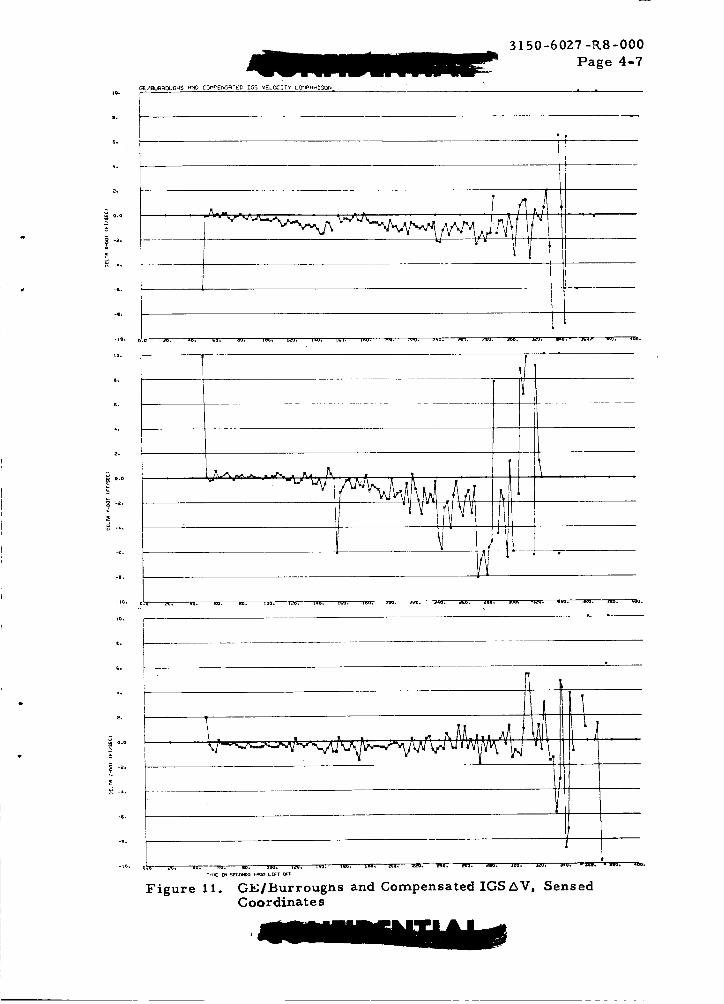
The quality of the Mod III data was relatively good, and the bias
errors were negligible (see Table 10). The GE final data are compared
with the IGS data before IMU error compensation in Figure 1 and after
compensations in Figures 13 and 14. Comparisons of the Burroughs and
compensated IGS data are presented in Figures 11. There was what
appears to be an elevation type error between the GE final data and the
TRW processed Burroughs data, which results in a 5 ft/sec difference in
at the end of flight. This error has been observed on previous flights
and is thought to be an error in the TRWfBurrouEhs reduction. The prob-
lem is being investigated. There is good agreement between the TRW
and GE/Syracuse reductions in the x and z directions except for a 5-mi]/i-
secondltiming difference.
4.2 MISTRAM DATA
4.2. 1 MISTRAM I Quick Look Data
The MISTRAM I quick look data received are corrected but unsmoothed
and in the system's measurement coordinates. This consists of R, P10K'
Pi00K' QIOK' and QI00K position data, where R is a range sum measure-
ment, Pl0K and Qi0K are range difference measurements from the i0,000-
foot baselines,and Pi00K and Qi00K are range difference measurements
3150-6027-._8-000
Page 4-3
0
..'4
Q
..'4
U
0
[-t
-! _ON_
_OOOO
_6666
iI I
@ >,
• -: c; c; 6 c;UC
D
I.,.1_ _ , ; ,_D
® D
w
D
k0
U_
,,D u_ !
.-/66
,_ • • |
!
-:66 '
.d _,i --; '
!
! iI II I
! !I I! I
U_ u_
O O O O
' 66-_c;
m
¢
u_ u_O O
_c; c;
O O
o66¢NI ! I
!
U
"0 "_
0 0 ,0 0
HU_
O
0
o
0
i°°m
I.,
3150-6027-R8-000
Page 4-4
from the 100, 000-foot baselines. The two sets of range difference
measurements along with the range sum measurement were processed to
give essentially two redundant sets of tracking data.
The MISTRAM I data were of good quality, but had PI00K and PIOK
biases of approximately -1.5 and -0. 1 feet, respectively. The effect of
the P bias was to cause the MISTRAM/IGS y velocity residuals to droop
starting near BECO and continue somewhat exponentially until termina-
tion of the data. Figure 5, which presents comparisons of the best esti-
mate of actual IGS error with that indicated by MISTRAM 100K residuals,
shows that the apparent y velocity error resulting from the P bias is -8
and -16 ft/sec at SECOand separation, respectively. Table 10 presents
other MISTRAM I errors recovered from analyses. The overall quality
of the MISTRAM I data is indicated in Figures 15 through 18, which
compare the MISTRAM I and compensated IGS data.
4. Z. Z MISTRAM II (Passive Mode)
MISTKAM II/compensated IGS comparisons are shown in Figures 19
and Z0. The analysis results show an approximate 0. 13 ft/sec range sum
rate bias and range sum bias of -Zl feet. The results also indicate P
and O biases of -I. 8 and -Z. 8 feet, respectively.
4.2.3 MISTRAM Final
The MISTRAM final is a best estimate trajectory based upon the
available MISTRAM data (both active and passive). The tracking
errors recovered by the GLAD BET program, which was used by
AFETR for the generations of MLSTRAM final, are listed in Table 10.
The recovered error source coefficients compare favorably with the TRW
analysis values and those derived from the range BET analysis, which
are also presented. Comparisons of MISTRAM final and compensated
IGS data are presented in Figures 21 and ZZ. These show little residual
x and z velocity differences, but a y velocity error of approximately
3 ft/sec at SECO. This residual difference resulted from an apparent
0.3-foot P bias excess correction applied to the MISTRAM 100K data used
in the MISTRAM final. A correction of 1.8 feet was used in the MISTRAM
final reduction, but the TRW analysis and AFETR BET indicated that
1.5 and 1.4-foot corrections, respectively, were necessary (see Table 10).
(This page is Unclassified)
i_,.? _ '¸ ....3150-60ZT-R8-000
Page 4-5
4.3 RANGE BET
Figures 23 and 24 show comparisons between compensated IGS and
the AFETR Best Estimate of Trajectory (BET). This BET combined the
measurements from MISTRA1VI I, 10K and 100K, MISTRAM II, GLOTRAC
(using the MISTRAM signal in a passive mode), GE Mod III {rate only),
and C-band FRQ-6 radars Number 19:18 (Merritt Island), 7:18 {Grand
Turk), 3:18 {GBI), and 0L18 {Patrick AFB). The program is a least
.......... n:..____^__ -.... _._ _ _._+_._+ _;_ _-_ n_l for p_rB .nh._'r-
ration is specified. The recovered bias magnitudes, Table I0, and the
AFETR BET/compensated IGS (TRW BET) residuals, Figure 23 and 24,
indicate very good agreement between the TRW and AFETR analyses.
4. 4 DISCUSSION OF TRACKING DATA EVALUATIONS
The judgement that Mod III data are good is relative to expected
performance. Thoughthe system appears to be relatively free of bias,
in actual fact the elevation angle data becomes very noisy under 10 degrees
elevation angle, and no precision angle information is available near the
end of flight where the elevation angle is 5 degrees. MISTRAM data,
which could, because of the ambiguities on biases, be judged as poor, is
in fact generally much superior to the Mod III data for postflight IGS
analysis purposes. This is because the problem with MISTRAM is uncor-
rected bias error though the data are relatively noise free for IGS analysis
purposes. At least ideally, the MISTRAM bias error can be extracted in
the postflight analysis; however, there is no way to obtain information
from the very noisy Mod III angular data at the lower elevati.on angles,
and usually this data is discarded from the analysis.
To carry the discussion one step further and show the scheme of
the analysis procedure, it is found that at elevation angles below 5 to
7 degrees the refraction correction becomes uncertain. This uncertainty
affects all ground tracking systems. At this point, trajectory accuracy
depends on the IGS, for though it is potentially the most biased of all the
systems, it has low noise throughout, and is not ordinarily subject to
abrupt level changes. It is insensitive to low elevation angles, and the
majority of its systematic errors are well defined and removable.
i

3150-6027-R8-000
Page 4-6
In summary, the higher elevation GE Mod III trackinK establishes
confidence in the MISTRAM angle measurements (P and Q). The bias-
corrected high precision MISTRAM allows detailed evaluation of the IGS
bias errors before the tracker angle data becomes uncertain at the very
end of flight. The corrected IGS output provides detailed trajectory
reconstruction over the unfavorable segments of the trajectory with
respect to the tracking systems, i.e., very early and very late in flight.
The evaluations of the tracking systems should be related to how each
fits into the analysis being attempted on Gemini. On this particular
flight the above procedure was implicit in the engineering analysis of the
IMUand tracking error sources. The tracking systems operated as well
as they ordinarily do and afforded considerable insight into the guidance
system errors. _ortunately, no large or unusual tracking errors were
present or at least detectable to any disturbing degree.
GEiBuRROUGHS ¢_ND C0r_PENSATED IGS VELOCITY L0_I_ISorl
3150-6027 -,_8-000
Page 4-7
|o.
u,
s,
e.
,3
o.o>
-lo. o -
io,
u.
6.
4,
-s,
-io,
4.
L
Figure If. G_S#Burrougbs and Compensated IGSAV, SensedCoordinate s
o.o
2-
.-_m.
,Air,_Ill_
, .l/!.
i i. IIII, i I
Figure LZ. GE/Burroughs and Compensated IGS _P, SensedCoordinate s

I0. 8E/FIP_ _ C(_PEN¢_qTED IGS VELOCITY CQflFgRISON 'm¢ _"
3150-6027-R.8-000
Page 4-9
t : ; •
I-
4,
-1o, ,_ ,,m, _, _. w, tim. lee. 1,4. iw. : sw, rim, m, i,,_. im, am, :m. a_. no, ._. Ja,
Io,
8,
e,
4.
|,
e°e
v,
_-,.
4.
-It.
to,
O,
II.
Q.
a,
5
E
d..4.
4°
4.
-to.
m
II
T°r_ ZN _ee_ Fn L_r _
Figure 13. GE/Final and CompensatedlGSAV, Sensed Coordinates

3150-60Z7-R8-000
Page 4-10
_E/FZhlFIL _ C_IPENSRTED ZG$ POSITION CDPIPRRZgO_I <, .
-IU.
-he°
-zoo,
_oo,
Ico.
o.o
-loll.
-+m_. • • i_. +o. io. io. iml. ii,. ]1o. imo. :io. _.oo. +r_. ++,.o. z41o. Iio. :loo. _'o+ 3,+o. _o. :11o.
+soo. • o _. +0. u. Io. 1_. orFl'_. +_. 1_. ll+o. i_o. m. +++o. _.so. llo. mlo+ +ao. a*o* .lu. :mlO.x TI_ Z, _C_'IOS ++iioi'i LIFt
Figure 14, GE/Final and Compensated ZGS AP, Sensed Coordinates
__. o.o
MISTRPtt Z tOOK _qt) COfIPENSATED IG$ VELEITY E(3f'_Z.,q_l"_ ''
3150-6027 -P,.8-O00
Page 4-11
I.
,i°
2.
I1_ o.o
,i
.4.
-8.
-to.
to.
I°
I.
_o
+t.
-8.
-IO. o.o _o. _. 0o. uo. ]c_. i_v. I_o. :so. leo. _oo. _o. e+o. _o. _,ao. 3oo. _o. 3_o. • _o. 380. too.
Tim: VN_r_+ ..........
Figure 15. MISTRAM I 100K and Compensated IGS ZSV, SensedC oor dinat e s
*oo,
300.
ZOO,
0,0
-$00.
c
o.o
2-
E
o.o
-300.
f
\
Jl i I i i
-soo. F zo. ,o. so. lzo. *oo. leo. *4o. tuo. *io. aoo. aao. 2,o. a_o. alo. zoo. _zo. _4o. _o. 3ao. ,co.
Figure lb. Ik41STRAM I IOOK and Compensated IGS Z_P, SensedCoordinates
to.
8.
oo
3150-6027-_8-000
Page 4-13
rlISTN_ I _ RHD corF_I_RTEL* IG5 V_LOCIIY CDr_RRI_ i ( _ _ _ - "', •
'.____________
-le, . ...................
i i iiiiiiiii iii4,
4o
-le, .e co, _,. w, . tw, tm lee, sue am m m _ ms. m m m _ m
W ¢oo
_-,.
_._, ,.r,............... ._,,A/I_[.L_,.T'1/!!.!
,[
Figure 17. MISTRAMI i0K and Compensated IGS/\V, SensedCoordinate s
1OOo
o,o
N
m- ,
|'_ l_ap I, _. _'u, W, ......imt IqnPL |@P. I_.. ir,o. lug .... LbO0 L'_O. _0. ['I0. m. 3OO 3_'0, ]6O, _0 _0, 400,
X
IL
lW,
e,o
y
o _. ,o. _. ,,, ..... ,,,,, _ , ,' _J ... .
' j
2o0.
_oo,
too,
o,o
-I00,
, l h l . i I
' ' _ - - _.L_____
-500, _i_, to, Io, 14}, I_, lilu, IIo, %10, liB, _. _I_, _Io, _ • llo, 31_, _, _wllh :I_, I, • _.r_ IN _ _ LIVT
Figure 18. MISTRAMI 10K and Compensated IGS _P, SensedC oor dinat e s
io.
II.
I.
+o
+.
_ o,o
-I,
-Io.
Io,
;150-6027-R8-000
Page 4-15
m.
i.
4,
z
-x,
-Io.
LO,
"t
I.
¢.
+.
+.
g
_-..
:I-,+.
4.
-IO. o.0
Figure 19. Passive MISTRAM and CompensatedIGS_V,Sensed Coordinates
,_14.
zoo.
iqlm.
ooo
i--.
- ,
..4mo
lira,
iN,
ooo
_ -IN,
if .._.
- ,
x
, J , , n | o o _ , , , u
NO.
2nN.
IW.
0ol
-lee.
i,-
, a , n | , o , , u , n , o , u u
Figure P-O. Passive MISTRAM and Compensated IGS _P,
Sensed Coordinates

_°
i°
o,o
c
4,
-go
-ll,
llh
II. rlZSTIkqll FIIIilL N4D CCIIPf_SATI_ I_J _LUI_.LIY _ZSO_ .
3150-60Z7-R8-000
Page 4-17
r-- •
41o
i".°
E
if.
........_..__:_jV_I
E
II-4.
4,
4,
-IO,
Figure Zi. AilSTRAM Final and Compensated IGSZ_V SensedCoordinates

3150-6027-R8-000 ,,
Page 4-18nISTl_ FZNP_ I:_ COI'_NS$1TED IGg POSITION COt_ISON
loll.
LIO0,
IO0.
O,O
-IO0°
_ -_°
-:1_°
f,l_,
/
loo.
ioo,
toll.
Ioo,
0.o
i -l_°
: : : _ i j_ ] _ [ i , i * u
..s_,
l lnl IN m _ CllrT 0_"
Figure 22. MISTRAM Final and Compensated IGSAPSensedCoordinates

_T Pd_q)CO_OIEhlSATED IG$ VELOCZTY COrlPf_f_Z_lqI0. • ' ,,
|.
R8-000
Page 4-19
?,W o.o
_ -,b.
2°
,3
O°O
z
-IS,
4.
-SO,
xtO*
8.
s.
a.
i o.o
-e°
-I°
-|o.
._____.__ ........... _-S_I
F.. A.-.
• _ m i_on t.llry or
Figure 23. Range BET and Compensated IGSA'_, SensedCoordinates
3150-6027-R8-000
Page 4-20
R_*4G( elET _ C(_'_(r4SFITED IGS POSITION CQMPeAI_soo.
34o..
_°
zoo.
o.o
_4
m.
0.0
P.
m.
L i . .,[ i j ,
J i _ i .. ,..,, I I I I I I
344o
a_lo.
ise.
o.0
r-
-tOO.
-,,oo.
i ii, , i , i II- I I
|, | L __
TZn[ )q m _ LIFT arF
Figure 24. Range BET and Compensated IGS LIP, SensedCoordinate s
3150-6027-R8-000
Page 5-1
5. TRAJECTORY RECONSTRUCTION
This section provides a description of the trajectory reconstruction
for the ascent and reentry flight phases. A listing of the BET is presented
in Appendix A.
The ascent data are provided in an earth-centered inertial coordi-
nate system. The z axis is aligned with the earth's rotational axis, posi-
tive north, and the x-y plane is the equatorial plane with the x-z plane
containing the Greenwich meridian at platform release time. Trajectory
parameters such as velocity magnitude, altitude, flight path angle, heading,
latitude, and longitude are also printed, as well as the sensed trajectory
from the "EDIT" program which includes the acceleration profile.
The ascent reconstruction consists of IGS data, corrected for IMU
error source magnitudes presented in Section Z.
5. i REENTRY TRAJECTORY RECONSTRUCTION
A detailed reentry reconstruction was severely compromised by the
loss of spacecraft telemetry data during the dynamic atmospheric reentry
portion of flight. Therefore, a reentry trajectory of varying quality was
reconstructed as follows:
a) 335, 000 to 180,000 feet
High-speed tracking data from MLA, PAT, GBI, and GTIwere processed to give the spacecraft trajectory in an earthreferenced set of parameters. The coverage of the trackingdata was as follows:
RadarData Spans
(in sec from retrofire)
0:18 (Patrick AFB) 1347 - 1606
3:i8 (GBI) i398 - i640
7:18 (GTI) 1569 - i60i
19:18 (Merritt Island) i317 - 1588
3150-6027-R8-000
Page 5-2
When tracking data overlapped, it was statistically merged
together into a "best" trajectory. BET position estimatesshould be accurate to i000 through Z000 feet; however,instantaneous velocity errors may be as large as 500 ft/sec
or more. The GBIdetermined trajectory (i603 through i636seconds from retro) is from data collected at 1 degree eleva-tion. It is obviously subject to major errors (the space-
craft is shown as rising) and should be disregarded for anal-ysis purposes. It is included only for completeness becauseof the interest in data at this time of flight.
The reconstruction consists of the following segments:
Time from Retro Gemini 6 Elapsed Time Source
i320 - t436 92278 - 92394 Merritt Island
t436 - i602 92394 - 92560 BETt603 - t636 9256t - 92594 GBI
b) 85,000 to 59,000 feet (92689 - 92721 GET)
The data given over this period are uncorrected guidancedata. Since there was no period of overlapping IGS telemetryand ground tracking data during or after the high accelera-tion portion of reentry, no attempt was made to specify theaccuracy of these parameters.

! • i_•i__>3150-60ZT-R8-000
Page 6-I
6. ONBOARD RADAR PERFORMANCE
This section is devoted to a presentation of the onboard radar data
together with comparisons of the telemetered data with predicted radar
values. Serious problems in the terminal guidance scheme, the radar,
and the IGS itself could be reflected in such comparison if the comparisons
were accurate. However, it is evident from examining the different sets
of data (Figures 25 through 33) that the trajectories of Gemini 6 and the
target vehicle Gemini 7 were not determined with sufficient accuracy to
yield anything more than a very gross check on the radar.
6. i TRAJECTORY RECONSTRUCTION
Using the TRW System orbit determination program, trajectories
for Gemini 6 and Gemini 7 were generated during the rendezvous period
(Revolution 166). The Gemini 7 trajectory was based on a curvefit that
contained station passes over ASC 165, PRE 166, HAW 166, PRE 167,
and HAW 167. Except for the low elevation (6 degrees) pass at Ascension
Island, there was no ground tracking of Gemini 7 from three revolutions
prior to one revolution after rendezvous. Therefore, an accurate rendez-
vous reconstruction or analysis was severely compromised. This trajec-
tory was used throughout the analysis.
The results of two TRW produced Gemini 6 trajectories are presented
here. The first trajectory (used in Reference 5) was a composite of an
orbital curve fit before the brake maneuver and another fit using HAW 04
and Cal 04 data extrapolated backwards to just after these maheuvers.
IGS thrusting data prior to the brake maneuver was included in the orbital
fit. The comparison in Figures Z5 through 27 show the results of the fit.
A second trajectory was produced by constructing a tape of artificial space-
craft accelerations that matched the observed telemetry data. This was
done in an attempt to get a more realistic trajectory during the entire
rendezvous span and see if such smooth step acceleration functions could
be more accurately handled in the orbit reconstruction program. Figures
28 through 30 show the results of this trajectory. Figures 31 through 33
are corhparisons produced by NASA/IVISC, and Figures 34 through 39 are
plot s of the telemetered onboard radar data used in the comparisons.
3150-60Z?-R8-000 _: :': :" :. i_:_ '_ '__Page 6-Z ,_. . . __ _j
6.2 CONCLUSIONS
No conclusion concerning the onboard radar accuracy can be realis-
tically made in the presence of such dramatically diverse comparison
results. The fact that the vehicles were together at a given time is irre-
futable which means the prediction schemes are in error either due to
insufficient data or some procedural error.
The excessively noisy real time telemetry data seriously impaired
a more thorough analysis. It is suggested that every effort be made to
keep the IGS on during the total rendezvous interval. Reference 5 should
be consulted for further scrutiny of the rendezvous interval of this mission.

3150-6027-R8-000Page 6-3

3150-6027-R8-O00
Page 6-4
:::;:::::
_+_
+_+_._
®: iii:
N
N__+_._
N_;;l[lll_t
_+_
0
0
0v
0
0
,-C4_
<

3150-60Z7-R.8-000
Page 6-5
p_
o
°,_
°_-_
o
o
0
c_
0
_)
0
>
,...-4
P/
b_
¢xl
<
3150-602-7-K8-000
Page 6-6
tf!!
t:=t
iii{_
o
0. ,-.._
.r-t
oU
o
o0
0,1
3150-60Z7-K8-O00
Page 6-7
3150-6027-R8-000
Page 6-8 i,
0
U
. ,-.._
-,D
©
0
'-o
0
rj
0
0
0
I1)

11•,II II ..: I;;:: _..._.:._;I II I Fi4_4[ i1! i [:i ..i i_i:... ,_7_[;_1"_;_]i _1
_N, , .... _ !_ •
3150-6027-R8-000Page 6-9
_ _141_._.., _ _ ................
__ :____
__iiiii_!iiiii;iiiiiiii0
©
0
0
v
0
c'_
0
L)
<
o'h
._,_
3150-6027-R8-O00
Page 6- i0
iii
:_ i__:__ i_i _i__ _!_iitt
ii" .........
lb
._ll X2L2
t_
N
N "
!_ tit N_-F. }i! ,
_. _
r4
b7
.... }tji _ ttl
0
0
0
o ,,.,_
,,D
°_-,_
0
n_
o
o
o
o
Z
0

3150-60Z 7-R.8-000
Page 6-I 1
b-,
O
U
°,-_(if
_O
O
ou
0
oL)
0n

3150-6 027-R8-000
Page 6 - 12
s S e
3150-6 02.7 -R8 -000
Page 6-13
3150-6027-R8-000
Page 6 - 14

3150-6027-R8-000
Page 6-15

31 50-6027-R8-000
Page 6-16
iil__I_̧
lii!_
qi' ti_
iiH
N_
iN 1444
_7.'t
ii!i
222g
N
N
i!:i
i!!!
H'!
t-i?
,_12i
,-_
0
_J
_D
0
lao
c6f¢3

3150-6 027 -R8 - 000
Page 6 - 17
u]
CO
c_
c
o
_- ,.Ct9 "_
o oCc_
W
_>
o
cc
z
o_C¢3
.,=d
(Keverse of this page is blank)

UNCL !FIED 3150-6027-R8-000
Page A-I
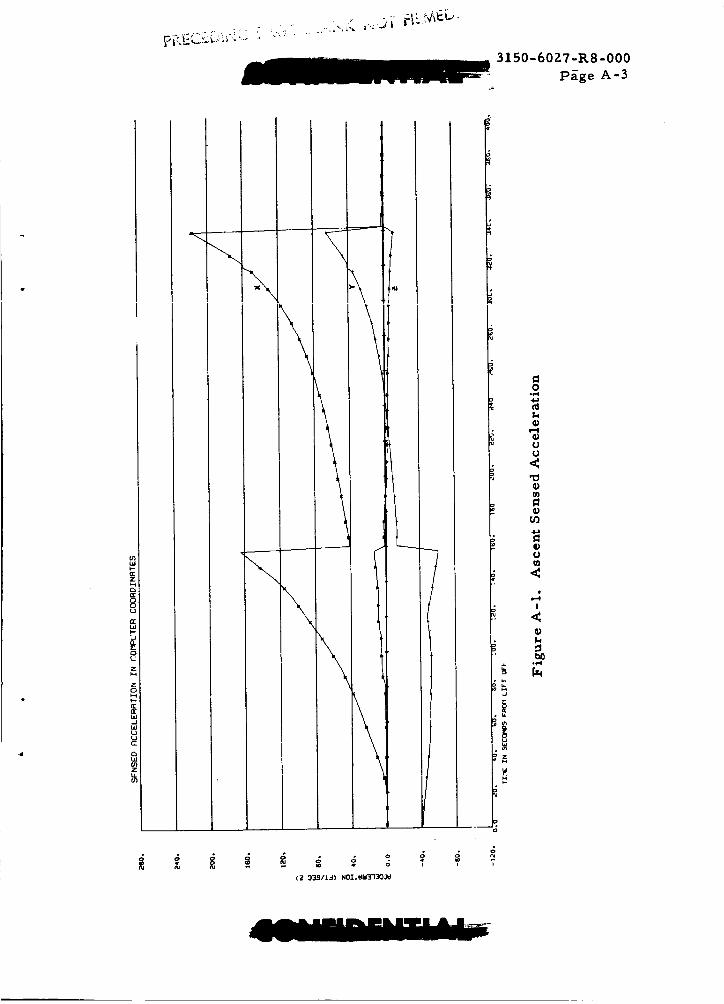
APPENDIX A
TRAJECTORY RECONSTRUCTION
Figure
A-I Ascent Sensed Acceleration ................
Table s
A-t
A-2a, b
A-3
A-4
ARcent Trajectory Reconstruction--Earth-Centered Inertial Coordinates .......... A-4
Ascent Trajectory Reconstruction--
Special Earth-Fixed Coordinates ............. A-6
Ascent (Uncorrected) Sensed Trajectory--IGS Coordinates ........................ A-10
Reentry Trajectory Reconstruction ........... A-IZ
(Reverse of this page is blank)
U CLASSI [ED
.... +Y_+_ _-,_i + _-+_+
xh_
i
I
k
k
Ii
i
p,
4
4
4
4
4
x4i
k
k
x
+,
+-
I
i
i
i
\\
<2 33S/L_) NOI+_13130++
,+-
++
i
0oP4.4.1
t,.+
O_I....4
U
U
U
I

3150-6087-R8-000
Page A-4
Table A-I. Ascent Trajectory Reconstruction--Earth-CenteredInertial CoOrdinate s
u_l_l tR_J£CTIJ'_Y IN ECIG
tlm[ I_ SECO_I)5 roc_ LI_TOFF
x Y Z x-Oc*T Y-rt()T Z-DOT
1.6_2 J02_77 -181bZllZ _n27_o 137_.5)a _nq._?R 5.77_
ll.le_ 80391_0 -1_150_T5 9_2621 n 1736.897 13_._?1 50._?
l_._l_ 30_55_ -1_149940 992B_1_ 1_46.40_ 01._ e_ ?_._77
1_.749 30_9_62 -1_1_971_ 992_?_5 1351°_a2 84°?_ _I.50A
21.1}8 _05Z5_5 -181_05_ _9Z8_91 1_5.822 40._78 10_.078
25.?O5 _0_810 -1e1_0518 QeZ_l 1366.929 -_.2_0 1_6°9_8
Z8.154 3(162228 -1_14_573 9_2_8Q_ 1377.807 -3_._9_ 1_2._1_
_7.567 3O784%0 -l_l_O_O_ Qo_6_ 1_._20 -1_.500 _._04
_C°O_Z 307910_ -1_1_079_ oo8Z_ l_._7_ -171.108 _._1_
_5.08_ 30_6679 -lelSl7nO _o3_ll 1_5_o?_' -727.°?3 ?o_o_,_
_9._2_ _9_705 -1_157_0_ 98380I_ 1_1.3_ -ZZ?.*_ _ _|.o,_
81.925 30_7_68 -1_15_0 9935899 16o_.548 -_OG.0_q _?.5_6
5_.916 31_l_ -!_15529_ 99_786_ 1814.Bb_ -361.Q_6 _21.120
_9._10 8111226 -181_023_ 993B951 1880.2_ -_._0 _0._76
61.90_ 311_9_ -18157_3_ 994_1)2 lO_)._1_ -_16.0 ?_ _81._71
oe_O_ _124_71 -181591_ 99_2360 Z085._8_ -_59.1e_ _0._6_
71.293 3138_79 -181_1570 _45222 2252.627 -_08.118 507.09A
77.7_3 31_1401 -18162_ q946776 23_.1_ o_?_.2c_ _l._°n
7a.174 31_i()5_ -1_1_52_7 _9_9729 2515.050 -_61.5"0 ?02°1_3
B0.56_ 3188_57 -16166657 o_'151_ ?_2_.38] -_81°6)0 731.72_
83.157 9165135 -1Albsl_ 9953381
85.bSU 3172097 -ie169b78 3955347
_.I_4 31793_8 -161711_2 99_7_28
90.688 8185988 -1_1787_6 995o627
93.18_ 81_4828 -181T_o2 99619_
95.038 3201088 -18175_05 9_6_796
97.535 _0960_ -l_IT7_? 996_887
100.031 _21_49_ -I_178927 99689?8
I02.838 822780_ -lSlS0_14 _Q717_7
I05.026 32_7498 -I_188802 9974_52
107.5_7 32_7738 -1818_008 9977703
108.451 8285775 -1818_89_ 998OO92
III.948 326_733 -18_859_ 9_83337
I14._4 327_172 -1818862! 9986719
11_°939 _290107 -1819028_ 99908_i
I19._8 8808579 -18191811 99989O8
121o938 3318640 -18193_34 9997728
128.842 3885982 -1819_53 I0000777
12_._4_ _340_21 -1_198_74 1OO04795
128.88_ 3_5_b89 -i_19T241 I000o01_
131.33_ 3_o9970 -18198556 10018887
188.828 83859O6 -18199821 I0017919
I_.3_4 8_02829 -1880108_ 1OO22619
138.229 3415686 -18801922 10026323
14U.78_ 84_3648 -18803040 IU0_135_
148.233 _452319 -18804093 I00868_I
14_.727 _TIT_ -18205O79 100_1953
148°24_ 84922_4 -1820b00_ I00_7609
180.744 3818_02 -18_06880 )O053421
182.650 3880163 -182074_2 1OO58OO5
155°148 3852959 -182081_4 I006_2)6
187.1_2 887_095 -18808b_8 I00_9406
l&0°I4O 8b00916 -18209888 I0077)8_
I_2.6,I 8628868 -lUZ098bl I008_b83
168.188 _680012 -18209740 1009O080
167.3b0 3672145 -18209773 10095800
169.828 369691O -18209_T_ 101U2124
172.290 _721918 -182094Z7 101084_0
17_.977 _789160 -I8Z0917_ 10112788
176o_41 _7©_864, -18Z086?7 10119002
178o908 _790288 -18208027 10128258
181o88Z 3816269 -1820722) 1013180_
183.8_6 38_243_ -18Z06268 101_7696
186oZ78 3888_90 -18Z05169 101_3768
I BB°b95 3894719 -I8Z0_922 10149788
191.117 38Z1222 -182025_0 101_87?5
I93o838 8947988 -18200967 I016172I
|88.96Z 897_080 -18199Z4_ 10167682
198.384 _00_872 -IB19?)b_ 10173_9b
200.81Z 40300_Z -18198818 1017q328
_08°233 _0_7982 -1819310_ 1016_099
20_°65_ 4086102 -18190728 10190818
ZOS°O7b 411_878 -18188178 10196489
210._97 _1483_Z -18188480 1020_108
2IZ.919 417Z4ZZ -18182847 10207669
215.3_0 4201800 -18179468 1O218177
217°76_ 4Z31_16 -1_17_196 102186_2
Z20.182 _ZSISU8 -181727_6 1028_020
Z22.608 4291911 -18169098 10229_66
Z28.02_ 4_Z286_ -18165Z60 1028_637
2Z7°_8 _353880 -181_1229 10239845
ZZ9.868 438_876 -1818_998 1O244991
2_.Z89 4_16860 -18182562 10250078
23,°714 _448647 -18147912 _07_5101
287.1_0 44811O7 -1_14_0_9 IOZ_O062
2_8.862 48O3588 -1813959_ 102684Z2
241._3_ _5367_6 -1_134358 102_82_0
_3.b_O 457018_ -1812U905 10Z7805_
2798._6 -898.728 767.79 _
2972.077 -6Z_.SZ_ 8_?.0_0
_009.165 -587.0_9 90'°180
?_32.5Z_ -5_8°970 95_.075
8839.522 -6_6.9_7 _89._8_
3486,1_t -8_8.67_ 1_87.75Q
3540.28_ -_72.121 lO_b._6
8972.3O7 -_77._l 1188.487
_152.118 -_76°_22 12_8.88_
_293°165 -678.6Z7 _77_._4
_84,319 -_67.27_ 1326.261
_68_.403 -b58.8_ 1_8_.881
48_Q._o -_39._0_ 1_40.8_9
5108.988 -5Z0.0_8 I497.0_8
5508._45 -579°410 1598._19
_7_._91 -857°_20 1688.q_
899b._9_ -88a.�A_ 17_0.74_
6821.897 -4Q6.765 _°2_6
6799°T14 -475.080 1917.686
7019._68 -4_7°6_4 197_.088
7319.27_ -4_4.n13 20_.757
7_30.788 -508._40 ZI_.ORP
7_85°777 -3B8.002 _?01._94
8Z99.88 _ -_5_.171 228_._94
8656°29T -822.7_6 _372.1_9
8940.178 -Z98.1?_ 7441.030
9827°94Z -26_o17Q ?584.8)9
9731.8_1 -160°8_8 2898.?98
9822.77O -101._78 _85°9Q_
"915,711 -41.781 _8T7.179
999_.91_ II.8;2 ?_&_.ST6
10095°_68 70.04_ Z5_°17!
I0192o653 l_9o786 2886°_0
1D860°28_ _7|.010 786_o8_
10860°921 282o088 25_0.0?6
I0a63°250 89_.0o8 8829,_57
10867°826 856°8_6 281o°I77
106T4°OTD 48D.1_0 280_°878
10780°281 _8_°I98 ?893*674
I0898°3_5 888o76_ 2879°87_
10998o50_ 610°987 246_o057
11110.115 576,395 7447°804
11283*985 _42°_86 _30°182
I1389.120 809°848 _11o97_
11_56._ 878o0_3 2_92°617
11_75°76_ 9_7o_Z_ 2_72°_85
11896.836 1017°8_4 7882°08_
11819°)49 1069.279 8330.6_0
18070o861 1288°q01 2?_.28_
17199.62_ 1_10°980 22_8°_17
18880._48 1_87°'86 2_3Q.672
IZ_63.168 1485°047 2718°_60
12598.238 1884o485 71_0.*_
18788°_51 1688°128 _168°_8_
1_8T_._63 1706.95_ _138.48_
1_016.0_ !790.017 2113o308t_159.887 1874.797 Z086.8_4
13806.8_ 1Q60.7_8 80_.988
1_455.91_ 2049.5_0 20_1°1_0
!_859.?_7 Zl_q.8*O ?0'1.9A3
13713.308 8199.5_ L08_.4_
18869.2_ 2?Ol.90_ 1994.690
3150-60ZT-K8-000
Page A-5
Table A-I.
T INI_
Ascent Trajectory ReconstructionmEarth-CenteredInertial Coordinates (Continued)
GEWINI TRAJECTORY IN ECIG
TIME IN SEC{?ND$ FROM LtFTOFF
X Y Z X-DnT Y-O_T Z-nOV
327.93_ 6N3q31_ -1775706_ 103_0675 22219.Qq0 733q.lF7 _3O.1_1
330.25_ 60902_| -17737792 103R1351 2_6n_.969 7576,_4_ ?53.01_
332*577 _14_20_ -1772190_ I03_tq4_ 2_006.745 ?_24.R_2 17_._1_
334.8_2 619_941 -1770_496 103_2147 _3427°011 _OR_°Q?_ _°_Q_
337°942 _269260 -17578307 10382245 _39B0.917 _4_q.|O_ -_._
3_8*737 _28_36_ -176T1_7_ 1038221_ 241_7°321 _520*_ -5_.244
_40°093 63212O4 -17_5993_ 1O382112 24213.1_1 _00.807 -_5,_
342°_05 6_77183 -17539976 103B1873 _42_0.2_ _62.878 -|20*q_q
346*660 6_0_89 -17_02_79 103B1225 2_169.$14 8773o9?1 -1_4°0_
3_8.938 6535110 -17582831 103_0767 _41_0._ A_32o2_ -?]A.13_
35_°408 e667095 -1753_13_ 1037934_ Z_100,36_ _9_q.q05 -?Qq.61A
356.5O5 _717_04 -17515274 10_7_b_9 2_080.2_ _022._2 -_0o_7_
358.6U3 _7o_0q5 -17495293 10377q_2 240_0.187 _074.771 -_?*OPl
361.823 684553_ -17_65q3_ 1037e719 2_030._82 _15_*_ -_0o0_ o
363*887 5895106 -17_T_88 10_75841 24O11.8O2 _07o?_ -_.ql _
366o6_$ 6_0331 -17_22870 1O374587 _3q8_.61_ q276°_4_ -4_l°q?_
3_8°5_3 700_6q0 -17_03T20 10373_63 _3957°525 _72_.1_0 -_13.0_
371.381 707_7q4 -1737_277 1037211_ Z_?42*_q'_ _3_5._6 -_o_?_
3T3°_38 712_01_ -1735_01 1037094_ Z3q22,Z63 _6._19 -_o_
376,251 7191511 -173_21_1 1035923_ 2_893.2_1 _51_*7B4 -_?_°I_
378.43_ 72433_0 -1731140_ 1O36784O 2_71o047 _70._fl -_*_30
246*067 _6u_034 -lU123230 102777_ 1402H.435 23RS.62fl ln75,257
248,513 4_260 -1_t17_7 102_7400 1_1q0°511 2481*_3 ._°??_
250°9_q _73176 -1BIIIJ?_ 10_869_9 1_35_*_02 757_°_70 _q_°_2 _
253°406 470_17 -1_1_0_ L_Z_ _°i_ "_.7_,_ _°_._a x
25_o855 47_4306 -1_09_02_ 102Q$975 146q_°036 _?7_,_q tq01*lTT
258,3O2 478047_ -160qlOq7 103_0_1 148T4o907 _B83°T10 17_°4_
263°205 4U54_00 -1_076436 1030_4_ l_23_,3_0 30q_°lF_ t_Qq,9_7
265,655 4891B_ -1_068710 1031_9e9 L542_o_17 _08*96Q _664*_9_
2bB,102 4_2983_ oIR0b0723 1031699_ 15616,312 _21,?1_ 1_2_°_53
270*550 4958303 -180524_ 10320_37 15B11°020 _4_7,7_ 15q1*05_
277*8_9 50_655_ -1_02_901 1O332191 1_421,43_ _01,_!2 t_?_,_0_
280,33_ 51270OO °1_016_43 10_35750 166_4*12_ _8,5_5 14_°q_4
2B2°015 5155O48 -1_009774 1033_133 16782,8_1 _017*5_4 140_°127
28_*903 523817_ -17q89484 10344795 17230,6_ 42_,q76 I_1q,67_
289,3_1 52_06_ -17_78_2_ 10347_70 17463*1_5 4_24°09_ l_74,_q_
2_1,7_7 5_22051 -17_5_2_ 10350_23 176q_*0_2 _561,_47 12_1°n_?
294°_21 53_250 -1795752 _ 103_7_0 17924, _ 4700,77_ l_R6,_
297*064 541_267 -179429_ 10357_37 1_2_T°069 _q°Q_3 11_5*26_
29_°381 5_60812 -t7931434 10_790 1_4_2,51? _9,00_ _07T°28B
301o707 550_098 -1791_534 10362238 18735,621 _lq2*qT_ 1027°6_
304,0Z5 55_7834 -17907313 10364562 1899_°22t _l°_q_ qT_,_4A
_0_*_43 _5921_1 -17894724 1O355765 1_262,402 _14,116 _23°97_
310,982 5682796 -17B68_62 10370TgT 1_21°_ _6°0 o? q1_,161
313,29T 572_02_ -17_$4596 10372612 20113,_q5 _0_,43_ 7_,_1
31_,340 5790837 -17B35_8 10374787 Z0513°004 62_2°12_ 674°_21
316,_57 _83_737 -17_2107_ 1037_276 _082_,T_7 _7To642 _lq°qg_
320,9B3 $B675b_ -17B0_77! 10377_20 _115T,520 _6_1,430 544,_T_
_5°621 5_B727_ -177738OO 1O379824 _1851°271 711_°3T_ 40_o08_
3150-6027-R8-000
Page A-6
Table A-Za. Ascent Trajectory Reconstruction---SpecialEarth-Fixed Coordinate s
136.3Z_
1_0.??_
_.?_?
14_.727
14A.748
....15T.I_7
160. I_0
16_.*?5
176._4!
17_.90_
_on..)?

3150-6027-R8-000
Page A-7
Table A-Za. Ascent Trajectory Reconstruction--SpecialEarth-Fixed Coordinates (Continued)
TlUF
&._ LIFVnrF
I_FCrkO_l
_cn.r?A
??e.p_*
737.140
_.IC_
270.q_O
_??...e
_1_o_?
C_*_TI_ LiT* GC_TI¢ LCJNG.
lerGl_FS| I_E_RF_I
=_*ql? -?e*13_
?P*_S? -??._qq
• 8.1_6 °??*8|J
?J._90 -?T.q6q
?_*q_O -77*|_1
_8.°S0 -76._83
?_*qSP -T6*71_
28*Qq4 -76°2ql
_0.00! -?6*]87
?q.o0_ -76.0_?
2q*02_ -Tq. Tq_
?_*040 -?S*S32
?q.o*_ -?q.*|?
_o.0_? °?S,)O0
?q,O_6 -75.719
?Q.077 -?_.7_
2a*oQ_ -74._??
?o.oq_ -?_.ZO0
?a*lO0 -74.071
79.1_ -73.a3q
Zq*lO? -73._06
_.lt7 -73._4_
?a*l?_ -I?.q09
?q.12_ -TZ.60_
?a, lZO -?_.12|
3_A.q_m
_S_._C*
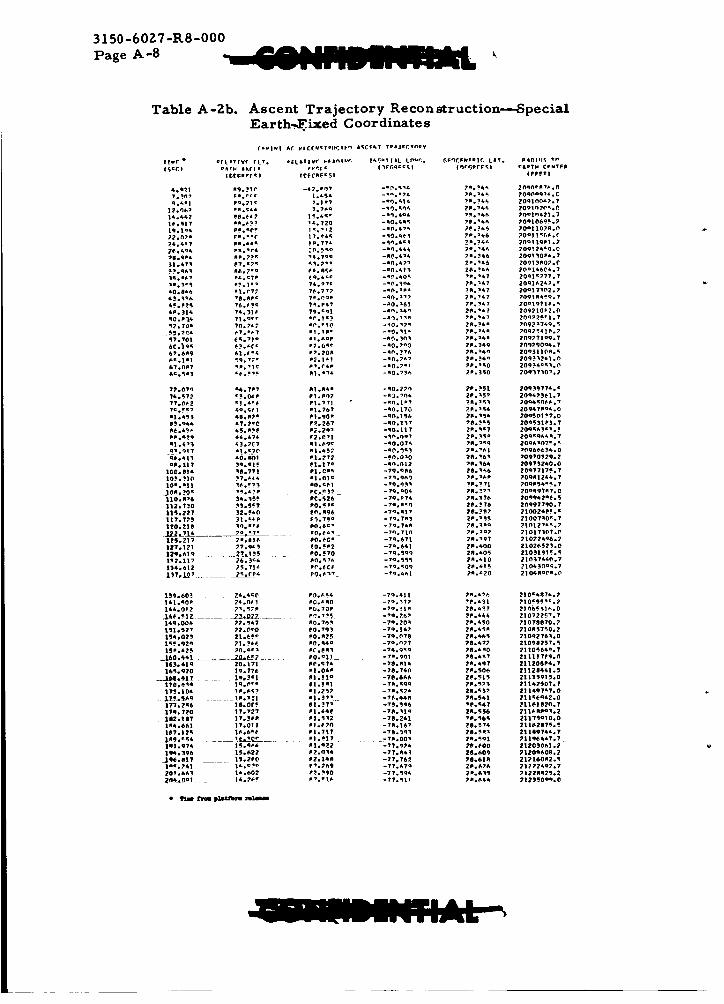
3150-60ZY-R8-000
Page A-8
Table A-2b. Ascent Trajectory Reconstruction---_SpecialEarth._.ixed Coordinates
_l_t _ _£C_¢TPlt_TFn I_£_T T.6j_Vn.y
°¢L_rfvr fLY. _Et&tlVr _fanwL'_ [_°T[_L t _* _;_C¢_T.I_ LiT. P4DIOI$ TnTfur•
a,_l _ao2t¢ _,1,7 -*_,_14 ?D.?4_ 20qlOOAS,?
|4,_4_ _8,_ ? I_._ r -*_.4_ _,=46 ?_)ot_421o?
_?*_^_ _6,7 _o _,4_ -e0.41_ 2_._ 20o14_4,?
40,8_6 _1.r77 26,7_ -*0._* • _#._47 20o17_02°?
_co_ _Q_I "1,762 -q0.170 2_,_$4 20942_o_,0
• i,_3 _8,_2 • _1,90_ -q0,1_6 2_._ ?Gq_01_?,0
8_.-4_ 6?.?o 0 P?.267 -q0,137 _8._5 20o_31_3_7
aP*31? 3q*_l? _|*!? c -qn.012 _o_64 209?3240,0
1GC°81_ qA,7?l PI.C_ -79.a_6 ?e*_6 20_T712_,?
10_°?10 27,_6 _1,01 c -?q.q_ _*_ ?0q_12_6,7
J0_Q _ P_*_?_ _C.°.¢32 _ -29.a04 2_._ 20_q92_?,0
110,826 $4°_ PC,_?6 -?q,p74 7_._26 20_942_6,5
12§, 217 ?**_1 _ POo_C _ -?q,_7! ?_. _7 210224°6,2
129,619 ...... _I?_ .... P0,_?Q -_9,_9q 28,40S 21031_1_,_
1_2-ii 7 26,_ ¢_ _0,_?_ -Tq,_ 2_,_10 210_24_0,7
|81.527 72.000 $0.793
|6_.q20 19.77_ n|*06_
__lL6|e}J? . ]9_¢] A|,_lo
l?q,??O 12e727 AI,&42
182,182 ]?._tA P1._12
1a&,661 17,011 P1._20
1S&.396 1S.622 P?,O_4
JS6.SI? ..... |_.SPO _2.1_#
-?0.20_ 2_,480 21028870.?
-?_.028 2_.4_8 2109226q*0
-?o._27 28._?? 21098257,_
-?O.MI4 ?_*4q? 21|208P4.7
*70.740 2_.506 2|1284_1.5
-75.6_ Z@*_|8 Z[|88915*0
-?A._q_ 2_,_73 2114250?°7
-78.261 _._68 211?_Q10°0
-?_,16 _ 26,574 211_287_._
-72,Q?_ 2P*_O0 212030_1,?
-72._4_ 28._09 2120Q608.2
-72_762 25.618 212160A2._
-??._?a 2P.62_ ?1222497*?
• Tim _ p_t,fOsan _la_io
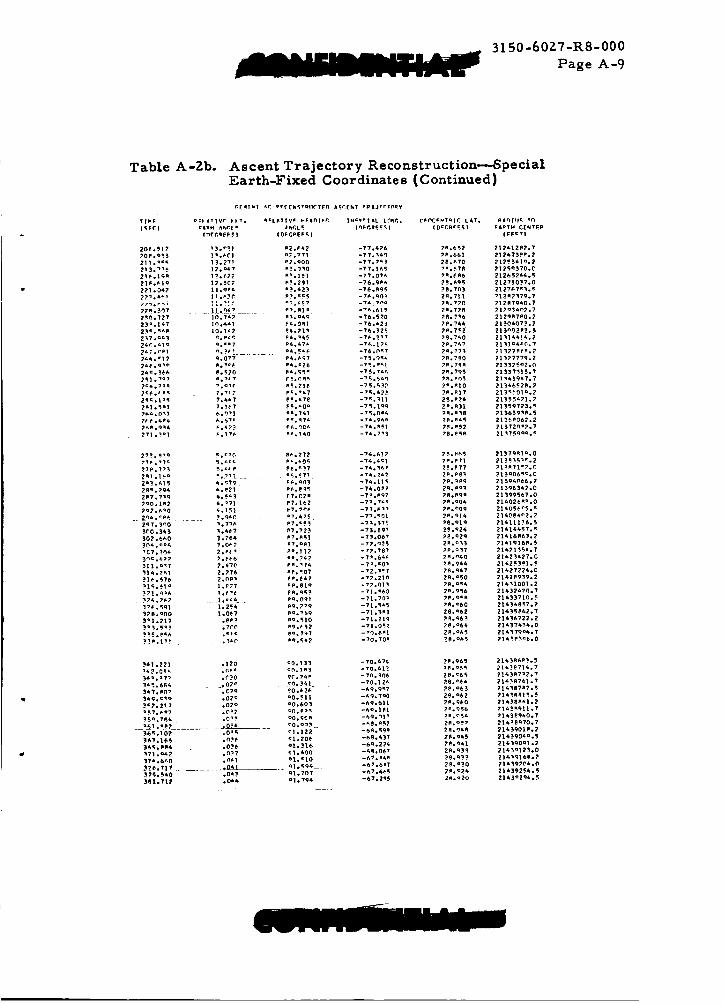
3150-60ZT-R8-000
Page A- c)
Table A-Zb. Ascent Trajectory Reconstruction---_pecialEarth-Fixed Coordinate s (Continued)
_QO.lm2 4._71
3C,0.343 3.4_?
_CT°_O_ 2°_ ¸_
_1_°_1 2,?76

3150-6027-68-000
Page A- 10 _.
Table A-3. Ascent (Uncorrected) Sensed Trajectory -IGS Coor di=u_te s
GEMINI EOIT pROGR&M
TIME TN $E0t)N0$ F_NN LYFTOFF
CONPUT_O PQ$1TIUN VELt_ITY 8N0 &COELE16TION IN OJ|DRNOE THRUST Cg_RO|_RTE5
TIME X Y Z XOUT YDflT ZOOT XDO_r Y_Dnt 7_T
ISEC$1 |FT| IFT| (FT) |FT/$EC) (FTtS[CI IFTISEC| |FTI3_C*11 |FT/SF(_?I IFT/SF_O3)
1.642 - -401 -*10 -172*7) *II *_0 -40**P .nQ
_*023 ...... -928 1 *06 -270*08 ,81 *04 -41.1fl ,13
6*602 -1687 2 *12 '-368.37 .61 ,10 -4|.47 ,16
8,783 1 -2683 4 ,39 -467*69 1,20 ,13 -4|,8_ *_3
11.163 2 -3014 8 ._6 -567,_3 ?*00 ,17 -t?,27 *?q
13.538 5 -5382 13 1.73 -668,79 ?.49 .Is -47,_4
8 20
*78
15,915 -7091 1,70 -770,05 3.29 *?0 -47,_2 *_
2h136 20 -11706 60 2*95 -990;16 4,65 *47 -66.26 ,77
23,215 27 -13875 51 3*68 -1090,49 5,36 *93 -64.7a ,26
25.705 39 -16730 66 6._6 -_202.68 5.76 I,R9 -4_.40 ,_q
26,194 61 -19866 80 12,35 -L316.82 6,42 3.31 -46,00 ,_i
30,686 103 -23286 96 22,66 -14_1.69 7.20 4,5_ -4_,55 .1_32.586 156 -26092 111 _3.05 -1520*82 "" 5,20 _.15 -46,95 *_?
35*076 259 -30029 132 50,23 -1638.57 6,57 7,84 -4T,48 ,_8
37.567 610 -36256 154 7|*97 -1757,45 9,44 q._5 -47.96 ,4_
40,057 021 -38782 179 97,56 -1877.47 10.80 I1.34 -46,47 ._ q
62.546 901 -43606 206 126.11 -1998*67 12.66 1_*17 -46.64 *_6
45,035 1263 -68733 242 16_.34 -_120.70 1_._? )5,0_ -49._4 ._?
67.525 1718 -56165 279 203.12 -2263.71 15*89 1_,96 -49.5P ,53
69,429 2136 -56528 311 236*73 -2335*52 17.17 _5,41 -49,61 ,4_
51,925 2?86 -64521 354 285,03 -2463,18 17,51 20,_0 -50,15 ,?q
56.622 3564 -70628 39_ 335,39 -25R8.46 17.05 27,06 -50._1 ,0_
56o916 6679 -774_1 _66 395,72 -2715,08 15.69 73.75 -50,8q .63
59.410 5540 -8"372 *q3 456.36 -_842*6_ ?0.54 2_.43 -q1.21 1.11
61,902- 6759 "-01616 568 522*22 -2970,69 24*08 27,13 -51,31 1,66
63*808 7806 -97370 597 575,19 -3068.70 27,78 ?P._3 -51,3_ _.6_
66,306 9330 -105189 676 648,_3 -3196,66 33*40 50.62 -51,39 ?.Ok
66,800 110_4 -113328 7_3 726,6_ -_32_.32 37,94 32*36 -51,)4 7.n4
71,293 12959 -121774 566 8}0.63 -3451,26 43.17 34.20 -51._4 _,36
73,7_3 15085 -130527 977 897,56 -1579.13 45.51 _6._6 -x_,_3 I,_9
76°273 17632 -139fl97 1105 988.86 -3707.73 53*76 3_.32 -5_.43 _.ln
78,176 19382 -146740 1210 1063*11 -3805*95 98,40 *0,1_ -51,_l .93
__..80,665 22159 -151_60 1365 1167,47 -39_3.00 53.91 42.?0 -_|,40 t,4183.157 25206 -166341 - 1663 1277*01 -6061,10 58.73 _4.55 -91.67 3,11
89*650 26528 -176623 1664 1391,11 -4190,31 70.86 46.94 -52,08 4,99
8_,166 32146 -187237 1839 1510,17 -432h16 85,70 69,20 -57,46 5._
90*638 36U67 -198178 2071 1636,03 -4452,16 100o23 x1,74 -57.74 q.70
93,,134 40314 -209456 2339 1768,06 -4584,48 114.76 54.57 -S1,P_ 5.5_
95,038 63761 -218262 2566 1874.18 -465_,19 124.52 56.55 -52,76 _.47
--97_5 4-86_1" --'=23616_6 .... 2e94 .... 2619.91- -4516.79 138,06 5_,99 -57._5 5.4.
100,031 53873 -242332 3255 2173,65 -4947*68 151,65 63*20 -52*76 5*q7
102,532 59510 -254870 3653 2335*50 -5078,16 165*97 86,51 -51._! 5,_?
105*026 65545 -267696 4084 2505,56 -5207..,11 180,07 _9,96 -51.S? 5.57
107.547 72086 -280986 4556 2685,96 -5336,46 194.|R T3.|5 -5_.17 5,97
.109,451 77335_ -291239 4936 2827.75 -5633.69 __ 205,23 ...... 75,_5_ . -_0,R9 6._111*96B 86633 -304966 5668 3020,52 -5560,36 221,73 79,0_ -90._0 ?,57
116._4 92426 -319002 60_8 3221,51 -568_.96 263*56 82,64 -6q*67 8.63
116,c/39 100719 -333337 6664 3432,33 -5808.73 266,66 88,61 -48,85 6.5
119.635 L09560 -367988 7376 3652,99 -5929.77 265.06 90,12 -48*_9 6.Ol
121,938 118990 -362977 8125 7853.58 -6048.55 310,37 93.61 -4_.F_ 8.91
123,842 126557 -374583 8733 4064.30 -81_1.08 327.61 96_ 17 -69,09 R.n3126._*0 137913 -390079 9579 4308*38 -6?65.33 _49.90 99,_? -%0*17 8._0
128,838 168089 -605587 10481 4560*66 -6391,94 371*89 103,02 -91*73 6.6 _
131,333 159792 _421996 11635 6821*57 -5521,03 397.76 106.92 -52.16 5.77
133.826 172160 -638431 12661 5093,53 -6652.70 414.43 1_1,10 -5_*0) 9.00
136,324 185226 -685203 13506 5376.23 '-6785.92 437.40 L15.69 -_3,n] 0.45
138,229 195676 -666223 14355 5599.53 -6888,95 455,01 119._o -5_.37 o.?_
160,733 210079 ._685651 15528 5906,13 -7026,29 480.57 178.62 " -5_.18 10*23_63,233 225226 -503382 16762 6220*79 -7164*77 505,91 129*79 -55*98 10.86
1_5,727 241151 -_21427 18060 6551,15 -7305,63 534,06 135.73 -56,85 11.15
148.246 258106 -540030 19442 6900.56 -7650.00 562.79 141.96 -_7,79 11.66
150,746 2757U0 -55_807 20_84 7263.56 -7595,40 592,51 146.79 -58.77 |7.?_
152.650 289893 -573385 22035 7552*35 -7708.13 616.30 154.39 -_0._8 17.6_
155*166 309233 .... "592812"-- 736]4 79_5,58 -T_58.18 64_.71 1_1.?9 -80.54 9_* _0
157,162 325590 -608781 26949 8278.97 -7951,)3 675.99 167*6_ -6|*_0 11,77
_60,140"" 35U338 -632581 2697 Z . p370,36 -8013.41 680.88 41,0! -15.0n 1,41
_6_,641 371399 -652667 28679 8472*70 -8069*08 686*0E _1.61 -1_.87 1,65
16_*138 392686 -672811 30391 8577,17 -5085,27 687.78 42,21 -14,5_ 1,60
. _T_3bO _!__B.55 ...... -690818 31926 8671,76 -8117.75 691,39 62.q? -16.70 1*59
169,825 633361 -710873 33633 8778.77 -5154,66 695,09 43.77 -_4,F9 1,96
172,290 655133 -731017 35351 8887,71 -8190,6_ 696,99 44,59 -16,49 1,67
173,977 470186 --764851 36532 8963,66 -8214.98 701,67 45,79 -14,?? 1,57
176,441 692610 --765135 38266 "--9076,13 -8249,66 706*72 _6'f2 .... -1_*_8 ...... t_0? ----
178*900 S16968 -78_535 ,60006 9190.65 -8?83.46 706.81 46,67 -15._1 ,?1
18h382 537827 -806067 61757 9307,69 -8316,57 708,30 47*65 -13,|1 *30183,846 560905 -826597 63502 9626*06 -5348,36 705*39 6_*67 -]?.7_ -.09 "-
186.275 583941 -846910 65222 9546,56 -8378.77 707*68 49.30 -12.35 -.57
188*695 607193 -867230 46933 9664*96 -8606.28 706.06 50.1_ -1).9_ -,_o
191.117 63076_8-----887629--- 4_640 9787.47- -8636.86 "- T03.1_ ÷-- S0,97 - -1|*_3 =1,77
193,538 bS4593 -908007 50339 9911,73 -8666.10 699*93 51,76 -11,07 ol,58
|95,962 670770 _ _9_8634 52030 10038,31 -8690,.42 695,60 52*95 -10,67 -1.8_-19_,384 703237 -969228 53708 10166*62 -8515,61 690*78 93*6? -10,!_ -?.16
200.812 T28076 -969931 55379 10296,86 -9539*87 665,16 56*26 -q*76 -_,94
203*233 ?53176 -990662 57031 10629,53 -8562*90 679*23 55,11 oo*_l -2*55
_o3.636 ??8585 -lO1_399 58666 1o6613,_--_ .... 677.eo _4T- ..... =e;_ -_,T0"----
208*0?6 R04336 -1032216 60289 10700.65 -8005*77 666.0? 56*86 -8.61 -?*66
_|0.697 830606 -1083074 . 61695 10639.10_ -8623.81 659*06 57*79 -7*98 -?.99_12,919 856828 o|073987 6_480 10980,28 -8666,32 651,?| 58,73 -7,51 -3*36
215.360 863563 -109a936 63069 11123*60 -_662,10 664*28 59*67 -T*04 -5,19
217.763. 910710 -1115963 66601 11269*24 -6678,85 63_,38 _0.8] -6._8 -3*30
222*608 966036 -1138070 69666 11967*53 -8707*86 619,78 6?*60 -5*56 -5*45
lZ23.0_6 996213 -1|79158 T1136 11720*38 -6T20*6q 6_1.55 63*63 "_*09 -3*5?
227,448 1022763 -1200276 72603 | 1875,56 -_ 732,61 832,61 66*48 -4,8? -_,61229*860 1031691 -122_ 621 74052 12033*2? -6763,20 ?93*97 6?*?6 -4.16 -3,7_
232*289 1081016 -1262599 75479 12193*7? -_752,65 584,8_ 6_,89 -3,_? ._.eO
23_* 716 111078L --1263832" " 76885 12357,31 -6760,98 5?5*40 67*92 -3,16 -_*96
237,_60 1140959 -1285093 ?8270 12523*86 -6767*9? 566*06 60,66 -?*35 -3782

3150-60ZT-R8-000
,. Page A-I 1
Table A-3. Ascent (UncorrectedlSensed Trajectory -IGS Coor dinate s (Continued }
TIME X
(SECS) IFT|
238,80Z t181870 -1299670 79205 12639,21 -8772,26 559*66
241,233 1192813 -1321008 80554 1281l*02 -8777,60 550°02
243°660 1224113 -1342314 81678 IZDES,L5 -8781,41 540,58
246*087 1255839 -1363628 83178 13162,83 -8783°8? 530,E4
246_513 1237988 -138_937 84453 13343,76 -8784*9O 520,79
250*959 1320857 -1406428 85715 13529*15 -8785,11 510,55
253*406 13_4197 . -1_27926 _ 86951 13718,39 -8783,67 50_°00
255,855 1388032 -1449435 88163 i_11*48 -3780,17 489,35
GEMINI EDIT PROGRAM
TIME IN SECONDS FROM LIFT3FF
COMPUTED POSITION VELOCITY AND &CEELERATION 1q GU[DENCE THRUST C03RnI_ETF5
Y Z XDOT VDOT ZO_T XODOT ¥NO_T ZD_OT
iFTI EFT| (FTISEC| (FTISFC) (FTISFC) (FTISEC*2) |FT/SE_I (_TI_Ce_|
69347 14107,91 -8775,14 478,50
91637 14513,76 -975%51 _35,29
92738 14722*77 -_745,72 443,44
O36O7 14935,93 -87_6,17 43O,98
94847 15153*36 -872O*96 418,63
95856 15375,85 -8704,10 40_,9T
15603,51 -9684,_7 393,11
15835,74 -8662,_7 379,85
16073,44 -8635,62 366,59
16239,70 -862O*49 357,O8
164_6*83 -8592o22 343*21
16739,94 -8_61,79 328,95
16999,75 -3528,07 314,28
17256*5Z -8492,71 300*01
17514*93 -5_54,87 285,_5
17864,5_ -8359,48 265,83
18138,_? -9353*32 250,37
18421o51 -8303,45 28_,60
18711,55 -82_9,99 218,4_
19010,01 -8192,52 201,75
19316,67 -8131*0_ 184,58
1963_,39 -8O64,72 186,70
1996O*73 -7993,78 148,12
2040_,36 -7891*41 12_,07
256.302 1422303 -1470908
260*75Z 1457115 -l_9_qUt
263*205 1492_67 -1513901
265°655 1528284 -1535350
Z6E.I02 15o4560 -|556738
2T0.550 1601392 -1578107
2?2.996 1638733 -1599_21
273.444 1676654 -1620708 96834
277*6_9 171$077 -1641909 _7779
260.336 1734121 -I66_080 98693
282.015 1781243 -1677566 993OO
2U4.460 1821255 -169£612 I00156
286*903 1861846 -1719569 100978
269.351 1903130 -17404E2 I01765
291.707 19434_0 -1760536 I024P_
294.021 19_3710 -1780L41 103166
1U4004297*0_4 2O37536 -IBOFY66
299.381 2079251 -18251_E 104602
301°707 2121773 -184437Z I05166
304.025 2164815 -186_761 105692
306°_3 2208521 -1882814 i06179
3O8*656 2252_90 -19O1713 I06626
310.962 229EI35 -1920_2T I07034
313.297 23_3973 -1939119 107399
316._0 24O5386 -1963290 1O7811
2075_.35 -7907._2 105.69
21125.64 -7716.94 83.00
21505.00 -7620.61 61,A0
21899,06 -7517.80 39.6O
223O9.65 -7408°30 16.69
318.657 24530_1 -1981_82 I08074
320.983 2501794 -1999539 108292
323.302 2551208 -2017319 108460
325°621 2601539 -203_876 108577
327.938 2652739 -2052165 108643
330,254 2704908 -206919_ 108054 22735,97 -7391,31 -7,32
332*577 278824§ _208_._98T 108605 2_184,e6 -7165,57 -32,63
334,892 28124_5 -210241E 108502 23651,92 -7031,51 -58,66
337,qu,2 2885546 -2123593 108270 24268,39 -6850,50 -93,15
336,717 Z904890 -2129018 1O8193 24431,3E -6_01,94 -102,26
340,093 293E154 -2138159 1O8047 24537.O7 -677O,37 -107,78
3_2°405 29949O7 -215_ 852 107797 245a5,87 -6767,82 -10_,20
344,528 3O47O24 -216_219 10756_ 24550°76 -_786,61 -107,_2
346,660 3099367 -2182643 107339 24_54,63 -6765°60 - -107,63
348,938 3155_89 -2198O5O 107093 24556,95 -6764,90 -103,65
354,406 3269639 -2235057 106503 24558,48 -876_,64 -107,79356,5O5 3_41130 -22_0241 106277 24558,4O -6764,76 -107,71
358,603 33926_S -2263431 106051 24558,52 -6764,67 -IOY,�Z
361,823 3_71745 -2285_17 105704 2_560,67 -_764,18_ -107°95
363,687 352Z426 -22§9474_ 1054E1 24561,91 -6763,79 -108,06
366*605 3589182 -2317556
368°663 3639751 -2331477
3T1,381 37O6516 -23_9657
37_,436 3757O43 -2363766
376*261 _826405 -2382855
376*433 3879763 -239T_46
380*469 3930291 -2_11454
383,21_ 3997229 -2429880
36_*425 4051548 -24448_3
368,221 4120237 -2463741
390°276 _170789 -Z477658
392*994 423751O -2_86023
395*052 _266062 -2509938
397,761 4334616 -252_259
399,81T 4405143 -2542167
402*538 4471965 -2560567
404,$93 4522464 _2574462
407°304 45890&5 -2592Tg6
409*357 4639696 -2606678
70,11 -?°34
Z1,29 -1o79
72*53 -1,_
73,85 -,76
76*62 *35
78°0T 1°00
79*5E 1,TO
81,15 2,42
_.79 ?,21
84*5O 3, Do
_6,25 _,84
_8,05 5,66
89._S 6.5_
91*94 T,52
94.00 8,_?
95.87 .°,50
_8,10 10,28
100.18 l]*l_
_02,65 12,16
104.92 13,_q
107.64 14.45
110,54 1_*"3
11_._3 1°,04
119,T2 20*57
12_°45 22,_0
170°75 2_*7_
134.71 pT._2
I_9*78 ?o,6_
1_3.91 33,20
149,_T 3_*96
I_.8_ 4o,oe,
160°81 _0,_8
16T*05 47.01
173.80 45.91
1_I.0_ 4o,03
195.q_ 5_.78
190*63 "" 5T.9_
204._I 60. T5
205*TB 61.483.38 *_I
2.78 *?Y
7,_2 ,_0
,?q .11
• 14 *|8
• 00 *_Y
• 80 .03
_ .... ,?0
105187 24563,75 -5782,89 -108,38
104963 24565*20 -6762*49 -109,00
104667 24567,2_ "'-_763,03 -109,32
104441 24568,07 -_76Z,64 -10_,74
104132 24567.96 -0782.86 -100.56
103894 24568°[7 -6762*68 -lOq*4T
103669 24568.00 -6762.70 -109*39
103371 24568,01 -6762°82 -109*61
103128 24568.II -_762.94 -109*53
102822 2_56T.90 -676?*E6 -_09*65
102596 2456T,93 -6762*67 -109.46
102299 24367,74 -6762*80 -10_*38
102074 24567°97 -6762.82 -109,60
lO]TT7 2456T.98 -6762°94 -10q*52
101552 24567*60 -6762,75 -109°53
101254 24567,81 -5762,88 -109.45
101029 2496T*64 -6763*69 -109,4T ,01
100733 2456T*65 -6762*R2 -109,_ -,02
100508 2456T*6E -6762*83 -109*40" ,00-,00
-*01
-,01
,00
-*01
-*03
24567_0 -6762*87 -109*3_ *03_
2456T*T2 -6762,T9 -109*45 -°08
2456T,62 -6TbZeT1 "109,46 ,02
.63
*68
.4T
.30
*02
-.04
,01
*00
-*01
-.04
-°03
.or
-*01
-*05
-.02
*33
,15
,09
*01
-,nO
-°(_I
-,03
-*03
-,00
*01
.01
°,0|
-*_)2
-.01
*01
*OI
-.0_
-*DO
-*01
°01
*01
°0_
-,01
-*01
-,01
-.t_|
°06
oOI
&_4.129 4756744 -2636953 99986 24367.T2 -6762*TT -109.34
416.644 6823441 -2657313 99688 2456T*63 -6762,7_ -109,66
418*899 4673920 -2671209 99463 Z456T°36 -6762*71 -109.4T
621*620 4940785 -266961_ 99163 24367*5T -6762,63 -109*39
424.329 3007336 -2707935 98869 2456T*ET -ET62*SE -100*51
426*390 5057961.___2721870 98643
429.098 5124490 -2740186 98347
431*312 5178880 -2755159 98105
-'_, 59
.t., 08
-4,16
-4.2';
-4*43
-4.'_8
-4.6o
-4.9m
-_,04
-m.14
-_*3_
-9.t.'_
-% ':4
-9. _,t,
-%?8
-5*O5
-8, _'r
-6.7O
-?.11
-?.3?
-7._
-7._
-_.0_
-"._8
-3,91
-c_. nO
-9,3Y
-9.74
-1_.17
-I0,99
-11.1_
-11,4_$
*|_,50
.0_
,0 •
.04
-.32
-.0,_
-*10
-°15
-.05
-.00
-.r)2
-*0_
°0 •,dl
.01
-.01
.01
.Or
°0_
-*00
*00
.,0_
-°_I
-*00
,0 ¸
*0
-.f
-°l

3150-60Z?-R8-000
Page A-12
Table A-4. Reentry Trajectory Reconstruction
GT-6 RE-_TRY _RRITT ISL
I_TIAL _. RELATIVEWL. m_AL FLT.FR_ LIFTOFF MAGNITUr_. MAORITU_ PATH ANGLE
(_co._) (P_/_c) (_l_c) (_.s)
9227?.529 25547.1 2/.188.4 -3.311
92278.529 25531.9 2A183. ? -6.260
92279.529 26043.6 24700.9 -2.033
92280.529 26470.0 25121.8 4.773
92281.529 26028.8 24672.9 I.A79
92282.529 25934.9 24584.6 -1.374
92283.529 25994.5 2A641,9 -.165
92284.5_ 255A1.2 2A186.8 .-4.638
92285.529 25533.2+ 24186.1 -6.&38
92286.529 25846.3 24495.7 -2.115
92287.529 26403.2 25054.1 2+.2AI
92288.529 26375.9 25025.4 2+.084
92289.529 25862.1 2&502+.7 -.239
92290.529 25677.8 24329.6 -A.852+
92291.529 2563 i. 1 2/,292+.9 -8.218
92292.529 25810.7 24457.9 -2.005
92293.529 25980.6 24623.1 1.520
92294.529 25687.2 2A330.i -2.027
92295.529 25945.1 24590.9 .02+5
92296.529 26265.2 24910.8 4.184
92297.529 25937.5 24586.8 -1.308
92298.529 25676.3 24341.7 -8,176
92299.529 25572.0 24222.2 -5 .AI3
92300.529 25908.9 24552.1 .517
92301.529 26117.8 24765.0 1.72+3
92302.529 25812.8 2AA56.0 -.769
92303.529 25796.2+ 2A4J_I.7 -i. 535
92304.529 25990.8 24640.2 -.2+02
92305.529 25728.5 24375.5 -2.652
92306.529 25771.7 24A20.7 -2.828
92307.529 2589?.8 245_.7 -.82492308.529 25801.9 _6.3 -1.167
92309.529 25972.9 2462&.9 -1.591
92310.529 25938.5 24591.1 -2.068
92311.529 25665 .i 24309.1 -2.480
9_.529 25758.9 244O1.3 -.995
92313.529 25870.3 24516.3 -.8059_14.5_ 25993.6 2A6AO. 6 .41292315.529 25955.8 24603.6 -.385
92316.529 25687.7 24336.3 -3.2+93
92317.529 25706.9 2&353 .& -2.715
92318.529 25975.2+ 2&623.2 -.i19
92319.529 26016.4 24666.1 -. 251
92320.529 25867.2 22+513.3 -.871
92321.529 25753.5 2A398.3 -1.630
92322.529 25773.7 P_,21.2+ -2.184
92323.529 25955.5 22+605.2 -.973
92324.529 25744_.9 24390.1 -1.802
92325.529 25689.3 2A332+.2+ -2.266
92326.529 25900.7 2452+7.0 -.357
92327.529 259&I, 2 24589.7 -. 64692328.529 25900.6 2A_50.6 -i. 661
92329.529 25899.2+ 2ASAS.7 -1.32+9
%2330.529 25797.2+ 2A_3.3 -1.229
92331.529 25815.2 24459.6 -.69o
92332.529 25983.7 24632+. 6 -. 998
92333.529 25769.1 24A17.7 -2.410
92334.529 2572/+.9 24371.0 -2.093
92335.529 25807.6 24&52.0 -.571
92336.529 25878.3 24525.3 -.785
92337.529 25899.2+ 2452+9.3 -1./485
92338.529 25918.5 22+569.9 -1.69092339.529 25892.0 2&SAO.7 -1.192
92340.529 25895.2 24542.3 - •52+7
923_1.529 25885.6 24513.2 -1.060
923&2.529 25928.0 24577.8 -I.A3992343.529 25913.5 24560.9 -.883
IXE_IAL ALTITUIZ GEOnmTIC LAT. GEOdeTIC LaMO.
(_reF.s)
93.57O 335280.5 28.469 -91._,995.665 333653.0 28.2+72 -91.376
99.608 329999.0 28,457 -91.303
97.004 330665.0 28.44_5 -91.228
95.996 334395.7 28.440 -91.151
97.871 331937.7 28.&32 -91.078
97.341 333365.2 28.422 -91.002
94.953 332053.7 28.&12 -90.928
96.032 329001.7 28.409 -90.855
97.631 327733.0 28.398 --90.781
97.232 326805.5 28.391 -90.707
96,991 330382.0 28.379 -90.630
95.818 330512.0 28.373 -_ .555
97,310 330417.0 28,365 -90.481
97,997 326633.0 28.353 -90.2+08
97.075 322415.2 28.3&8 -90.336
95.685 3258"/6.7 28.338 -90.259
95.569 323453.5 28,337 -90.186
97.030 323088.2 28.325 -90.11195.646 324053.5 28.317 -90.036
98.098 326955.5 28.312 -89.96098.628 3227_2.5 28.297 -89.888
96.434 3192+72.7 28.289 -89.815
96.192 317924.7 28.281 -89.741
97.386 3192+58.2 28.275 -89.666
96.272 319462.5 28.264 -89.591
96.883 318746.7 28.260 -89.517
98.315 318691.2 28.245 -89.4A2
97,151 318558.7 28.239 --89.368
97.686 315840.7 28.229 -89.295
97.578 3152+68.0 28.221 -89.221
96.780 315772+.7 28.211 -89.146
98.953 3144-17.5 28.202 -89.072
99.012 313949.2 28.189 -88.998
96.334 312269.0 28. IR2 --88.924
96.229 312384.5 28.174 -88.850
97.2+65 311898.2 28.166 -88.776
97.792 310779.5 28.156 -88.702
98.110 312014.2 28.147 -88.627
97.564 310024.0 28.138 -88.553
97.247 308633.5 28.127 -88.480
98,106 308276.7 28.120 -88.406
98.672 308379.7 28.110 -88.331
97.6&l 30792+8.2 28.100 -88.257
97.168 308215.0 28.090 -88.182
97.902+ 306361.7 28.082 -88.109
98.696 306010.2 28.070 -88.035
97.298 305517.2 28.061 -87.961
97.162 302+586.0 28.052 --87.887
97.804 303406.7 28.04/+ -87.813
98.522 304197.2 28.033 -87.739
98.793 3025A2.2 28.021 -87.665
98.683 302668.5 28.031 -87.591
97.765 301451.2 28.003 -87.517
97.&&2 301651.5 27.992 -87.44J
99.208 300907.5 27.982 -87.369
98.367 300399.0 27.972 -87.295
97.%o 298710.7 27.963 -87.222
97.52+6 298620.2 27.953 -87.14798,316 298420.2 27.943 -87,073
98.99O 297_28.7 27.932 -87.000
99.350 29718&.7 27.922 -86.92698.78? 29601_.7 27.907 -86.85298.2+55 296052.2 27.900 -86.778
98.571 295609.0 27.88? -86.702+99.086 29/,856.2 27.880 -86.63098.601 2940O1.5 27.866 -86.556

3150-60ZT-R8-000
Page A- 13
Table A-4. Reentry Trajectory Reconstruction (Continued)
GT-6SZ-mT_ mzmU_TZSL(COJT.)
TIME INERTIAL VEL. RELATIVE VEL. ]RERTIAL FIT.FRCK LIFTOFF MA_ITUEE MA_ITUI]E PATH ANGLE
(SZCa_m) (zzlszc) (z_Iszc) (_GRZZS)
I_EErIAL ALTITUmZ G_OI_TIC LAT. GEOE_TIC ILRG.m_VI_G ANGLE (FEET) ( _m_.S ) (C_S)
92344.529 25780.7 24424.4 -1.232 97.50692345.529 25911.0 24563.3 -1.937 99.692
92346.529 26O78.5 24738.3 -1.850 101.34792347.529 25738.8 24382.9 -1.360 98.270923_8.529 25562.3 24200.9 -.388 96.02592349.529 258O0.2 2_5.2 -.568 98.08892350.529 25877.4 24528.1 -1.773 99.43892351.529 25818.1 24466.9 -1.717 99.02192352.529 25868.6 24516.6 -.949 98.952
92353.529 25888.3 24536.6 -.826 99.06192354.529 25852.7 24501.7 -1.407 99.20592355.529 25832.3 24480.9 -i.bJ+O 99.12292356.529 25839.9 24488.4 -1.298 99.12.992357.529 25840.6 24489.9 -1.526 99.33J,92358.529 258_.3 24488.4 -1.131 99._J.392359.529 25840.5 2h488.2 -.949 99.05492360.529 25840.7 2Jd_9.5 -1.317 99.319
92361,529 25837.9 24486.9 -1.403 99.38492362'.529 25826.4 24_75.2 -1.380 99.34792363.529 25827.7 24476.9 -1.472 99.45892364.529 25824.9 24_73.8 -1.364 99.4?.692365.529 25853.2 24502.2 -1.152 99149392366.529 25845.4 24494.0 -1.0_6 99.44692367.529 25852.8 23+501.3 -.924 99.45792368.529 258_.0.4 24489.9 -1.328 99.66692369.529 25823.9 24473.7 -1.543 99.73992370.529 25820.0 2JJ+88.8 -1.197 99.56992371.529 25820.7 2J_J+69.1 -1.052 99.54492372.529 25820.7 24470.I -1.335 99.74492373.529 25828.5 2/2+78.3 -1.373 99.8/8
92374.529 25785.4 24404.7 -1.482 99.75992375.529 25816.7 24J+66.0 -1.208 99.80092376.529 25834.8 2J_84.2 -1.111 99.86492377.529 25818.4 2_68.1 -1.339 99.959
92378.529 25782.9 24432.3 -1.403 99.90192979.529 25819.4 242+68.9 -i.177 99.97492380.529 25836.7 24486.2 -1.060 100.02092381.529 25813.4 24463.0 -1.184 100.04392382.529 25809.6 24459.5 -1.293 100.12192383.529 25795.7 24445.4 -1.289 100.108
92384.529 25787.9 24437.4 -1.218 100.09892_85.529 25796.1 24446.0 -1.269 100.20492386.529 25788.9 24438.9 -1.287 100.2379238?.529 25789.5 24439.2 -1.168 100.22592388.529 25794.7 24444.5 -1.139 100.27792389,529 25778.8 24428.8 -1.219 100.31692390.529 25776.3 2&426.4 -1.278 100.38092391,529 25783.o 2/_33.4 -1.275 lO0.449
92392.529 25777.5 24427,.7 -1.227 100.45992393.529 25760.7 244/0.9 -1.237 io0.&62
294354.0 2'7.859 -86.482Lx)286_..5 27.847 -86.4O8292391.0 27.835 -86.3352913]_]..? 27.821 .-86.26129107+.0 27,815 -86.18829O969.0 27.805 -86. L1629O517.7 27.79_, -86.O4O289469.7 27.78:3 -85.967288998.5 2?.772 -85.893288563.5 27.761 -85.819288192.7 27.750 -85.74528'7295.0 27.739 .,85.672286834.2 27.728 -85.598286290.2 27.717 -85.525285369.5 27.705 -85.451285106.5 27.694 -85..37728_B5;5 27.684 -85.304283957.5 27.672 -85.230283372.7 27.66o -85.15v282554.5 27.649 -85.O8628202_1..7 2?.638 -85.01o283.439.5 27.626 -84.93728O771.5 27.614 -84.863280378.7 27.6O3 -84.790
2"/9930.5 27.591 -44.716279328.0 27.580 -84.643278524.0 27.568 -84.570278112.7 2?.556 -8_, .h96277469.7 27.545 --8&.k23
276940.5 27.533 -8A.349276236.5 _7.521 -44.276275582.0 27.509 --84.203275214.2 27.497 -44.13027_579.5 27.485 -84.056273963.5 27._72 --89.983
273245.2 27.461 -83.9102728?0.7 27.448 -83.8372722?9.5 27._6 --83.764271752.7 27.424 -4_.691271O65.2 27.412 -83.618270518.0 27.399 -83.54,4269954.5 27.387 -83,471269364.5 27.374 -83.398268777.5 27.362 -83.3252(:,83].2.2 27.350 .-83.252267715.5 27.337 -83.179276126.7 27.324 -83.106
266556.5 27.312 -83.034265998.0 27.299 -82.961265372.0 27.286 -82.888
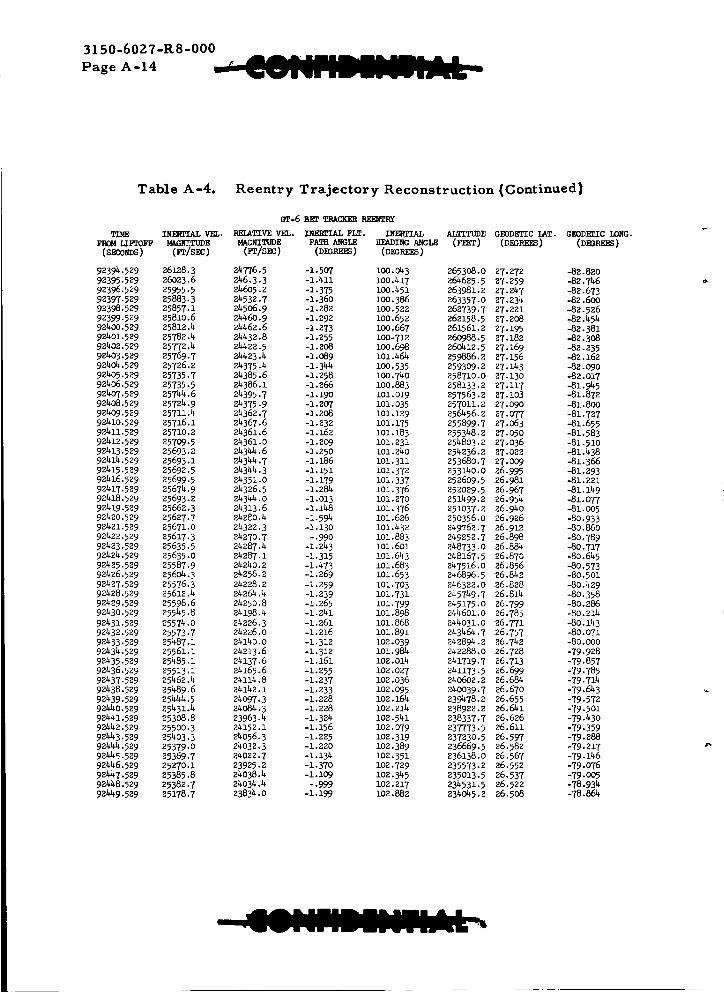
3150-6027-R8-000
Page A- 14
Table A-4. Reentry Trajectory Reconstruction (Continued]
GT-6 Bin' TRACKER
TIME INI_IAL VEL. RELATIVE VEL. _ FLT. INERTIAL ALTITUDE GEODETIC IAT. GEODETIC LONG.
FBCM LIFTOFF MAG_..TUDE MAGNITUDE PATH ANGLE HEADING ANGLE (F_-'f) (DEGREES) (DEGK_S)
(s_o_s) (_Is_) (_Is_c) (Dm_ES) (Dm_S)
92394.529 26128.3 24776.5 -1-507 I00.043 265308.0 27.272 -82.820
92395.529 26023.6 246.3.3 -1.411 100.417 264625.5 27.259 -82.746
98396.529 25955.5 24605.2 -1.375 zoo.451 263981.2 27.247 -82.67398397.529 25883.3 24532.7 -1.360 100.386 263357-0 27.234 -82.600
92398.529 25857.1 24506.9 -1.282 100.522 262739.7 27.221 -82.526
92399.529 25810.6 24-460.9 -1.292 100.652 262158.5 27.208 -82.454
92400.529 25812.4 24462.6 -1.273 100.667 261561.2 27.195 -82.381
92401.529 25782.4 24432.8 -1.255 100-712 260988.5 27.182 -82.30892402.529 25772.4 24_22.5 -1.208 100.698 260412.5 27.169 -82.235
92403.529 25769.7 24423.4 -1.089 101.464 259886.2 27.156 -82.162
9240_.529 25726.2 24375.4 -1.3_ 100.535 259309.2 27.143 -82.090
92405.529 25735.7 24385.6 -1.258 100.740 258710.0 27.130 -82.o17
92406.529 25735.5 24386.1 -1.266 100.883 258133.2 27.117 -81.9_5
92407.529 25744.6 24395.7 -1.190 101.019 257563.2 27.103 -81.872
92408.529 25724.9 24375-9 -1.207 101.035 257011.2 27.090 -81.800
92409.529 25711.4 24362.7 -1.208 101.129 256_56.2 27.077 -81.727
92410.529 25716.1 24367.6 -1.232 101.175 255899.7 27.063 -81.655
92411.529 25710.2 24361.6 -1.162 101.183 255348.2 27.O50 -81.583
92412.529 25709.5 24361.0 -1.209 101.231 254803.2 27.036 -81.510
92413.529 25693.2 24344.6 -1.250 101.240 254236.2 27.022 -81.438
92414.529 25693.1 24344.7 -i.186 i01.311 253680.7 27.009 -81.366
92415.529 25692.5 24344.3 -1.151 101.372 253140.0 26.995 -81.293
92416.529 25699.5 24351.0 -1.179 101.337 252609.5 26.981 -81.221
92417.529 25674.9 24326.5 -1.284 101.376 252029.5 26.967 -81.149
92418.529 25693.2 2434_.0 -i.013 i01.270 251499.2 26.954 -81.077
92419.529 25662.3 24313.6 -1.148 101.376 251037.2 26.940 -81.005
92420.529 25627.7 24280.4 -1.594 101.626 250356.0 26.926 -80.933
92421.529 25671.0 24322.3 -i.130 101.432 249762.7 26.912 -80.860
92422.529 25617.3 24270.7 -.990 101.883 249252.7 26.898 -80.789
92423.529 25635.5 24287.4 -1.243 101.601 248733.0 26.884 -80.71792424.529 25635.0 24287.1 -1.315 101.643 248167.5 26.870 -80.645
92425.529 25587.9 24240.2 -1.473 i01.683 247516.0 26.856 -80.57392426.529 25604.3 2_256-2 -1.269 101.653 246896.5 26.8_2 -80.501
92427.529 25576.3 24228.2 -1.259 101.703 246322.0 26.828 -80.429
92428.529 25612.4 24264.4 -1.239 101.731 245749.7 26.814 -80.358
92429.529 25598.6 24250.8 -1.265 101.799 245175.0 26.799 -80.286
92430.529 25545.8 24198.4 -1.241 101.898 244601.0 26.785 -80.214
92431.529 25574.0 24226.3 -1.261 101.868 244031.0 26.771 -80.143
92432.529 25573.7 24226.0 -1.216 101.891 243464.7 26.757 -80.071
92433.529 25487.1 24140.0 -1.312 102.039 242894.2 26.742 -80.000
92434.529 25561.1 24213.6 -1.312 101.984 242288.0 26.728 -79.928
92435.529 25485.1 24137.6 -1.161 102.014 241719.7 26.713 -79.857
92436.529 25513.1 24165.6 -1.255 i02.027 241173.5 26.699 -79.785
92437.529 25462.4 24114.8 -1.237 102.036 240602.2 26.68_ -79.714
92438.529 25489.6 24142.1 -1.233 102.095 240039.7 26.670 -79.6_3
92439.529 25444.5 24097.3 -1.228 102.16% 239478.2 26.655 -79-572
92td_0.529 25431.4 2408_.3 -1.228 102.214 238922.2 26.6%1 -79-501
92441.529 25308.8 23963.4 -1.324 102.541 238337-7 26.626 -79.430
92442.529 25500.3 24152.1 -1.156 i02.079 237773.5 26.611 -79.359
92443.529 25403.3 24056.3 -1.225 102.319 237830.5 26.597 -79.288
924-44.529 25379.0 24032.3 -1.220 102.389 236669.5 26.582 -79.217
92_51529 25369.7 24022.7 -i.134 102.351 236138.0 26.567 -79.146
92446.529 25270.1 23925.2 -1.370 102.729 235573.2 26.552 -79.076
924A7.529 25385.8 24038.4 -1.109 102.345 235013.5 26.537 -79.005
924A8.529 25382.7 24034.4 -.999 102.217 234531.5 26.528 -78.934
92_9.529 25178.7 23834.0 -i.199 102.882 2340_5.2 26.508 -78.864
Jm.

'-R8-000
Page A- 15
Table A-4. Reentry Trajectory Reconstruction (Continued)
TIME INERTIAL %'EL. RELATIVE VEL. IHESrlAL FLT. INEHN_.AL ALTITUDE GEODETIC LAT. GEODEI'IC LONG.
LIFTOFF MAC_TUDE MAGNITUDE PATH ANGLE KFADING ANGLE (FEE_) (DEGREES) (DEGREES)
(sEco_s) C_/s_c) (er/sEc) (Dm_) (DmP_S)
92456.529 25392.9 240_.2 -.982 102.185 233539.2 26.493 -78.793
92451.529 25238.2 23892.4 -i. 274 102.727 233032.7 26.478 -78.723
92452.529 25250.4 23903.7 -1.133 lO2.588 232461.0 26.463 -78.653
92453.529 25171.3 23826.9 -1.415 102.998 231910.2 26.448 -78.583^_,_, .... o=_o_ v _RI_._ -i._12 102.856 231292.5 26.432 -78.513
92455.529 25204.0 23858.6 -i.302 102.883 230696.7 26.417 -'(6._z
92456.529 25126.4 23781.2 -1.248 lO2.95o 23011o.2 26.402 -78.373
92457.529 25166.1 23819.6 -1.o62 102.768 229602.2 26.386 -78.303
92458.529 25203.0 23856.2 -1.252 lO2.724 229079.7 86.371 -78.233
92459.529 25141.7 23796.5 -1.259 lO3.O28 228492.5 26.356 -78.163
92460.529 25131.7 23785.6 -1.312 102.889 227925.0 26.341 -78.o93
92461.529 25051.2 23706.3 -1.175 103.137 227352.2 26.325 -78.o23
92462.529 25081.6 23736.7 -1.376 103.134 226779.2 26.310 -77.954
92463.529 25003.5 23658.8 -i. 183 103.209 226193.2 26.294 -77.884
9246_.529 25014.8 23670.2 -1.300 103.241 225638.2 26.279 -77-815
92465.529 25024.1 83678.6 -1.380 103.109 285054.0 26.263 -77.746
92466.529 24925.7 23582.5 -1.389 103.517 224424.2 26.248 -77.677
92467.529 24938.1 23592.9 -1.133 I03.239 223873.5 26.232 -77.6O8
92468.529 24920.4 23575-7 -1.272 103.328 223327.0 26.216 -77.539
92469.529 24904.9 23560.2 -i. 316 103.340 222747.0 26.201 -77.470
92470.529 24856.6 23511.7 -1.168 103.350 222196.0 26.185 -77.4Ol
92471.529 24809.5 23466.2 -1.287 103.625 221632.0 26.169 -77-332
92472.529 24794.5 23450.6 -1.224 103.566 221087.5 26.153 -77.26_
92473.529 24791.8 23447.1 -1.247 103.448 220532.2 26.137 -77.195
92474.529 24775 •5 23431.1 -1.348 103.528 219944.0 26.122 -77.127
92475.529 24696.1 23352.5 -1.123 103.683 219%23.0 26.106 -77.058
92476.529 24698.3 23354.4 -1.340 103.638 218850.2 26.O90 -76.990
92477.529 24610.6 23267.8 -1.062 103.866 218306.0 26.074 -76.922
92478.529 24656.0 23311.7 -1.329 103.643 217796.7 26.058 -76.854
92_79.529 24598.3 23254.7 -1.348 103.763 217201.0 26.0_2 -76.786
92480.529 24543.0 23199.8 -1.133 103.870 216637.7 26.026 -76.719
92481.529 24522.0 23178.7 -1.239 103.871 216138.7 26.010 -76.651
92482.529 24467.5 23125.0 -1.248 i0_ .010 215578.2 25.99% -76.58_
92483.529 24441.9 23099.4 -1.429 IOA.029 214978.2 25.978 -76.516
9248_.529 24439.7 23095.9 -1-315 103.855 21_07.5 25.962 -76.449
92485.529 24373.5 23030.5 -i'.286 103.999 213809.8 25.9%6 -76.382
92486.529 24317.9 2297512 -i. i00 i04.096 21332_-7 25.930 -76.315
92487.529 24269.2 22926.3 -l.Oh6 i0h.087 212833.0 25.914 -76.248
92488.529 24253.3 22910.3 -1.107 lob. 089 212391.7 25.898 -76.181
92489.529 24250.1 22909.0 -1.9%0 104.327 211677.5 25.882 -76.115
92490.529 24161.9 22819.0 -i.0_5 IOA. 157 211033.7 25.865 -76.048
92_91.529 24101.3 22758.7 -.998 10_.229 210561.7 25.849 -75.982
92492.529 24070.7 22727.5 -i.0_ i0_.157 210120.5 25.833 -75.916
92493.529 24040.3 22699.2 -1.377 i0_.487 2095_3.0 25.817 -75.850
92_9%.529 23969.3 22626.1 -.861 10%.202 209089.5 25.801 -75.78_
92_95.529 239_.7 22603.2 -1.301 I0_.463 2O8582.0 35.785 -75.719
92496.529 239%5.9 22603 .1 -1.542 io_.259 207980.2 25.768 -75.653
92497.529 23714.1 22373.9 -.179 i0_.781 207565.0 25.752 -75.588
92498.529 23851.3 22509.0 -1.732 i0_.365 207194.5 25.736 -75.523
92_99.529 23713.5 22371.8 -.814 i0_.563 206649.2 25.720 -75.458
92500.529 23722.1 22380.3 -1.490 i0_.520 206100.2 25.703 -75.393
92501.529 23620.8 22276.8 -.707 i0_.25_ 205782.0 25.687 -75.328
92502.529 23591.3 22250.3 -1.328 I0_.7O8 205221.2 25.671 -75.26_
92503.529 23543.7 22200.3 -.979 I0_.375 20A813.7 25.655 -75.199
9250_.5_9 239%0.2 22195.9 -1.49! 10%.211 204216.7 25.639 -75.135
92505.529 23_65.3 221_.I -1.672 i0_.690 203535.5 25.623 -75.071

3150-60Z7-R8-000
Page A-16
Table A-4.
(s¢o_) (n/sEc) (l_/S_C)
92506.529 23350.9 22008.492507.529 23332 -5 21989-09250_.529 23307.2 21963.792509.529 23189.9 21847.292510.529 23160.4 21817.1
92511.529 23156.2 2181"2.9
92512.529 22987.0 21643.6
92513.529 23010.7 21667.5
9251_.529 22862.2 _1520.292515.529 22889.9 21544.5
92516.529 22726.4 21383.5
92517.529 22791.7 21_48.9
92518.529 22590.5 21247.0
92519.529 22666.7 21322.3
92520.529 22543.5 21202.3
92521.529 22_66.8 21120.5
92522.529 22368.7 21021.6
92523.529 22390.2 21041.1
9252_.529 22152.5 2o816.792525.529 22392.6 21O40.6
98526.529 22193.4 208_i.._
92527.529 22066.5 20732.3
92528.529 221o5.8 20762.9
92529.529 21862.0 20525.4
92530.529 21693.5 20347.1
92531.529 2189_.4 20547.1
92532.529 21808.2 20467.6
98533.529 21581.3 20242.692534.529 21420.8 20073.8
92535.529 21467.4 20]27.3
92536.529 21508.6 80159.5
92537.529 21817.3 19872.5
92538.529 21146.5 19812.1
92539.529 21215.0 19857.4
92540.529 21689.6 20354.9
92541'529 21708.9 20349.7
925_2.529 21436.4 20097.2
92543.529 21133.6 19792 .i
92544.529 20871.3 19537.8
92545.529 20564.3 19221.0
92546.529 20572.8 19235.4
92547.529 205O4.9 19173.3
92548.529 20390.4 19047.9
92549.529 20570.2 19232.5
92550.529 20478.7 19156.5
92551.529 20408.4 19072.9
92552.529 19531.9 18196.0
92553.529 19669,9 18340.1
92554.529 19617.7 18258.5
92555.529 20416.3 19049.2
92556.529 20041.6 18701.8
92557.529 20024.4 18669.3
92558.529 20392.4 19050.4
92559.529 20140.6 18797.5
92560.529 20025.4 18702.3
IN_/.AL V_. R_ATIVE VEL. INE_--AL FLT.
Reentry Trajectory Reconstruction (Continued.]
GT-6 BE_E TRA_ER _I_
INERTIAL ALTITUDE G_DDEFiC IAT. GEODETIC LONG
PATH ARGLE F_ADING ANGLE (FEET) (DII]REES) (DRR-REES)
(Dm_) (pEOn)
-.893 104.592 203006.5 25.607 -75.007
-.939 104.443 202646.5 25.591 -74.943
-1.364 104.447 202186.7 25.575 -74.879
-.852 IO4.623 201657.7 25.560 -74.816
-1.273 lO4.524 201227.0 25.5_d_ -74.753
-1.684 lo4.49_ 200626.7 25.528 -74.690
-._J',5 lO4.6oo 200184.2 25.512 -74.627-1.625 io4.582 199765.7 25.496 -74.564
-- ,1614 IO4.843 199292.2 25.481 -74.502
-1.387 104.286 198835.5 25.465 -74.439
-.219 104.766 198473.o 25.449 -74.377
-1.964 104.674 198079.7 25.433 -74.315
-.i09 IO4.726 197600.2 25.418 -74.254
-1.659 104.498 197320.7 25.402 -74.192
-1.543 105.020 196585.5 25.387 -74.131
-.?]2 104.326 196119.? 25.371 -74.o7o
.281 IO4.239 196053.0 25.356 -74.009
-.927 103.925 195950.5 25.341 -73.948
-.722 105.944 195594.7 25.326 -73.887
-1.024 103.487 1951o4.7 25.31o -73.827
-i.248 103.471 194727.2 25.296 -73.766
-1.671 106.145 194170.7 25.280 -73.706
-3.074 104.704 193273.5 25.264 -73.647
-.870 105.904 192432.7 25.249 -73.587
1.936 104.393 192761.7 25.233 -73.528
-1.627 104.315 192861.0 25.219 -73.469
-3.185 105.093 191735.5 25.203 -73.410
.102 105.712 191128.2 25.188 -7/-3.5_
•731 IO4.485 191355.5 25.172 -73.294
-2.184 105.396 191028.2 25.158 -73.236
-.780 lo4.209 19O454.0 25.142 -73.178
-.049 104.898 190275.0 25.128 -73.120
-.771 106.380 190114.2 25.112 -73.063
-.4_7 102.895 189926.2 25.098 -73.006
-1.467 i06.348 189529.5 25.083 -72.948
-i. 5_8 102.569 188864.7 25.067 -72.889
-6.253 IO4.549 187399.7 25.054 -72.831
-3.817 105.003 185403.5 25.039 -72.774
2.159 106.464 1_o.2 25.024 -72.717
-.045 105.253 185647.2 25. oo8 -72.662
-2.o65 1o5.969 185276.2 24.993 -72.607
-2.726 106.690 18_167.5 24.977 -72.552
-I.167 105.365 183518.5 24.962 -72.498
-1.477 i06.056 183143.0 24.9_7 -72.443
-1.718 108.073 182596.7 24.930 -72.389
.215 i06.451 182312.7 24.914 -72.334
.090 106.396 182212.7 24.898 -72.281
-1.2_/_ 107.187 182174.7 24.883 -72.2291.089 102.882 182031.2 24.869 -72 • 177-.871 101.521 182198.7 24.858 -72.122
.886 105.933 181842.0 24.8Z9_ -72.0682.659 103.447 182642.5 24.830 -72.014-3.909 105.216 182788.2 24.817 -71.960
-.058 105.543 18O470.7 24.802 -71.9054.361 107.695 182324.0 24.787 -71.853
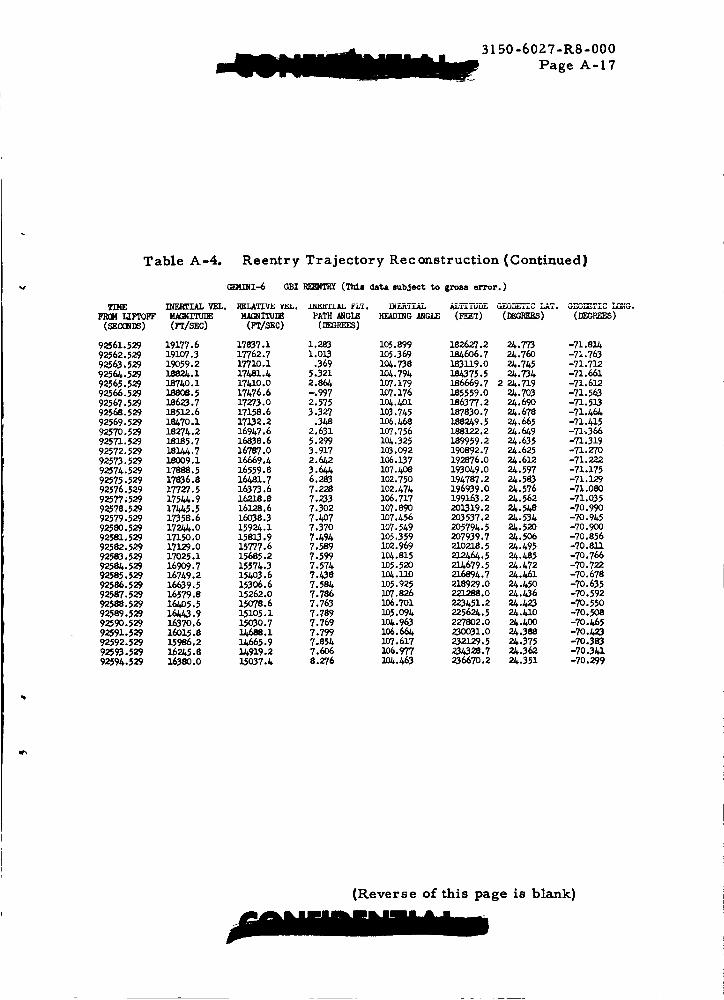
31 50-6027-R8-000
Page A- 1 7
Table A-4. Reentry Trajectory Reconstruction (Continued}
(]_q]NIJo GBI F{]_TI_ (Th_ll data subject to gross error. )
T_EFROI( T.TFTOFF(_cosm)
INERTIAL VEL. RELATIVe:V_:L. J_'A'AAL FLT. _RYiAL ALA-iA-_DEG_O_TIC LAT. G_O_.TIC LC_;G.MAGNITUDE MA_I_ n_. PATH ANGLE HEADING ANGLE (FEET) (DEGREES) (_GREES)
(zrlszc) (rr/szc) C_Gm_ZS)
92561.52992562.52992563.52992564.52992565.52992566.52992567.52992568.52992569.52992570.529
92571.52992572.52992573.52992574.52992575.52992576.529925??;52992578.529
92579.52992580.52992581.52992582.52992583.529
92584.52992585.52992586.52992587.52992588.52992589.52992590.52992591.52992592.529925 93.5299259k.529
19177.6 17837.1 1.283 105.899 182627.2 24.773 -71.814191O7.3 17762.7 1.013 105.369 1846O6.7 24.760 -71.76319059.2 17710.1 .369 104.738 183119.0 24.745 -71.712
18824.I 17481.4. 5.321 104.794 184J75.5 24.734 -71.661187A0.i 17410.0 2.864 107.179 186669.7 2 24.719 -71.61218808.5 17476.6 -.997 107.176 185559.0 24.703 -71.56318623.7 17273.0 2.575 104.4,01 186377.2 24.690 -71.513
18512.6 17158.6 3.327 103.74.5 187830.7 24.678 -71.46418_70.1 17132.2 .348 I06.468 188249.5 24.665 -71.4151827_.2 169k7.6 2.631 107.756 188122.2 24.64.9 -71.36618185.7 16838.6 5.299 104.325 189959.2 24.635 -71,3i9
1814_.7 16787.0 3.917 i03.092 190892.7 24.625 .-71.27018009.1 16669.4 2.642 106.137 192876.0 24.612. .-71.222.17888.5 16559.8 3.644 107.408 193049.0 24.597 -71,17517836.8 16481.7 6.283 102.750 194787.2 24.583 -71.129
17727.5 16373.6 7.228 lO2.474 196939.0 24.576 -71.0801754J+.9 16218.8 7.233 106.717 199163.2 24.562 -71.03517445.5 16128.6 7.302 107.890 201319.2 24.5_ -70.99017358.6 16038.3 7.407 107.456 203537.2 24.534 -70.94.5
172J_.0 15924.1 7.370 107.549 205794.5 24.520 -70.90017150.0 15813.9 7.494 105.359 207939.7 24.50_ -7O.85617129.0 15777.6 7,589 102.969 210218.5 24.495 -70.81117025.1 15685.2 7.599 i0_.815 212A64.5 24._85 -70.766169O9.7 1557_..3 7.574 105.520 214679.5 24.472 -70.72216749.2 15403.6 7.438 104. ]SO 216894.7 24.461 -7O. 67816639.5 153O6.6 7.584 105.925 218929.0 24.450 -70.635
16579.8 15262.0 7.786 10%826 221288.0 24.436 -70.59216405.5 15078.6 7.763 106.701 223451.2 24.423 -70.55016443.9 15105.1 7.789 105.094 225624.5 24.410 -70.50816370.6 15030.7 7.769 i04.963 227802.0 2_.$00 -70.4.65
16015.8 I;_88.1 7.799 106.664 230031.0 24.388 -7o._15986.2 14665.9 7_854 107.617 232129.5 24.375 -70.38316245.8 i_919.2 7.606 106.977 234328.7 24.362 -70.34116380.0 15037.4 8.2"/6 10_.h63 236670.2 24.351 -70.299
(Reverse of this page is blank)
3150=60Z7-R8-000Page B-t
APPENDI X B
TR.W REGR.ESSION PR.OGRAM
(R.E MPJ MODIFICATIONS
(Reverse of this page blank)

PRECEDING P?,G2 _:' _'_'_"_-,_-,,'_ NOT FILMED.
0o0Page B-3
APPENDIX B
TRW REGRESSION PROGRAM
({%EMP) MODIFICATIONS
A change has been implemented in the TKW regression program
(REMP) that allows the effect of unmodeled error uncertainties to be
reflected in the a posteriori statistics of the error coefficients. This
means that if a set of known functions are purposely omitted from the
solution due to correlaL_.on ........... " ........
of these omitted errors can be effectively added to the uncertainties in the
errors that are solved for. This change is mathematically sound and can
be described in the following equations.
The usual expression for C K, the a posteriori covariance matrix
of the error coefficients, is
(BT m-'B C o-l)I (B. 1)
where
B = partial derivations of measurements with respect to errorcoefficients
• m -- assumed white noise covariance matrix of data
C K = a priori error coefficient uncertaintieso
The more valid expression for C K, in Light of functions which truly exist
but are not solved for, is
CK= _T_m'IB+CKo'I)'I[BT_m-I I_m+_J_o_m'IB +CKo "I]
+ -1) -1(BTGrm'IB CKo
(B.Z)

3150-6027 -R8 -000
Page B-4
where
= partial derivatives of measurements with respect to omittederror coefficients
_o - a priori statistics of omitted terms
with manipulations Equation {B. 2) can be written as
C K = CK_ + CK_BTo'm'I_Io[3To'm'IBCK • = CK_ + 5C K
where
(BTo- -1B +CK -1) "1CK* = m o
The REA_P program now computes the AC K term and prints out
both C K and ACK, omitting the old CK* terms. It is obvious that the
uncertainties of the solved-for error coefficients will now be larger than
before (_C K being always positive)0 sometimes much larger, depending
of course on _ and_ O.

3150-6 027 -R8 -000
Page C-I
APPENDIX C
PREFLIGHT CALIBRATION HISTORY PLOTS
Figures
C-I
C-2
C-3
C-4
C-5
From Flight Constant) .......................
Accelerometer Scale Factor History(Deviation From Flight Constant) ................
Gyro Input Axis Unbalance Drift History ...........
Gyro Constant Drift Rate History ................
Gyro Spin Axis Unbalance Drift History ...........
C-4
C-5
C-6
C-7
e_
(Reverse of this page is blank)

400'
! v
12R
1/66
coo
BI
tS.
4OO
).I
0
0
• • J_ • ii a• i v • • _ |
eO0'
|L
4o0
o i
Figure C-I.
0
00
I I • I0
I I
®
Accelerometer Bias History (Deviation FromFlight Constant)

315 0-60Z7 -R8 -000
Page C-4
:ia.o.
xu.(/I
800-
400
®
®
0 I8165
®
l t % I ,9 I0 I I 12 O
I1/66
00 j
400 _"0
®
I I _ I I E) I
eO0
a.
400O
Q
O
8
O I I 0 I I I0
O
Figure C-Z. Accelerorneter Scale Factor History (DeviationFrom Flight Constant)
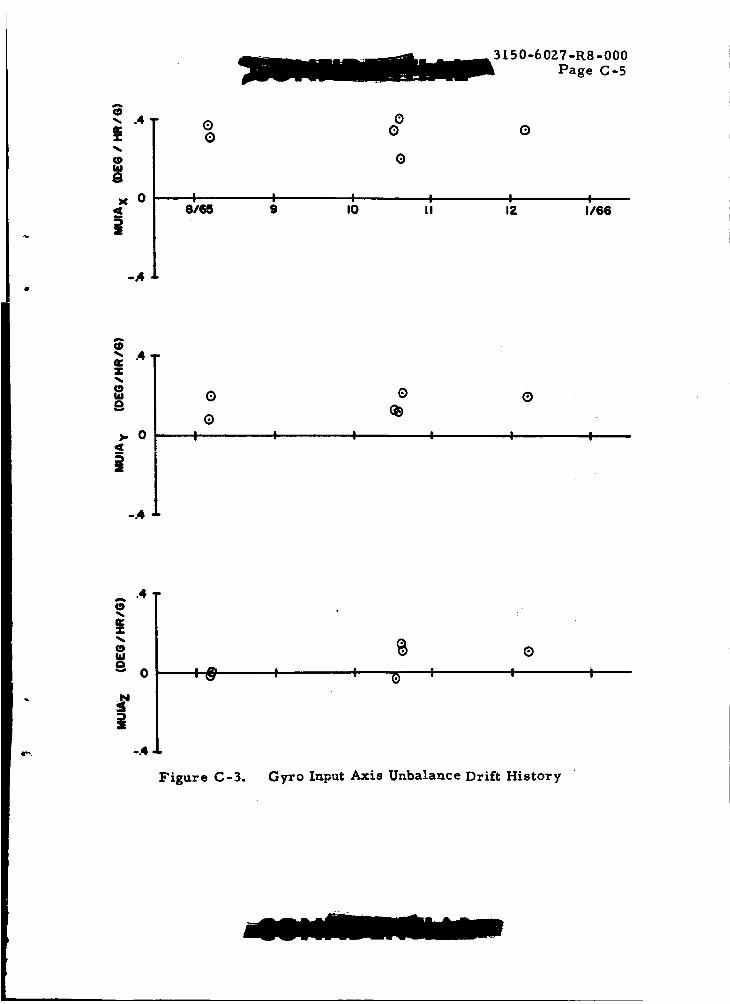
3150-6027-1%8-000Page C-5
-, .4
(DW
g
x 0
i
-A
0®
00 0
0
I I I I I I8/65 9 10 I I 12 1/66
(D
o:.T
$
). 0
-A
®
®
® ®
I I I I I I
.4ew_cD
a,T
(9ILl0"" 0
-.4
w 2_"
Figure C-3.
®
I I ® I I i
Gyro Input Axis Unbalance Drift History

3150-6027-R8-000
Page C-6
.4-
T
,.,0O
Xn,
-.4
oo
®
W_
.4,
i
w0Q
-.4
:s),0 i
.4, o
,.,0Q
Nn.
-.4
, , % 'o
I I
Figure C-4. Gyro Constant Drift Rate History

150-6027-R8-O00
PaEe C-7
i0 ,®
z_.4 £
! Ig _
®
_-9 i Ic.) I(D II 12 - i,_716
.4
|o I (_ I !
®
OCIf)
t--,4
@
Figure C-5.
I I:I I I
Gyro Spin Axis Unbalance Drift History
| i
(Reverse of this page blank)

3150-6077-R8-000
Page R-1
REFERENCES
I,
Z,
3,
4,
o
F.B. Lavenhar, "Preliminary Gemini G and C Data Reduction and
Analysis Plan," Space Technology Laboratories, 4160-6009-TU000,
30 October 1964.
R.E. Sansom, "Gemini Inertial Measurement Unit Error Budget
and Burnout Covariance Matrices (U)" TRW Systems,
3150-6026-R8000, March 10, 1966.
"Final Flight Test Data Mistram Coordinate Systems (i and 3)
After Test No. 7100 (U)," Gemini Missile Number GT-6,
OD Item 9.2. 1.3 No. 20. (C)
"Final Flight Test Data Best Estimate of Trajectory Coordinate
Systems No. I and 3 After Test No. 7100," Gemini Missile No. GT-6,OD Item No. 9. Z. 1.3-26.
R.J. Boyles, "Gemini 6 Orbit and Reentry Trajectory Reconstruc-
tion," TRW Systems, 3150-600Z-R0000, Z March 1966.
(Reverse of this page blank)


