Supplemental Material and Methods Cell Surface...
14
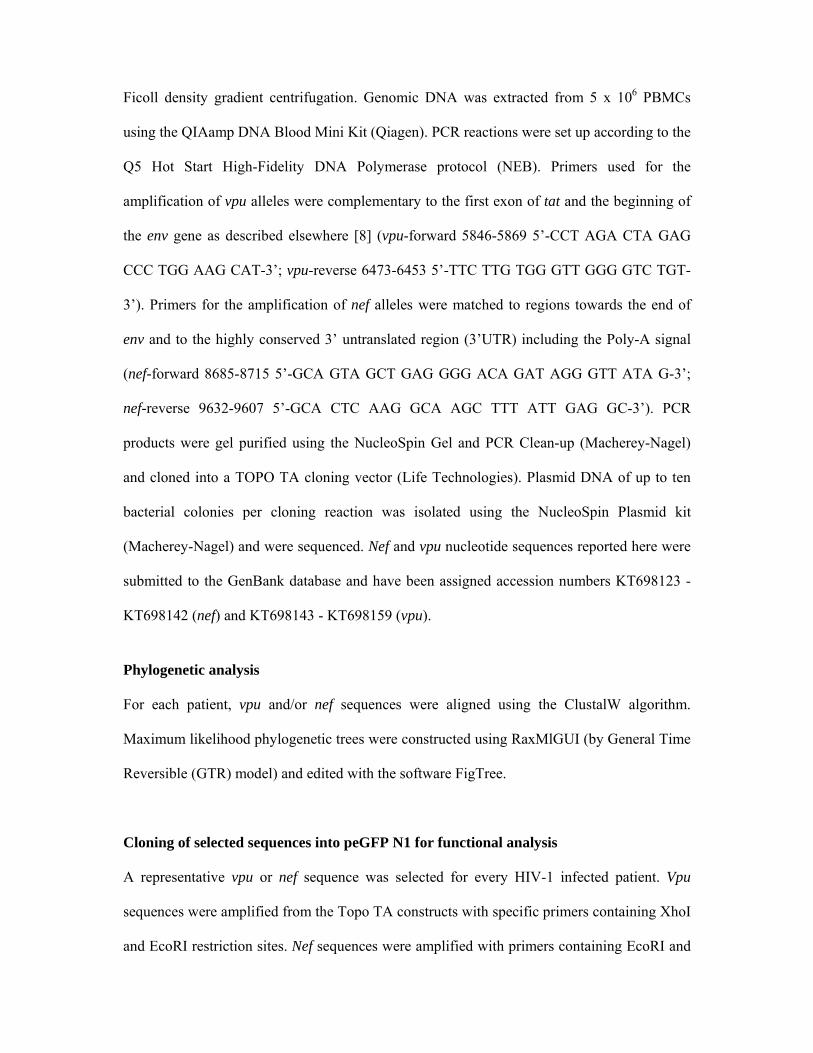
Supplemental Material and Methods Cell Surface Downregulation of NK Cell Ligands by Patient-derived HIV-1 Vpu and Nef Alleles Johanna Galaski, Fareed Ahmad, Nadine Tibroni, Francois M. Pujol, Birthe Müller, Reinhold E. Schmidt and Oliver T. Fackler Cells lines and expression plasmids HeLa TZM-bl and A3.01 T cells were cultivated in Dulbecco's modified Eagle's medium (DMEM) and RPMI 1640, respectively, supplemented with 10% fetal calf serum and 1% penicillin-streptomycin (Invitrogen). Both cell lines were obtained through the NIH AIDS Reagent Program: HeLa TZM-bl cells from Dr. John C. Kappes, Dr. Xiaoyun Wu and Tranzyme Inc. and A3.01 T cells from Dr. Thomas Folks. The expression constructs for green fluorescent protein (GFP) fusion proteins of SF2 Nef and NL4-3 Vpu as well as for most of the corresponding mutants were described previously [1-5]. To generate Vpu H2ELV, the wild type vpu was PCR amplified using a 3’-end primer that contained the corresponding mutations for the acidic di-leucine motif, the product was subsequently cloned in the peGFP-N1 vector using HindIII and BamHI restriction sites [6, 7]. Isolation of genomic DNA from PBMC samples and amplification and sequencing of vpu and nef alleles To facilitate the isolation of viral sequences also from patients with low viral load as well as the limited availability of plasma samples from these patients, proviral sequences were amplified from Peripheral blood mononuclear cells (PBMCs). PBMCs were separated using
Transcript of Supplemental Material and Methods Cell Surface...
Supplemental Material and Methods
Cell Surface Downregulation of NK Cell Ligands by Patient-derived HIV-1 Vpu and Nef
Alleles
Johanna Galaski, Fareed Ahmad, Nadine Tibroni, Francois M. Pujol, Birthe Müller, Reinhold
E. Schmidt and Oliver T. Fackler
Cells lines and expression plasmids
HeLa TZM-bl and A3.01 T cells were cultivated in Dulbecco's modified Eagle's medium
(DMEM) and RPMI 1640, respectively, supplemented with 10% fetal calf serum and 1%
penicillin-streptomycin (Invitrogen). Both cell lines were obtained through the NIH AIDS
Reagent Program: HeLa TZM-bl cells from Dr. John C. Kappes, Dr. Xiaoyun Wu and
Tranzyme Inc. and A3.01 T cells from Dr. Thomas Folks.
The expression constructs for green fluorescent protein (GFP) fusion proteins of SF2 Nef and
NL4-3 Vpu as well as for most of the corresponding mutants were described previously [1-5].
To generate Vpu H2ELV, the wild type vpu was PCR amplified using a 3’-end primer that
contained the corresponding mutations for the acidic di-leucine motif, the product was
subsequently cloned in the peGFP-N1 vector using HindIII and BamHI restriction sites [6, 7].
Isolation of genomic DNA from PBMC samples and amplification and sequencing of vpu
and nef alleles
To facilitate the isolation of viral sequences also from patients with low viral load as well as
the limited availability of plasma samples from these patients, proviral sequences were
amplified from Peripheral blood mononuclear cells (PBMCs). PBMCs were separated using
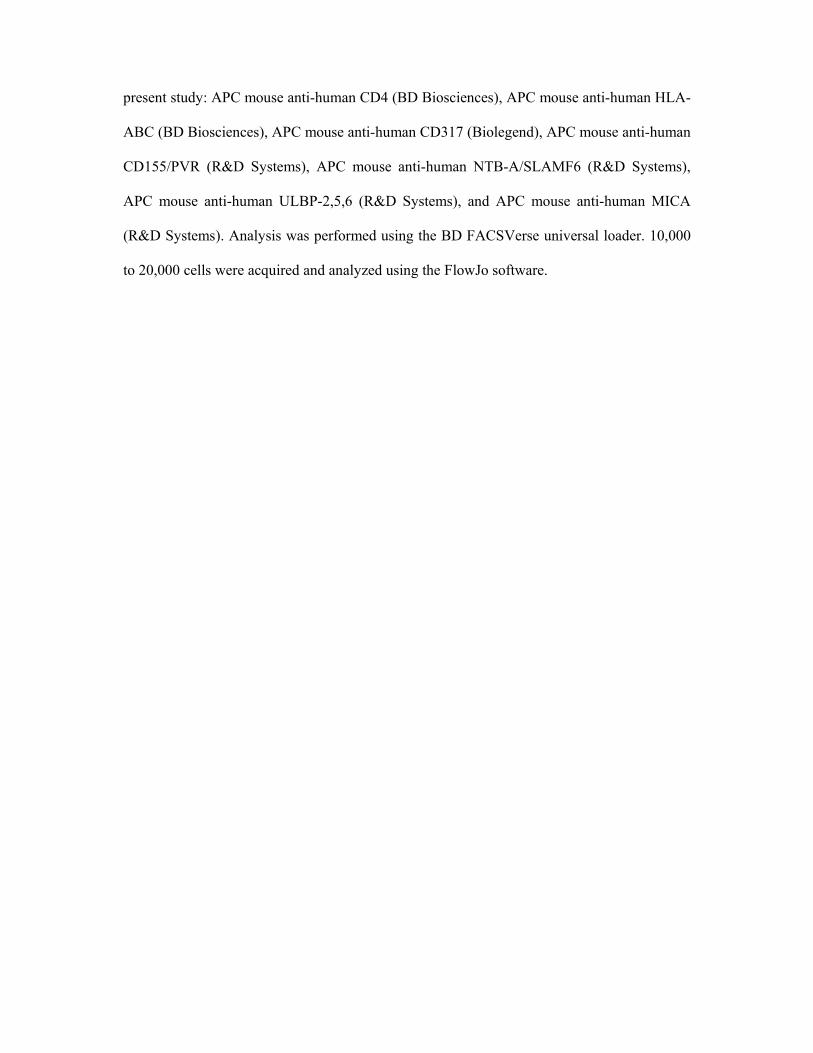
Ficoll density gradient centrifugation. Genomic DNA was extracted from 5 x 10⁶ PBMCs
using the QIAamp DNA Blood Mini Kit (Qiagen). PCR reactions were set up according to the
Q5 Hot Start High-Fidelity DNA Polymerase protocol (NEB). Primers used for the
amplification of vpu alleles were complementary to the first exon of tat and the beginning of
the env gene as described elsewhere [8] (vpu-forward 5846-5869 5’-CCT AGA CTA GAG
CCC TGG AAG CAT-3’; vpu-reverse 6473-6453 5’-TTC TTG TGG GTT GGG GTC TGT-
3’). Primers for the amplification of nef alleles were matched to regions towards the end of
env and to the highly conserved 3’ untranslated region (3’UTR) including the Poly-A signal
(nef-forward 8685-8715 5’-GCA GTA GCT GAG GGG ACA GAT AGG GTT ATA G-3’;
nef-reverse 9632-9607 5’-GCA CTC AAG GCA AGC TTT ATT GAG GC-3’). PCR
products were gel purified using the NucleoSpin Gel and PCR Clean-up (Macherey-Nagel)
and cloned into a TOPO TA cloning vector (Life Technologies). Plasmid DNA of up to ten
bacterial colonies per cloning reaction was isolated using the NucleoSpin Plasmid kit
(Macherey-Nagel) and were sequenced. Nef and vpu nucleotide sequences reported here were
submitted to the GenBank database and have been assigned accession numbers KT698123 -
KT698142 (nef) and KT698143 - KT698159 (vpu).
Phylogenetic analysis
For each patient, vpu and/or nef sequences were aligned using the ClustalW algorithm.
Maximum likelihood phylogenetic trees were constructed using RaxMlGUI (by General Time
Reversible (GTR) model) and edited with the software FigTree.
Cloning of selected sequences into peGFP N1 for functional analysis
A representative vpu or nef sequence was selected for every HIV-1 infected patient. Vpu
sequences were amplified from the Topo TA constructs with specific primers containing XhoI
and EcoRI restriction sites. Nef sequences were amplified with primers containing EcoRI and

BamHI restriction sites. Nef and vpu fragments were then subcloned into the peGFP-N1
vector.
Western blotting
For western blot analysis, HeLa TZM-bl cells were transfected with 3µg of expression
plasmid using Lipofectamine 2000 (Life Technologies) and harvested 24 h post-transfection.
Samples were boiled in sample buffer, separated by 12.5% SDS-PAGE and transferred onto a
nitrocellulose membrane using a semi-dry blotting apparatus). GFP and transferrin receptor
(TfR) were detected using the rat monoclonal α-GFP antibody (Chromotek) and the
monoclonal mouse anti-transferrin receptor (Zymed Laboratories), respectively. For detection
via the Odyssey infrared imaging system (LI-COR), membranes were incubated with IRDye
700 or 800-coupled secondary antibodies. For detection via enhanced chemiluminescence
(ECL), membranes were incubated with horseradish peroxidase-coupled secondary
antibodies.
Analysis of cell surface expression levels of CD4, CD317/tetherin, MHC-I, PVR, NTB-A,
MICA, and ULBP-2,5,6
An initial screen of cell surface levels of relevant receptor revealed robust surface expression
for most of them in HeLa TZM-bl cells. To assess cell surface levels of CD4, CD317, MHC-I,
PVR and MICA, HeLa TZM-bl cells were transfected with 3µg of Vpu or Nef expression
plasmid using Lipofectamine 2000 (Life Technologies). However, HeLa Tzm-bl cells did not
express significant levels of cell surface NTB-A and ULBP-2,5,6, and effects of Vpu and Nef
on these NK cell ligands were therefore assessed in A3.01 T cells, which were electroporated
with 18 µg of Vpu or Nef expression plasmid. MICB was not well expressed on any cell line
available and thus not analyzed. 48 h post-transfection, cells were washed and stained in PBS
with allophycocyanin (APC)-conjugated antibodies. Following antibodies were used in the
present study: APC mouse anti-human CD4 (BD Biosciences), APC mouse anti-human HLA-
ABC (BD Biosciences), APC mouse anti-human CD317 (Biolegend), APC mouse anti-human
CD155/PVR (R&D Systems), APC mouse anti-human NTB-A/SLAMF6 (R&D Systems),
APC mouse anti-human ULBP-2,5,6 (R&D Systems), and APC mouse anti-human MICA
(R&D Systems). Analysis was performed using the BD FACSVerse universal loader. 10,000
to 20,000 cells were acquired and analyzed using the FlowJo software.
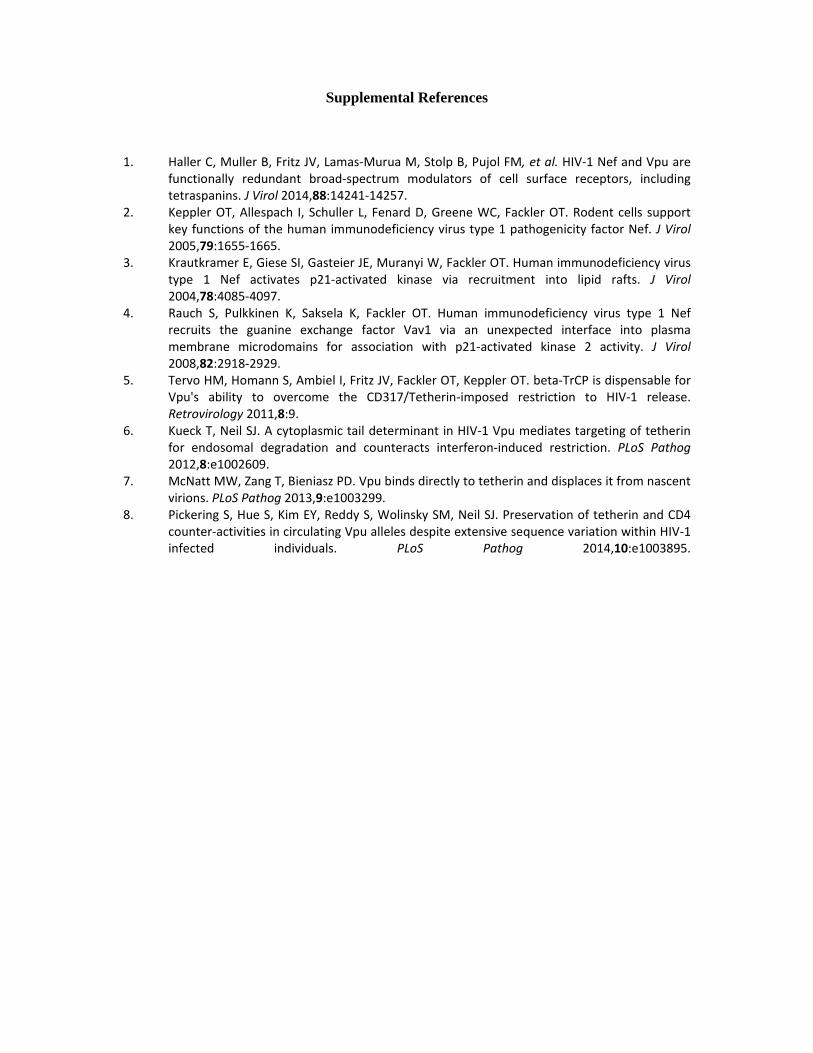
Supplemental References
1. Haller C, Muller B, Fritz JV, Lamas‐Murua M, Stolp B, Pujol FM, et al. HIV‐1 Nef and Vpu are functionally redundant broad‐spectrum modulators of cell surface receptors, including tetraspanins. J Virol 2014,88:14241‐14257.
2. Keppler OT, Allespach I, Schuller L, Fenard D, Greene WC, Fackler OT. Rodent cells support key functions of the human immunodeficiency virus type 1 pathogenicity factor Nef. J Virol 2005,79:1655‐1665.
3. Krautkramer E, Giese SI, Gasteier JE, Muranyi W, Fackler OT. Human immunodeficiency virus type 1 Nef activates p21‐activated kinase via recruitment into lipid rafts. J Virol 2004,78:4085‐4097.
4. Rauch S, Pulkkinen K, Saksela K, Fackler OT. Human immunodeficiency virus type 1 Nef recruits the guanine exchange factor Vav1 via an unexpected interface into plasma membrane microdomains for association with p21‐activated kinase 2 activity. J Virol 2008,82:2918‐2929.
5. Tervo HM, Homann S, Ambiel I, Fritz JV, Fackler OT, Keppler OT. beta‐TrCP is dispensable for Vpu's ability to overcome the CD317/Tetherin‐imposed restriction to HIV‐1 release. Retrovirology 2011,8:9.
6. Kueck T, Neil SJ. A cytoplasmic tail determinant in HIV‐1 Vpu mediates targeting of tetherin for endosomal degradation and counteracts interferon‐induced restriction. PLoS Pathog 2012,8:e1002609.
7. McNatt MW, Zang T, Bieniasz PD. Vpu binds directly to tetherin and displaces it from nascent virions. PLoS Pathog 2013,9:e1003299.
8. Pickering S, Hue S, Kim EY, Reddy S, Wolinsky SM, Neil SJ. Preservation of tetherin and CD4 counter‐activities in circulating Vpu alleles despite extensive sequence variation within HIV‐1 infected individuals. PLoS Pathog 2014,10:e1003895.
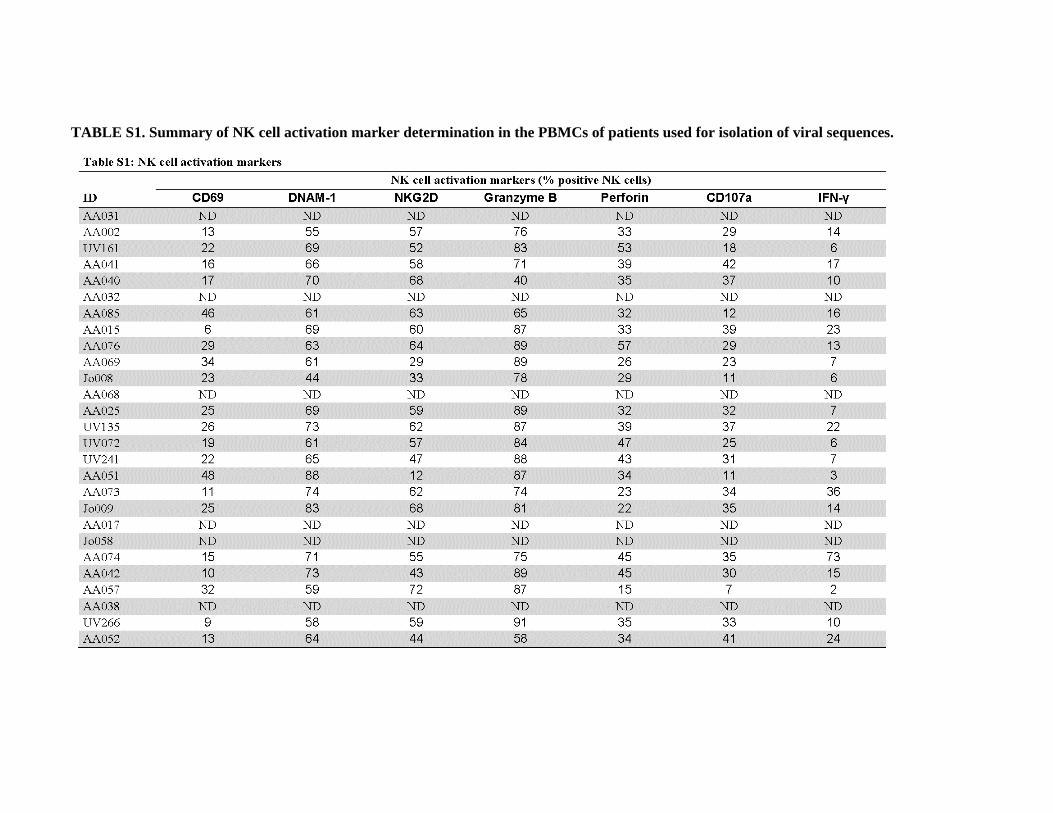
TABLE S1. Summary of NK cell activation marker determination in the PBMCs of patients used for isolation of viral sequences.
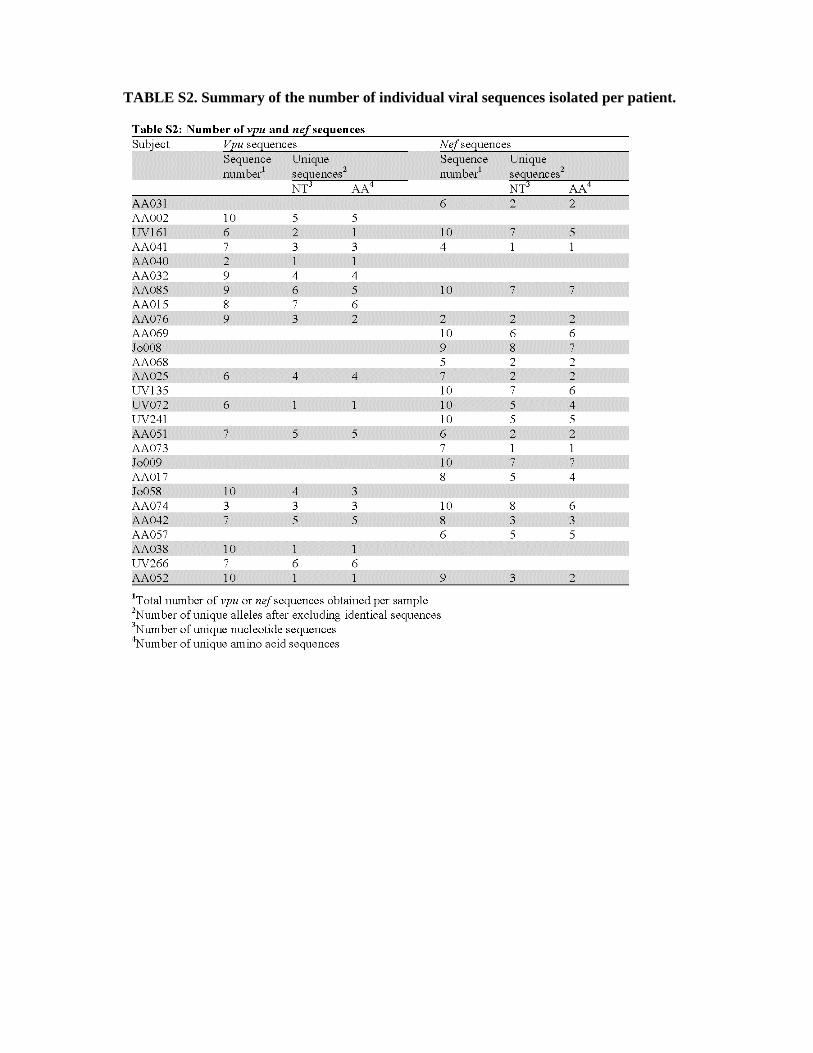
TABLE S2. Summary of the number of individual viral sequences isolated per patient.
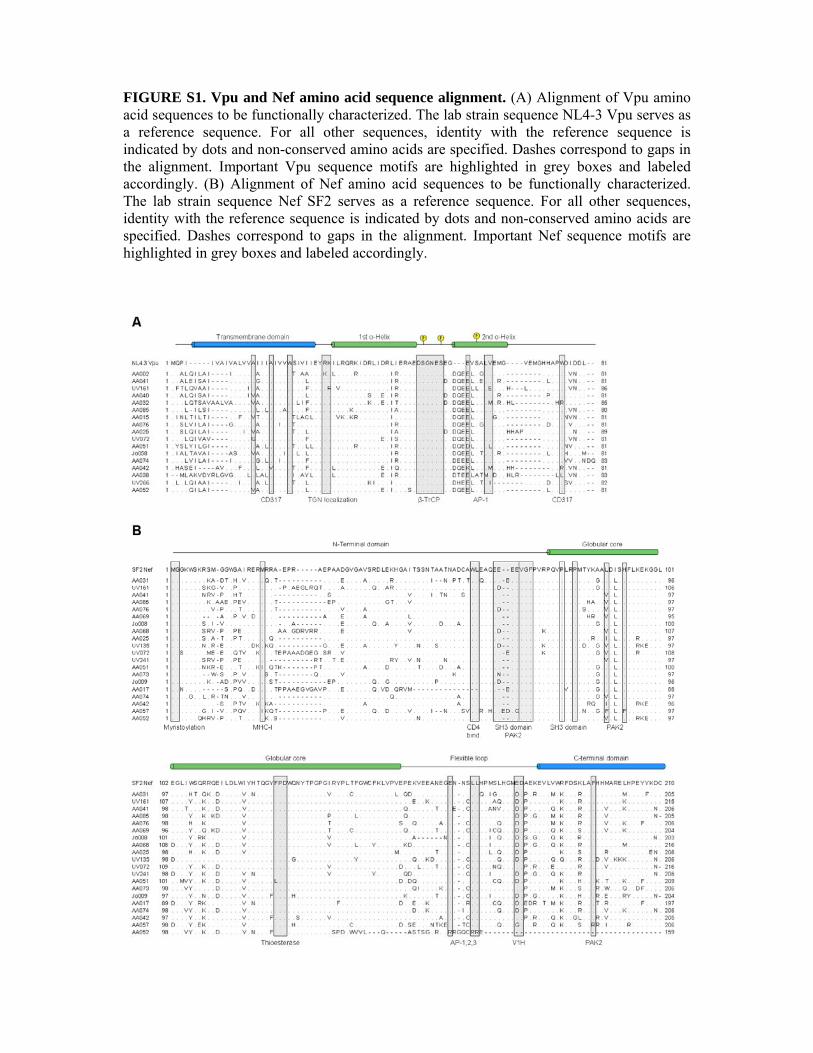
FIGURE S1. Vpu and Nef amino acid sequence alignment. (A) Alignment of Vpu amino acid sequences to be functionally characterized. The lab strain sequence NL4-3 Vpu serves as a reference sequence. For all other sequences, identity with the reference sequence is indicated by dots and non-conserved amino acids are specified. Dashes correspond to gaps in the alignment. Important Vpu sequence motifs are highlighted in grey boxes and labeled accordingly. (B) Alignment of Nef amino acid sequences to be functionally characterized. The lab strain sequence Nef SF2 serves as a reference sequence. For all other sequences, identity with the reference sequence is indicated by dots and non-conserved amino acids are specified. Dashes correspond to gaps in the alignment. Important Nef sequence motifs are highlighted in grey boxes and labeled accordingly.
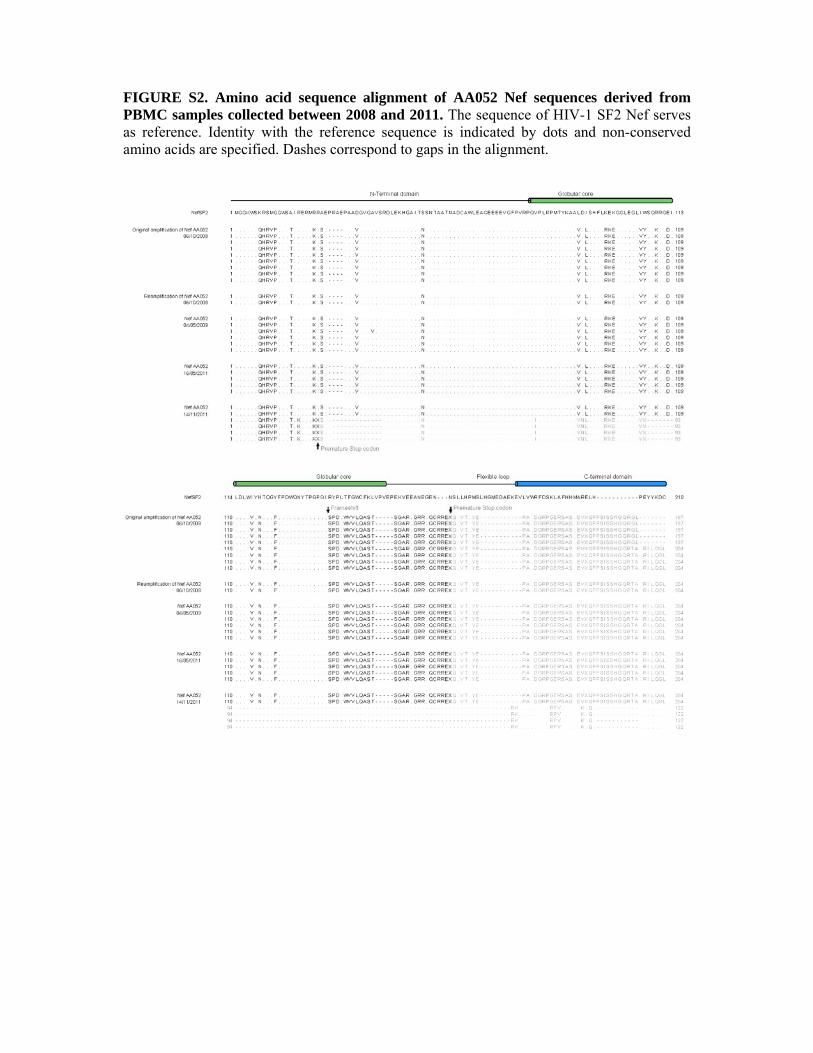
FIGURE S2. Amino acid sequence alignment of AA052 Nef sequences derived from PBMC samples collected between 2008 and 2011. The sequence of HIV-1 SF2 Nef serves as reference. Identity with the reference sequence is indicated by dots and non-conserved amino acids are specified. Dashes correspond to gaps in the alignment.

FIGURE S3. MICA downregulation by patient derived Vpu or Nef constructs. HeLa TZM-bl cells were transfected with GFP, Vpu.GFP or Nef.GFP fusion proteins. 48 hours post-transfection cell surface levels of MICA were analyzed by flow cytometry. (A) Representative flow cytometry dot plots of gated living cells transfected with GFP and NL4-3 Vpu.GFP expression plasmids are shown. The MICA.APC fluorescent intensity is displayed on the y-axis and the GFP fluorescent intensity on the x-axis. Mean fluorescent intensities are indicated. (B) The MICA surface expression relative to GFP-transfected cells is shown for all patient derived Vpu alleles. The relative surface expression for each allele was calculated by dividing the MFI of Vpu.GFP expressing cells by the MFI of Vpu.GFP negative cells. For control cells transfected with GFP this value was arbitrarily set to 100% and all other values were normalized accordingly. Stars indicate statistically significant differences to the GFP control. For clarity, only the lowest p-value that applies to all results is shown (one-way ANOVA with Dunnett’s multiple comparisons test; * p ≤ 0.05; ** p ≤ 0.01; *** p ≤ 0.001). Bars represent means of three independent experiments ± SD. (C,D) As in (A,B), but for Nef fusion proteins.
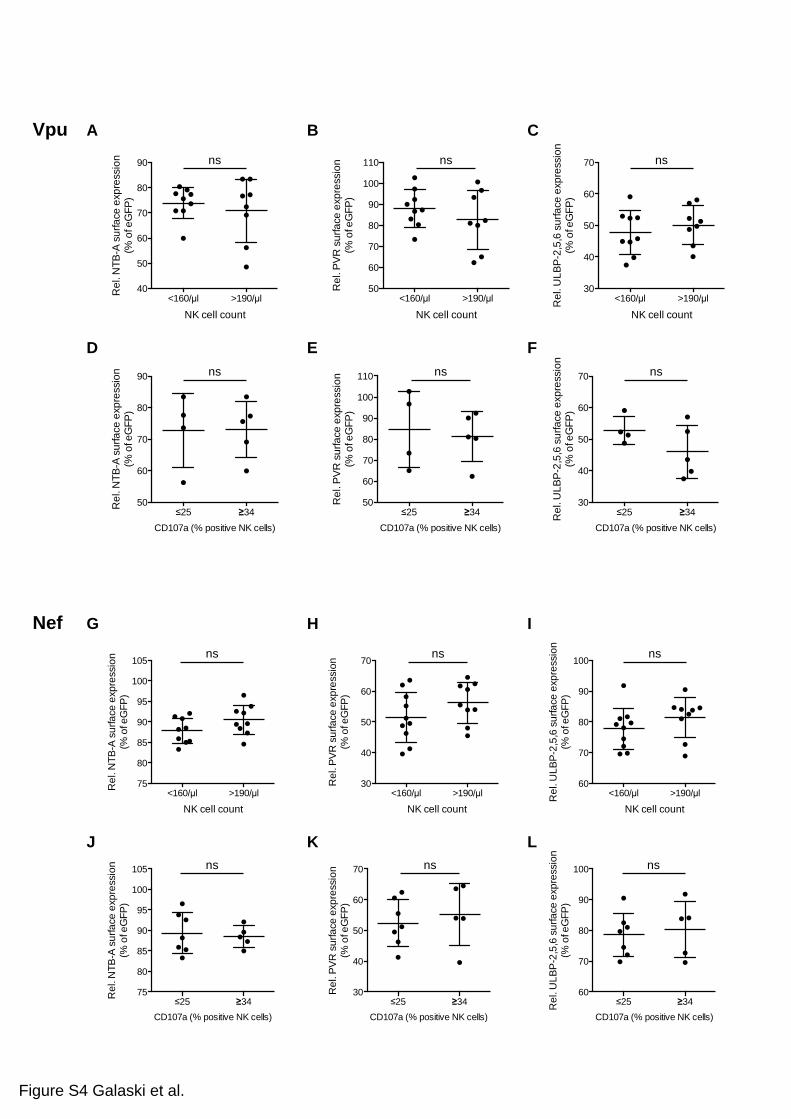
FIGURE S4. Relationship between Vpu and Nef-mediated activities and selected NK cell parameters. The patients from which vpu and nef sequences were isolated were arbitrarily stratified into cohorts with high or low NK cell count (A-C, G-I) or high or low NK cell activation (D-F, J-L). Statistical activity of NK cell ligand downregulation activity between these Vpu and Nef proteins in these two groups was assessed by Mann Whitney U-test. (A) Association between NTB-A downregulation by Vpu alleles and the patient NK cell count (p=0.73). (B) Association between PVR downregulation by Vpu alleles and the patient NK cell count (p=0.41). (C) Association between ULBP downregulation by Vpu alleles and the patient NK cell count (p=0.73). (D) Association between NTB-A downregulation by Vpu alleles and the percentage of CD107a positive NK cells (p=0.98). (E) Association between PVR downregulation by Vpu alleles and the percentage of CD107a positive NK cells (p=0.71). (F) Association between ULBP downregulation by Vpu alleles and the percentage of CD107a positive NK cells (p=0.41) (G) Association between NTB-A downregulation by Nef alleles and the patient NK cell count (p=0.13). (H) Association between PVR downregulation by Nef alleles and the patient NK cell count (p=0.27). (I) Association between ULBP downregulation by Nef alleles and the patient NK cell count (p=0.13). (J) Association between NTB-A downregulation by Nef alleles and the percentage of CD107a positive NK cells (p=0.82). (K) Association between PVR downregulation by Nef alleles and the percentage of CD107a positive NK cells (p=0.53). (L) Association between ULBP downregulation by Nef alleles and the percentage of CD107a positive NK cells (p=0.63).
Nef
Vpu BA C
D
KJ
IHG
FE
L
Figure S4 Galaski et al.
<160/ l >190/ l40
50
60
70
80
90
NK cell count
Rel
. NTB
-A s
urfa
ce e
xpre
ssio
n (%
of e
GFP
)
25 3450
60
70
80
90
CD107a (% positive NK cells)
Rel
. NTB
-A s
urfa
ce e
xpre
ssio
n (%
of e
GFP
)
<160/ l >190/ l50
60
70
80
90
100
110
NK cell count
Rel
. PVR
sur
face
exp
ress
ion
(% o
f eG
FP)
25 3450
60
70
80
90
100
110
CD107a (% positive NK cells)
Rel
. PVR
sur
face
exp
ress
ion
(% o
f eG
FP)
<160/ l >190/ l30
40
50
60
70
NK cell count
Rel
. ULB
P-2,
5,6
surfa
ce e
xpre
ssio
n (%
of e
GFP
)
25 3430
40
50
60
70
CD107a (% positive NK cells)
Rel
. ULB
P-2,
5,6
surfa
ce e
xpre
ssio
n (%
of e
GFP
)
<160/ l >190/ l75
80
85
90
95
100
105
NK cell count
Rel
. NTB
-A s
urfa
ce e
xpre
ssio
n (%
of e
GFP
)
25 3475
80
85
90
95
100
105
CD107a (% positive NK cells)
Rel
. NTB
-A s
urfa
ce e
xpre
ssio
n (%
of e
GFP
)
<160/ l >190/ l30
40
50
60
70
NK cell count
Rel
. PVR
sur
face
exp
ress
ion
(% o
f eG
FP)
25 3430
40
50
60
70
CD107a (% positive NK cells)
Rel
. PVR
sur
face
exp
ress
ion
(% o
f eG
FP)
<160/ l >190/ l60
70
80
90
100
NK cell count
Rel
. ULB
P-2,
5,6
surfa
ce e
xpre
ssio
n (%
of e
GFP
)
25 3460
70
80
90
100
CD107a (% positive NK cells)
Rel
. ULB
P-2,
5,6
surfa
ce e
xpre
ssio
n (%
of e
GFP
)
ns ns ns
ns ns ns
ns ns ns
ns ns ns
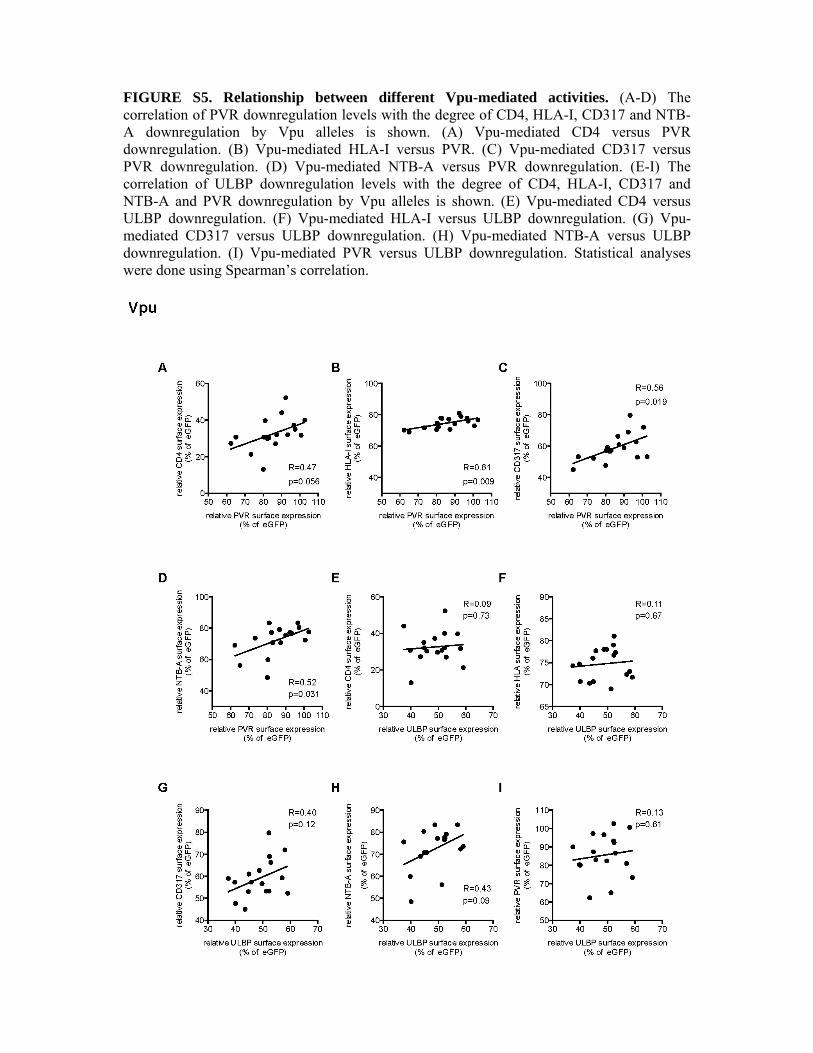
FIGURE S5. Relationship between different Vpu-mediated activities. (A-D) The correlation of PVR downregulation levels with the degree of CD4, HLA-I, CD317 and NTB-A downregulation by Vpu alleles is shown. (A) Vpu-mediated CD4 versus PVR downregulation. (B) Vpu-mediated HLA-I versus PVR. (C) Vpu-mediated CD317 versus PVR downregulation. (D) Vpu-mediated NTB-A versus PVR downregulation. (E-I) The correlation of ULBP downregulation levels with the degree of CD4, HLA-I, CD317 and NTB-A and PVR downregulation by Vpu alleles is shown. (E) Vpu-mediated CD4 versus ULBP downregulation. (F) Vpu-mediated HLA-I versus ULBP downregulation. (G) Vpu-mediated CD317 versus ULBP downregulation. (H) Vpu-mediated NTB-A versus ULBP downregulation. (I) Vpu-mediated PVR versus ULBP downregulation. Statistical analyses were done using Spearman’s correlation.

FIGURE S6. Relationship between different Nef-mediated activities. (A-D) The correlation of PVR downregulation levels with the degree of CD4, HLA-I, CD317 and NTB-A downregulation by Nef alleles with intact ORF is shown. (A) Nef-mediated CD4 versus PVR downregulation (B) Nef-mediated HLA-I versus PVR downregulation (C) Nef-mediated CD317 versus PVR downregulation. (D) Nef-mediated NTB-A versus PVR downregulation. (E-I) The correlation of ULBP downregulation levels with the degree of CD4, HLA-I, CD317 and NTB-A and PVR downregulation by Nef alleles is shown. (E) Nef-mediated CD4 versus ULBP downregulation. (F) Nef-mediated HLA-I versus ULBP downregulation. (G) Nef-mediated CD317 versus ULBP downregulation. (H) Nef-mediated NTB-A versus ULBP downregulation. (I) Nef-mediated PVR versus ULBP downregulation. Statistical analyses were done using Spearman’s correlation.