Supplemental Information - University of Arkansas
22
1 Supplemental Information Synthesis of Hollow Gold-Silver Alloyed Nanoparticles: A “Galvanic Replacement” Experiment for Chemistry and Engineering Students Samir V. Jenkins, Taylor D. Gohman, Emily K. Miller, Jingyi Chen * Department of Chemistry and Biochemistry, University of Arkansas, Fayetteville, AR 72701 Corresponding author: [email protected] (+1 479-575-6203) I. Materials and Methods II. Instructor Notes III. Laboratory Manual APPENDIX I. Photothermal Conversion APPENDIX II. Surface-Enhanced Raman Spectroscopy APPENDIX III. Sample Calculation of AgNC concentration APPENDIX IV. Sample Quiz
Transcript of Supplemental Information - University of Arkansas
1
Supplemental Information
Synthesis of Hollow Gold-Silver Alloyed Nanoparticles: A “Galvanic Replacement”
Experiment for Chemistry and Engineering Students
Samir V. Jenkins, Taylor D. Gohman, Emily K. Miller, Jingyi Chen
*
Department of Chemistry and Biochemistry, University of Arkansas, Fayetteville, AR 72701
Corresponding author: [email protected] (+1 479-575-6203)
I. Materials and Methods
II. Instructor Notes
III. Laboratory Manual
APPENDIX I. Photothermal Conversion
APPENDIX II. Surface-Enhanced Raman Spectroscopy
APPENDIX III. Sample Calculation of AgNC concentration
APPENDIX IV. Sample Quiz

2
I. Materials and Methods
Chemicals
Silver trifluoroacetate (AgTFA), sodium hydrogen sulfide (NaSH), hydrochloric acid (HCl,
99.999%), and tetrachloroauric acid trihydrate (HAuCl4∙3H2O), were purchased from Alfa Aesar.
Copper sulfate pentahydrate (CuSO4∙5H2O), poly(vinylpyrrolidone) (PVP, M.W.=55,000), and
4-mercaptobenzoic acid (4-MBA, 99%) were purchased from Sigma Aldrich. Ethylene glycol
(EG) was purchased from J.T. Baker. Acetone was purchased from EMD. Experiments were
performed using 18 MΩ H2O to achieve best results. Deionized water can also be used with
reasonable success. All chemicals were used as received. The Ag and Au precursor solutions
should be freshly prepared prior to the experiments and protected from light using aluminum
foil.
Experimental Methods
Synthesis of Ag nanocubes (by instructors prior to class). Ag nanocubes (AgNCs) were
synthesized by the polyol method. Briefly, an oil bath was heated to 150 °C. Note that the oil
bath needs sufficient stirring to maintain an even temperature, which dramatically improves
particle uniformity. 10 mL EG was added to an 8 dr vial with a stir bar and placed in the oil bath
while reagent solutions were prepared. The following solutions were prepared separately: 75 mg
PVP was dissolved in 3 mL EG, 1 mg NaSH was dissolved in 5.95 mL EG, and 1.5 L HCl was
added to 6 mL EG. Once the oil bath had reached 150 °C, 60 mg AgTFA was dissolved in 0.84
mL EG. Sequentially, 0.12 mL NaSH, 1 mL HCl, and 2.5 mL PVP stock solutions were added to
the reaction vial, which was then allowed to equilibrate for 2 min. Next 0.8 mL of the AgTFA
solution was added and the vial closed but not purged. Periodically a small sample (~10 L) was
extracted from the reaction vial with a capillary tube and the extinction spectrum acquired. Once

3
the LSPR peak reached ~440 nm (~ 35 min after addition of Ag), the reaction was quenched in
an ice bath. Upon cooling, the reaction solution was divided into two 50 mL centrifuge tubes that
were then filled with acetone and mixed. The tubes were centrifuged at 7,000 RPM for 10 min.
The supernatant was removed and the pellets were redispersed by sonication in 6 mL H2O (total),
transferred to 1.5 mL centrifuge tubes, and centrifuged for 10 min at 15000 RPM. The
supernatant was again removed and the pellets redispersed in H2O and centrifuged a second time.
The supernatant was once again removed and the sample dispersed in a total volume of 3 mL for
use as a stock solution in class. A 1000× dilution of this stock solution had an extinction of ~0.9
a.u. at the LSPR maximum.
Synthesis of hAuAgNPs. To synthesize hAuAgNPs, 10 mL of 18 M H2O was heated to boiling
in a 50-mL round-bottom flask. To the boiling liquid, 0.25 mL of 50 mM PVP (in H2O) and 0.5
mL of the AgNC suspension (redispersed by sonication prior to use) were added. Next 1 mM
HAuCl4 was added dropwise at approximately 0.5 mL/min. The amount of HAuCl4 was varied
among student groups, from 3 to 6 mL, allowing students to acquire different, but comparable
results. Once the specific amount of HAuCl4 was added, the reaction was allowed to proceed for
another 5 min. The reaction flask was then removed from heat and allowed to cool to room
temperature.
Sample Characterization. Samples were characterized using transmission electron microscopy
(TEM) and UV-vis spectroscopy. TEM samples were prepared by casting a 3 L of the sample
suspension onto a carbon-coated copper grid and drying in air, and images were acquired by the
teaching assistant. The AgNC sample was prepared directly from the stock solution while the
hAuAgNP sample was concentrated by centrifuging 1 mL of reaction solution and redispersing
in 100 L H2O for TEM preparation. TEM images were acquired by the teaching assistant

4
outside of class. Students were provided with several images of their respective samples and
access to images by other groups. UV-vis spectra can be acquired using 4-way acrylic cuvettes.
The hAuAgNP sample was measured directly from the reaction solution following a 10×
dilution. The AgNC sample was diluted 1000 fold in 2 mL H2O before measurement, and had an
extinction of ~0.9 a.u. Qualitative analysis of the absorption and scattering is performed using
the UV-vis samples of nanoparticles a cuvette filled with H2O and a cuvette containing 100 mM
CuSO4. A red laser pointer was shined through the samples in various directions and the shape of
the beam is described and/or photographed.
Photothermal Measurement. To demonstrate the photothermal effect, a photodiode laser centered
at 808 nm (Power Technologies) and infrared temperature probe (Omega) were used. The UV-
vis samples from previous experiments, a solution of 100 mM CuSO4, and a blank of 18 MΩ
H2O were used. The laser was allowed to warm up for 5 min prior to use, and then was
positioned to shine downward into the open cuvette. Samples were irradiated for 5 min at 0.9
W/cm2, then removed from irradiation for 5 min, then irradiated again for 5 min. The
temperature was recorded every 15s.
Raman Spectroscopy. SERS was demonstrated using a Raman spectrometer (Ocean Optics),
consisting of a laser source (785 nm diode laser), a Raman detector (QE65PRO-RAMAN), a
Raman coupled fiber probe, and a Raman sample holder. The SERS samples were prepared
according to the following procedure: each sample containing 1 nM hAuAgNPs was incubated
with 0.010 M MBA in 2 mL of 0.1 M NaOH aqueous solution for 24 h; and the hAuAgNPs were
then collected by centrifugation and redispersed in 2 mL of 0.1 M NaOH aqueous solution. Each
SERS sample contained a total surface area of ~0.9 m2/L. The reference sample was 0.010 M 4-
MBA in 0.1 M NaOH aqueous solution. For each sample, the Raman spectra were collected

5
using laser power of 100 mW at 785 nm and integration time of 30s in one acquisition. A 0.1 M
NaOH aqueous solution was used as a blank for baseline correction.

6
II. Instructor Notes
General Notes
The authors strongly recommend preparation of stock solutions prior to the class. Stock
solutions reduce waste by the student groups and increase the comparability of results across
groups. Additionally, the authors recommend a practice run of the experiments be performed
prior to class. The resultant samples are useful as a backup in case of experimental failure. The
practice run also helps ensure that the stock solutions will work in the classroom.
To achieve the best synthetic results, glassware needs to be extremely clean and free of
scratches. Trace impurities, particularly metals, can significantly affect particle morphology.
Scratches in glassware provide additional nucleation sites that affect seed formation. If glassware
is promptly cleaned with acid following experiments, intense scrubbing is typically not
necessary, which reduces the risk of scratching the glass. Stir bars should be cleaned in acid and
rinsed with glassware.
Glassware from the AgNC synthesis should be cleaned with concentrated HNO3 to dissolve
the Ag. HNO3 is highly corrosive and should be used with extreme caution in a fume hood. It is
advisable to scrub the glassware with soap and water as well, to remove any adsorbates from the
glass. Reaction flasks for the galvanic replacement reaction should be cleaned using aqua regia
(3:1 HCl:HNO3) to dissolve Au. Aqua regia is best prepared fresh, and cannot be stored in a
closed container, as it generates gas, which can cause the container to violently explode. If a
white film persists in the Au reaction flask, use HNO3 to dissolve the AgCl more effectively.
After acid washing, glassware and stir bars need to be rinsed at least 5 times with tap water, 5
times with DI water, and 5 times with 18 MΩ H2O to ensure complete removal of the acid. After

7
use, aqua regia or other acid waste should be diluted and carefully neutralized with NaHCO3 in a
container.
Synthesis of AgNCs. The reaction can be easily scaled up or down to accommodate different
classroom sizes. The authors recommend use of a round-bottom flask if the reaction is to be
scaled up any further than described. The oil bath is strongly recommended as a heat source as it
will provide more uniform heating of the sample, providing for more uniform particles. Stirring
in the oil bath needs to be fast enough that the bath is homogeneous. The bath will be extremely
hot, do not touch it. When the reaction is completed, remove the reaction vessel and allow it to
drip off excess oil, and then quickly wipe it down before quenching in the ice bath to reduce
mess. The PVP and HCl solutions are stable for several days, but it is recommended that the
NaSH and AgTFA solutions be prepared fresh prior to the reaction. Molecular oxygen is critical
for the etching of the twinned seed particles, so the reaction is not degassed, and is left open to
air. High humidity can affect the quality of the cubes; on hot and humid days, allowing the EG to
sit in the hot oil bath for an hour before addition of reagents can mitigate this problem. Fast
injection of the Ag precursor is crucial to produce highly uniform particles from the synthesis.
The synthetic protocol described yields AgNCs with a particle concentration of ~8 nM, based
on the extinction coefficient of 1.2×10¹¹
M-1
cm-1
, and the concentration of the stock solution can
be ascertained. There will likely be a small number of rods and wires in any AgNC sample (can
be <0.1 %); if these particles represent less than 5% of the population, they will not significantly
affect the following steps. The acetone is used to precipitate the AgNCs and remove as much EG
as possible, but the AgNCs need to be washed twice with H2O to remove residual acetone, which
will affect the galvanic replacement reaction. Carefully following the procedure described above,
one can reproducibly synthesize Ag nanocubes with 90% success rate. The unsuccessful

8
synthesis usually results in Ag nanocubes with mixed sizes and/or the presence of round particles
and rods with increased percentages. This will broaden the LSPR spectra of AgNCs and the
resulting hAuAgNPs from the galvanic reactions using these AgNCs
Synthesis of hAuAgNPs. The concentration and size of the AgNCs affect the amount of HAuCl4
that needs to be titrated into the reaction to obtain hAuAgNPs with desired optical properties. For
example, larger particles and higher concentrations require more HAuCl4 to achieve the same
LSPR position. It is advisable to test the reaction before class to determine the appropriate range
of HAuCl4 titration. In our studies, 6 mL of 1 mM HAuCl4 could shift the LSPR beyond 900 nm.
During titration, the color of the reaction transitions from yellow to purple to deep, royal blue
after addition of ~3 mL of 1 mM HAuCl4. At this point, the LSPR is at ~650 nm indicative of the
alloying process of Ag and Au. If this transition occurs at significantly lower Au volumes, it is
recommended to proportionally adjust the amount of HAuCl4. If this transition occurs after
addition of greater amounts of HAuCl4, the lab can proceed normally, but final spectra can be
expected to be blue-shifted. It is recommended that the AgNCs be sonicated well prior to use so
students start with identical AgNC samples for the galvanic replacement reaction, which
facilitates comparison of results following titration of different HAuCl4 volumes.
The temperature of galvanic reaction is recommended to be close to the boiling point of
water to increase the solubility of the byproduct AgCl. After addition of AgNCs, the reaction
requires one minute to equilibrate, however, if this period is too long, the AgNCs may begin to
grow and agglomerate. In contrast, if HAuCl4 is added at a low temperature, the reaction may not
fully proceed to an alloyed shell and the optical properties may be compromised. Vigorous
stirring is recommended, as it allows the Au precursor to more homogeneously react with the
AgNCs. Results were significantly improved using a high rate of stirring with a creation of
9
visible vortex. The rate of titration is recommended to be 0.5 mL/min; however, the range of 0.1
to 1 mL/min is acceptable. Too rapid addition of HAuCl4 (especially at low stir rates) can result
in cage breaking and inhomogeneity amongst particles. On the other hand, too slow addition can
result in reconstruction of the nanoparticle morphology due to the high temperature.
Acquisition of UV-vis Spectra. Four-way cuvettes are preferable to 2-way cuvettes as they allow
for more options in the laser pointer experiment. It is recommended that the samples be diluted
to yield extinction maxima of 0.8-1 as described in the experimental methods.
Comparison of Absorption and Scattering. Four-way cuvettes allow the beam to be passed
horizontally through multiple samples. The light absorption will likely be greatest for the LSPR
of hAuAgNPs that best overlap with the 660 nm wavelength of the red laser beam. If
photographing the beam in the dark, it may be necessary to partially block the beam, as there will
be extremely high scattering intensity which will cause glare and compromise image quality.
Samples that are too dilute will not show significant tapering.
Photothermal Experiment. Care should be exercised that the laser does not directly interact with
the temperature probe as it can falsely elevate the temperature. For best results, the laser spot size
is required to be less than the width of the cuvette. The photothermal effect is an absorption
based process, therefore, the closer the optical density of the CuSO4 solution and the hAuAgNPs
at the laser wavelength, the more closely these temperature profiles will match. If sample
quantities are limited, the UV-vis samples can be used for this experiment.
SERS Experiment. The concentration of the nanoparticles can be roughly estimated from the
concentration of the AgNCs used for the galvanic replacement reaction and dilution factors
during the titration. The compound, 4-MBA, is not soluble in pure water, but can be dissolved in
0.1 M NaOH aqueous solution or pure ethanol. The intensity of s(COO-) increases with the pH

10
increase. Comparing the ordinary spectrum of the pure 4-MBA with the SERS spectrum, the
slight shift of some of the peaks can be attributed to the change of the orientation and selection
rules of the molecules as they are adsorbed on the surface. To avoid particle aggregation, the
samples were prepared using 0.1 M NaOH solutions instead of ethanol and were sonicated before the
SERS spectra were taken. Aggregation can significantly increase the value of the enhancement factor.

11
III. Lab Manual
Synthesis of Hollow Gold-Silver Nanoparticles and Investigation of Their Optical
Properties
Objectives
1. Introduce students to the control of nanoparticle composition/morphology to tune their
physical and chemical properties.
2. Introduce the solution-phase synthesis of nanoparticles with the emphasis on galvanic
replacement reaction.
3. Demonstrate the influence of composition and morphology on nanoparticle optical
properties.
4. Demonstrate the unique phenomena that occur due to these optical properties.
5. The end goal is to give students an introductory knowledge of chemical synthesis of
nanoparticles and how the properties change with composition and morphology of the
nanoparticles.
Safety Rules
1. Safety information must be reviewed prior to experiments. This includes lab safety training,
safety data sheets (e.g. MSDS) for chemicals used, and lab procedures.
2. Personal protective equipment is required at all times. These include lab coats, safety
glasses, gloves, close-toed shoes, and long pants.
3. Used chemicals and materials should be captured in appropriate waste receptacles and not
sent to the sewer.
4. Caution should be taken around heating mantles and reaction flasks to minimize risk of
accidental burns.
5. Lasers should never be pointed at individuals and reflective objects should not be near the
laser path.
Introduction
Nanomaterials composed of coinage metals (Cu, Ag, and Au) have many attractive biological
applications due to their unique optical properties.1-3
When their size is comparable or smaller to
the wavelength of light, their free electrons in the conduction band collectively oscillate with the
electric field generated by incident light and give rise to an extinction maximum at the resonant
wavelength. This phenomenon is called localized surface plasmon resonance (LSPR). Extinction
is the sum of absorption and scattering. In 1908, Gustav Mie developed a theory to describe the
light extinction and scattering of spherical metal nanoparticles. The Mie theory is the exact
solution to Maxwell’s electromagnetic field equations which describe a plane wave interacts with
a metal sphere of radius R having the same dielectric functions as its bulk counterpart. If the
boundary conditions are specified, the extinction cross-section (σext) of a sphere can be obtained,
and thus the extinction efficiency factor (Qext) which is defined as ratio of the extinction cross
section to the physical cross-sectional area (πR2). For example, when R≪λ, one can neglect both
phase retardation and effects from higher multipoles and consider only the dipole oscillation
contribution. The extinction cross-section is then derived as Eq. 1.
(1) 22
2/332
)(]2)([
)(24)(
imr
imext
R

12
where εm is the dielectric constant of the embedding medium and the εr and εi are the real and
imaginary components of the metal dielectric function, respectively. A resonance peak occurs
when the condition of is satisfied. In the case of Cu, Ag, or Au, this condition is
met in the visible region of the electromagnetic spectrum. For a given material, the position,
height, and width of resonance peak depend on the size and shape of the nanoparticle.
In addition to size and shape, the dielectric constant (εm) of the embedding medium (or
refractive index, n; ) also influences the wavelength maximum of the resonance ( ).
The shift of this wavelength is dependent on the change in the local environment such as the
solvent and the surface coating. For example, the relationship between the shift and the surface
adsorbate is shown in Eq. 2.2
(2)
where m is the bulk refractive-index of the nanoparticle; Δn is the change in the refractive index
induced by the adsorbate; d is the effective thickness of adsorbate layer; and ld is the
characteristic electromagnetic field decay length. The sensitivity of the LSPR to the local
environment provides a useful tool for chemical and biological sensing and indirect validation of
the success of the surface modification.
Gold nanoparticles are well-studied materials due to their chemical and biological inertness.
The LSPR of spherical nanoparticles is in the visible region and varies slightly with the size of
the nanoparticles. For biomedical applications, the LSPR of the nanoparticles needs to be shifted
to the near-infrared (NIR) region (650-900 nm), which is the “transparent” window for the light,
enabling deeper tissue penetration. There are several ways to shift the LSPR of the nanoparticles
to NIR: 1) aggregation of individual particles to nanoparticle clusters; 2) coating of SiO2
particles with metal shells; 3) elongation of the spherical particles into rod-shaped particles; and
4) hollowing out the interior of the metal nanoparticles. The color change in the first scenario is
often used for biological sensing.4 The other three types of nanostructures can be used as contrast
agents for optical imaging, therapeutic agents for photothermal therapy, and controlled-release
drug delivery.5 In this module, we will synthesize hollow Au-Ag nanoparticles (hAuAgNPs) and
characterize their optical properties.
The hAuAgNPs are synthesized using the galvanic replacement reaction between the Ag
nanocubes (AgNCs) and chloroauric acid (HAuCl4).6 Cubic AgNPs are bounded by {100} facets
which are considered to be more reactive than the close-packed {111} facets in absence of other
effects such as surface capping ligands. Initially, AgNCs are prepared via polyol method (Fig. 1),
in which ethylene glycol (EG) serves as a reducing agent and a solvent while poly(vinyl
pyrrolidone) (PVP) is the capping agent.7
Figure 1. Schematic illustration of the polyol synthesis of AgNCs.
mr 2)(
2nm m
)]2
exp(1[max
dl
dnm

13
After the Ag reduces, two major processes will occur in the reaction: nucleation and growth.8,9
The Ag+ ions were reduced by glycolaldehyde, an oxidation product of EG, to form Ag
0 atoms in
solution.10
Once the atomic concentration of Ag has reached a critical, supersaturated threshold,
the atoms independently self-nucleate to form seeds including single-crystalline and twinned
seeds. Addition of NaHS can accelerate the nucleation process while the presence of Cl- ion and
O2 can etch and dissolve the twinned seeds.11
Nucleation creates small clusters of atoms and
lowers the atomic concentration below the critical nucleation threshold. The Ag atoms still
persist at a concentration sufficient to grow onto the seeds during the growth phase. At the
growth stage, the capping agent PVP strongly interacts with {100} facet of the single-crystalline
seeds, and thus the addition of the Ag atoms on the {111} facets lead to the formation of AgNCs.
In the second step, the AgNCs serve as sacrificial templates for the generation of hAuAgNPs
via the galvanic replacement reaction (Eq. 3).12,13
(3)
The driving force of the reaction is the reduction potential
difference between the redox pairs. The reduction
potential for the AuCl4-/Au pair (0.99 V vs SHE) is higher
than the Ag+/Ag pair (0.80 V vs SHE), resulting in the
spontaneous reaction of Eq. 3 (Gibbs energy change:
. The reaction is carried out by titrating
different volumes of HAuCl4 solution to the Ag
nanoparticle suspension. The morphological change of the
nanoparticles is illustrated in Figure 2. The replacement
reaction is initiated stochastically from the surface of the
nanoparticles through a pitting process (A). As the
reaction proceeds, nanoboxes are formed through a
combination of replacement and alloying between Ag and
Au (B-C). By the end of the reaction, Au-Ag nanocages
with hollow interiors and porous walls have evolved as a
result of dealloying of Ag from the Au-Ag alloyed walls
(D-F). The formation of the hollow structures is attributed to difference in the diffusion rates
between the Au and Ag, known as the Kirkendall effect.14,15
The 3 to 1 stoichiometry of Ag to
Au in the reaction leads to fewer atoms in the final nanoparticles, resulting in porous walls.
During this replacement process, the extinction spectrum changes with the morphological
evolution. The extinction efficiency factor of each nanostructure can be quantified based on the
extinction spectra using the Beer’s Law (Eq. 4) using a UV-vis spectrometer:
A = cl (4)
where A is the measured absorbance at wavelength maximum of the LSPR; is the molar
extinction coefficient at this wavelength (NAext with NA is the Avogadro constant); c is the molar
concentration of the sample; and l is the path length of the beam travelling through the sample.
3Ag (s) + AuCl4- (aq) Au (s) + 3Ag+ (aq) + 4Cl- (aq)
heat
)0 nFEG
Figure 2. Schematic illustration
of morphological evolution of
galvanic replacement reaction.
(Reproduced from ref. 12).

14
At a fixed path length usually determined by the cuvette that is used, the absorbance is
proportional to the molar concentration of the nanoparticles. By plotting the absorbance as a
function of nanoparticle molar concentration, the slope gives the molar extinction coefficient
(slope = l) and the extinction cross-section of individual nanoparticles can be derived. The
accuracy of the experimental data highly depends on uniformity of the sample and accurate
concentration measurement. In this module, we will learn the synthesis of the metal
nanoparticles and study their optical properties.
Materials, Supplies and Instrumentation
Chemicals:
- Poly(vinylpyrrolidone), M.W. 55000 (PVP)
- Tetrachlororauric acid trihydrate (HAuCl4∙3H2O)
- Copper sulfate pentahydrate (CuSO4∙5H2O)
- AgNCs (stock concentration to be provided by the teaching assistant)
- 18 MΩ water
Supplies:
- A 50 mL 3-neck round bottom flasks
- Magnetic stir bars
- A reflux condenser and glass stoppers
- A magnetic stir plate and heating mantle
- A centrifuge and appropriate centrifuge tubes
- A bath sonicator
- A timer
- UV-vis acrylic cuvettes
- Pasteur pipettes and bulbs
- Calibrated micropipette and appropriate tips
Instrumentation:
- UV-Vis spectrophotometer
- Transmission electron microscope (TEM)
- Laser pointer
Experimental Procedures
Solution Preparation:
- AgNCs (prepared in advance)
- 50 mM PVP (5.6 mg/mL), 5 mL
- 1 mM HAuCl4 (0.39 mg/mL), 10 mL
- 100 mM CuSO4 (25 mg/mL), 5 mL
Note: Prepare the following aqueous solutions using 18M water for best results. Use the wide
end of a glass Pasteur pipette as a spatula to eliminate any trace metal contamination. Modify
volumes as necessary to accommodate accurate concentrations using Eq. 5.
V1 = V2 × M2 / M1 (5)

15
where V1 is the volume of solution that needs to be made, V2 is 1 mL, M2 is the mass per mL
specified in parentheses above and M1 is the mass of sample that is weighed out. Stock solutions
may be prepared beforehand and diluted, but should be protected from light.
Synthesis of hAuAgNPs:
Add 10 mL H2O to the 50 mL flask. Place on a heating mantle with magnetic stirring and
allow to heat for 10 minutes, so that it starts to boil. Next add 0.5 mL of PVP solution and 1.0
mL of the silver nanoparticle suspension. Wait 2 min for the solution to equilibrate. Begin
adding 1 mM HAuCl4 dropwise to the reaction flask. Add the HAuCl4 solution no faster than 0.5
mL/min (roughly 20 drops/min). Groups will be using different amounts of Au3+
solution, so that
the hollow particles can be tuned to different wavelengths. Instructors will provide specific
quantities of Au to be added for each group. It will likely take between 3 and 6 mL to reach the
desired wavelength (e.g., 650 nm); however this value may vary depending on the AgNC size
and concentration. Make note of any observed color changes during this process.
Acquisition of UV-vis Spectra:
Add 2.0 mL H2O to a cuvette and acquire a blank spectrum. To this add 2 μL of the
remaining AgNC solution to yield a 1000× dilution. If needed, dilute the solution further to
achieve a clean spectrum. Record the wavelength of maximum absorbance and the value of this
absorbance. If this spectrum has a maximum value greater than one, then dilute the sample so
that the maximum is ~1 a.u. In a separate cuvette, directly add 1.8 mL H2O and 0.2 mL of the
Au-Ag reaction solution to obtain a 10x dilution. Record the maximum wavelength and similarly
dilute the sample to a maximum absorbance of ~1 a.u.
Investigation of Absorption and Scattering:
Acquire a standard red laser pointer and the samples, in cuvettes, used for the prior UV-vis
study. In clean cuvettes, prepare 2 mL of H2O and 2 mL of 100 mM CuSO4. Shine the beam
downward through each sample. Record any pertinent observations particularly relating to the
shape and intensity of the beam. The beam can be more easily visualized with the room lights
off, to minimize ambient light.
TEM Imaging:
The TEM samples are prepared by putting a drop of the nanoparticle suspension on the TEM
grid and allowing it to dry at room temperature. The TEM image will be recorded by the
teaching assistant. Identify the size and shape of the nanoparticles. Specifically, measure the
diameter of a statistically significant sample of nanoparticles using ImageJ.
Post Experiment Cleaning:
Clean all glassware following use. Condensers and stoppers need to be thoroughly rinsed
with deionized water. Rinse flasks into the liquid waste then scrub with soap and water in the
sink. Be careful not to scratch the glass. Used centrifuge tubes, pipette tips, and cuvettes should
be discarded in solid waste, and all unusable glassware should be disposed of in glass waste.
16
Lab Report:
Lab reports will contain the sections described below, and are expected to be written as
though it were to be published in a scientific journal. The content described in each section is
expected to be present in the report, but additional information is expected.
Abstract – Briefly describe the purposes and broad methodology of the experiment. Include a
summary of the major results from YOUR experiments.
Introduction – The background of the experiments is outlined. Specifically, the origin and nature
of the optical properties should be considered with regard to the experiments performed and the
synthetic methods utilized should be thoroughly explained.
Experimental Methods – All experimental procedure is described in such a manner that the
reader could easily repeat the experiment. Important information includes (but is not limited to)
equipment used, quantities of solutions, reagents, reaction times, and dilutions should all be
included. Methods are expected to describe the procedure followed by the author of the report.
Results and Discussion – All results should be presented, described, and the implications of these
data discussed. Include a sample calculation for all unique calculations. Clearly labeled figures
should be included which show the relevant data, and any significant observations during the
reaction of deviations from protocol should be discussed.
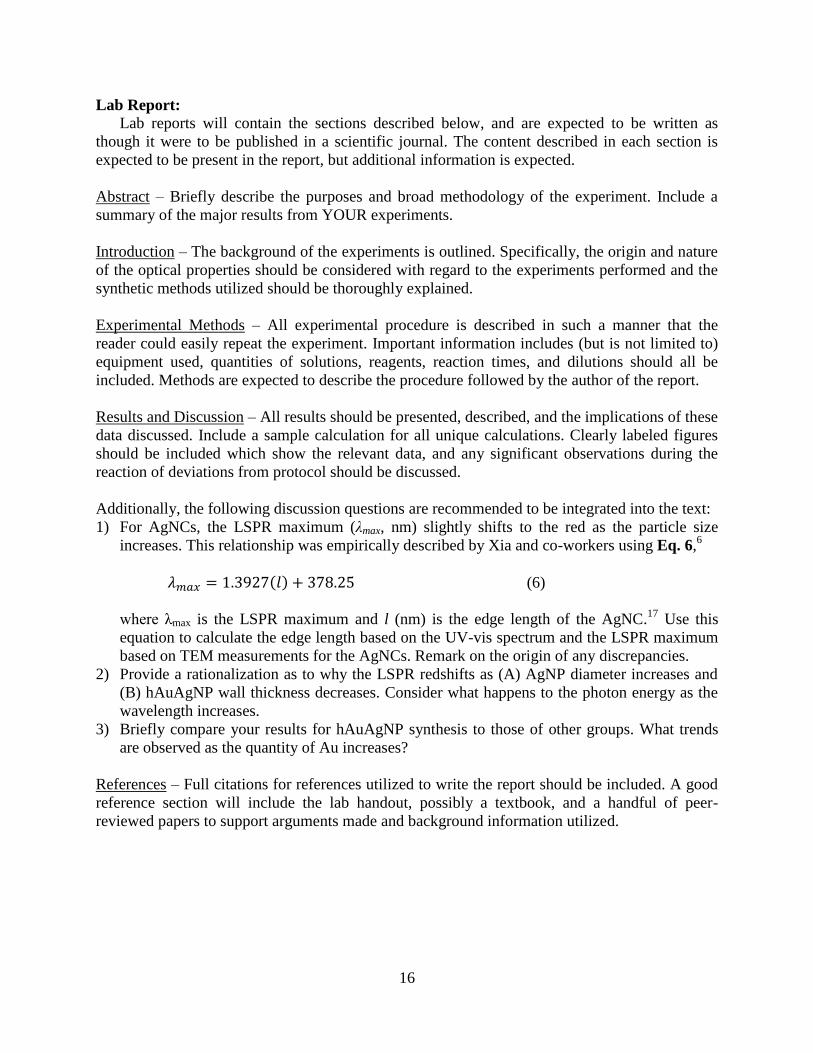
Additionally, the following discussion questions are recommended to be integrated into the text:
1) For AgNCs, the LSPR maximum (λmax, nm) slightly shifts to the red as the particle size
increases. This relationship was empirically described by Xia and co-workers using Eq. 6,6
𝜆𝑚𝑎𝑥 = 1.3927(𝑙) + 378.25 (6)
where λmax is the LSPR maximum and l (nm) is the edge length of the AgNC.17
Use this
equation to calculate the edge length based on the UV-vis spectrum and the LSPR maximum
based on TEM measurements for the AgNCs. Remark on the origin of any discrepancies.
2) Provide a rationalization as to why the LSPR redshifts as (A) AgNP diameter increases and
(B) hAuAgNP wall thickness decreases. Consider what happens to the photon energy as the
wavelength increases.
3) Briefly compare your results for hAuAgNP synthesis to those of other groups. What trends
are observed as the quantity of Au increases?
References – Full citations for references utilized to write the report should be included. A good
reference section will include the lab handout, possibly a textbook, and a handful of peer-
reviewed papers to support arguments made and background information utilized.

17
References
1. Dreaden, E. C.; Alkilany, A. M.; Huang, X.; Murphy, C. J.; El-Sayed, M. A., The Golden
Age: Gold Nanoparticles for Biomedicine. Chem. Soc.Rev. 2012, 41, 2740-2779.
2. Stiles, P. L.; Dieringer, J. A.; Shah, N. C.; Van Duyne, R. P., Surface-Enhanced Raman
Spectroscopy. Ann. Rev. .Anal. Chem. 2008, 1, 601-626.
3. Hu, M.; Chen, J.; Li, Z.-Y.; Au, L.; Hartland, G. V.; Li, X.; Marquez, M.; Xia, Y., Gold
Nanostructures: Engineering Their Plasmonic Properties for Biomedical Applications. Chem.
Soc. Rev. 2006, 35, 1084-1094.
4. Rosi, N. L.; Mirkin, C. A., Nanostructures in Biodiagnostics. Chem. Rev. 2005, 105 , 1547-
1562.
5. Chen, J.; Yang, M.; Zhang, Q.; Cho, E. C.; Cobley, C. M.; Kim, C.; Glaus, C.; Wang, L. V.;
Welch, M. J.; Xia, Y., Gold Nanocages: A Novel Class of Multifunctional Nanomaterials for
Theranostic Applications. Adv. Funct. Mater. 2010, 20, 3684-3694.
6. Sun, Y.; Xia, Y. Shape-Controlledd Synthesis of Gold and Silver Nanoparticles, Science,
2002, 298, 2176-2179.
7. Zhang, Q.; Li, W.; Wen, L.-P.; Chen, J.; Xia, Y. Facile Synthesis of Ag Nanocubes of 30 to
70 nm in Edge Length with CF3COOAg as a Precursor. Chemistry Euro. J. 2010, 16, 10234-
10239.
8. LaMer, V. K.; Dinegar, R. H., Theory, Production and Mechanism of Formation of
Monodispersed Hydrosols. J. Am. Chem. Soc. 1950, 72, 4847-4854.
9. Xia, Y.; Xiong, Y.; Lim, B.; Skrabalak, S. E., Shape-Controlled Synthesis of Metal
Nanocrystals: Simple Chemistry Meets Complex Physics? Angew. Chem. Int. Ed. 2009, 48,
60-103.
10. Skrabalak, S.E.; Wiley, B.; Kim, M.; Formo, E.V.; Xia, Y. On the Polyol Synthesis of Silver
Nanostructures: Glycoaldehyde as a Reducing Agent. Nano Lett. 2008, 8, 2077-2081.
11. Siekkinen, A.R.; McLellan, J.M.; Chen, J.; Xia, Y. Rapid Synthesis of Small Silver
Nanocubes by Mediating Polyol Reduction with a Trace Amount of Sodium Sulfide or
Sodium Hydrosulfide. Chem. Phys. Lett. 2006, 491-496.
12. Sun, Y.; Xia, Y., Mechanistic Study on the Replacement Reaction between Silver
Nanostructures and Chloroauric Acid in Aqueous Medium. J. Am. Chem. Soc. 2004, 126,
3892-3901.
13. Chen, J.; McLellan, J. M.; Siekkinen, A.; Xiong, Y.; Li, Z.-Y.; Xia, Y., Facile Synthesis of
Gold−Silver Nanocages with Controllable Pores on the Surface. J. Am. Chem. Soc. 2006,
128, 14776-14777.
14. Smigelskas, A. D.; Kirkendall, E. O., Zinc Diffusion in Alpha Brass. Trans. AIME 1947, 171,
130-142.
15. Yin, Y.; Rioux, R. M.; Erdonmez, C. K.; Hughes, S.; Somorjai, G. A.; Alivisatos, A. P.,
Formation of Hollow Nanocrystals Through the Nanoscale Kirkendall Effect. Science 2004,
304, 711-714.

18
APPENDIX I. Photothermal Conversion
Background
Absorption is one of the two primary components of extinction; it is the process by which the
energy of an incident photon is introduced into the molecular energy of a system. Following
absorption, the energy must be released to return the system to its ground state. Plasmonic
materials are particularly well-suited to convert the absorbed photonic energy into phonon
energy (lattice vibrations) that dissipates in the form of heat. As a result, irradiation of these
nanomaterials can be used to generate localized heating. The temperature profile can be finely
controlled by adjusting the particle concentration, absorption cross-section, and optical dose
(power and duration). Removing the irradiation source will cause the system to cool back to
room temperature, which can be modeled with Eq. 7:16
T(t) = T0 + (Tmax − T0) ∗ e−Bt (7)
where T(t) is the temperature at a given time, T0 is room temperature, Tmax is the temperature
when irradiation was removed, and t is time. B is the rate constant (in s-1
) associated with the
heat dissipation from the sample. B is influenced by the heat capacity, mass, and surface area of
the system. The rise in temperature during laser irradiation can be modelled to fit Eq. 8:
T(t) = T0 + AB⁄ (1 − e−Bt) (8)
which uses the same B value from Eq. 7. A is a constant associated with energy absorption (in
°C/s) and is influenced heavily by the absorption cross section and heat transfer coefficients of
the sample, as well as extrinsic factors like the sample concentration and optical path length,
flux, and dose.
Experimental Procedures
An NIR photodiode laser (808 nm), temperature probe, 2 mL of the samples of AgNCs and
hAuAgNCs with extinction ~0.1 a.u., a solution of 100 mM CuSO4, and 18 MΩ H2O are used
for this experiment. The laser is warmed up for 5 min, is then positioned to shine downward into
the open cuvette. Irradiate a sample for 5 min, then remove from irradiation for 5 min, then
irradiate again for 5 min. Record the temperature every 15 s.
Discussion question: Using these data, determine the values for A and B for your hAuAgNP
sample. Rationalize the results observed for all four samples measured.
References
16. Richardson, H.H.; Carlson, M.T.; Tandler, P.J.; Hernandex, P.; Govorov, A.O.
Experimental and Theoretical Studies of Light-to-Heat Conversion and Collective Heating
Effects in Metal Nanoparticle Solutions. Nano Lett. 2009, 9, 1139-46.
19
APPENDIX II. Surface Enhanced Raman Spectroscopy (SERS)
Background Raman spectroscopy is a commonly-used vibrational spectroscopic technique which is based on
the inelastic Raman scattering of higher-energy visible photons by a molecule. The energy shifts
in the scattered radiation corresponds to transitions between vibrational energy levels of the
molecule. Raman cross sections are very small, and therefore difficult to detect. When molecules
are adsorbed or in close proximity to a metal surface, the Raman intensity enhances, known as
SERS. A recent review has detailed the concepts and applications of SERS.17
At the resonance
condition with incident radiation, charge separation confined within the nanoparticle surface
enhances the electromagnetic (EM) field strength near the surface. The EM enhancement serves
as a two-way antenna that increases the light intensity on the molecule and increases the
scattered Raman signal, resulting in quartic signal enhancement (E4). SERS enhancement can be
compared quantitatively by enhancement factor (EF).18
From the SERS substrate point of view,
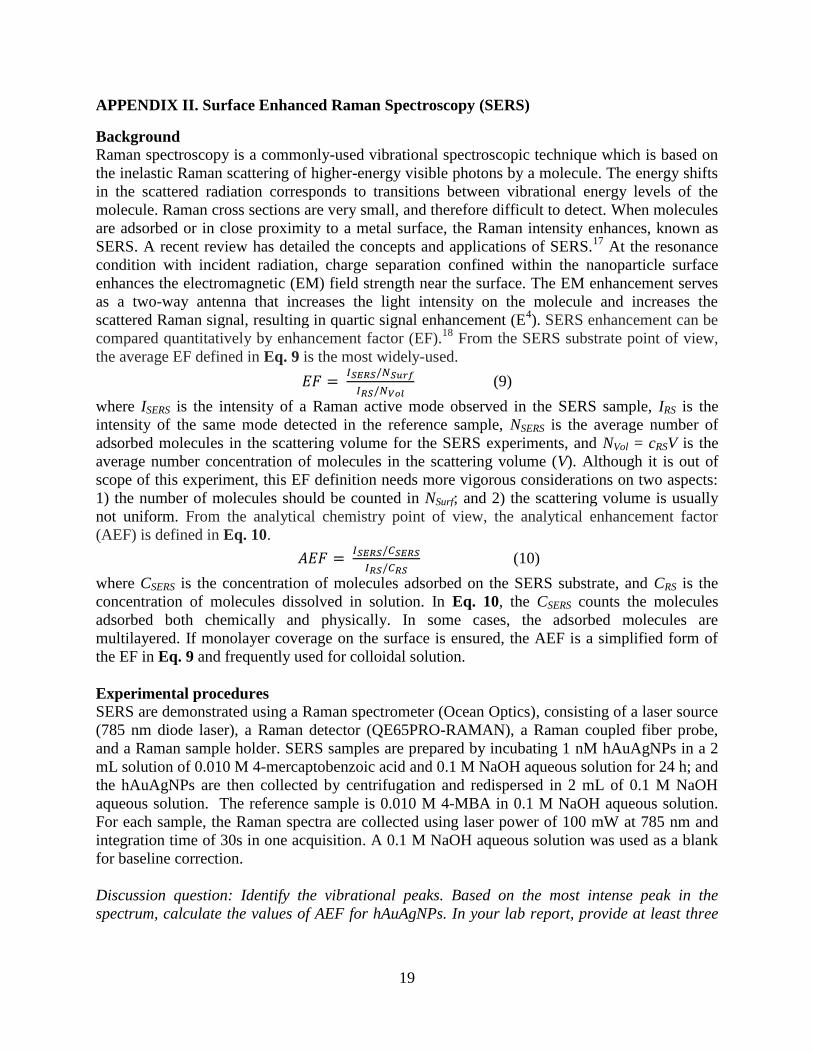
the average EF defined in Eq. 9 is the most widely-used.
𝐸𝐹 = 𝐼𝑆𝐸𝑅𝑆/𝑁𝑆𝑢𝑟𝑓
𝐼𝑅𝑆/𝑁𝑉𝑜𝑙 (9)
where ISERS is the intensity of a Raman active mode observed in the SERS sample, IRS is the
intensity of the same mode detected in the reference sample, NSERS is the average number of
adsorbed molecules in the scattering volume for the SERS experiments, and NVol = cRSV is the
average number concentration of molecules in the scattering volume (V). Although it is out of
scope of this experiment, this EF definition needs more vigorous considerations on two aspects:
1) the number of molecules should be counted in NSurf; and 2) the scattering volume is usually
not uniform. From the analytical chemistry point of view, the analytical enhancement factor
(AEF) is defined in Eq. 10.
𝐴𝐸𝐹 = 𝐼𝑆𝐸𝑅𝑆/𝐶𝑆𝐸𝑅𝑆
𝐼𝑅𝑆/𝐶𝑅𝑆 (10)
where CSERS is the concentration of molecules adsorbed on the SERS substrate, and CRS is the
concentration of molecules dissolved in solution. In Eq. 10, the CSERS counts the molecules
adsorbed both chemically and physically. In some cases, the adsorbed molecules are
multilayered. If monolayer coverage on the surface is ensured, the AEF is a simplified form of
the EF in Eq. 9 and frequently used for colloidal solution.
Experimental procedures
SERS are demonstrated using a Raman spectrometer (Ocean Optics), consisting of a laser source
(785 nm diode laser), a Raman detector (QE65PRO-RAMAN), a Raman coupled fiber probe,
and a Raman sample holder. SERS samples are prepared by incubating 1 nM hAuAgNPs in a 2
mL solution of 0.010 M 4-mercaptobenzoic acid and 0.1 M NaOH aqueous solution for 24 h; and
the hAuAgNPs are then collected by centrifugation and redispersed in 2 mL of 0.1 M NaOH
aqueous solution. The reference sample is 0.010 M 4-MBA in 0.1 M NaOH aqueous solution.
For each sample, the Raman spectra are collected using laser power of 100 mW at 785 nm and
integration time of 30s in one acquisition. A 0.1 M NaOH aqueous solution was used as a blank
for baseline correction.
Discussion question: Identify the vibrational peaks. Based on the most intense peak in the
spectrum, calculate the values of AEF for hAuAgNPs. In your lab report, provide at least three

20
rationalizations for why the AEF is not the same and discuss any significant discrepancies
between the spectra.
References
17. Schlücker, S. Surface-Enhanced Raman Spectroscopy: Concepts and Chemical
Applicaitions. Angew. Chem. Int. Ed. 2014, 53, 4756-4795.
18. Le Ru, E.; Blackie, E.; Meyer, M.; Etchegoin, P. G. Surface enhanced Raman scattering
enhancement factors: a comprehensive study. J. Phys. Chem. C 2007, 111, 13794-13803.

21
Appendix III – Sample Calculation for AgNCs
A) Determination of AgNC Stock Solution concentration
A total of 2 μL of the AgNCs prepared for use by the undergraduates was dissolved with HNO3
and diluted to 2 mL (dilution factor = 1000) with 2 % HNO3 to prepare the flame atomic
absorbance spectroscopy (FAAS) sample. The sample was determined to have a Ag
concentration of 4.6 ppm.
Based on the data from FAAS, the mass concentration was converted to atom concentration as
follows.
4.6 ppm Ag = 4.6 μg/mL Ag = 4.6 mg/L Ag
(4.6 mg/L Ag)/(107.9 g/mol) = (42.6 μM Ag)×(6.02×10²³
atoms/mol) = 2.56×10¹⁹
Ag atoms/L
Based on the data from TEM, the average size of the AgNCs was measured and then used to
determine the number of atoms per AgNC according to the lattice constant of Ag (α = 0.418 nm)
and the unit cell structure (face-centered cubic, 4 atoms/unit cell).
Volume (V) of AgNCS with an edge length (l) of 46.6 nm: V = l3 = 1.01×10
5 nm
3/AgNC;
Atoms per AgNC:
(1.01×10⁵ nm
3/AgNC)/[(0.418 nm/unit cell)×(4 atom/unit cell)] = 5.53×10
6 Ag atoms per AgNC
Then, AgNC concentration was determined from the above information.
(2.56×10¹⁹
Ag atoms/L)/(5.53×106 Ag atoms per AgNC) = 4.63×10
12 AgNC/L
or
(4.63×10¹²
AgNC/L) /(6.02×1023
atoms/mol) = 7.69x10⁻¹²
M AgNC
Considering the dilution factor of 1000, the concentration of the AgNC stock solution is 7.7×10⁻⁹
M or 7.7 nM.
B) Calculation of Extinction Coefficient
AgNC stock solution was diluted between 500× (15.5 pM) and 4000× (1.9 pM) and the UV-vis
spectra was acquired. The extinction at 438 nm is plotted in Figure IIIA. According to the Beer’s
Law: A = εcl, where l is 1 cm, slope of the graph gives ε = 1.2 pM-1
cm-1
= 1.2×10¹¹
M-1
cm-1
.
Figure IIIA. Plot of extinction at 438 nm versus AgNC concentration.
Chen
Cross-Out
Chen
Inserted Text
[(1.01x10^5 nm^3/AgNC)/(0.408^3 nm^3/unit cell)]x(4 atoms/unit cell) = 5.95x10^6 Ag atoms per AgNC
Chen
Cross-Out
Chen
Inserted Text
5.95
Chen
Cross-Out
Chen
Inserted Text
4.30
Chen
Cross-Out
Chen
Inserted Text
4.30
Chen
Cross-Out
Chen
Inserted Text
7.14
Chen
Cross-Out
Chen
Inserted Text
7.1
Chen
Cross-Out
Chen
Inserted Text
7.1
Chen
Cross-Out
Chen
Inserted Text
0.12

22
Appendix IV – Sample Quiz
1) What are the functions of ethylene glycol (EG) and poly(vinyl pyrrolidone) PVP during the
synthesis of Ag nanocubes?
2) Why does the galvanic replacement reaction between AgNCs and Au3+
result in a hollow,
porous structure?
3) Why does the galvanic replacement reaction between AgNCs and Au3+
proceed
spontaneously?
4) What is localized surface plasmon resonance (LSPR)? Give two examples for the
applications of metal nanoparticles based on their (LSPR).
5) Briefly describe the physical effect of each component of extinction (i.e. what happens to the
incident photon)?