Supplemental Information Intertissue Control of the ...
17
Cell Reports, Volume 7 Supplemental Information Intertissue Control of the Nucleolus via a Myokine-Dependent Longevity Pathway Fabio Demontis, Vishal K. Patel, William R. Swindell, and Norbert Perrimon,
Transcript of Supplemental Information Intertissue Control of the ...

Cell Reports, Volume 7
Supplemental Information
Intertissue Control of the Nucleolus
via a Myokine-Dependent Longevity Pathway
Fabio Demontis, Vishal K. Patel, William R. Swindell, and Norbert Perrimon,

SUPPLEMENTAL FIGURES AND LEGENDS
Figure S1. Drosophila Mnt is Detected in Skeletal Muscle and Adipose Tissue, Related to Figure 1. (A-D) Immunostaining of indirect flight muscle with anti-Mnt antibodies (red), F-actin (phalloidin, blue), and nuclei (DAPI, green). Mnt is detected in nuclei of adult skeletal muscle (A) and adipose tissue (C) from wild-type flies but not from Mnt-/- null flies (B, D, E). Scale bar is 20 µm. In (E), relative Mnt mRNA levels are shown with SEM indicated and n=4. ***P<0.001, unpaired two-tailed Student’s t-test. (F) No apparent changes in Mnt and myoglianin mRNA levels are detected in muscle during aging and in response to starvation and a 5% sucrose diet. Mnt activity and Myoglianin signaling may be modulated via post-transcriptional mechanisms during aging independently from gene expression.
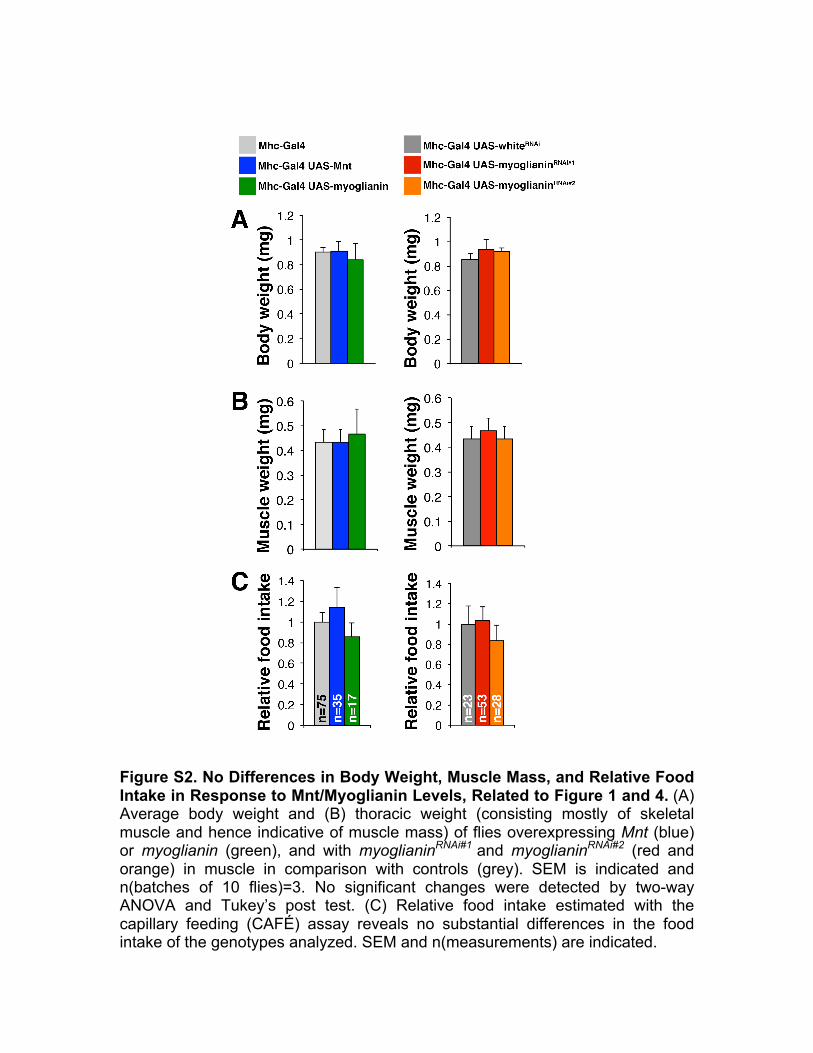
Figure S2. No Differences in Body Weight, Muscle Mass, and Relative Food Intake in Response to Mnt/Myoglianin Levels, Related to Figure 1 and 4. (A) Average body weight and (B) thoracic weight (consisting mostly of skeletal muscle and hence indicative of muscle mass) of flies overexpressing Mnt (blue) or myoglianin (green), and with myoglianinRNAi#1 and myoglianinRNAi#2 (red and orange) in muscle in comparison with controls (grey). SEM is indicated and n(batches of 10 flies)=3. No significant changes were detected by two-way ANOVA and Tukey’s post test. (C) Relative food intake estimated with the capillary feeding (CAFÉ) assay reveals no substantial differences in the food intake of the genotypes analyzed. SEM and n(measurements) are indicated.

Figure S3. Lifespan Extension in Response to Mnt/Myoglianin Overexpression and RNAi-mediated knockdown of Genes Involved in Ribosome Biogenesis and Function, Related to Figure 1 and 4. (A-B) Overexpression of Mnt and myoglianin in adult skeletal muscle with the dMef2-Gal4 driver under the temporal control of Gal80ts. Flies were raised at 18°C to avoid transgene expression during development and shifted to 25°C three days after eclosion to inactivate Gal80ts and induce Mnt and myoglianin

expression in muscle of adult flies. Overexpression of Mnt (blue; dMef2-Gal4/UAS-Mnt; n=112; median/maximum lifespan=73.3/92 days) and myoglianin (green; dMef2-Gal4/UAS-myoglianin; n=121; median/maximum lifespan=80.5/98 days) in adult skeletal muscle extends lifespan (P<0.001; Log-rank tests) and decreases age-related climbing defects (P<0.01; Log-rank tests) in comparison to control flies (grey; dMef2-Gal4/+; n=45; median/maximum lifespan=60.2/74 days). Relative mRNA levels of Mnt and myoglianin are shown with SEM indicated and n=4. ***P<0.001, unpaired two-tailed Student’s t-test. (C-H) RNAi-mediated knockdown (blue) in muscle of Nopp140 (C; n=97; median/maximum lifespan=74.1/92 days), RpLP0 (D; n=35; median/maximum lifespan=80.2/92 days), RpS3 (E; n=70; median/maximum lifespan=72.3/92 days), eIF-4a (F; n=77; median/maximum lifespan=76.5/94 days), Brf (G; n=170; median/maximum lifespan=75.2/94 days), and Ssrp (H; n=130; median/maximum lifespan=82/100) extends the median lifespan in comparison with UAS-RNAi alone controls (dashed blue line; respectively in C to H: n=166; n=271; n=396; n=271; n=132; n=125; having respectively median/maximum lifespan: 69.3/90; 69.8/100; 66.8/100; 72/98; 63.8/90; 62.6/92 days) and white RNAi (black; n=72 and median/maximum lifespan=65.3/88 days in C-F; n=57 and median/maximum lifespan=68.6/86 days in G-H; P<0.001; Log-rank tests). Relative mRNA levels of Nopp140, RpLP0, RpS3, eIF-4a, Brf, and Ssrp are respectively shown in boxes in C-H, with SEM indicated and n=4. *P<0.05; **P<0.01; ***P<0.001, unpaired two-tailed Student’s t-test.

Figure S4. Regulation of Nucleolar Size in Mnt Null Adipocytes during Aging, Related to Figure 2. Immunostaining of adipose tissues (fat body) from control (+/+) and Mnt-/- null flies in young (1 week) and old age (7 weeks). Although nucleolar size decreases during aging in wild-type adipocytes (A-C), it does not in the absence of Mnt (B-D; Mnt-/-). In A-D, scale bar is 10 µm. Nucleolar size quantification is shown in (E) with SEM and n indicated; ns, not significant; *P<0.05; ***P<0.001; two-way ANOVA followed by Tukey’s post test.

Figure S5. Statistical Analysis of the Myokine RNAi Screen (Ordered by Ascending Median Lifespan), Related to Figure 3. Left panel: Results of the RNAi screen (Figure 3) are ordered by ascending median lifespan with each box outlining the middle 50% of survival times for flies in each RNAi treatment, and whiskers outlining the middle 80% of survival times. RNAi treatments significantly increasing lifespan relative to controls (RNAi against the white; HMS17) are represented by red boxes, and treatments significantly decreasing lifespan are represented by green boxes (log-rank test; FDR-adjusted P<0.05 with at least a 5% change in median lifespan). The vertical yellow region outlines the middle 50% of survival times in the control treatment (HSM17). Two different RNAi treatments in skeletal muscles against the TGF-β ligand myoglianin significantly shortened the median lifespan as compared with RNAi against white (HMS17). Right panel: Percentage of flies with climbing defects at days 36 (violet) and 56 (black). A green asterisk is used to denote cohorts for which the percentage of flies with climbing defects at day 56 is significantly higher than in controls at day 56 (chi-square test; FDR-adjusted P<0.05). Myoglianin RNAi significantly increases the percentage of flies with climbing defects in old age. None of the RNAi treatments resulted in climbing defects in young age (day 8; Figure 3).

Figure S6. Myoglianin RNAi Leads to Partial Suppression of the Lifespan Extension Induced by Mnt Overexpression in Muscle, Related to Figure 4. (A-B) Overlay of the data shown in Figure 4C-F reporting lifespan and climbing assays. Myoglianin RNAi in Mnt overexpressing muscle is statistically different from Myoglianin RNAi alone, indicating that myoglianin is required only in part for the preservation of climbing ability and lifespan extension induced by Mnt (P<0.001, Log-rank tests). See the legend of Figure 4 for additional information on the statistical analysis of these data. (C) Myoglianin RNAi in muscle overexpressing Mnt results in lower myoglianin mRNA levels in thoraces, which consist mostly of muscle, but not in heads and abdomens, which are enriched in non-muscle tissues. SEM is indicated and n=4. **P<0.01, unpaired two-tailed Student’s t-test.


Figure S7. Additional Analysis of P-p38 MAPK, total p38 MAPK, and P-p70 S6K levels in Response to Mnt/Myoglianin Signaling, Related to Figure 7. (A) Absence of changes in P-p38 MAPK levels in UAS-transgene alone controls. Western blot analysis of phospho-p38 (P-p38) MAPK levels in thoraces from heterozygous flies carrying UAS- transgenes but no Mhc-Gal4. Normalization of P-p38 MAPK levels with α-tubulin levels (loading control) indicates the lack of changes in P-p38 MAPK levels in the absence of Gal4-driven transgene expression. (B) Western blot analysis of phospho-p70 S6K and total p38 MAPK levels in response to Mnt and myoglianin overexpression and RNAi in muscle. No substantial changes were detected, indicating that Mnt/Myoglianin signaling regulates phosphorylation of p38 MAPK (Figure 7) but not total p38 MAPK protein levels and phospho-p70 S6K levels. (C) Myoglianin RNAi in muscle overexpressing Mnt results in lower P-p38 MAPK levels in thoraces and heads and abdomens when compared to white RNAi (control). See also Figure 7.

EXTENDED EXPERIMENTAL PROCEDURES Fly Stocks The following fly stocks were used: ppl-Gal4 (Colombani et al., 2003); Mhc-Gal4 (Schuster et al., 1996); dMef2-Gal4 (Ranganayakulu et al., 1996), UAS-Mnt and Mnt1/1 (Loo et al., 2005); UAS-whiteRNAi #1 and #2 (TRiP ID: HMS0017 and JF01786), UAS-myoglianinRNAi #1 and #2 (Awasaki et al., 2011), UAS-RpS3RNAi (JF01410), UAS-RpLP0RNAi (JF01335), UAS-Nopp140RNAi (HMS00564), UAS-eIF-4aRNAi (HMS00927), UAS-BrfRNAi (JF02482), UAS-SsrpRNAi (JF02120), UAS-CG5033RNAi (HMS01433), UAS-p38MAPK WT (wild-type) and UAS-p38MAPK KD3 (kinase dead; (Vrailas-Mortimer et al., 2011)). Additional transgenic RNAi stocks used in the screen were from the DRSC/TRiP (http://www.flyrnai.org/TRiP-HOME.html/; (Ni et al., 2009; Ni et al., 2011)) and are indicated in Figures S5. Construction of UAS-myoglianin To generate UAS-myoglianin, the Drosophila melanogaster myoglianin (CG1838) coding sequence, corresponding to nucleotides 844-2640 of sequence AY061367, was amplified by PCR using the full-length cDNA clone LD29161 as template with primers 5’-gccagatctatgctggccaactcatgctgcggttgg-3’ and 5’-gccctcgagctaagaacag ctgcaaccctcgacagac-3’ (underlined are BglII and XhoI restriction sites, respectively). The PCR product was cut with BglII and XhoI for cloning into the pUAST vector, followed by sequencing and injection into y1w1118 embryos. Capillary Feeding (CAFÉ) Assays For capillary feeding (CAFÉ) assays (Ja et al., 2007), groups of 10 flies were transferred twelve hours before the assay from standard food to 1.5% agar vials and fed a 5% sucrose solution in PBS provided via a 5 µl calibrated glass micropipette (VWR, #53432-706). At the start of the assay, the old micropipette was replaced with a new one and the amount of liquid food consumed was recorded every 2 hours and corrected on the basis of the evaporation observed in a vial without flies. Muscle and Body Weight Measurements For measurement of body weight, 3 groups of 10 flies were weighted on a precision balance and the average body weight calculated. For measurement of thoracic weight (indicative of muscle mass), 3 groups of 10 thoraces were weighted and the average weight calculated. Immunostaining, Laser Scanning Confocal Microscopy, and Image Analysis Dissected tissues were fixed for 20 minutes in PBS with 4% paraformaldehyde and 0.1% Triton X-100, washed, and incubated overnight with 1:100 dilution of anti-Fibrillarin (Nop1p; Encore Biotechnology #MCA-38F3) or mouse anti-Mnt (P5D6) (Loo et al., 2005). The following day, samples were washed and
incubated overnight with DAPI (Invitrogen, 1µg/mL), Alexa555-conjugated secondary antibodies (Molecular Probes, 1:200), and Alexa635-conjugated Phalloidin (Molecular Probes, 1:100). Samples were imaged with a Leica SP2 confocal microscope. Image analysis was done with the “Analyze particle” function of ImageJ. Luciferase Assays Luciferase assays were done as before (Demontis and Perrimon, 2010). 15×104 S2R+ cells/cm2 were seeded in Schneider's medium (Gibco) containing 10% FCS and transfected one day later using the Effectene Transfection Kit (Qiagen). The following day the medium was changed and, after an additional 3 days in culture, the luciferase assay was performed with the Dual-Glo Luciferase Assay (Promega) according to manufacturer's instructions. The CG4364- and CG5033-firefly luciferase reporters were previously described (Hulf et al., 2005). To generate the myoglianin-Renilla luciferase reporter, the proximal promoter region (>4:718244,716674) of the myoglianin gene (CG1838) was amplified by PCR and cloned into the pRL-null vector (Promega) with XhoI and EcoRI. UAS-Mnt and UAS-YFP plasmids for overexpression of either Mnt (CG13316) or yellow fluorescent protein (YFP) were provided by the DRSC at Harvard Medical School. In experiments with the myoglianin-Renilla luciferase reporter, an actin-firefly luciferase reporter was co-transfected as normalization control and luciferase activity refers to ratio of Renilla to firefly luciferase activity. In experiments with the CG4364- and CG5033-firefly luciferase reporters (Hulf et al., 2005), an actin-Renilla luciferase reporter was co-transfected as normalization control and luciferase activity refers to ratio of firefly to Renilla luciferase activity. S2R+ cells were also co-transfected with either UAS-YFP (control) or UAS-Mnt as indicated. Western Blots Samples were prepared by homogenizing in a bullet blender (NextAdvance) either fly thoraces (consisting mainly of muscles) or heads and abdomens (consisting mainly of non-muscle tissues) from at least 15 male flies per group in RIPA buffer with protease and phosphatase inhibitors. SDS-PAGE was done as previously (Demontis and Perrimon, 2010). Primary antibodies used are anti-P-p38 MAPK (Cell Signaling Technologies #9215), anti-Drosophila P-p70 S6K (Cell Signaling Technologies #9209), anti-total p38 MAPK (Cell Signaling Technologies #9212), and anti-α-Tubulin (Cell Signaling Technologies #2125). For densitometry of Western blots, band intensity was quantified with the Histogram function of Photoshop. Bioinformatic Analysis Multiple sequence alignment and phylogenetic analysis were done with ClustalW, available at http://www.ebi.ac.uk/Tools/msa/clustalw2/, and orthology prediction with DIOPT, available at http://www.flyrnai.org/cgi-bin/DRSC_ orthologs.pl.

Statistical Analysis Statistical analysis was performed with Excel and the GraphPad Prism software. Unpaired two-tailed Student’s t-test was used to compare means of two independent groups to each other, while two-way ANOVA followed by Tukey’s post test was used to compare the means of more than two independent groups of normally distributed data. Log-rank tests were employed for the statistical analysis of lifespan data and negative geotaxis assays. Statistical Analysis of the RNAi Screen Differences in median lifespan were analyzed using the log-rank test as implemented in the “survdiff” function included within the R package “survival” (Therneau, 2012). Survival times for each RNAi treatment were compared with the control (whiteRNAi; HMS00017). To control the false discovery rate, P-values generated from each log-rank test were adjusted by using the Benjamini-Hochberg method (Benjamini Y, 1995). To qualify as a statistically significant difference compared with whiteRNAi, an FDR-adjusted P-value of less than 0.05 (log-rank test) was required in addition to at least a 5% difference in median lifespan. Similarly, differences in the percentage of flies with climbing defects at day 56 were analyzed using a chi-square test, as implemented in the function “prop.test” included within the R statistical software, with P-values from each test adjusted by using the Benjamini-Hochberg method. For a statistically significant difference in climbing ability compared with whiteRNAi, an FDR-adjusted P-value of less than 0.05 (chi-square test) was required. Statistical Analysis of Microarrays Genome-wide expression levels were evaluated using the Affymetrix Drosophila Genome 2.0 array platform (18,952 probe sets representing transcripts associated with 12,440 unique fly genes). Array hybridizations were performed following standard Affymetrix protocols, yielding CEL files in standard format containing probe-level intensity estimates. Quality control metrics were calculated by using CEL files generated for each array, including average background, scale factor, percent present, RNA degradation score, RLE median, RLE IQR, NUSE median and NUSE IQR (Bolstad BM, 2005). There was no indication of problematic array hybridizations based upon these quality-control metrics. Normalized expression scores were calculated for each array by using robust multichip average (RMA) (Bolstad BM, 2003). Presence and absence calls were calculated by using the Wilcoxon rank sum test, as implemented in the MAS 5.0 algorithm (Liu WM, 2002). Of 18,952 probe sets, 6,353 were identified for which signal intensities were not significantly above background with respect to any of the arrays. These 6,353 probe sets were excluded, leaving a total of 12,599 probe sets for further analyses. Differential expression between treatments was analyzed by using linear models with variance estimates moderated using empirical Bayes methods (Smyth, 2005). Raw P-values were generated based upon moderated T statistics generated for each gene and each treatment comparison (Smyth, 2005). To assess significance given the total number of hypotheses evaluated, raw P-values were adjusted to control the false discovery

using the Benjamini-Hochberg method (Benjamini Y, 1995). Probe set annotation for the Affymetrix Drosophila Genome 2.0 array was obtained from the R Bioconductor package “drosophila2.db” (Carlson M, 2012a). Additional annotation for the Drosophila genome was obtained using the package “org.Dm.eg.db” (Carlson M, 2012b).
Overrepresentation of gene ontology (GO) terms among differentially expressed genes was evaluated using a conditional version of the Fisher’s exact test (Bolstad BM, 2005; Falcon S, 2007). In this approach, the significance of a GO term is evaluated based on a filtered set of associated genes, which excludes any genes associated with more specific GO terms already known to be overrepresented. This approach serves to reduce redundancy among GO terms identified as significantly overrepresented with respect to a set of differentially expressed genes (Bolstad BM, 2005; Falcon S, 2007). In these analyses, enrichment of GO terms among differentially expressed genes was evaluated relative to a reference set of fly genes, which was filtered to include only those genes associated with the 12,599 probe sets expressed above background levels. SUPPLEMENTAL REFERENCES Awasaki, T., Huang, Y., O'Connor, M.B., and Lee, T. (2011). Glia instruct developmental neuronal remodeling through TGF-beta signaling. Nat Neurosci 14, 821-823. Benjamini Y, H.Y. (1995). Controlling the false discovery rate: a practical and powerful approach to multiple testing. Journal of the Royal Statistical Society Series, 289-300. Bolstad BM, C.F., Brettschneider J, Simpson K, Cope L, et al. (2005). Quality assessment of Affymetrix GeneChip Data (New York: Springer). Bolstad BM, I.R., Astrand M, Speed TP. (2003). A comparison of normalization methods for high density oligonucleotide array data based on variance and bias. Bioinformatics, 185-193. Carlson M, F.S., Pages H, Li N. (2012a). drosophila2.db: Affymetrix Drosophila Genome 2.0 Array annotation data (chip drosophila2). Carlson M, F.S., Pages H, Li N. (2012b). org.Dm.eg.db: Genome wide annotation for Fly. Colombani, J., Raisin, S., Pantalacci, S., Radimerski, T., Montagne, J., and Leopold, P. (2003). A nutrient sensor mechanism controls Drosophila growth. Cell 114, 739-749.

Demontis, F., and Perrimon, N. (2010). FOXO/4E-BP signaling in Drosophila muscles regulates organism-wide proteostasis during aging. Cell 143, 813-825. Falcon S, G.R. (2007). Using GOstats to test gene lists for GO term association. Bioinformatics, 257-258. Hulf, T., Bellosta, P., Furrer, M., Steiger, D., Svensson, D., Barbour, A., and Gallant, P. (2005). Whole-genome analysis reveals a strong positional bias of conserved dMyc-dependent E-boxes. Mol Cell Biol 25, 3401-3410. Ja, W.W., Carvalho, G.B., Mak, E.M., de la Rosa, N.N., Fang, A.Y., Liong, J.C., Brummel, T., and Benzer, S. (2007). Prandiology of Drosophila and the CAFE assay. Proc Natl Acad Sci U S A 104, 8253-8256. Liu WM, M.R., Di X, Ryder TB, Hubbell E, Dee S, Webster TA, Harrington CA, Ho MH, Baid J, Smeekens SP (2002). Analysis of high density expression microarrays with signed-rank call algorithms. Bioinformatics 18(12), 1593-1599. Loo, L.W., Secombe, J., Little, J.T., Carlos, L.S., Yost, C., Cheng, P.F., Flynn, E.M., Edgar, B.A., and Eisenman, R.N. (2005). The transcriptional repressor dMnt is a regulator of growth in Drosophila melanogaster. Mol Cell Biol 25, 7078-7091. Ni, J.Q., Liu, L.P., Binari, R., Hardy, R., Shim, H.S., Cavallaro, A., Booker, M., Pfeiffer, B.D., Markstein, M., Wang, H., et al. (2009). A Drosophila Resource of Transgenic RNAi Lines for Neurogenetics. Genetics 182, 1089-1100. Ni, J.Q., Zhou, R., Czech, B., Liu, L.P., Holderbaum, L., Yang-Zhou, D., Shim, H.S., Tao, R., Handler, D., Karpowicz, P., et al. (2011). A genome-scale shRNA resource for transgenic RNAi in Drosophila. Nat Methods 8, 405-407. Ranganayakulu, G., Schulz, R.A., and Olson, E.N. (1996). Wingless signaling induces nautilus expression in the ventral mesoderm of the Drosophila embryo. Dev Biol 176, 143-148. Schuster, C.M., Davis, G.W., Fetter, R.D., and Goodman, C.S. (1996). Genetic dissection of structural and functional components of synaptic plasticity. I. Fasciclin II controls synaptic stabilization and growth. Neuron 17, 641-654. Smyth, G. (2005). Limma: linear models for microarray data. (New York: Springer). Therneau, T. (2012). A Package for Survival Analysis in S. Vrailas-Mortimer, A., del Rivero, T., Mukherjee, S., Nag, S., Gaitanidis, A., Kadas, D., Consoulas, C., Duttaroy, A., and Sanyal, S. (2011). A muscle-specific

p38 MAPK/Mef2/MnSOD pathway regulates stress, motor function, and life span in Drosophila. Dev Cell 21, 783-795.