Supplemental Information for prostate cancer therapy via ...
31
Supplemental Information for PSMA-targeted arsenic nanosheets: a platform for prostate cancer therapy via ferroptosis and ATM deficiency-triggered chemosensitization Hui Wang, a,1 Li Zhang, a,1 Zhaohua Miao, b,1 Meng Zhang, a Hang Liu, b Qiong He, c Jialin Meng, a Longping Wen, a,d Zunfu Ke, c Zhengbao Zha, b, * Run Lin, e,c * and Chaozhao Liang a, * a Department of Urology, the First Affiliated Hospital of Anhui Medical University, Institute of Urology, Anhui Medical University and Anhui Province Key Laboratory of Genitourinary Diseases, Anhui Medical University, Hefei, 230022 China. b School of Food and Biological Engineering, Hefei University of Technology, Hefei, 230009 China. c Molecular Diagnosis and Gene Testing Center, the First Affiliated Hospital, Sun Yat-sen University, Guangzhou, 510080 China. d School of Medicine and Institutes for Life Sciences, South China University of Technology, Guangzhou, 510006 China. e Department of Radiology, the First Affiliated Hospital, Sun Yat-sen University, Guangzhou, Guangzhou, 510080, China 1 These authors contributed equally to this work. *Corresponding author. Email: [email protected] (Z.Z.); [email protected] Electronic Supplementary Material (ESI) for Materials Horizons. This journal is © The Royal Society of Chemistry 2021
Transcript of Supplemental Information for prostate cancer therapy via ...

Supplemental Information for
PSMA-targeted arsenic nanosheets: a platform for
prostate cancer therapy via ferroptosis and ATM
deficiency-triggered chemosensitization
Hui Wang,a,1 Li Zhang,a,1 Zhaohua Miao,b,1 Meng Zhang,a Hang Liu,b Qiong He,c
Jialin Meng,a Longping Wen,a,d Zunfu Ke,c Zhengbao Zha,b,* Run Lin,e,c* and
Chaozhao Lianga,*
a Department of Urology, the First Affiliated Hospital of Anhui Medical University,
Institute of Urology, Anhui Medical University and Anhui Province Key Laboratory
of Genitourinary Diseases, Anhui Medical University, Hefei, 230022 China.
b School of Food and Biological Engineering, Hefei University of Technology, Hefei,
230009 China.
c Molecular Diagnosis and Gene Testing Center, the First Affiliated Hospital, Sun
Yat-sen University, Guangzhou, 510080 China.
d School of Medicine and Institutes for Life Sciences, South China University of
Technology, Guangzhou, 510006 China.
e Department of Radiology, the First Affiliated Hospital, Sun Yat-sen University,
Guangzhou, Guangzhou, 510080, China
1 These authors contributed equally to this work.
*Corresponding author. Email: [email protected] (Z.Z.); [email protected]
Electronic Supplementary Material (ESI) for Materials Horizons.This journal is © The Royal Society of Chemistry 2021

(R.L.); [email protected] (C.L.)
Experimental
Materials: Raw arsenic powder (7440-38-2), polyvinylpyrrolidone (PVP) (9003-39-8)
and 1-methyl-2-pyrrolidinone (NMP) (872-50-4) were purchased from Sigma-Aldrich
(Louis, MO, USA). Streptavidin (polyethylene glycol) amine (SA-PEG2k-NH2) (R-
9991-2k) was purchased from Xi’an Ruixi Biotechnology Co., Ltd (Xi’an, China).
Biotinylated anti-PSMA antibody (ab201253), anti-Cdc25A-P antibody (ab277771)
and anti-GPX4 antibody (ab40993) were obtained from Abcam (Cambridge, MA,
USA). Doxorubicin hydrochloride (DOX∙HCl) (25316-40-9) and 3-(4,5-dimethyl-2-
thiazolyl)-2,5-diphenyl-2-H- tetrazolium bromide (MTT) (298-93-1) were purchased
from Aladdin (Shanghai, China). Deferoxamine mesylate (DFOM) (S5742),
ferrostatin-1 (Fer-1) (S7243), liproxstatin-1 (S7699), necrostatin-1 (S8037) and 5,5′-
dithiobis (2-nitrobenzoic acid) (DTNB) (S276401) were obtained from Selleck
(Houston, USA). Phosphate-buffered saline (PBS) (C0221A), Z-VAD-FMK (C1202),
4′,6-diamidino-2-phenylindole (DAPI) (C1002), vitamine E (S0079), glutathione
(GSH) (S0073), N-Acetyl-L-cysteine (NAC) (ST1546), anti-p53 antibody (AF0255),
anti-p21 antibody (AF021), anti-FLAG Tag antibody (AF0036), anti-β-actin antibody
(AF5003), anti-Chk2-P antibody (AC508), anti-Cdk2-P antibody (AF2317), anti-
ATM antibody (AF1399) and anti-PUMA antibody (AF0270) were purchased from
Beyotime (Jiangsu, China). RPMI-1640 medium (ATCC) (A1049101) and fetal
bovine serum (FBS) (A12483020) were obtained from Gibco (Gaithersburg, MD,
USA). C11-BODIPY581/591 (D3861) and 2′,7′-dichlorofluorescin diacetate (DCFH-DA)
(C2938) and 100 units/mL penicillin/streptomycin (10378016) were purchased from
Thermo Fisher (Waltham, MA, USA). DyLight 649 AffiniPure goat anti-rabbit IgG
(H+L) (A23620) was purchased from Abbkine (California, USA).

Synthesis of Samples: A simple liquid exfoliation technique was used to prepare
ANs. In brief, 100 mg of raw AS powder was ball-milled into powder for 30 min and
then dispersed in a 50 mL sealed conical tube holding mixture liquid that included 20
mL of NMP, 10 mL of ethanol and 400 mg of PVP. Subsequently, the AS powder
solution was treated with an ultrasound probe for 5 hours in ice-bath. The ultrasound
probe worked for 3 s with an interval of 3 s at a power of 500 W. Afterwards, the
solution was continuously sonicated in an ultrasonic bath for another 5 h at a power of
300 W in an ice bath. The resulting solution was centrifuged for 15 min at 5,000 rpm,
and the supernatant including ANs was gently transferred to a new tube. Then, the
ANs solution was centrifuged for 20 min at 10,000 rpm to obtain the precipitate, and
the precipitate was washed with DI water three times. The final ANs were
resuspended in deionized (DI) water and stored at 4 °C in dark environment for future
use.
Surface Modification of ANs: To improve the water dispersibility and
biocompatibility of ANs, SA-PEG-NH2 was utilized to coat their surface, and 1 mg of
the ANs was mixed with 5 mg of SA-PEG-NH2 in 10 mL of H2O. The mixture
solution was sonicated in an ultrasonic bath for 10 min and then stirred overnight at 4
°C. The excess PEG molecules were removed by centrifugation at 10,000 rpm for 20
min and repeated water rinsing to obtain SA-PEG-ANs (PANs). Additionally, to
increase the tumor-targeting capacity, a biotinylated PSMA antibody (Biotin-PSMAA)
was used to modify PANs. 1 mg of BPSMAA was mixed with 3 mg of PANs in 10 ml
of DI H2O. The mixture solution stirred overnight at 4 °C. The solution was then
centrifuged at 12,000 rpm for 20 min to obtain a precipitate. Next, the precipitate was
washed three times with H2O to obtain PSMA-PGE-ANs (PMANs), which were
resuspended in DI water and stored in the dark at 4 °C for future use.
Drug Loading and Release: For DOX loading, the prepared PMANs (0.2 mg/mL)
were dispersed into PBS at pH = 8.0 and then mixed with DOX tofinal DOX
concentrations of 0.2, 0.4, 0.6, 0.8, and 1 mg/mL. After stirring at room temperature
for 24 h, centrifuging at 12,000 rpm for 20 min and washing with DI water three times,

the resulting PMANs/DOX were obtained. PMANs/DOX were redispersed in DI
water and stored at 4 ℃. The absorbance (490 nm) of different standard
concentrations of DOX was used to formulate the standard curve of absorbance-
concentration. The concentration of unbound DOX in the supernatant was calculated
via the above standard curve, allowing the mass of loaded DOX to be calculated.
To evaluate DOX release kinetics, 1 mL of PMANs/DOX solution was packaged
in a dialysis bag (MWCO = 14 kDa) and then incubated in 9 mL PBS at different pH
values (5.0, 6.5 and 7.4) and with GSH (5.0 mM). At different time points, 0.1 mL of
the solution outside the dialysis bag was collected to measure absorbance (490 nm) to
determine the concentrations of released DOX.
Structural and Physical Characterizations: TEM images were obtained by a
transmission electron microscope operated at 200 kV to observe the morphology of
the ANs and PMANs (Hitachi HT7700). High-resolution TEM (HRTEM) was
performed on a Talos F200S system (Thermo Fisher Scientific). MFP-3D-S atomic
force microscopy (AFM) was applied to characterize the morphology of PMANs on
Si/SiO2 substrates (Asylum Research, USA). Fourier transform infrared (FT-IR)
spectra were used to confirm the chemical compositions of ANs and PMANs (Nexus
470, Nicolet, Madison, WI, USA). The structure of ANs and PMANs was analyzed by
Raman spectroscopy (HORIBA JOBIN YVON, France). Energy dispersive
spectroscopy (EDS) was used to analyze the elements in the PMANs sample. UV-vis
spectra were obtained using an Infinite M200 PRO spectrophotometer. The size
distribution was evaluated using a Zetasizer Nano ZS90 (Malvern Instruments,
Malvern, UK). X-ray photoelectron spectroscopy (XPS) was performed using a
Thermo Scientific ESCALAB 250 Xi XPS system. The As ion concentration was
determined by inductively coupled plasma mass spectrometry (ICP-MS) (NexION
300XX, PerknElmer, USA).
Preparation of FITC labeling of PEGylated ANs and PMANs: For FITC labeling,
the prepared PEGylated ANs and PMANs (2mg) were dispersed into PBS at pH = 8.0
and then mixed with FITC (10mg). After stirring at room temperature for 24 h,
centrifuging at 12,000 rpm for 20 min and washing with ethanol two times and DI
water two times, the resulting PEGylated ANs-FITC and PMANs-FITC was obtained.
ANs-FITC and PMANs-FITC were re-dispersed in DI water and dark at 4 ℃.
Cell Culture: PSMA positive PC3 human prostate cancer cell lines (PC3-PSMA
(+)) and PSMA negative PC3 human prostate cancer cell lines (PC3-PSMA (-)) were
purchased from Hanbio Biotechnology Co., Ltd. PC3 cells were cultured in RPMI-
1640 medium supplemented with 10% fetal bovine serum and 100 units/mL
penicillin/streptomycin at 37 °C in a 5% CO2 incubator.
Observations of Cellular Uptake Behavior: PC3-PSMA (+) cells were seeded in a
48-well plate dish. When the density reached 80–90%, free DOX, ANs/DOX and
PMANs/DOX were respectively added at an equivalent DOX dose (5 μg/mL) for
various time periods (2 h, 4 h and 8 h). Additionally, PMANs/DOX were added and
cultured at various concentrations (PMANs = 0, 20, 40 and 80 μg/mL) for 8 h. Then,
the cells were washed with PBS three times and nuclei were stained with DAPI. The
fluorescence of DOX (emission range 500 to 700 nm) was achieved by using a 488
nm laser.
Quantification of Tumor Uptake Effect: PC3-PSMA (+) cells were seeded in a 6-
well plate dish for flow cytometry analysis. When the cell density reached 80–90%,
PEGylated ANs/DOX and PMANs/DOX were added at equivalent DOX doses (5
μg/mL) for various time periods (2 h, 4 h and 8 h). Additionally, the cells were
incubated with PEGylated ANs/DOX and PMANs/DOX at various concentrations
(ANs = 0, 20, 40 and 80 μg/mL) for 8 h. Finally, the cells incubated with PEGylated
ANs-FITC and PMANs-FITC at various concentrations (ANs = 0, 20, 40 and 80
μg/mL) for 6 h. Then, the cells were washed with PBS three times and dispersed in
500 μL of PBS. low cytometry was used to collect the fluorescence intensity of the
cells, and the fluorescence intensity was determined using flowJo software.
In Vitro Therapy Experiments: To test the toxicity of free DOX, ANs, ANs/DOX,
PMANs and PMANs/DOX (DOX: 2 μg/mL, As ions: 20 μg/mL), PC3-PSMA (+)

cells were precultured in 96-well plates (approximately 6000-10000 per well) for 20-
24 h. Drugs including free DOX, ANs, ANs/DOX, PMANs and PMANs/DOX were
added to each well. PC3-PSMA (+) cells were cultured for another 20-24 h. The
medium was removed and MTT reagent (5 mg/mL) was added and incubated at 37 ℃
for 4 h. The MTT solution was removed from all samples and 200 μL of dimethyl
sulfoxide (DMSO) were added to dissolve the formazan crystals. The absorbance in
each well was measured by a microplate reader at test wavelength of 490 nm.
In Vitro Cell Viability of PC3 Cells after Treatment with Various Inhibitors: PC3-
PSMA (+) cells were seeded on a 96-well plate (approximately 6000-10000 per well)
for 20-24 h. Ferroptosis inhibitors, including ferrostatin-1, liproxstatin-1, DFOM,
GSH, VE and NAC, a necroptosis inhibitor (Necrostatin-1) and an apoptosis inhibitor
(Z-VAD-FMK) were separately added to the appropriate wells, and then PMANs
were added to inhibitor-treated cells after 1 h. After cells were cultured for another
20-24 h, MTT solution was used to measure cell viability at test wavelength of 490
nm.
Intracellular GSH Assay: PC3-PSMA (+) cells were seeded in a 24-well plate.
When the cell density reached 80-90%, the cells were incubated with PMANs for 0, 2,
4 and 8 h at 80 μg/mL or with PMANs at 0, 20, 40 and 80 μg/mL for 8 h. A
glutathione assay kit (Catalog number: S0053, Beyotime, Jiangsu, China) was used to
measure the content of cellular GSH and GSSG according to the instructions. A
microplate reader was used to measure absorbance at 412 nm.
Intracellular GPX4 Activity Assay: PC3-PSMA (+) cells were seeded in a 24-well
plate. When the cell density reached 80-90%, the cells were incubated with PMANs
for 0, 2, 4 and 8 h at 80 μg/mL or with PMANs at 0, 20, 40 and 80 μg/mL for 8 h. A
glutathione peroxidase assay kit (Catalog number: S0056, Beyotime, Jiangsu, China)
was used to measure the activity of cellular GPX4 according to the instructions. A
microplate reader was used to measure absorbance at 340 nm.
In Vitro ROS Assay: An ROS sensitive probe, DCFH-DA, was used to measure
the ROS levels. PC3-PSMA (+) cells were seeded on a 24-well plate (approximately
60000-100000 per well). When the cell density around reached 80%, the cells were
incubated with PMANs for 0, 2, 4 and 8 h at 80 μg/mL or with PMANs at 0, 20, 40
and 80 μg/mL for 8 h. The cells were washed one time and then stained by DCFH-DA
(10 μM) and DAPI and incubated for 15 min. Flow cytometry was used to collect the
fluorescence intensity of the cells in FITC channel by using a 488 nm laser, or the
CLSM unit was used to obtain fluorescence images of the cells.
In Vitro Lipid Peroxide Assay: C11-BODIPY581/591 is a lipid peroxide sensitive
probe, and was used to measure lipid peroxides. PC3-PSMA (+) cells were seeded on
a a 24-well plate (approximately 60000-100000 per well). When the cell density
around reached 80%, the cells were incubated with PMANs for 0, 2, 4 and 8 h at 80
μg/mL or with PMANs at 0, 20, 40 and 80 μg/mL for 8 h. The cells were washed once
and then stained by C11-BODIPY581/591 (2 μM) and incubated for 30 min. Similarly,
nuclei were also stained with DAPI. Flow cytometry was used to collect the
fluorescence intensity of the cells in the FITC channel by using a 488 nm laser, or the
CLSM unit was used to obtain fluorescence images of the cells.
In Vitro GSH Depletion Assay: DTNB solution was applied as a probe to detect
GSH levels. The solutions including PMANs (80 μg/mL) and GSH (5 mM) were
incubated at 37°C with shaking for different durations (0 h, 1 h, 2 h, 4 h, 6 h, 8 h and
12 h). Then the solutions were centrifuged at 10000 rpm for 15 min, and each
supernatant was collected and coincubated with DTNB solution (4 mg/mL) at room
temperature for 5 min. Finally, the absorbance peaks of the yellow product TNB at
412 nm were measured by a microplate reader.
Western Blot Analysis: PC3-PSMA (+) cells were seeded in a 24-well plate dish
for 20-24 h. Various concentrations of PMANs (0, 20, 40 and 80 μg/mL) were added
and cultured for another 20-24 h or at 80 μg/mL cultured for 0, 2, 4 and 8 h.
Afterwards, the cells were washed with PBS three times, and total protein lysates
were extracted by RIPA buffer. The protein concentration was measured by the BCA
method. The samples were analyzed in a 5%-15% sodium dodecyl sulfate

polyacrylamide gel electrophoresis (SDS-PAGE), based on the molecular weight of
protein.
Overexpressing GPX4 in PC3 Cells: A cDNA of GPX4 (GeneBank ID:
NM_002085.3, Hanbio Biotechnology Co., Ltd.) was transiently transfected into PC3-
PSMA (+) cells by using Lipofectamine 3000 (Catalog number: L3000075, Thermo
Fisher, USA) in Opti-MEM (Catalog number: 31985088, Thermo Fisher, USA)
according to the instructions. The cell biological changes were analyzed 48 h post
transfection, including cell viability, ROS and LPO accumulation.
Cell Death Assay: Cell death was analyzed with the Annexin V-FITC Apoptosis
Detection Kit (Catalog number: C1062M, Beyotime, Jiangsu, China) and detected by
flow cytometry (Beckman Coulter, USA). PC3-PSMA (+) cells were seeded into 12-
well culture plates at a density of 1.5 × 10⁶ cells per well overnight. PC3-PSMA (+)
cells were then treated with DOX, PMANs, and PMANs/DOX (DOX: 2 μg/mL, AS:
20 μg/mL) for 20 hours. PC3-PSMA (+) cells were harvested and washed by PBS one
time. Afterwards, cells were stained with 5 μL of annexin V–FITC and 5 μL of
propidium iodide for 20 min in the dark at 37 ℃. Last, cells death was detected by a
flow cytometer (Beckman Coulter, USA) within 1 hour.
Animal Tumor Models: BALB/c nude mice (4 -5 weeks old, approximately 20 g
body weight) were purchased from the Animal Experiment Center of Nanjing
University (Nanjing, China), and used to establish tumor xenografts. The PC3-PSMA
(+) cells were washed with PBS twice and harvested by 0.05% EDTA, and then
redispersed in 50% matrigel diluted in PBS buffer. In 150 μL 50% matrigel, PC3-
PSMA (+) cells at a density of 1×10⁷/150 μL were injected into dorsal subcutaneous
region to establish a tumor model. The experimental protocols were designed by
referring to the National Institutes of Health animal care guidelines (Office of Animal
Care and Use), in which the relevant critical guidelines (such as Diet Control in
Laboratory Animals; Pain and Distress in Laboratory Animals: Responsibilities,
Recognition, and Intervention; Endpoints in Animal Study Proposals, etc.) were
approved by the Institutional Animal Care and Use Committees (IACUC) of our

institution (Anhui Medical University). The animal studies were conducted by strictly
following the protocols reviewed and approved by the IACUC of Anhui Medical
University (Case number: LLSC20200741).
In Vivo Pharmacokinetic and Biocompatibility Assay: For pharmacokinetic
evaluation, BALB/c mice were injected with a PMANs solution via tail vein (100 μL,
50 μg per mouse), and PBS was injected as a control. Blood samples (20 μL) were
collected at predestined time intervals (0.5, 1, 2, 4, 6, 8, 12 and 24 h). The amounts of
As ions were quantitatively determined by ICP-MS. For in vivo biocompatibility
evaluation of PMANs, BALB/c mice were injected with PMANs solution via tail vein
(100 μL, 50 μg per mouse), and PBS was injected as a control. At predetermined time
points (2, 8 and 24 h), the mice were sacrificed, and the organs were harvested,
including the heart, liver, spleen, lung and kidney. The amounts of As ions in various
organs were quantitatively determined by ICP-MS. Additionally, we compared the
differences between raw arsenic powders and PMANs in healthy ICR mice to
understand the pharmacokinetics and distribution. Healthy ICR mice were injected
with raw arsenic powders dispersed in PEG300 and PMANs solution (As ions: 3
mg/kg) via the tail vein. Blood samples (20 μL) were collected at predetermined time
intervals (0.5, 1, 2, 4, 8, 12 and 24 h). The amounts of As ions were quantitatively
determined by ICP-MS. Furthermore, after the initial drug exposure (As ions: 3
mg/kg), the ICR mice were sacrificed at predetermined time points (1, 3 and 5 weeks),
and the organs, including the heart, liver, spleen, lung and kidney, were harvested.
The amounts of As ions in various organs were quantitatively determined by ICP-MS
to determine the concentration change in As ions in the organs.
In Vivo Anticancer Efficacy and Safety Evaluation: To investigated the efficiency
of the tumor-killing effect, when the average tumor volume reached approximately
150 mm3, tumor-bearing mice were divided into five groups that were intravenously
administered PBS, free DOX (DOX: 2 mg/kg), ANs (As ions: 2 mg/kg), PMANs (As
ions: 2 mg/kg) and PMNAs/DOX (DOX: 2 mg/kg, As ions: 2 mg/kg). Body weights
and relative tumor volumes (V) were measured every 2 days after the treatment until

day 14. Tumor volumes were calculated by V=L*W2/2, where L is the longest tumor
diameter and W is the shortest tumor diameter (millimeters). After 14 days, the mice
were sacrificed, and the organs and tumor tissue were harvested for hematoxylin-
eosin (H&E) staining. To further evaluate the safety of different drugs in vivo, the
serum levels of urea nitrogen (BUN), serum creatinine (Cr), alanine aminotransferase
(ALT) and aspartate transaminase (AST) were analyzed using ELISA kits (Catalog
number: C013-2-1, C011-2-1, C009-2-1, C010-2-1, respectively, Nanjing Jiancheng
Bioengineering Institute, Jiangsu, China). The blood of mice was collected to measure
the hematological indexes by an auto hematology analyzer (BC-6000, Mindray,
China).
Furthermore, long-term toxic profiles of raw arsenic powders and PMANs
administered to healthy ICR mice at various i.v. amounts were closely monitored for
over 30 days after the initial drug exposure. Healthy ICR mice were injected with
different concentrations of raw arsenic powders dispersed in PEG300 and PMAN
solution via the tail vein (As ions: 1.5 mg/kg, 3 mg/kg and 6 mg/kg). After the initial
drug exposure, the ICR mice were sacrificed at predetermined time points (1, 3 and 5
w), and the organs were harvested for H&E staining. To further evaluate the long-
term safety in vivo, the serum levels of BUN, CRE, ALT and AST were analyzed
using ELISA kits. The blood of mice was collected to measure the hematological
indexes by an auto hematology analyzer (BC-6000, Mindray, China).
In Vivo Ferroptosis Evaluation: To study the mechanism of ferroptosis induced by
arsenic in vivo, tumor-bearing mice were intravenously administered with PBS, free
DOX (DOX: 2 mg/kg), ANs (As ions: 2 mg/kg), PMANs (As ions: 2 mg/kg) and
PMANs/DOX (DOX: 2 mg/kg, As ions: 2 mg/kg). After 14 days, the mice were
sacrificed, and the tumor tissues were harvested for TUNEL staining (Catalog number:
C1089, Beyotime, Jiangsu, China) and immunohistochemical (IHC) staining of GPX4,
SLC7A11 and ATM.
Statistical Analysis: All results were expressed as the means ± SD as indicated.
Student’s t test was used for the comparison of differences between two groups, while

one-way analysis of variance (ANOVA) was applied to evaluate the statistically
significant differences among multiple groups. All statistical analyses were performed
using SPSS 19.0 (SPSS Inc., Chicago, IL). The threshold for statistical significance
was P < 0.05.

Fig. S1 XPS survey spectrum (a) of raw arsenic powders (AS) and TEM images of
AS (b and c) and ANs that were exfoliated in NMP (d).
Fig. S2 The sizes of ANs (a) and PMANs (b).

Fig. S3 AFM image (a) and height profiles along the red lines in (a) (b) of raw arsenic
powders, and UV-vis absorbance of raw arsenic powders (c) and ANs exfoliated in
NMP (d).
Fig. S4 Fourier transform infrared (FTIR) spectra (a) of ANs and PMANs, and energy dispersive spectroscopy (EDS) (b) of PMANs.

Fig. S5 XPS spectra of PMANs at various pH values for 24 h.
Fig. S6 Raman spectrum of raw arsenic powders.

Fig. S7 Photographs of the ANs (a) and PMANs (b) dispersed in DI water under natural light at room temperature for different amounts of time (1 to 7 days) and UV-vis absorbance changes of ANs (c) and PMANs (d).
Fig. S8 UV-vis absorbance of PMANs dispersed in deoxygenated water and the dark for different time points (1 to 7 days).

Fig. S9 TEM images of PMANs at room temperature without GSH (a) and with 10 mM GSH for 12 h (b) and 24 h (c).
Fig. S10 TEM images of PMANs in deoxygenated water and the dark at various pH values for 12 h, 24 h or 48 h.

Fig. S11 UV-vis absorbance of PMANs in deoxygenated water and dark at various pH values for 12 h (a), 24 h (b) and 48 h (c).
Fig. S12 Release profiles of DOX in the absence or presence of GSH.

Fig. S13 CLSM images of DOX in PC3-PSMA (+) cells incubated with DOX, ANs/DOX and PMANs/DOX at the same DOX concentration (DOX: 2 μg/mL). Scale bar: 100 μm.
Fig. S14 The intensity of intracellular DOX in PC3-PSMA (+) cells incubated with ANs/DOX (a) and PMANs/DOX (b) at different incubation times (DOX: 2 μg/mL).

Fig. S15 Fluorescent intensities of PC3-PSMA (+) cells after incubation with FITC-conjugated ANs (a) and FITC-conjugated PMANs (b) at various concentrations.
Fig. S16 Time-dependent GSH depletion by PMANs in solution.

Fig. S17 The original western blot images corresponding to Fig. 4f. M (Marker), prestained protein ladder.
Fig. S18 The expression of SLC7A11, p53 and downstream targets after PMANs treatment.

Fig. S19 The original western blot images corresponding to Fig. S18. M (Marker), prestained protein ladder.
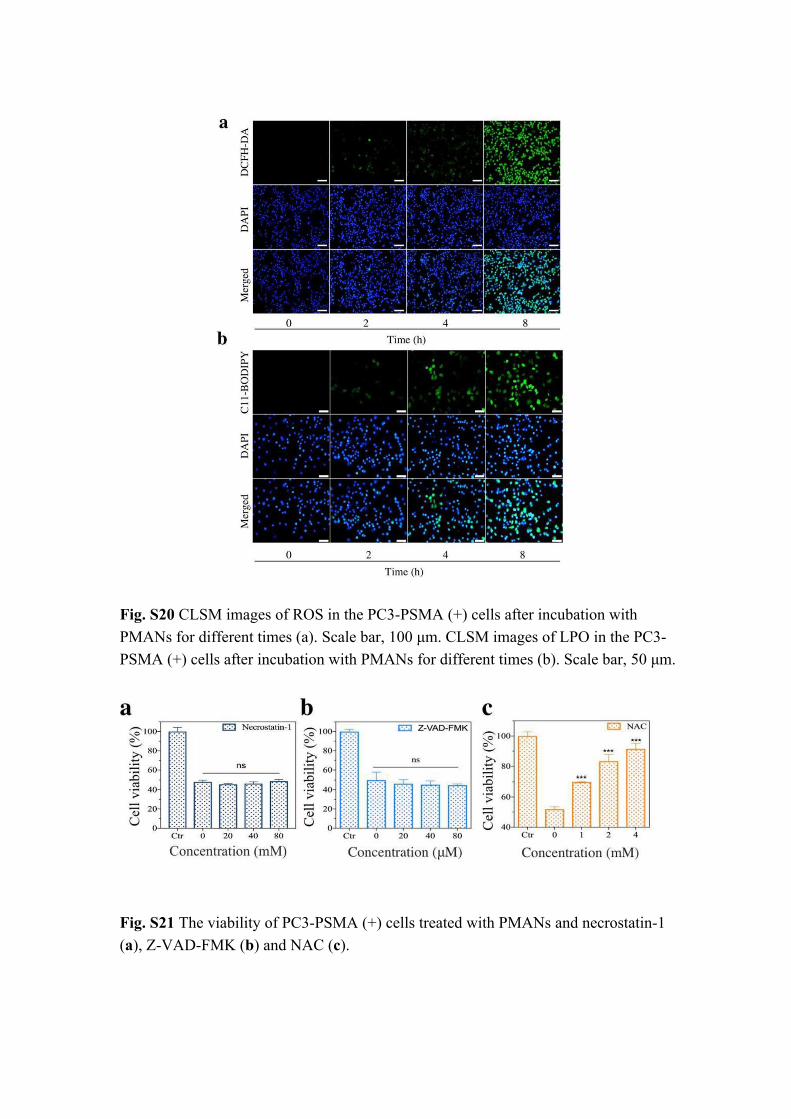
Fig. S20 CLSM images of ROS in the PC3-PSMA (+) cells after incubation with PMANs for different times (a). Scale bar, 100 μm. CLSM images of LPO in the PC3-PSMA (+) cells after incubation with PMANs for different times (b). Scale bar, 50 μm.
Fig. S21 The viability of PC3-PSMA (+) cells treated with PMANs and necrostatin-1 (a), Z-VAD-FMK (b) and NAC (c).
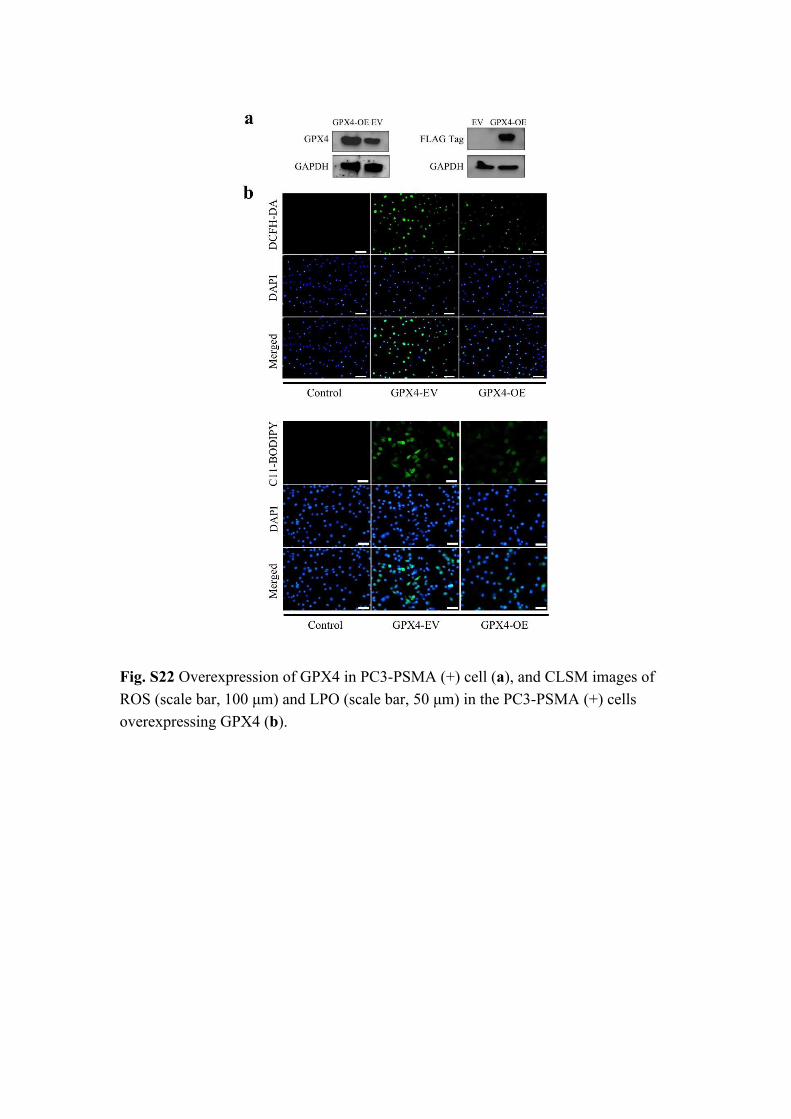
Fig. S22 Overexpression of GPX4 in PC3-PSMA (+) cell (a), and CLSM images of ROS (scale bar, 100 μm) and LPO (scale bar, 50 μm) in the PC3-PSMA (+) cells overexpressing GPX4 (b).

Fig. S23 The original western blot images corresponding to Fig. S22. M (Marker), prestained protein ladder.
Fig. S24 The original western blot images corresponding to Fig. 5d. M (Marker), prestained protein ladder..
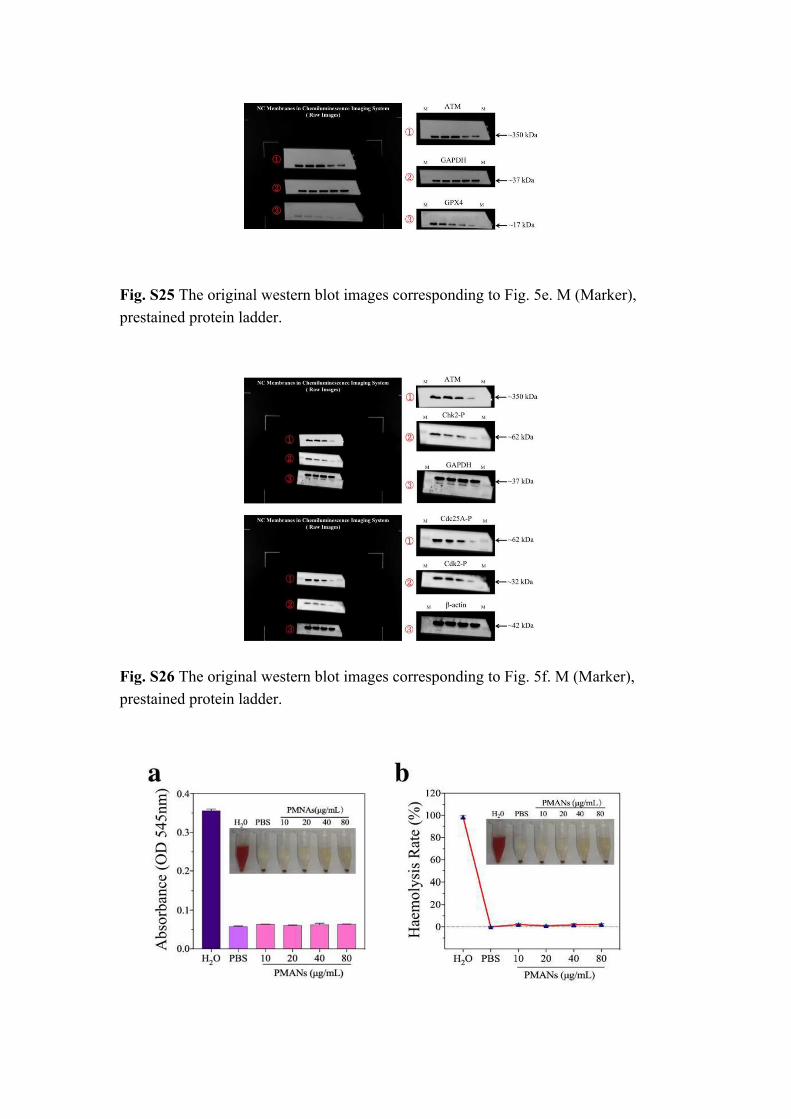
Fig. S25 The original western blot images corresponding to Fig. 5e. M (Marker), prestained protein ladder.
Fig. S26 The original western blot images corresponding to Fig. 5f. M (Marker), prestained protein ladder.

Fig. S27 The absorbance of blood supernatant incubated with PMANs for 8 h (a) and the analysis of the hemolysis rate (b).
Fig. S28 The accumulation of As ions in the major organs (a) or tumors (b) of tumor-bearing nude mice evaluated by ICP-MS at 2, 12 and 24h.

Fig. S29 Histopathological examination of the major organs of tumor-bearing nude mice after intravenous injection of PBS, DOX, ANs, PMANs and PMANs/DOX for 2 weeks. Scale bar, 200 μm.

Fig. S30 Blood urine nitrogen (BUN), creatinine (CRE), aspartate aminotransferase (AST), alanine aminotransferase (ALT) values and hematological parameters of tumor-bearing nude mice after intravenous injection of PBS, DOX, ANs, PMANs and PMANs/DOX for 2 weeks.
Fig. S31 Pharmacokinetic profiles of raw arsenic powders (AS) (a) and PMANs (b) after intravenous injection into ICR mice.
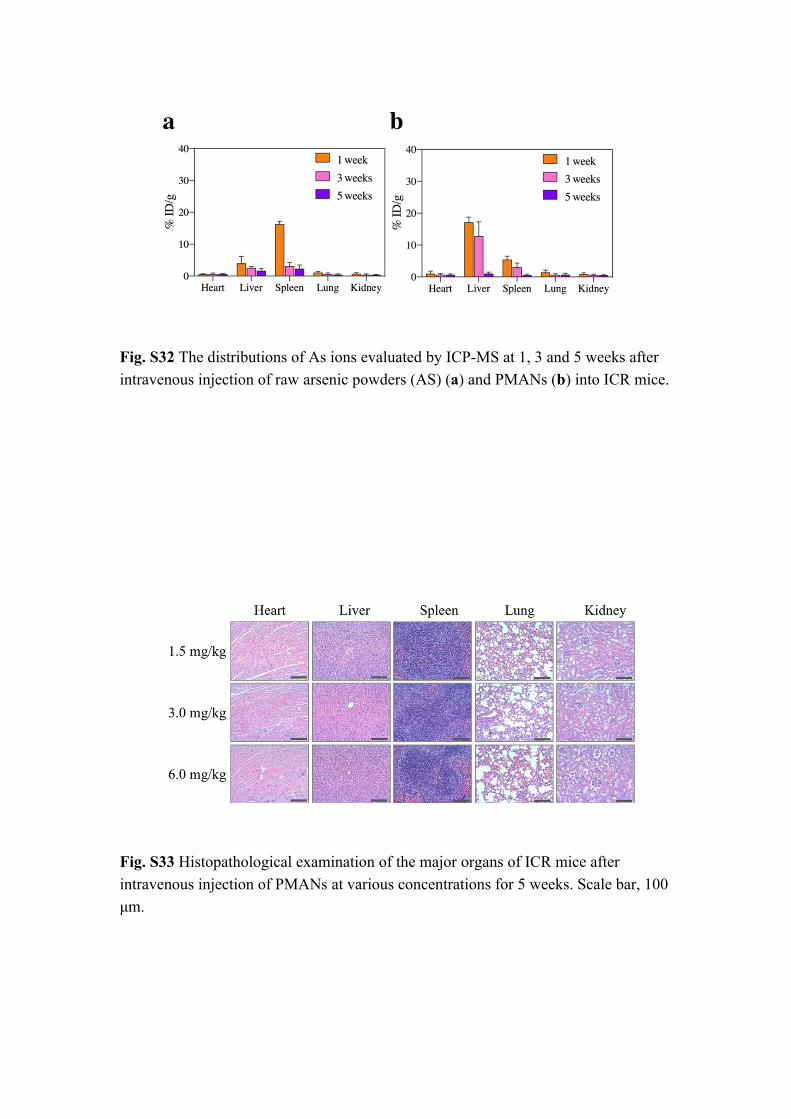
Fig. S32 The distributions of As ions evaluated by ICP-MS at 1, 3 and 5 weeks after intravenous injection of raw arsenic powders (AS) (a) and PMANs (b) into ICR mice.
Fig. S33 Histopathological examination of the major organs of ICR mice after intravenous injection of PMANs at various concentrations for 5 weeks. Scale bar, 100 μm.

Fig. S34 Blood urine nitrogen (BUN), creatinine (CRE), aspartate aminotransferase (AST) and alanine aminotransferase (ALT) values of ICR mice after intravenous injection of raw arsenic powders (AS) or PMANs at various concentrations for 1, 3 or 5 weeks.

Fig. S35 Hematological parameters of ICR mice after intravenous injection of raw arsenic powders (AS) or PMANs at various concentrations for 1, 3 or 5 weeks.