Supplemental Data. Balcke et al. (2017). Plant Cell 10.1105/tpc.17 · Supplemental Data. Balcke et...
28
Supplemental Data. Balcke et al. (2017). Plant Cell 10.1105/tpc.17.00060 Metabolome aqueous phase hydrophilic metabolites (targeted analysis) Metabolome organic phase semi‐polar metabolites (untargeted analysis) Supplemental Figure 1. Venn diagrams of differentially regulated omics signals with a log2-fold change > 1. Supporting Figure 2, 3 and 4. All p-values are reported in Supplemental Dataset 5 for the transcriptome and proteome data, in Supplemental Dataset 1 for the semi-polar metabolites and Supplemental Dataset 3 for the polar metabolites. Red: upregulated in trichome; Blue: upregulated in leaf. Orange circles contain values for S. habrochaites LA 1777 and green circles for S. lycopersicum LA 4024. 369 125 368 407 330 299 205 777 206 831 153 490 6 14 17 11 14 13 830 691 1406 1500 909 1741 Transcriptome Proteome
-
Upload
phungtuyen -
Category
Documents
-
view
217 -
download
0
Transcript of Supplemental Data. Balcke et al. (2017). Plant Cell 10.1105/tpc.17 · Supplemental Data. Balcke et...

Supplemental Data. Balcke et al. (2017). Plant Cell 10.1105/tpc.17.00060
Metabolome aqueous phase
hydrophilic metabolites (targeted analysis)
Metabolome organic phase
semi‐polar metabolites (untargeted analysis)
Supplemental Figure 1. Venn diagrams of differentially regulated omics signals with a log2-fold change > 1. Supporting Figure 2, 3 and 4. All p-values are reported in Supplemental Dataset 5 for the transcriptome and proteome data, in Supplemental Dataset 1 for the semi-polar metabolites and Supplemental Dataset 3 for the polar metabolites. Red: upregulated in trichome; Blue: upregulated in leaf. Orange circles contain values for S. habrochaites LA 1777 and green circles for S. lycopersicum LA 4024.
369
125
368
407
330
299
205
777
206
831
153
490
6
14
17
11
14
13
830
691
1406
1500
909
1741
Transcriptome Proteome
Supplemental Data. Balcke et al. (2017). Plant Cell 10.1105/tpc.17.00060
Supplemental Figure 2. Total GC-MS and LC-MS ion chromatograms from S. habrochaites LA1777 and S. lycopersicum LA4024 extracts. Supporting Figure 2. A) Hexane surface extracts measured by GC-MS; B) methanolic extracts of brushedGT measured by (-)ESI-LC-MS.
1 – 4 monoterpenes 5 – 9 sesquiterpenes10 – 11 sesquiterpene carboxylic acids
Intensity
2.0109
1.0109
.
LA 4024
.
5.0108 .
LA 1777
LA 4024
LA 1777
1 – 8 acyl sugars9 – 10 sesquiterpene carboxylic acids
1 2
3
9
4
5
6
7
8
2
9
10 11
.
rutin
6
. .
7
8
1
16 24
3
4 5
A
8
10
B
1.0107
5.0106
0
Intensity
Time, min

Supplemental Data. Balcke et al. (2017). Plant Cell 10.1105/tpc.17.00060
Supplemental Figure 3. Fatty acid and oxylipin peak areas from trichome and trichome-free leaf extracts. Supporting Figure 2. A: long-chain saturated, monounsaturated, and polyunsaturated fatty acids. B: most abundant oxylipins. Data represent averages of n=3 individual extractions.
5.E+01
5.E+02
5.E+03
5.E+04
5.E+05
5.E+06
16:0
16:1
16:2
16:3
16:4
18:0
18:1
18:2
18:3
18:4
20:0
20:1
20:2
20:3
20:4
20:5
1.E+02
1.E+03
1.E+04
1.E+05
1.E+06
1.E+07
1.E+08
1xOH/ 16:11xOH/ 16:2
1xOH/ 16:3
2xOH/ 16:0
2xOH/ 16:1
2xOH/ 16:2
2xOH/ 16:3
3xOH/ 16:1
3xOH/ 16:2
3xOH/ 16:3
3xOH/ 16:4
1xOH/ 18:1
1xOH/ 18:2
1xOH/ 18:3
1xOH/ 18:4
2xOH/ 18:0
2xOH/ 18:12xOH/ 18:2
2xOH/ 18:32xOH/ 18:43xOH/ 18:1
3xOH/ 18:3
3xOH/ 18:4
1xOH/ 20:1
1xOH/ 20:2
1xOH/ 20:3
1xOH/ 20:4
2xOH/ 20:0
2xOH/ 20:1
2xOH/ 20:2
2xOH/ 20:3
2xOH/ 20:4
2xOH/ 20:5
3xOH/ 20:1
3xOH/ 20:3
3xOH/ 20:43xOH/ 20:5
A
B

Supplemental Data. Balcke et al. (2017). Plant Cell 10.1105/tpc.17.00060
Supplemental Figure 4. MS/MS spectra of a peak eluting at 13.8 min with [M-H]: m/z 295.228. Supporting Figure 2 and Supplemental Figure 3. A: trichome LA1777, B: authentic standard for 9-HODE, C: trichome LA4024, D: authentic standard for 13-HODE.
A
B
D
C
100
90
80
70
60
50
40
30
20
10
0
-100
-90
-80
-70
-60
-50
-40
-30
-20
-10
100
90
80
70
60
50
40
30
20
10
0
-100
-90
-80
-70
-60
-50
-40
-30
-20
-10
% in
tens
ity%
inte
nsity
m/z
m/z

Supplemental Data. Balcke et al. (2017). Plant Cell 10.1105/tpc.17.00060
LA1777 TRI LA4024 TRI
LA1777 LVS LA4024 LVS
Supplemental Figure 5. Scores of a principle component analysis comparing 115 selected signals from hydrophilic extracts of leaves (LVS) and trichomes (TRI) of LA1777 and LA4024. Supporting Figure 3. All data are weight-normalized and Pareto-scaled. R2X: Cumulative sum of squares of the entire X explained by principal components 1, 2 and 3 respectively (X = log-normalized peak heights relative to LA1777 leaf matter); Q2(cum): Cumulative fraction of the total variation of X that can be predicted by principal components 1, 2 and 3 respectively for all of its x-variables.
Component R2X Q2(cum)
1 0.379 0.205
2 0.338 0.445
3 0.177 0.733
t[2]
-20-15-10-5051015
-25 -15 -5 5 15t[1]
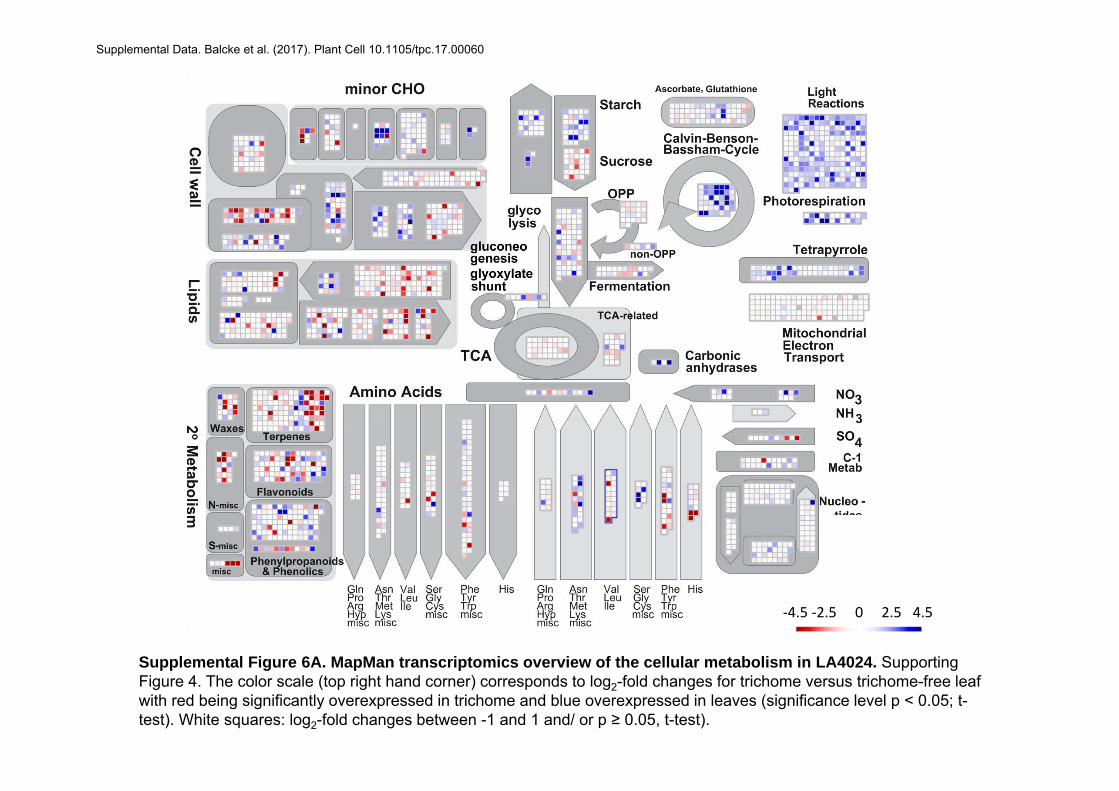
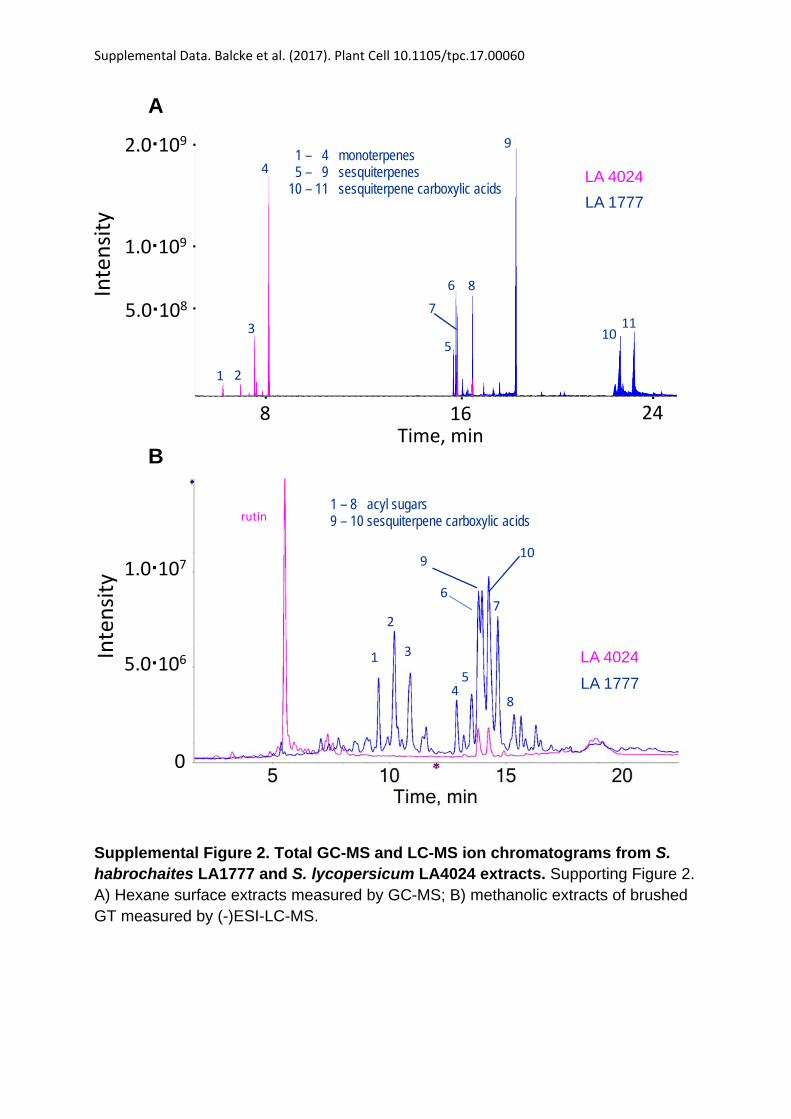
Supplemental Figure 6A. MapMan transcriptomics overview of the cellular metabolism in LA4024. Supporting Figure 4. The color scale (top right hand corner) corresponds to log2-fold changes for trichome versus trichome-free leaf with red being significantly overexpressed in trichome and blue overexpressed in leaves (significance level p < 0.05; t-test). White squares: log2-fold changes between -1 and 1 and/ or p ≥ 0.05, t-test).
‐4.5 ‐2.5 0 2.5 4.5
Supplemental Data. Balcke et al. (2017). Plant Cell 10.1105/tpc.17.00060

Supplemental Figure 6B. MapMan proteomics overview of the cellular metabolism in LA4024. Supporting Figure 4.The color scale (top right hand corner) corresponds to log2-fold changes for trichome versus trichome-free leaf with red being significantly overexpressed in trichome and blue overexpressed in leaves (significance level p < 0.01; t-test). White squares: log2-fold changes between -1 and 1 and/ or p ≥ 0.01; t-test). Gray squares: no information available (protein not detected).
‐4.5 ‐2.5 0 2.5 4.5
Supplemental Data. Balcke et al. (2017). Plant Cell 10.1105/tpc.17.00060

Supplemental Figure 7. MapMan proteomics overview of the cellular metabolism in LA1777. Supporting Figure 4. The color scale (top right hand corner) corresponds to log2-fold changes for trichome versus trichome-free leaf with red being significantly overexpressed in trichome and blue overexpressed in leaves (significance level p < 0.01; t-test). White squares: log2-fold changes between -1 and 1 and/ or p ≥ 0.01; t-test). Gray squares: no information available (protein not detected).
‐4.5 ‐2.5 0 2.5 4.5
Supplemental Data. Balcke et al. (2017). Plant Cell.Supplemental Data. Balcke et al. (2017). Plant Cell.
Supplemental Data. Balcke et al. (2017). Plant Cell.
Supplemental Data. Balcke et al. (2017). Plant Cell 10.1105/tpc.17.00060

Supplemental Data. Balcke et al. (2017). Plant Cell 10.1105/tpc.17.00060
Supplemental Figure 8A. Time course after pulse labeling of LA1777 with 13C-CO2. Supporting Figure 8. Relative isotopolog abundance of 13C-isotopologs in 3-phosphoglycerate, ribulose-1,5-bisphosphate and sucrose. Standard deviations are listed in Supplemental Dataset 8. All data have been corrected for the natural isotopic abundance of 13C-isotopes.
Ribulose‐1,5‐bisphosphate
0%
10%
20%
30%
40%
50%
60%
70%
80%
90%
100%
LVS 10 m
in
LVS 30 m
in
TRI 10 m
in
TRI 30 m
in
C12 1xC13 2xC13 3xC13
LVS 10
min
LVS 30
min
TRI 10 m
in
TRI 30 m
in
C12 1xC13 2xC133xC13 4xC13 5xC13
LVS 10
min
LVS 30
min
TRI 10 m
in
TRI 30 m
in
C12 1xC13 2xC133xC13 4xC13 5xC136xC13 7xC17 8xC139xC13 10xC13 11xC1312xC13
100
90
80
70
60
50
40
30
20
10
0
%
100
90
80
70
60
50
40
30
20
10
0
%
3‐Phosphoglycerate Sucrose
100
90
80
70
60
50
40
30
20
10
0
%

Supplemental Data. Balcke et al. (2017). Plant Cell 10.1105/tpc.17.00060
100
90
80
70
60
50
40
30
20
10
0
Supplemental Figure 8B. Time course after pulse labeling of LA1777 with U 13C-D-glucose. Supporting Figure 8. Relative isotopolog abundance of 13C-isotopologs in 3-phosphoglycerate, ribulose-1,5-bisphosphate and sucrose. Standard deviations are listed in Table 8-SI. All data have been corrected for the natural isotopic abundance of 13C-isotopes.
Ribulose‐1,5‐bisphosphate
0%
10%
20%
30%
40%
50%
60%
70%
80%
90%
100%
LVS 10 m
in
LVS 30 m
in
LVS 120 m
in
LVS 24
h
TRI 10 m
in
TRI 30 m
in
TRI 120 m
in
TRI 24 h
C12 1xC13 2xC133xC13 4xC13 5xC136xC13 7xC17 8xC139xC13 10xC13 11xC1312xC13
100
90
80
70
60
50
40
30
20
10
0
%
3‐Phosphoglycerate Sucrose
0%
10%
20%
30%
40%
50%
60%
70%
80%
90%
100%
LVS 10 m
in
LVS 30 m
in
LVS 120 min
LVS 24 h
TRI 10 min
TRI 30 min
TRI 120 m
in
TRI 24 h
C12 1xC13 2xC13 3xC13
0%
10%
20%
30%
40%
50%
60%
70%
80%
90%
100%
LVS 10 m
in
LVS 30 m
in
LVS 120 m
in
LVS 24 h
TRI 10 m
in
TRI 30 m
in
TRI 120 m
in
TRI 24 h
C12 1xC13 2xC133xC13 4xC13 5xC13
100
90
80
70
60
50
40
30
20
10
0
%
100
90
80
70
60
50
40
30
20
10
0
%
100
90
80
70
60
50
40
30
20
10
0
%

transcripts proteins
leaf LA1777
LA4024
leaf
leaf leaftrichome trichome
trichome trichome
ND
ND
Supplemental Figure 9. Biosynthesis of isoprenoid precursors in leaves andtrichomes of LA4024 and LA1777. Supporting Figure 4. Transcript data are shown inthe left panels with average expression values from the microarray divided by 1000.Protein data are in the right panels with average expression values as normalizedaverage spectral counts. The complete list of abbreviations for enzymes and ofcorresponding genes is provided in Supplemental Table 2. Ac-CoA, acetyl coenzyme A;AcAc-CoA: acetoacetyl coenzyme A; HMG-CoA: 3-hydroxy-3-methylglutaryl coenzyme A;MVA: mevalonic acid; PMVA: phosphomevalonic acid; PPMVA: diphosphomevalonic acid;IPP: isopentenyl diphosphate; DMAPP: dimethylallyl diphosphate; PYR: pyruvate; GA3P:glyceraldehyde-3-phosphate; DXP: 1-deoxy-D-xylulose 5-phosphate; MEP: 2-C-methyl-D-erythritol 4-phosphate; CDP-ME: 4-diphosphocytidyl-2-C-methyl-D-erythritol; CDP-MEP:4-diphosphocytidyl-2-C-methyl-D-erythritol 2-phosphate; MEcPP: 2-C-methyl-D-erythritol2,4-cyclodiphosphate; HMBPP: (E)-4-Hydroxy-3-methyl-but-2-enyl pyrophosphate.
Supplemental Data. Balcke et al. (2017). Plant Cell 10.1105/tpc.17.00060
Supplemental Data. Balcke et al. (2017). Plant Cell 10.1105/tpc.17.00060
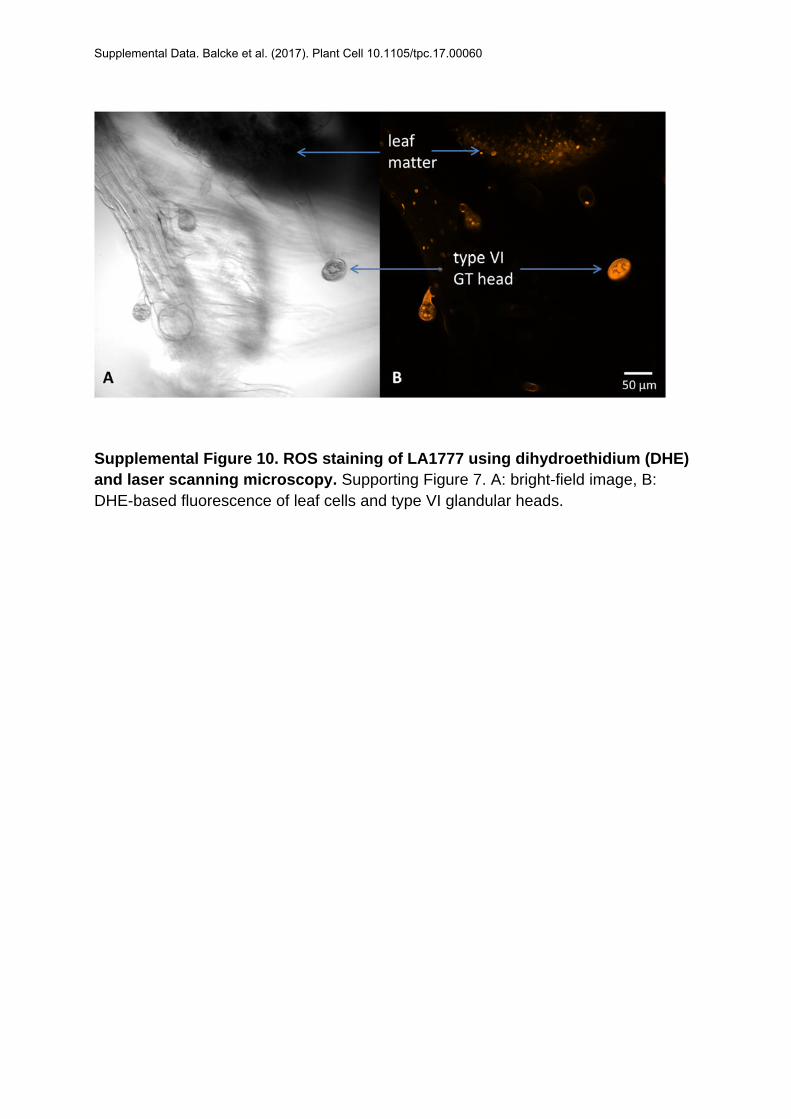
Supplemental Figure 10. ROS staining of LA1777 using dihydroethidium (DHE) and laser scanning microscopy. Supporting Figure 7. A: bright-field image, B: DHE-based fluorescence of leaf cells and type VI glandular heads.
Supplemental Data. Balcke et al. (2017). Plant Cell 10.1105/tpc.17.00060
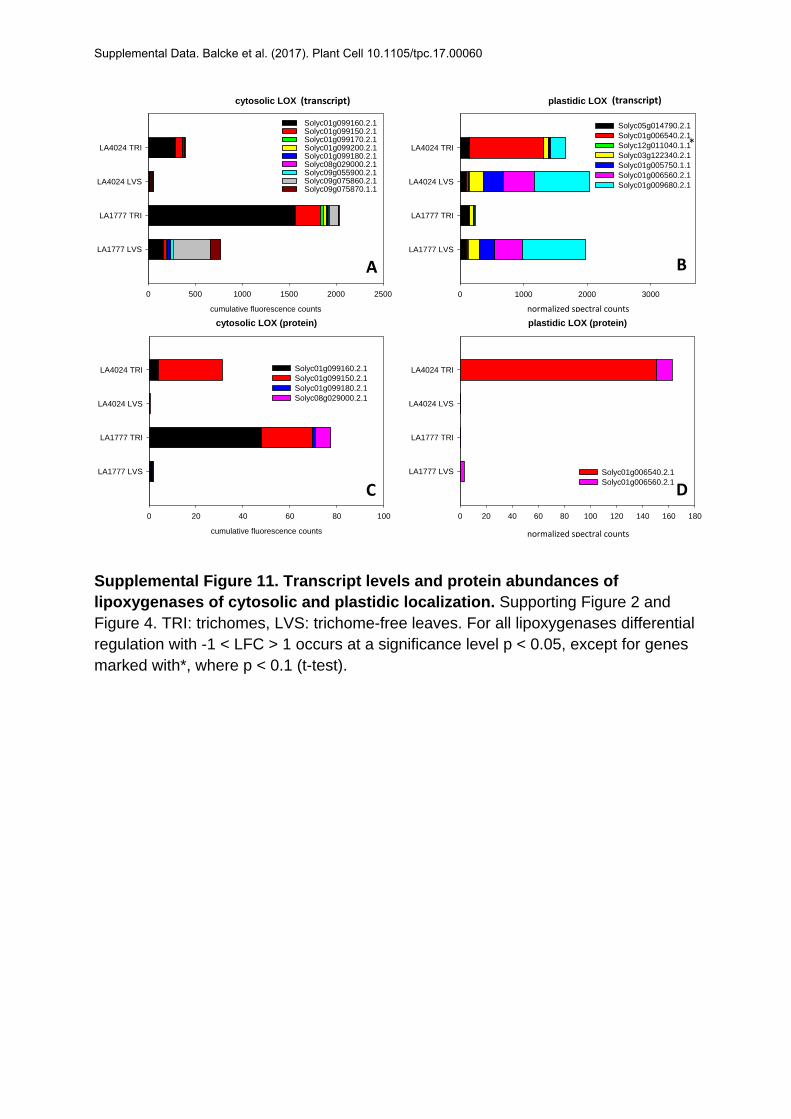
Supplemental Figure 11. Transcript levels and protein abundances of lipoxygenases of cytosolic and plastidic localization. Supporting Figure 2 and Figure 4. TRI: trichomes, LVS: trichome-free leaves. For all lipoxygenases differential regulation with -1 < LFC > 1 occurs at a significance level p < 0.05, except for genes marked with*, where p < 0.1 (t-test).
cytosolic LOX
cumulative fluorescence counts
0 500 1000 1500 2000 2500
LA1777 LVS
LA1777 TRI
LA4024 LVS
LA4024 TRI
Solyc01g099160.2.1 Solyc01g099150.2.1 Solyc01g099170.2.1 Solyc01g099200.2.1 Solyc01g099180.2.1 Solyc08g029000.2.1 Solyc09g055900.2.1 Solyc09g075860.2.1 Solyc09g075870.1.1
plastidic LOX
cumulative fluorescence counts
0 1000 2000 3000
LA1777 LVS
LA1777 TRI
LA4024 LVS
LA4024 TRI
Solyc05g014790.2.1 Solyc01g006540.2.1 Solyc12g011040.1.1 Solyc03g122340.2.1 Solyc01g005750.1.1 Solyc01g006560.2.1 Solyc01g009680.2.1
cytosolic LOX (protein)
cumulative fluorescence counts
0 20 40 60 80 100
LA1777 LVS
LA1777 TRI
LA4024 LVS
LA4024 TRI Solyc01g099160.2.1 Solyc01g099150.2.1 Solyc01g099180.2.1 Solyc08g029000.2.1
plastidic LOX (protein)
cumulative fluorescence counts
0 20 40 60 80 100 120 140 160 180
LA1777 LVS
LA1777 TRI
LA4024 LVS
LA4024 TRI
Solyc01g006540.2.1 Solyc01g006560.2.1
(transcript)(transcript)
A B
C D
normalized spectral counts
normalized spectral counts
*

Supplemental Data. Balcke et al. (2017). Plant Cell 10.1105/tpc.17.00060
Supplemental Figure 12. Differential transcript and protein levels of REDOX enzyme families. Supporting Figure 4. The color scale (top left hand corner) corresponds to log2-fold changes for trichome versus trichome-free leaf with red being overexpressed in trichomes and blue overexpressed in leaves. A and C: differential expression of transcripts. B and D: differential expression of proteins. Gray squares: no information available (gene not represented on the microarray or protein not detected).
A B C D
LA1777 LA4024
Supplemental Data. Balcke et al. (2017). Plant Cell 10.1105/tpc.17.00060
OH
O OH
OO
O
HO
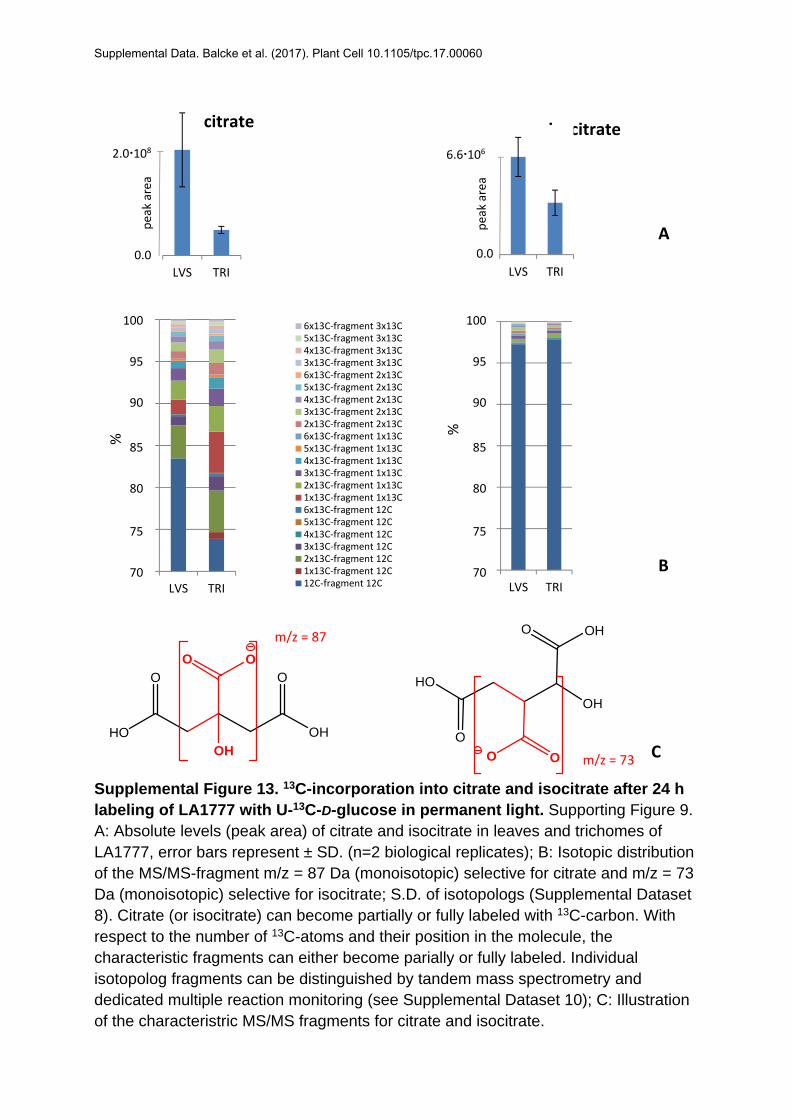
Supplemental Figure 13. 13C-incorporation into citrate and isocitrate after 24 h labeling of LA1777 with U-13C-D-glucose in permanent light. Supporting Figure 9. A: Absolute levels (peak area) of citrate and isocitrate in leaves and trichomes of LA1777, error bars represent ± SD. (n=2 biological replicates); B: Isotopic distribution of the MS/MS-fragment m/z = 87 Da (monoisotopic) selective for citrate and m/z = 73 Da (monoisotopic) selective for isocitrate; S.D. of isotopologs (Supplemental Dataset 8). Citrate (or isocitrate) can become partially or fully labeled with 13C-carbon. With respect to the number of 13C-atoms and their position in the molecule, the characteristic fragments can either become parially or fully labeled. Individual isotopolog fragments can be distinguished by tandem mass spectrometry and dedicated multiple reaction monitoring (see Supplemental Dataset 10); C: Illustration of the characteristric MS/MS fragments for citrate and isocitrate.
LVS TRI
peak area
70%
75%
80%
85%
90%
95%
100%
LVS TRI
6x13C‐fragment 3x13C5x13C‐fragment 3x13C4x13C‐fragment 3x13C3x13C‐fragment 3x13C6x13C‐fragment 2x13C5x13C‐fragment 2x13C4x13C‐fragment 2x13C3x13C‐fragment 2x13C2x13C‐fragment 2x13C6x13C‐fragment 1x13C5x13C‐fragment 1x13C4x13C‐fragment 1x13C3x13C‐fragment 1x13C2x13C‐fragment 1x13C1x13C‐fragment 1x13C6x13C‐fragment 12C5x13C‐fragment 12C4x13C‐fragment 12C3x13C‐fragment 12C2x13C‐fragment 12C1x13C‐fragment 12C12C‐fragment 12C
70%
75%
80%
85%
90%
95%
100%
LVS TRI
O O
OH
O
HO
O
OH
m/z = 87
m/z = 73
citrate
B
C
100
95
90
85
80
75
70
100
95
90
85
80
75
70
% %
isocitrate
A
LVS TRI
peak area
6.61062.0108
0.0 0.0
Supplemental Data. Balcke et al. (2017). Plant Cell 10.1105/tpc.17.00060
A
Supplemental Data. Balcke et al. (2017). Plant Cell 10.1105/tpc.17.00060
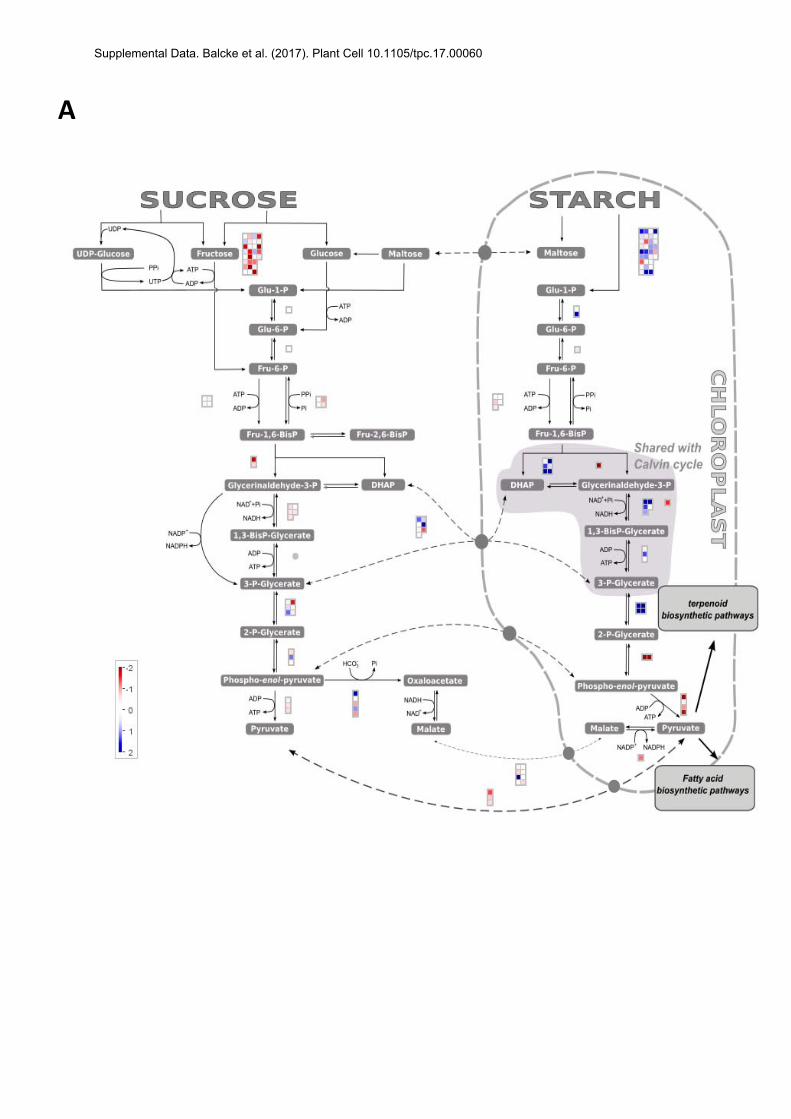
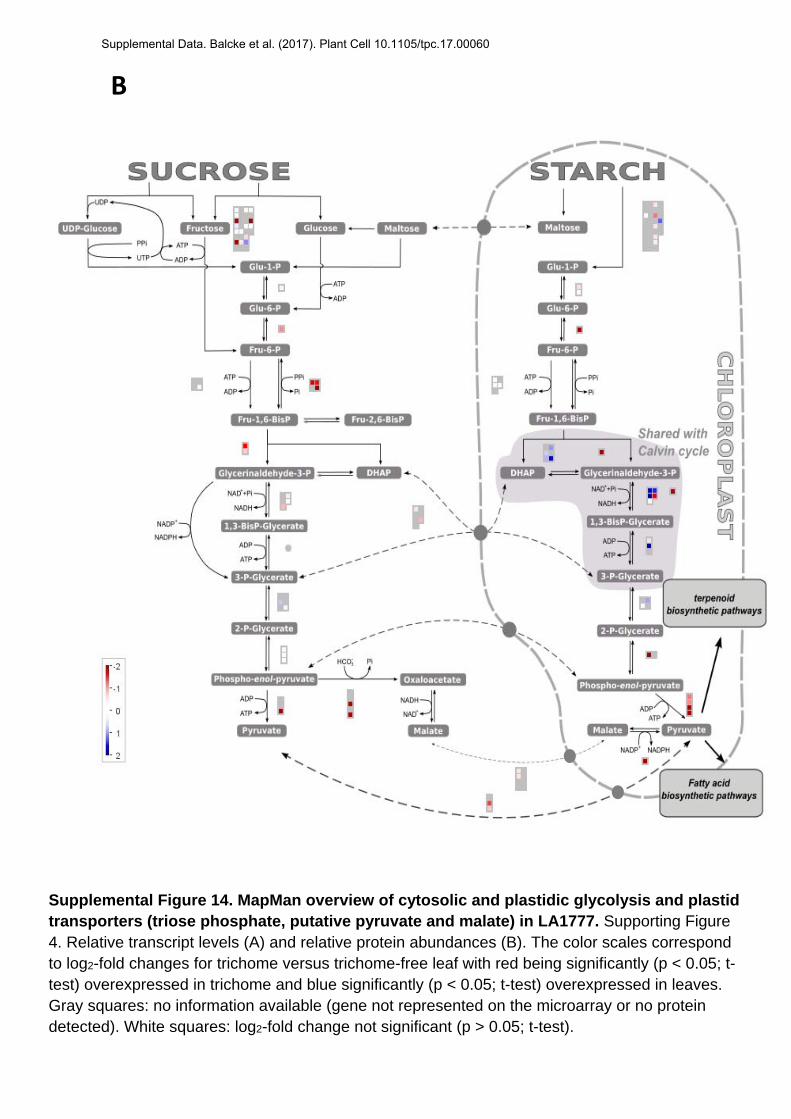
Supplemental Figure 14. MapMan overview of cytosolic and plastidic glycolysis and plastid transporters (triose phosphate, putative pyruvate and malate) in LA1777. Supporting Figure 4. Relative transcript levels (A) and relative protein abundances (B). The color scales correspondto log2-fold changes for trichome versus trichome-free leaf with red being significantly (p < 0.05; t-test) overexpressed in trichome and blue significantly (p < 0.05; t-test) overexpressed in leaves. Gray squares: no information available (gene not represented on the microarray or no protein detected). White squares: log2-fold change not significant (p > 0.05; t-test).
B
plastidial pyruvate symporter
Met-derived -ketoacids symporter
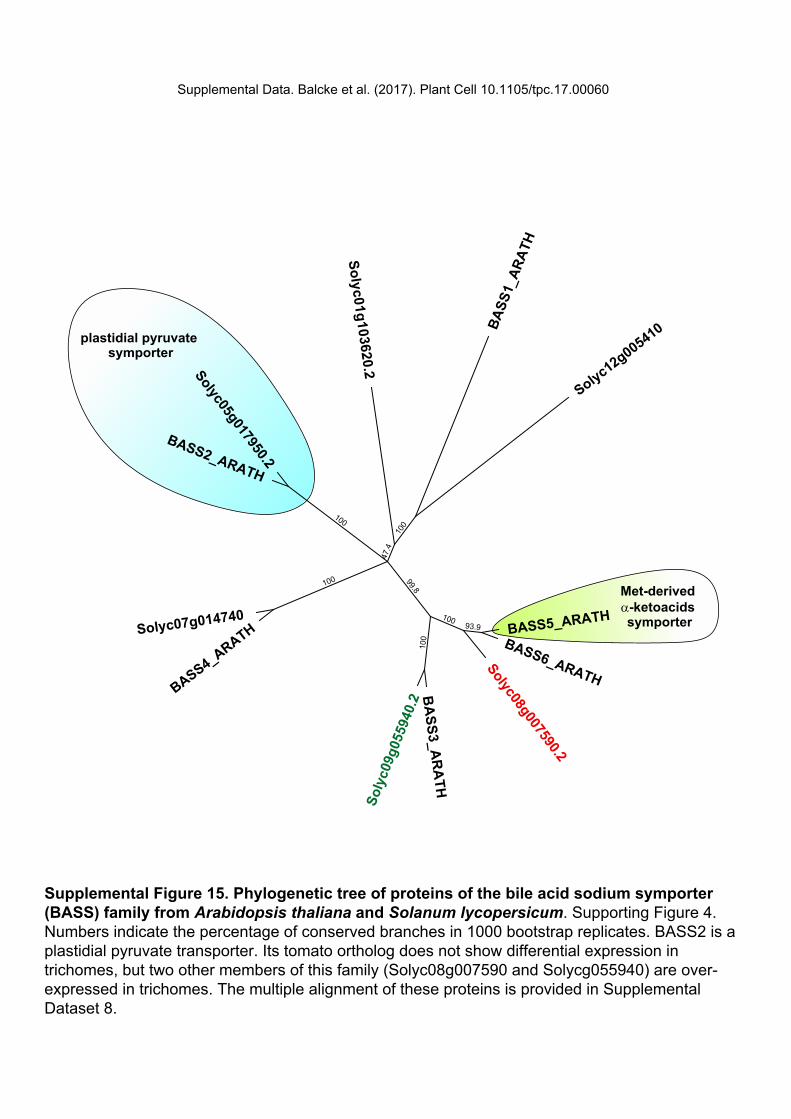
Supplemental Figure 15. Phylogenetic tree of proteins of the bile acid sodium symporter (BASS) family from Arabidopsis thaliana and Solanum lycopersicum. Supporting Figure 4. Numbers indicate the percentage of conserved branches in 1000 bootstrap replicates. BASS2 is a plastidial pyruvate transporter. Its tomato ortholog does not show differential expression in trichomes, but two other members of this family (Solyc08g007590 and Solycg055940) are over-expressed in trichomes. The multiple alignment of these proteins is provided in Supplemental Dataset 8.
Supplemental Data. Balcke et al. (2017). Plant Cell 10.1105/tpc.17.00060
atissier
Schreibmaschinentext
atissier
Schreibmaschinentext

Supplemental Data. Balcke et al. (2017). Plant Cell 10.1105/tpc.17.00060
Supplemental Figure 16. Expression of NADPH-producing enzyme families in GT versus trichome-free leaves. Supporting Figure 4. The color scale (top right hand corner) corresponds to log2-fold changes for trichome versus trichome-free leaf with red being significantly (p < 0.05; t-test) overexpressed in trichome and blue significantly (p < 0.05; t-test) overexpressed in leaves. Gray squares: no information available (gene not represented on the microarray or protein not detected).White squares: no significant change (p > 0.05) A: LA1777 transcript levels; B: LA1777 protein abundances; C : LA4024 transcript levels; D : LA4024 protein abundances.
A B C D
Supplemental Data. Balcke et al. (2017). Plant Cell 10.1105/tpc.17.00060
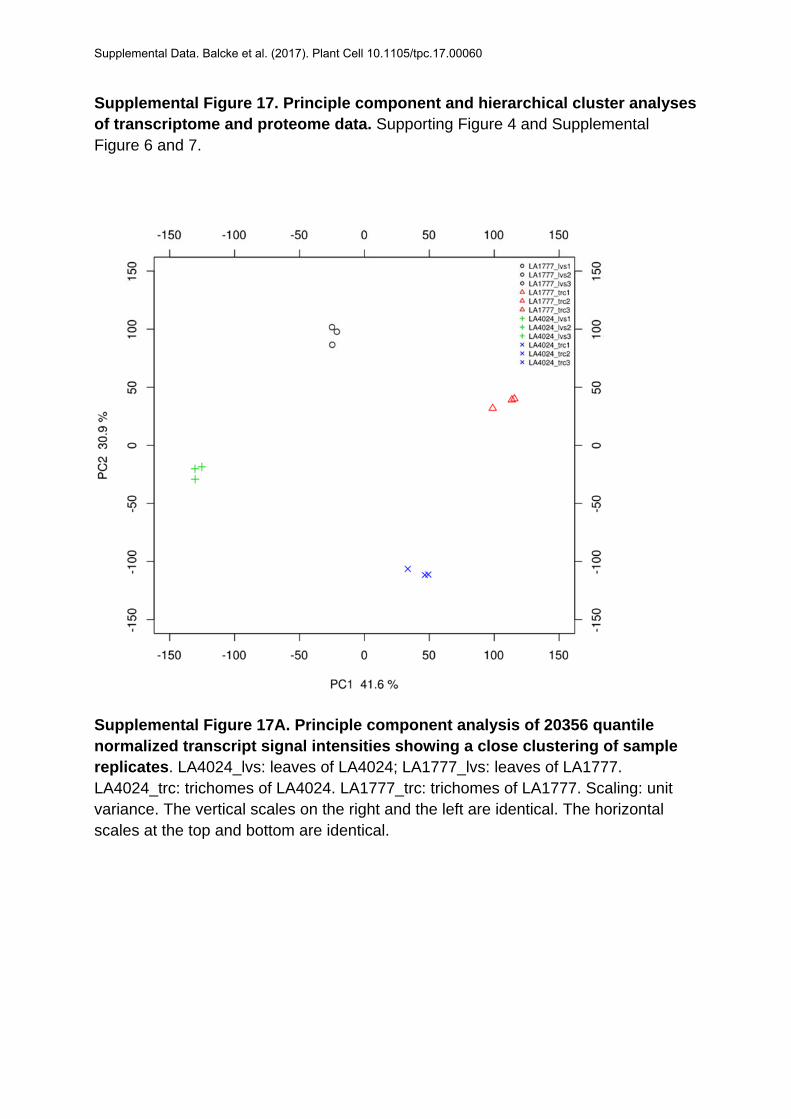
Supplemental Figure 17. Principle component and hierarchical cluster analyses of transcriptome and proteome data. Supporting Figure 4 and Supplemental Figure 6 and 7.
Supplemental Figure 17A. Principle component analysis of 20356 quantile normalized transcript signal intensities showing a close clustering of sample replicates. LA4024_lvs: leaves of LA4024; LA1777_lvs: leaves of LA1777. LA4024_trc: trichomes of LA4024. LA1777_trc: trichomes of LA1777. Scaling: unit variance. The vertical scales on the right and the left are identical. The horizontal scales at the top and bottom are identical.

Supplemental Data. Balcke et al. (2017). Plant Cell 10.1105/tpc.17.00060
Supplemental Figure 17B. Principle component analysis of 4507 log2-normalized protein abundances showing a close clustering of sample replicates. LA4024_lvs: leaves of LA4024; LA1777_lvs: leaves of LA1777. LA4024_trc: trichomes of LA4024. LA1777_trc: trichomes of LA1777. Scaling: unit variance. The vertical scales on the right and the left are identical. The horizontal scales at the top and bottom are identical.

Supplemental Data. Balcke et al. (2017). Plant Cell 10.1105/tpc.17.00060
Supplemental Figure 17C. Hierarchical cluster analysis of 20356 quantile normalized transcript signal intensities showing a close clustering of sample replicates. LA4024_lvs: leaves of LA4024; LA1777_lvs: leaves of LA1777. LA4024_trc: trichomes of LA4024. LA1777_trc: trichomes of LA1777.

Supplemental Data. Balcke et al. (2017). Plant Cell 10.1105/tpc.17.00060
Supplemental Figure 17D. Hierarchical cluster analysis of 4507 log2-normalized protein abundances showing a close clustering of sample replicates. LA4024_lvs: leaves of LA4024; LA1777_lvs: leaves of LA1777. LA4024_trc: trichomes of LA4024. LA1777_trc: trichomes of LA1777.

Supplemental Data. Balcke et al. (2017). Plant Cell 10.1105/tpc.17.00060
Supplemental Table 1. Genes whose expression was verified by qRT‐PCR and corresponding primers
Gene ID Description Functional category 2-ΔCt SE 2-ΔCt SE 2-ΔCt SE 2-ΔCt SE forward reverse
Solyc12g044600 NADP‐dependent malic enzyme, chloroplastic NADPH production 11.84 2.09 49.07 7.55 12.47 1.29 16.53 2.90 CGCAGCCCAAGGACCTAGTCG GCTGCGGTATGCTGGGCTGT
Solyc05g015950 Glucose‐6‐phosphate 1‐dehydrogenase NADPH production 1.63 0.15 5.35 0.82 1.26 0.09 2.45 0.39 TGCTGCTTGGTCTCTTTTCACACCA CGTGCTGCAAGGTAATGTGCTCC
Solyc02g093830 Glucose‐6‐phosphate 1‐dehydrogenase NADPH production 6.18 0.99 5.57 0.99 2.65 0.23 4.00 0.63 ACAAGCCAGGCAGCAGAGGC GCCATGAGTTTGAACGTAACCGGCA
Solyc12g056120 6‐phosphogluconate dehydrogenase decarboxylating NADPH production 1.88 0.19 4.15 0.64 3.15 0.24 3.24 0.51 GGGAGATGGTGCAGAGGCAAGC CGCGGGAAGCCTAGAACGCC
Solyc05g050120 Malic enzyme NADPH production 65.23 12.84 24.13 5.41 21.95 1.66 3.03 0.86 TGGTTTTGGCTTGGTCATGTCTGG TGAGCAGCCAGAGCTTCCGA
Solyc12g099260 ATP citrate lyase a‐subunit Acetyl CoA production 7.92 2.96 9.72 1.98 1.73 0.17 4.31 0.86 GCTGTTGACGATGCTGCCCG TCCTGGCACTCGGATGCCTCT
Solyc01g059880 ATP citrate lyase a‐subunit Acetyl CoA production 2.12 0.31 3.01 0.38 2.47 0.23 4.37 0.70 TGACCAGAAGAGATTGAAGCAGCCA GGGCAGGCAACTTTCTGCCTCT
Solyc07g062650 Malate dehydrogenase Acetyl CoA production 15.39 2.19 11.77 1.52 7.77 0.73 6.72 1.02 AGGAAGTCCTAGGGTTGGGTCCAC GCAGCTCTGGCTTAAGAGCCTCA
Solyc01g073740 Citrate synthase Acetyl CoA production 4.53 0.67 3.65 0.51 1.96 0.13 2.17 0.40 TGGTTTCTCGAGCCTTGTCCCT TGCTGGATCAGCGTGTGAGGA
Solyc12g011000 Citrate synthase Acetyl CoA production 1.65 0.24 2.34 0.47 1.56 0.24 1.99 0.35 CTCGGTCACGTCTCCGTCTCCA TCAGGCCCCTGAACCAGCCA
Solyc02g085350 Succinate dehydrogenase flavoprotein subunit CAC 8.19 0.99 11.15 1.38 8.19 0.54 14.62 2.37 TGGGAGGACGAGAAAGTTCGGCT ACACGAGCCTTTGGTGGGAACG
Solyc09g075450 Fumarate hydratase class II CAC 2.78 0.32 2.04 0.28 1.65 0.21 0.92 0.17 CGCACAAGGAGGGAACCAGTT ACTCTTCACTGGTGAGGACTGC
Solyc01g106780 Pyruvate kinase PYR‐providing 0.33 0.05 11.00 1.99 0.52 0.07 2.56 0.55 CAGACGACATGGAAGGAAACGTTAAGA ATGGACTGGAAAATTGTTCTGGCAGT
Solyc08g066360 Malic enzyme NADPH production 0.39 0.06 4.69 1.04 0.62 0.18 5.38 1.17 CACGTCTCCCTCGTCCTAGCG AGCTGCGGTAGAGTGGAGTGT
Solyc03g114500 Enolase Glycolysis 0.34 0.05 1.42 0.25 0.16 0.02 0.46 0.09 TCTGTCTGTTGGTTTGGCCAGTGGA TTTGCCAGCCGCTCACTCCG
Solyc07g055060 Phosphoenolpyruvate carboxylase 1 CO2 recycling/ fixation 5.25 0.51 8.02 1.70 3.60 1.06 3.03 0.74 TGGAATCAAGCAAACCAGCTGCTGAA CCAGGCGCATACTCGCTCGT
Solyc04g076880 Phosphoenolpyruvate carboxykinase CO2 recycling/ fixation 2.13 0.27 25.21 6.20 1.31 0.30 6.57 1.95 CCCGTGAACACTTGGCCCGA GCCTCCCAGCTTCAACAGGGT
Solyc09g009260 Fructose‐bisphosphate aldolase glycolysis 2.49 0.47 6.70 1.36 1.34 0.14 4.82 1.18 GGTGCAAGGCCAACTCCGAG GCGCCCTCGCTCAAGTTAGA
Solyc12g014380 Glucose‐6‐phosphate isomerase 1 glycolysis 2.55 0.43 2.42 0.33 2.06 0.19 1.89 0.40 GACAGTTACTGGCCATCTACGAGCA TGATACCCCATACGAAGCCTTGGAC
Solyc05g008600 Fructose‐bisphosphate aldolase glycolysis 1.33 0.21 8.45 1.50 3.37 0.26 6.24 1.25 GTTTGTCAAGGGCTACACCTACTAAGC ACACAAAAAGAAAGTCGCATCAAAGCA
Solyc12g095760 Diphosphate‐fructose‐6‐phosphate 1‐phosphotransferase glycolysis 5.76 0.68 4.32 0.82 3.19 0.21 2.62 0.65 GCCTGCTGTGCATCCAGCCA ACTGGAGGGGGCCTGGGTTT
Solyc08g076220 Phosphoribulokinase/uridine kinase calvin cycle 13.80 4.96 1.61 0.42 12.29 3.17 0.71 0.48 TCGTTGCCAGCAGAGCTGGAG ACAGATGATTCTGGGGCCTAGCTGT
Solyc11g008620 Phosphoglycolate phosphatase photorespiration 10.33 4.93 1.84 0.43 10.40 2.98 1.31 0.41 TGCTCAGGAATGGGCAGGTGG AGTGGTTCACGCTTTGTAGAGCC
Solyc07g056540 L‐lactate dehydrogenase photorespiration 102.89 31.13 6.09 2.60 103.90 28.87 5.98 2.35 ACCCCAAGGCTCGGACGTAGA GCTTGGTCCATCTTGCCAAGGTCC
Solyc01g007530 Cytochrome b6 PS‐electron transport 147.46 34.50 32.48 7.30 132.83 40.53 29.26 11.80 ACCATTCATGCCAACTAAACGGGG GTTCAAGTCACACACTCCCATAATCCA
Solyc10g044520 Ferredoxin I PSI‐NADPH prod 126.57 62.12 17.42 7.00 117.63 58.91 12.68 7.70 ACCAAGAAGCTGCTGGATTTGTGC AGCAGTAAGCTCCTCCTCCTTGTGA
Solyc02g083810 Ferredoxin‐NADP reductase PSI‐NADPH prod 8.94 29.77 5.28 6.63 7.35 22.67 2.78 3.45 TGTCTGGGCGGACTACAAGAAGCA TGGATGCAGGGGGAGAGAAGCA
Solyc01g006540 Lipoxygenase lipid oxidation 0.30 0.23 24.66 4.05 0.84 0.57 138.54 47.78 CGGTGGTGCCGGCATTGGAA TGGCCGGAAAATGTGGAAACCCT
Solyc07g049690 Cytochrome P450 lipid oxidation 5.70 2.73 50.64 10.13 9.20 5.25 58.90 25.77 ACTGAATCAAACAAGCAATGTGCTGC TCACAGATGTGAGTGAACCAGATGAGA
Solyc06g073460 Glutathione peroxidase lipid oxidation 11.85 3.02 62.76 14.30 11.37 2.04 40.50 9.50 GGTGTGGCTTGAGCACTACAGGTG GGGGTGGGGTACAAGCTCGC
Solyc01g067740 Superoxide dismutase superoxide dismutase 17.47 2.99 21.56 3.51 16.05 1.99 18.34 4.18 TGACGCCTTTTGAATTGGGGTTGA CCACTGAAAAGCAGCACTACAGTCA
Solyc03g121680 Beta‐fructofuranosidase invertase 0.79 0.73 3.91 1.07 0.33 0.74 0.00 0.00 AGGAAAGGCTTGCATTACAACTAGGGT GCTGTTTTCATGCTCCAAGCAGTCA
Solyc04g081440 Neutral invertase like protein invertase 3.85 0.55 4.88 0.74 3.60 0.45 5.22 1.21 TGGTCCATTGCTGGTTACTTGGTAGC ACCCAAATGAGATGGATCTTCCAGCAT
Solyc12g099200 Invertase inhibitor invertase inhibitor 7.31 2.04 0.13 0.16 9.76 1.20 0.21 0.05 TCCTCAAGCTTGGAAAGATCC AGAACCAACCATTCCATCTTCT
Solyc07g042550 Sucrose synthase sucrose synthase 0.67 0.09 2.40 0.34 0.38 0.05 5.07 0.51 GTTGAGGCCATGAGCTGCGGT GCAGCCTGCTCGCCATGGTA
Solyc12g055760 ATP synthase subunit epsilon mitochondrial ATP synthase 7.35 1.00 7.74 1.46 7.20 0.38 7.91 0.67 TGGCATCGAACGCAGCAGCA CTCACGGGAAAGGGCTTCAGCTT
Solyc11g030570 NADH‐ubiquinone oxidoreductase chain 4 electron transport mito 97.64 11.75 105.90 13.70 64.94 3.19 89.22 9.57 CACCTACGGCAGGATCCGTCA TGTCGCTTCGGGAAACATGGGT
Solyc04g011350 2‐oxoglutarate dehydrogenase E1 component CAC 1.44 0.24 2.75 0.50 0.68 0.04 1.34 0.14 TGCACCACGTCTTTCTACTGCGA CTGCAGAAGGAGCACGGCCT
Solyc02g084440 Fructose‐bisphosphate aldolase CBB 20.31 3.75 4.82 1.07 17.18 3.19 3.00 0.45 CAGGGCCACCCCACAGCAAG TTCCTGGGACGGCAGGAGGG
Solyc03g034220 Ribulose bisphosphate carboxylase small chain CBB 699.34 219.95 71.96 22.54 430.17 124.90 51.51 36.35 GCAACCCAAGTGTTGGCTGAGGT GACCCATGCTTGTGGGTATGCCT
Solyc01g006560 Lipoxygenase ROS degradation 8.50 0.98 0.45 0.25 8.67 1.98 0.48 0.09 CAATGGAGTTGAGTTCTGTTGCC TAAGGTCCTCAGGGAGTGCTT
Solyc11g051170 ATP synthase subunit alpha chloroplastic ATP provision 596.83 163.50 81.60 15.11 525.76 174.27 109.94 50.46 CGAAACGGCGGATTCCCCT TTCACGATACATAAAATATTCAGCCAGAGC
Solyc09g015870 Cytochrome c oxidase subunit 2 mitochondrial respiration 144.71 21.44 166.78 23.18 94.84 4.13 125.78 11.68 GGGGGAGCAGAGCAGTCAAAGA GCCATGGTTCCGCTGCATCAC
Solyc01g007500 Photosystem II CP47 chlorophyll apoprotein PSII 1295.45 200.95 316.76 50.68 1006.26 238.38 248.45 94.42 CGGCGATGGGATTGTTAGAGCCG GCCGTTGAGTTCACCGCCGTA
Reference gene Ct SE Ct SE Ct SE Ct SE
Solyc05g006590 Serine/threonine‐protein phosphatase 2 15.18 0.19 14.85 0.16 15.02 0.04 15.08 0.10 AGGTGCCACATGAAGGGCCG ACCACAGCGATCGTCTGGATCA
LA1777 LEAFLA1777
TRICHOMELA4024 LEAF
LA4024 TRICHOME
primer sequences

Supplemental Data. Balcke et al. (2017). Plant Cell 10.1105/tpc.17.00060
Enzyme name Abbreviation Solyc numbers
acetyl CoA-acetyltransferase
ACAT
Solyc04g015100.2.1
Solyc05g017760.2.1
Solyc07g045350.2.1
HMG-CoA synthase
HMGS
Solyc08g007790.2.1
Solyc08g080160.2.1
Solyc08g080170.2.1
HMG-CoA reductase
HMGR
Solyc02g038740.2.1
Solyc02g082260.2.1
Solyc03g032010.2.1
Solyc03g032020.2.1
Mevalonate kinase MVK Solyc01g098840.2.1
Phosphomevalonate kinase PMK
Solyc06g066310.2.1
Solyc08g076140.2.1
Diphosphomevalonate decarboxylase DPMD
Solyc04g009650.2.1
Solyc11g007020.1.1
Isopentenyl diphosphate isomerase IDI2 (cytosolic) Solyc05g055760.2.1
deoxyxylulose phosphate synthase 1 DXS1 Solyc01g067890.2.1
deoxyxylulose phosphate synthase 2 DXS2 Solyc11g010850.1.1
deoxyxylulose phosphate reductase DXR Solyc03g114340.2.1
2-C-methyl-D-erythritol 4-phosphate
cytidylyltransferase MCT Solyc01g102820.2.1
4-diphosphocytidyl-2-C-methyl-D-erythritol
kinase CMK Solyc01g009010.2.1
2-C-methyl-D-erythritol 2,4-cyclodiphosphate
synthase MDS Solyc08g081570.2.1
(E)-4-Hydroxy-3-methyl-but-2-enyl
pyrophosphate synthase HDS Solyc11g069380.1.1
E)-4-Hydroxy-3-methyl-but-2-enyl
pyrophosphate reductase HDR Solyc01g109300.2.1
Isopentenyl diphosphate isomerase IDI1 (organelles) Solyc04g056390.2.1
Supplemental Table 2. List of genes of the MEV and MEP pathways. Supporting
Figure 4 and Supplemental Figure 9. Gene ID numbers used in the figure are listed
below. When several genes encode the same enzyme activity, the expression values
were added together. Significance values for the trichome versus leaf differential
expression are available in Supplemental Dataset 5.

Supplemental Data. Balcke et al. (2017). Plant Cell 10.1105/tpc.17.00060
Supplemental Table 3. Chromatography Conditions
UPLC
injector:injection Volume IPC (ion pairing chromatography): 5 µL
injection Volume RP (reverse phase): 0.5 µL
injection mode: partial loop
loop size: 10 µL
weak wash solvent: 20% MeOH
weak wash volume: 600 µL
strong wash solvent: 80% MeOH
strong wash volume: 200 µL
sample temperature: 4 °C
oven and gradient conditions ( for IPC and RP):
column temperature: 40 °C
UPLC column type: Nucleoshell RP18 (2.7 µm x 2.1 mm x 150 mm)
flow rate: 400 µL/min
UPLC analysis of hydrophilic metabolites by IPC:
solvent A: 10 mM aqueous tributylamine acidified to pH6.2 with glacial acetic acid
solvent B: acetonitrile (LC‐MS grade)
gradient program
Time (min) %B
0 2
2 2
18 36
21 95
22.5 95
22.51 2
24 2
UPLC analysis of semi‐polar metabolites by RP‐UPLC:
solvent A: 0.3 mM aqueous ammonium formate acidified with formic acid to pH 3
solvent B: acetonitrile (LC‐MS grade)
gradient program
Time (min) %B
0 5
2 5
19 95
22 95
22.01 5
24 5
All solvents and modiefiers were purchased from Sigma‐Aldrich, Inc.

Supplemental Data. Balcke et al. (2017). Plant Cell 10.1105/tpc.17.00060
MS source parameters:
curtain gas 35 arbitrary
gas 1 60 psi
gas 2 70 psi
ionisation needle
voltage ‐4500 V
source temperature 600 °C
Source Housing:
DuoSpray
Ion Source
SWATH MS and MS/MS
parameters:
MS1 Exp Index:
Start Mass
(Da)
Stop Mass
(Da)
declustering
potential [V]
entrance
potential [V]
collision
energy [V]
collision
energy spread
dwell
time [ms]
TOF Exp 1: 65 1250 ‐35 ‐10 ‐10 ‐ 150
SWATH Exp Index:
Start Mass
(Da)
Stop Mass
(Da)
declustering
potential [V]
entrance
potential [V]
collision
energy [V]
collision
energy spread
dwell
time [ms]
SWATH Exp 1: 65 97.03 ‐35 ‐10 ‐45 35 20
SWATH Exp 2: 96.03 129.06 ‐35 ‐10 ‐45 35 20
SWATH Exp 3: 128.06 161.09 ‐35 ‐10 ‐45 35 20
SWATH Exp 4: 160.09 193.12 ‐35 ‐10 ‐45 35 20
SWATH Exp 5: 192.12 225.15 ‐35 ‐10 ‐45 35 20
SWATH Exp 6: 224.15 257.18 ‐35 ‐10 ‐45 35 20
SWATH Exp 7: 256.18 289.21 ‐35 ‐10 ‐45 35 20
SWATH Exp 8: 288.21 321.24 ‐35 ‐10 ‐45 35 20
SWATH Exp 9: 320.24 353.27 ‐35 ‐10 ‐45 35 20
SWATH Exp 10: 352.27 385.3 ‐35 ‐10 ‐45 35 20
SWATH Exp 11: 384.3 417.33 ‐35 ‐10 ‐45 35 20
SWATH Exp 12: 416.33 449.36 ‐35 ‐10 ‐45 35 20
SWATH Exp 13: 448.36 481.39 ‐35 ‐10 ‐45 35 20
SWATH Exp 14: 480.39 513.42 ‐35 ‐10 ‐45 35 20
SWATH Exp 15: 512.42 545.45 ‐35 ‐10 ‐45 35 20
SWATH Exp 16: 544.45 577.48 ‐35 ‐10 ‐45 35 20
SWATH Exp 17: 576.48 609.51 ‐35 ‐10 ‐45 35 20
SWATH Exp 18: 608.51 641.54 ‐35 ‐10 ‐45 35 20
SWATH Exp 19: 640.54 673.57 ‐35 ‐10 ‐45 35 20
SWATH Exp 20: 672.57 705.6 ‐35 ‐10 ‐45 35 20
SWATH Exp 21: 704.6 737.63 ‐35 ‐10 ‐45 35 20
SWATH Exp 22: 736.63 769.66 ‐35 ‐10 ‐45 35 20
SWATH Exp 23: 768.66 801.69 ‐35 ‐10 ‐45 35 20
SWATH Exp 24: 800.69 833.72 ‐35 ‐10 ‐45 35 20
SWATH Exp 25: 832.72 865.75 ‐35 ‐10 ‐45 35 20
SWATH Exp 26: 864.75 897.78 ‐35 ‐10 ‐45 35 20
SWATH Exp 27: 896.78 929.81 ‐35 ‐10 ‐45 35 20
SWATH Exp 28: 928.81 961.84 ‐35 ‐10 ‐45 35 20
SWATH Exp 29: 960.84 993.87 ‐35 ‐10 ‐45 35 20
SWATH Exp 30: 992.87 1025.9 ‐35 ‐10 ‐45 35 20
SWATH Exp 31: 1024.9 1057.93 ‐35 ‐10 ‐45 35 20
SWATH Exp 32: 1056.93 1089.96 ‐35 ‐10 ‐45 35 20
SWATH Exp 33: 1088.96 1121.99 ‐35 ‐10 ‐45 35 20
SWATH Exp 34: 1120.99 1154.02 ‐35 ‐10 ‐45 35 20
SWATH Exp 35: 1153.02 1186.05 ‐35 ‐10 ‐45 35 20
SWATH Exp 36: 1185.05 1218.08 ‐35 ‐10 ‐45 35 20
SWATH Exp 37: 1217.08 1250 ‐35 ‐10 ‐45 35 20
Supplemental Table 4. MS parameters for the untargeted analysis of hydrophilic and semi‐polar metabolites by (‐)ESI‐
SWATH‐MS/MS

Supplemental Data. Balcke et al. (2017). Plant Cell 10.1105/tpc.17.00060
Supplemental Table 5. Summary of RNAseq samples and data
species genotype library id number of reads
perc.
aligned genotype aligned
reads after
removing
duplicates SNPsa
S. habrochaites LA1731 Trichome A lib16657 69987520 78% LA1731
S. habrochaites LA1731 Trichome B lib16662 68631066 78% LA1731 108146049 31949542 327929
S. habrochaites LA1753 Trichome A lib16658 72698375 81% LA1753
S. habrochaites LA1753 Trichome B lib16663 68971723 80% LA1753 113928537 37615191 361490
S. habrochaites LA1777 Trichome A lib17110 38583627 84% LA1777
S. habrochaites LA1777 Apex and lealib16667 57068285 78% LA1777
S. habrochaites LA1777 Apex and lealib16668 40516310 84% LA1777
S. habrochaites LA1777 Trichome B lib16664 69234053 81% LA1777 166655914 41804886 347303
S. habrochaites LA2158 Apex and lealib16669 55657357 86% LA2158
S. habrochaites LA2158 Apex and lealib16670 59269655 83% LA2158 97285228 31529455 170735
S. habrochaites LA2167 Trichome A lib16660 65867112 79% LA2167
S. habrochaites LA2167 Trichome B lib16665 58844572 80% LA2167 99165425 29687716 321276
S. habrochaites LA2650 Trichome A lib17111 48334603 85% LA2650
S. habrochaites LA2650 Trichome B lib16666 42277995 77% LA2650 73912278 26280899 341872
S. lycopersicum LA4005 Trichome A lib16672 44414290 89% LA4005
S. lycopersicum LA4005 Trichome B lib16673 56833234 81% LA4005 85555242 28370316 24639
S. lycopersicum LA4024 Apex and lealib16671 87175921 93% LA4024 81505109 22475773 8872
a ‐ fixed differences with reference with coverage greater than 5 reads