Supplemantary Materials Figure S1. DSC and TG spectra of 1 (a)
13
Supplemantary Materials Figure S1. DSC and TG spectra of 1 (a), 1n (b), 2n (c) and 1c (d). Figure S2. DSC spectra of 1, 1n and 1c. 100 200 300 400 500 -150 -100 -50 0 50 100 DSC/(mW/mg) Exothermic TG/% 218 o C 470 o C Temperature/ o C -2 0 2 4 6 8 10 100 200 300 400 500 -150 -100 -50 0 50 100 Temperature/ o C DSC/(mW/mg) Exothermic TG/% 137 o C 260 o C -2 0 2 4 6 100 200 300 400 500 -150 -100 -50 0 50 100 DSC/(mW/mg) Temperature/ o C TG/% -2 -1 0 1 2 3 4 233 o C 112 o C Exothermic 100 200 300 400 500 -50 0 50 100 -18 -12 -6 0 6 12 18 Temperature/ o C TG/% 246 o C DSC/(mW/mg) Exothermic (a) (b) (c) (d) 100 200 300 400 500 1n 1 Temperature/ o C 1c 218 o C 260 o C 246 o C 137 o C
Transcript of Supplemantary Materials Figure S1. DSC and TG spectra of 1 (a)
Supplemantary Materials
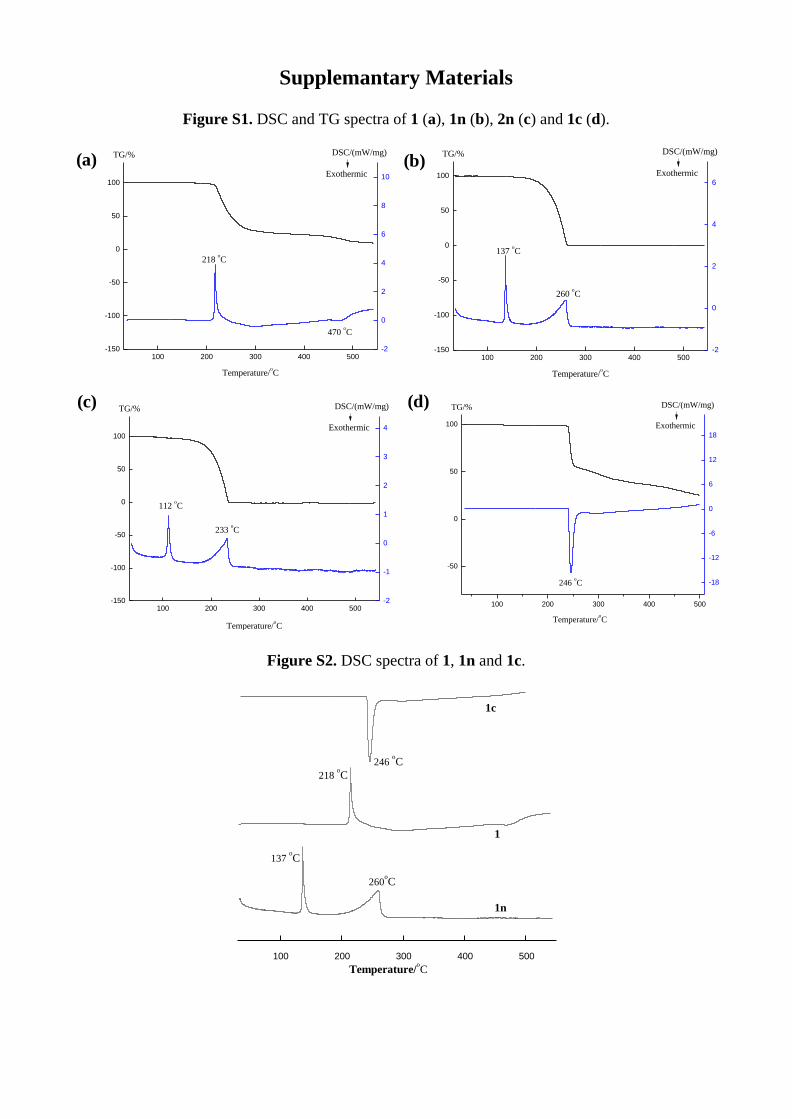
Figure S1. DSC and TG spectra of 1 (a), 1n (b), 2n (c) and 1c (d).
Figure S2. DSC spectra of 1, 1n and 1c.
100 200 300 400 500-150
-100
-50
0
50
100
DSC/(mW/mg)
Exothermic
TG/%
218 oC
470 oC
Temperature/oC
-2
0
2
4
6
8
10
100 200 300 400 500-150
-100
-50
0
50
100
Temperature/oC
DSC/(mW/mg)
Exothermic
TG/%
137 oC
260 oC
-2
0
2
4
6
100 200 300 400 500-150
-100
-50
0
50
100
DSC/(mW/mg)
Temperature/oC
TG/%
-2
-1
0
1
2
3
4
233 oC
112 oC
Exothermic
100 200 300 400 500
-50
0
50
100
-18
-12
-6
0
6
12
18
Temperature/oC
TG/%
246 oC
DSC/(mW/mg)
Exothermic
(a) (b)
(c) (d)
100 200 300 400 500
1n
1
Temperature/oC
1c
218 oC
260oC
246 oC
137 oC

Molecules 2014, 19 S2
Figure S3. DSC spectra of 2, 2n and 2c.
Table S1. Selected bond lengths (Å) and bond angles (°) in crystal for 1c [1] and 1n.
Bonds 1c (Å) 1n (Å) Bonds 1c (Å) 1n (Å)
N1-C2 1.344 1.337 N5-O5A 1.221 1.226
N2-C2 1.309 1.315 N5-O5B 1.226 1.226
N2-N3 1.369 1.351 N3-N4 1.398
C1-N3 1.350 1.334 C1-N4 1.341
C1-N1 1.334 1.328 C2-N5 1.447 1.452
Bond angles 1c (°) 1n (°) Bond angles 1c (°) 1n (°)
N1-C2-N2 118.3 117.9 O5A-N5-O5B 124.1 125.8
C2-N2-N3 100.1 99.8 N2-N3-N4 122.5
C1-N3-N2 110.6 111.2 N3-N4-H4A 104.1
N1-C1-N3 109.5 109.8 N3-N4-H4B 105.0
C1-N1-C2 101.5 101.2 H4A-N4-H4B 121 112.5
N1-C2-N5 120.7 121.6 N1-C1-H1 125.1
C2-N5-O5A 117.7 117.0 N3-C1-H1 125.1
N2-C2-N5 212.0 120.5 N4-N3-C1 126.3
C2-N5-O5B 118.2 117.2
100 200 300 400 500
2n
2
178 oC
164 oC
Temperature/oC
112 oC
233 oC
173 oC
295 oC
2c

Molecules 2014, 19 S3
Table S2. Selected bond lengths (Å) and bond angles (°) in crystal for 2c [2] and 2n.
Bonds 2c (Å) 2n (Å) Bonds 2c (Å) 2n (Å)
N5-O5A 1.234 1.227 N5-O5B 1.229 1.225
C5-N5 1.398 1.443 C5-C4 1.390 1.377
C5-N1 1.380 1.332 N2-N4 1.390
N1-N2 1.325 1.330 N2-C3 1.346 1.360
C3-C4 1.409 1.356 C3-N3 1.424 1.444
N3-O3A 1.223 1.220 N3-O3B 1.223 1.227
C4-N4 1.334
Bond angles 2c (°) 2n (°) Bond angles 2c (°) 2n (°)
C4-C3-N3 126.8 126.7 O5B-N5-C5 116.8 116.5
C4-C5-N5 129.1 126.9 O5B-N5-O5A 124.5 125.1
C5-C4-C3 100.9 102.3 C4-N4-H4A 120.0
N1-C5-N5 121.8 118.9 C4-N4-H4B 120.0
N1-N2-C3 104.4 110.8 H4A-N4-H4B 120.0 35.3
N1-C5-C4 109.1 114.2 N2-C3-C4 114.4 109.0
N2-N1-C5 111.2 103.7 N2-C3-N3 118.8 124.2
O3A-N3-C3 116.0 115.4 O3B-N3-O3A 124.6 124.6
Table S3. Crystallographic data and structure refinement parameters for 1n and 2n.
1n 2n
Empirical formula C2H3N5O2 C3H3N5O4
CCDC 958583 958582
Temperature/K 153(2) 180(10)
Wavelength/Å 0.71073 0.71073
Crystal system Orthorhombic Orthorhombic
Space group Pna21 P212121
a /Å 9.919(6) 5.4902(7)
b /Å 9.880(6) 9.7958(12)
c /Å 5.152(3) 11.7902(17)
α /° 90 90
β /° 90 90
γ /° 90 90
V /Å 3 504.9(5) 634.09(15)
Z 4 4
ρ /(g·cm−3) 1.698 1.813
/mm−1 0.149 0.167
F(000) 264 352
Crystal size/mm 0.41 × 0.33 × 0.25 0.2 × 0.1 × 0.1
/° 2.91~30.03 3.45~25.99
Limiting indices
−13 ≤ h ≤ 13 −6 ≤ h ≤ 5
−9 ≤ k ≤ 13 −12 ≤ k ≤ 9
−7 ≤ l ≤ 7 −14 ≤ l ≤ 13
Reflections Collected 4096 1869
Independent reflections 807 1195
Rint 0.0426 0.0263
Final R indices [I > 2 (I)] R1 = 0.0313, wR2 = 0.0663 R1 = 0.0474, wR2 = 0.1135
Final R indices (all data) R1 = 0.0348, wR2 = 0.0680 R1 = 0.0587, wR2 = 0.1245

Molecules 2014, 19 S4
Heat of formation
Isodesmic reaction, in which numbers of electron pairs and chemical bond types are conserved, has
been employed very successfully to give heat of formation more accurate than semi-empirical
calculation [3]. Based on the optimized structures, the total energy (E0) and thermodynamic parameters,
including zero point energy (ZPE) and thermal correction to enthalpy (HT), were obtained at the
B3LYP/6-311++g(d, p) level.
For the isodesmic reaction (Scheme S1), heat of reaction (∆H298K) can be calculated from the
following Equation (1):
H298 K = ∆Hf,P − ∆Hf,R (1)
where ∆Hf,R and ∆Hf,P are the heats of formation for reactants and products at 298.15 K, respectively.
Meanwhile, ∆H298 K can also be calculated using the following Equation (2):
∆H298 K = ∆E298 K + ∆(PV) = ∆E0 + ∆ZPE + ∆HT+ ∆(nRT) (2)
Where ∆E0 is the change in total energy between the products and the reactants at 0 K; ∆ZPE is the
difference between the zero-point energies of the products and the reactants; ∆HT is thermal correction
from 0 K to 298.15 K. Since there is no change in number of total molecules, ∆(PV) = ∆(nRT) =0.
Therefore, the heat of formation can be figured out according to ∆H298 and heats of formation of other
reactants and products. Fortunately, these data can be acquired from the literature and handbook facilely.
Scheme S1. Isodesmic reactions.
Molecules 2014, 19 S5
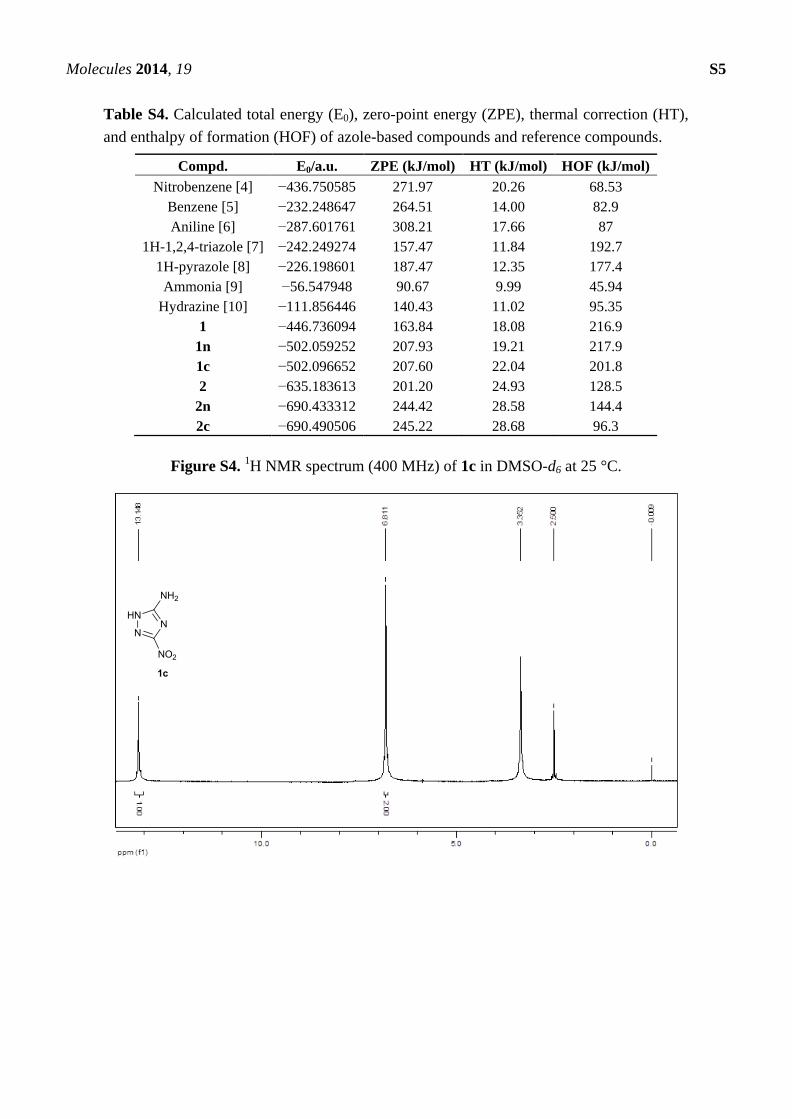
Table S4. Calculated total energy (E0), zero-point energy (ZPE), thermal correction (HT),
and enthalpy of formation (HOF) of azole-based compounds and reference compounds.
Compd. E0/a.u. ZPE (kJ/mol) HT (kJ/mol) HOF (kJ/mol)
Nitrobenzene [4] −436.750585 271.97 20.26 68.53
Benzene [5] −232.248647 264.51 14.00 82.9
Aniline [6] −287.601761 308.21 17.66 87
1H-1,2,4-triazole [7] −242.249274 157.47 11.84 192.7
1H-pyrazole [8] −226.198601 187.47 12.35 177.4
Ammonia [9] −56.547948 90.67 9.99 45.94
Hydrazine [10] −111.856446 140.43 11.02 95.35
1 −446.736094 163.84 18.08 216.9
1n −502.059252 207.93 19.21 217.9
1c −502.096652 207.60 22.04 201.8
2 −635.183613 201.20 24.93 128.5
2n −690.433312 244.42 28.58 144.4
2c −690.490506 245.22 28.68 96.3
Figure S4. 1H NMR spectrum (400 MHz) of 1c in DMSO-d6 at 25 °C.

Molecules 2014, 19 S6
Figure S5. 13
C NMR spectrum (100 MHz) of 1c in DMSO-d6 at 25 °C.
Figure S6. ESI-MS spectrum of 1c.
ppm (f1)050100150200
16
0.8
61
15
7.3
96
39
.52
1

Molecules 2014, 19 S7
Figure S7. 1H NMR spectrum (400 MHz) of 2 in DMSO-d6 at 25 °C.
Figure S8. EI-MS spectrum of 2. Provide higher resolution figure.

Molecules 2014, 19 S8
Figure S9. 1H NMR spectrum (400 MHz) of 2c in DMSO-d6 at 25 °C.
Figure S10. ESI-MS spectrum of 2c.

Molecules 2014, 19 S9
Figure S11. 1H NMR spectrum (400 MHz) of 1n in DMSO-d6 at 25 °C.
Figure S12. 13
C NMR spectrum (100 MHz) of 1n in DMSO-d6 at 25 °C.
Molecules 2014, 19 S10
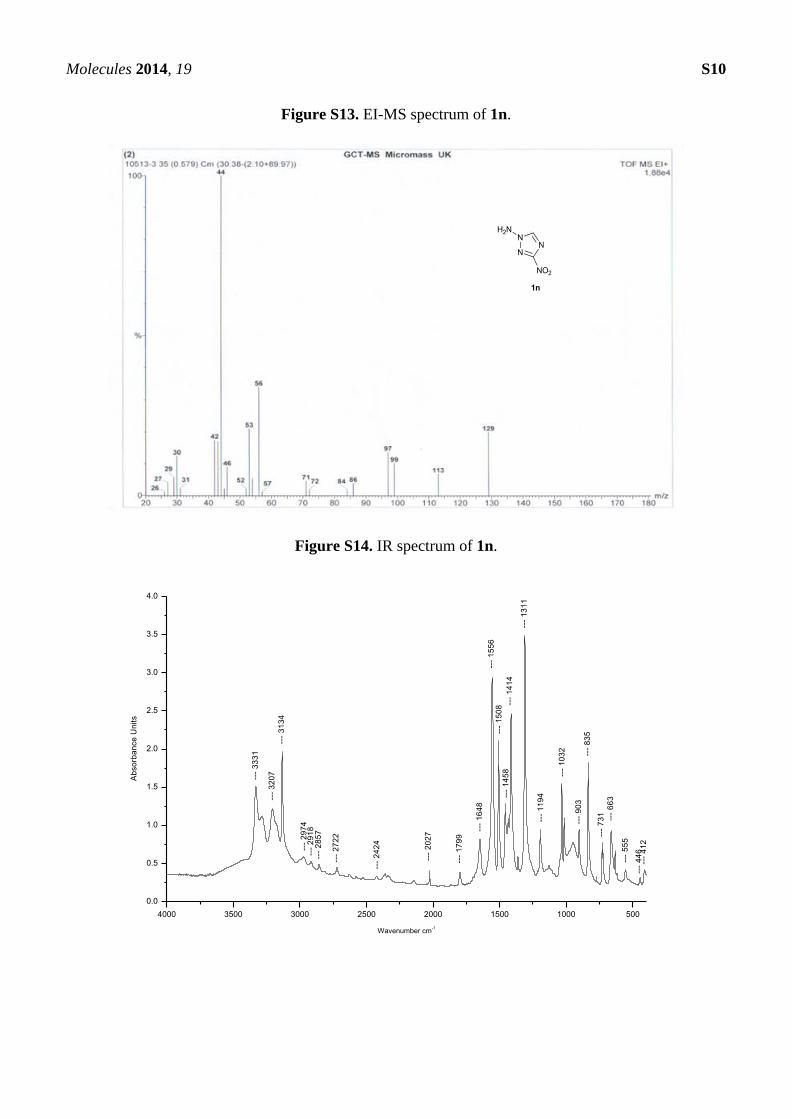
Figure S13. EI-MS spectrum of 1n.
Figure S14. IR spectrum of 1n.
4000 3500 3000 2500 2000 1500 1000 500
0.0
0.5
1.0
1.5
2.0
2.5
3.0
3.5
4.0
---
55
5
---
44
6--
- 4
12
---
73
1
---
83
5--
- 9
03
---
66
3
---
11
94
---
13
11
---
10
32
---
15
08
---
14
58
---
14
14
---
15
56
---
16
48
---
17
99
---
29
74
---
29
18
---
20
27
---
24
24
---
31
34
---
27
22
---
28
57
---
32
07
---
33
31
Ab
so
rba
nce
Un
its
Wavenumber cm-1

Molecules 2014, 19 S11
Figure S15. 1H NMR spectrum (400 MHz) of 2n in DMSO-d6 at 25 °C.
Figure S16. 13
C NMR spectrum (100 MHz) of 2n in DMSO-d6 at 25 °C.
ppm (t1)0.01.02.03.04.05.06.07.08.0
8.0
15
7.8
83
3.3
29
2.5
04
0.0
00
1.0
02
.01
ppm (f1)050100
10
1.7
21
40
.20
1
39
.99
1
39
.78
2
Molecules 2014, 19 S12
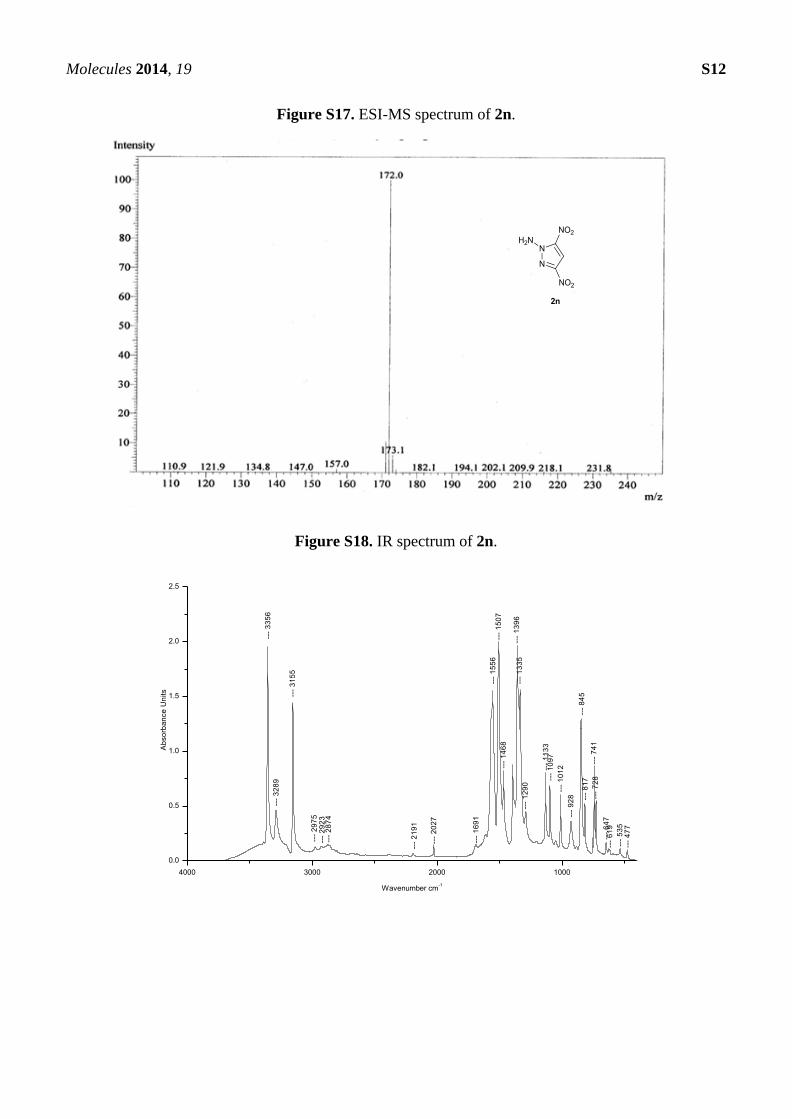
Figure S17. ESI-MS spectrum of 2n.
Figure S18. IR spectrum of 2n.
4000 3000 2000 1000
0.0
0.5
1.0
1.5
2.0
2.5
---
47
7--
- 5
35
---
61
9
---
72
8
---
64
7
---
74
1
---
81
7---
10
97
---
10
12
---
92
8
---
84
5
---
13
35
---
13
96
---
14
68
---
12
90
---
11
33
---
15
07
---
15
56
---
16
91
---
20
27
---
28
74
---
21
91
---
29
23
---
29
75
---
31
55
---
32
89
---
33
56
Ab
so
rba
nce
Un
its
Wavenumber cm-1

Molecules 2014, 19 S13
References
1. Garcia, E.; Lee, K.Y. Structure of 3-amino-5-nitro-1,2,4-triazole. Acta Cryst. 1992, C48, 1682–1683.
2. Schmidt, R.D.; Lee, G.S.; Pagoria, P.F.; Mitchell, A.R. Synthesis of 4-amino-3,5-dinitro-1H-pyrazole
using vicarious nucleophilic substitution of hydrogen. J. Heterocycl. Chem. 2001, 38, 1227–1230.
3. Hehre, W.J.; Radom, L.; Schleyer, P.V.R.; Pople, J.A. Ab Initio Molecular Orbital Theory;
Wiley: New York, NY, USA, 1986.
4. Lebedeva, N.D.; Katin, Y.A.; Akhmedova, G.Y. Standard enthalpy of formation of nitrobenzene.
Russ. J. Phys. Chem. 1971, 45, 1192–1193.
5. Roux, M.V.; Temprado, M.; Chickos, J.S.; Nagano, Y. Critically evaluated thermochemical
properties of polycyclic aromatic hydrocarbons. J. Phys. Chem. Ref. Data 2008, 37, 1855–1996.
6. Hatton, W.E.; Hildenbrand, D.L.; Sinke, G.C.; Stull, D.R. Chemical thermodynamic properties of
aniline. J. Chem. Eng. Data 1962, 7, 229–231.
7. Jimenez, P.; Roux, M.V.; Turrion, C. Thermochemical properties of N-heterocyclic compounds II.
Enthalpies of combustion, vapour pressures, enthalpies of sublimation, and enthalpies of formation
of 1,2,4-triazole and benzotriazole. J. Chem. Thermodyn. 1989, 21, 759–764.
8. Zaheeruddin, M.; Lodhi, Z.H. Enthalpies of formation of some cyclic compounds. Phys. Chem.
1991, 10, 111–118.
9. Cox, J.D.; Wagman, D.D.; Medvedev, V.A. Codata Key Values for Thermodynamics; Hemisphere
Publishing Corp: New York, NY, USA, 1984.
10. Chase, M.W. NIST-JANAF themochemical tables. J. Phys. Chem. Ref. Data 1998, 9, 1948–1951.