Supersize Me: Intangibles and Industry Concentration...• National vs. local (Rossi- ... •...
29
Supersize Me: Intangibles and Industry Concentration Chiara Criscuolo, Matej Bajgar, Jonathan Timmis Directorate for Science, Technology and Innovation OECD
Transcript of Supersize Me: Intangibles and Industry Concentration...• National vs. local (Rossi- ... •...
Supersize Me: Intangibles and Industry
Concentration
Chiara Criscuolo, Matej Bajgar, Jonathan Timmis
Directorate for Science, Technology and Innovation
OECD
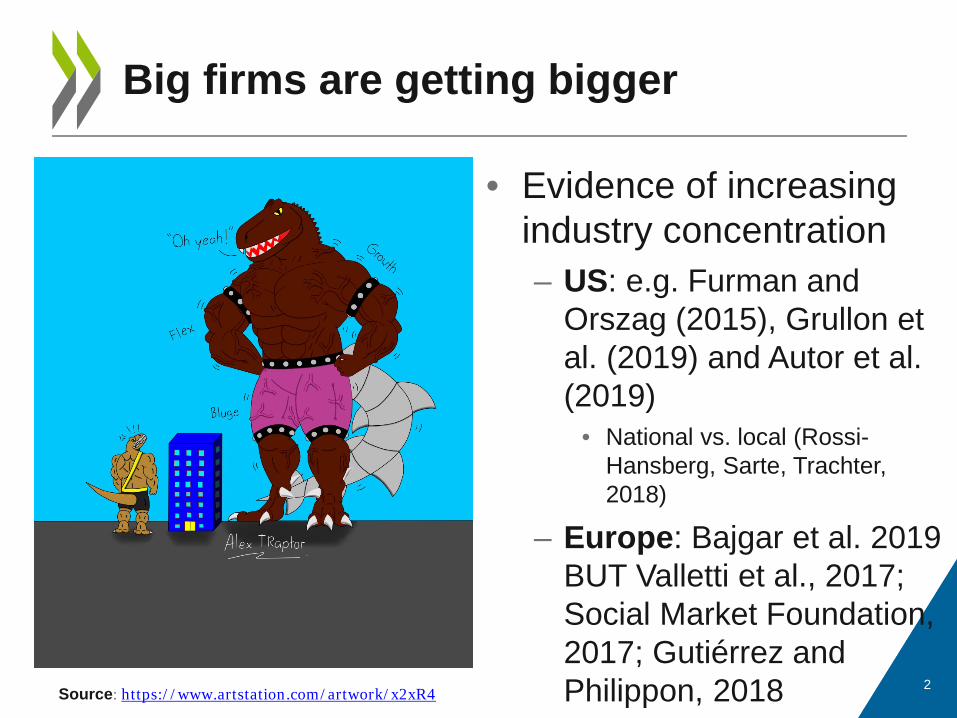
• Evidence of increasing industry concentration – US: e.g. Furman and
Orszag (2015), Grullon et al. (2019) and Autor et al. (2019)
• National vs. local (Rossi-Hansberg, Sarte, Trachter, 2018)
– Europe: Bajgar et al. 2019 BUT Valletti et al., 2017; Social Market Foundation, 2017; Gutiérrez and Philippon, 2018 2
Big firms are getting bigger
Source: https://www.artstation.com/artwork/x2xR4
3
Good vs. bad concentration?
Market power Superstars
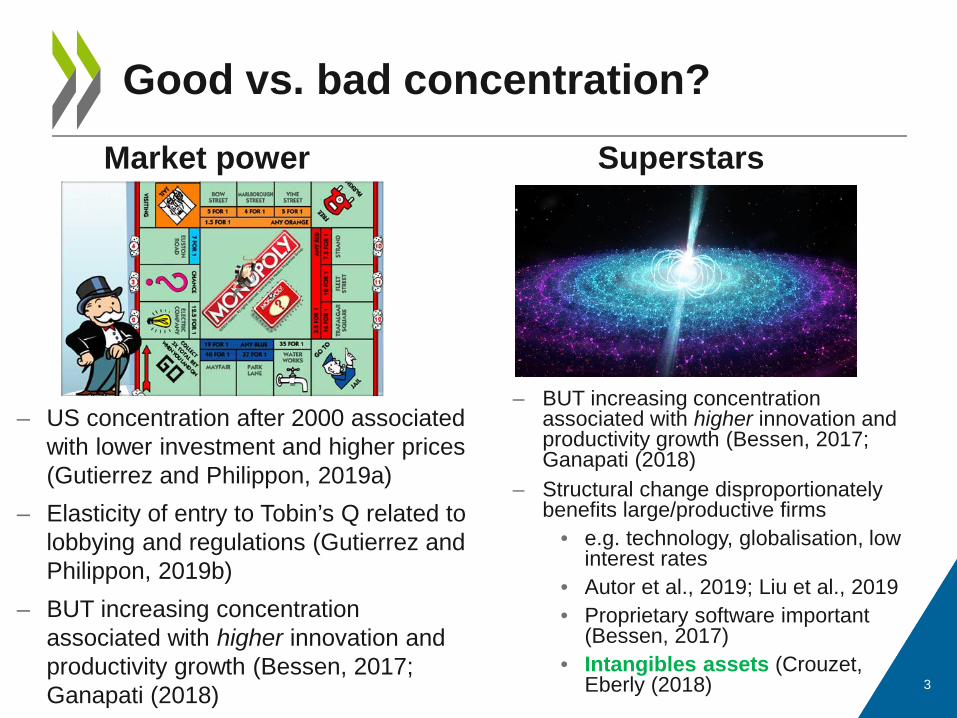
– US concentration after 2000 associated with lower investment and higher prices (Gutierrez and Philippon, 2019a)
– Elasticity of entry to Tobin’s Q related to lobbying and regulations (Gutierrez and Philippon, 2019b)
– BUT increasing concentration associated with higher innovation and productivity growth (Bessen, 2017; Ganapati (2018)
– BUT increasing concentration associated with higher innovation and productivity growth (Bessen, 2017; Ganapati (2018)
– Structural change disproportionately benefits large/productive firms
• e.g. technology, globalisation, low interest rates
• Autor et al., 2019; Liu et al., 2019 • Proprietary software important
(Bessen, 2017) • Intangibles assets (Crouzet,
Eberly (2018)
4
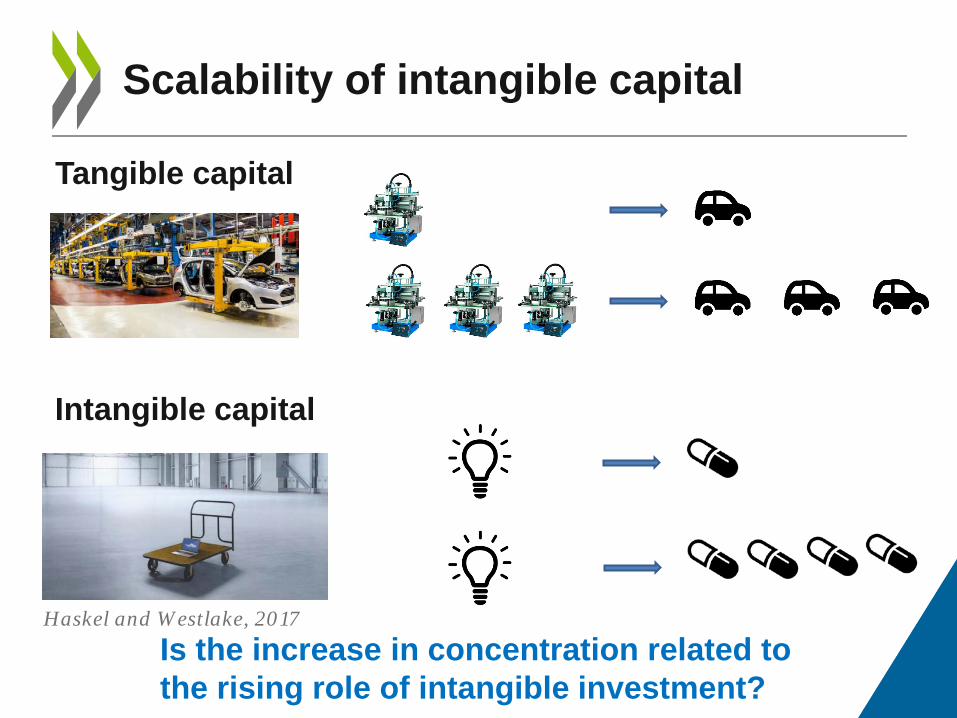
Scalability of intangible capital
Tangible capital
Intangible capital
Is the increase in concentration related to the rising role of intangible investment?
Haskel and Westlake, 2017
What we do • Link changes in industry concentration to intangibles
investment and other potential determinants • 7 European economies (Belgium, Spain, France, Finland, Italy,
Great Britain and Sweden) + United States + Japan (Greece, (Hungary), Denmark about to be added)
Preview of results • Concentration increased by 5p.p. on average • Intangible investment a strong predictor of concentration
changes • Effects especially strong in open, concentrated and digital
country-industries • Industry-level results supported by firm-level evidence (patents)
5
Paper overview
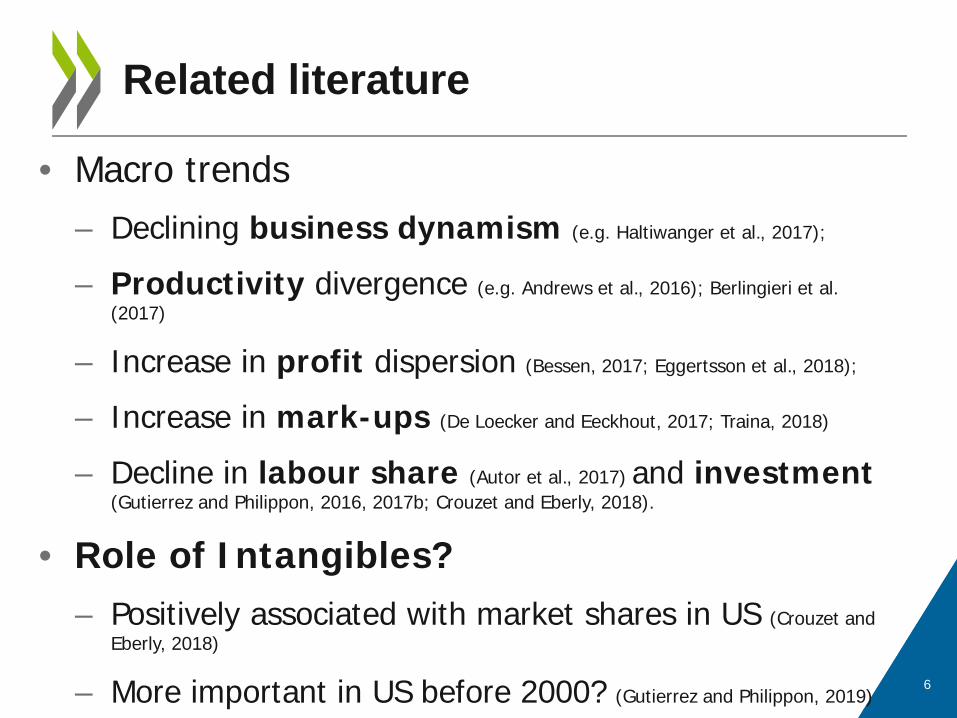
• Macro trends – Declining business dynamism (e.g. Haltiwanger et al., 2017);
– Productivity divergence (e.g. Andrews et al., 2016); Berlingieri et al. (2017)
– Increase in profit dispersion (Bessen, 2017; Eggertsson et al., 2018);
– Increase in mark-ups (De Loecker and Eeckhout, 2017; Traina, 2018)
– Decline in labour share (Autor et al., 2017) and investment (Gutierrez and Philippon, 2016, 2017b; Crouzet and Eberly, 2018).
• Role of Intangibles? – Positively associated with market shares in US (Crouzet and
Eberly, 2018)
– More important in US before 2000? (Gutierrez and Philippon, 2019)
6
Related literature

DATA AND MEASUREMENT
7

How do we measure concentration?
Measure: share of sales due to 8 (4, 20) largest business groups Level: country-industry • see Bajgar et al. (2019) for world region-industry analysis • A64 industries -> differ from product markets Data: matched Orbis-Zephyr-Worldscope data Industry sales (denominator): OECD STAN • dangers of other choices with coverage changes
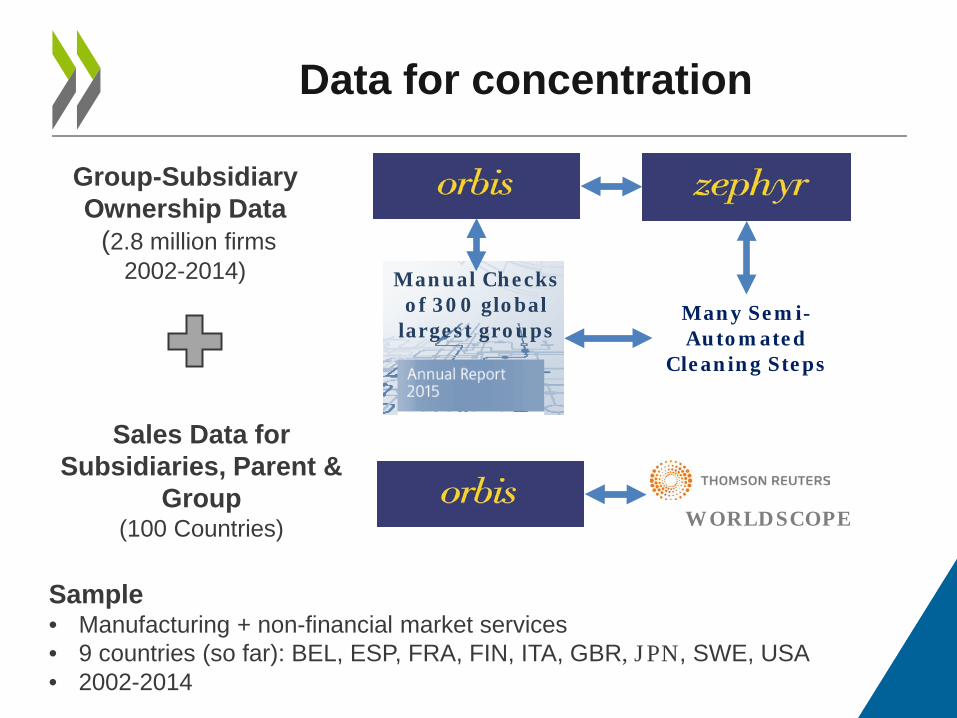
Data for concentration
WORLDSCOPE
Group-Subsidiary Ownership Data (2.8 million firms
2002-2014)
Sales Data for Subsidiaries, Parent &
Group (100 Countries)
Many Semi-Automated
Cleaning Steps
Manual Checks of 300 global
largest groups
Sample • Manufacturing + non-financial market services • 9 countries (so far): BEL, ESP, FRA, FIN, ITA, GBR, JPN, SWE, USA • 2002-2014
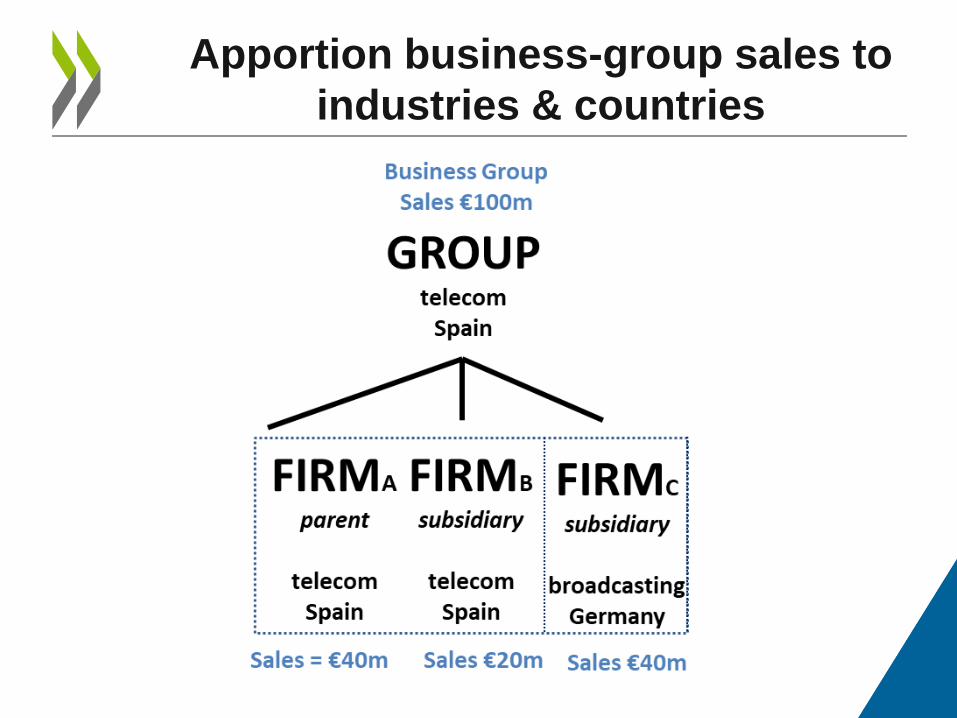
Apportion business-group sales to industries & countries
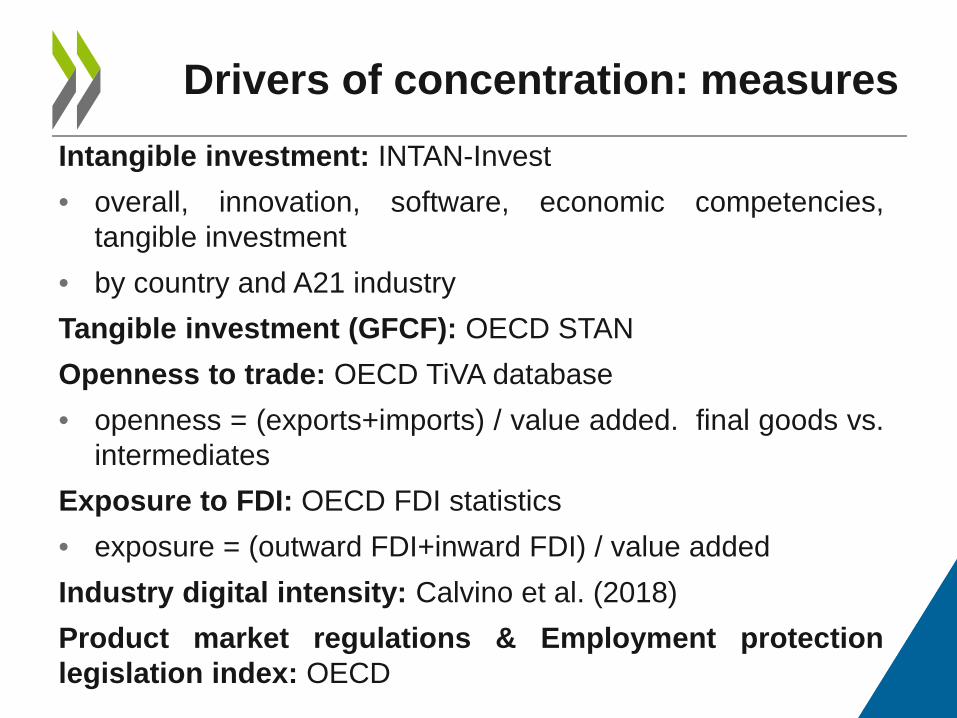
Drivers of concentration: measures Intangible investment: INTAN-Invest • overall, innovation, software, economic competencies,
tangible investment • by country and A21 industry Tangible investment (GFCF): OECD STAN Openness to trade: OECD TiVA database • openness = (exports+imports) / value added. final goods vs.
intermediates Exposure to FDI: OECD FDI statistics • exposure = (outward FDI+inward FDI) / value added Industry digital intensity: Calvino et al. (2018) Product market regulations & Employment protection legislation index: OECD

TRENDS
12
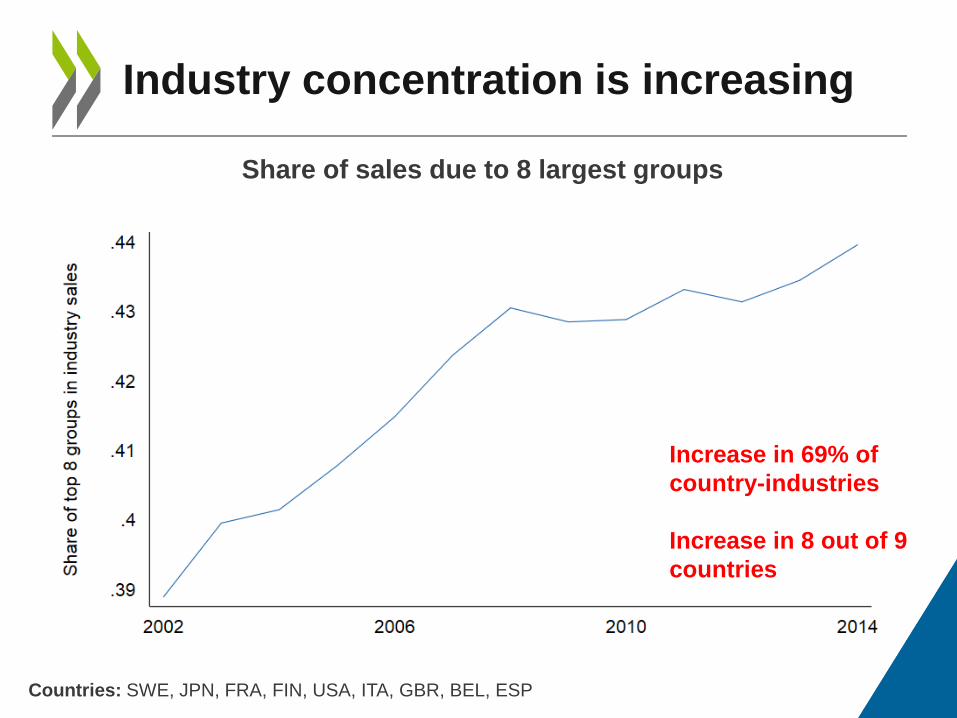
Industry concentration is increasing
Countries: SWE, JPN, FRA, FIN, USA, ITA, GBR, BEL, ESP
Share of sales due to 8 largest groups
Increase in 69% of country-industries Increase in 8 out of 9 countries
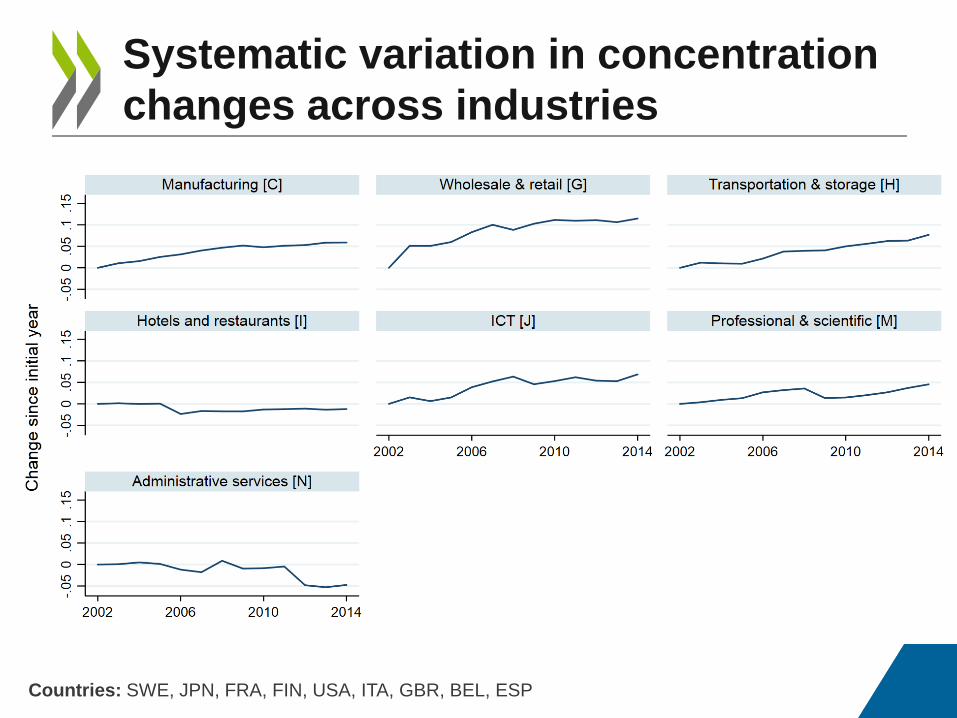
Systematic variation in concentration changes across industries
Countries: SWE, JPN, FRA, FIN, USA, ITA, GBR, BEL, ESP
Change in the share of sales due to 8 largest groups (rel. to 2002)
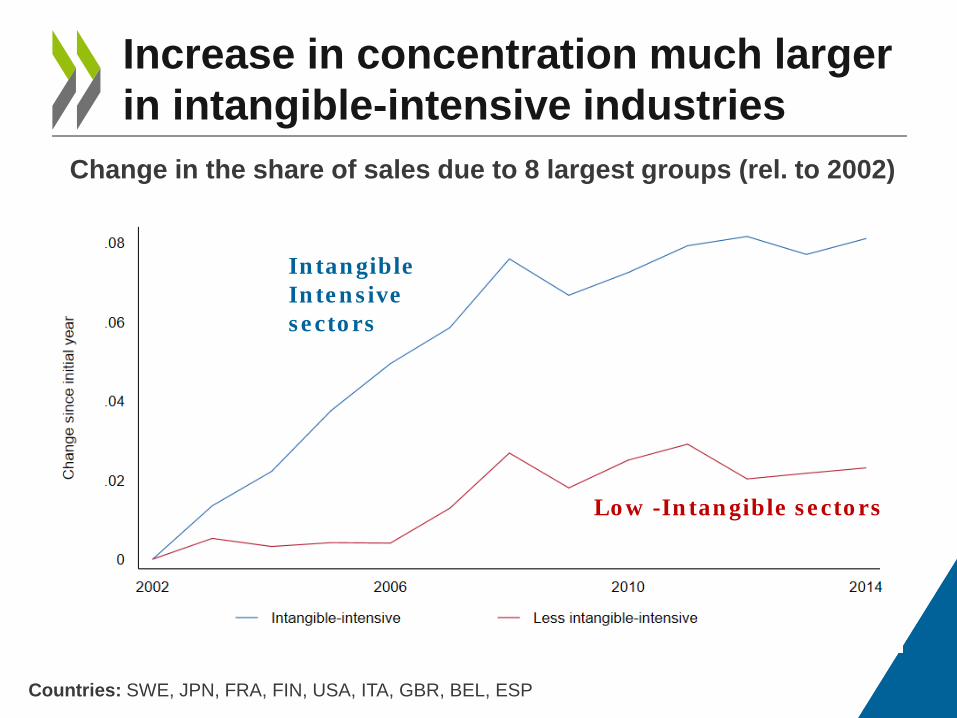
Increase in concentration much larger in intangible-intensive industries
Countries: SWE, JPN, FRA, FIN, USA, ITA, GBR, BEL, ESP
Change in the share of sales due to 8 largest groups (rel. to 2002)
Intangible Intensive sectors
Low -Intangible sectors

ECONOMETRIC RESULTS
16
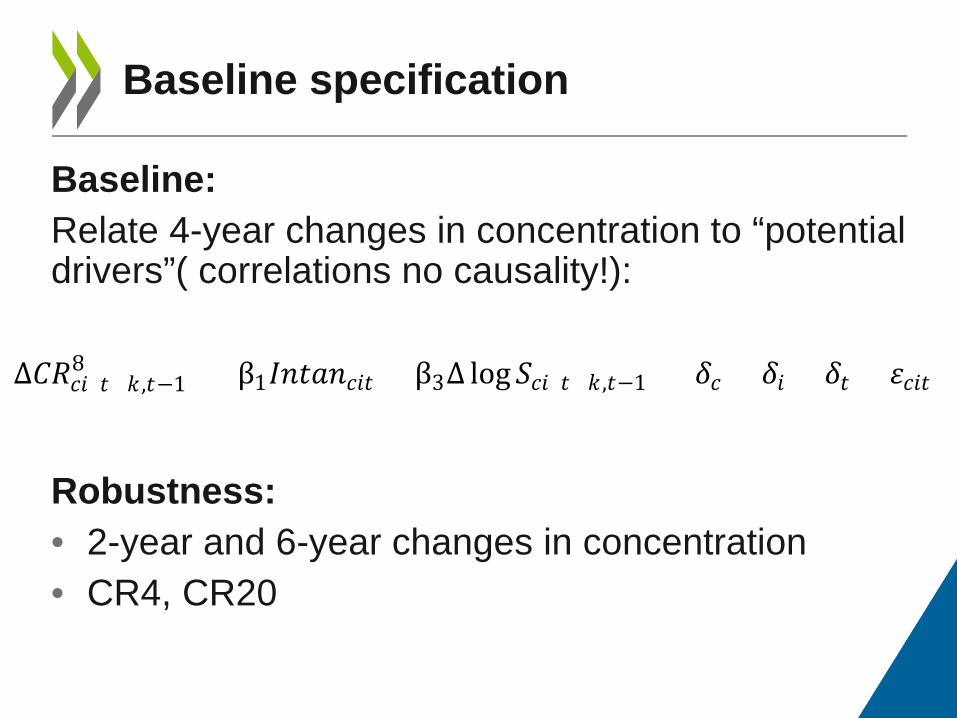
Baseline: Relate 4-year changes in concentration to “potential drivers”( correlations no causality!):
Robustness: • 2-year and 6-year changes in concentration • CR4, CR20
Baseline specification
∆𝐶𝐶𝐶𝐶𝑐𝑐𝑐𝑐(𝑡𝑡+𝑘𝑘 ,𝑡𝑡−1)8 = β1𝐼𝐼𝐼𝐼𝑡𝑡𝐼𝐼𝐼𝐼𝑐𝑐𝑐𝑐𝑡𝑡 + β3∆ log𝑆𝑆𝑐𝑐𝑐𝑐(𝑡𝑡+𝑘𝑘 ,𝑡𝑡−1) + 𝛿𝛿𝑐𝑐 + 𝛿𝛿𝑐𝑐 + 𝛿𝛿𝑡𝑡 + 𝜀𝜀𝑐𝑐𝑐𝑐𝑡𝑡
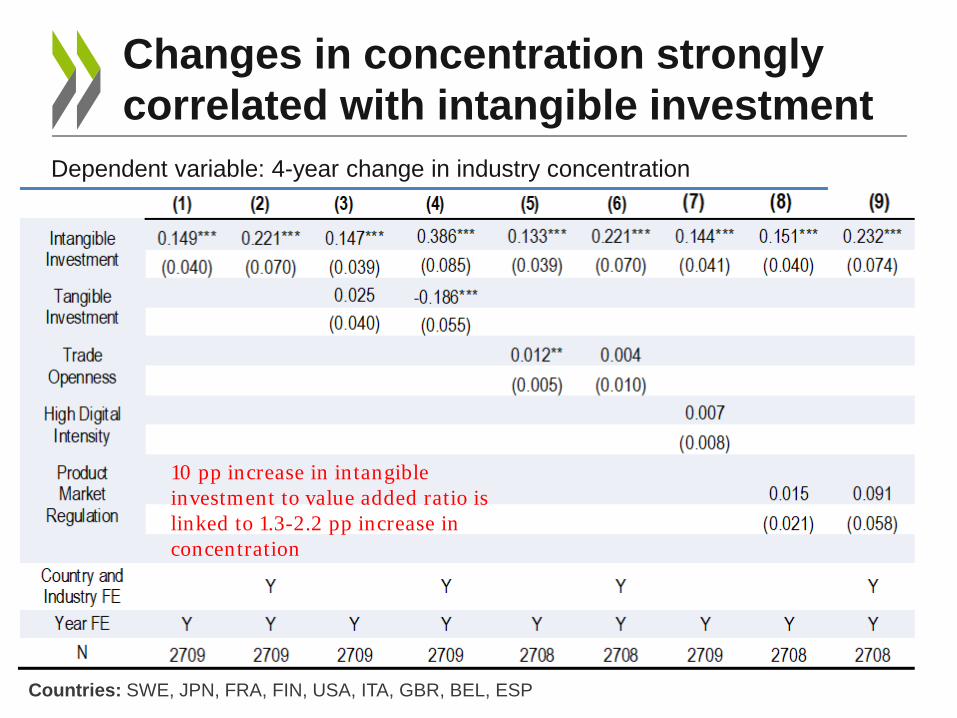
Changes in concentration strongly correlated with intangible investment
Countries: SWE, JPN, FRA, FIN, USA, ITA, GBR, BEL, ESP
Dependent variable: 4-year change in industry concentration
10 pp increase in intangible investment to value added ratio is linked to 1.3-2.2 pp increase in concentration
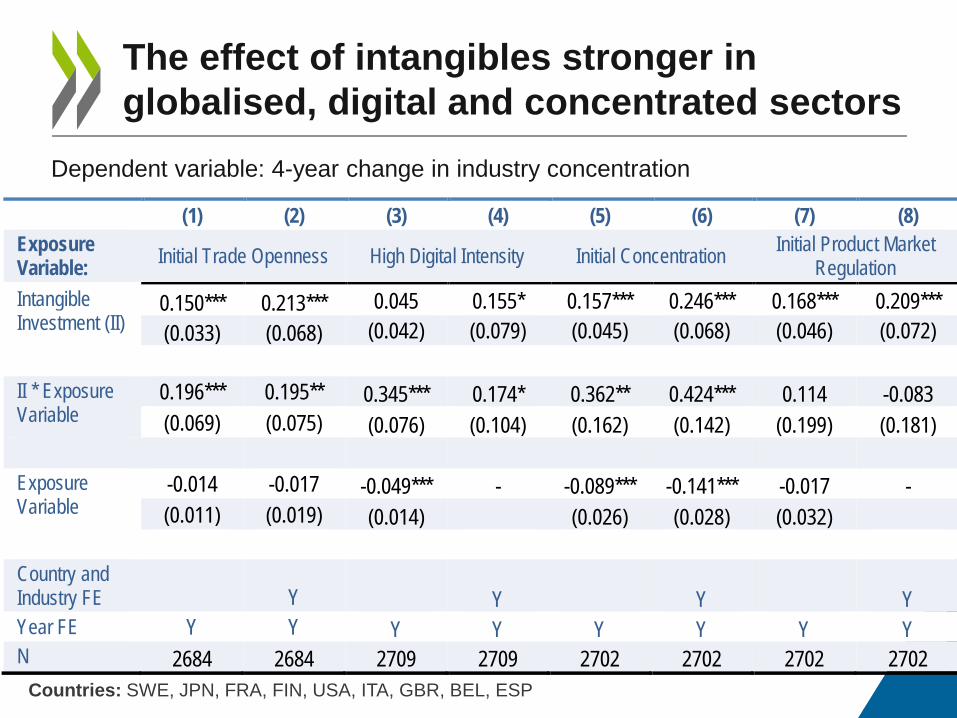
The effect of intangibles stronger in globalised, digital and concentrated sectors
Countries: SWE, JPN, FRA, FIN, USA, ITA, GBR, BEL, ESP
Dependent variable: 4-year change in industry concentration
(1) (2) (3) (4) (5) (6) (7) (8) Exposure Variable: Initial Trade Openness High Digital Intensity Initial Concentration Initial Product Market
Regulation Intangible Investment (II)
0.150*** 0.213*** 0.045 0.155* 0.157*** 0.246*** 0.168*** 0.209*** (0.033) (0.068) (0.042) (0.079) (0.045) (0.068) (0.046) (0.072)
II * Exposure Variable
0.196*** 0.195** 0.345*** 0.174* 0.362** 0.424*** 0.114 -0.083 (0.069) (0.075) (0.076) (0.104) (0.162) (0.142) (0.199) (0.181)
Exposure Variable
-0.014 -0.017 -0.049*** - -0.089*** -0.141*** -0.017 - (0.011) (0.019) (0.014) (0.026) (0.028) (0.032)
Country and Industry FE Y Y Y Y Year FE Y Y Y Y Y Y Y Y N 2684 2684 2709 2709 2702 2702 2702 2702
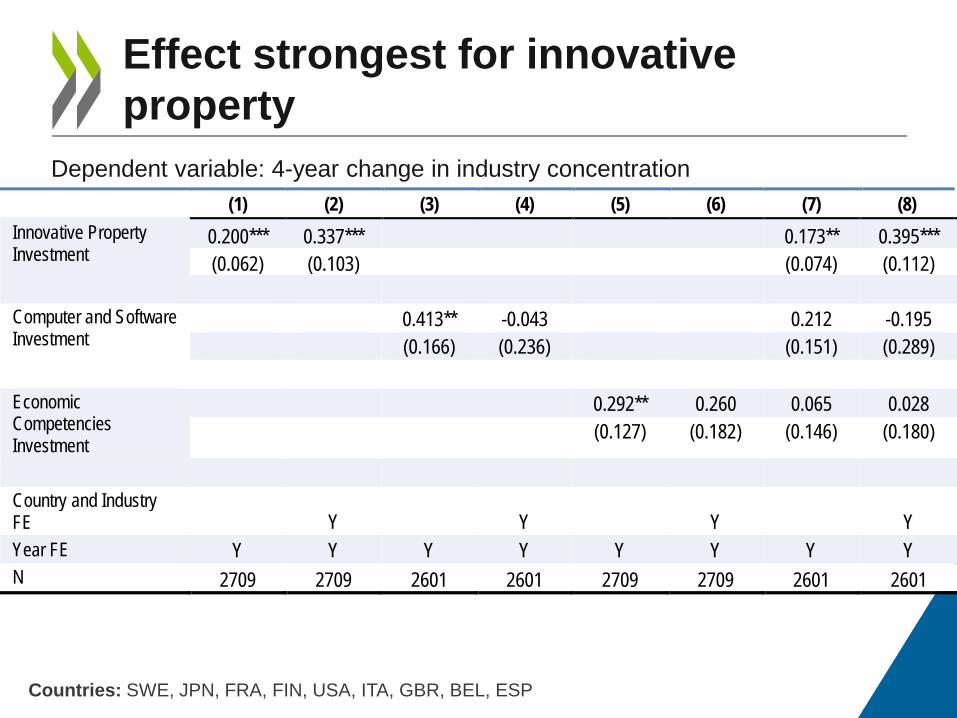
Effect strongest for innovative property
Countries: SWE, JPN, FRA, FIN, USA, ITA, GBR, BEL, ESP
Dependent variable: 4-year change in industry concentration (1) (2) (3) (4) (5) (6) (7) (8)
Innovative Property Investment
0.200*** 0.337*** 0.173** 0.395*** (0.062) (0.103) (0.074) (0.112)
Computer and Software Investment
0.413** -0.043 0.212 -0.195 (0.166) (0.236) (0.151) (0.289)
Economic Competencies Investment
0.292** 0.260 0.065 0.028
(0.127) (0.182) (0.146) (0.180)
Country and Industry FE Y Y Y Y Year FE Y Y Y Y Y Y Y Y N 2709 2709 2601 2601 2709 2709 2601 2601
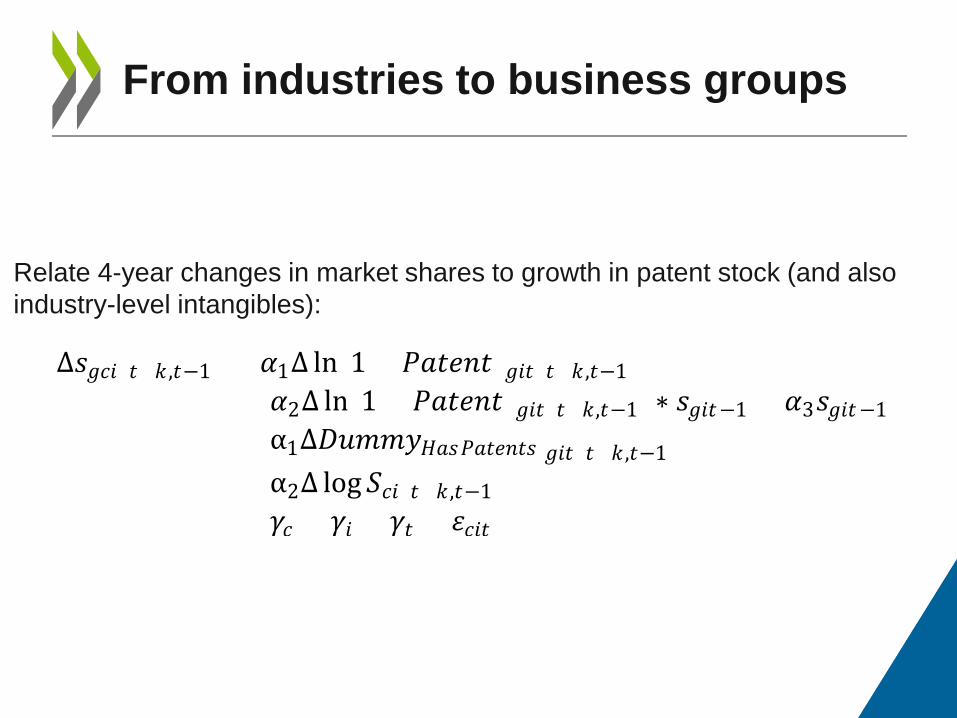
Relate 4-year changes in market shares to growth in patent stock (and also industry-level intangibles):
From industries to business groups
∆𝑠𝑠𝑔𝑔𝑐𝑐𝑐𝑐 (𝑡𝑡+𝑘𝑘 ,𝑡𝑡−1) = 𝛼𝛼1∆ ln(1 + 𝑃𝑃𝐼𝐼𝑡𝑡𝑃𝑃𝐼𝐼𝑡𝑡)𝑔𝑔𝑐𝑐𝑡𝑡 (𝑡𝑡+𝑘𝑘 ,𝑡𝑡−1) +𝛼𝛼2∆ ln(1 + 𝑃𝑃𝐼𝐼𝑡𝑡𝑃𝑃𝐼𝐼𝑡𝑡)𝑔𝑔𝑐𝑐𝑡𝑡 (𝑡𝑡+𝑘𝑘,𝑡𝑡−1) ∗ 𝑠𝑠𝑔𝑔𝑐𝑐𝑡𝑡−1 + 𝛼𝛼3𝑠𝑠𝑔𝑔𝑐𝑐𝑡𝑡−1 +α1∆𝐷𝐷𝑢𝑢𝑢𝑢𝑢𝑢𝑢𝑢𝐻𝐻𝐼𝐼𝑠𝑠𝑃𝑃𝐼𝐼𝑡𝑡𝑃𝑃𝐼𝐼𝑡𝑡𝑠𝑠 𝑔𝑔𝑐𝑐𝑡𝑡 (𝑡𝑡+𝑘𝑘 ,𝑡𝑡−1) +α2∆ log𝑆𝑆𝑐𝑐𝑐𝑐(𝑡𝑡+𝑘𝑘 ,𝑡𝑡−1) +𝛾𝛾𝑐𝑐 + 𝛾𝛾𝑐𝑐 + 𝛾𝛾𝑡𝑡 + 𝜀𝜀𝑐𝑐𝑐𝑐𝑡𝑡
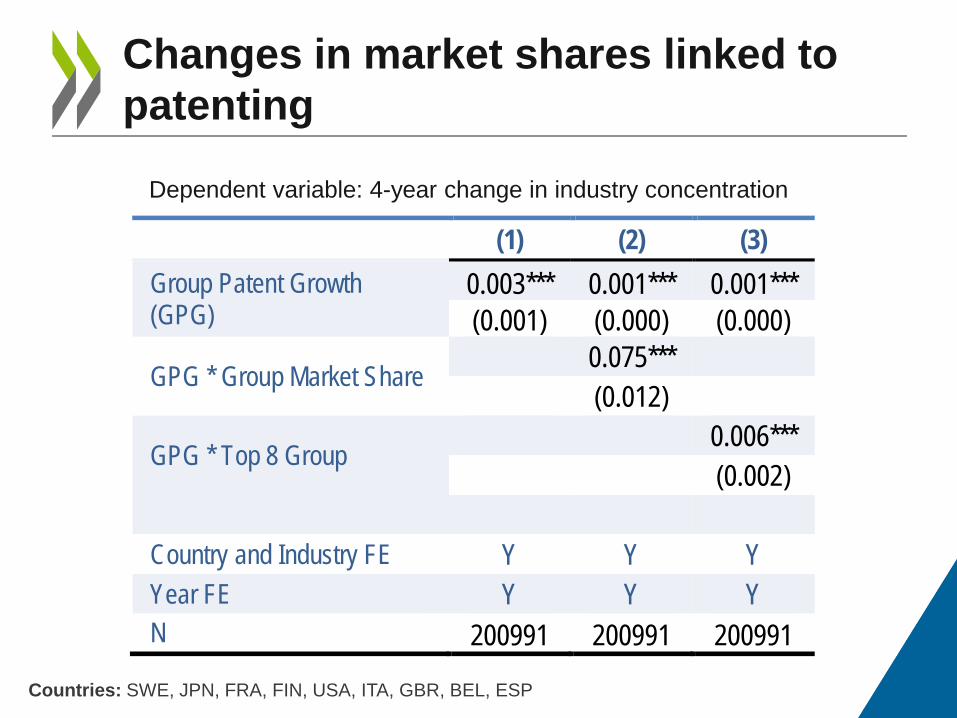
Changes in market shares linked to patenting
Countries: SWE, JPN, FRA, FIN, USA, ITA, GBR, BEL, ESP
Dependent variable: 4-year change in industry concentration
(1) (2) (3) Group Patent Growth (GPG)
0.003*** 0.001*** 0.001*** (0.001) (0.000) (0.000)
GPG * Group Market Share 0.075*** (0.012)
GPG * Top 8 Group 0.006*** (0.002)
Country and Industry FE Y Y Y Year FE Y Y Y N 200991 200991 200991
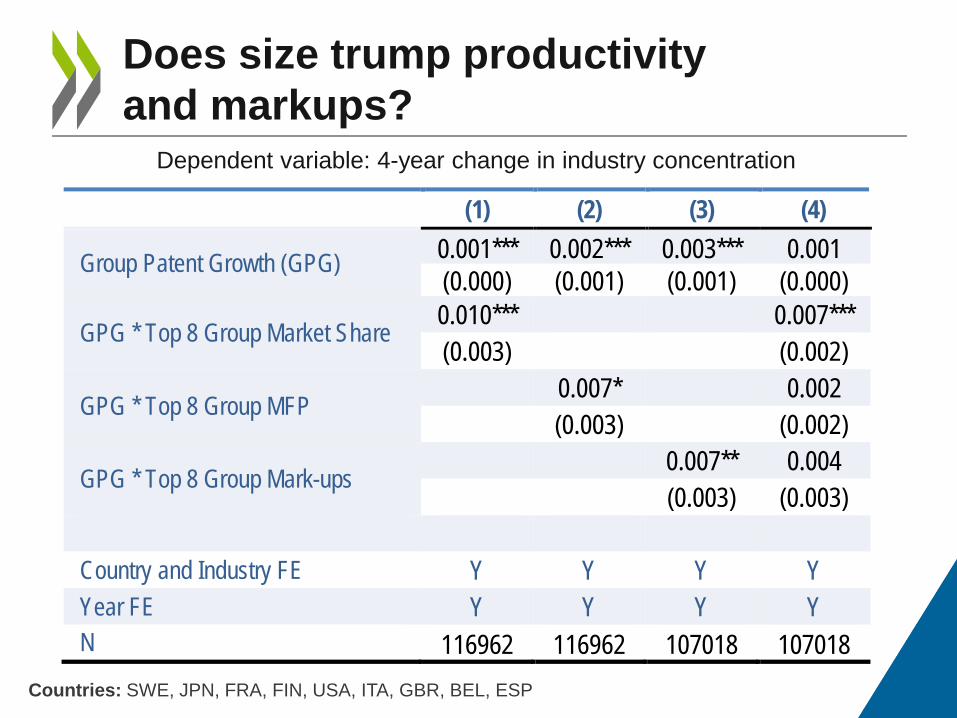
Does size trump productivity and markups?
Countries: SWE, JPN, FRA, FIN, USA, ITA, GBR, BEL, ESP
Dependent variable: 4-year change in industry concentration
(1) (2) (3) (4)
Group Patent Growth (GPG) 0.001*** 0.002*** 0.003*** 0.001 (0.000) (0.001) (0.001) (0.000)
GPG * Top 8 Group Market Share 0.010*** 0.007*** (0.003) (0.002)
GPG * Top 8 Group MFP 0.007* 0.002 (0.003) (0.002)
GPG * Top 8 Group Mark-ups 0.007** 0.004 (0.003) (0.003)
Country and Industry FE Y Y Y Y Year FE Y Y Y Y N 116962 116962 107018 107018

SUMMARY
24
• Concentration increased by 5p.p. on average (70% of country-industries)
• Intangible investment a strong predictor of concentration changes
• Effects especially strong in globalised, concentrated and digital country-industries
• Driven by investment in innovative assets • Who benefits determined by size more than by productivity or mark-ups
25
Summary of results
• Taken at face value, evidence of “good” concentration BUT more analysis needed:
• Same or different drivers of concentration increases in US vs international? (Crouzet and Eberly, 2018; Gutierrez and Philippon, 2019)
• Need finer measures of regulations, entry barriers etc. • Firm growing through innovation may nevertheless try to
entrench their position with entry barriers (Van Reenen, 2018; Ayyagari et al., 2019)
• Break-down of knowledge diffusion? (Andrews et al., 2016; Akcigit and Ates, 2019a,b; Berlingieri et al., forthcoming)
• Need for policies that encourage broader investment in intangibles; level-playing field (large incumbents vs start-ups) and knowledge diffusion (re-think IP?) 26
Implications

ANNEX
27
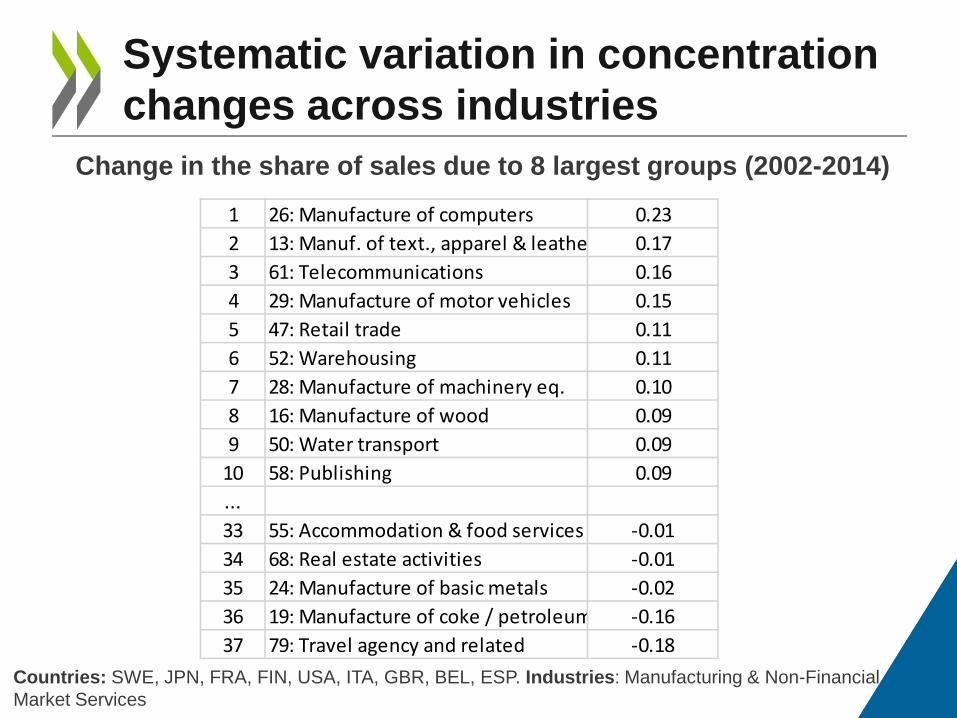
Systematic variation in concentration changes across industries
Countries: SWE, JPN, FRA, FIN, USA, ITA, GBR, BEL, ESP. Industries: Manufacturing & Non-Financial Market Services
Change in the share of sales due to 8 largest groups (2002-2014)
1 26: Manufacture of computers 0.232 13: Manuf. of text., apparel & leathe 0.173 61: Telecommunications 0.164 29: Manufacture of motor vehicles 0.155 47: Retail trade 0.116 52: Warehousing 0.117 28: Manufacture of machinery eq. 0.108 16: Manufacture of wood 0.099 50: Water transport 0.09
10 58: Publishing 0.09...33 55: Accommodation & food services -0.0134 68: Real estate activities -0.0135 24: Manufacture of basic metals -0.0236 19: Manufacture of coke / petroleum -0.1637 79: Travel agency and related -0.18

Changes in market shares of large groups correlated with intangibles
Countries: SWE, JPN, FRA, FIN, USA, ITA, GBR, BEL, ESP
Dependent variable: 4-year change in industry concentration
(1) (2) (3) (4) (5) (6) Innovative Property Investment
0.003*** 0.006*** 0.003*** 0.006*** 0.001** 0.004** (0.001) (0.001) (0.001) (0.001) (0.000) (0.002)
* Group Market Share 0.577* 0.582* (0.301) (0.304)
* Top 8 Group 0.025** 0.025** (0.011) (0.011)
Country and Industry FE Y Y Y Year FE Y Y Y Y Y Y N 200991 200991 200991 200991 200991 200991