Superior High-rate Performance of Core-shell Li Ti O … Electronic Supplementary Information (ESI)...
18
1 Electronic Supplementary Information (ESI) Superior High-rate Performance of Core-shell Li 4 Ti 5 O 12 /Carbon Nanocomposite Synthesized by a Supercritical Alcohol Approach Agung Nugroho, Wonyoung Chang, Su Jin Kim, Kyung Yoon Chung, and Jaehoon Kim* Synthesis of Li 4 Ti 5 O 12 14.27 mg of LiOH∙H 2 O (purity 98 wt%, Sigma-Aldrich, St Louis, MO, USA), 56.9 mg of oleylamine (purity 70 wt%, Sigma-Aldrich), and 122.1 mg of TTIP (purity 97 wt%, Sigma-Aldrich) were charged into 3.5 mL of MeOH and the suspension was transferred into an SUS316 tube reactor with an inner volume of 11 mL. The reactor was then heated in a molten-salt bath at 400 °C. After 15 min, the resulting precipitates were washed carefully with MeOH to remove residual organic species followed by vacuum drying at 100 °C for 12 h. The samples, referred to as LTO-OA1 and LTO-OA2, were calcined at a temperature of 750 °C for 5 h in an Ar/5% H 2 flow. The calcined samples are referred to as LTO-OA1-750C and LTO-OA2-750C, respectively. The micron-sized LTO sample prepared using a solid-state method is referred to as LTO-SS. The submicron-sized LTO sample prepared in supercritical water with subsequent calcination in air at 700 °C is referred to as LTO- scH 2 O-700C. Detailed synthetic conditions were described in our previous paper. 1 The LTO sample prepared in scMeOH with subsequent calcination in air at 600 °C is referred to as LTO-scMeOH-600C. Characterization The crystal structures of the samples were characterized using XRD (Rigaku RINT2000, Tokyo, Japan) with Cu Kα radiation at 40 kV and 50 mA. The organic functional groups on the surface of LTO were characterized using a NICOLET 380 FT-IR spectrometer (Thermo Electron Co. NJ, USA). The thermal properties of the obtained particles were measured using a DuPont Instruments TGA 2950 thermal gravimetric analyzer. The particle morphologies were observed using HR-TEM (Tecnai FT20, FEI Co., OR, USA). The electrochemical performance of the sample was tested using a Type CR2032 coin cell (counter electrode: Li metal, electrolyte: 1 M LiPF 6 dissolved in ethylene carbonate (EC)/dimethyl carbonate (DMC)/ethyl methyl carbonate (EMC), volume ratio of EC/DMC/EMC = 1:1:1, weight ratio of LTO/carbon black/poly(vinylidene fluoride) = 87:8:5). The cells were galvanostatically charged and discharged in the voltage range from 1.0 to 2.5 V (vs. Li/Li + ) using a MACCOR Series 4000 Battery Test System (OK, USA). Electronic Supplementary Material (ESI) for RSC Advances This journal is © The Royal Society of Chemistry 2012
Transcript of Superior High-rate Performance of Core-shell Li Ti O … Electronic Supplementary Information (ESI)...
1
Electronic Supplementary Information (ESI)
Superior High-rate Performance of Core-shell Li4Ti5O12/Carbon
Nanocomposite Synthesized by a Supercritical Alcohol Approach
Agung Nugroho, Wonyoung Chang, Su Jin Kim, Kyung Yoon Chung, and Jaehoon Kim*
Synthesis of Li4Ti5O12
14.27 mg of LiOH∙H2O (purity 98 wt%, Sigma-Aldrich, St Louis, MO, USA), 56.9 mg of oleylamine (purity 70
wt%, Sigma-Aldrich), and 122.1 mg of TTIP (purity 97 wt%, Sigma-Aldrich) were charged into 3.5 mL of
MeOH and the suspension was transferred into an SUS316 tube reactor with an inner volume of 11 mL. The
reactor was then heated in a molten-salt bath at 400 °C. After 15 min, the resulting precipitates were washed
carefully with MeOH to remove residual organic species followed by vacuum drying at 100 °C for 12 h. The
samples, referred to as LTO-OA1 and LTO-OA2, were calcined at a temperature of 750 °C for 5 h in an Ar/5%
H2 flow. The calcined samples are referred to as LTO-OA1-750C and LTO-OA2-750C, respectively. The
micron-sized LTO sample prepared using a solid-state method is referred to as LTO-SS. The submicron-sized
LTO sample prepared in supercritical water with subsequent calcination in air at 700 °C is referred to as LTO-
scH2O-700C. Detailed synthetic conditions were described in our previous paper.1 The LTO sample prepared in
scMeOH with subsequent calcination in air at 600 °C is referred to as LTO-scMeOH-600C.
Characterization
The crystal structures of the samples were characterized using XRD (Rigaku RINT2000, Tokyo, Japan) with Cu
Kα radiation at 40 kV and 50 mA. The organic functional groups on the surface of LTO were characterized
using a NICOLET 380 FT-IR spectrometer (Thermo Electron Co. NJ, USA). The thermal properties of the
obtained particles were measured using a DuPont Instruments TGA 2950 thermal gravimetric analyzer. The
particle morphologies were observed using HR-TEM (Tecnai FT20, FEI Co., OR, USA). The electrochemical
performance of the sample was tested using a Type CR2032 coin cell (counter electrode: Li metal, electrolyte: 1
M LiPF6 dissolved in ethylene carbonate (EC)/dimethyl carbonate (DMC)/ethyl methyl carbonate (EMC),
volume ratio of EC/DMC/EMC = 1:1:1, weight ratio of LTO/carbon black/poly(vinylidene fluoride) = 87:8:5).
The cells were galvanostatically charged and discharged in the voltage range from 1.0 to 2.5 V (vs. Li/Li+) using
a MACCOR Series 4000 Battery Test System (OK, USA).
Electronic Supplementary Material (ESI) for RSC AdvancesThis journal is © The Royal Society of Chemistry 2012

2
Table S1. Different synthesis and coating methods of carbon-coated LTO and its electrochemical performance
Samples LTO Synthesis
method
Carbon coating
method
Calcination
condition
LTO size/LTO
morphology/coating
content/coating
thickness/coating
structure
Cell composition
(active
material:AB:bind
er) and
Working voltage
Discharge
capacity
(mAh/g)
Refs
LTO/Ca Supercritical
methanol
Carbonization from
oleyamine modified
LTO
750 oC, 6 h, in
Ar+H2
5-15 nm/
nanoparticle/ 6-14%/
0.7-2.3 nm/ layer
87:8:5
1.0-2.5 V
147 (at 10C)
139 (at 20C)
128 (at 30C)
101 (at 50C)
This study
LTO/Ti(III)/Cb Solid-state In situ
polymerization of
aniline
800 oC, 24 h, in
Ar+H2
50-70 nm/
nanoparticle/3%/NA
/NA
80:15:5
1.0-3.0 V
115 (at ~ 10C)
75 (at ~ 20C)
Wang et
al., 20092
LTO/C-Nc Spray-drying Pyrolysis of urea 400
oC, 30 min, in
Ar+H2
NA/porous/NA/
2 nm/thin layer
80:10:10
1.0-2.2 V
105 (at 10C) Pan et al.,
20123
LTO/C-Nd Spray-drying Pyrolysis of ionic
liquid
600 oC, in Ar NA/porous/7%/
2-3 nm/thin layer
80:10:10
1.0-2.2 V
129 (at 10C) Zhao et al.,
20114
LTO/Ce Solid-state Thermal vapor
decomposition of
toluene
800 oC, 2 h, in N2 NA/nanoparticle/3%
/3-5 nm/thin layer
90:5:10
1.0-3.0 V
12.5 (at 20C) Cheng et
al., 20075
LTO/Cf Solid-state Chemical vapor
deposition
800 oC, in inert 50-80 nm/nanorod/
3% /5 nm/thin layer
90:5:10
1.0-3.0 V
140 (at 10C)
120 (at 20C)
Cheng et
al., 20106
LTO/Cg Anionic
Polymerization
Self assembly
block coplymer
700 oC, 2 h, in N2 NA/mesostructure/
8.5% /NA/thin layer
80:10:10
1.0-2.5 V
115 (at 10C)
90 (at 50C)
Kang et al.,
20117
LTO/Ch High-energy
ball-miling
assited solid-
phase
Carbonization from
sucrose
750 oC, 5 h, in
Ar+H2.
20-30 nm/
nanoparticle/4.3%/
1-3 nm /thin layer
85:8:7
1.0-3.0 V
121 (at 10C)
110 (at 20C)
90 (at 40C)
Yuan et al.,
20118
Electronic Supplementary Material (ESI) for RSC AdvancesThis journal is © The Royal Society of Chemistry 2012

3
LTO/Ci Spray drying Pyrolysis of
C28H16Br2
400 oC 50 nm/ porous
microsphere/ 5.9% /
1 nm /ultrathin layer
80:10:10
1.0-2.2 V
1.0-3.0 V
131 (at 5C)
104 (at 10C)
Jian et al.,
20129
LTO/Cj Spray drying Carbonization of
sugar
800 oC, 10 h, in N2 200 nm/ porous
microsphere/ 6%
/6nm /thin layer
85:5:10
1.0-3.0 V
129 (at 10C)
126 (at 20C)
Zhu et al.,
201110
LTO/Ck Sol-gel Pyrolysis of citric
acid
800 oC, 15 h in Ar 200-700 nm/
nanoparticle/2-5%/ 2-
10 nm /thin layer
85:10:5
1.0-3.0 V
~ 100 (at 5C) Wang et
al., 201111
LTO/Cl Cellulose-
assisted
combustion
process
Carbonization from
sucrose
700 °C for 5 h in
air
700-900 nm/
microparticle/ 3.35%
/5 nm /thin layer
85:8:7
1.0-2.0 V
~ 130 (at 10C) Yuan et al.,
201012
LTO/Cm Solid state
method
Carbonization of
multiwall CNT
800 °C for 10 h in
Ar
NA/microparticle/
3.04% /NA/NA
85:10:5
1.0-3.0 V
134 (at 10C) Li et al.,
201013
LTO/Cn Rheological
phase method
Polyvinylbutyral as
template and
carbon source
800 °C for 15 h in
Ar
2.1 μm/
microparticle/0.98% /
NA/thin layer
80:10:10
1.0-2.6 V
127 (at 3C) Liu et al.,
200814
LTO/Co Solid state
method
Carbonization of
sugar
850 °C for 24 h in
air
NA/microparticle/
NA/NA/NA
80:10:10
1.0-2.5 V
40 (at 2C) Wang et
al., 200715
LTO/C/CNTp Solid state
method
Carbonization
using pitch and
CNT
800 °C for 12 h in
Ar
NA/microparticle
/6%/NA/NA
92:3:5
1.0-3.0 V
143 (10C) Li et al.,
201016
LTO/Cq Solid state
method
Carbonization
using PAA, CA,
MA, PVA
800 °C for 8 h in
N2
0.1-1 μm/
microparticle/ 3-4.5%
/NA/NA
86:10:4
1.0-3.0 V
133 (10C) Hu et al.,
201117
LTO/Pr Thermal
decomposition
Thermal
decomposition of
trioctylphosphine
600 oC, 2 h, in
Ar+H2.
30-52 nm/
nanoparticle/NA/NA
/NA
80:11:9
1.0-3.0 V
100 (at 10C) Jo et al.,
201118
Electronic Supplementary Material (ESI) for RSC AdvancesThis journal is © The Royal Society of Chemistry 2012
4
LTO/Ns Thermal
Nitridation
Thermal nitridation
using NH3
700 oC, 1 h, in
NH3.
NA/nanoparticle/NA
/NA/NA
82:10:8
1.0-3.0 V
120 (at 10C) Park et al.,
200819
LTOt Solution-
combustion
method
NA 20-50 nm/
nanoparticle/NA/NA
/NA
80:15:5
1.0-2.0 V
140 (at 10C)
102 (at 50C)
Prakash et
al., 201020
LTOu Microwave-
assisted
hydrothermal
NA 550 oC, 6 h, in Air 500-800 nm/
nanoparticle/NA/NA
/NA
80:10:10
1.0-3.0 V
100 (at 10C)
62 (at 40C)
Chou et al.,
201121
LTOv Thermal method NA 800
oC, 3 h 80-100 nm/nanowire/
NA/NA/NA
90:5:5
1.0-2.5 V
155 (at 10C) Kim et al.,
200722
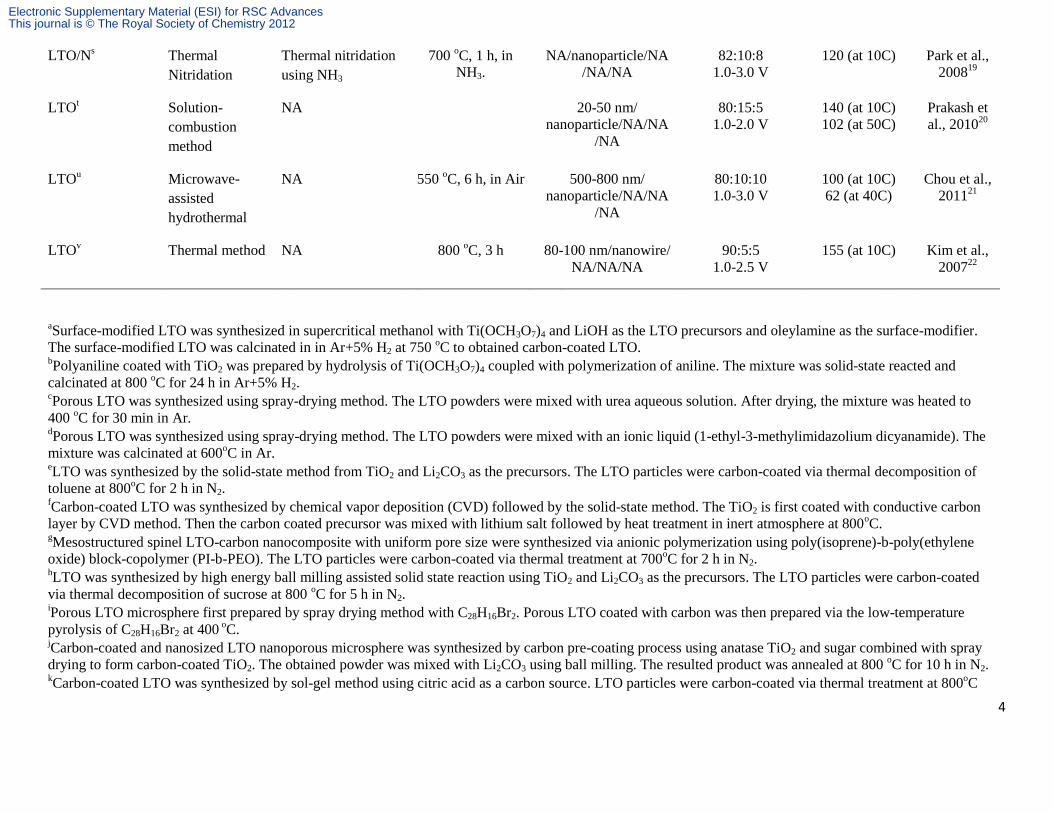
aSurface-modified LTO was synthesized in supercritical methanol with Ti(OCH3O7)4 and LiOH as the LTO precursors and oleylamine as the surface-modifier.
The surface-modified LTO was calcinated in in Ar+5% H2 at 750 oC to obtained carbon-coated LTO.
bPolyaniline coated with TiO2 was prepared by hydrolysis of Ti(OCH3O7)4 coupled with polymerization of aniline. The mixture was solid-state reacted and
calcinated at 800 oC for 24 h in Ar+5% H2.
cPorous LTO was synthesized using spray-drying method. The LTO powders were mixed with urea aqueous solution. After drying, the mixture was heated to
400 oC for 30 min in Ar.
dPorous LTO was synthesized using spray-drying method. The LTO powders were mixed with an ionic liquid (1-ethyl-3-methylimidazolium dicyanamide). The
mixture was calcinated at 600oC in Ar.
eLTO was synthesized by the solid-state method from TiO2 and Li2CO3 as the precursors. The LTO particles were carbon-coated via thermal decomposition of
toluene at 800oC for 2 h in N2.
fCarbon-coated LTO was synthesized by chemical vapor deposition (CVD) followed by the solid-state method. The TiO2 is first coated with conductive carbon
layer by CVD method. Then the carbon coated precursor was mixed with lithium salt followed by heat treatment in inert atmosphere at 800oC.
gMesostructured spinel LTO-carbon nanocomposite with uniform pore size were synthesized via anionic polymerization using poly(isoprene)-b-poly(ethylene
oxide) block-copolymer (PI-b-PEO). The LTO particles were carbon-coated via thermal treatment at 700oC for 2 h in N2.
hLTO was synthesized by high energy ball milling assisted solid state reaction using TiO2 and Li2CO3 as the precursors. The LTO particles were carbon-coated
via thermal decomposition of sucrose at 800 oC for 5 h in N2.
iPorous LTO microsphere first prepared by spray drying method with C28H16Br2. Porous LTO coated with carbon was then prepared via the low-temperature
pyrolysis of C28H16Br2 at 400 oC.
jCarbon-coated and nanosized LTO nanoporous microsphere was synthesized by carbon pre-coating process using anatase TiO2 and sugar combined with spray
drying to form carbon-coated TiO2. The obtained powder was mixed with Li2CO3 using ball milling. The resulted product was annealed at 800 oC for 10 h in N2.
kCarbon-coated LTO was synthesized by sol-gel method using citric acid as a carbon source. LTO particles were carbon-coated via thermal treatment at 800
oC
Electronic Supplementary Material (ESI) for RSC AdvancesThis journal is © The Royal Society of Chemistry 2012
5
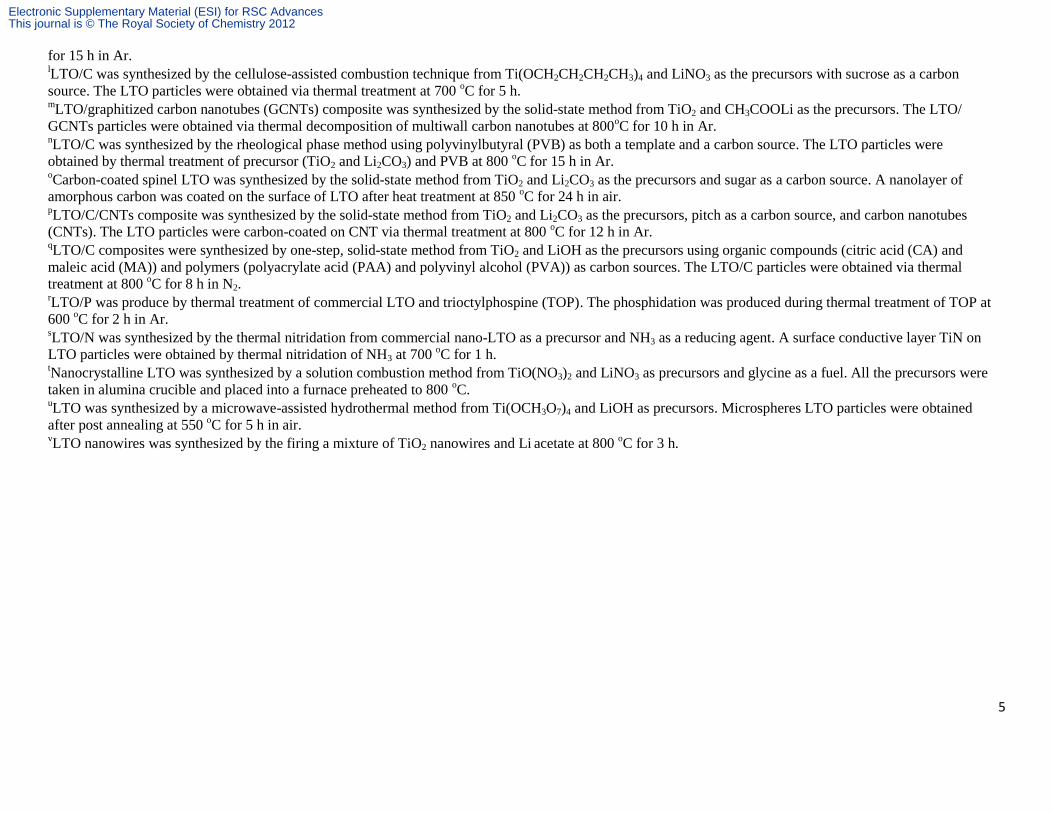
for 15 h in Ar. lLTO/C was synthesized by the cellulose-assisted combustion technique from Ti(OCH2CH2CH2CH3)4 and LiNO3 as the precursors with sucrose as a carbon
source. The LTO particles were obtained via thermal treatment at 700 oC for 5 h.
mLTO/graphitized carbon nanotubes (GCNTs) composite was synthesized by the solid-state method from TiO2 and CH3COOLi as the precursors. The LTO/
GCNTs particles were obtained via thermal decomposition of multiwall carbon nanotubes at 800oC for 10 h in Ar.
nLTO/C was synthesized by the rheological phase method using polyvinylbutyral (PVB) as both a template and a carbon source. The LTO particles were
obtained by thermal treatment of precursor (TiO2 and Li2CO3) and PVB at 800 oC for 15 h in Ar.
oCarbon-coated spinel LTO was synthesized by the solid-state method from TiO2 and Li2CO3 as the precursors and sugar as a carbon source. A nanolayer of
amorphous carbon was coated on the surface of LTO after heat treatment at 850 oC for 24 h in air.
pLTO/C/CNTs composite was synthesized by the solid-state method from TiO2 and Li2CO3 as the precursors, pitch as a carbon source, and carbon nanotubes
(CNTs). The LTO particles were carbon-coated on CNT via thermal treatment at 800 oC for 12 h in Ar.
qLTO/C composites were synthesized by one-step, solid-state method from TiO2 and LiOH as the precursors using organic compounds (citric acid (CA) and
maleic acid (MA)) and polymers (polyacrylate acid (PAA) and polyvinyl alcohol (PVA)) as carbon sources. The LTO/C particles were obtained via thermal
treatment at 800 oC for 8 h in N2.
rLTO/P was produce by thermal treatment of commercial LTO and trioctylphospine (TOP). The phosphidation was produced during thermal treatment of TOP at
600 oC for 2 h in Ar.
sLTO/N was synthesized by the thermal nitridation from commercial nano-LTO as a precursor and NH3 as a reducing agent. A surface conductive layer TiN on
LTO particles were obtained by thermal nitridation of NH3 at 700 oC for 1 h.
tNanocrystalline LTO was synthesized by a solution combustion method from TiO(NO3)2 and LiNO3 as precursors and glycine as a fuel. All the precursors were
taken in alumina crucible and placed into a furnace preheated to 800 oC.
uLTO was synthesized by a microwave-assisted hydrothermal method from Ti(OCH3O7)4 and LiOH as precursors. Microspheres LTO particles were obtained
after post annealing at 550 oC for 5 h in air.
vLTO nanowires was synthesized by the firing a mixture of TiO2 nanowires and Li acetate at 800
oC for 3 h.
Electronic Supplementary Material (ESI) for RSC AdvancesThis journal is © The Royal Society of Chemistry 2012

6
Fig. S1. The powder X-ray diffraction patterns of LTO-scMeOH, LTO-OA1, LTO-OA2, LTO-OA1-750C and
LTO-OA2-750C.
The powder X-ray diffraction (PXRD) patterns of unmodified LTO (LTO-scMeOH), oleylamine-modified LTO
(LTO-OA1 and LTO-OA2) synthesized in supercritical methanol (scMeOH), and core-shell LTO/C
nanocomposite (LTO-OA1-750C and LTO-OA2-750C) by the calcination of the oleylamine-modified LTO at
750 °C in an Ar+5% H2 flow. Titanium tetraisopropoxide (TTIP) was used as the Ti source. The mole ratio of
TTIP:oleylamine was 10:1 for synthesizing the LTO-OA1 sample and was 10:8 for synthesizing the LTO-OA2
sample. All main diffraction peaks observed for the synthesized particles can be assigned to spinel LTO pattern
(JCPDS No.49-0207), indicating highly phase-pure LTO was synthesized in scMeOH at the short reaction time
of 15 min. The crystallite size estimated using the Scherrer equation and (111) peak was estimated to be 4.9 nm,
4.2 nm, and 2.0 nm for LTO-scMeOH, LTO-OA1, and LTO-OA2 samples, respectively. After carbon layer
formation onto LTO surface by the calcination, slight increase in the LTO crystallite size was observed; the
crystallite size for LTO-OA1-750C and LTO-OA2-750C estimated to be 9.2 nm and 5.0 nm, respectively.
Electronic Supplementary Material (ESI) for RSC AdvancesThis journal is © The Royal Society of Chemistry 2012

7
Fig. S2. Fourier transform infrared (FT-IR) spectroscopy of LTO-scMeOH, LTO-OA1, LTO-OA2, LTO-OA1-
750C and LTO-OA2-750C.
The surface functional groups were examined by Fourier transform infrared (FT-IR) spectroscopy. The FT-IR
spectra of the LTO-scMeOH exhibits methyl (-CH3) stretching peak at 2926 cm-1
and -OH stretching peak at
3000-3750 cm-1
, suggesting that supercritical methanol acts as a methylation, hydroxylation, and methoxylation
agent.23-24
The presence medium stretching peak (2850 cm-1
) and strong bending peak (1450 cm-1
) of -CH2-, and
-CH3 stretching peak at 2920 cm-1
in LTO-OA1 and LTO-OA2 indicates the presence of olelyamine on the LTO
surface. After the calcination, the -CH2- and -CH3 peaks disappeared. The peak of 1436 and 1498 cm-1
is
associated with Li2CO3 which is attach on the surface due to reaction of remain LiOH with CO2, while peak of
1621 cm-1
is bending mode of water molecule.25-26
Electronic Supplementary Material (ESI) for RSC AdvancesThis journal is © The Royal Society of Chemistry 2012

8
Fig. S3.HR-TEM image of LTO-OA1
Electronic Supplementary Material (ESI) for RSC AdvancesThis journal is © The Royal Society of Chemistry 2012

9
Fig. S4.HR-TEM image of LTO-OA2
Electronic Supplementary Material (ESI) for RSC AdvancesThis journal is © The Royal Society of Chemistry 2012

10
Fig. S5. Raman spectra of LTO-OA1-750C and LTO-OA2-750C.
The structure of the carbon in the LTO/C nanocomposites was monitored using Raman spectroscopy. The band
at 1591 cm-1
is one of the E2g modes (or G band, sp2), which is associated with a graphene sheet. The band at
1338 cm-1
is one of the D bands (sp3), which is an amorphous carbon band. The high ID/IG ratio indicates that
the high content of graphitic carbon in the LTO/C sample.
Electronic Supplementary Material (ESI) for RSC AdvancesThis journal is © The Royal Society of Chemistry 2012
11
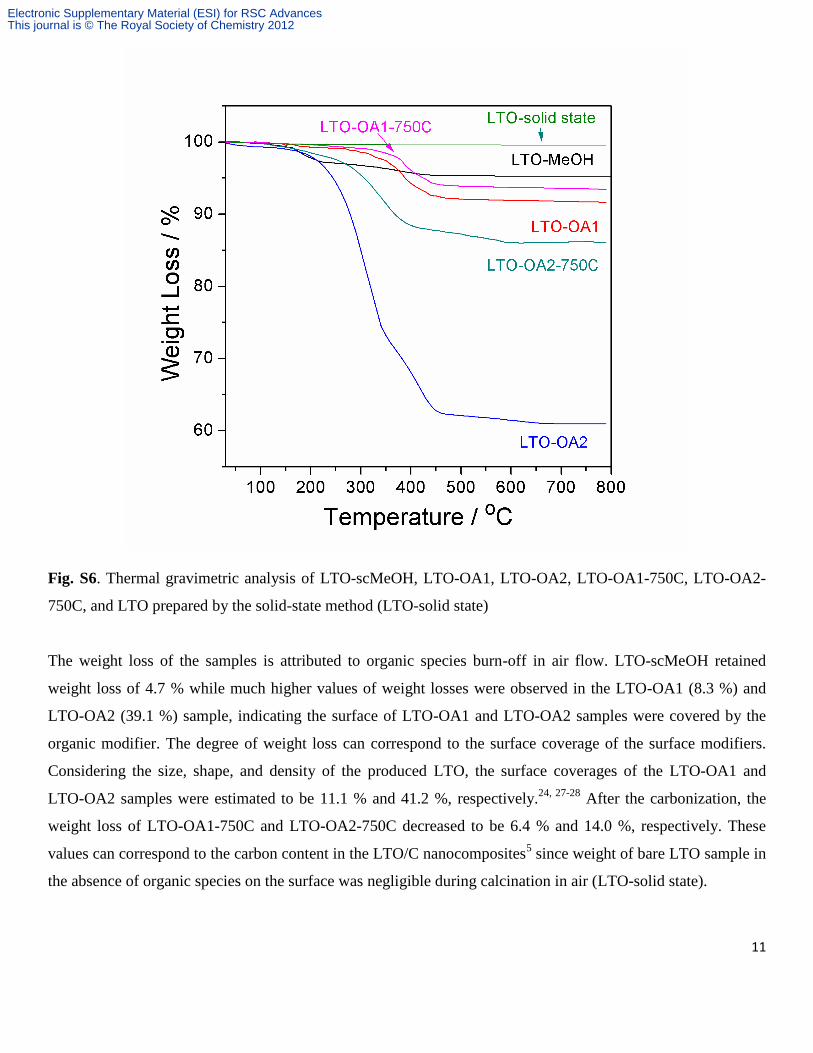
Fig. S6. Thermal gravimetric analysis of LTO-scMeOH, LTO-OA1, LTO-OA2, LTO-OA1-750C, LTO-OA2-
750C, and LTO prepared by the solid-state method (LTO-solid state)
The weight loss of the samples is attributed to organic species burn-off in air flow. LTO-scMeOH retained
weight loss of 4.7 % while much higher values of weight losses were observed in the LTO-OA1 (8.3 %) and
LTO-OA2 (39.1 %) sample, indicating the surface of LTO-OA1 and LTO-OA2 samples were covered by the
organic modifier. The degree of weight loss can correspond to the surface coverage of the surface modifiers.
Considering the size, shape, and density of the produced LTO, the surface coverages of the LTO-OA1 and
LTO-OA2 samples were estimated to be 11.1 % and 41.2 %, respectively.24, 27-28
After the carbonization, the
weight loss of LTO-OA1-750C and LTO-OA2-750C decreased to be 6.4 % and 14.0 %, respectively. These
values can correspond to the carbon content in the LTO/C nanocomposites5 since weight of bare LTO sample in
the absence of organic species on the surface was negligible during calcination in air (LTO-solid state).
Electronic Supplementary Material (ESI) for RSC AdvancesThis journal is © The Royal Society of Chemistry 2012
12
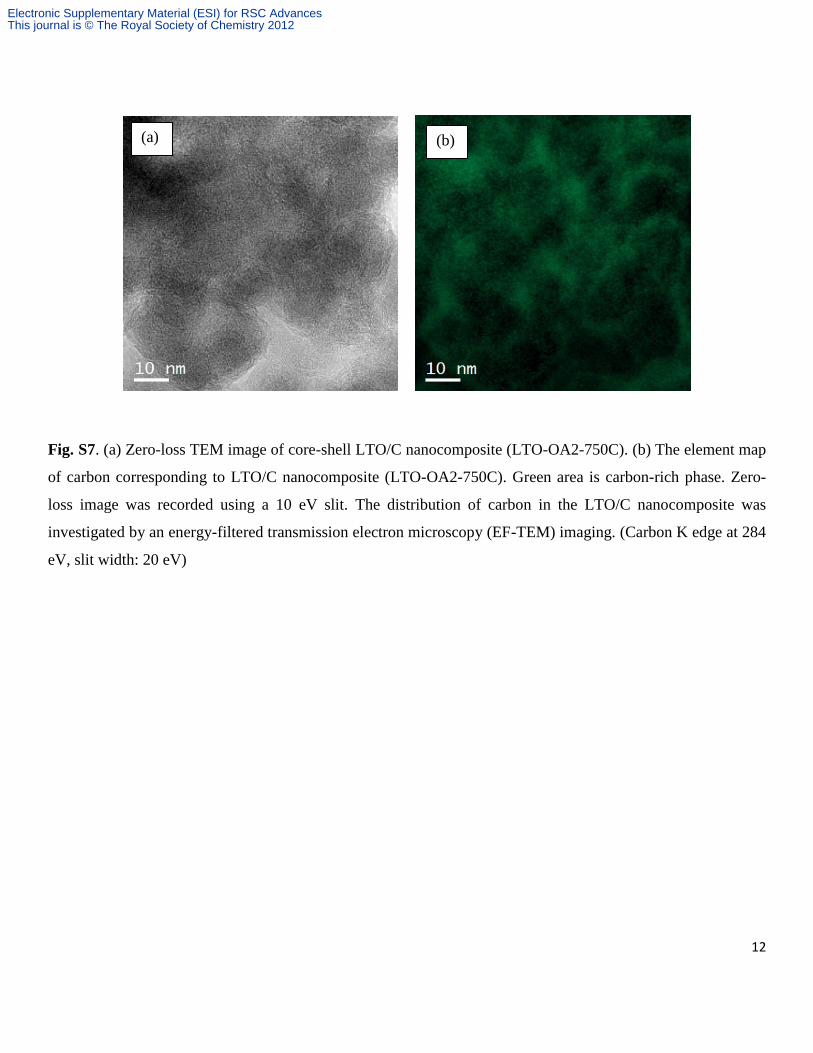
Fig. S7. (a) Zero-loss TEM image of core-shell LTO/C nanocomposite (LTO-OA2-750C). (b) The element map
of carbon corresponding to LTO/C nanocomposite (LTO-OA2-750C). Green area is carbon-rich phase. Zero-
loss image was recorded using a 10 eV slit. The distribution of carbon in the LTO/C nanocomposite was
investigated by an energy-filtered transmission electron microscopy (EF-TEM) imaging. (Carbon K edge at 284
eV, slit width: 20 eV)
(a) (b)
Electronic Supplementary Material (ESI) for RSC AdvancesThis journal is © The Royal Society of Chemistry 2012

13
Fig. S8. SEM or TEM image of (a) LTO-SS, (b) LTO-scH2O-700C, and (c) LTO-scMeOH-600C
Electronic Supplementary Material (ESI) for RSC AdvancesThis journal is © The Royal Society of Chemistry 2012

14
Fig. S9. The galvanostatic discharge/charge curves for Li insertion-extraction of each sample at 1 C
Electronic Supplementary Material (ESI) for RSC AdvancesThis journal is © The Royal Society of Chemistry 2012

15
Fig. S10. The cyclability of the core-shell LTO/C nanocomposite (LTO-OA2-750C) at different testing
temperatures.
Electronic Supplementary Material (ESI) for RSC AdvancesThis journal is © The Royal Society of Chemistry 2012
16
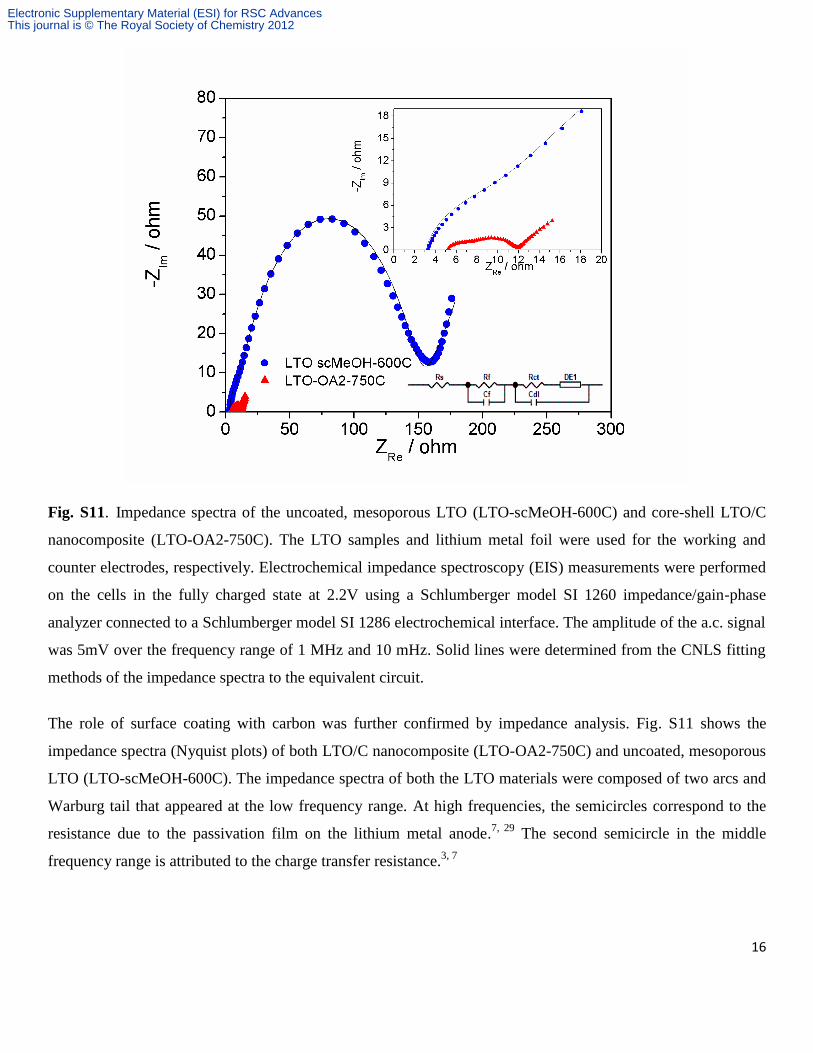
Fig. S11. Impedance spectra of the uncoated, mesoporous LTO (LTO-scMeOH-600C) and core-shell LTO/C
nanocomposite (LTO-OA2-750C). The LTO samples and lithium metal foil were used for the working and
counter electrodes, respectively. Electrochemical impedance spectroscopy (EIS) measurements were performed
on the cells in the fully charged state at 2.2V using a Schlumberger model SI 1260 impedance/gain-phase
analyzer connected to a Schlumberger model SI 1286 electrochemical interface. The amplitude of the a.c. signal
was 5mV over the frequency range of 1 MHz and 10 mHz. Solid lines were determined from the CNLS fitting
methods of the impedance spectra to the equivalent circuit.
The role of surface coating with carbon was further confirmed by impedance analysis. Fig. S11 shows the
impedance spectra (Nyquist plots) of both LTO/C nanocomposite (LTO-OA2-750C) and uncoated, mesoporous
LTO (LTO-scMeOH-600C). The impedance spectra of both the LTO materials were composed of two arcs and
Warburg tail that appeared at the low frequency range. At high frequencies, the semicircles correspond to the
resistance due to the passivation film on the lithium metal anode.7, 29
The second semicircle in the middle
frequency range is attributed to the charge transfer resistance.3, 7
Electronic Supplementary Material (ESI) for RSC AdvancesThis journal is © The Royal Society of Chemistry 2012
17
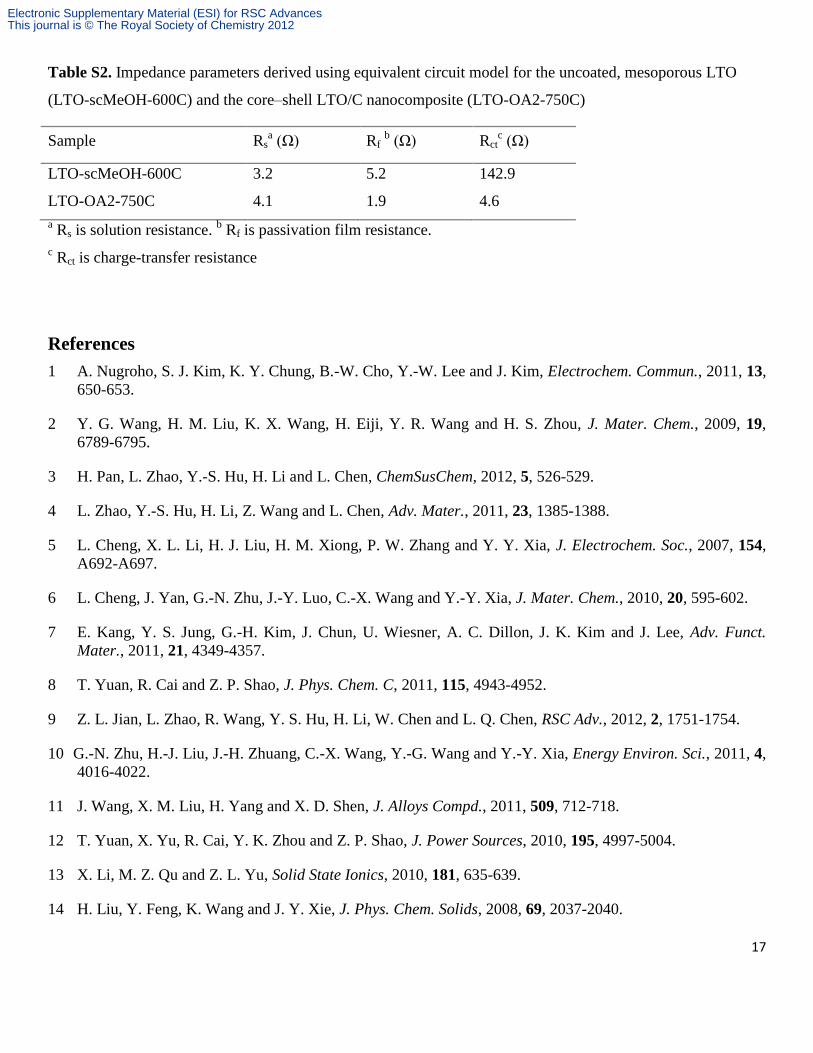
Table S2. Impedance parameters derived using equivalent circuit model for the uncoated, mesoporous LTO
(LTO-scMeOH-600C) and the core–shell LTO/C nanocomposite (LTO-OA2-750C)
Sample Rsa (Ω) Rf
b (Ω) Rct
c (Ω)
LTO-scMeOH-600C 3.2 5.2 142.9
LTO-OA2-750C 4.1 1.9 4.6
a Rs is solution resistance.
b Rf is passivation film resistance.
c Rct is charge-transfer resistance
References
1 A. Nugroho, S. J. Kim, K. Y. Chung, B.-W. Cho, Y.-W. Lee and J. Kim, Electrochem. Commun., 2011, 13,
650-653.
2 Y. G. Wang, H. M. Liu, K. X. Wang, H. Eiji, Y. R. Wang and H. S. Zhou, J. Mater. Chem., 2009, 19,
6789-6795.
3 H. Pan, L. Zhao, Y.-S. Hu, H. Li and L. Chen, ChemSusChem, 2012, 5, 526-529.
4 L. Zhao, Y.-S. Hu, H. Li, Z. Wang and L. Chen, Adv. Mater., 2011, 23, 1385-1388.
5 L. Cheng, X. L. Li, H. J. Liu, H. M. Xiong, P. W. Zhang and Y. Y. Xia, J. Electrochem. Soc., 2007, 154,
A692-A697.
6 L. Cheng, J. Yan, G.-N. Zhu, J.-Y. Luo, C.-X. Wang and Y.-Y. Xia, J. Mater. Chem., 2010, 20, 595-602.
7 E. Kang, Y. S. Jung, G.-H. Kim, J. Chun, U. Wiesner, A. C. Dillon, J. K. Kim and J. Lee, Adv. Funct.
Mater., 2011, 21, 4349-4357.
8 T. Yuan, R. Cai and Z. P. Shao, J. Phys. Chem. C, 2011, 115, 4943-4952.
9 Z. L. Jian, L. Zhao, R. Wang, Y. S. Hu, H. Li, W. Chen and L. Q. Chen, RSC Adv., 2012, 2, 1751-1754.
10 G.-N. Zhu, H.-J. Liu, J.-H. Zhuang, C.-X. Wang, Y.-G. Wang and Y.-Y. Xia, Energy Environ. Sci., 2011, 4,
4016-4022.
11 J. Wang, X. M. Liu, H. Yang and X. D. Shen, J. Alloys Compd., 2011, 509, 712-718.
12 T. Yuan, X. Yu, R. Cai, Y. K. Zhou and Z. P. Shao, J. Power Sources, 2010, 195, 4997-5004.
13 X. Li, M. Z. Qu and Z. L. Yu, Solid State Ionics, 2010, 181, 635-639.
14 H. Liu, Y. Feng, K. Wang and J. Y. Xie, J. Phys. Chem. Solids, 2008, 69, 2037-2040.
Electronic Supplementary Material (ESI) for RSC AdvancesThis journal is © The Royal Society of Chemistry 2012

18
15 G. J. Wang, J. Gao, L. J. Fu, N. H. Zhao, Y. P. Wu and T. Takamura, J. Power Sources, 2007, 174, 1109-
1112.
16 X. Li, M. Z. Qu, Y. J. Huai and Z. L. Yu, Electrochim. Acta, 2010, 55, 2978-2982.
17 X. B. Hu, Z. J. Lin, K. R. Yang, Y. J. Huai and Z. H. Deng, Electrochim. Acta, 2011, 56, 5046-5053.
18 M. R. Jo, K. M. Nam, Y. Lee, K. Song, J. T. Park and Y. M. Kang, Chem. Commun., 2011, 47, 11474-
11476.
19 K. S. Park, A. Benayad, D. J. Kang and S. G. Doo, J. Am. Chem. Soc., 2008, 130, 14930-14931.
20 A. S. Prakash, P. Manikandan, K. Ramesha, M. Sathiya, J. M. Tarascon and A. K. Shukla, Chem. Mater.,
2010, 22, 2857-2863.
21 S. L. Chou, J. Z. Wang, H. K. Liu and S. X. Dou, J. Phys. Chem. C, 2011, 115, 16220-16227.
22 J. Kim and J. Cho, Electrochem. Solid-State Lett., 2007, 10, A81-A84.
23 J. Kim, Y.-S. Park, B. Veriansyah, J.-D. Kim and Y.-W. Lee, Chem. Mater., 2008, 20, 6301-6303.
24 B. Veriansyah, H. Park, J.-D. Kim, B. K. Min, Y. H. Shin, Y.-W. Lee and J. Kim, J. Supercrit. Fluids, 2009,
50, 283-291.
25 N. R. Smyrl, E. L. Fuller and G. L. Powell, Appl. Spectrosc., 1983, 37, 38-44.
26 M. Q. Snyder, W. J. DeSisto and C. P. Tripp, Appl. Surf. Sci., 2007, 253, 9336-9341.
27 A. Nugroho, B. Veriansyah, S. K. Kim, B. G. Lee, J. Kim and Y.-W. Lee, Chem. Eng. J., 2012, 193–194,
146-153.
28 B. Veriansyah, J.-D. Kim, B. K. Min, Y. H. Shin, Y.-W. Lee and J. Kim, J. Supercrit. Fluids, 2010, 52, 76-
83.
29 N. Schweikert, H. Hahn and S. Indris, Phys. Chem. Chem. Phys., 2011, 13, 6234-6240.
Electronic Supplementary Material (ESI) for RSC AdvancesThis journal is © The Royal Society of Chemistry 2012