Supercomputer End Users: the OptIPuter Killer Application
51
Supercomputer End Users: the OptIPuter Killer Application Keynote TeraGrid ‘08 Las Vegas, NV June 11, 2008 Dr. Larry Smarr Director, California Institute for Telecommunications and Information Technology Harry E. Gruber Professor, Dept. of Computer Science and Engineering Jacobs School of Engineering, UCSD
-
Upload
larry-smarr -
Category
Business
-
view
1.191 -
download
0
Transcript of Supercomputer End Users: the OptIPuter Killer Application

Supercomputer End Users:the OptIPuter Killer Application
KeynoteTeraGrid ‘08
Las Vegas, NVJune 11, 2008
Dr. Larry SmarrDirector, California Institute for Telecommunications and
Information TechnologyHarry E. Gruber Professor,
Dept. of Computer Science and EngineeringJacobs School of Engineering, UCSD

AbstractDuring the last few years, a radical restructuring of optical networks supporting e-Science projects has occurred around the world. U.S. universities are beginning to acquire access to high bandwidth lightwaves (termed "lambdas") on fiber optics through the National LambdaRail, Internet2's Circuit Services, and the Global Lambda Integrated Facility. The NSF-funded OptIPuter project explores how user controlled 1- or 10- Gbps lambdas can provide direct access to global data repositories, scientific instruments, and computational resources from the researcher's Linux clusters in their campus laboratories. These end user clusters are reconfigured as "OptIPortals," providing the end user with local scalable visualization, computing, and storage. I will describe how this user configurable OptIPuter global platform opens new frontiers in collaborative work environments, digital cinema, biomedical instruments,and marine microbial metagenomics. However, a major new user community should be end users of TeraGrid, allowing them to directly optically connect to the remote Tera or Peta-scale resource from their local laboratories.

Interactive Supercomputing Collaboratory Prototype: Using Analog Communications to Prototype the Fiber Optic Future
“We’re using satellite technology…to demo what It might be like to have high-speed fiber-optic links between advanced computers in two different geographic locations.”― Al Gore, Senator
Chair, US Senate Subcommittee on Science, Technology and Space
Illinois
Boston
SIGGRAPH 1989“What we really have to do is eliminate distance between individuals who want to interact with other people and with other computers.”― Larry Smarr, Director, NCSA

Chesapeake Bay Simulation Collaboratory : vBNS Linked CAVE, ImmersaDesk, Power Wall, and Workstation
Alliance Project: Collaborative Video Productionvia Tele-Immersion and Virtual Director
UICDonna Cox, Robert Patterson, Stuart Levy, NCSA Virtual Director Team
Glenn Wheless, Old Dominion Univ.
Alliance Application TechnologiesEnvironmental Hydrology Team
4 MPixel PowerWall
Alliance 1997

ASCI Brought Power Walls to the Frontier of Supercomputing
An Early sPPM Simulation RunSource: LLNL
1999
LLNL Wall--20 MPixels (3x5 Projectors)

60 Million Pixels Projected Wall Driven By Commodity PC Cluster
At 15 Frames/s, The System Can Display 2.7 GB/Sec
Source: Philip D. Heermann, DOE ASCI Program
2002

Oak Ridge National Laboratory Uses Tiled Projector Walls to Analyze Simulations
35Mpixel EVEREST Display ORNL
2004

Challenge: Average Throughput of NASA Data Products to End User is ~ 50 Mbps
Internet2 Backbone is 10,000 Mbps!Throughput is < 0.5% to End User
TestedMay 2008
http://ensight.eos.nasa.gov/Missions/aqua/index.shtml

fc *λ=
Dedicated Optical Fiber Channels Makes High Performance Cyberinfrastructure Possible
(WDM)
“Lambdas”Parallel Lambdas are Driving Optical Networking
The Way Parallel Processors Drove 1990s Computing
10 Gbps per User ~ 500x Shared Internet Throughput
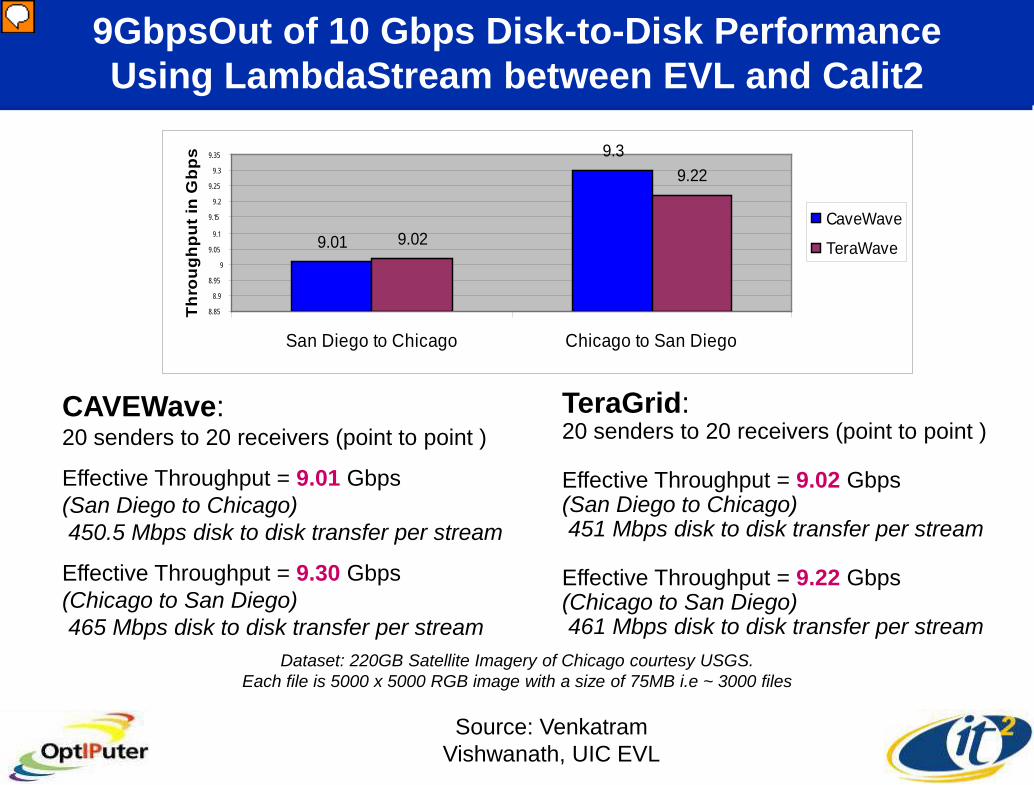
9GbpsOut of 10 Gbps Disk-to-Disk Performance Using LambdaStream between EVL and Calit2
CAVEWave:20 senders to 20 receivers (point to point )
Effective Throughput = 9.01 Gbps(San Diego to Chicago)450.5 Mbps disk to disk transfer per stream
Effective Throughput = 9.30 Gbps(Chicago to San Diego)465 Mbps disk to disk transfer per stream
TeraGrid:20 senders to 20 receivers (point to point )
Effective Throughput = 9.02 Gbps(San Diego to Chicago)451 Mbps disk to disk transfer per stream
Effective Throughput = 9.22 Gbps(Chicago to San Diego)461 Mbps disk to disk transfer per stream
9.01
9.3
9.02
9.22
8.85
8.9
8.95
9
9.05
9.1
9.15
9.2
9.25
9.3
9.35
San Diego to Chicago Chicago to San Diego
Thro
ughp
ut in
Gbp
s
CaveWave
TeraWave
Dataset: 220GB Satellite Imagery of Chicago courtesy USGS.Each file is 5000 x 5000 RGB image with a size of 75MB i.e ~ 3000 files
Source: Venkatram Vishwanath, UIC EVL
Presenter
Presentation Notes
The filesystem used is XFS. In this experiment, we had a LambdaRAM server at Chicago(San Diego) read the data from disk and stream it out to a LambdaRAM client at San Diego(Chicago). In this case, we had the LambdaRAM server fetch an entire 75MB from disk and send this to the remote LambdaRAM client. This Client would then write this data out to disk. The results from Chicago to San Diego are better as we have SATA drives at Vellum(San Diego).

States Have Been Acquiring Their Own Dark Fiber for a Decade -- Illinois’s I-WIRE and Indiana’s I-LIGHT
Source: Larry Smarr, Rick Stevens, Tom DeFanti, Charlie Catlett
Today Two Dozen State and Regional Optical Networks
1999

Interconnecting Regional Optical NetworksIs Driving Campus Optical Infrastructure Deployment
http://paintsquirrel.ucs.indiana.edu/RON/
CENIC2008
1999

National Lambda Rail (NLR) Provides Cyberinfrastructure Backbone for U.S. Researchers
NLR 40 x 10Gb Wavelengths Expanding with Darkstrand to 80
Interconnects Two Dozen
State and Regional Optical NetworksInternet2 Dynamic
Circuit Network Under Development

NLR/I2 is Connected Internationally viaGlobal Lambda Integrated Facility
Source: Maxine Brown, UIC and Robert Patterson, NCSA

Two New Calit2 Buildings Provide New Laboratories for “Living in the Future”
• “Convergence” Laboratory Facilities– Nanotech, BioMEMS, Chips, Radio, Photonics– Virtual Reality, Digital Cinema, HDTV, Gaming
• Over 1000 Researchers in Two Buildings– Linked via Dedicated Optical Networks
UC Irvinewww.calit2.net
Preparing for a World in Which Distance is Eliminated…

September 26-30, 2005Calit2 @ University of California, San Diego
California Institute for Telecommunications and Information Technology
Calit2 Has Become a Global Hub for Optical Connections Between University Research Centers at 10Gbps
iGrid 2005THE GLOBAL LAMBDA INTEGRATED FACILITY
Maxine Brown, Tom DeFanti, Co-Chairs
www.igrid2005.org
21 Countries Driving 50 DemonstrationsUsing 1 or 10Gbps Lightpaths
100Gb of Bandwidth into the Calit2@UCSD Building Sept 2005

The OptIPuter Project: Creating High Resolution Portals Over Dedicated Optical Channels to Global Science Data
Picture Source:
Mark Ellisman,
David Lee, Jason Leigh
Calit2 (UCSD, UCI), SDSC, and UIC Leads—Larry Smarr PIUniv. Partners: NCSA, USC, SDSU, NW, TA&M, UvA, SARA, KISTI, AISTIndustry: IBM, Sun, Telcordia, Chiaro, Calient, Glimmerglass, Lucent
Now in Sixth and Final Year
Scalable Adaptive Graphics
Environment (SAGE)

OptIPuter / OptIPortalScalable Adaptive Graphics Environment (SAGE) Applications
MagicCarpetStreaming Blue Marble dataset from San Diego
to EVL using UDP.6.7Gbps
JuxtaViewLocally streaming the aerial photography of downtown
Chicago using TCP.850 Mbps
BitplayerStreaming animation of tornado simulation
using UDP.516 Mbps
SVCLocally streaming HD camera live
video using UDP.538Mbps
~ 9 Gbps in Total. SAGE Can Simultaneously Support These
Applications Without Decreasing Their Performance
Source: Xi Wang, UIC/EVL
Presenter
Presentation Notes
SAGE lets you select protocol for each application you run. TCP is fair − congested circuits make bandwidth small. TCP also has lots of latency. TCP works well on low-latency LANs. Works well on WAN (high latency) if “tuned.”

SAGE OptIPortalsHave Been Adopted Worldwide
www.evl.uic.edu/cavern/optiplanet/OptIPortals_Worldwide.html

OptIPuter Software Architecture--a Service-Oriented Architecture Integrating Lambdas Into the Grid
GTP XCP UDT
LambdaStreamCEP RBUDP
DVC ConfigurationDistributed Virtual Computer (DVC) API
DVC Runtime Library
Globus
XIOGRAM GSI
Distributed Applications/ Web Services
Telescience
Vol-a-Tile
SAGE JuxtaViewVisualization
Data Services
LambdaRAM
DVC Services
DVC Core Services
DVC Job Scheduling
DVCCommunication
Resource Identify/Acquire
NamespaceManagement
Security Management
High SpeedCommunication
Storage Services
IPLambdas
Discovery and Control
PIN/PDC RobuStore

LambdaRAM: Clustered Memory To ProvideLow Latency Access To Large Remote Data Sets
• Giant Pool of Cluster Memory Provides Low-Latency Access to Large Remote Data Sets – Data Is Prefetched Dynamically– LambdaStream Protocol Integrated into
JuxtaView Montage Viewer• 3 Gbps Experiments from Chicago to
Amsterdam to UIC – LambdaRAM Accessed Data From
Amsterdam Faster Than From Local Disk
all
8-14
none
all
8-141-7
Displayed region
Visualization of the Pre-Fetch Algorithm
none
Data on Disk in Amsterdam
Local Wall
Source: David Lee, Jason Leigh
May 2004

Distributed Supercomputing: NASA MAP ’06 System Configuration Using NLR

LambdaRAM uses the entire memory of one or more clusters to mitigate latency. In current trials, LambdaRAM has achieved a 5-fold improvement in accessing remote data. Also, LambdaRAM provides
transparent access; i.e., application codes do not need to be modified.
LambdaRAM for Data Pre-Fetching:LambdaGrid Enables Low-Latency Remote Data Access
EVL is working with NASA Goddard and its Modeling, Analysis and
Prediction (MAP) Program on Tropical Hurricane Analysis
Source:Venkatram Vishwanath, EVL, UIC
Katrina
Planned Project
Presenter
Presentation Notes
MERRA: MODERN ERA RETROSPECTIVE-ANALYSIS FOR RESEARCH AND APPLICATIONS Retrospective-analyses (or reanalyses) have been a critical tool in studying weather and climate variability for the last 15 years. Reanalyses blend the continuity and breadth of output data of a numerical model with the constraint of vast quantities of observational data

PI Larry Smarr
Paul Gilna Ex. Dir.
Announced January 17, 2006—$24.5M Over Seven Years


Flat FileServerFarm
W E
B P
OR
TAL
TraditionalUser
Response
Request
DedicatedCompute Farm
(1000s of CPUs)
TeraGrid: Cyberinfrastructure Backplane(scheduled activities, e.g. all by all comparison)
(10,000s of CPUs)
StarCAVEVarrier
OptIPortal
UserEnvironment
DirectAccess LambdaCnxns
Data-BaseFarm
10 GigE Fabric
CAMERA’s Direct Access Core Architecture: An OptIPuter Metagenomics Metacomputer
Source: Phil Papadopoulos, SDSC, Calit2+
Web
Ser
vice
s
Sargasso Sea Data
Sorcerer II Expedition (GOS)
JGI Community Sequencing Project
Moore Marine Microbial Project
NASA and NOAA Satellite Data
Community Microbial Metagenomics Data

Calit2 Microbial Metagenomics Cluster-Next Generation Optically Linked Science Data Server
512 Processors ~5 Teraflops
~ 200 Terabytes Storage 1GbE and
10GbESwitched/ Routed
Core
~200TB Sun
X4500 Storage
10GbE
Source: Phil Papadopoulos, SDSC, Calit2
Presenter
Presentation Notes
This is a production cluster with it’s own Force10 e1200 switch. It is connected to quartzite and is labeled as the “CAMERA Force10 E1200”. We built CAMERA this way because of technology deployed successfully in Quartzite

CAMERA’s Global Microbial Metagenomics CyberCommunity
Over 2010 Registered Users From Over 50 Countries

e-Science Collaboratory Without Walls Enabled by Uncompressed HD Telepresence Over 10Gbps
Photo: Harry Ammons, SDSCJohn Delaney, PI LOOKING, Neptune
May 23, 2007
iHDTV: 1500 Mbits/sec Calit2 to UW Research Channel Over NLR

The Calit2 1/4 Gigapixel OptIPortals at UCSD and UCI Are Joined to Form a Gbit/s HD Collaboratory
Calit2@ UCSD wall
Calit2@ UCI wall
UCSD cluster: 15 x Quad core Dell XPS with Dual nVIDIA 5600sUCI cluster: 25 x Dual Core Apple G5
UCSD Wall to Campus Switch at 10 Gbps
NASA Ames Visit Feb. 29, 2008
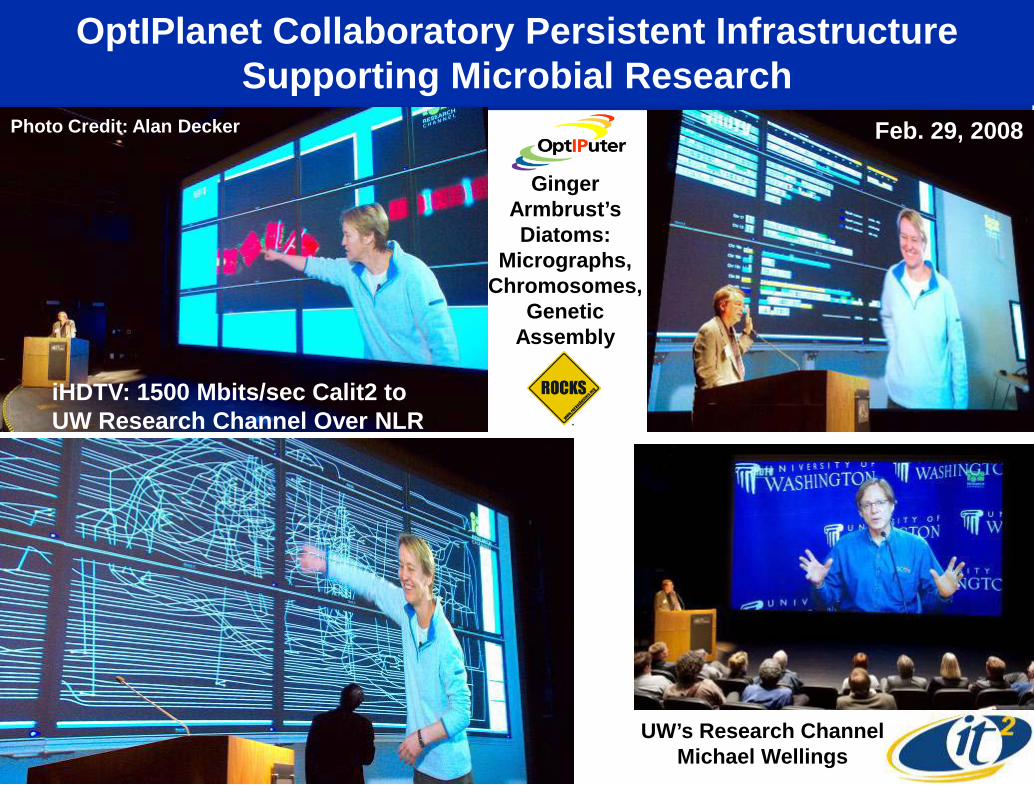
OptIPlanet Collaboratory Persistent Infrastructure Supporting Microbial Research
Ginger Armbrust’s Diatoms:
Micrographs, Chromosomes,
Genetic Assembly
Photo Credit: Alan Decker
UW’s Research Channel Michael Wellings
Feb. 29, 2008
iHDTV: 1500 Mbits/sec Calit2 to UW Research Channel Over NLR
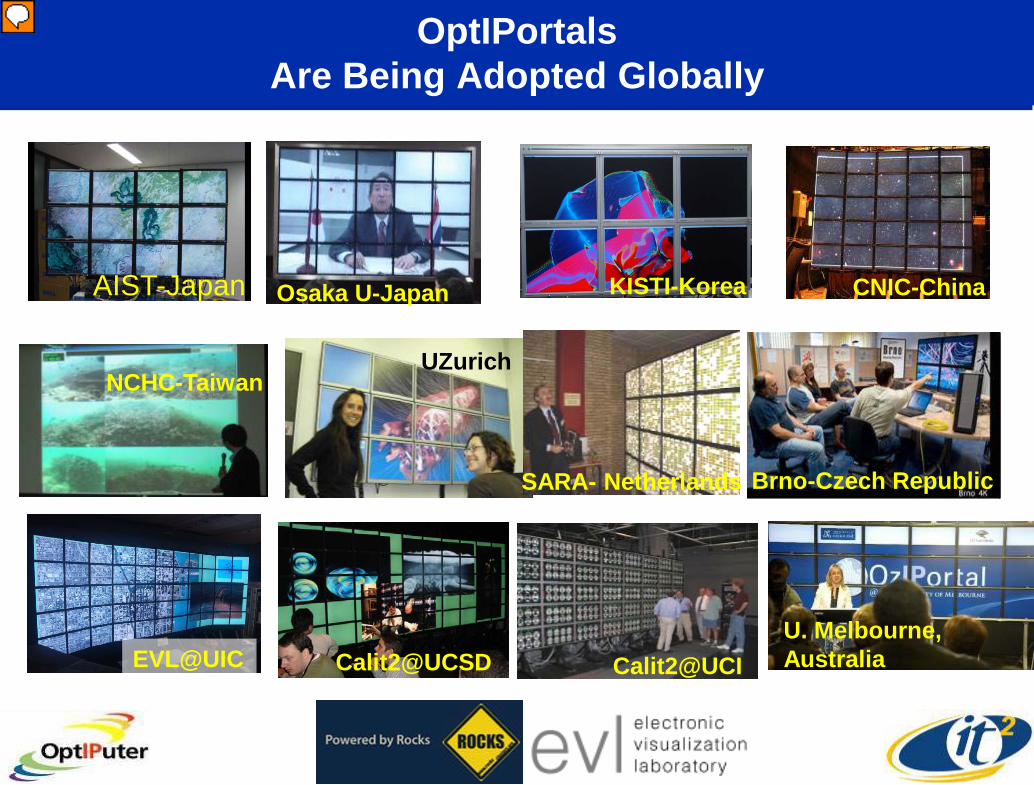
OptIPortalsAre Being Adopted Globally
EVL@UIC Calit2@UCI
KISTI-Korea
Calit2@UCSD
AIST-Japan
UZurich
CNIC-China
NCHC-Taiwan
Osaka U-Japan
SARA- Netherlands Brno-Czech Republic
Calit2@UCIU. Melbourne, Australia
Presenter
Presentation Notes
Maybe add another slide to indicate which science groups are using this or working with this

Source: Maxine Brown, OptIPuter Project Manager
GreenInitiative:
Can Optical Fiber Replace Airline Travel
for Continuing Collaborations
?

Launch of the 100 Megapixel OzIPortal Over Qvidium Compressed HD on 1 Gbps CENIC/PW/AARNet Fiber
www.calit2.net/newsroom/release.php?id=1219
No Calit2 Person Physically Flew to Australia to Bring This Up!
January 15, 2008
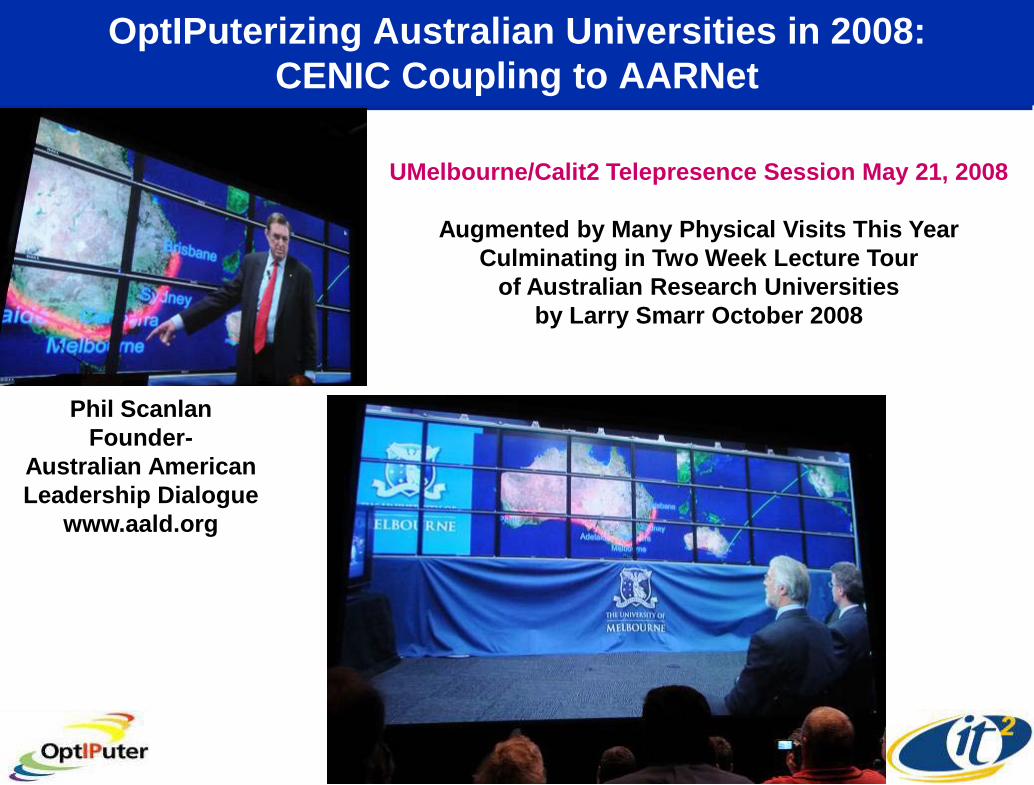
OptIPuterizing Australian Universities in 2008:CENIC Coupling to AARNet
UMelbourne/Calit2 Telepresence Session May 21, 2008
Augmented by Many Physical Visits This YearCulminating in Two Week Lecture Tour
of Australian Research Universities by Larry Smarr October 2008
Phil ScanlanFounder-
Australian American Leadership Dialogue
www.aald.org

First Trans-Pacific Super High Definition Telepresence Meeting Using Digital Cinema 4k Streams
Keio University President Anzai
UCSD Chancellor Fox
Lays Technical Basis for
Global Digital Cinema
Sony NTT SGI
Streaming 4k with JPEG 2000 Compression ½ gigabit/sec
100 Times the Resolution
of YouTube!
Calit2@UCSD Auditorium
4k = 4000x2000 Pixels = 4xHD
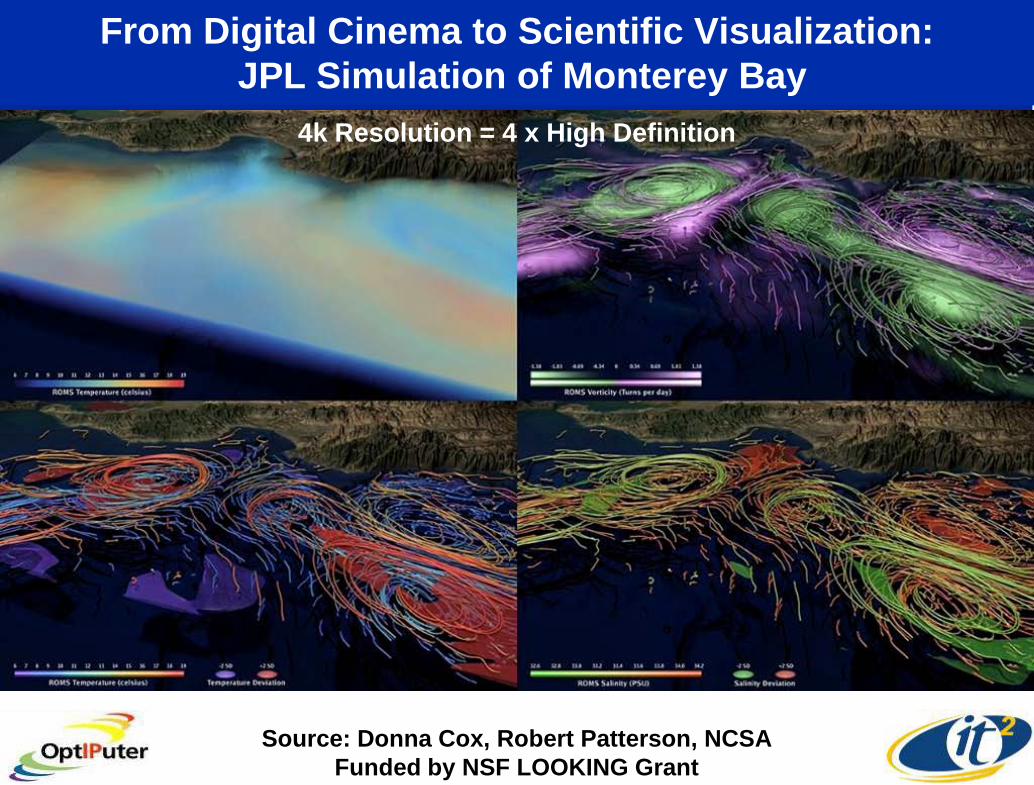
From Digital Cinema to Scientific Visualization: JPL Simulation of Monterey Bay
Source: Donna Cox, Robert Patterson, NCSAFunded by NSF LOOKING Grant
4k Resolution = 4 x High Definition
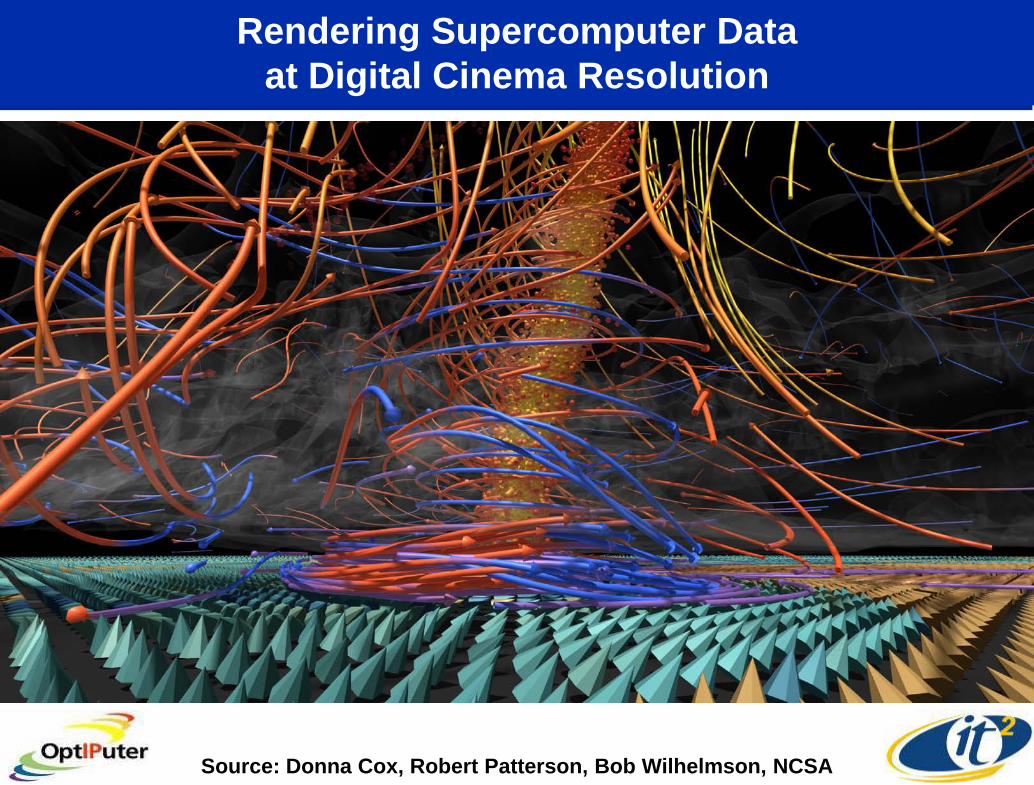
Rendering Supercomputer Data at Digital Cinema Resolution
Source: Donna Cox, Robert Patterson, Bob Wilhelmson, NCSA

EVL’s SAGE Global Visualcasting to Europe September 2007
Image Source
OptIPuter servers at
CALIT2San Diego
Image Replication
OptIPuter SAGE-
Bridge at StarLightChicago
Image Viewing
OptIPortals at EVL
Chicago
Image Viewing
OptIPortal at SARA
Amsterdam
Image Viewing
OptIPortal at Masaryk
University Brno
Image Viewing
OptIPortal at Russian
Academy of SciencesMoscow
Oct 1
Source: Luc Renambot, EVL
Gigabit Streams

Creating a California Cyberinfrastructure of OptIPuter “On-Ramps” to NLR & TeraGrid Resources
UC San Francisco
UC San Diego
UC Riverside UC Irvine
UC Davis
UC Berkeley
UC Santa Cruz
UC Santa Barbara
UC Los Angeles
UC Merced
Source: Fran Berman, SDSC , Larry Smarr, Calit2
Creating a Critical Mass of OptIPuter End Users on a Secure LambdaGrid

Source: Jim Dolgonas, CENIC
CENIC’s New “Hybrid Network” - Traditional Routed IP and the New Switched Ethernet and Optical Services
~ $14MInvested
in Upgrade
Now Campuses
Need to Upgrade

The “Golden Spike” UCSD Experimental Optical Core:Ready to Couple Users to CENIC L1, L2, L3 Services
QuartziteCore
CalREN-HPRResearch
Cloud
Campus ResearchCloud
GigE Switch withDual 10GigE Upliks
.....To cluster nodes
GigE Switch withDual 10GigE Upliks
.....To cluster nodes
GigE Switch withDual 10GigE Upliks
.....To cluster nodes
GigE
10GigE
...Toothernodes
Quartzite CommunicationsCore Year 3
ProductionOOO
Switch
Juniper T3204 GigE4 pair fiber
Wavelength Selective
Switch
To 10GigE clusternode interfaces
..... To 10GigE clusternode interfaces and
other switches
Packet Switch
32 10GigE
Source: Phil Papadopoulos, SDSC/Calit2 (Quartzite PI, OptIPuter co-PI)
Funded by NSF MRI
Grant
Lucent
Glimmerglass
Force10
OptIPuter Border Router
CENIC L1, L2Services
Cisco 6509
Goals by 2008:>= 60 endpoints at 10 GigE>= 30 Packet switched>= 30 Switched wavelengths>= 400 Connected endpoints
Approximately 0.5 Tbps Arrive at the “Optical” Center
of Hybrid Campus Switch
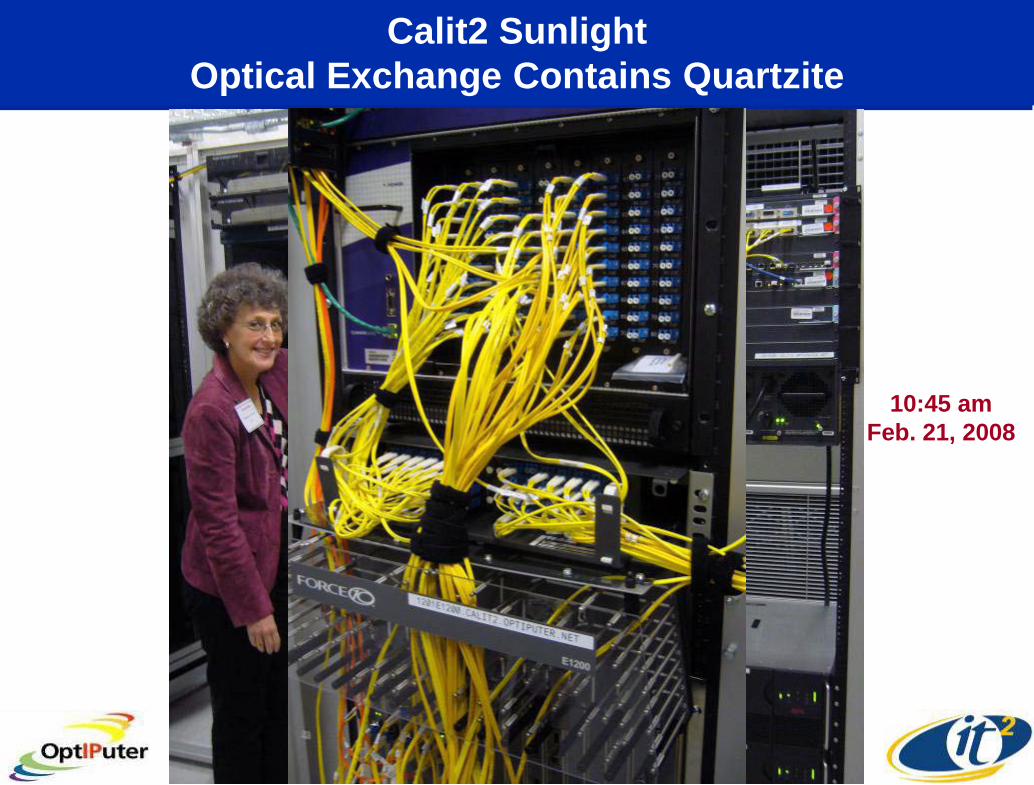
Calit2 SunlightOptical Exchange Contains Quartzite
10:45 am Feb. 21, 2008

Next Step: Experiment on OptIPuter/OptIPortal with Remote Supercomputer Power User
1.3 M SUs, NERSC Seaborg170 TB output
M. Norman, R. Harkness, P. Paschos
Structure of the Intergalactic Medium
Source: Michael Norman, SDSC, UCSD
Working on Putting in Calit2 StarCAVE
1 Billion Light-year Pencil From a 20483 Hydro/N-Body Simulation

The Livermore Lightcone: 8 Large AMR Simulations Covering 10 Billion Years “Look Back Time”
• 1.5 M SU on LLNL Thunder• Generated 200 TB Data• 0.4 M SU Allocated on
SDSC DataStar for Data Analysis Alone
5123 Base Grid, 7 Levels of Adaptive
Refinement65,000 Spatial Dynamic
Range
Livermore Lightcone Tile 8
Source: Michael Norman, SDSC, UCSD

Digital CinemaImage
An 8192 x 8192 Image Extracted from Tile 8:How to Display/Explore?
Working on Putting it on
Calit2 HIPerWallOptIPortal

2x

4x

8x

16x

200 Million Pixels of Viewing Real EstateFor Visually Analyzing Supercomputer Datasets
HDTV
Digital CamerasDigital Cinema
Goal: Link Norman’s Lab OptIPortal Over Quartzite, CENIC, NLR/TeraGrid to
Petascale Track 2 at Ranger@TACC and Kraken@NICS by October 2008