
Supercharge Learning with The Geometer’s Sketchpad, …gsp5.s3.amazonaws.com/GSP5_Spark.pdf ·...
64
Teaching Mathematics with INNOVATORS IN MATHEMATICS EDUCATION Supercharge Learning with The Geometer’s Sketchpad, Version 5 [ See Sketchpad’s Big Idea, page 4 ] [ Teacher to Teacher page 11 ] [ Sketchpad in Thailand page 12 ] [ A Student’s Perspective page 14 ]
-
Upload
phamkhuong -
Category
Documents
-
view
228 -
download
1
Transcript of Supercharge Learning with The Geometer’s Sketchpad, …gsp5.s3.amazonaws.com/GSP5_Spark.pdf ·...

Teaching Mathematics with
I N N O VAT O R S I N M AT H E M AT I C S E D U C AT I O N
Supercharge Learning with The Geometer’s Sketchpad, Version 5[ See Sketchpad’s Big Idea, page 4 ]
[ Teacher to Teacher page 11 ]
[ Sketchpad in Thailand page 12 ]
[ A Student’s Perspective page 14 ]

Inside
On this page: 2 One Software Across All Grades 4 Sketchpad’s Big Idea 7 Algebra and Beyond 9 Farther Frontiers 10 Powerful Learning Strategies 12 Sketchpad and Thai Weaving 13 Sketchpad Around the World 14 A Student’s Perspective 16 How I Got Started with Sketchpad 18 Versatile Technology 20 A Conversation with Sketchpad’s Designer 22 Research on Sketchpad 23 The Mystery Number 24 Construction in a Nutshell 26 Exploration 27 Presentation 28 A Tool for Student Inquiry 29 Tess-Rings 30 Sketchpad and Proof
Teacher to Teacher: 8, 11, 19, 21, 27, 31
Info & Tips: 3 Q&A 11 Ten Tips for Interactive Whiteboards 17 Ten Tips to Save Time 25 Sketchpad as a Productivity Tool
Spark! is published by Key Curiculum Press, 1150 65th Street, Emeryville, CA 94608 800-995-MATH (6284) U.S. +1-510-595-7000 Local and International
www.keypress.com
Content EditorsDaniel Scher, Steve Rasmussen Project Editor, Andres MartiProduction Editor, Barbara YoderCreative Director, Judy AndersonDesigner, Suzanne Anderson
We welcome letters and stories about your experiences with Sketchpad. Send to [email protected].
Copyright © 2009.
The Geometer’s Sketchpad and Dynamic Geometry are registered trademarks, and Sketchpad, Sketchpad LessonLink, and Hot Text are trademarks of KCP Technologies, Inc.
2 Key Curriculum Press® | Innovators in Mathematics Education | www.keypress.com
rom a model of
multiplication in grade 3
to a visualization of the
derivative in freshman calculus,
The Geometer’s Sketchpad®
is the only mathematics
software that accompanies
students every step of the
way from elementary school
through college.
Classroom teachers know that with so much to do, time is at a premium. Why commit to learning half a dozen software programs when each one might be useful for only several weeks?
By contrast, The Geometer’s Sketchpad is an investment with long-term rewards. Students can begin doing meaningful mathematics from the very first day they use Sketchpad, and the software know-how they acquire will continue to be relevant as they return to the software again and again, exploring new areas of mathematics.
One Software Across All Grades Sketchpad™—An Investment in Long-term Learning
F

Teaching Mathematics with The Geometer’s Sketchpad® 3
The student who learns how to construct perpendicular lines with Sketchpad in grade 3 will put this same skill to use in high school when she builds a Sketchpad model of a sine-wave tracer. And beyond specific skills, the mathematical ways of thinking that Sketchpad makes possible—model-building, investigation, hypothesis testing—are reinforced every time students use Sketchpad, making it an ideal tool for helping students of all ages to develop powerful habits of mind.
Sketchpad is a single, all-purpose software program designed to let students begin doing real mathematics at any entry point. Regardless of your students’ grade level, you’ll find activities tailored specifically for them. The Sketchpad LessonLink™ online subscription service contains over 500 activities spanning grades 3 to 12. If several of your ninth grade students need a refresher on fractions, just search the database for fraction activities from grades 6 to 8. Similarly, if your students are ready for more challenging work, look ahead in the database to see what else is available.
From a professional development perspective, using Sketchpad across multiple grades makes economic sense. By focusing professional development resources on a single software program with so many potential uses, schools and school districts can train their entire staff of mathematics teachers to use Sketchpad, knowing that everyone will benefit. And because Sketchpad encompasses the entire mathematics curriculum, teachers at different grade
levels can collaborate more effectively. Students who explore a Sketchpad model in grade 7 using early algebraic reasoning might return to this very same model in grade 8, but now focus on introducing variables into the investigation. Similarly, third, fourth, and fifth grade teachers might assign an animation project to their students and pool all the Sketchpad models together, creating a single exhibit of their students’ work.
When students enter college, Sketchpad goes with them. Sketchpad is an important exploratory tool for university-level mathematics, supported by activities in linear algebra, three-dimensional modeling, dynamical systems, and non-Euclidean geometry.
Ultimately, Sketchpad is to mathematics what a word processor is to writing: It’s a general-purpose tool that allows students of any age to do, explore, and share mathematics, just as a word processor allows them to write, edit, and share ideas.
An interactive model of a jumping rabbit teaches about multiplication and factors.
Estimating the area under a curve using rectangles.
Q&A Can I use Sketchpad for more than geometry? It’s called The Geometer’s Sketchpad, but Sketchpad excels at far more than just geometry. Nearly every topic from elementary-school mathematics through algebra and calculus benefits from Sketchpad’s dynamic approach to mathematics.Sketchpad does everything you’d expect from a graphing calculator—graph functions, plot table data, compute derivatives—but leaps beyond this basic functionality with tools, models, and interactive visualizations not found elsewhere.
Is Sketchpad any different from software I can get on the Internet? Unlike its many online imitators, The Geometer’s Sketchpad is grounded in more than 20 years of continuous educational research and technological development. When you choose Sketchpad, you’re joining a community of ardent users who have made Sketchpad the world’s most widely used technology for school mathematics. Equally important, Sketchpad provides the crucial pieces of the educational puzzle that its Internet competitors lack: curriculum and professional development. Sketchpad LessonLink, available by subscription from Key Curriculum Press, provides more than 500 Sketchpad activities aligned to textbooks and state standards for grades 3 to 12. Finally, while getting started with Sketchpad is a snap, for professionals interested in further training, Key Curriculum Press offers in-person and online Sketchpad seminars and courses, including courses for elementary, middle school, and high school teachers.
Can I use Sketchpad with younger students? Absolutely. The Geometer’s Sketchpad is the only mathematics software that supports students from third grade through college. The Geometer’s Sketchpad immerses young learners directly in mathematical problem solving, a task that they find incredibly engaging! The visual, hands-on nature of Sketchpad is ideal for younger students. Animation, a central feature of the software, captivates students because it’s fun, and it also reveals mathematical properties of objects in ways that static images cannot. In the Sketchpad LessonLink library, there are over 150 Sketchpad activities for grades 3 to 6, ranging from fractions, decimals, whole numbers, and percents to geometry, early algebra, and probability. Extensive activity notes provide pedagogical and mathematical insights, technology tips, and answers to questions that allow you to get the most out of Sketchpad with a minimal amount of planning.
When students
enter college,
Sketchpad goes
with them.

Dynamic Geometry®
Sketchpad’s Big Idea
One nice aspect of Sketchpad is that for all the power of the program, it revolves around just one essential idea—Dynamic Geometry.
Simply put, Dynamic Geometry operates under the principle that mathematics in motion is intrinsically more interesting than static mathematics, and that the mathematical “behaviors” that Sketchpad images exhibit when you drag them yield powerful insights.
In the world of Dynamic Geometry, mathematical images move through a seemingly infinite number of continuously related examples, all of which share a single, fundamental mathematical definition that was used to construct them. A simple Sketchpad triangle illustrates this idea. Connect three points with segments to construct a triangle (Figure 1). Now move one of these points—a vertex—with the mouse, and you’ll see a rapid succession of triangles, including acute triangles, right
triangles, and obtuse triangles (Figure 2). Your figure is no longer a picture of a single triangle; it is a picture of all possible triangles. The relationship between the image and the general mathematical idea of triangles is “one-to-one.”
Now drag a vertex of your triangle and watch the behavior of the triangle carefully. You’ll notice something important: As the array of acute triangles gives way to an array of obtuse triangles, there’s a singular moment when the triangle is a right triangle (Figure 3). A right triangle is the “boundary” between the acute triangles and the obtuse triangles. In other words, a right triangle isn’t some third, independent type of triangle; instead you can think of it as the border or balance point between two families of triangles.
While this particular case is straightforward, the attention that Dynamic Geometry brings to striking singular cases across a continuum of mathematically related images can provide important “aha” experiences for
students. These moments of insight into the “whys” of mathematics are key ingredients of mathematical proof. Here’s an example.
Construct an arbitrary quadrilateral ABCD, the midpoints of its sides, and the quadrilateral defined by these midpoints. Let’s call this the “midpoint quadrilateral” of ABCD (Figure 4). If you drag a vertex of ABCD, you’ll see that the midpoint quadrilateral is always a parallel-ogram. For most students this is surprising. From an arbitrary shape comes this strong definition. Even when you cross your original quadrilateral “sides” (Figure 5), the midpoint quadrilateral is a parallelogram. Why?
A singular case provides some insight. Drag point A towards point B. Drag until point A and point B are coincident (Figure 6). This is the “limit,” so to speak, of a set of related cases. At this limit, the original quadrilateral is now a triangle. And a well-known theorem of triangles now “jumps” out at you from the screen. This theorem, it turns out, is the clue to proving that the midpoint quadrilateral of
By Nicholas Jackiw, Chief Designer of The Geometer’s Sketchpad
Figure 1 Figure 2 Figure 3
4 Key Curriculum Press® | Innovators in Mathematics Education | www.keypress.com
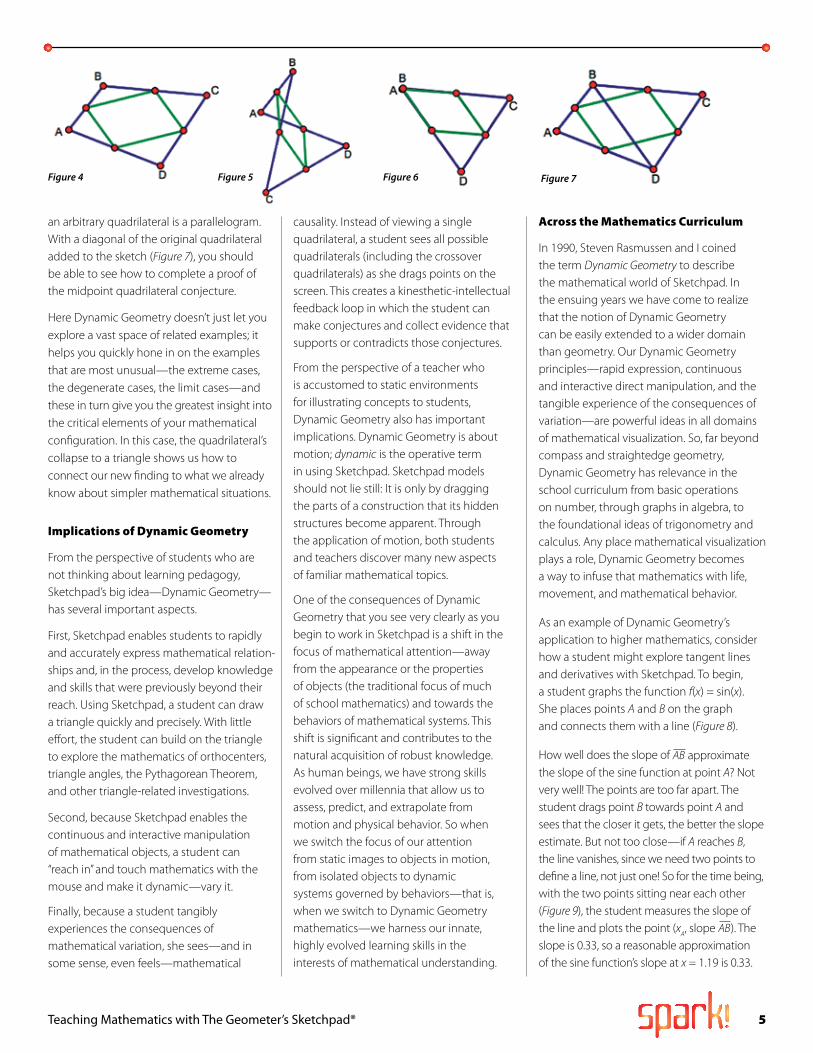
an arbitrary quadrilateral is a parallelogram. With a diagonal of the original quadrilateral added to the sketch (Figure 7), you should be able to see how to complete a proof of the midpoint quadrilateral conjecture.
Here Dynamic Geometry doesn’t just let you explore a vast space of related examples; it helps you quickly hone in on the examples that are most unusual—the extreme cases, the degenerate cases, the limit cases—and these in turn give you the greatest insight into the critical elements of your mathematical configuration. In this case, the quadrilateral’s collapse to a triangle shows us how to connect our new finding to what we already know about simpler mathematical situations.
Implications of Dynamic Geometry
From the perspective of students who are not thinking about learning pedagogy, Sketchpad’s big idea—Dynamic Geometry— has several important aspects.
First, Sketchpad enables students to rapidly and accurately express mathematical relation-ships and, in the process, develop knowledge and skills that were previously beyond their reach. Using Sketchpad, a student can draw a triangle quickly and precisely. With little effort, the student can build on the triangle to explore the mathematics of orthocenters, triangle angles, the Pythagorean Theorem, and other triangle-related investigations.
Second, because Sketchpad enables the continuous and interactive manipulation of mathematical objects, a student can “reach in” and touch mathematics with the mouse and make it dynamic—vary it.
Finally, because a student tangibly experiences the consequences of mathematical variation, she sees—and in some sense, even feels—mathematical
Figure 4 Figure 7Figure 5
causality. Instead of viewing a single quadrilateral, a student sees all possible quadrilaterals (including the crossover quadrilaterals) as she drags points on the screen. This creates a kinesthetic-intellectual feedback loop in which the student can make conjectures and collect evidence that supports or contradicts those conjectures.
From the perspective of a teacher who is accustomed to static environments for illustrating concepts to students, Dynamic Geometry also has important implications. Dynamic Geometry is about motion; dynamic is the operative term in using Sketchpad. Sketchpad models should not lie still: It is only by dragging the parts of a construction that its hidden structures become apparent. Through the application of motion, both students and teachers discover many new aspects of familiar mathematical topics.
One of the consequences of Dynamic Geometry that you see very clearly as you begin to work in Sketchpad is a shift in the focus of mathematical attention—away from the appearance or the properties of objects (the traditional focus of much of school mathematics) and towards the behaviors of mathematical systems. This shift is significant and contributes to the natural acquisition of robust knowledge. As human beings, we have strong skills evolved over millennia that allow us to assess, predict, and extrapolate from motion and physical behavior. So when we switch the focus of our attention from static images to objects in motion, from isolated objects to dynamic systems governed by behaviors—that is, when we switch to Dynamic Geometry mathematics—we harness our innate, highly evolved learning skills in the interests of mathematical understanding.
Across the Mathematics Curriculum
In 1990, Steven Rasmussen and I coined the term Dynamic Geometry to describe the mathematical world of Sketchpad. In the ensuing years we have come to realize that the notion of Dynamic Geometry can be easily extended to a wider domain than geometry. Our Dynamic Geometry principles—rapid expression, continuous and interactive direct manipulation, and the tangible experience of the consequences of variation—are powerful ideas in all domains of mathematical visualization. So, far beyond compass and straightedge geometry, Dynamic Geometry has relevance in the school curriculum from basic operations on number, through graphs in algebra, to the foundational ideas of trigonometry and calculus. Any place mathematical visualization plays a role, Dynamic Geometry becomes a way to infuse that mathematics with life, movement, and mathematical behavior.
As an example of Dynamic Geometry’s application to higher mathematics, consider how a student might explore tangent lines and derivatives with Sketchpad. To begin, a student graphs the function f(x) = sin(x). She places points A and B on the graph and connects them with a line (Figure 8).
How well does the slope of approximate the slope of the sine function at point A? Not very well! The points are too far apart. The student drags point B towards point A and sees that the closer it gets, the better the slope estimate. But not too close—if A reaches B, the line vanishes, since we need two points to define a line, not just one! So for the time being, with the two points sitting near each other (Figure 9), the student measures the slope of the line and plots the point (x
A, slope ). The
slope is 0.33, so a reasonable approximation of the sine function’s slope at x = 1.19 is 0.33.
Figure 6
Teaching Mathematics with The Geometer’s Sketchpad® 5

Figure 8
Figure 9
Figure 10
The power of this construction is its com-plete generality. Sketchpad has approxi-mated the sine’s slope at a particular location along the curve, but it can now estimate the slope at any point on the function whatsoever. Here’s how: The student sets points A and B in motion so that they travel in unison along the curve. As the points move, Sketchpad continuously updates the location of point (x
A, slope ). By tracing this point’s path,
students create a good approximation of the derivative of the sine function (Figure 10). The traces look like the cosine function.
Moving now from a secant line to a tangent line, the student uses Sketchpad’s built-in derivate function to compute the derivative of the sine function. Sketchpad reports that the derivative is indeed f ’(x) = cos(x). The student calculates f ’(x
A)—the slope at x
A. At last, she
has an authentic purpose for the point-slope form of the equation of a line, since she now knows a point on the tangent line—(x
A, y
A)—
and its slope at that point. So she graphs a new function g(x) = f ’(x
A) (x – x
A) + y
A that
represent the tangent line at xA (Figure 11).
Figure 11
Figure 12
Again, this construction is completely general. As the student drags point A, the line moves with it, maintaining its tangency to the curve. Furthermore, there is nothing particular in her reasoning so far that obliges her to work with the sine function she originally chose. By double-clicking on f(x), the student can change the function to something entirely different, like f(x) = x3 – 4x2 + x, and the line will still stay tangent to the changed function since she has defined it in completely general mathematical terms (Figure 12).
This is just one example of the application of Dynamic Geometry beyond geometry. Elsewhere in this issue of Spark!, you’ll see applications to trigonometry, conic sections, probability, calculus, physics, and complex analysis. The concept of Dynamic Geometry can be understood with just a single triangle, but its application to the entire scope of the mathematics curriculum is large indeed!
Sketchpad 5 now does so much more with photographs!Kendra Lockman combined her interests in mathematics and photography to create this fractal image with Sketchpad 5. The original picture was attached to three points in a rectangle, and then the diagonal points were iterated onto the left and bottom edges in order to create this blossom of a fractal.
6 Key Curriculum Press® | Innovators in Mathematics Education | www.keypress.com

Students use a prebuilt Sketchpad model of a balance scale to solve algebraic equations. The model includes weights that pull down on the balance as well as balloons that pull up. This allows students to work with negative numbers and negative variables as they solve the equation. Students drag objects from the reservoir of weights and balloons onto the balance or remove objects from the balance as ways to isolate the unknown x.
The two red segments in this model serve as “sliders”: When their endpoints are dragged, the values of m and b change. These two values are used to graph a line, y = mx + b. When students change the value of the sliders, the line dynamically responds, changing either its slope (for new values of m) or its y-intercept (for new values of b).
Virtual algebra tiles allow students to model expressions like (x + 3)(y + 1) with Sketchpad. Unlike physical algebra tiles whose dimensions are fixed, Sketchpad’s algebra tiles allow students to change the lengths of x and y. This reinforces the idea that x and y are variables and that the relationships students discover work no matter what their values.
This Sketchpad model gives tangible meaning to each term (c2, a2, b2, and –2abcos(c)) in the Law of Cosines. Students build the model from scratch, using a combination of squares and parallelograms. Through visual inspection, students determine that the area of the big square (c2) is equal to the areas of the two smaller squares (a2 + b2) plus the areas of the two parallelograms (–2abcos(c)). When point C is dragged so that ΔABC becomes a right triangle, the parallelograms disappear, and students are left with a proof of the Pythagorean Theorem.
Starting with a single segment, students build a coil whose lengths form a geometric sequence with a common ratio less than one. Sketchpad’s Iteration command allows students to add more and more segments to the coil while simultaneously tabulating the sum of the lengths in a table. By unfurling the coil and observing the table data, students discover that the combined length of the segments approach a limiting sum.
Two people arrange to meet for a date between 12:00 and 1:00, but both forget the exact meeting time. If each arrives at a ran-dom time during the hour and waits for 10 minutes, what is the probability they meet? A Sketchpad simulation plots the arrival times as (x, y) points and colors the points either red or green depending on whether the two people meet. The geometry of the picture helps students compute the exact probability.
Algebra and BeyondSketchpad’s Extensive Capabilities
The Geometer’s Sketchpad excels as a tool for
investigating geometry, but its capabilities extend across the entire mathematics curriculum. Here is a gallery of images showcasing Sketchpad’s use in everything from elementary algebra and function plotting to probability, conic sections, and calculus.
Teaching Mathematics with The Geometer’s Sketchpad® 7

“ T e a c h e r t o T e a c h e r ”
Layne Hudes Principal, Concord Road Elementary School, Ardsley, NY
More Efficient and More Effective
Some teachers are concerned that using Sketchpad “is one more thing,” requiring more time and preparation. I think all educators struggle with managing their
time, but I don’t consider Sketchpad as “one more thing.” Not only does it enliven my teaching and ensure student progress and achievement, Sketchpad is a much more efficient and effective way of demonstrating the big mathematical ideas that are part of our textbook and curriculum. Modeling an array and the relationship between multiplication and the distributive property may take several lessons when you’re bound to a textbook. With Sketchpad, many of those lessons can be subsumed into one experience with one sketch.
At our school, we have found that we actually move more quickly through the curriculum. The Sketchpad models, examples, and activities are so strong, broad, and enriching that they bring out many big ideas simultaneously. As a result, our teachers have been able to streamline their teaching. Sketchpad makes it easier to deliver our lessons.
When two sinusoidal functions are added, the sum function has interesting behavior that depends on the amplitude, period, and phase of the functions being added. Students can use such functions to model many physical motions with Sketchpad that exhibit periodic behavior. They can also create a sound button to play the function.
Point A is a random point within a circle. Point B sits on the circle’s circumference. As point B moves around the circumference, what does the perpendicular bisector of trace? Sketchpad’s Locus feature allows students to answer this question and generate this striking image of an ellipse. As students drag point A, the locus is dynamically updated. When point A sits outside the circle, the locus forms the envelope of a hyperbola.
Sketchpad allows students to create their own custom transformations. These transformations can be simple ones, like glide-reflect, or more complicated ones, like inversion through a circle. In this example, a transformation takes complex numbers and squares them. The result of applying the squaring transformation to a lattice is shown here, but the transformation can also be applied to any other object, including pictures. (See photo transformation on page 6.)
Slope fields allow students to visualize the family of functions described by differential equation. In this sketch, students used an iterative algorithm known as Euler’s method to generate the slope field.
8 Key Curriculum Press® | Innovators in Mathematics Education | www.keypress.com

While in high school, Yao created this 3-D representation of the seams on a basketball.
Among other projects, Yao has created custom tools for 3-D exploration in Sketchpad. In this sketch he models a function on a torus. A simple set of controls represented by the circles and segments in the top left corner of the sketch allow Yao to change the perspective and the sizes of various components of the 3-D model. These Sketchpad custom tools are a refined set of tools that he first developed in high school.
This colored-surface plot models an electric field (in two dimensions) generated by a pair of particles with charges of +4 and -1.
This sketch combines Yao’s interest in 3-D modeling with his interest in astronomy. Titled “Sun’s Path,” it models multiple aspects of the sun’s path as seen in the earth’s sky.
In this sketch Yao has used data fed to Sketchpad to create a constellation map of the zodiac.
FartherFrontiersExploring with Sketchpad
Yao Liu has used
Sketchpad throughout
his school career and across
two continents. He first
encountered Sketchpad
in China as a grade-school
student. He’s continued his
explorations with Sketchpad
as a high school student in the
United States, in his studies at
Columbia University, and as
a graduate student in physics
at Cornell University.
Teaching Mathematics with The Geometer’s Sketchpad® 9

Sketchpad Enables Powerful Learning Strategies
Using Sketchpad activities with your students facilitates a variety of proven learning strategies.
Many of these strategies are drawn from Classroom Instruction That Works
by Marzano, Pickering, and Pollock (Association for Supervision and Curriculum Development, 2001).
n Sketchpad activities provide excellent opportunities to ask students to identify similarities and differences among mathematical figures and representations. When students manipulate a Sketchpad construction by dragging a point or varying a parameter, they can pay attention to the things that change (the differences) and the things that stay the same (the similarities, or invariances). By describing and analyzing these similarities and differences, students develop understanding and insight into the mathematics expressed in the sketch. By listening to the similarities and differences that students notice, teachers can gain insight into their students’ thinking.
n Sketchpad activities provide dynamic representations that accelerate and deepen student understanding. Students change variables by dragging points or animating parameters; they trace functions to investigate families of functions; and they transform one example of a triangle into hundreds
of triangles of different shapes and sizes by dragging a vertex. Because the human brain is wired to notice and interpret motion, the dynamic nature of Sketchpad is an efficient and engaging way to learn.
n Sketchpad’s tools enable students to move from process to object conceptions of mathematical objects. Because students can build mathematical models directly using Sketchpad objects, see their constructions as scripts, describe and explain their work with captions and other annotations, they work with multiple representations of their mathematical ideas—concrete and
abstract as well as symbolic, visual, and verbal.
n Students receive immediate visual feedback, which allows them to assess their own work, possibly without needing any intervention from their teacher. Did the construction come out the way they expected? Does the construction hold together when they drag various points? (We like to call this the “drag test.”) Self-assessments like these are powerful learning tools—and the intrinsic satisfaction that students derive from completing a construction, or from discovering a mathematical principle by manipulating a construction, can be highly motivating for them.
Important Learning Strategies l Recognition of similarities and differences
l Dynamic representations of mathematics
l Multiple representations of critical knowledge
l Immediate visual feedback
l Self-assessment
l Intrinsic satisfaction and motivation
l Vocabulary development
l Mathematical discourse
l Collective reflection
l Hypothesis generation and testing
l Development of mathematical habits of mind
10 Key Curriculum Press® | Innovators in Mathematics Education | www.keypress.com

“ T e a c h e r t o T e a c h e r ”
n Sketchpad promotes students’ mathematical vocabulary and their use of precise language. Students interact with Sketchpad by choosing such menu commands as Construct Perpendicular Line, Plot New Function, and Measure Circumference. Sketchpad’s use of text for menus (rather than icons) is deliberate. Because mathematical terminology holds the key for carrying out constructions, students assimilate the language naturally, motivated by their desire to have Sketchpad do exactly what they have in mind. When students share Sketchpad models with each other or as an entire class, they engage in extended mathematical discourse and collective reflection as they describe the mathematics that lies behind their interactive models.
n As students build and experiment with their constructions, describe the behavior they observe, and try to answer questions about that behavior, they are encouraged to generate and test hypotheses. Why does the construction behave as it does? How can students explain its behavior? How can they modify or manipulate the construction to test their explanation? This leads them to mathematical problem posing, which is arguably the most important and creative aspect of mathematics.
n Sketchpad promotes mathematical habits of mind that extend beyond specific activities. As students discover how they can use Sketchpad’s tools and dynamic visualization capabilities to explore mathematical models, they develop a new relationship with mathematics. They begin to see themselves as active learners, capable of taking any piece of mathematics and using Sketchpad to illuminate its properties.
Thelma Bonilla High School Mathematics Teacher, Coalition School for Social Change, New York, NY
Developing Conceptual Understanding
I am a ninth and tenth grade teacher in a school in New York. I usually stay with a group of kids for two years because I have to prepare them for the
New York State Regents test.
In terms of developing conceptual understanding, telling students that the sum of the angles in a triangle is 180 degrees is different from having them actually manipulate a triangle and observe the measurements. I’ve seen so many kids who haven’t been through the experience of using Sketchpad forget this idea because they really didn’t do anything to internalize it. But those who use Sketchpad don’t forget concepts as easily because they’re not just told something, they do something. They construct, measure, and drag, and they form their own conclusions. I don’t have to re-teach the same concept every time I mention it because my students learned it by doing an investigation and making their own conjectures.
10 Tips for Interactive Whiteboards1. Prevent Misplaced Clicks: Choose Edit | Preferences | Tools. Under Arrow Tools, check
Double-click deselection and set Selection magnetism to High.
2. Make Large and Bold Measurements and Captions: Choose Display | Show Text Palette and make the first measurement and/or caption in your sketch bold and at least 24 pt. This setting applies to new text, even after you quit and restart Sketchpad.
3. Display Large and Bold Labels: Show a point label and use the Text Palette to make it bold and at least 24 pt. This setting carries over to new labels.
4. View Large Points: Choose Display | Point Style | Large to make your first point easy to see. Subsequent points in the same sketch will be large and so will points in new sketches. If you quit and restart Sketchpad, you’ll have to make new points large again.
5. Create Thick Lines: Choose Display | Line Style | Thick to make your first segment, ray or line easy to see. Subsequent lines in the same sketch will be thick and so will lines in new sketches. If you quit and restart Sketchpad, you’ll have to make new lines thick again.
6. Make the Toolbox Large: Choose Edit | Preferences | Tools. Under Toolbox Size, choose Large. With the large toolbox, all your students can see the Sketchpad tools.
7. Mark Angles and Segments: Use the Marker tool to quickly mark angles and segments as you talk to your class.
8. Draw and Write with the Marker Tool: Make freehand drawings and write notes.
9. Insert Hot Text™: Use Hot Text to create visual links between the text in your captions and the objects to which they refer.
10. Use Whiteboard Soft Keys: Program your whiteboard soft keys for your favorite keyboard shortcuts (such as Undo, Redo, and Midpoint) and for other frequently used keys (such as the Esc key for deselecting objects and stopping animations, and the Shift key for Undo All and constraining the Straightedge tool).
Teaching Mathematics with The Geometer’s Sketchpad® 11

Sketchpad &
Traditional Thai Weaving
woven by their parents and to interpret the mathematics of Pha-Nan to their parent-weavers. The students looked at geometric patterns and patterns best characterized as woven functions.
Then the students used Sketchpad to design new Pha-Nan—incorporating multiple transformations of functions ranging from trig functions to logarithmic functions to absolute value functions. They used paintbrushes and, ultimately, Adobe Photoshop to colorize their new Pha-Nan. The new Pha-Nan (six new models in all) were passed to weavers in the community, including the students’ parents, who wove them into commercial products using traditional hand looms.
To stimulate appreciation of local culture, there is a widespread campaign in
In 2003 the Institute for the Promotion of Teaching Science and Technology (IPST) introduced Sketchpad across the nation
of Thailand. In 2005 IPST sponsored their first national Sketchpad Project contest. Three high school students from Srisawatwittayakarn School in Nan, a rural northern province bordering Laos, won first prize with their entry “From Function to Pha-Nan.” Pha-Nan refers to the traditional cultural designs used by the weavers in Nan, one of Thailand’s most famous textile regions, which are woven into fabrics used for sarongs, skirts, shorts, scarves, and curtains.
The high school students began their project by using Sketchpad to analyze the symmetries in traditional Pha-Nan
both the public and private sector of Nan to dress Pha-Nan each Friday. The students’ Pha-Nan proved so popular that they became the fabric used by the teachers in their school and by other local organizations and individuals. To the great honor of the Srisawatwittayakarn School and its students, Her Royal Highness Princess Maha Chakri Sirindhorn visited the school to bestow upon the students their first prize medal for their work with Sketchpad. She invited the students to Bangkok to visit her at the Royal Palace. Now many other schools in Thailand have launched projects to incorporate analysis with Sketchpad into the creation of new and traditional crafts.
This sarong was woven by a parent from her daughter’s Sketchpad homework.
Nan students use Sketchpad to design Pha-Nan.
12 Key Curriculum Press® | Innovators in Mathematics Education | www.keypress.com

The Geometer’s Sketchpad
Around the World
T he Geometer’s Sketchpad is among the world’s most widely used computer software tools for school mathematics. Leading educators in the United States and scores of other countries consider Sketchpad and graphing calculators to be essential
technology tools for 21st-century classrooms.
Sketchpad, through its many versions, has been translated and published in Arabic, Chinese, Croation, Czech, Danish, French, German, Greek, Hebrew, Hungarian, Japanese, Korean, Russian, Slovenian, Spanish, Swedish, Thai, and Vietnamese.
Southeast Asian and North Asian countries have widely adopted Sketchpad, especially as an instrument to promote student creativity and project-based learning in mathematics. Several Southeast Asian countries, including Malaysia and Thailand, have licensed Sketchpad for all of their schools and for use by students at home. In China, Sketchpad is as well known as it is in the United States.
In Britain, where electronic whiteboards are very popular, Sketchpad is incorporated in specialized “whiteboard” curricula. In Costa Rica, Sketch-pad is used in teacher training and in classrooms at many levels. The first statewide implementation of Sketchpad was in the state of Aguascalientes, Mexico, where every secondary mathematics teacher and student uses Sketchpad weekly.
A Srisawatwittayakarn School parent uses traditional looms to weave a Sketchpad Pha-Nan. Nan weaving is famous throughout Thailand.
A student describes her work with Sketchpad to Her Royal Highness Princess Maha Chakri Sirindhorn on her visit to bestow the Sketchpad Project prize.
The faculty of the Srisawatwittayakarn School in their Sketchpad-designed Pha-Nan uniforms.
Teaching Mathematics with The Geometer’s Sketchpad® 13

A Student’s PerspectiveOn Learning with Sketchpad
I was first introduced to The Geometer’s Sketchpad in the summer of 2002 when my mother and I were vacationing at a friend’s house.
Being math junkies, we sat down one evening to sketch a Star of David fractal. Noticing this, our friend told us that he could make the fractal on his computer and beckoned me to come watch. I was transfixed as he constructed the line segments and connected the points to make the repeating image. I had no idea that this piece of software would enable me to construct hundreds of complex sketches over the next seven years and teach me numerous algebraic and geometric concepts that would prepare me for my high school math curriculum.
When I got my own copy of Sketchpad, I quickly learned its tools and functions. I then began to create simple designs and marveled at the example scripts that were included in the software package. How can anyone do that, I remember thinking as I watched a car with square wheels roll across the screen. After a short time, I moved from the novice user to the advanced one—creating golden mean spirals and flowers with odd numbers of petals. My favorite sketch from that time period is a heart made from two golden mean spirals. Just for fun, I threw in a seven-petaled flower in the center of the heart. This sketch is pictured here with detail shown and hidden (Figures 1 and 2).
Figure 3: My model of the tunnel with lights (enhanced using Sketchpad 5)
Figure 2: My heart with details hidden
Figure 1: Heart made from two golden mean spirals
As I grew older, I began to sketch scenarios that I observed in my daily life. One day I was in the car driving towards our local airport when I noticed a peculiar phenomenon. We were about to enter a tunnel that curved 90 degrees. As we approached the tunnel, the rate at which the lights on the outside of the tunnel disappeared behind a concrete wall increased rapidly. I went home, opened my computer, and created the tunnel, the lights, and the car on Sketchpad. It was obvious from the sketch that the rate was increasing while the car’s speed remained constant, but I did not know why. When I showed this sketch to a friend who had a greater knowledge of math than I did, we explored the trigonometry of the situation. At what angle was the passenger looking at each light before the light disappeared? How fast and why was the rate increasing? These are the types of questions that arise and can be answered with Sketchpad. The tunnel sketch is enhanced using Sketchpad Version 5 (Figure 3).
The black horizontal and vertical lines represent the roadway, and the black arcs represent the tunnel. The yellow points on the biggest arc represent the
By Carl Sigmond, Senior, Central High School, Philadelphia, PA
14 Key Curriculum Press® | Innovators in Mathematics Education | www.keypress.com
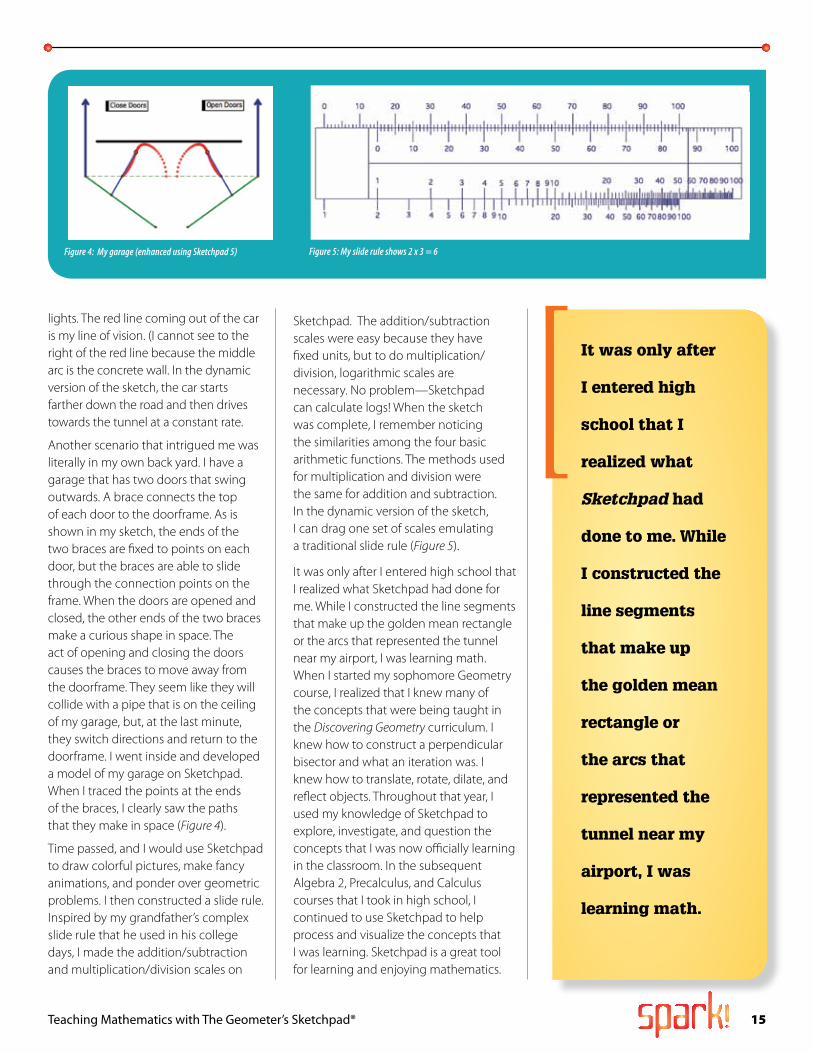
Sketchpad. The addition/subtraction scales were easy because they have fixed units, but to do multiplication/division, logarithmic scales are necessary. No problem—Sketchpad can calculate logs! When the sketch was complete, I remember noticing the similarities among the four basic arithmetic functions. The methods used for multiplication and division were the same for addition and subtraction. In the dynamic version of the sketch, I can drag one set of scales emulating a traditional slide rule (Figure 5).
It was only after I entered high school that I realized what Sketchpad had done for me. While I constructed the line segments that make up the golden mean rectangle or the arcs that represented the tunnel near my airport, I was learning math. When I started my sophomore Geometry course, I realized that I knew many of the concepts that were being taught in the Discovering Geometry curriculum. I knew how to construct a perpendicular bisector and what an iteration was. I knew how to translate, rotate, dilate, and reflect objects. Throughout that year, I used my knowledge of Sketchpad to explore, investigate, and question the concepts that I was now officially learning in the classroom. In the subsequent Algebra 2, Precalculus, and Calculus courses that I took in high school, I continued to use Sketchpad to help process and visualize the concepts that I was learning. Sketchpad is a great tool for learning and enjoying mathematics.
lights. The red line coming out of the car is my line of vision. (I cannot see to the right of the red line because the middle arc is the concrete wall. In the dynamic version of the sketch, the car starts farther down the road and then drives towards the tunnel at a constant rate.
Another scenario that intrigued me was literally in my own back yard. I have a garage that has two doors that swing outwards. A brace connects the top of each door to the doorframe. As is shown in my sketch, the ends of the two braces are fixed to points on each door, but the braces are able to slide through the connection points on the frame. When the doors are opened and closed, the other ends of the two braces make a curious shape in space. The act of opening and closing the doors causes the braces to move away from the doorframe. They seem like they will collide with a pipe that is on the ceiling of my garage, but, at the last minute, they switch directions and return to the doorframe. I went inside and developed a model of my garage on Sketchpad. When I traced the points at the ends of the braces, I clearly saw the paths that they make in space (Figure 4).
Time passed, and I would use Sketchpad to draw colorful pictures, make fancy animations, and ponder over geometric problems. I then constructed a slide rule. Inspired by my grandfather’s complex slide rule that he used in his college days, I made the addition/subtraction and multiplication/division scales on
Figure 5: My slide rule shows 2 x 3 = 6Figure 4: My garage (enhanced using Sketchpad 5)
It was only after
I entered high
school that I
realized what
Sketchpad had
done to me. While
I constructed the
line segments
that make up
the golden mean
rectangle or
the arcs that
represented the
tunnel near my
airport, I was
learning math.
Teaching Mathematics with The Geometer’s Sketchpad® 15

How I Got Started with Sketchpad In My School Computer Lab
I first saw The Geometer’s Sketchpad at a mathematics conference. I was fascinated by the way sketches were manipulated on the screen. It
was easy to imagine how students could use this dynamic software to explore mathematics concepts. Sketchpad became number one on my professional wish list.
At my request, the new county high school where I taught requested Sketchpad for the computer lab. It arrived during the second nine weeks of the school year. I had a dilemma: there was no time to become a Sketchpad expert and I needed a plan to implement it into the classroom immediately. My primary concern was how to efficiently use the program and, at the same time, maintain my students’ focus on task on their geometry class work. Unsure how it would all come together, I just jumped in because I knew we should start right away.
To begin, I decided to use prepared activities from Key Curriculum’s Exploring
Geometry with The Geometer’s Sketchpad* so I would be free to circulate, observe, and help students. Students worked in pairs on reading and keyboarding activities. Working through the lessons, they learned how to use the Sketchpad tools while investigating important geometric concepts. We all learned fast!
The lab was buzzing with mathematics discourse as students shared their discoveries, solutions, and tips. The program practically taught itself. Diving in without a completed “perfect” plan worked.
Construction of equilateral triangles to make daisies, creating working clocks, and producing animated kaleidoscopes were favorites activities. These activities
*The material in this book is now included in Sketchpad LessonLink.
were challenging, motivating, and fun! Students commented: “This is cool!… Look what happened when… Try this, it’s faster!… This is easy!” My apprehension was relieved as little frustrations gave way to “aha’s,” satisfaction, and confidence.
Sketchpad proved to be a good choice to extend an activity I like called “Which Name Is Which?” Using a code, students converted the letters in their names to coordinate pairs and then graphed the points on a coordinate grid to form a polygonal region. They reflected these polygons over the axes and graphed
Continued on page 17
The challenge of a working clock caused students to think. You can see that this student’s strategy to time the speed of the second hand was to mark off 5 congruent intervals by constructing radii.
A student displays his name represented as a polygon.
Using Sketchpad, my students extended the basic construction of one equilateral triangle to constructing multiple triangles to form a daisy and then constructing a tetrahedron pattern.
By Carol Martin, Mathematics Teacher, Fort White High School, Fort White, FL
16 Key Curriculum Press® | Innovators in Mathematics Education | www.keypress.com

A
B
C
D
Eiffel Tower Photo: Rüdiger Wölk, Münster
ba c
A
C
B
F
A B
CD
E
-5
1 1x
Activity SAmpler

2A Key Curriculum Press® | Innovators in Mathematics Education | www.keypress.com | © 2009 Key Curriculum Press Teaching Mathematics with The Geometer’s Sketchpad® | © 2009 Key Curriculum Press 3A
Try these activities yourself and with your students to see how you might use Sketchpad in your classroom. You may reproduce these worksheets for use with your students.
Some of these activities require prepared sketches that are available through the Sketchpad Learning Center, where you can also download activity notes for each activity, including teaching suggestions and answers to worksheet questions.
You’ll need a copy of Sketchpad 5 to use these activities. Visit www.keypress.com/gsp5 to learn more.
Elementary School Activities 3A Crop and Reflect: Mirror Symmetry
5A Jump Along: Factor Families on the Number Line
8A Mondrian in Motion: Parallel and Perpendicular Lines
Middle School Activities 10A Mean Meets the Median: Measures of Central Tendency
12A Balancing with Balloons: Solving Equations with Negatives
14A Pyramid Dissection: Surface Area
Algebra Activities 17A Mellow Yellow: Interpreting Graphs
19A Hikers: Solving Through Multiple Representations
21A Parabolas in Factored Form
Geometry Activities 23A Exterior Angles in a Polygon
25A Midpoint Quadrilaterals
26A Visual Demonstration of the Pythagorean Theorem
Trigonometry and Calculus Activities 27A A Sine Wave Tracer
29A Unit Circle and Right Triangle Functions
31A Instantaneous Ratecont
ents
Sketchpad™ Activities to Use in Your Classroom

2A Key Curriculum Press® | Innovators in Mathematics Education | www.keypress.com | © 2009 Key Curriculum Press Teaching Mathematics with The Geometer’s Sketchpad® | © 2009 Key Curriculum Press 3AActivity Sampler
Crop and Reflect Name:
Examples of mirror symmetry can be found all around us. In this activity, you’ll use Sketchpad to find the line of symmetry for buildings, a butterfly, and maybe even your own face!
FIND THE LINE OF SYMMETRY
The Eiffel Tower in Paris, France is one of the world’s most famous buildings. Does it have mirror symmetry? You’ll find out by cropping a picture of the Eiffel Tower and reflecting what remains across a line.
1. Open Crop and Reflect.gsp. Go to page “Eiffel Tower.” You’ll see two identical pictures of the Eiffel Tower in Paris, France.
2. Look for any examples of symmetry in the picture of the Eiffel Tower.
3. You’ll use quadrilateral ABCD to crop the Eiffel Tower picture. Drag the interior of ABCD so that it partially overlaps Picture 1.
4. Select the interior of ABCD and the picture. Choose EditCrop Picture to Quadrilateral. The portion of the picture outside of ABCD will be hidden.
5. Experiment by dragging point A or B. Notice that as you drag, the portion of the picture that is cropped changes.
6. Now, you’ll reflect the visible portion of the Eiffel Tower across a mirror line. Double-click segment AB to mark it as a mirror.
7. Select Picture 1. Choose TransformReflect. The visible portion of the picture will be reflected across
___ AB .
8. Find the line of symmetry for the Eiffel Tower: Drag points A and B so that the cropped picture and its reflection form a complete image of the Eiffel Tower. Use Picture 2 as a reference to help you find the line of symmetry.
9. What differences remain between the original picture and your reflected version?
_____________________________________________________________________________
_____________________________________________________________________________
Eiffel Tower Photo: Rüdiger Wölk, Münster
A
B
C
D

4A Key Curriculum Press® | Innovators in Mathematics Education | www.keypress.com | © 2009 Key Curriculum Press Teaching Mathematics with The Geometer’s Sketchpad® | © 2009 Key Curriculum Press 5A
Crop and Reflectcontinued
REFLECT OTHER PICTURES
Now you’ll look for mirror symmetry in other pictures.
10. Go to page “Other Pictures.” Select the picture of the Leaning Tower of Pisa (which is in Pisa, Italy) and choose EditCopy.
11. Go back to page “Eiffel Tower.” Select either half of the cropped and reflected Eiffel Tower picture. Choose EditPaste Replacement Picture. The Eiffel Tower will be replaced by the Leaning Tower.
12. Select the other picture of the complete Eiffel Tower. Choose EditPaste Replacement Picture.
13. Adjust points A and B so that ___
AB is a mirror line for the Leaning Tower. You can change which half of the picture is being reflected by dragging
___ CD to the
opposite side of the mirror.
14. Compare the two pictures of the Leaning Tower. Is the Leaning Tower perfectly symmetric?
_____________________________________________________________________________
_____________________________________________________________________________
15. Repeat steps 10–14 with the picture of the butterfly and the picture of the man on page “Other Pictures.”
EXPLORE MORE
16. Go to page “Explore More.” Which letters of the alphabet have mirror symmetry? Select a letter, choose EditCopy, and paste the picture onto the page “Eiffel Tower” to find its line of symmetry. Repeat this process with the other letters that have mirror symmetry.
17. If possible, copy a head-on picture of your face to the computer and drag it into Sketchpad. Reflect one half of your face onto the other. Is your face perfectly symmetric?

4A Key Curriculum Press® | Innovators in Mathematics Education | www.keypress.com | © 2009 Key Curriculum Press Teaching Mathematics with The Geometer’s Sketchpad® | © 2009 Key Curriculum Press 5AActivity Sampler
Jump Along Factor Families Name:
Find all the ways a rabbit can jump to different targets.
EXPLORE
1. Open Jump Along Factor Families.gsp. Go to page “Jump to 12.”
2. The rabbit wants to get to 12. How many different ways can it get there?
Double-click the Number of Jumps and Jump By numbers to change them. Then press Jump Along to start the rabbit.
Make each set of jumps a different color. Select the point below the rabbit. Then pick a new color by choosing DisplayColor.
Use the table to record the different ways.
Target Number: 12
Number of Jumps Jump By
Multiplication Number Sentence

6A Key Curriculum Press® | Innovators in Mathematics Education | www.keypress.com | © 2009 Key Curriculum Press Teaching Mathematics with The Geometer’s Sketchpad® | © 2009 Key Curriculum Press 7A
Jump Along Factor Familiescontinued
3. Look at the jumps traced by the rabbit. What patterns do you see?
_____________________________________________________________________________
_____________________________________________________________________________
_____________________________________________________________________________
4. Go to page “Jump to Target.”
Pick a target from this list: 16, 18, 20, 24.
How many different ways can the rabbit get to the target?
Make each set of jumps a different color.
Use the table to record the different ways.
Target Number:
Number of Jumps Jump By
Multiplication Number Sentence
5. Look at the jumps traced by the rabbit. What patterns do you see?
_____________________________________________________________________________
_____________________________________________________________________________
_____________________________________________________________________________

6A Key Curriculum Press® | Innovators in Mathematics Education | www.keypress.com | © 2009 Key Curriculum Press Teaching Mathematics with The Geometer’s Sketchpad® | © 2009 Key Curriculum Press 7AActivity Sampler
Jump Along Factor Familiescontinued
6. Pick a target from this list: 13, 17, 19, 23.
How many different ways can the rabbit get to the target?
Make each set of jumps a different color.
Use the table to record the different ways.
Target Number:
Number of Jumps Jump By
Multiplication Number Sentence
7. Look at the jumps traced by the rabbit. How are the jumps for this target number different?
_____________________________________________________________________________
_____________________________________________________________________________
_____________________________________________________________________________

8A Key Curriculum Press® | Innovators in Mathematics Education | www.keypress.com | © 2009 Key Curriculum Press Teaching Mathematics with The Geometer’s Sketchpad® | © 2009 Key Curriculum Press 9A
Mondrian in Motion Name:
Like the painter Mondrian, you will make a work of art using lines and shapes.
CONSTRUCT AND EXPLORE
1. Open Mondrian in Motion.gsp. Go to page “Blue Line.”
Make the window as large as you can.
2. To the right of the blue line, construct five points.
3. Select the points and the blue line.
Choose ConstructParallel Lines.
4. Drag the new lines, one at a time. How do they behave?
_____________________________________________________________________________
5. Select the points and the blue line again.
Choose ConstructPerpendicular Lines.
6. Drag the new lines. What is their relationship to the blue line?
_____________________________________________________________________________
7. What shapes are made by the lines?
_____________________________________________________________________________
8. Try to drag any line so that it is neither parallel nor perpendicular to the other lines. Can you do it?
9. Choose a rectangle in your picture to color in. Going around the rectangle, click the intersections of the lines to create four vertices and a rectangle. Click the first vertex again to complete the rectangle.
With the rectangle selected, choose DisplayColor and choose a color.

8A Key Curriculum Press® | Innovators in Mathematics Education | www.keypress.com | © 2009 Key Curriculum Press Teaching Mathematics with The Geometer’s Sketchpad® | © 2009 Key Curriculum Press 9AActivity Sampler
Mondrian in Motioncontinued
10. Repeat step 9 to color in four more rectangles.
11. Sign your name to your work.
12. Now you will animate your picture.
Choose the Point tool.
Choose EditSelect All Points.
Choose DisplayAnimate Points.
13. Describe how the shapes behave.
_____________________________________________________________________________
_____________________________________________________________________________
14. To stop the animation, press the Stop button on the Motion Controller.
You can also choose DisplayStop Animation.
15. Press Show Point A. Slowly drag point A.
How do the lines and shapes behave?
_____________________________________________________________________________
_____________________________________________________________________________

10A Key Curriculum Press® | Innovators in Mathematics Education | www.keypress.com | © 2009 Key Curriculum Press Teaching Mathematics with The Geometer’s Sketchpad® | © 2009 Key Curriculum Press 11A
Mean Meets the Median Name:
In this activity you’ll investigate some properties of the median and compare its behavior to that of the mean.
EXPLORE
1. Open Mean Meets the Median.gsp. Go to page “Median 5.” You should see data points at 1.0, 2.0, 4.0, 7.0 and 8.0, and a thick vertical orange line through 4.0 that represents the median value. Drag the data points. Write down different data sets that have a median of 4.0. What do all these data sets have in common besides having the same median?
2. Press Reset. Drag the data point at 8.0 to different locations. Describe all the values that data point can have without affecting the median value.
3. Press Reset. Drag the data point at 8.0 so that the median value changes. Why did it change?
4. Create a data set that has two data points on one side of the orange line and only one data point on the other side. Describe what’s special about your data set.
5. Some people say that the median value is always in the middle. Why might this be a misleading way to characterize the median?
6. Go to page “Median 6.” Drag the data points. Write down three data sets that all have a median of 4.0.
7. Describe a strategy for creating a data set that has a median of 7.5.

10A Key Curriculum Press® | Innovators in Mathematics Education | www.keypress.com | © 2009 Key Curriculum Press Teaching Mathematics with The Geometer’s Sketchpad® | © 2009 Key Curriculum Press 11AActivity Sampler
Mean Meets the Mediancontinued
8. In step 1, you found that all your data sets had to contain the value 4.0. Is this still true? Explain.
9. Go to page “Mean and Median.” Try to predict the value of the mean for the given data set. Then press Show Mean.
10. Find three different ways of changing the data points so that the mean and the median are equal to each other.
11. Find a data set in which the mean and median values are the same. Predict what will happen to each value if you increase your largest data value. Verify your prediction.
12. In many cases extremely small or large data values are called outliers. Will the mean or the median be more affected by outliers? Explain.
13. A doctor’s office wanted to find out how long patients had to wait in order to see whether they needed to hire another doctor. After gathering their “waiting time” data, they learned that some patients had been dropped off first thing in the morning, even though their appointments weren’t until late morning or early afternoon. Which measure of central tendency do you think would be more useful to the doctor’s office?
EXPLORE MORE
14. Go to page “Median 6.” Press Show Mean. Every time you move one of the data points, the mean changes. However, if you could move two data points at once, you could probably keep both the mean and the median the same. Press Reset. Select the data points 1.0 and 8.0 and choose EditAction ButtonsAnimation. Set point C to animate in a forward direction and point E to animate in a backward direction. Press the button you just created to verify that your mean value stays the same. Explain why this works.

12A Key Curriculum Press® | Innovators in Mathematics Education | www.keypress.com | © 2009 Key Curriculum Press Teaching Mathematics with The Geometer’s Sketchpad® | © 2009 Key Curriculum Press 13A
Balancing with Balloons Name:
In this activity you’ll use Sketchpad’s balance model to solve equations that include negative numbers and negative variables, represented by balloons.
EXPLORE
1. Open Balancing with Balloons.gsp and go to page “A.” Write the equation represented by the balance.
2. How can you isolate the x? Explain and write the resulting solution.
3. Go to page “B.” Solve this equation in two steps. After each step, the scale should balance. Record the balanced equations at each step.
Original equation:
After first step:
Solution:
4. Go to page “C.” Solve this equation in two steps. After each step, the scale should balance. Record the balanced equations at each step.
Original equation:
After first step:
Solution:
5. How is the solution to equation C different from the solutions to equations A and B? What does this mean in terms of the model?
-5
1 1x

12A Key Curriculum Press® | Innovators in Mathematics Education | www.keypress.com | © 2009 Key Curriculum Press Teaching Mathematics with The Geometer’s Sketchpad® | © 2009 Key Curriculum Press 13AActivity Sampler
Balancing with Balloonscontinued
6. Equations D, E, F, and G each require two or more steps. Use the balance to solve them and record your steps.
Equation D:
Equation E:
Equation F:
Equation G:
EXPLORE MORE
7. Go to page “Balance.” Build your own equation by putting weights and balloons on each side of the balance. Add 1-weights and –1-balloons as necessary to balance the scale. Now solve your own equation, or challenge a classmate to solve it. When you’re done, press Change x-value and repeat.
8. In the sketch the x-value is always a whole number. Write an equation whose solution is a fraction. Show the solution steps.
9. Go to page “Practice” and try solving equations without using the model. Check your work by pressing Show Solution, then press New Equation for more practice.

14A Key Curriculum Press® | Innovators in Mathematics Education | www.keypress.com | © 2009 Key Curriculum Press Teaching Mathematics with The Geometer’s Sketchpad® | © 2009 Key Curriculum Press 15A
Pyramid Dissection Name:
In this activity you’ll create a regular pyramid with your choice of the height, the number of sides, and the size of the base. Then you’ll calculate its surface area.
EXPLORE
1. Open Pyramid Dissection.gsp and go to page “Pyramid.” Use spin, pitch, and roll to change your view of the regular pyramid.
2. Change the number of sides (N ), the size of the base (R ), and the slant height (L). View the pyramid from different angles.
3. Adjust the controls to look at the pyramid from directly above. Which control did you use to do this? What does the pyramid look like in this position? What does the spin control do now?
4. Explore the shape of the net for various pyramids. How small can you make the slant height? What do the pyramid and the net look like then? What happens if you make the slant height large and the radius small?

14A Key Curriculum Press® | Innovators in Mathematics Education | www.keypress.com | © 2009 Key Curriculum Press Teaching Mathematics with The Geometer’s Sketchpad® | © 2009 Key Curriculum Press 15AActivity Sampler
Pyramid Dissection continued
To find the surface area, you must find the area of the base and of the lateral faces.
Base Area
5. Go to page “Base.” Change the size of the base and change the number of sides. Measure the distance from R to the midpoint of the thick red side. Label the measurement r.
6. Measure one side of the base and have Sketchpad calculate the perimeter. Write down your calculation and result.
7. Find the area of the base. Imagine dividing the regular polygon into simpler shapes and do some measurements and calculations. (If you’re stuck, press Show Hint to get some ideas.) Write down your calculation and result.
8. Change the number of sides and the size of the base, and make sure that your perimeter and area calculations seem reasonable. If not, fix them so that they work correctly for any base.
9. Increase the number of sides to more than 50. Divide the perimeter by r and divide the area by r 2 . Have you seen these two numbers before? Why do you think you get these values?
Face Area
10. On page “Faces,” drag L, R, and N to change the slant height, the size of the base, and the number of sides. Measure the distance r and side length s as you did in steps 5 and 6. Measure the slant height of the pyramid and label it l.

16A Key Curriculum Press® | Innovators in Mathematics Education | www.keypress.com | © 2009 Key Curriculum Press Teaching Mathematics with The Geometer’s Sketchpad® | © 2009 Key Curriculum Press 17A
Pyramid Dissection continued
11. Find the total area of the lateral faces. Calculate a value that will be correct for any value of n. Write down the calculation and the result.
12. What is this value when the number of faces is at least 50? Why?
Total Area
13. On page “Area,” do the necessary constructions, measurements, and calculations to find the total surface area of the regular pyramid, including the base and the lateral faces. Write down your calculation and result.
EXPLORE MORE
14. On page “Net,” set L, R, and N to match the pyramid you made on page “Area.” Choose FilePrint Preview and make sure the net fits on one page. If necessary, click Scale To Fit Page, and then click Print. Label the base and each face with the area you calculated based on the measurements. Cut out the net, fold along the lines, and glue or tape your three-dimensional pyramid together.
15. What does the pyramid look like when the number of lateral faces is large? How could you calculate the surface area of this shape without using the value of n? (Your answers to steps 9 and 12 may be useful.)
16. The height (h) of a pyramid is defined as the vertical distance from the base to the vertex. In step 10, you measured the slant height l (the height of one of the lateral faces). How can you find the vertical height of the pyramid if you know l and r ? (For instance, if l 15 cm and r 9 cm, what is h?) How could you find l if you know h and r? (For instance, if h 5 cm and r 12 cm, what is l ?)
17. On page “Explore More,” you can experiment with the advanced controls that affect the look of this three-dimensional model.

16A Key Curriculum Press® | Innovators in Mathematics Education | www.keypress.com | © 2009 Key Curriculum Press Teaching Mathematics with The Geometer’s Sketchpad® | © 2009 Key Curriculum Press 17AActivity Sampler
Mellow Yellow Name:
In this activity you’ll try to describe and predict how different motions, such as stopping, walking slowly, or walking very quickly, are represented on a graph.
EXPLORE
1. Open Mellow Yellow.gsp and go to page “Story 1.” Press Go!, and then press Show Story. Describe how the features of the graph (the axes, slopes, and points) correspond to the story of Mellow Yellow’s walk.
2. Go to page “Story 2.” Read the story and compare the graph to the story. Then press Go!, and describe the different types of motion you see in Story 2 compared to Story 1.
3. Go to page “Story 3.” Read the story and then press Go!. Decide whether the graph corresponds to the story. If not, change the graph (or the story!). Describe what you did.
5 10time (minutes)
distance(miles)
1
0.5
Corner Store
Start
Stop
Home

18A Key Curriculum Press® | Innovators in Mathematics Education | www.keypress.com | © 2009 Key Curriculum Press Teaching Mathematics with The Geometer’s Sketchpad® | © 2009 Key Curriculum Press 19A
Mellow Yellow continued
4. Go to page “Fit the Story.” Read the story and drag points 1 and 2 to make the graph fit the story. Check your graph by pressing Go!, and describe what you did.
5. Go to page “Write a Story.” Write a story that fits the graph. Check your story by pressing Go!. Change your story if necessary. Then write your final story here.
EXPLORE MORE
6. Write your own story, but this time imagine that Mellow Yellow has to travel only to the bus stop, which is halfway to the corner store, in about 10 minutes. Then write a story in which she travels to the bus stop, but in about 5 minutes. Fit the graph to each of your stories.

18A Key Curriculum Press® | Innovators in Mathematics Education | www.keypress.com | © 2009 Key Curriculum Press Teaching Mathematics with The Geometer’s Sketchpad® | © 2009 Key Curriculum Press 19AActivity Sampler
Hikers Name:
Edna leaves a trailhead at dawn to hike toward a lake 12 miles away, where her friend Maria has been camping. At the same time, Maria leaves the lake to hike toward the trailhead (on the same trail, but in the opposite direction).
Edna is walking uphill, so her average speed is 1.5 mi/h. Maria is walking downhill, so her average speed is 2 mi/h.
In this activity you’ll investigate when and where the hikers will meet.
EXPLORE
1. Complete the table.
Time (hours)
Edna’s Distance (miles from trailhead)
Maria’s Distance (miles from trailhead)
0 0 12
1
2
3
4
5
2. Open Hikers.gsp and go to page “Table.” Double-click each value and change it to match the value in the table above. From the table, what can you predict about when the hikers will meet?
To predict the meeting time more accurately, you’ll graph the points in the table, and then graph lines through them.
3. To graph Maria’s first point, select the 0 in the Time column, then the 12 in Maria’s Distance column, and choose GraphPlot as (x, y). Axes and a grid will appear, with the point (0, 12) plotted. Repeat this process to plot all of Edna’s and Maria’s distances in the table. What patterns do you see?
4. Construct a point on the x-axis. While the point is still selected, choose MeasureAbscissa (x).
5. Change the label of the point on the axis to T and the label of the abscissa measurement to Time.
20A Key Curriculum Press® | Innovators in Mathematics Education | www.keypress.com | © 2009 Key Curriculum Press Teaching Mathematics with The Geometer’s Sketchpad® | © 2009 Key Curriculum Press 21A
Hikers continued
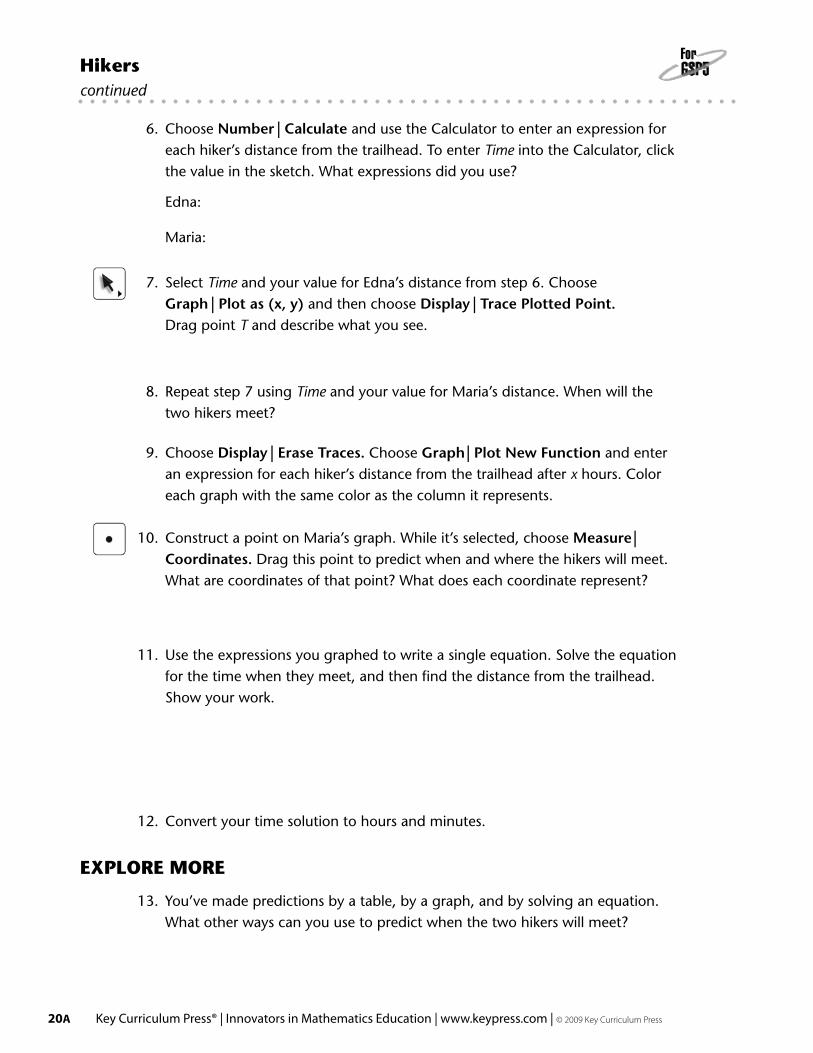
6. Choose NumberCalculate and use the Calculator to enter an expression for each hiker’s distance from the trailhead. To enter Time into the Calculator, click the value in the sketch. What expressions did you use?
Edna:
Maria:
7. Select Time and your value for Edna’s distance from step 6. Choose GraphPlot as (x, y) and then choose DisplayTrace Plotted Point. Drag point T and describe what you see.
8. Repeat step 7 using Time and your value for Maria’s distance. When will the two hikers meet?
9. Choose DisplayErase Traces. Choose GraphPlot New Function and enter an expression for each hiker’s distance from the trailhead after x hours. Color each graph with the same color as the column it represents.
10. Construct a point on Maria’s graph. While it’s selected, choose MeasureCoordinates. Drag this point to predict when and where the hikers will meet. What are coordinates of that point? What does each coordinate represent?
11. Use the expressions you graphed to write a single equation. Solve the equation for the time when they meet, and then find the distance from the trailhead. Show your work.
12. Convert your time solution to hours and minutes.
EXPLORE MORE
13. You’ve made predictions by a table, by a graph, and by solving an equation. What other ways can you use to predict when the two hikers will meet?

20A Key Curriculum Press® | Innovators in Mathematics Education | www.keypress.com | © 2009 Key Curriculum Press Teaching Mathematics with The Geometer’s Sketchpad® | © 2009 Key Curriculum Press 21AActivity Sampler
If you use a parabola to model a thrown ball, you might want to know exactly where
it hits the ground. Or if you model a profit function with a parabola, you might be
interested in the break-even point—the cutoff between profitability and loss. In both
cases you’re interested in the roots of the equation—where the function’s value is
zero. In this activity you’ll explore a quadratic form that’s based on the roots.
SkETCH AND INvESTIGATE
1. Open Factored Form.gsp. This sketch contains three
r2 = –1.7
r1 = 2.0
a = –0.5
sliders (a, r 1 , and r
2 ). Adjust each slider by dragging
the point at its tip. Observe how the values change as
you drag.
First you’ll create a function, evaluate it for an input variable, and plot the
resulting point.
2. Use the slider values to define the function f(x) 5 a(x 2 r 1 )(x 2 r
2 ). To do
so, choose GraphNew Function. The New Function dialog box appears. If
necessary, move it so that you can see the measurements of a, r 1 , and r
2 .
To enter a, r1, and r2, click their measurements in the sketch. To enter x, click the x key in the dialog box.
3. Enter a*(x2 r 1 )*(x2 r
2 ) and click OK. Sketchpad creates the function.
4. Measure the x-coordinate of point P by choosing MeasureAbscissa.
5. Calculate f( x P ), the value of function f evaluated at x
P . To do so, choose
NumberCalculate. Click on the function object f(x) and then on
measurement x P . Finally click OK. The value of the function appears.
6. To plot the point, select x P and f( x
P ) and choose GraphPlot as (x, y).
To turn tracing on or off, select the plotted point and choose DisplayTrace Plotted Point.
Q1 Drag P back and forth along the x-axis to change the input variable for the
function. How does the plotted point behave? Turn on tracing for the plotted
point to better observe its behavior. What shape does this function trace out?
Traces are temporary in Sketchpad. Instead of using traces, you’ll now make the
graph permanent so you can compare the graphs of different functions.
4
2
–5
f(xP) = 1.59
f(x) = a.(x – r1).(x – r2)
xP = 0.67
r2 = –1.7
r1 = 2.0
a = –0.5
P
Parabolas in Factored Form

22A Key Curriculum Press® | Innovators in Mathematics Education | www.keypress.com | © 2009 Key Curriculum Press Teaching Mathematics with The Geometer’s Sketchpad® | © 2009 Key Curriculum Press 23A
Parabolas in Factored Form continued
7. Turn off tracing for the plotted point. Then choose DisplayErase Traces and
drag P to make sure the traces no longer appear.
8. Plot a permanent graph of the function by selecting the function and choosing
GraphPlot Function. Drag P back and forth to make sure that the graph really
corresponds to the path of the plotted point.
EXPLORING FAMILIES OF PARABOLAS
By dragging point P, you explored how x and y vary for one particular function with
specific values of a, r 1 , and r
2 . Now you’ll change the values of a, r
1 , and r
2 , which
changes the function itself, allowing you to explore whole families of parabolas.
Q2 Adjust slider a and describe its effect on the parabola. Discuss the effect of a’s
sign (whether it’s positive or negative), its magnitude (how big or small it is),
and anything else that seems important.
Q3 Dragging a appears to change all the points on the parabola but two: the
x-intercepts of the parabola (the roots). Adjust all three sliders and observe the
effect that each has on the x-intercepts. How are the locations of the x-intercepts
related to the values of the sliders?
Q4 Adjust slider r 1 . What happens to the parabola as r
1 changes? What happens as
r 2 changes?
Q5 Adjust the sliders so that r 1 5 r
2 . Describe the resulting parabola.
Figure out the equations using pencil and paper only. Once you think you have the equation, you can use the sketch to check your result.
Q6 For each description below, write an equation for a parabola in factored form
f(x) 5 a(x 2 r 1 )(x 2 r
2 ). Check your answers by adjusting the sliders.
a. x-intercepts at (24, 0) and (6, 0); vertex at (1, 21)
b. x-intercepts at (25, 0) and (1, 0); contains the point (3, 32)
c. x-intercepts at (0, 0) and (23, 0); contains the point (2, 3)
d. same x-intercepts as y 5 2(x 2 3)(x 1 1); contains the point (0, 23)
e. same shape as y 5 2(x 2 3)(x 1 1); x-intercepts at (24, 0) and (1, 0)
Q7 You throw a baseball and it flies in a parabolic path across a field. If the ball
reaches its apex (highest point) 60 feet away from you, and the apex is 40 feet
above the ground, how far away from you will the ball land? What is the
equation of the ball’s flight in factored form? (Assume that the ball starts at
the point (0, 0).)

22A Key Curriculum Press® | Innovators in Mathematics Education | www.keypress.com | © 2009 Key Curriculum Press Teaching Mathematics with The Geometer’s Sketchpad® | © 2009 Key Curriculum Press 23AActivity Sampler
An exterior angle of a polygon is formed when one of the sides is extended. Exterior
angles lie outside a convex polygon. In this investigation you’ll discover the sum of
the measures of the exterior angles in a convex polygon.
Do this investigation with a triangle, a quadrilateral, or a pentagon. Plan together
with classmates at nearby computers to investigate different polygons so that you
can compare your results. The activity here shows a pentagon. Don’t let that throw
you if you’re investigating a triangle or a quadrilateral—the basic steps are the same.
SkETCH AND INvESTIGATE
1. Use the Ray tool to construct a polygon with each side extended in one
direction. Be sure to construct the polygon without creating any extra points.
Your initial sketch should have the same number of points (vertices) as sides.
If your polygon didn’t end up convex, drag a vertex to make it convex.
2. Use the Text tool to label the vertices of the polygon.
3. Create an angle marker in each external angle by dragging the Marker tool
counterclockwise from one side of the angle to the other.
4. Select all the angle markers and choose MeasureAngles.
C
D
EA
B
m�JEA � 61.31°m�IDE � 60.16°m�HCD � 91.82°m�GBC � 87.84°m�FAB � 58.86°
B
AE
D
C
F
G
H
I
J
Steps 1 and 2 Steps 3 and 4
Press and hold the pointer on the Segment tool; then drag right to choose the Ray tool.
Exterior Angles in a Polygon
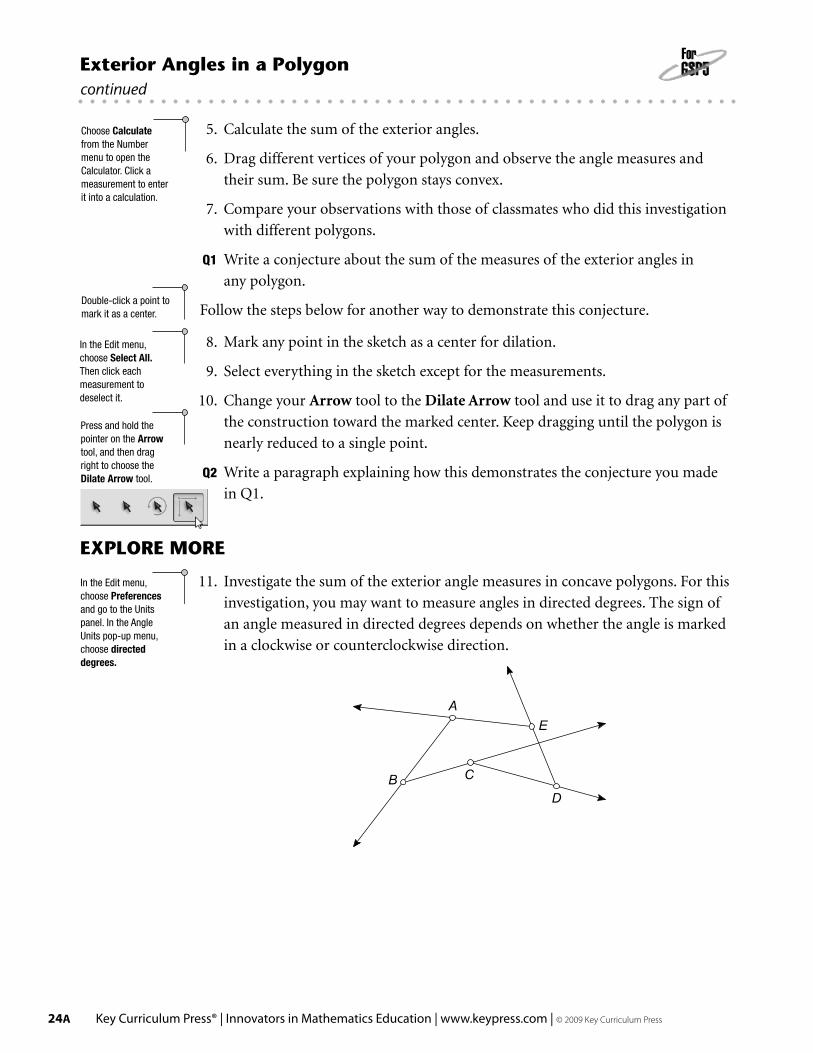
24A Key Curriculum Press® | Innovators in Mathematics Education | www.keypress.com | © 2009 Key Curriculum Press Teaching Mathematics with The Geometer’s Sketchpad® | © 2009 Key Curriculum Press 25A
5. Calculate the sum of the exterior angles.
6. Drag different vertices of your polygon and observe the angle measures and
their sum. Be sure the polygon stays convex.
7. Compare your observations with those of classmates who did this investigation
with different polygons.
Q1 Write a conjecture about the sum of the measures of the exterior angles in
any polygon.
Follow the steps below for another way to demonstrate this conjecture.
8. Mark any point in the sketch as a center for dilation.
9. Select everything in the sketch except for the measurements.
10. Change your Arrow tool to the Dilate Arrow tool and use it to drag any part of
the construction toward the marked center. Keep dragging until the polygon is
nearly reduced to a single point.
Q2 Write a paragraph explaining how this demonstrates the conjecture you made
in Q1.
EXPLORE MORE
11. Investigate the sum of the exterior angle measures in concave polygons. For this
investigation, you may want to measure angles in directed degrees. The sign of
an angle measured in directed degrees depends on whether the angle is marked
in a clockwise or counterclockwise direction.
B
AE
D
C
Exterior Angles in a Polygon continued
Choose Calculate from the Number menu to open the Calculator. Click a measurement to enter it into a calculation.
In the Edit menu, choose Select All. Then click each measurement to deselect it.
In the Edit menu, choose Preferences and go to the Units panel. In the Angle Units pop-up menu, choose directed degrees.
Press and hold the pointer on the Arrow tool, and then drag right to choose the Dilate Arrow tool.
Double-click a point to mark it as a center.

24A Key Curriculum Press® | Innovators in Mathematics Education | www.keypress.com | © 2009 Key Curriculum Press Teaching Mathematics with The Geometer’s Sketchpad® | © 2009 Key Curriculum Press 25AActivity Sampler
Midpoint Quadrilaterals
In this investigation you’ll discover something surprising about the quadrilateral
formed by connecting the midpoints of another quadrilateral.
SkETCH AND INvESTIGATE
1. Construct quadrilateral ABCD.
If you select all four sides, you can construct all four midpoints at once.
2. Construct the midpoints of the sides.
3. Connect the midpoints to construct another quadrilateral, EFGH.
4. Drag vertices of your original quadrilateral and observe the midpoint quadrilateral.
5. Measure the four side lengths of this midpoint quadrilateral.
Q1 Measure the slopes of the four sides of the midpoint quadrilateral. What kind of quadrilateral does the midpoint quadrilateral appear to be? How do the measurements support that conjecture?
6. Construct a diagonal.
7. Measure the length and slope of the diagonal.
8. Drag vertices of the original quadrilateral and observe how the length and slope of the diagonal are related to the lengths and slopes of the sides of the midpoint quadrilateral.
Q2 The diagonal divides the original quadrilateral into two triangles. Each triangle has as a midsegment one of the sides of the midpoint quadrilateral. Use this fact and what you know about the slope and length of the diagonal to write a
paragraph explaining why the conjecture you made in Q1 is true.
EXPLORE MORE
9. Construct the midpoint quadrilateral of the midpoint quadrilateral. Then construct its midpoint quadrilateral. Do this two or three more times. Describe any patterns you see in the midpoint quadrilaterals.
10. Construct the polygon interiors of a quadrilateral and its midpoint quadrilateral. Measure their areas. Make a conjecture about these areas.
11. What’s the midpoint quadrilateral of a trapezoid, an isosceles trapezoid, a parallelogram, a kite, a rhombus, a rectangle, a square? Organize and explain your findings.
12. Under what conditions is a midpoint quadrilateral a rectangle? A rhombus? A square? See if you can construct the most general quadrilateral whose midpoint
quadrilateral is one of these.
H
E
F
G
A
B
C
D
H
E
F
G
A
B C
D

26A Key Curriculum Press® | Innovators in Mathematics Education | www.keypress.com | © 2009 Key Curriculum Press Teaching Mathematics with The Geometer’s Sketchpad® | © 2009 Key Curriculum Press 27A
In this activity you’ll do a visual demonstration of the Pythagorean theorem based
on Euclid’s proof. By shearing the squares on the sides of a right triangle, you’ll
create congruent shapes without changing the areas of your original squares.
SkETCH AND INvESTIGATE
1. Open the sketch Shear Pythagoras.gsp. You’ll see a
right triangle with squares on its sides.
2. Measure the areas of the squares.
3. Drag point A onto the line that’s perpendicular
to the hypotenuse. Note that as the square
becomes a parallelogram its area doesn’t change.
4. Drag point B onto the line. It should overlap
point A so that the two parallelograms form
a single irregular shape.
5. Drag point C so that the large square deforms
to fill in the triangle. The area of this shape doesn’t change either.
It should appear congruent to the shape you made with the
two smaller parallelograms.
Q1 How do these congruent shapes demonstrate the Pythagorean theorem?
(Hint: If the shapes are congruent, what do you know about their areas?)
ba c
C
A
B
ba c
A
C
B
ba c
B
A
C
ba c
B
C
A
visual Demonstration of the Pythagorean Theorem
Step 3 Step 4 Step 5
To confirm that this shape is congruent, you can copy and paste it. Drag the pasted copy onto the shape on the legs to see that it fits perfectly.
Click on an interior to select it. Then, in the Measure menu, choose Area.
To confirm that this works for any right triangle, change the shape of the triangle and try the experiment again.

26A Key Curriculum Press® | Innovators in Mathematics Education | www.keypress.com | © 2009 Key Curriculum Press Teaching Mathematics with The Geometer’s Sketchpad® | © 2009 Key Curriculum Press 27AActivity Sampler
In this exploration you’ll construct an animation “engine” that traces out a special
curve called a sine wave. Variations of sine curves are the graphs of functions called
periodic functions, functions that repeat themselves. The motion of a pendulum and
ocean tides are examples of periodic functions.
SkETCH AND INvESTIGATE
1. Construct a horizontal segment AB.
F
A B
CD
E
2. Construct a circle with center A and radius endpoint C.
3. Construct point D on ___
AB .
4. Construct a line perpendicular to ___
AB through point D.
5. Construct point E on the circle.
6. Construct a line parallel to ___
AB through point E.
7. Construct point F, the point of intersection of the vertical line through point D
and the horizontal line through point E.
Q1 Drag point D and describe what happens to point F.
Q2 Drag point E around the circle and describe what point F does.
Q3 In a minute, you’ll create an animation in your sketch that combines these two
motions. But first try to guess what the path of point F will be when point D
moves to the right along the segment at the same time that point E is moving
around the circle. Sketch the path you imagine.
8. Make an action button that animates point D forward along ___
AB and point E
forward around the circle.
9. Move point D so that it’s just to the right of the circle.
10. Select point F; then, in the Display menu, choose Trace Point.
11. Press the Animation button.
A Sine Wave Tracer
Select point D and ___
AB ; then, in the Construct menu, choose Perpendicular Line.
Don’t worry, this isn’t a trick question!
Select points D and E and choose EditAction ButtonsAnimation. Choose forward in the Direction pop-up menu for point D.

28A Key Curriculum Press® | Innovators in Mathematics Education | www.keypress.com | © 2009 Key Curriculum Press Teaching Mathematics with The Geometer’s Sketchpad® | © 2009 Key Curriculum Press 29A
Q4 Sketch the path traced by point F. Does the actual path resemble your guess in
Q3? How is it different?
12. Select the circle; then, in the Graph menu, choose Define Unit Circle. You
should get a graph with the origin at point A. Point B should lie on the x-axis.
The y-coordinate of point F above ___
AB is the value of the sine of ∠EAD.
5 10
F
A
BC
D
E
Q5 If the circle has a radius of 1 grid unit, what is its circumference in grid units?
(Calculate this yourself; don’t use Sketchpad to measure it because Sketchpad
will measure in inches or centimeters, not grid units.)
13. Measure the coordinates of point B.
14. Adjust the segment and the circle until you can make the curve trace back on
itself instead of drawing a new curve every time. (Keep point B on the x-axis.)
Q6 What’s the relationship between the x-coordinate of point B and the
circumference of the circle (in grid units)? Explain why you think this is so.
A Sine Wave Tracercontinued
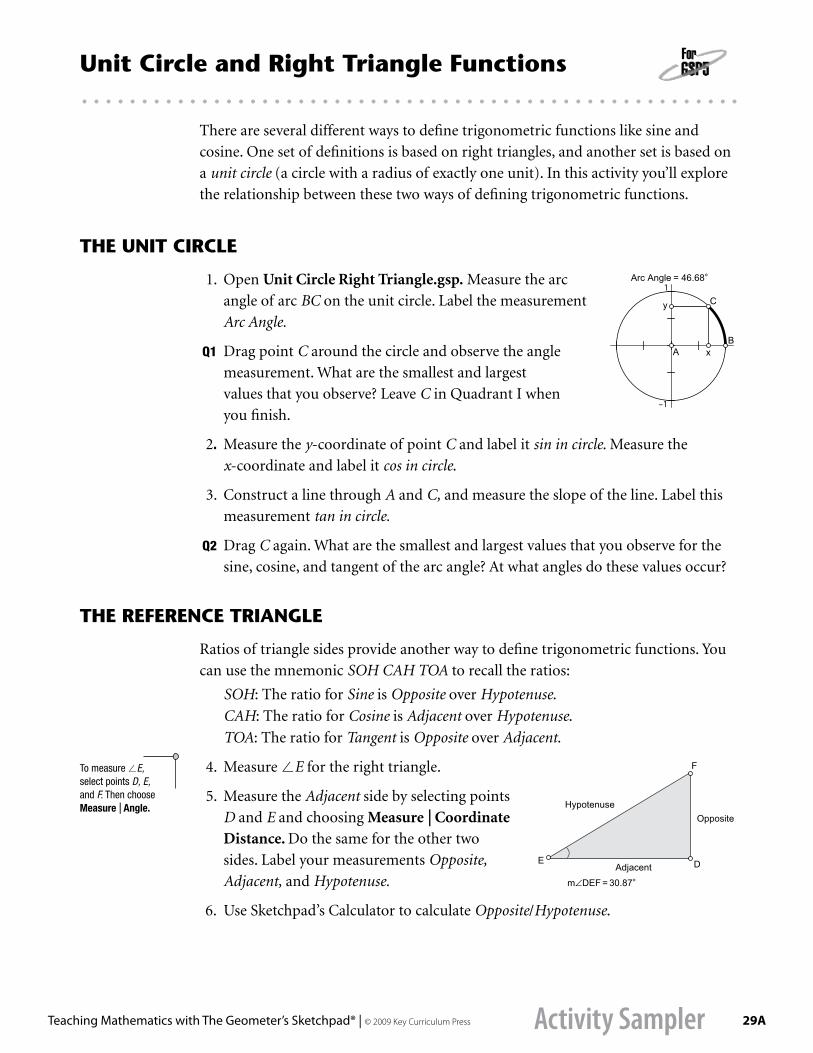
28A Key Curriculum Press® | Innovators in Mathematics Education | www.keypress.com | © 2009 Key Curriculum Press Teaching Mathematics with The Geometer’s Sketchpad® | © 2009 Key Curriculum Press 29AActivity Sampler
Unit Circle and Right Triangle Functions
There are several different ways to define trigonometric functions like sine and
cosine. One set of definitions is based on right triangles, and another set is based on
a unit circle (a circle with a radius of exactly one unit). In this activity you’ll explore
the relationship between these two ways of defining trigonometric functions.
THE UNIT CIRCLE
1. Open Unit Circle Right Triangle.gsp. Measure the arc 1
–1
Arc Angle = 46.68°
x
y
BA
Cangle of arc BC on the unit circle. Label the measurement
Arc Angle.
Q1 Drag point C around the circle and observe the angle
measurement. What are the smallest and largest
values that you observe? Leave C in Quadrant I when
you finish.
2. Measure the y-coordinate of point C and label it sin in circle. Measure the
x-coordinate and label it cos in circle.
3. Construct a line through A and C, and measure the slope of the line. Label this
measurement tan in circle.
Q2 Drag C again. What are the smallest and largest values that you observe for the
sine, cosine, and tangent of the arc angle? At what angles do these values occur?
THE REFERENCE TRIANGLE
Ratios of triangle sides provide another way to define trigonometric functions. You
can use the mnemonic SOH CAH TOA to recall the ratios:
SOH: The ratio for Sine is Opposite over Hypotenuse.
CAH: The ratio for Cosine is Adjacent over Hypotenuse.
TOA: The ratio for Tangent is Opposite over Adjacent.
To measure /E, select points D, E, and F. Then choose MeasureAngle.
4. Measure /E for the right triangle.
Hypotenuse
Adjacent
Opposite
m∠DEF = 30.87°
D E
F
5. Measure the Adjacent side by selecting points
D and E and choosing MeasureCoordinate Distance. Do the same for the other two
sides. Label your measurements Opposite,
Adjacent, and Hypotenuse.
6. Use Sketchpad’s Calculator to calculate Opposite/Hypotenuse.

30A Key Curriculum Press® | Innovators in Mathematics Education | www.keypress.com | © 2009 Key Curriculum Press Teaching Mathematics with The Geometer’s Sketchpad® | © 2009 Key Curriculum Press 31A
Q3 According to the SOH CAH TOA mnemonic, to which trigonometric function
does this calculation correspond?
7. Label your calculation sin in triangle. Calculate each of the other two ratios and
label them appropriately.
Q4 Drag point F. What are the smallest and largest values that you observe for the
sine, cosine, and tangent in the right triangle? At what angle do the maximum
and the minimum occur for each?
COMPARE THE DEFINITIONS
To compare these definitions, you’ll combine the two 1
–1
x
y
BA
C
models.
8. Select points A and E, and choose EditMerge Points. Also merge points C and F. The right triangle is now
attached to the inside of the unit circle.
Q5 Drag point C and observe the two angle measurements
(the arc angle and the angle in the triangle). When do these measurements
agree? When do they disagree?
Q6 Drag point C and observe the two sine measurements. Explain why the values
are equal in certain quadrants but not in others.
Q7 When do the two cosine measurements agree, and when do they disagree? Why?
Q8 When do the two tangent measurements agree? Explain.
Q9 Why is the sine of 150° the same value as the sine of 30°? Why is the sine of 210°
the opposite of the sine of 30°? (Hint: Think about how each relates to either a
coordinate or a ratio, and compare these.)
Q10 Describe possible advantages and disadvantages for each method of defining the
trigonometric functions.
EXPLORE MORE
Q11 Based on the different definitions, which might be better to determine the flight
path of an airplane? The position of a person on a Ferris wheel? The height of a
building? Explain.
Q12 Could you always use a single definition? Explain.
Q13 Drag point C. What happens to the tangent at 90°? Explain. What does this
mean in terms of the graph of the tangent function at 90°?
Unit Circle and Right Triangle Functionscontinued

30A Key Curriculum Press® | Innovators in Mathematics Education | www.keypress.com | © 2009 Key Curriculum Press Teaching Mathematics with The Geometer’s Sketchpad® | © 2009 Key Curriculum Press 31AActivity Sampler
Many schools have doors equipped with automatic closers. When you push such a door, it opens quickly, and then the closer closes it again, more and more slowly until it finally closes completely.
DOOR ANGLE AS A FUNCTION OF TIME
1. Open Instantaneous Rate.gsp. Press the Open Door button to operate the door. The door opens and closes, and the graph shows the angle of the door (d) in degrees as a function of time (t) in seconds.
2. Drag point t1 back and forth along the time axis, and watch how the angle of the
door changes and how the point on the graph corresponds to the door’s angle. Observe the values of the t
1 and d
1 measurements as you drag.
Q1 For what values of t1 is the angle increasing? How can you tell?
Q2 What is the maximum angle the door reaches? At what time does this occur?
THE DOOR AT TWO DIFFERENT TIMES
3. To find the rate of change of the door’s angle, you need to look at the door’s position at two different times. Press the Show t2 button to see a second point on the time axis slightly separated from point t
1. Drag point t
1 back and forth, and
observe the behavior of the new points on the graph. To change the separation of the two times, press the button labeled 1.0 and then the button labeled 0.1.
4. Make the separation of the two points smaller than 0.1. Can you still see two distinct points on the graph? Can you see the values of t
2 and d
2 change as
you make t smaller? Experiment with dragging the t slider, to change the separation of the two values of time directly.
Q3 What is the largest separation you can get by moving the slider? What is the smallest separation you can actually observe on the graph?
Q4 As you make t smaller, can you observe changes in the numeric values of t2
and d2 even when you can no longer observe any changes on the graph?
THE RATE OF CHANGE OF THE DOOR’S ANGLE
5. Set t to 0.1, and then use the numeric values of t1, d
1, t
2, and d
2 to calculate
the rate of change of the door’s angle at any particular time. (Use Sketchpad’s Calculator to perform this calculation.)
100
50
d (angle)
5 10t (time)
The value t is the separation between the two values of time t1 and t2.
Hint: Divide the change in the angle by the change in the time.
Instantaneous Rate

32A Key Curriculum Press® | Innovators in Mathematics Education | www.keypress.com | © 2009 Key Curriculum Press
Instantaneous Ratecontinued
Q5 What are the units of the rate of change? What does the rate of change tell you about the door’s motion?
6. Press the Show Rate button to check your result.
Q6 What is the relationship between the dotted line and the rate of change you calculated?
Q7 Move t1 back and forth. How can you tell from the rate of change whether the
door is opening or closing? How can you tell whether its rate is fast or slow?
Q8 Use the buttons to set t1 to 1.0 and t to 0.1. What is the rate of change?
7. Select the numeric values of t1, d
1, t
2, d
2, t and the rate of change. With these
six measurements selected, choose NumberTabulate. Double-click the table to
make the current entries permanent.
THE LIMIT OF THE RATE OF CHANGE
8. Set the time interval (t) to exactly 0.01. Note the new value of the rate of change. Could you see the dotted line move as you reduced the time interval? Double-click the table to permanently record these new values.
Q9 How does this rate of change compare to the value when t was 0.1?
9. Similarly, record in the table values for time intervals of 0.001, 0.0001, 0.00001, and 0.000001.
Q10 What happens to the value of the rate of change as the time interval becomes smaller and smaller? What value does the rate of change appear to approach?
Q11 Can you see the dotted line move as t changes from 0.001 to 0.0001?
10. Set the value of t1 to 3 seconds (by pressing the t →3 button), and collect more
data on the rate of change of the door’s angle. Collect one row of data for each time interval from 0.1 second to 0.000001 second.
The average rate of change is the rate of change between two different values of t. The instantaneous rate of change is the exact rate of change at one specific value of t. Because you must have two different values to calculate the rate of change, one way to measure the instantaneous rate of change is to make the second value closer and closer to the first and then find the limit of the average rate of change as the interval gets very small.
The instantaneous rate of change of a function—that is, the limit of the average rate of change as the interval gets close to zero—is called the derivative of the function.
Q12 What is the derivative of the door’s angle when t1 is 3 seconds?
You may want to press the 0.1 button and then the 0.01 button again to check the motion of the dotted line.
When you press the Show Rate button, a dotted line appears connecting the two points on the graph.
After double-clicking the table, it shows two rows of numbers, with the first row permanent and the second row changing as the measurements change.

32A Key Curriculum Press® | Innovators in Mathematics Education | www.keypress.com | © 2009 Key Curriculum Press
10 Tips to Save Time1. Menu-Key Shortcuts: Use shortcuts listed on the menus like Ctrl+Z (⌘Z with Mac) for Edit |
Undo, Ctrl+L (⌘L) for Construct | Segment, and Alt+/ (⌘/) for Edit | Properties.2. Context Menus: Choose commands for a single object by right-clicking or Ctrl-clicking the
object; or for the entire sketch by right-clicking or Ctrl-clicking in empty space.3. Selection Rectangles: Click in empty space and drag the Arrow tool to select groups
of objects.4. Resize Text: Press Alt+> (⌘>) to make text larger, or Alt+< (⌘<) to make it smaller.5. Constrain Straight Objects: Press and hold the Shift key while you use the Straightedge
tool to constrain the orientation of straight objects to multiples of 15° from the screen axes.6. Use the + and – Keys: Use these keys on your keyboard to adjust the value of a parameter,
the number of samples of a locus or function plot, or the depth of an iteration.7. Select All: Select all of one type of object (Points, Segments, Circles, Polygons, or Text) by
first choosing the corresponding tool and then choosing Edit | Select All (Ctrl+A or ⌘A).8. Show a Single Hidden Object: Choose Display | Show All Hidden, deselect the desired
hidden object, and then choose Display | Hide Objects.9. Align Text: Select text objects and press Shift+Return to align them. Drag a text object until
it snaps into alignment with a nearby text object. While editing multi-line captions, align them left, right, or center by pressing Alt (Option) and an arrow key.
10. Information Tool: Use this tool to investigate objects in a sketch, to traverse parent-child relationships between objects, and to navigate to a hidden object you want to show.
them as well. The graph of each name was unique. Graphs were posted on the classroom wall. We discussed the results. Which names are convex polygons?
What if we changed the code? To check, we used Sketchpad. Each student was given coordinates of another student’s name to plot and reflect. They searched the wall for the graph that corresponded to their sketch and then changed the interior colors to match. My students were engaged and able to use Sketchpad as a tool for their own work. Because they were quickly comfortable with the tools and menus, in very little time we were able to integrate the use of Sketchpad into the daily classroom routine to model concepts and constructions.
Each year I ask my geometry students to construct the five Platonic solids with construction paper as a project. With Sketchpad, I was able to ask them to construct the patterns as an assessment. They were amazed how much more
quickly and accurately they were able to construct with Sketchpad and commented, “This is a lot easier than using the compass and straightedge!”
By verbalizing and writing directions for their constructions, students were able to share, validate, and evaluate their own thinking. Their work showed how they approached the construction of the Pythagorean spiral and an inscribed regular octagon using different procedures. They were inventing and discovering their own mathematics. It was then that I realized the benefits of using Sketchpad in the classroom. My students had gained more
With Sketchpad, all students had to do was select the points, construct the region, mark the reflection line, and reflect! It was so easy for them and a lot faster than plotting individual points!
The task was simply to inscribe a regular octagon in a circle and use midpoints to generate regular octagons by repeating several times. Once one student used color, they all began to experiment. The joy in discovering the spiral was conveyed with the embedded message “Amazing! ”
To construct the Pythagorean Spiral some students chose perpendicular lines while others rotated segments. They used color to emphasize a pattern. In this sketch, blue triangles have a hypotenuse whose measure is an irrational number, while the measure of the hypotenuse of a red triangle is a rational number.
Student remarks while animating the kaleidoscope: “This is cool! . . . Let’s see what happens if we change the speed and direction. . . . What will happen if we rotate every 30 degrees?”
quality time on task, were able to apply new concepts, and were becoming more responsible for their own learning!
Teachers struggle with more content to teach while faced with less time and dwindling funding for materials and technology. In my classroom, I found Sketchpad to be effective, motivating, and versatile. Implementation was easier than I expected, and the results have been rewarding for both my students and me. They feel success and enjoy learning because they are empowered by this new tool. Isn’t that what teachers want for their students?
Teaching Mathematics with The Geometer’s Sketchpad® 17
Continued from page 16

transform them in an infinite variety of ways without having to erase and redraw.
Classroom with Some Computers
If you have a few computers in your classroom, you can divide your class into pairs or groups of three and give each group some time to work on a computer. Depending on the numbers, you may need to plan a lesson involving both a Sketchpad activity and a related activity that doesn’t require a computer, and then rotate the groups.
Here are suggestions for maximizing student learning with Sketchpad.
n Introduce Sketchpad lessons in front of the whole class using a whiteboard or projector to minimize how-to related
Student access to computers varies widely between schools. You might have several computers with a
projector or interactive whiteboard in your classroom. You might have to bring your students to the school computer lab. Or you might even have access to a laptop cart with enough computers for your entire class.
Sketchpad was designed so that its display features can be optimized to your needs. You can also adapt your teaching strategies to make best use of Sketchpad with the technology resources available to you. Here are some suggestions for teaching with Sketchpad in a variety of configurations and settings.
Interactive Whiteboard or Projector
A variety of interactive whiteboards and projectors are available that make Sketchpad’s display visible to the whole class. Sketchpad has been optimized to work well with both whiteboards and projectors. Make sure to use large font sizes, large points, and thick lines for best viewing from all corners of your classroom. If you are using a whiteboard, go to the Tools tab in Preferences, choose the large toolbox size, and set the selection magnetism to medium or high. This allows you to select an object
without having to click precisely on the right spot.
When you use Sketchpad with a whole class, consider having students drive the software during an investigation, while you focus on asking good prompting questions. If you are deliberate and thoughtful about the questions you pose, your students will be well prepared to use the software on their own if the opportunity arises. Examples of questions to ask include:
“What should we try next?”
“What do we need to select in order to construct a perpendicular?”
“Which objects should we reflect?”
“What do you notice as we move this point?”
You and your students can prepare demonstrations that make use of Sketchpad’s interactive display and its ability to add dynamic annotations and text to mathematical models. Sketchpad becomes a “dynamic chalkboard” on which you and your students can draw more precise, more complex figures and then distort and
Sketchpad Is Versatile! Using Sketchpad with Your Available Technology
18 Key Curriculum Press® | Innovators in Mathematics Education | www.keypress.com

Mary Wiltjer High School Mathematics Teacher, Oak Park and River Forest High School, Oak Park, IL
Student Learning with Sketchpad
My students’ reaction to Sketchpad has been phenomenal. They like using Sketchpad because it reacts to all their learning styles,
it’s very visual, and it connects with what we’re doing on a symbolic level. It makes mathematics meaningful and puts them in control. Using Sketchpad students don’t feel like they’re making mistakes even if they’re not getting the “right thing” because it still gives them something, so they feel they can always maneuver and try something else. Often students’ mistakes are “smart mistakes,” if you want to call them that, because they take them somewhere else. The mistakes give them some idea what they weren’t thinking about in the right way. While they may be on the wrong path, their mistakes with Sketchpad often help them find the right path.
Sketchpad also allows me to be creative in a typical class setting in ways that I don’t normally have available, and it facilitates discovery to the nth degree. In my geometry classes, students do some activities where they construct quadrilaterals and analyze their properties, and others where they start with properties and use Sketchpad to find what quadrilaterals possess those properties. What’s wonderful is that everyone doesn’t have the exact same quadrilateral on their screen at the same time. They’ve all created something that fits the properties and they can move their quadrilaterals to see if they’re maintaining those properties. And when my students come back to a testing situation or some other situation outside of the computer lab, they have a lot more understanding. They don’t feel like they were forced to go home and memorize properties. They’ve internalized them out of usefulness.
In Algebra 1, my students benefit from Sketchpad because we can work with functions in a dynamic way. Students can work with the slope and y-intersect of lines and literally watch the graphs change as the numeric values change. And when they see that, it’s so obvious to them what all the pieces do. Because the graphs are moving, they love it. You’d think that a group of goofy freshmen would have a hard time sitting down in a lab to do Sketchpad activities, but because Sketchpad activities encourage active involvement, labs end up being better days for everyone involved.
“ T e a c h e r t o T e a c h e r ”
questions that might arise when students begin their work.
n When students work in pairs or groups, make sure everyone has an opportunity to actually operate the computer. Periodically announce to the class that it’s time to let the next person in the group work with the mouse.
n Make it clear that students who are not actually operating the computer are still expected to contribute to the group discussion and give input.
n Move among the groups while students are working, pose questions, give help if needed, and keep students on task.
n Require students to summarize their findings, either on a worksheet or in the form of a sketch with captions and comments that they create and turn in. Have students share their findings in a whole-class discussion to bring closure to the lesson.
n Print out one or more copies of the Sketchpad tip sheets so that students can refer to them when they have a question about Sketchpad functionality.
Laptop Cart or Computer Lab
All of the suggestions for a classroom with some computers also apply to using a laptop cart or computer lab. Many teachers recommend having students work in pairs, even if enough computers are available for students to work individually. Students learn best when they communicate about what they’re learning, and students working together can better generate ideas and lend help to one another. Even if students are working individually, encourage them to talk about what they’re doing and to compare their findings with those of their nearest neighbors.
Teaching Mathematics with The Geometer’s Sketchpad® 19

to learn from the user. That seems like another way that Sketchpad is a “learning tool”—it learns too.
Nick: In some ways it’s funny that Sketchpad has developed such a worldwide reputation as a powerful mathematical tool. The program by itself is actually mathematically very “ignorant.” For a geometry tool, people often comment how surprising it is that Sketchpad doesn’t know what a triangle is, or what a square is. You have to build those ideas in Sketchpad. Sketchpad, however, is a good learner. Once you’ve made a construction that you are satisfied with, the tool says, “Okay, now that you’ve made this, this is your definition of a square” or, “This is your definition of a triangle.” And you can reuse the knowledge you’ve given Sketchpad whenever you need that construction again.
So, for example, I can make a square quickly with Sketchpad by constructing some perpendicular lines and then using a circle to mark out equal radii. Lo and behold, that’s pretty much all I need to do to construct a square. I might fill in the square with a yellow interior just so one can see it a little bit better and then maybe hide the circle and the rest of the lines I used in defining my square.
Steven Rasmussen: Nick, how would you describe your design vision for Sketchpad to someone who is getting started using it?
Nicholas Jackiw: Two of the best descriptions of Sketchpad’s design that I’ve ever heard have come from Sketchpad users. Both of them offer surprising and deep insights of the sort that the actual designer—myself—would never give you. One description came from a fourth grade student who said, “Oh, I get it. It’s just like a calculator, but for shapes.” That’s very specific—it’s a tool, it’s a math machine—but also very open, and even poetic: a shape calculator! The second comment came from a Japanese elementary school teacher I met in Kobe many years ago. He suggested to me that Sketchpad wasn’t a tool for teaching mathematics, but a tool for learning mathematics. The notion of Sketchpad as a learning tool is very close and dear to my personal vision of Sketchpad.
Steve: Can you delve deeper into the distinction between a “teaching tool” and a “learning tool”?
Nick: There are lots of software programs that you can buy that come with prepackaged ideas, curriculum, facts, and embedded knowledge. These programs attempt to teach you things
that someone wants you to know and they tell you when you get things right. Maybe they give you a prize if you get the right answer. That’s just not the sort of program that Sketchpad is. When you start up Sketchpad, it opens with a blank page—your invitation to do what you want with it. And it’s always tickled me that the same program, Sketchpad, with the same user interface, can be used by a young student and by a research mathematician. Because they both begin at the same place—with their imagination and mathematical background and a blank screen—both may feel as if the program was designed just for them, at their respective level of mathematical understanding. And it’s that nonjudgmental, neutral invitation to do the mathematics you want to do—to express your own creativity—that unifies Sketchpad’s design. It’s a tool designed to help you learn what you’re most interested in learning. It’s ready to go in whatever direction you want to go.
Steve: Having worked with you for twenty years, I know how much exploration you do with Sketchpad to learn and create mathematics yourself. And I know that one of your design principles is to keep Sketchpad lean with respect to preprogrammed commands and robust in its power
A Conversation with Sketchpad’s Designer Nicholas Jackiw Nicholas Jackiw, designer of The Geometer’s Sketchpad, talks with Steven Rasmussen, publisher at Key Curriculum Press.
20 Key Curriculum Press® | Innovators in Mathematics Education | www.keypress.com
Lynn Hughes Elementary School Teacher, Miquon School, Conshohocken, PA
A Collection of Tools
One of the things I like to do with Sketchpad when I’m starting out with students is to present it as “a package of tools.” This is
important because kids, at this point, are much more used to having a piece of software that does one thing or one set of things. But to start out with a blank screen and explore the tools is the way children begin to realize that Sketchpad is something that they can control.
I like the way children will anticipate Sketchpad’s capacities. They’ll ask, “Can I make it do this? How do I get it to do that? Can I change the color of the lines? Can I make them thicker? Can I get this line not to move?” And so more of the instruction is in response to their actual need rather than my idea of what I think they’re going to need. In one activity students are asked to make a rectangle. This is something they already know how to do. They know what a rectangle is. They know what its attributes are. And so they start out with a line segment and then, usually, they’ll mess around a little bit with trying to get a square corner. Eventually, they’ll begin to ask, “Can I tell it how many degrees?” Or, “Can I make a perpendicular line?”
Even if they don’t have the vocabulary, they understand the relationships among the lines they want and that’s a good place to introduce vocabulary. If I use the term perpendicular, they’ll begin to use perpendicular. As they begin to make rectangles and begin to think about the requirements of them, they’re solidifying their understanding of that particular geometry. Usually they’ll start out with parallel lines, drop some segments to make the perpendicular sides. In some cases, students will pull on a corner and realize that what they really have is a parallelogram and not a rectangle and begin to wonder how they can secure it.
Sketchpad’s dynamic nature and its forgiving nature are also terrific for kids whose manual dexterity is not great, who are readily frustrated, who think that if it’s on paper it has to be perfect. It’s so easy to back up and undo on Sketchpad. I’ve seen many children take many more cognitive and intellectual risks because they know they can undo things and try something else.
“ T e a c h e r t o T e a c h e r ”
Now suppose I say, “I like this square. This is my yellow square.” I can turn my square into a new command in Sketchpad. I just select the whole thing and “Create a new tool.” Sketchpad asks for the tool name. I’ll call it “Nick’s square.” Now whenever I want a square, I just use the “Nick’s square” tool and Sketchpad gives me my yellow square.
So I’ve just taught the program what a square is in a way that lets me now use square in my mathematical vocabulary from this point on. Sketchpad has learned from me. And I don’t have to worry about squares again—I can go on to investigate something else.
Precisely because Sketchpad is built on a lean foundation with relatively few primitive building blocks that can be combined in all sorts of ways, users can build all kinds of tools, not just tools for geometry. I have a tool, for instance, that creates a tangent to a function. There’s no command in Sketchpad for function tangents. My tangent tool is an elaborate mathematical construction that someone—not me—has put together using Sketchpad’s algebraic, function-plotting, and trigonometric capabilities to define a tangent. I can, in turn, use this tool to make a new tool that, given any function, lets me find its gradient curve. I can build on my own knowledge, or I can use tools made by others to build on their knowledge. Collectively, we make Sketchpad smarter and more useful.
Steve: The way knowledge is constructed in Sketchpad mirrors the way mathematicians create new mathematics.
Nick: And it’s that constructivist, or even constructionist, vision of building your own mathematics—starting out with an essential small set of core definitions and building and building, higher and higher, to access ever more complex mathematics—that makes Sketchpad so useful. If I, as Sketchpad’s designer, defined all of the mathematics embedded in Sketchpad, its potential would be far more limited—and certainly not a learning tool that I could use myself.
Steve: Thanks, Nick.
Teaching Mathematics with The Geometer’s Sketchpad® 21

n Sketchpad Supports Students’ Work with Proof. Michael de Villiers, in summarizing his experiences using Sketchpad to teach the art of proof, explains that teachers can help make proofs a more meaningful activity to students by focusing not only on proof as a means of verification, but on its role in explanation and discovery.5
n Sketchpad Motivates Students and Increases Their Enjoyment of Mathematics.Nathalie Sinclair describes the motivational and aesthetic aspects of using Sketchpad in the context of interviews she conducted with middle-school students.6 Sinclair notes that because there is more than one way to construct an object like a square, students develop a personal connection with the techniques they devise, much as they might feel a sense of ownership with an essay they write.
Notes1. Sinclair, N. and S. Crespo. (2006). Learning mathematics in dynamic computer environments. Teaching Children Mathematics, 12, 436–444.
2. Battista, M. T. (2008). Development of the shape makers geometry microworld. In G. W. Blume and M. K. Heid (Eds.), Research on technology and the teaching and learning of mathematics: Volume 2. Cases and perspectives, 131-156.. Charlotte, NC: Information Age Publishing.
3. Scher, D. (2002). What to expect when geometry becomes interactive. New England Mathematics Journal, May 2003, 36–43.
4. Hazzan, O. & E. P. Goldenberg (1997). Students’ understanding of the notion of function in dynamic geometry environments. International Journal of Computers for Mathematical Learning, 1, 263–291.
5. De Villiers, M. D. (2003). Rethinking proof. Emeryville, CA: Key Curriculum Press.
6. Sinclair, N. (2006). Mathematics and beauty: Aesthetic approaches to teaching children. New York, NY: Teachers College Press.
In addition to its countless classroom applications, The Geometer’s Sketchpad has inspired a healthy body of research
describing its effects on student learning. Here is a small sampling of research findings about Sketchpad collected from the academic literature. You’ll find a much longer research bibliography at the Sketchpad Resource Center located at www.dynamicgeometry.com.
n Sketchpad Supports Elementary School Students’ Development of Number and Early Algebra Concepts.Nathalie Sinclair and Sandra Crespo describe a dynamic number line built with Sketchpad that includes inputs a and b as well as their product, a x b.1 Dragging either input along the number line in a continuous motion moves the product as well. Sinclair and Crespo observe that the act of dragging shifts students’ attention from discrete computations to a more comprehensive view of the behavior of operations. If input b stays at 1 while the student drags input a, for example, she obtains a dramatic demonstration that a x1 always equals a.
n Sketchpad Strengthens Students’ Conceptual Understanding of Geometric Shapes.Michael Battista studied a classroom of fifth-grade students who experimented with Sketchpad models of parallelograms, rectangles, squares, and rhombi.2 As students dragged the shapes, changing their measurements
but not their defining properties, they observed that a rhombus could become a square but not an arbitrary rectangle. Battista concludes that the ability to manipulate shapes directly with Sketchpad helps students to think about, classify, and describe their geometric properties.
n Sketchpad Helps Students Connect Their Intuitive Notions of Geometry with a More Formal Perspective.Daniel Scher, in collaboration with Paul Goldenberg, conducted interviews with middle-school students using The Geometer’s Sketchpad.3 He notes that because geometric objects built with Sketchpad can be dragged and animated, students often describe what they see using informal similes. (e.g., “When I drag this point, my construction behaves like a slingshot.”) These similes can help bridge the gap between students’ informal understandings and the formal geometry of the models.
n Sketchpad Expands Students’ Notions of Functions. Orit Hazzan and Paul Goldenberg conducted interviews with undergraduate mathematics majors and concluded that by investigating geometric models built with Sketchpad, students can deepen their under-standing of functions.4 Rather than view functions as purely algebraic statements, Goldenberg and Hazzan argue that the act of dragging a point and seeing which other objects in a sketch are affected by the dragging is, in itself, an example of a functional relationship.
Research on Sketchpad How The Geometer’s Sketchpad Affects Student Learning
22 Key Curriculum Press® | Innovators in Mathematics Education | www.keypress.com

together. In this case, Sketchpad reveals that the sum of the mystery number’s digits is 5. Since 2 + 3 = 5, the mystery number is 23.
Students now work in pairs at laptops solving new Mystery Number challenges. When the class comes back together for the final 10 minutes of class, the teacher asks them to share some interesting discoveries and strategies. Here’s what the students report:n Sometimes you need to press Sum of Digits even when the mystery number isn’t prime. For example, if the mystery number is a multiple of 5, but every other button gives an answer of No, the number could be either 5 or 25. The only way to check is to press Sum of Digits.
n If the mystery number isn’t a multiple of 4, that doesn’t necessarily mean the mystery number isn’t a multiple of 2. n If you click the lowest number, it will eliminate the most choices. Megan explains that if you pick Multiple of 2? as your first choice, you will eliminate roughly half of the possible choices for the mystery number.
Students are visibly pleased with the problem-solving strategies they devised and are eager to play Mystery Number again when the teacher gives them free time on the computers.
It’s the first day that Ms. Kirkwood’s fourth-grade class at the Manhattan New School is using Sketchpad. They’re about
to explore a Sketchpad activity called Mystery Number. The class has already learned about multiples, factors, and prime numbers, but they’re going to push their thinking further today as they encounter multiples and primes in a novel context that will engage them in logical thinking and deductive reasoning.
The teacher begins by projecting the Mystery Number sketch and describing the challenge: Sketchpad has secretly picked a number between 1 and 25 inclusive. The number is hidden, but students can ask questions to gather hints to the number’s identity. Each question is of the form, “Is the mystery number a multiple of __?”
As an example, the teacher presses the Multiple of 2? button. A checkmark appears in the No column. The class records this information on their worksheets, and the teacher asks how it can help them narrow down their choices. Michael responds that the mystery number cannot be even—it must be odd. The students refer to the list of numbers from 1 to 25 on their worksheets and cross off all the even numbers.
A volunteer suggests that the students try Multiple of 5? as their next clue. Again, the answer is No—the number is not a multiple of 5. Some multiples of 5 have already been eliminated as choices (namely, 10 and 20); students now remove 5, 15, and 25 as well.
The class could keep pressing buttons at random, but Mimi has a timesaving idea. She makes the following hypothesis:
“We don’t need to ask about any of the even numbers because Sketchpad is going to say No.”
Students are quick to raise their hands to explain Mimi’s thinking. They conclude that if the mystery number were a multiple of an even number like 6 or 10, it would automatically be a multiple of 2 as well. Since the mystery number isn’t a multiple of 2, it cannot be a multiple of any even number. Through this piece of deductive reasoning, students feel clever because they know the answer to the questions Multiple of 4? 6? 8? 10? 12? without having to press any buttons at all.
With the mystery number still unknown, students check whether the number is a multiple of 3, 7, or 11. Again, the answer to all of these questions is No. The teacher now asks the class to examine the numbers that remain:
“Let me ask you this—What numbers are left on your sheet? You’ve got 1, 13, 17, 19, and 23. What are those numbers called?”
Alex excitedly notes that all of these numbers, with the exception of 1, are prime. This makes sense: Since a prime number like 13 has only itself and 1 as a factor, no Multiple of button can eliminate it from contention. What can be done to check the prime numbers?
The teacher points to a button on the sketch called Sum of Digits. This is the button of last resort, the button to press if there is no other way to determine the mystery number. The teacher explains that Sum of Digits takes the tens-place digit in the mystery number and the ones-place digit and adds the two digits
The Mystery Number Sketchpad in the Fourth Grade
Teaching Mathematics with The Geometer’s Sketchpad® 23

One issue that arises in every Sketchpad classroom is the difference between a drawing and a construction. If you
ask students with no prior Sketchpad experience to construct a square, they often use the Segment tool to draw four connected segments (Figures 1 and 2).
Students might then drag the vertices of their quadrilateral to make it more square-like, or they might measure the lengths of the sides and drag them until all four of the measurements are equal (Figure 3). Then they’ll say, “There. This is a square.” Or if they’re mathematically precocious, they might go a step further and claim, “This is a square, and the fact that all the measure-ments are equal proves that it’s a square.”
But it’s not a square. You can ask students, “What happens if I drag this corner?” And as soon as they drag any vertex, the square breaks because when the shape was created, it wasn’t given any of the math-ematical definitions that are essential to a square (Figure 4). All students have done is connect four points with segments yield-ing what is mathematically a quadrilateral,
Construction in a Nutshell “Draw versus Construct”
Figure 2 Figure 3 Figure 4
not a square. A constructed square will stay a square no matter how it is dragged. It will survive what we have come to call “the drag test.”
So if you ask students to construct a square with Sketchpad, they have to begin think-ing, “What are the properties of a square? How can I put these properties into my image so that when I drag any part of it, the shape will always stay a square?”
Your students probably know that squares have right angles. So they might construct a segment EF, select the segment and an endpoint, and construct a perpendicular using the Perpendicular Line command (Figure 5). Now, whenever they drag either endpoint of , the new line remains perpendicular to (Figure 6).
Your students also likely know that the sides of a square have equal lengths. Because all radii of a circle have the same length, they can use a circle with radius to create a segment EG that is perpendicu-lar and congruent to (Figures 7 and 8).
These two steps have resulted in two per-pendicular segments of equal length. By
hiding the circle and the line, students have the first half of their square (Figures 9 and 10).
There are many different properties of a square that students could use to finish their construction. They could, for example, draw
and reflect and across to obtain the complete square. Or they could use Sketchpad’s Rotate command to rotate the segments by 90 degrees. One other option is to construct parallel lines. Specifically, students can construct a line through point G parallel to and a line through point F parallel to (Figure 11).
After constructing point H, the intersection of the two lines, hiding the lines, and connect-ing point H with points F and G, students end up with a square that will survive the drag test (Figures 12 and 13). It can be as big as they want and it can be oriented however they want, but there’s no way they can drag the quadrilateral to be anything other than a square (Figure 14).
That’s the difference, in a nutshell between a drawing and a construction. A construction will survive the drag test, a drawing will not. With Sketchpad, it’s easy to tell the difference.
Figure 1
24 Key Curriculum Press® | Innovators in Mathematics Education | www.keypress.com

Sketchpad as a Productivity Tool
Sketchpad is a valuable mathematical productivity tool for creating documents and presentations.
You can easily include figures, graphs, or constructions in a quiz, a worksheet, or a report. Construct the desired objects in Sketchpad, select and copy them, and paste them into your word processor. You can modify the sketch to include before-and-after images or a longer sequence of images in a process. Or you can drag points and change parameters in your sketch to put five similar problems into a worksheet, or to create multiple forms of a test. Many teachers use Sketchpad to create richly formatted mathematical text (including fractions, overbars, exponents and the like) to use in the materials they prepare. Some teachers create all their worksheets, quizzes, and tests in Sketchpad.
You can use Sketchpad to produce graph paper for various purposes. Sample sketches allow you to establish your desired scale and extent for square, rectangular, polar, semi-log and log-log graph paper, and several varieties of geoboards. You can use these graphs and geoboards for live Sketchpad investigations, or you can paste them into other documents.
Sketchpad can help you create presentations in many ways. Print a sketch onto a transparency for use with an overhead projector, or paste Sketchpad images into PowerPoint or another presentation program. Or consider using Sketchpad itself as your mathematical presentation program by creating multiple pages and assorted action buttons. Hot Text, mathematically formatted text, and the ability to manipulate your sketches add excitement and mathematical interest to your presentations.
Figure 5 Figure 6
Figure 7 Figure 8
Figure 9 Figure 10
Figure 11 Figure 12
Figure 13 Figure 14
Teaching Mathematics with The Geometer’s Sketchpad® 25

Students love to explore and to make things happen. Sketchpad lets them investigate and discover. One
time, I showed my students a sketch with a right triangle. Since the model was described as an example of the Pythagorean Theorem, I expected it to have squares on the triangle’s three sides. But instead, there were identical, scaled teapots on the bases and hypotenuse. By taking measurements, we determined that the sum of the areas of the teapots on the bases was equal to the area of the teapot on the hypotenuse. As a math teacher, I thought this was a new, exciting idea. And it got me thinking—what if my students could draw other scaled figures, besides teapots, on the sides of the right triangle? Would the area relationship still hold?
I came up with an idea that was both mathematical and fun: First, we worked in class to create an 8-by-8 grid that we could attach to the three sides of a right triangle. Using this grid, students could draw scaled images, measure their areas, and check if the Pythagorean Theorem held for shapes other than squares. My students created the most amazing projects! I got the school mascot, which was a Spartan; Elvis playing on the sides of a right triangle; and Tweety Bird. Students absolutely loved this project. I have two bulletin boards in
ExplorationFostering Student Creativity
my classroom that I keep covered with their work. They love seeing their work displayed and try to outdo each other.
Another big project we do involves transformations, where students dive in and learn how to do translations, rotations, dilations, and reflections with Sketchpad and how to create animations. Then they have to create a model that has all the transformations and an animation in a single sketch. And here again, I’ve received amazing projects. Students never
By Karen Wyatt, Middle School Mathematics Teacher, Mountain Brook Junior High School, Birmingham, AL
fail to surprise me with what they create. I’ve had Harry Potter sketches where Harry’s flying around on his broom, going after the Snitch. Draco, the other character shown in the picture, was not drawn separately. Martha, the girl that built the sketch, made Harry, then she reflected him, dilated him, and changed the color of his shirt and his hair a little bit—and that’s how she created Draco.
26 Key Curriculum Press® | Innovators in Mathematics Education | www.keypress.com

David Hallas Middle School Mathematics Teacher, Winchester Thurston School, Pittsburgh, PA
Variables that Vary
I’ve used algebra tiles to introduce concepts such as adding like
terms, multiplying binomials, factoring, and that sort of thing. Traditional algebra tiles are static, so even though you say the side of this square is x, x has a value. Sketchpad allows you to develop a dynamic algebra tile where you can truly vary x, and I think it’s really important that students, when they first learn about algebra, actually see variables that vary.
When plotting functions in Sketchpad, you can change them dynamically by using parameters or sliders instead of numbers. You can then say, “Well what if this particular profit function changes? And what would that do to the slope of the graph?” So I think Sketchpad gives you the potential to ask many more “What if” questions.
There’s always just so much more for teachers and students to learn. Using Sketchpad keeps me excited, which keeps my teaching of mathematics fresh. Sketchpad allows me to think about new ways of doing things. No matter how long you’ve been teaching, you realize that you’re either getting better or you’re getting worse—there’s no standing still. As long as I’m in the profession, I want to continue to get better. Sketchpad is a tool that allows me to do that.
“ T e a c h e r t o T e a c h e r ”
Using Sketchpad keeps my teaching fresh.
PresentationSketchpad for Mathematics Communication
You’ll find that Sketchpad’s features—especially its text and annotation capabilities, multipage document
structure, and action buttons—make it ideally suited for teacher and student presentations. Sketchpad provides a powerful medium for sharing and communicating ideas.Un With the Text tool, you can write
captions that describe salient features of a sketch or pose questions to be explored. Your students can use captions to capture their own thoughts about a sketch and then share the sketch with you or their classmates.
n With action buttons, you can simplify complex sketches. Use buttons to hide and show objects or initiate animations. Sequence buttons together so that procedures and explanations of a construction can be “played” with the click of a button, turning sketches into presentations.
n With Hot Text, you can click on any object in your sketch and its mathematically formatted label will be inserted into the caption to dynamically link the object to its label.
n With the Marker tool, you can quickly add common mathematical mark-up notation to a construction, including angle markers, hatch marks
for congruency, and markings for parallel lines.
n With link buttons, you can provide access to online resources from within a sketch, which can provide additional explorations, survey real-world applications, or establish the historical context of a particular mathematics exploration.
n With JavaSketchpad, you can publish your Sketchpad models online, integrating them with multimedia components and hyperlinked resources. Users who visit your web page can interact with your Java sketches even if they do not own Sketchpad.
Mousing over Hot Text highlights the referenced object. Here is highlighted.
Teaching Mathematics with The Geometer’s Sketchpad® 27

my instructions. What happened was wonderful. He ended up creating a different type of ring-shaped tessellation from regular polygons.
I remember, though, my first reaction. I was a little bit upset that he didn’t follow my instructions. But when I went home, I realized that he had generated a construction that was very rich mathematically. So with the help of two other freshmen, we developed the mathematics behind this discovery. We realized that the constructions related
I used to teach in Istanbul, Turkey, at the high school division of Robert College. One year I had a wonderful student, Bilge Demirköz,
who was a nontraditional learner. She had a style that was different than what the curriculum demanded. Before our work with Sketchpad, she never finished my tests on time. She was a very bright student, but not in a classical sense.
With the advent of technologies like Sketchpad, we started exploring various things. And one day, when we were studying conic sections, she asked a question that at the time really puzzled me because I had never thought about it myself: “What if, instead of two foci in an ellipse, you had three foci?”
I didn’t know the answer, but we realized that we had the right technologies to pose the question. So with the help of Sketchpad and another powerful computer program now called Graphing Calculator (from Pacific Tech, www.nucalc.com), we were able to actually visualize such constructions. And what my student found out later was that her question was originally posed by a 19th-century mathematician. The mathematician came to the point where he defined the mathematics my student investigated—he wrote the equations and so forth—but he could not visualize the equations because he did not have the means to do so.
My student and I were very happy about this because we were able to finally make the next link in a historical chain of events that had come to a halt in the 19th century. My student wrote about her discoveries and became the youngest person ever published by the Turkish Mathematical Society. She eventually got accepted to MIT, where she graduated from the college and the
master’s program. She went on to study physics at Oxford.
In her case, and with many others, Sketchpad provided the environment for making an original conjecture and getting feedback on the idea. What students often miss in a mathematics classroom is appropriate feedback on their ideas. In other fields, computer science, for instance, if students make errors, the computer lets them know they’ve made errors. In a traditional mathematics classroom, it’s hard to tell if you’re on the right path or not. When you make things in Sketchpad, however, you get immediate feedback. This allows exploration to really speed up and become very rich.
My experience at Robert College wasn’t my only exciting experience of this kind. One time when I was teaching about Archimedean tessellations (tessellations of mixed regular polygons) to high school freshmen and sophomores at a new school in the United States, one of the students did not follow
A Tool for Student Inquiry Students Explore Original Ideas with Sketchpad
Robert College Student Bilge Demirkoz’s
three-foci curve drawn with Sketchpad
By Selim Tezel, High School Mathematics Teacher, Concord Academy, Concord, MA
28 Key Curriculum Press® | Innovators in Mathematics Education | www.keypress.com

TESS-Rings: A Surprising Link Between Geometry and Number Theory
TESS-Rings were originally discovered in the spring of 2004 by Tony Diaz, when he was a sophomore
at Concord Academy, during a Sketchpad explorations lab on the topic of Archimedean tessellations. While studying the nature of these structures, Tony came to realize that the rules of their geometric formation are deeply related to factoring of numbers, and thus the structures provide a beautiful link between geometry and number theory. We named these structures “TESS-Rings” to indicate their origins as related to TESSellations and to hint at who worked on them: Tony Diaz, Everett
Wallace, Sylvie Lam, Selim Tezel. Tony’s teacher, Selim Tezel, and his students have authored a paper on the subject of TESS-Rings and recommend that others may enjoy investigating the “Fundamental Question of TESS-Rings.”
Definition: A TESS-Ring is a two dimensional geometric structure formed by joining coplanar congruent regular polygons side by side until they form a closed ring-shaped figure, such as the one shown above. The centers of the regular polygons themselves create a regular polygon when joined by segments. Definition: The number of the sides of the regular polygon used to make the ring is called the base of the TESS-Ring and the number of regular polygons needed to form the ring is called the period of the TESS-Ring.
The TESS-Ring shown above is made of ten regular pentagons joined side by side. Thus, the base of the ring is 5 and its period is 10. The polygon created by the centers is a regular decagon.
Notation: A TESS-Ring formed by joining k regular n-gons is denoted by: nTRk. Thus n is the base and k is the period of the TESS-Ring. For example a TESS-Ring formed by ten regular pentagons is denoted: 5TR10.
(Some more examples are at left.)
Fundamental Question of TESS-Rings: What is the relationship between the number of sides (n) of a regular polygon and the number of such regular poly-gons needed (k) to form a TESS-Ring? In other words, how does the period (k) of a TESS-Ring relate to its base (n)?
I do not believe
that the possibility
of high school
freshmen
publishing original
scholarly work
would be possible
without the advent
of technologies
like Sketchpad.
geometry to number theory. Together, my students and I wrote a paper. Someday we hope to see it published.
Sketchpad lets students explore their own ideas and get immediate feedback. It gives them confidence in their ideas. I do not believe that the possibility of high school freshmen publishing original scholarly work would be possible without the advent of technologies like Sketchpad. Sketchpad really is a tool for student inquiry. That’s a big thing.
Teaching Mathematics with The Geometer’s Sketchpad® 29

Using Sketchpad’s annotation features, students create a picture with accompanying text to communicate the ideas of their proof. Because and are the midsegments of ΔADB and ΔCDB respectively, they are both parallel to and half its length. A similar argument explains why and are parallel. Thus, EFGH is a parallelogram.
Points E and F are midpoints of and . By the Triangle Midsegment Theorem, EF is parallel to and half its length.
The proof is now complete, but further areas of inquiry remain. For certain positions of ABCD, students notice
that EFGH is a rectangle. For other positions, it is a square. Students might never encounter these situations if they saw just a single picture in their textbook. With Sketchpad, students naturally explore these special cases systematically. By revisiting the deductive reasoning of their midpoint quadrilateral proof, students are able to discover properties of the construction that explain when—and why—EFGH is a rectangle or square.
M ichael de Villiers, author of Rethinking Proof with The Geometer’s Sketchpad (Key Curriculum Press,
2003), describes six roles for proof:
n Proof as a Means of Verification
n Proof as a Means of Explanation
n Proof as a Means of Discovery
n Proof as a Means of Systematization
n Proof as a Means of Communication
n Proof as a Means of Intellectual Challenge
While school mathematics typically focuses on proof as a means of verification, de Villiers argues that students (and mathematicians) are usually convinced of their conjectures long before they begin a proof. Indeed, the student who builds a triangle with Sketchpad, measures its angles, adds them together, and then drags a vertex to view a seemingly limitless collection of triangles probably needs no additional convincing to be sure that the angles always sum to 180 degrees.
So with Sketchpad in mathematics classrooms, is proof obsolete? Hardly. As de Villiers notes, proof has the power to illuminate what students observe, allowing them to answer the question, “Why is this mathematical result true?” Instead of stressing proof as a means of verification, de Villiers urges teachers to shift their emphasis and encourage students to use proof as a means of explanation. Why questions arise naturally when students work with Sketchpad. Answering these questions and constructing logical arguments remains the rightful responsibility of students—Sketchpad leaves the intellectual lifting in the hands of students. Sketchpad does,
however, provide students with the tools to mine visual and numerical data for clues that, when pieced together through deductive reasoning, shine a light on what they’re observing. The example that follows gives a sense of how this happens.
A Midpoint Quadrilateral
A classic result from geometry states that the midpoints of an arbitrary quadrilateral, when connected in order, form a parallelogram. Using Sketchpad, there is no need to state the result upfront. By constructing their own dynamic model of a quadrilateral ABCD and its midpoint quadrilateral, EFGH, students can drag any vertex of ABCD and see that regardless of ABCD’s configuration, EFGH always appears to be a parallelogram. This kind of visual demonstration is not a proof, of course, yet it is a compelling first step that motivates students to ask, Why is what I’m seeing true?
EFGH stays a parallelogram no matter how the vertices of ABCD are dragged.
Connecting vertices B and D and dragging the construction provide additional insight into the situation. Segment BD appears to be parallel to both and . Measuring the lengths of all three segments with Sketchpad reveals that and are always half the length of . Students are now ready to give a proof as a means of explaining what Sketchpad is showing them.
Sketchpad and ProofHow The Geometer’s Sketchpad Promotes Deductive Reasoning
30 Key Curriculum Press® | Innovators in Mathematics Education | www.keypress.com

Ralph Pantozzi High School Mathematics Teacher, Millburn High School, Millburn, NJ
A Metaphor for Thinking
In geometry, when I talk about the area of the triangle not
changing under certain conditions, I imagine in my mind a whole variety of triangles. But when I asked students one day to draw a triangle, they all drew isosceles triangles. That told me that they lacked a “math imagination” and took things shown in our textbook very literally. If a triangle looked isosceles, that was enough for it to be isosceles, because the picture in the book wouldn’t lie.
In algebra, many students don’t see that variables actually vary. They’ll see x + 3 and figure, “Okay, x is something I’m supposed to put in a number for, but not something I’m going to put in a variety of numbers for.” Whether it was geometry or algebra, students used the same static strategy. Triangles and variables weren’t things that could take on a range of possibilities.
I had students in my calculus class one year who had used Sketchpad in my geometry classroom two years before. I found them looking at pictures and diagrams in the textbook and saying, “Can you make this with Sketchpad? I want to see this move.” I found that even if they didn’t have Sketchpad with them, they’d use the language of
Sketchpad as they were talking about a picture. They’d put their fingers in the textbook and start to try to move points around. So even when Sketchpad wasn’t there, it was a metaphor for thinking, a real powerful way for them to represent their calculus ideas.
Another year in calculus, I was teaching a group of students who had used Sketchpad in Geometry, Algebra 2, and Precalculus, so these students were used to not taking a static diagram at face value. They were accustomed to asking questions about it, making conjectures and trying to test them out. So on the first day, I asked them the question, “Can you find the area under this curve?” Then I just set them to that task.
They worked with paper and pencil for a while, but within a few minutes they were asking, “We need to make many rectangles and we’d like to see what happens when we do that. Can we get Sketchpad out and do that?”
I acted as their assistant. They discovered integrals and how to find the area on the first day of the class and started asking about the concept of limit before I had a chance to even mention the word. The second day of class they started asking questions about derivatives, again, before the word was ever mentioned.
I really think Sketchpad was part of that remarkable start. The fact that they asked for Sketchpad because they’d used it before told me how powerfully it had affected them. Sketchpad isn’t with them all the time, but I think somehow it is in their minds all the time. My students asked for Sketchpad so they could take ideas inside their head and put them out there in the outside world for examination and discussion.
“ T e a c h e r t o T e a c h e r ”
Can you make this with Sketchpad? I want to see this move.
Teaching Mathematics with The Geometer’s Sketchpad® 31

WARNING: YOUR STUDENTS MAY DEVELOPA SUDDEN, INCURABLE INTEREST IN MATHEMATICS.
www.keypress.com/gsp5
8221
6


![Impact Of Geometer’s Sketchpad On [1] Faculty of Education ... · The software Geometer’s Sketchpad not only allows user to make constructions but is also able to solve problems](https://static.fdocuments.us/doc/165x107/5e55608410a91d715d104a5e/impact-of-geometeras-sketchpad-on-1-faculty-of-education-the-software-geometeras.jpg)


