Case Studies UNDP: SRI LANKA WILDLIFE CONSERVATION SOCIETY, Sri Lanka
David Haigh CEOBrand Finance plc
Superbrands Sri Lanka ‘Value Based Marketing’
20th March 2007
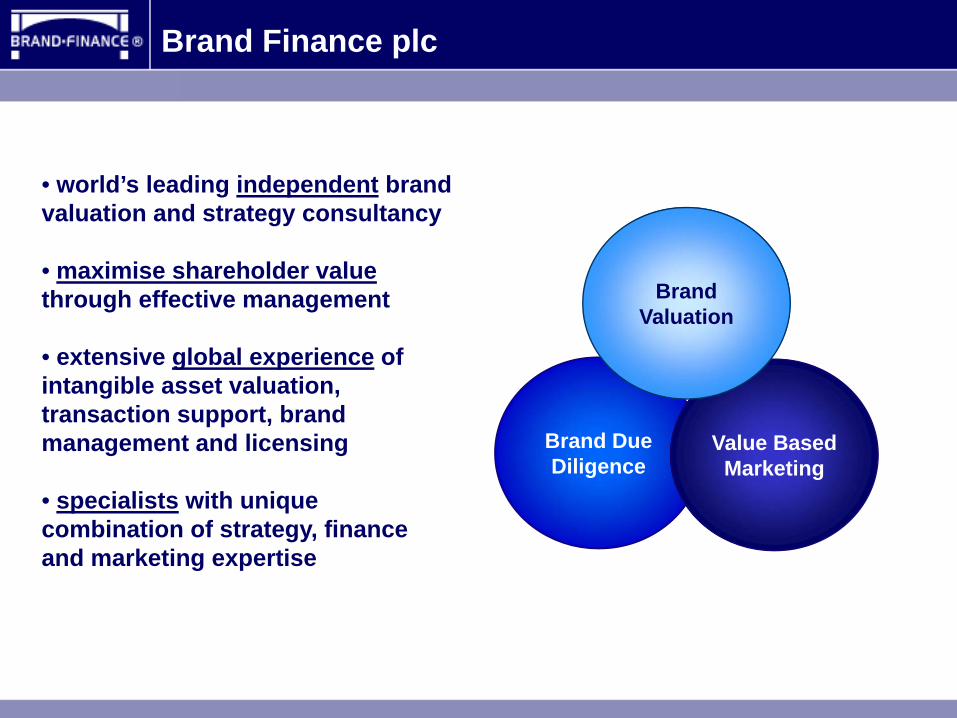
Brand Finance plc
• world’s leading independent brand valuation and strategy consultancy
• maximise shareholder valuethrough effective management
• extensive global experience of intangible asset valuation, transaction support, brand management and licensing
• specialists with unique combination of strategy, finance and marketing expertise
Brand Due Diligence
Value BasedMarketing
BrandValuation
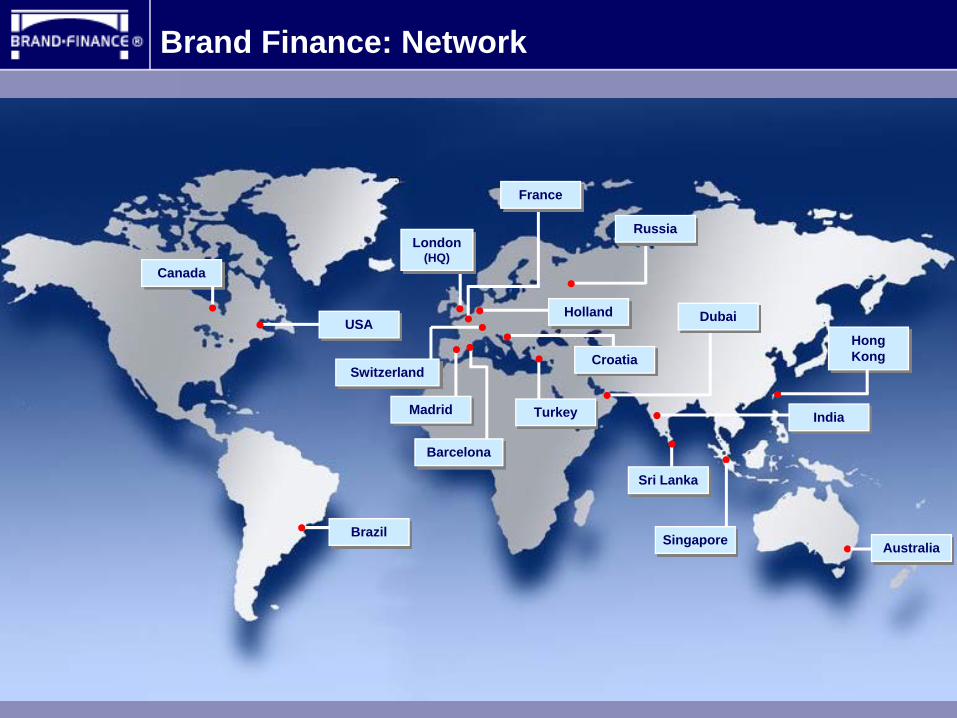
AustraliaBrazil
USA
Canada
RussiaLondon
(HQ)
France
Holland
Croatia
Turkey
Barcelona
Madrid India
Sri Lanka
Singapore
Brand Finance: Network
Hong Kong
Dubai
Switzerland
The Intangible Revolution
‘Understanding the hidden 70% of corporate value’
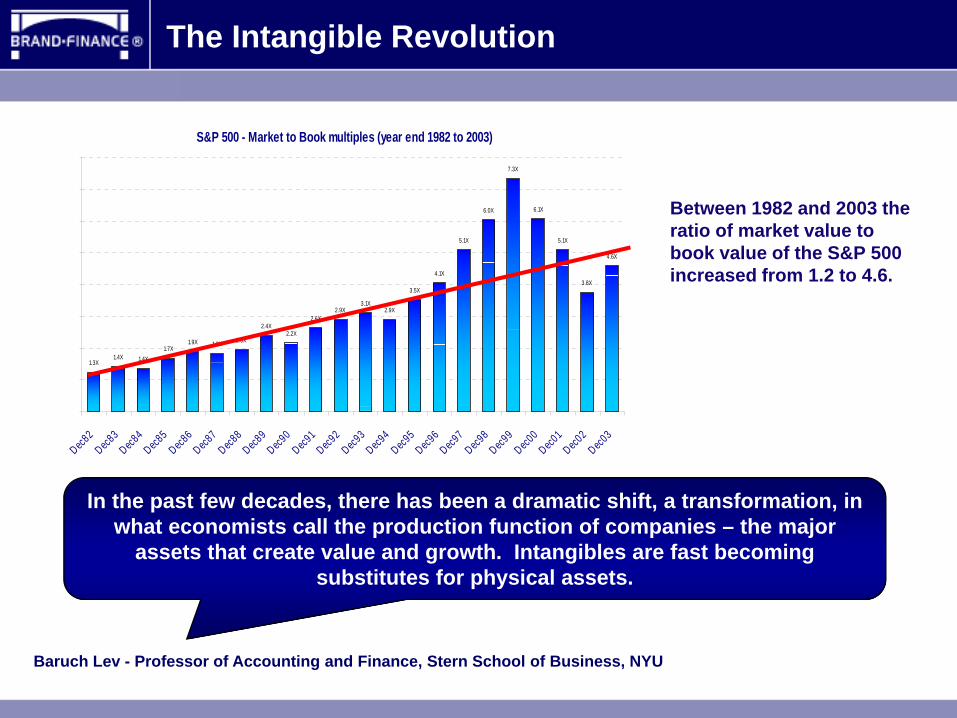
In the past few decades, there has been a dramatic shift, a transformation, in what economists call the production function of companies – the major
assets that create value and growth. Intangibles are fast becoming substitutes for physical assets.
The Intangible Revolution
Baruch Lev - Professor of Accounting and Finance, Stern School of Business, NYU
Between 1982 and 2003 the ratio of market value to book value of the S&P 500 increased from 1.2 to 4.6.
S&P 500 - Market to Book multiples (year end 1982 to 2003)
1.3X1.4X 1.4X
1.7X1.9X 1.8X 2.0X
2.4X2.2X
2.6X2.9X
3.1X2.9X
3.5X
4.1X
5.1X
6.0X
7.3X
6.1X
5.1X
3.8X
4.6X
0X
1X
2X
3X
4X
5X
6X
7X
8X
Dec82
Dec83
Dec84
Dec85
Dec86
Dec87
Dec88
Dec89
Dec90
Dec91
Dec92
Dec93
Dec94
Dec95
Dec96
Dec97
Dec98
Dec99
Dec00
Dec01
Dec02
Dec03
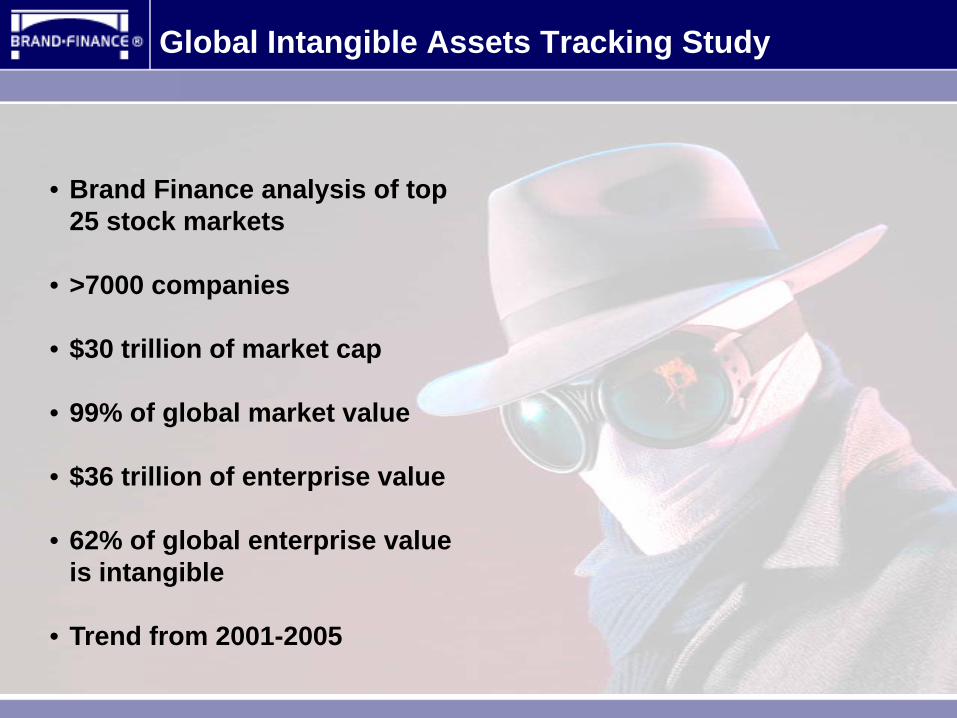
Global Intangible Assets Tracking Study
• Brand Finance analysis of top 25 stock markets
• >7000 companies
• $30 trillion of market cap
• 99% of global market value
• $36 trillion of enterprise value
• 62% of global enterprise value is intangible
• Trend from 2001-2005
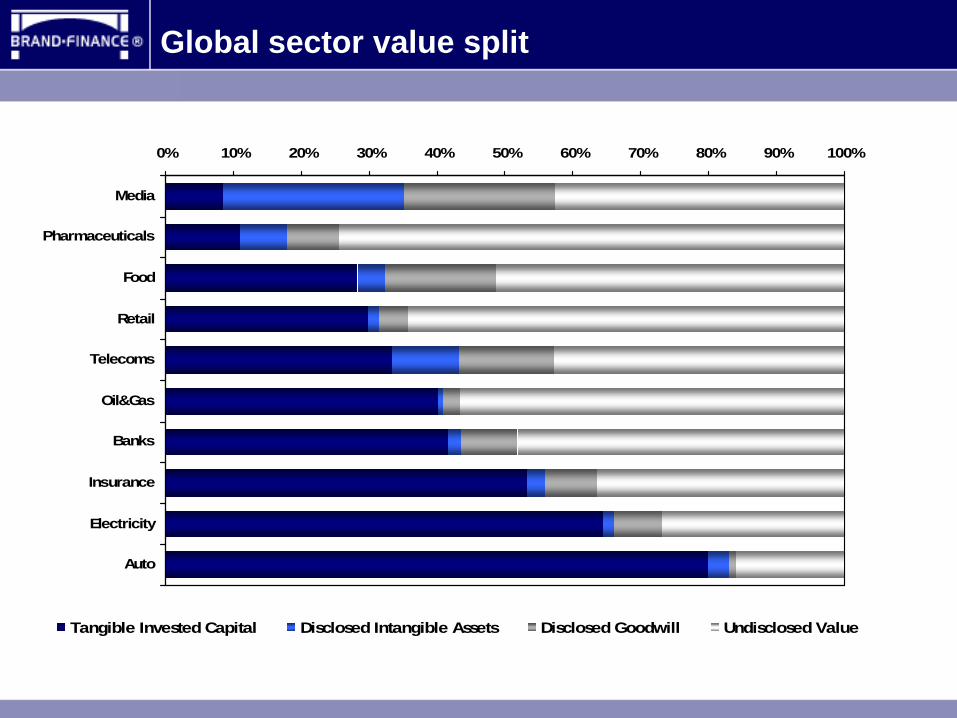
Global sector value split
0% 10% 20% 30% 40% 50% 60% 70% 80% 90% 100%
Media
Pharmaceuticals
Food
Retail
Telecoms
Oil&Gas
Banks
Insurance
Electricity
Auto
Tangible Invested Capital Disclosed Intangible Assets Disclosed Goodwill Undisclosed Value
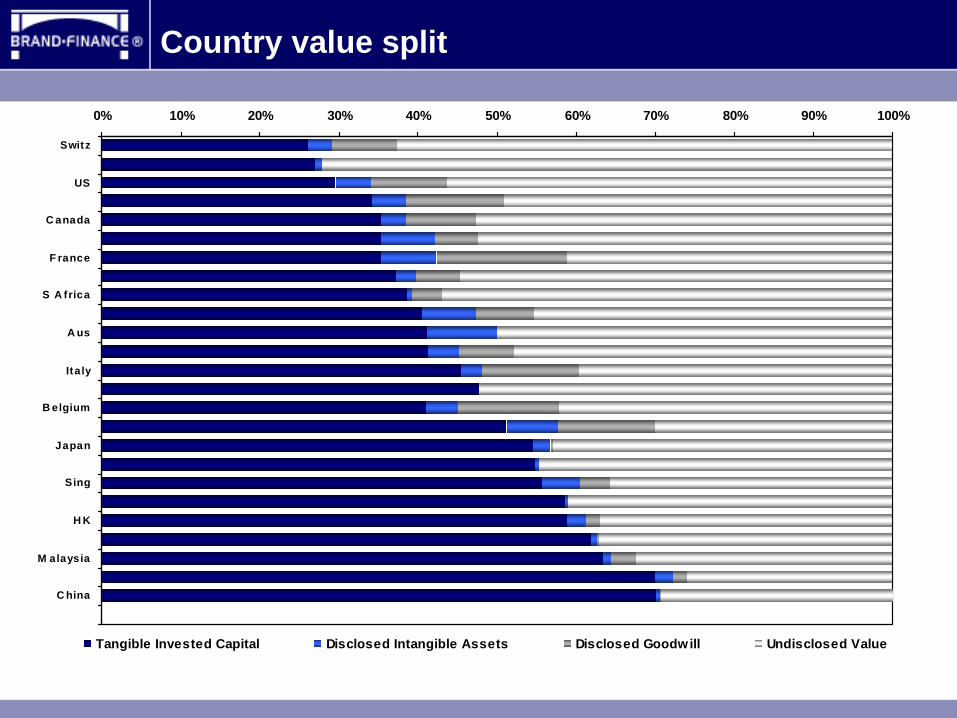
Country value split
0% 10% 20% 30% 40% 50% 60% 70% 80% 90% 100%
Switz
US
C anada
F rance
S A frica
A us
Italy
B elgium
Japan
Sing
H K
M alaysia
C hina
Tangible Invested Capital Disclosed Intangible Assets Disclosed Goodwill Undisclosed Value

High: Low ‘Intangible Value’ Countries
100%0% 10% 20% 30% 40% 50% 60% 70% 80% 90%
Switzerland
India
US
Malaysia
South Korea
China
Tangible Invested Capital
Disclosed Intangible Assets (ex Goodwill)
Disclosed Goodwill
Undisclosed Value
Top Three
Bottom Three
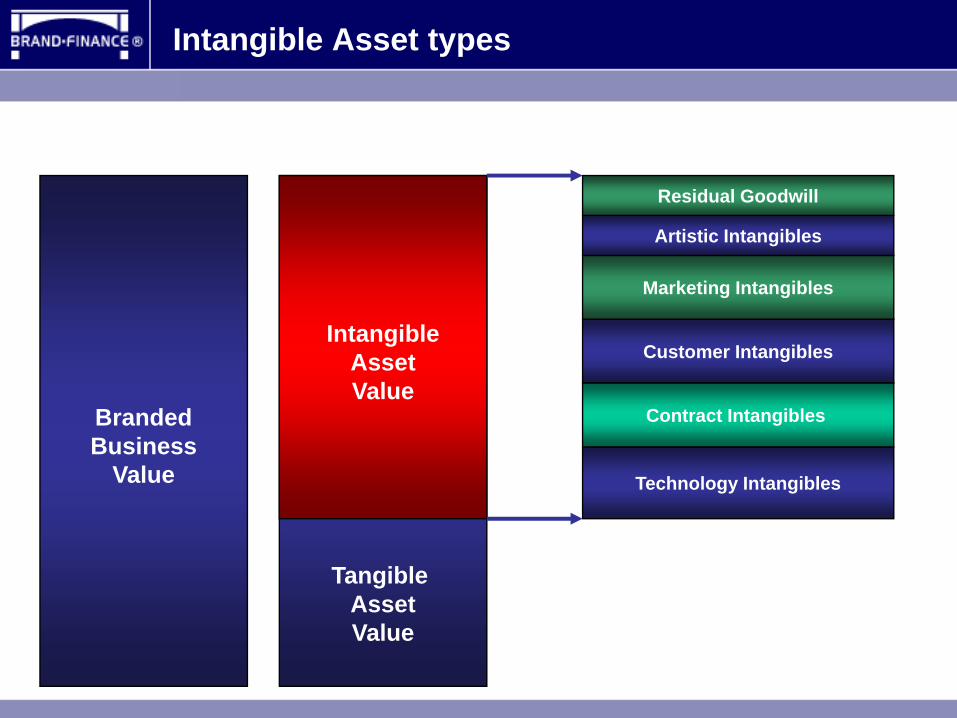
Intangible Asset types
BrandedBusiness
Value
Tangible AssetValue
IntangibleAssetValue
Technology Intangibles
Residual Goodwill
Customer Intangibles
Marketing Intangibles
Contract Intangibles
Artistic Intangibles
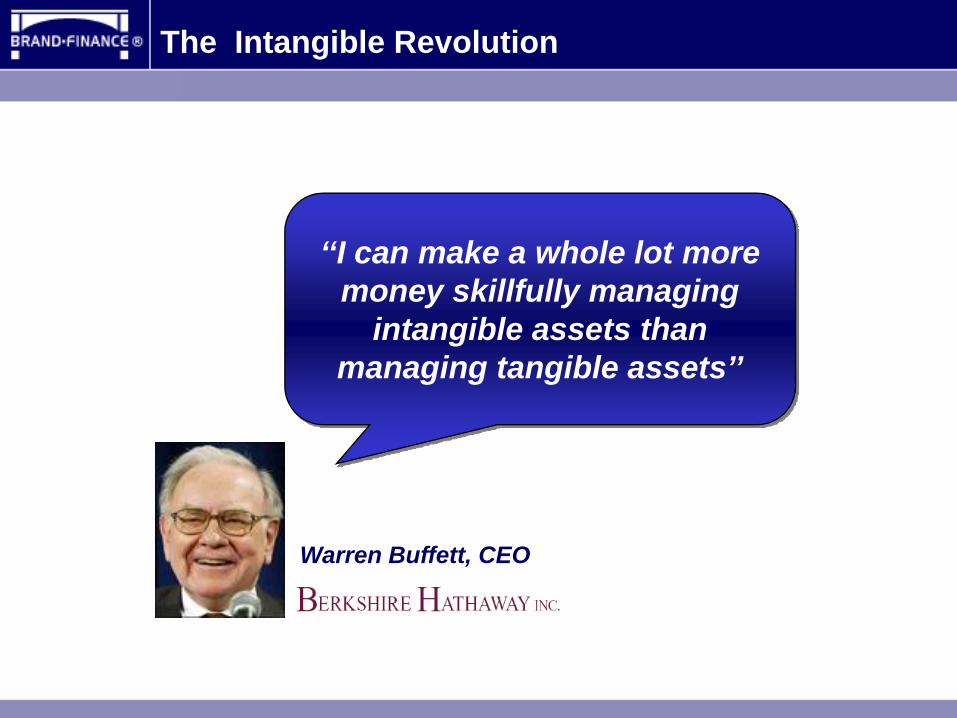
The Intangible Revolution
‘‘I can make a whole lot more money skillfully managing
intangible assets than managing tangible assets’’
Warren Buffett, CEO

P&G acquisition of Gillette
Intangible Assets
Tangible Assets
Technology
Relationships
Brands
Purchase Price Allocation:
Gillette
Purchase price 53.4
$ billion
Total Intangible Assets 29.7
Intangible Assets :
Brands 25.6
Patents and technology 2.7
Customer relationships 1.4
Residual Goodwill 34.9
Tangible Fixed Assets 4.5
Working Capital 0.6
L-t liabilities assumed (16.2)
Total Goodwill 64.5
The Brand Finance Global Top 250
‘Tracking the strongest and most valuable brands in the world’

BF250 – top 10 brands by value
Source: BrandFinance250©

BF250 – top 10 brands by Brand Strength
Source: BrandFinance250©
Brand Rating
Number of Brands
Brands
AAA+ AAA AAA-
12 8 17
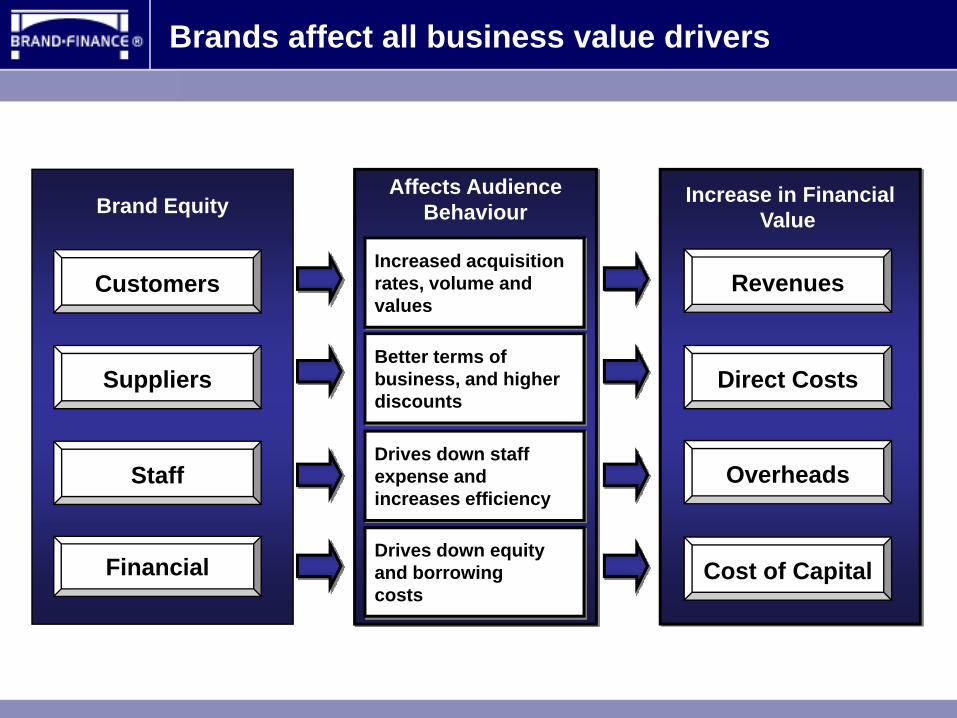
Brand Equity
Financial
Staff
Customers
Brands affect all business value drivers
Suppliers
Affects AudienceBehaviour
Drives down equity and borrowing costs
Drives down staff expense andincreases efficiency
Increased acquisitionrates, volume and values
Better terms of business, and higher discounts
Increase in FinancialValue
Revenues
Direct Costs
Overheads
Cost of Capital
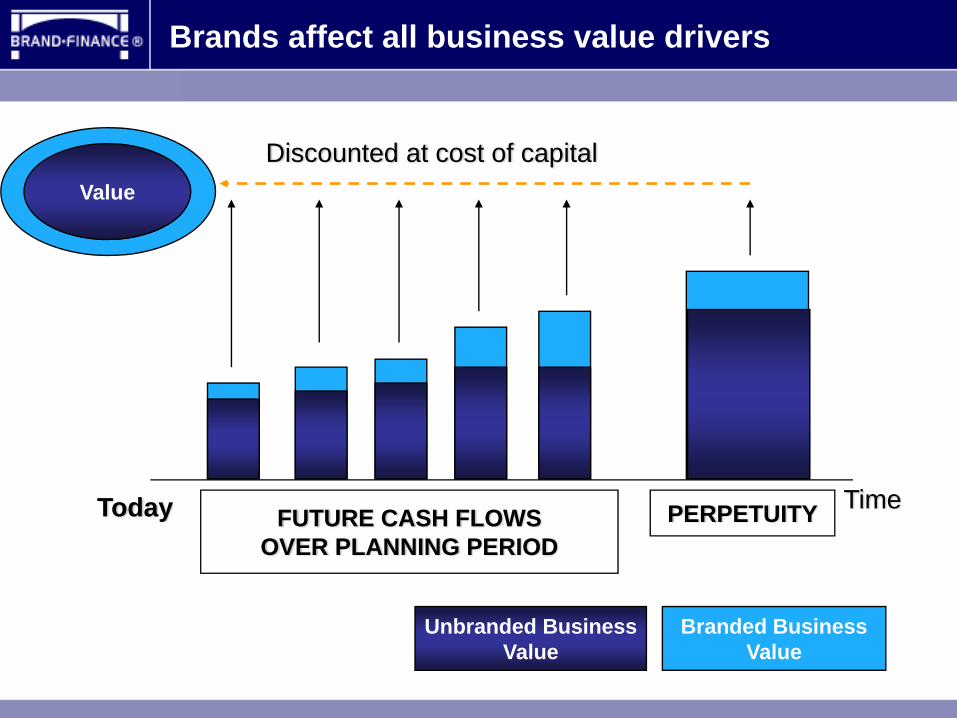
FutureValue
Discounted at cost of capital
FUTURE CASH FLOWSOVER PLANNING PERIOD
PERPETUITY
Value
Today Time
Yr.5
Branded BusinessValue
Unbranded BusinessValue
Brands affect all business value drivers
Case Study
Taking the global brand war seriously
‘The sole purpose of brands is to get more people to buy more of your
product, more often for more money.’
What do ‘brands’ add?
Sergio Zyman, former-CMO of
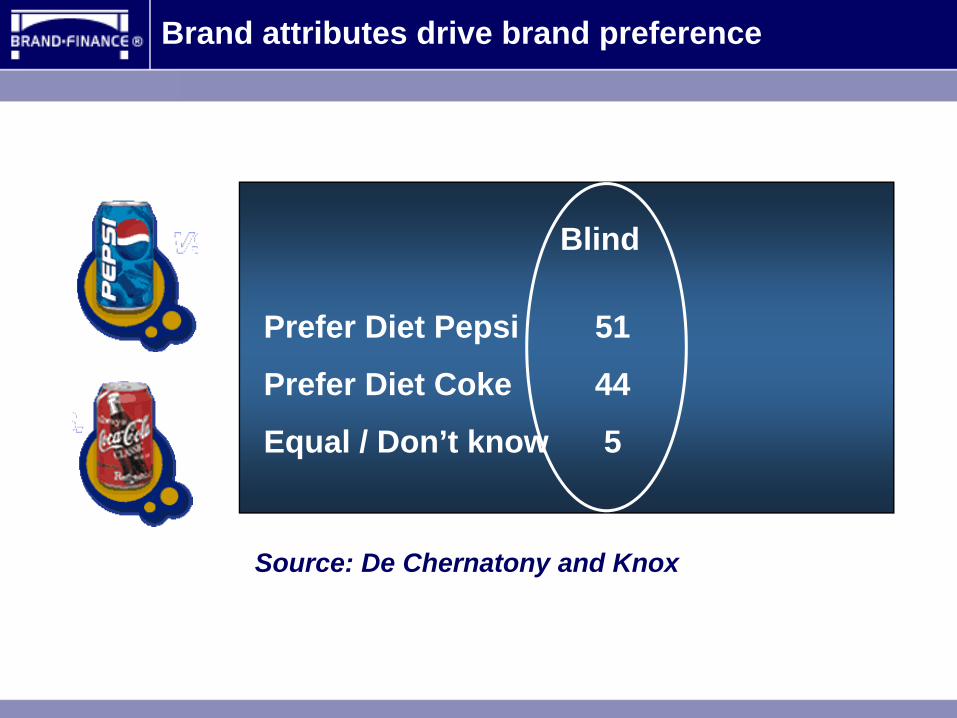
Source: De Chernatony and Knox
Blind
Prefer Diet Pepsi 51
Prefer Diet Coke 44
Equal / Don’t know 5
Brand attributes drive brand preference
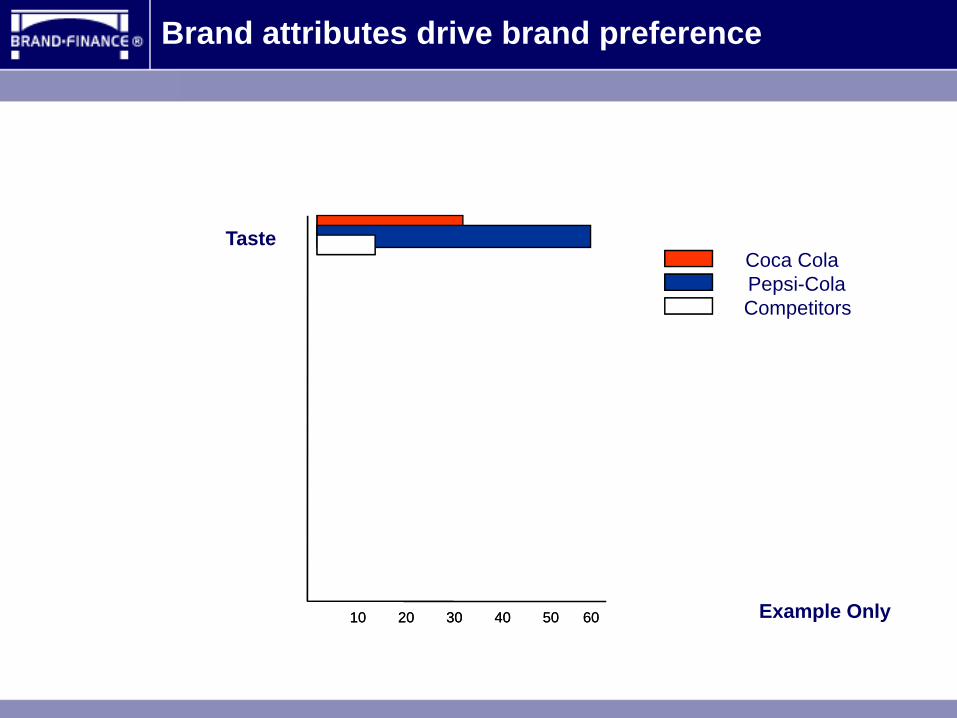
Coca Cola
10 20 30 40 50 60
Taste
CompetitorsPepsi-Cola
10 20 30 40 50 60 Example Only
Brand attributes drive brand preference

Source: De Chernatony and Knox
Blind
Prefer Diet Pepsi 51
Prefer Diet Coke 44
Equal / Don’t know 5
23
65
12
Named
Brand attributes drive brand preference
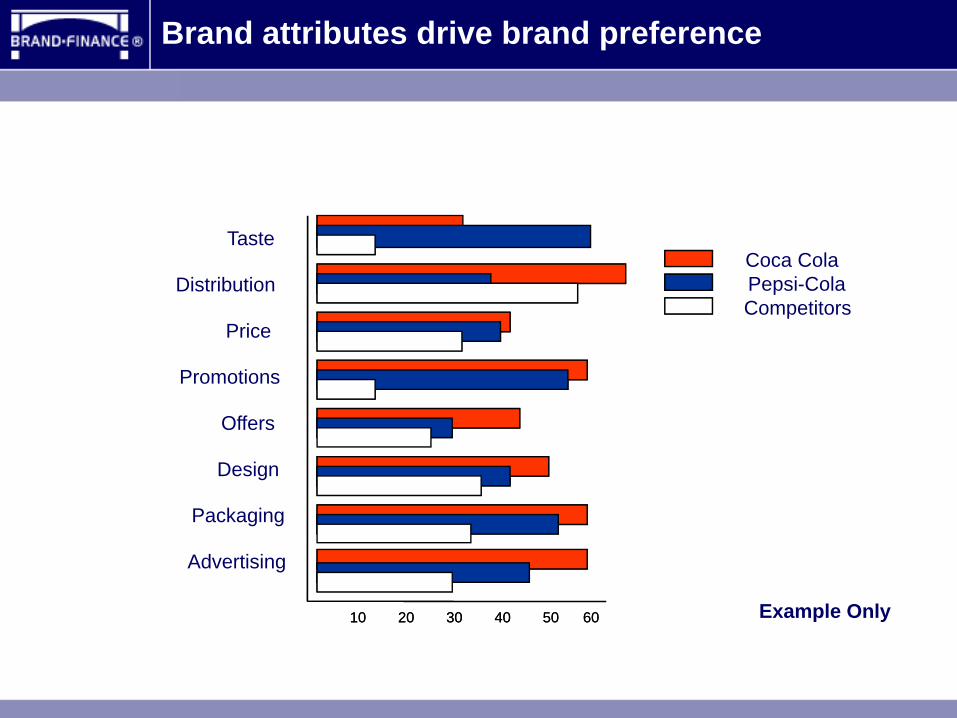
Coca Cola
10 20 30 40 50 60
Taste
Distribution
Price
Offers
Design
CompetitorsPepsi-Cola
10 20 30 40 50 60
Promotions
Packaging
Advertising
Example Only
Brand attributes drive brand preference
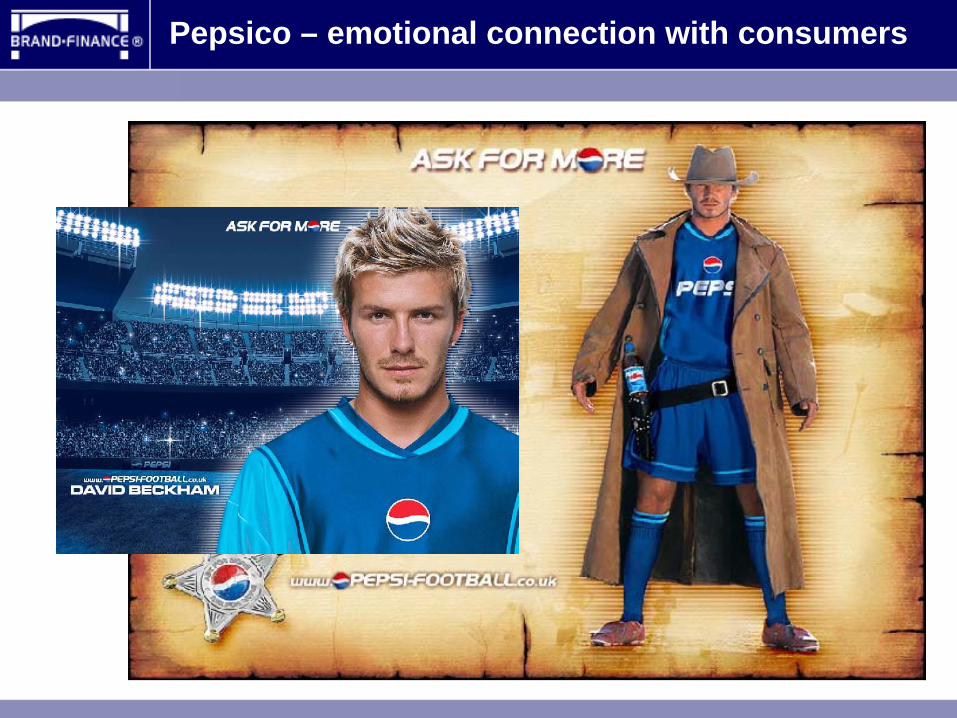
Pepsico – emotional connection with consumers
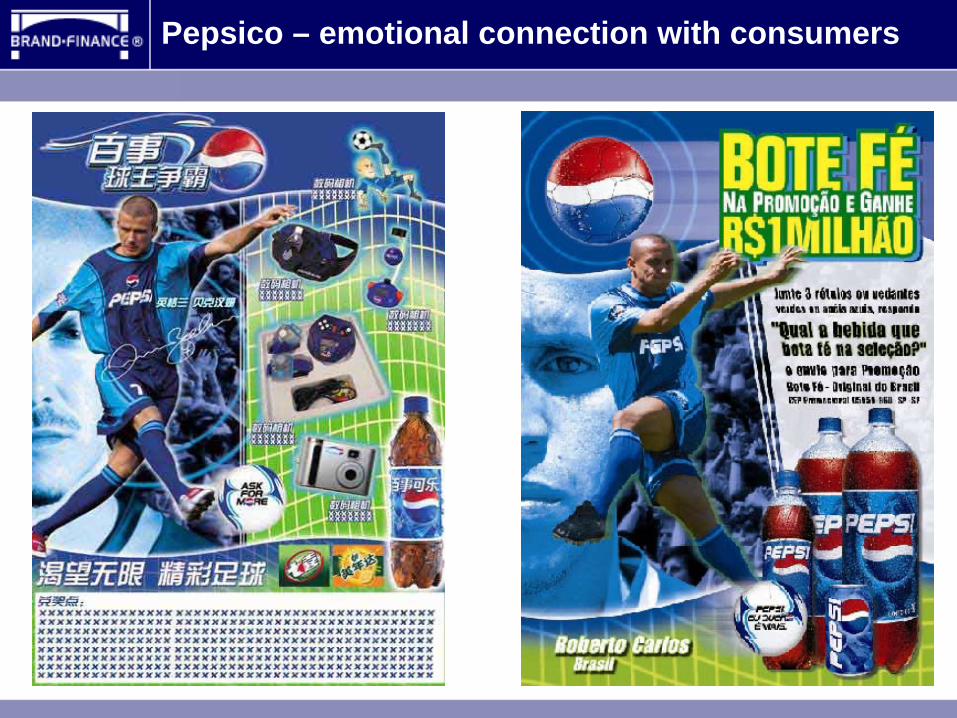
Pepsico – emotional connection with consumers


$ 2.4 B
$ 1.5 B
$ 5.9 B
$ 5.0 B
$ 3.6 B
$ 3.8 B
$ 2.4 B $ 1.5 B
$ 1.6 B
$ 1.6 B
$ 1.3 B
$ 1.3 B
$ 1.1 B
$ 1.9 B*
Source: Estimate of 2002 Global Sales at Retail
$ 14.8 B
* International only.
$ 1.0 B
Sixteen Billion $ Global Brands (2005)
Pepsico – satisfying consumer tastes

Pepsi International vs Coke International CSD Growth vs PY
Source: KO earnings releases, PI analysis
3.9% 4.1%
6.4%
10.7%
9.7%
2.4%1.7%
2.6% 2.3% 2.40%
2001 2002 2003 2004 2005
2002-2005 International Volume Growth
+9% +12% +11% +20%
Pepsico – delivering outstanding growth
5.0
5.5
6.0
6.5
7.0
7.5
8.0
8.5
9.0
Manag
emen
tProd
uctsInn
ovati
onEmplo
yees
Socia
lInv
estmen
tSo
undne
ss
Assets
Overall
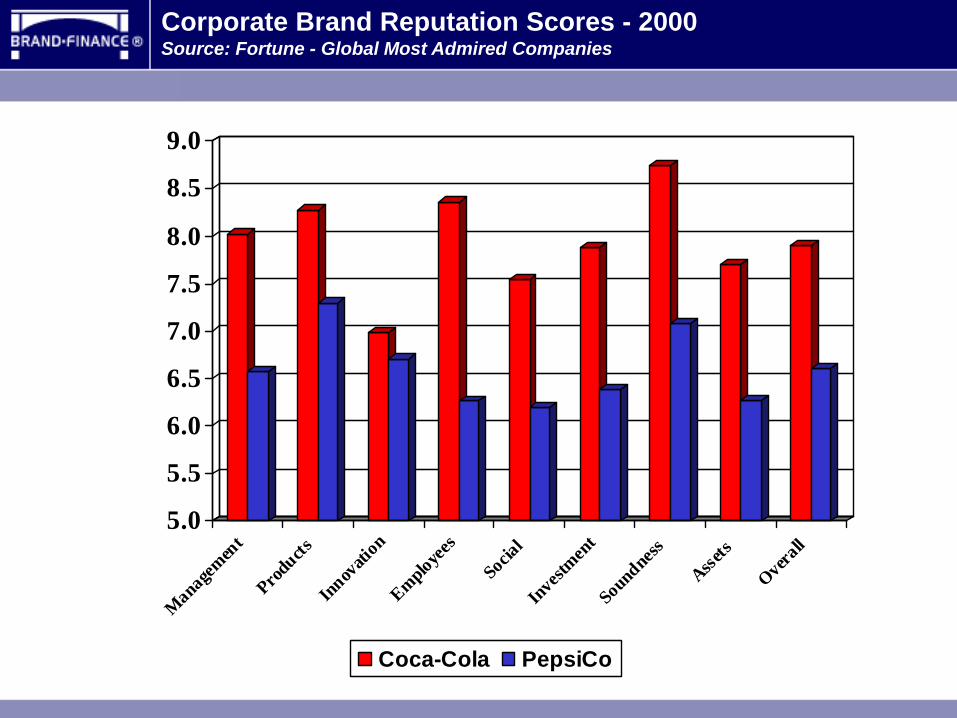
Coca-Cola PepsiCo
Corporate Brand Reputation Scores - 2000Source: Fortune - Global Most Admired Companies
5.0
5.5
6.0
6.5
7.0
7.5
8.0
Manag
emen
tProd
uctsInn
ovati
onEmplo
yees
Socia
lIn
vestm
ent
Soun
dness
Assets
Overall
Coca-Cola PepsiCo
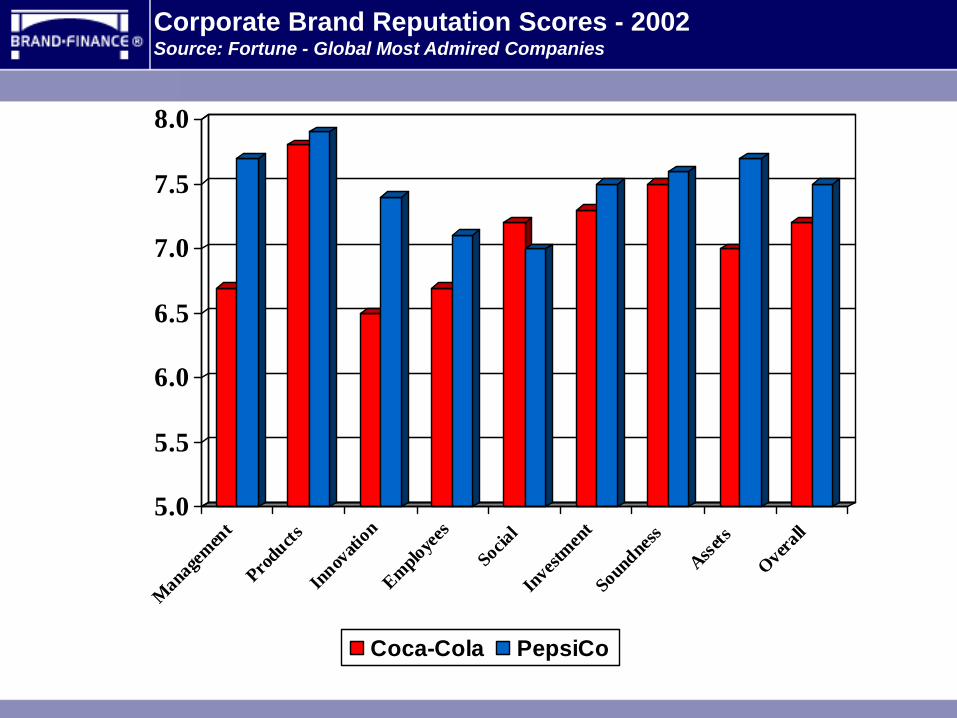
Corporate Brand Reputation Scores - 2002Source: Fortune - Global Most Admired Companies
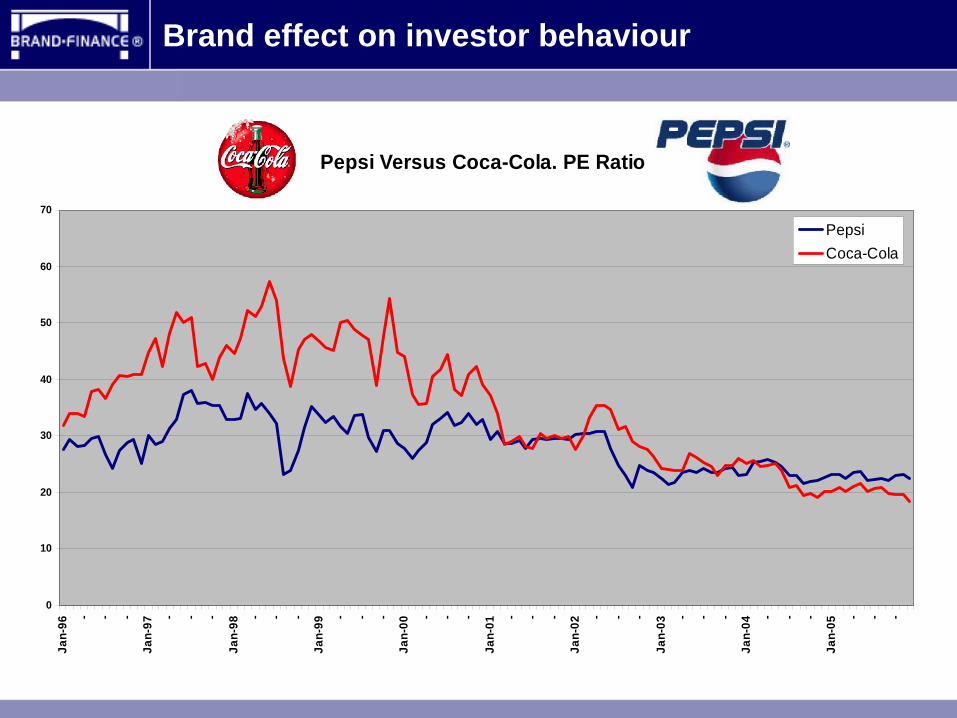
Brand effect on investor behaviour
Pepsi Versus Coca-Cola. PE Ratio
0
10
20
30
40
50
60
70
Jan-
96
- - -
Jan-
97
- - -
Jan-
98
- - -
Jan-
99
- - -
Jan-
00
- - -
Jan-
01
- - -
Jan-
02
- - -
Jan-
03
- - -
Jan-
04
- - -
Jan-
05
- - -
PepsiCoca-Cola
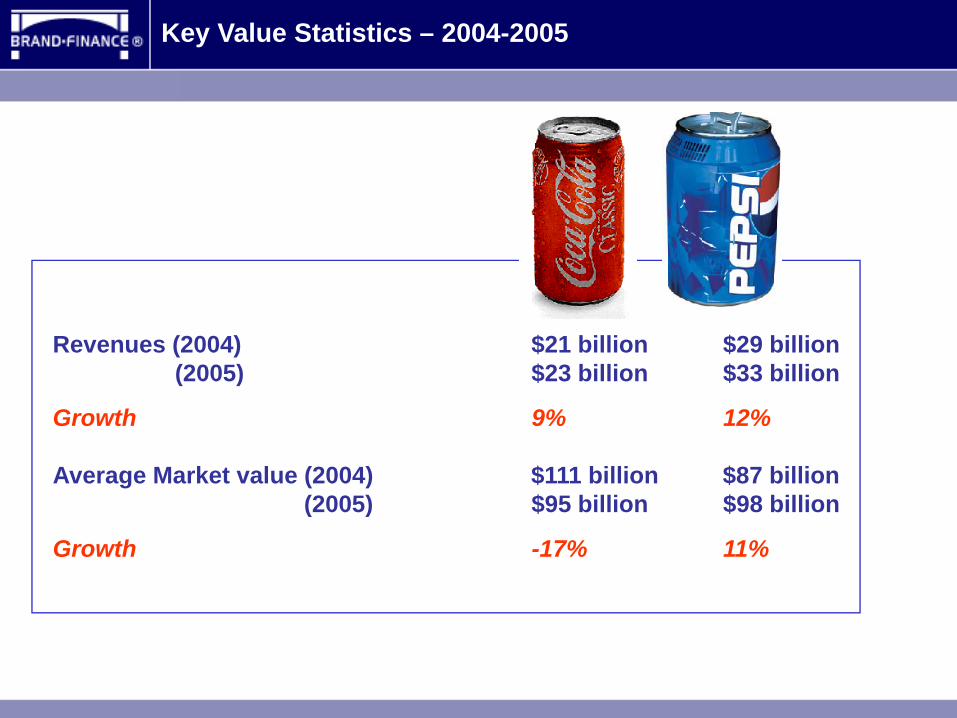
Revenues (2004) $21 billion $29 billion(2005) $23 billion $33 billion
Growth 9% 12%
Average Market value (2004) $111 billion $87 billion(2005) $95 billion $98 billion
Growth -17% 11%111
234
162
Key Value Statistics – 2004-2005
The Brand Finance Sri Lanka Top 50
‘Tracking the strongest and most valuable brands in Sri Lanka’


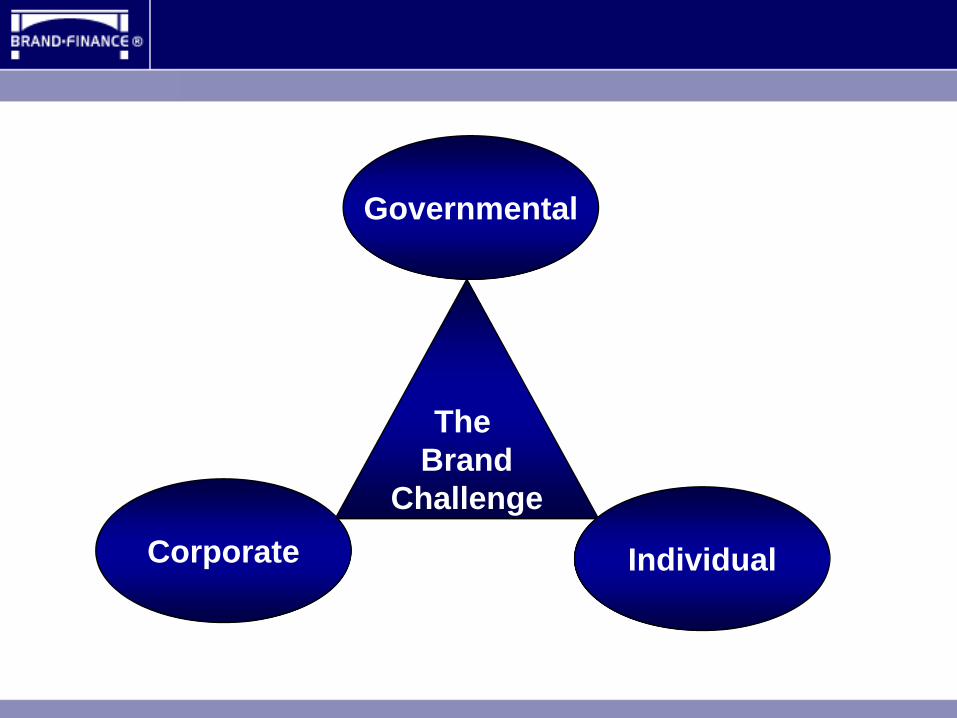
The Brand Challenge

The Brand
ChallengeCorporate Individual
Governmental

The Governmental Brand Challenge
Tourism
People
Products / Services
Investment
The four dimensions of Nation Branding(Simon Anholt, CEO GMI Index)

Governmental branding campaigns in tourism

• Geographic denomination of origin powerful ‘branding’ local products
• Consumers are willing to pay more "authentic" and of "high quality"
• ‘Protected name’ products attract a price premium of up to 20-30%. For example: Champagne, Parma Ham, Feta cheese, Patna Rice, Darjeeling Tea
• Governments are increasingly standing up for their producers
• Ethiopia versus Starbucks
Governmental branding campaigns in produce
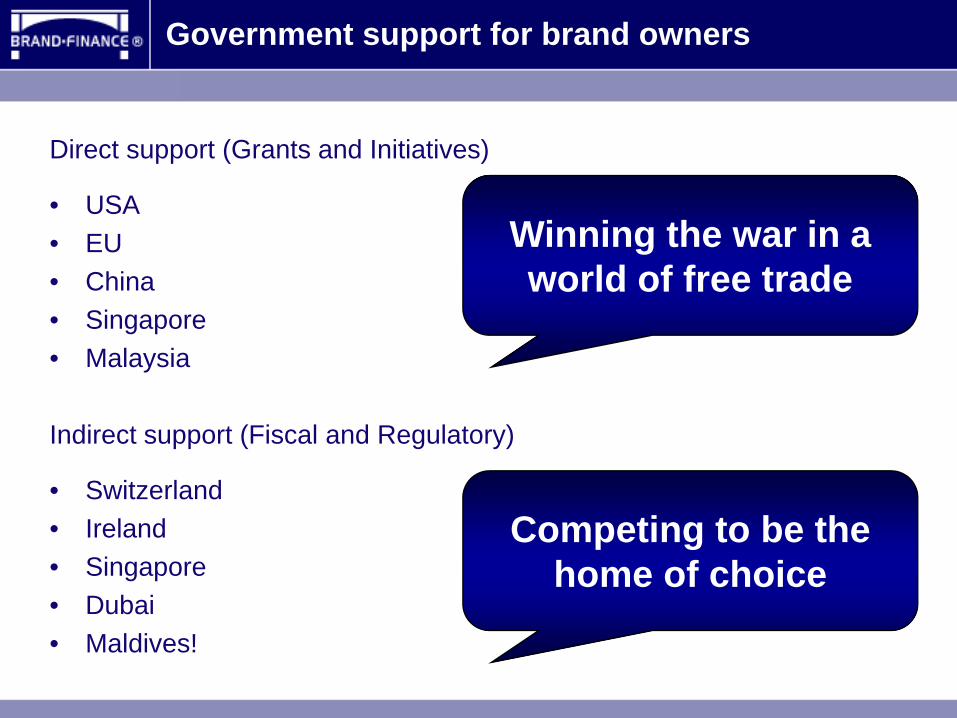
Direct support (Grants and Initiatives)
• USA• EU• China• Singapore• Malaysia
Indirect support (Fiscal and Regulatory)
• Switzerland• Ireland• Singapore• Dubai• Maldives!
Government support for brand owners
Winning the war in a world of free trade
Competing to be thehome of choice

The Brand
ChallengeCorporate Individual
Governmental
Top 10 Sri Lanka brands by value
• Dialog• DCSL• Cargills Food City• Ceylinco Insurance• SLT• Singer• Nestle• Commercial Bank• Lion• CTC
The Corporate Brand Challenge

The Corporate Brand Challenge

Vodafone global brand footprint
The Corporate Brand Challenge
The Corporate Brand Challenge
The Brand
ChallengeCorporate Individual
Governmental

Brand Equity
Financial
Staff
Customers
Brands affect all business value drivers
Suppliers
Affects AudienceBehaviour
Drives down equity and borrowing costs
Drives down staff expense andincreases efficiency
Increased acquisitionrates, volume and values
Better terms of business, and higher discounts
Increase in FinancialValue
Revenues
Direct Costs
Overheads
Cost of Capital
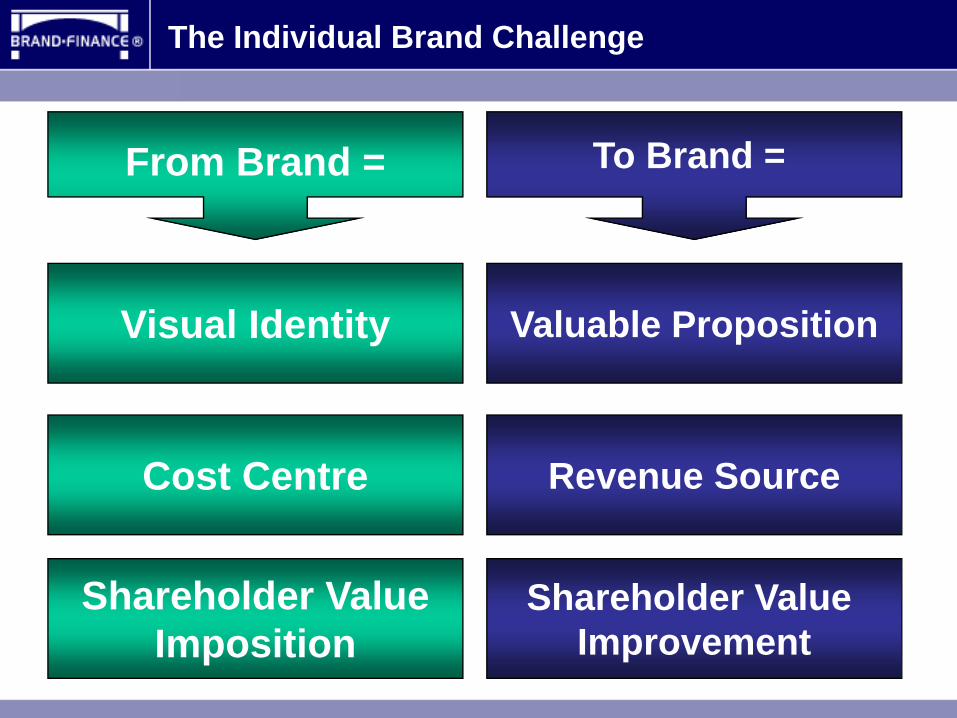
Visual Identity Valuable Proposition
Cost Centre Revenue Source
Shareholder ValueImposition
Shareholder Value Improvement
From Brand = To Brand =
The Individual Brand Challenge
Contact Details:
David HaighCEOBrand Finance plc8 Oak LaneTwickenhamTW1 3PA UK
Tel: +44 208 607 0300Fax: +44 208 607 0301