SUPER RETAIL GROUP LIMITED 20 ANNUAL 20 REPORT
75
ANNUAL REPORT 20 20 Inspiring you to live your passion SUPER RETAIL GROUP LIMITED ABN: 81 108 676 204
Transcript of SUPER RETAIL GROUP LIMITED 20 ANNUAL 20 REPORT

ANNUALREPORT
2020
Inspiring you to live your passion
S U P E R R E TA I L G R O U P L I M I T E D
ABN: 81 108 676 204
2 S U P E R R E TA I L G R O U P L I M I T E D A N N U A L R E P O R T 2020 3S U P E R R E TA I L G R O U P L I M I T E D A N N U A L R E P O R T 2020
Chair’s Message
CEO’s Message
About Us
Performance Highlights
Our Strategy
2020 Events: Testing the Strength of Super Retail Group
Our Brands
Supercheap Auto
rebel
BCF
Macpac
Board of Directors
Executive Leadership Team
Our Team
Directors’ Report
Remuneration Report (Audited)
Financial Statements
Shareholder Information
Corporate Directory and Financial Calendar
4
6
8
10
12
14
16
16
18
20
22
24
26
28
30
49
79
142
144
CONTENTS

4 S U P E R R E TA I L G R O U P L I M I T E D A N N U A L R E P O R T 2020
The 2020 financial year stands out as the most challenging in our 16 years as a public company.For our team members, customers, suppliers and the wider community, the past 12 months have been extremely testing. A prolonged drought in many parts of Australia, floods and tragic bushfires devastated many communities. The ongoing COVID-19 pandemic ignited a health and economic crisis that has changed the way we live, work and shop.
As with the broader retail sector, Super Retail Group has not been immune from the repercussions of coronavirus and its economic impact.
However, the Group’s strong fundamentals combined with the extraordinary commitment and dedication of both our team members and the executive team in working collaboratively with our partners helped the business navigate the initial crisis and deliver a resilient financial performance for the year.
The performance of the Group during this difficult period has reinforced the Board’s confidence in our strategy and demonstrated the importance of continuing to enhance our omni-retail capabilities.
A sustained focus on executing our strategy and decisive action in response to the unfolding COVID-19 crisis and material changes in consumer behaviour were crucial contributors to delivering sustainable outcomes for all of our stakeholders.
The Group’s financial position and operational performance has supported the Board’s decision to determine a fully franked final dividend of 19.5 cents per share. This represents a payout ratio of 55 per cent of underlying net profit after tax for the second half, in line with the Group’s policy.
In its deliberations on shareholder returns, the Board considered a number of factors, including its earlier decision to cancel the interim dividend, the performance of the business in the second half and the net cash position on the balance sheet following a successful equity raising in July 2020. We completed the $203 million equity raising with strong support from retail and institutional shareholders, including our founder and major shareholder Reg Rowe.
Complementing our focus on shareholder returns, the Board takes great pride in how the issues faced across Australia and New Zealand during the year unquestionably reinforce the Group’s role in the community.
Our purpose is to provide solutions and engaging experiences that inspire our customers to make the most of their leisure time.
During the year, our purpose has come to the fore for many of our customers. Our team showed immense initiative and embraced innovative practices to ensure we did everything possible to continue to meet the needs of the community. In a COVID world, with the lines increasingly blurred between work and leisure time, and growing focus on health, safety and wellbeing, the Group’s four core brands played an increasingly important role for our customers.
The indefatigable efforts of our team members in delivering for customers, suppliers and our partners reflect the Group’s purpose and are crucial to the underlying strength of the business. In his first full year in the role of Group Managing Director and Chief Executive Officer, Anthony Heraghty ensured his executive team remain focused on optimising our capabilities and driving team member engagement during this extraordinary period.
DEAR SHAREHOLDER
Chair’s Message
5S U P E R R E TA I L G R O U P L I M I T E D A N N U A L R E P O R T 2020
In line with good governance and our Board succession planning, during the year we welcomed to the Board two highly credentialled directors, Annabelle Chaplain AM and Gary Dunne. After a career in investment banking with global financial institutions, Annabelle has diverse board experience with a range of ASX-listed companies while Gary brings to the board more than 25 years’ experience in operations and strategy with Coles, ALDI and Woolworths.
On behalf of the Board, I would also like to thank Launa Inman, who retired as a director in October 2019, for her many contributions as a committed and engaged director during her four-year tenure.
I thank my Board colleagues for their commitment to the Group and sound counsel over the tumultuous past 12 months. The decisions taken by the Board leave the Group in a stronger position and well placed to create shareholder value over the long term.
Looking ahead, there is no question we will continue to face fresh challenges in a period marked by ongoing volatility and uncertainty
but the Group has a track record of not only surviving but thriving in tough conditions.
With a strong balance sheet and no net debt, we are ideally placed to deliver on our omni-retail strategy, enhance our footprint and capitalise on organic opportunities to grow market share as we pursue long-term value for our shareholders. Despite the immense challenges, we have not been distracted from this task.
Thank you for your continuing support of Super Retail Group.
Sally Pitkin Chair
6 S U P E R R E TA I L G R O U P L I M I T E D A N N U A L R E P O R T 2020
CEO’s Message
The past 12 months will be remembered as a year like no other for Super Retail Group. As outlined by the Chair, natural disasters and the COVID-19 pandemic have tested the limits of your company’s resilience.I am pleased to report, however, that thanks to the remarkable efforts of the Super Retail Group team and the flexibility of our omni-retail strategy we weathered these crises by adapting quickly to the volatile operating environment.
As the COVID-19 crisis began to unfold in February 2020, our primary focus remained the health, safety and wellbeing of our team members and customers. We strictly adhered to the advice and guidance of governments and health authorities across Australian and New Zealand while striving to remain open for business where possible. Continuing to operate helped support our team members with meaningful employment and provided our loyal customers with the essential products they need.
This approach played a fundamental role in shaping Super Retail Group’s performance for FY20.
Despite some of the toughest operating conditions ever faced by the retail sector, the Group delivered a strong trading outcome. The parallel efforts of keeping stores open where possible during COVID-19 lockdowns, while successfully pivoting to meet increased demand in our online sales channels bolstered the Group’s financial results.
STRONG FINANCIAL PERFORMANCEGiven the context for FY20, we were very pleased with the Group’s financial performance. Our omni-retail strategy has provided flexibility for our businesses to adapt quickly to the wholesale changes in customer behaviour triggered by the COVID-19 restrictions. Key features of the full year financial performance for the 52 weeks to 27 June 2020 included:
• Total Group sales of $2.83 billion, an increase of 4.2 per cent on the previous comparative period (pcp)
• Online sales of $290.5 million, an increase of 44.4 per cent on pcp
• Group like-for-like sales growth of 3.6 per cent
• Group segment earnings before interest, tax, depreciation and amortization (EBITDA) of $328.1 million, an increase of 4.3 per cent on pcp
• Group segment earnings before interest and tax (EBIT) of $236.1 million, an increase of 3.5 per cent on pcp
• Normalised net profit after tax (NPAT) of $154.1 million, an increase of 1 per cent on pcp.
FOUR POWERFUL BRANDS
Our four core brands maintain leading positions in attractive and growing lifestyle categories.
In FY20, Supercheap Auto, rebel and BCF recorded sales growth, with Macpac recording a decline largely due to Australia’s summer bushfires and COVID-19 affecting Easter trading.
ONLINE SALES MEETING CUSTOMER DEMANDThe channel shift to online accelerated dramatically in the second half of the past year as COVID-19 restrictions prevented many customers from accessing our stores.
Group online sales increased by 44 per cent to $291 million, representing 10 per cent of Group sales. Click & Collect, which leverages the strength of our 697 stores, represented 43 per cent of Group online sales.
DEAR SHAREHOLDER
FY20 sales ($m)
Sales growth
Like-for-like sales growth
Online sales growth
Supercheap Auto 1,119.7 7.6% 6.3% 37%
rebel 1,038.6 3.3%(1) 2.7%(1) 49%
BCF 535.0 4.0% 3.0% 33%
Macpac 131.9 (5.0%) (9.1%) 83%(1) Excluding Infinite Retail business which has been permanently discontinued. Total rebel sales growth
including Infinite Retail was 2.2%
7S U P E R R E TA I L G R O U P L I M I T E D A N N U A L R E P O R T 2020
In responding to coronavirus restrictions, the Group successfully re-allocated store-based resources to supporting our online business, rapidly introducing contact-free Click & Collect across all four brands and replacing catalogue campaigns with digital advertising.
More than one million customers made their first online purchase with the Group during the year.
OUR STRATEGY IS ON TRACKOur corporate strategy helped guide the Group though this period.
The Group’s strategic focus remains on:
Growing the four core brands: focusing on our four core brands, key categories and leveraging scale.
Leveraging closeness to our customer: building a personalised relationship with our customers, leveraging data and insights.
Connecting our omni-retail supply chain: continuing to build a fit-for-purpose integrated supply chain.
Simplifying the business: becoming a more efficient and effective omni-retailer through optimising overheads and focusing on customer-facing investment
Excelling in omni-retail: enhancing our customer experience through all touchpoints along the customer journey.
We are well positioned to benefit from consumer trends emerging from the COVID-19 pandemic, including an even greater channel shift to online, uptake in DIY auto repairs and household projects, increased focus on personal health and wellbeing, and greater demand for domestic travel and outdoor leisure activities.
CUSTOMER LOYALTY IS KEYOur large, growing and loyal customer base continues to underpin our performance and provides us with a competitive advantage.
We now have 6.6 million active club members across our four core brands and, together, these club members contributed 59 per cent of total sales.
The Group’s active membership base has grown almost five times faster than store numbers over the past four years. Scalable growth is critical to our success and our ability to expand the Group’s customer base multiple times faster than our physical store network reinforces our conviction in an omni-retail business strategy.
Pleasingly, during a period of accelerated online sales growth characterised by concentrated demand for specific products, customer satisfaction levels have improved with average club member NPS increasing to 60.7.
AN ENGAGED AND CAPABLE TEAM In such a challenging year, our capable and passionate team members have been more important to the business than ever before. They met every challenge thrown at them and thrived. On behalf of the executive team, I offer my sincere gratitude for their dedication and commitment. In recognition of their extraordinary efforts, the Group made the decision to reward our permanent frontline team members with a one-off payment of between $250 and $1,000.
To support team members in our stores, offices and distribution centres, we implemented a sweeping series of measures to protect our team from COVID-19. This included new protocols around personal hygiene, physical distancing, incident responses, corporate travel and enhanced facilities cleaning.
Our team member safety performance continues to improve. Our focus on safety reporting, early intervention, incident investigations, line accountability and initiatives such as the ‘back of house’ rest program delivered improved injury rates. We achieved a Total Recordable Injury Frequency Rate (TRIFR) of 10.58 in FY20, a 25 per cent reduction on the previous year.
In February 2020, Super Retail Group was awarded the Workplace Gender Equality Agency’s (WGEA) Employer of Choice for Gender Equality citation. This is a significant achievement. We were the first retail organisation to achieve this citation under the Agency’s new criteria.
Acknowledgement from the WGEA is the culmination of sustained commitment to a diverse and inclusive workforce and confirmation of the progress we are making towards gender equality. We know the task is far from complete however and continue to explore ways to improve.
Female representation on our Board is at 38 per cent, 27 per cent at the executive leadership level and 39 per cent for women in senior leadership. A previously-set target of 40 per cent female representation at Board and senior leadership levels by 2020 was disappointingly missed, indicating where some of our priorities sit in the period ahead.
We are also methodically resolving the underpayment issues identified and proactively reported to the Fair Work Ombudsman. In FY20, 6,478 individual investigations were completed with $27 million, including interest and superannuation, paid to 2,490 former and current team members. As at the end of FY20, this brought the total amount paid to $31.5 million, including interest and superannuation, to 3,458 team members. We expect to conclude the remediation program, including all relevant back payments, in FY21.
A SUSTAINABLE FUTUREIn FY20, we continued to make progress towards adopting a sustainable approach to our business operations.
We completed energy efficiency upgrades for 62 stores and our recycling rate increased by 2 per cent to 65 per cent.
Our brands continue to support our sustainability journey: SCA recycled more than 1.3 million litres of oil and 79,000 car batteries (returned to stores by customers); rebel started an in-store sports shoe recycling initiative and continued to champion women’s sport; BCF contributed $280,000 to OzFish with a further $250,000 raised by customers; and Macpac completed their move to Fairtrade certified cotton for its T-shirt production.
Super Retail Group has the right strategy in place to create long-term value for our shareholders and a dedicated team committed to ensuring continued success.
Despite ongoing challenges around COVID-19, the Group is in a strong position to inspire our customers to live their passion, grow our market share and create value for our shareholders.
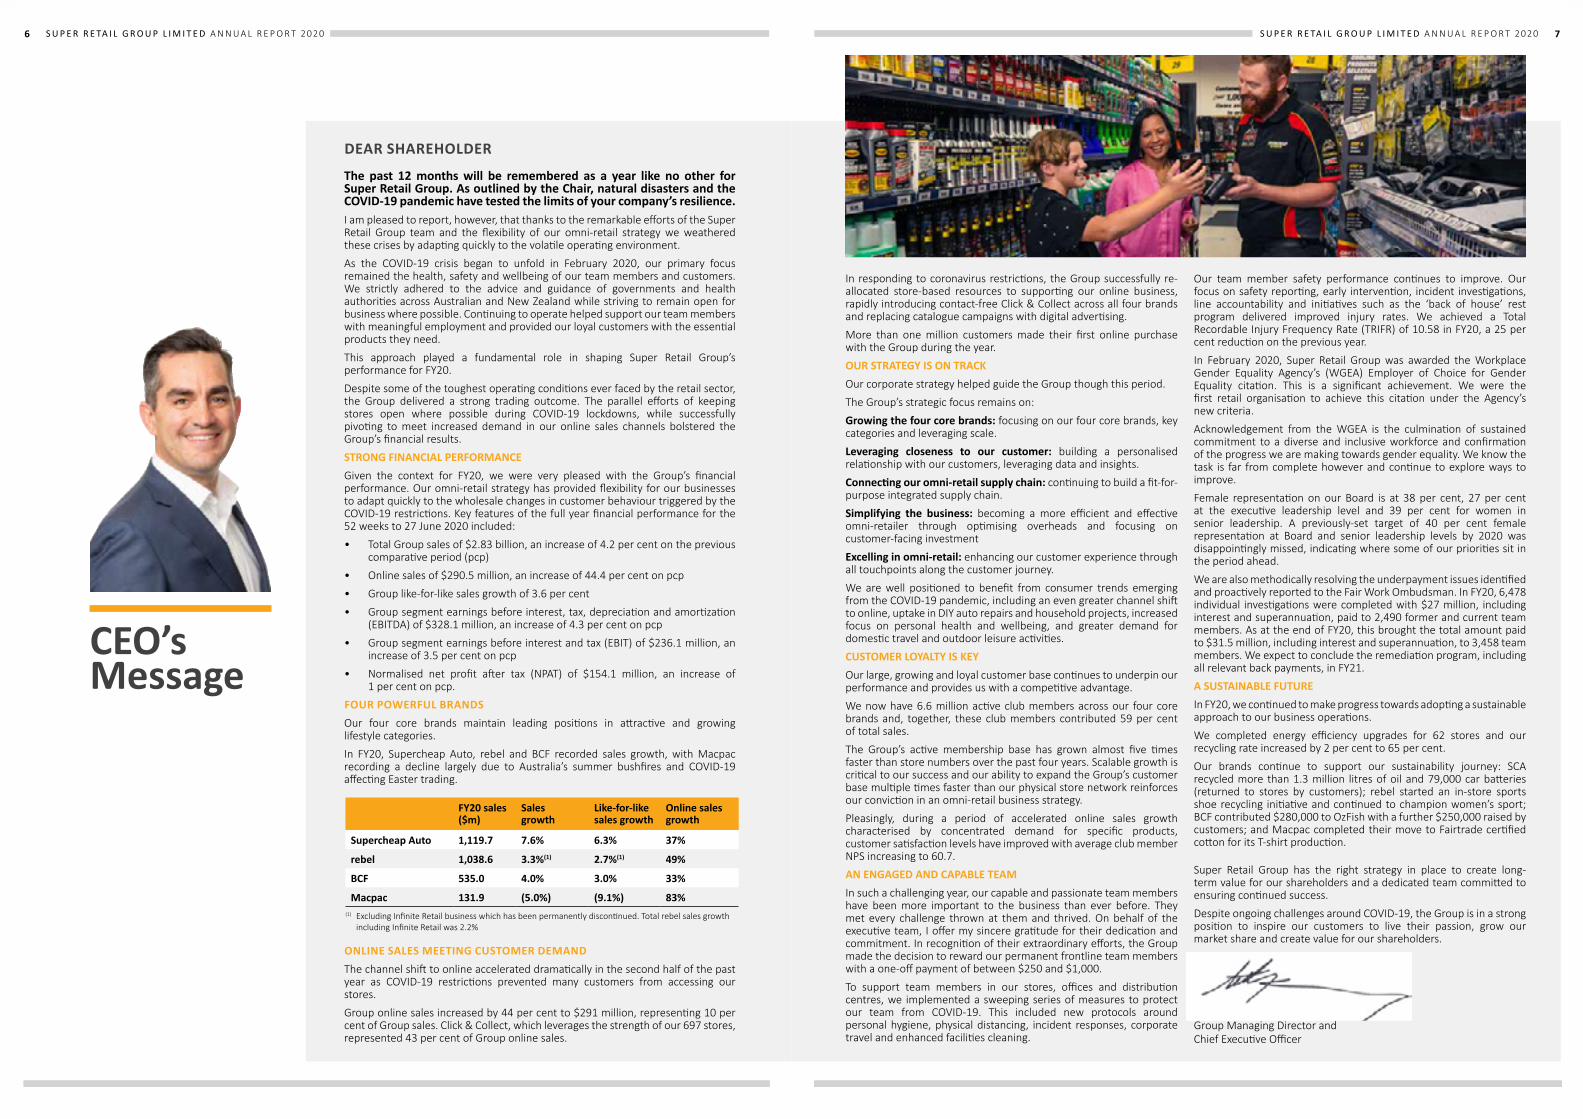
Anthony Heraghty Group Managing Director and Chief Executive Officer

8 S U P E R R E TA I L G R O U P L I M I T E D A N N U A L R E P O R T 2020
ABOUT US
OUR PURPOSE
To inspire our customers to live their leisure passions – whether that’s proudly looking after their car, running a marathon, catching a ‘barra’ or reaching a mountain summit.
CORPORATE GOVERNANCE
Super Retail Group is committed to sound corporate governance standards that protect and enhance the long-term performance of the Group, taking into account the interests of our stakeholders.
The Group has fully followed the recommendations of the ASX Corporate Governance Council’s Principles and Recommendations (3rd Edition) throughout the reporting period. Further details are set out in the Group’s Appendix 4G and Corporate Governance Statement, authorised for issue by the Directors on 3 September 2020, which are available on the Australian Securities Exchange (ASX) website at www.asx.com.au and the Group’s website at: https://www.superretailgroup.com.au/investors-and-media/corporate-governance/
ABOUT THIS REPORT
These financial statements are the consolidated financial statements of the consolidated entity consisting of Super Retail Group Limited and its subsidiaries. The financial report is presented in Australian dollars. Super Retail Group Limited is a company limited by shares, incorporated and domiciled in Australia. Its principal registered office and principal place of business is 6 Coulthards Avenue, Strathpine, Queensland, 4500. A description of the nature of the consolidated entity’s operations and its principal activities is included in the Directors’ Report and Remuneration Report on pages 30 to 78. The financial report was authorised for issue by the Directors on 24 August 2020. The Directors have the power to amend and reissue the financial report. Through the use of the internet, we have ensured that our corporate reporting is timely, complete, and available globally at minimum cost to the Company. All press releases, financial reports and other information are available on our Investors and Media page on our website: https://www.superretailgroup.com.au/investors-and-media/
Super Retail Group (ASX: SUL) is the proud owner of four iconic brands: Supercheap Auto, rebel, BCF and Macpac, and is one of Australia and New Zealand’s largest retailers.
Our powerful brands have established, leading positions in growing high-involvement lifestyle categories of auto, sports and outdoor leisure. We provide our customers and highly engaged 6.6 million active loyalty club members with the option to experience our brands whenever and however they choose – whether that’s through our network of 697 stores or via our digital capabilities, which we continue to enhance.
13,000TEAM MEMBERS
697STORES
4SUPPORT OFFICES
7DISTRIBUTION CENTRES
3COUNTRIES OF OPERATIONAustralia, New Zealand and China
9S U P E R R E TA I L G R O U P L I M I T E D A N N U A L R E P O R T 2020
Supercheap Auto is Australia and New Zealand’s largest specialty automotive parts and accessories retail business.
We leverage our market leadership to provide a wide range of tools and
accessories for the DIY home handyman, as well as products for travel, touring,
outdoors, garage and the shed.
rebel helps our customers dream big. We are Australia’s leading sporting goods specialist retailer, bringing the best of global brands direct to our customers. We inspire all Australians to live their sporting passion, by providing the right service, right advice, right brands and right products to help them ‘start right’ and chase their dreams.
BCF is a leading outdoor retailer in the country, with stores in every Australian state and territory. With expert knowledge and service, we provide everything you could possibly need for your next boating, camping or fishing adventure, all under the one roof.
Macpac has designed apparel and equipment that has inspired a life outdoors since 1973. Designed, tested and proven in the ultimate outdoor test lab – New Zealand – Macpac’s
wide range of products are made by adventurers for adventurers.
OUR VALUES
PASSION INTEGRITY CAREOPENNESS DISCIPLINE
Our culture is underpinned by five values that guide the way we operate and behave.
OUR BRANDS

10 S U P E R R E TA I L G R O U P L I M I T E D A N N U A L R E P O R T 2020
$2.83bGROUP SALES UP 4.2%
PERFORMANCE HIGHLIGHTS
$328.1mSEGMENT EBITDA
UP 4.3%
$236.1mSEGMENT EBIT
UP 3.5%
$154.1mNORMALISED NET PROFIT AFTER TAX
19.5¢
PER SHARE, FULLY FRANKED
SALES
EARNINGS PROFIT
GROUP LFL SALES GROWTH
3.6%
$203m
EQUITY RAISING COMPLETED IN JULY
BALANCE SHEET DIVIDEND
11S U P E R R E TA I L G R O U P L I M I T E D A N N U A L R E P O R T 2020
37%SUPERCHEAP AUTO
33%BCF
49%REBEL
83%MACPAC
46%
HOME DELIVERY SALES GROWTH %
59%
ACTIVE CLUB MEMBER % OF GROUP SALES
>1m
NEW ONLINE CUSTOMERS
60.7
AVERAGE CUSTOMER NPS
41%
CLICK & COLLECT SALES GROWTH %
6.6m
ACTIVE CLUB MEMBERS
43%
CLICK & COLLECT % OF TOTAL ONLINE SALES
57%
HOME DELIVERY % OF TOTAL ONLINE SALES
44%TOTAL GROUP ONLINE SALES GROWTH %
% OF TOTAL SALES
4%
HOME DELIVERY
CLICK & COLLECT
CUSTOMER LOYALTY AND OMNI-RETAIL EXECUTION
6%
CHANNEL
ONLINE SALES GROWTH
CUSTOMER LOYALTY
90% IN-STORE SALES

12 S U P E R R E TA I L G R O U P L I M I T E D A N N U A L R E P O R T 2020
OUR STRATEGY
GROWING ANNUAL CUSTOMER VALUE
BEING AN EFFICIENT OMNI-RETAILER
0102
03
0405
PRIMAR
Y VA
LUE
LEVE
RS
Image 1: Introduced Macpac range in BCF stores
Image 2: Improving conversion with Salesforce Einstein analytics and personalised product experiences
Image 3: Distribution centre optimisation, including rebel consolidation and Macpac Australia
Image 4: Accelerated migration to cloud-based solutions
Image 5: Digital investment enabled significant online growth during the height of COVID-19
ENSURING ORGANIC GROWTH AND CAPITAL
DISCIPLINE
13S U P E R R E TA I L G R O U P L I M I T E D A N N U A L R E P O R T 2020
FOCUS AREAS• Align capital investment to grow our four
core brands• Develop organic brand strategies,
leveraging consolidated competitive advantage
• Refresh private brand strategy
FY20 OUTCOMES• New concept rebel Doncaster store• Five-year organic brand strategies in train• Relationships with global partners
strengthened• Private brand review commenced• Introduced Macpac range in BCF stores
GROW THE FOUR CORE BRANDS: Focus on four core brands, key categories and leveraging scale.
FOCUS AREAS• Deepen understanding of the customer
through more sophisticated analytics and insights
• Develop structured customer relationship management (CRM) program to drive visitation and transaction growth
• Align marketing, merchandising and pricing strategies to customer
FY20 OUTCOMES• Campaign activity that’s built from
customer behavioural analytics and insights
• Investment in analytical insight and customer strategy leadership
• Execution of pricing strategy delivering positive results
LEVERAGE CLOSENESS TO OUR CUSTOMER: Building a personalised relationship with our customers, capitalising on data and insights.
FOCUS AREAS• Optimise Australian and New Zealand
distribution centre networks, planning and product flows
• Orchestration of customer online orders• Maximise benefits of group sourcing
capability
FY20 OUTCOMES• Five-year supply chain strategy in train• Order Management System (OMS), phase
one, implementation complete• Overseas sourcing project implementation
in progress
CONNECTED OMNI-RETAIL SUPPLY CHAIN: Continuing to build a fit-for-purpose integrated supply chain.
FOCUS AREAS• Remove duplication and leverage scale• KPI alignment and value mindset• Modernise technology infrastructure to
be fit for purpose
SIMPLIFY THE BUSINESS: Becoming a more efficient and effective omni-retailer through optimising overhead and focusing on customer-facing investment.
STRATEGIC DRIVERS
FOCUS AREAS• Build expertise for our customer-facing
teams, underpinned by team members as industry experts
• Deliver a seamless ‘Super Retailer’ experience
• Evolve the store experience
FY20 OUTCOMES• Improved conversion rates across all
brands• Introduced Click & Collect in all Macpac
Australian stores• Click & Collect rollout complete
across NZ; contact-free Click & Collect implemented across all stand-alone Australian stores
• Key range and assortment alignment to customer need commenced
EXCEL IN OMNI-RETAIL: Enhancing our customer experience through all touchpoints along the customer journey.
FY20 OUTCOMES• Workforce planning program commenced• Senior Leadership Team KPIs aligned to
Group strategy• Team engagement and communication
tools in place • Information Services’ five-year strategy
implementation commenced• Closed Infinite Retail and Autocrew
Online sales to total sales
2H19
1H20
2H20
7.6%
8.8%
11.9%
7.4%1H19
14 S U P E R R E TA I L G R O U P L I M I T E D A N N U A L R E P O R T 2020
2020 events: testing the strength of Super Retail Group
Two significant events in 2020 tested the strength of Super Retail Group. The devastating summer bushfire season and the global impact of the coronavirus brought unique challenges and required both strategic and compassionate responses.
Against the ongoing backdrop of drought in rural and regional Australia, these events showed how our four core brands support the communities in which they operate; in both the good times as well as times of greatest need.
They also reinforced our source of advantage – engaged team, loyal customers and powerful brands – as the features underpinning the strength of our response in crisis, as well as our ability to quickly recover.
SUPPORTING THE COMMUNITIES IN WHICH WE OPERATE
It was a tough start to the new year for many Australians. Major bushfires resulted in loss of life, property and razed millions of hectares.
As an employer operating in many of those fire-ravaged communities, we sought to help our loyal customers, team members and their communities.
Super Retail Group contributed $250,000 to the Red Cross Disaster Relief and Recovery program to help deal with the aftermath of the summer’s disastrous bushfires.
In addition to the financial contribution, we offered paid leave to our permanent team members who were active volunteer firefighters so they could continue their efforts to contain the fires throughout the summer. We will never be able to match the generosity of spirit of the volunteer firefighters in our team, but we wanted to ensure they did not suffer financially for battling the fires on our behalf.
Across our support offices and stores, a further $159,000 was raised for the Red Cross, WIRES, BlazeAid, Wildlife Victoria and the NSW Rural Fire Service from local fundraising activities and a point-of-sale ‘round up’ initiative.
Above all, we thank the firefighters, Australian Defence Force personnel, Police, State Emergency Services and other agencies that were involved in fighting the fires. It was at the worst of times that we saw the best in people.
TO RED CROSS
UNLIMITED PAID LEAVE FOR VOLUNTEER FIREFIGHTERS
LOCAL FUNDRAISING
$250,000
$159,000
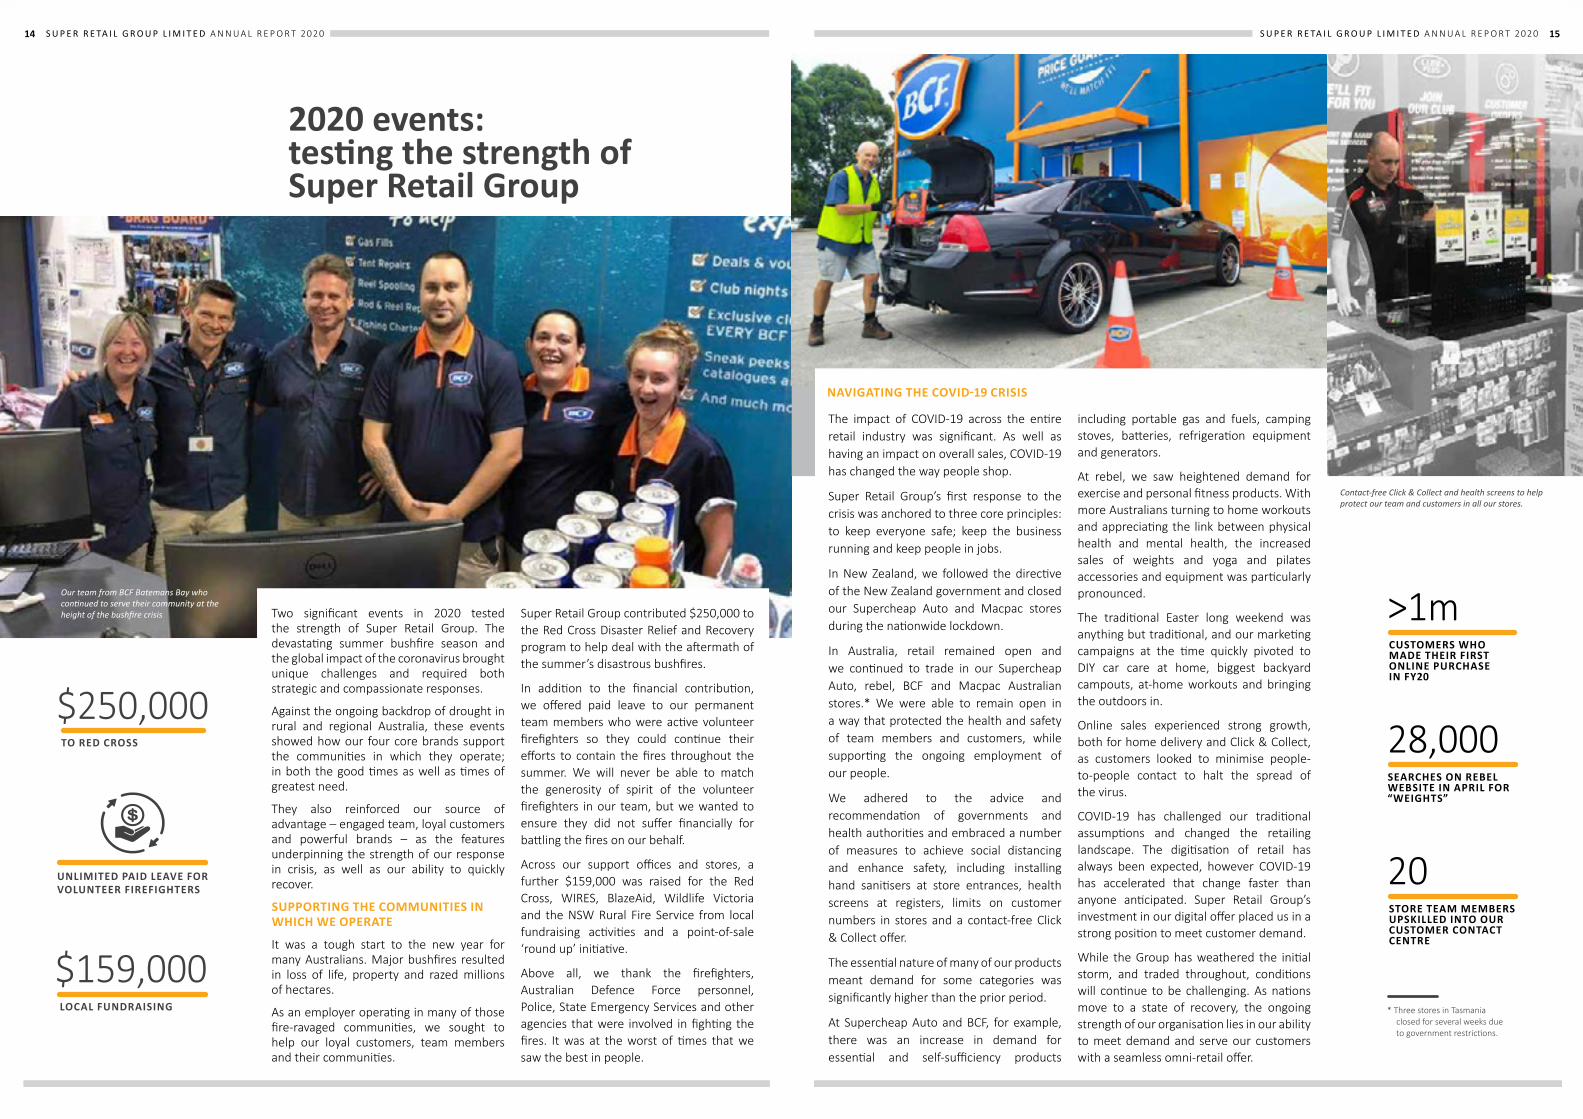
Our team from BCF Batemans Bay who continued to serve their community at the height of the bushfire crisis
15S U P E R R E TA I L G R O U P L I M I T E D A N N U A L R E P O R T 2020
The impact of COVID-19 across the entire retail industry was significant. As well as having an impact on overall sales, COVID-19 has changed the way people shop.
Super Retail Group’s first response to the crisis was anchored to three core principles: to keep everyone safe; keep the business running and keep people in jobs.
In New Zealand, we followed the directive of the New Zealand government and closed our Supercheap Auto and Macpac stores during the nationwide lockdown.
In Australia, retail remained open and we continued to trade in our Supercheap Auto, rebel, BCF and Macpac Australian stores.* We were able to remain open in a way that protected the health and safety of team members and customers, while supporting the ongoing employment of our people.
We adhered to the advice and recommendation of governments and health authorities and embraced a number of measures to achieve social distancing and enhance safety, including installing hand sanitisers at store entrances, health screens at registers, limits on customer numbers in stores and a contact-free Click & Collect offer.
The essential nature of many of our products meant demand for some categories was significantly higher than the prior period.
At Supercheap Auto and BCF, for example, there was an increase in demand for essential and self-sufficiency products
including portable gas and fuels, camping stoves, batteries, refrigeration equipment and generators.
At rebel, we saw heightened demand for exercise and personal fitness products. With more Australians turning to home workouts and appreciating the link between physical health and mental health, the increased sales of weights and yoga and pilates accessories and equipment was particularly pronounced.
The traditional Easter long weekend was anything but traditional, and our marketing campaigns at the time quickly pivoted to DIY car care at home, biggest backyard campouts, at-home workouts and bringing the outdoors in.
Online sales experienced strong growth, both for home delivery and Click & Collect, as customers looked to minimise people-to-people contact to halt the spread of the virus.
COVID-19 has challenged our traditional assumptions and changed the retailing landscape. The digitisation of retail has always been expected, however COVID-19 has accelerated that change faster than anyone anticipated. Super Retail Group’s investment in our digital offer placed us in a strong position to meet customer demand.
While the Group has weathered the initial storm, and traded throughout, conditions will continue to be challenging. As nations move to a state of recovery, the ongoing strength of our organisation lies in our ability to meet demand and serve our customers with a seamless omni-retail offer.
NAVIGATING THE COVID-19 CRISIS
CUSTOMERS WHO MADE THEIR FIRST ONLINE PURCHASE IN FY20
SEARCHES ON REBEL WEBSITE IN APRIL FOR “WEIGHTS”
STORE TEAM MEMBERS UPSKILLED INTO OUR CUSTOMER CONTACT CENTRE
>1m
28,000
20
Contact-free Click & Collect and health screens to help protect our team and customers in all our stores.
* Three stores in Tasmania closed for several weeks due to government restrictions.
16 S U P E R R E TA I L G R O U P L I M I T E D A N N U A L R E P O R T 2020
‘My Garage’: helping car enthusiasts find the right car parts
At Supercheap Auto, delivering a personalised experience for our loyal 1.71 million Club Plus members is critical. Leveraging technology to help car enthusiasts shop for the right car parts and accessories to suit their vehicle, with greater confidence, is one way the Supercheap Auto team is tailoring that shopping experience for our customers.
Recalling a specific car model can be a challenge for many customers, however this information is an essential first-step when shopping for car parts.
To help solve this challenge, Supercheap Auto launched ‘My Garage’, an online self-service and in-store technology solution that allows customers to save the details of five vehicles to their Club Plus membership or Trade account and search a database of 39,000 vehicles for specific parts and accessories.
The process integrates into a seamless shopping experience by allowing customers shopping online to quickly identify their car model through their vehicle registration number. Once they have entered their registration number into My Garage, a large
range of car parts and accessories specific to their car model is displayed.
To access the information in store, our team scans the customer’s Club Plus membership card (or finds their membership via their phone number or email), which brings up the vehicles saved in their garage. Our store team can then help members find the right parts and accessories specific to their car model.
Having this technology capability both online and in store enables us to better support customer needs, provides expert advice on the right products for the vehicles and ensures customers leave with the products they need.
Since launching My Garage, the details of more than 550,000 vehicles have been stored and more than 4.8 million registration searches have been conducted. In turn, this improves conversion (customers are more than twice as likely to purchase a product if using the My Garage registration search) and improves the shopping experience by reducing the likelihood of the customer having to return for an alternative product.
17S U P E R R E TA I L G R O U P L I M I T E D A N N U A L R E P O R T 2020
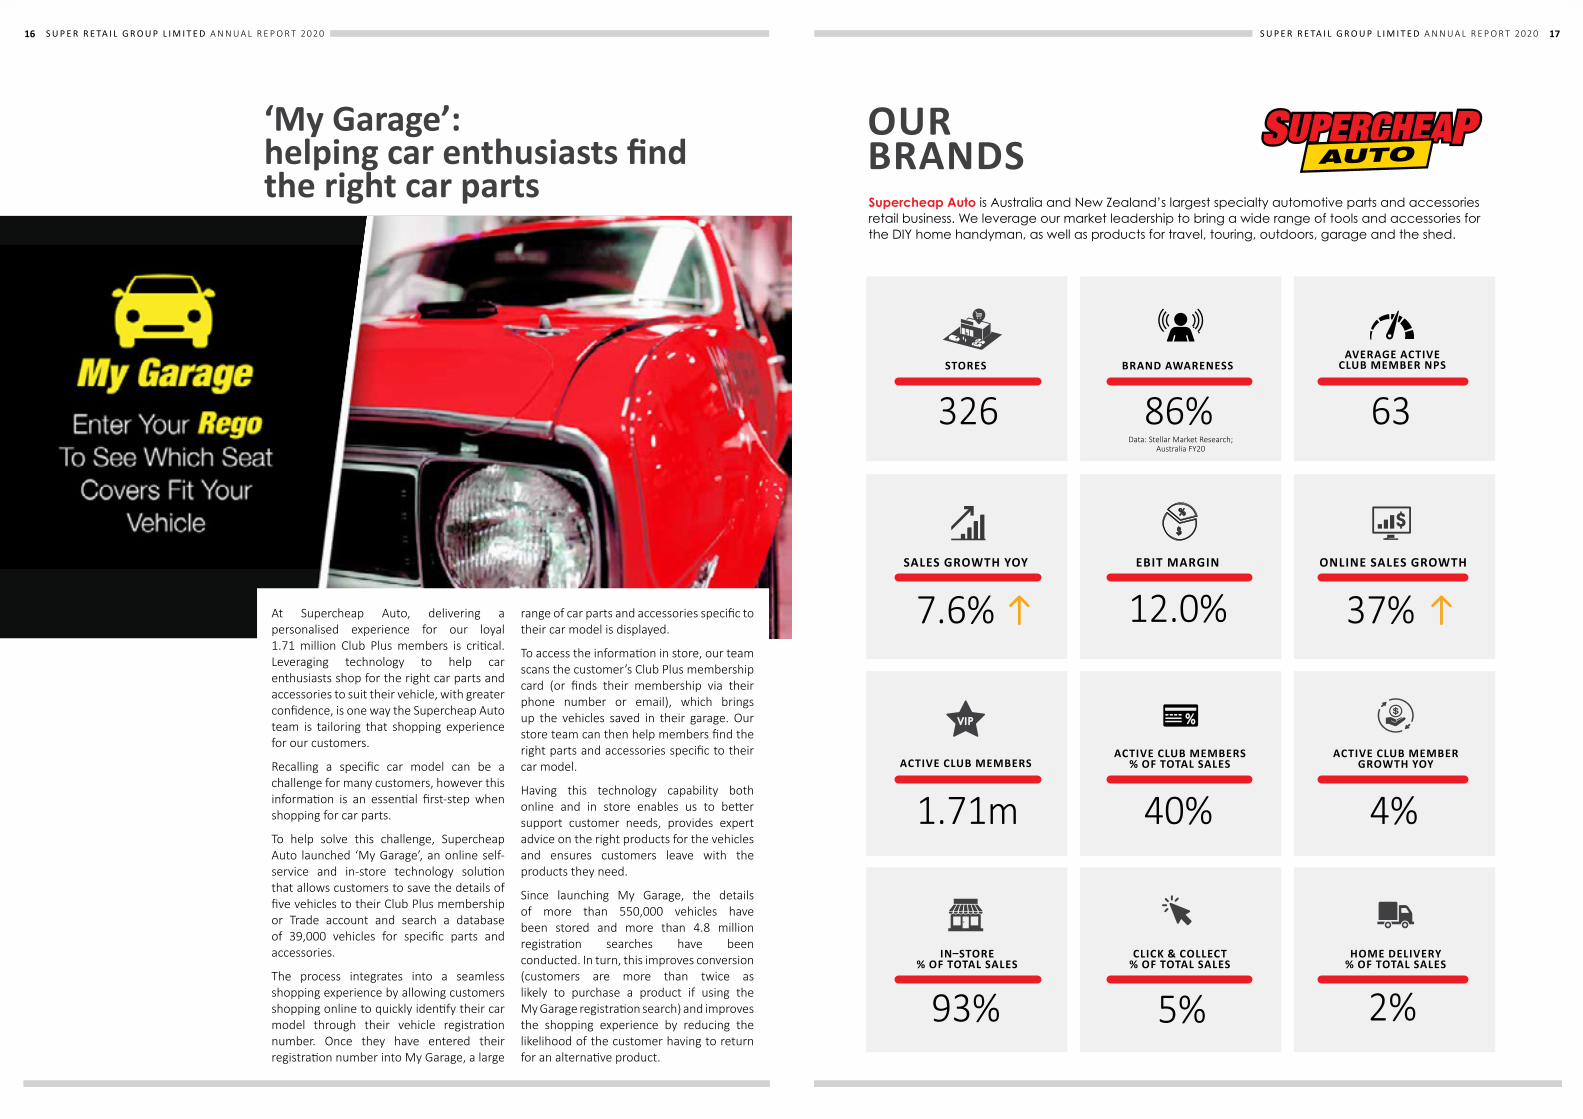
Supercheap Auto is Australia and New Zealand’s largest specialty automotive parts and accessories retail business. We leverage our market leadership to bring a wide range of tools and accessories for the DIY home handyman, as well as products for travel, touring, outdoors, garage and the shed.
OUR BRANDS
326Data: Stellar Market Research;
Australia FY20
AVERAGE ACTIVE CLUB MEMBER NPS
63
1.71m
ACTIVE CLUB MEMBERS % OF TOTAL SALES
CLICK & COLLECT % OF TOTAL SALES
40%
ACTIVE CLUB MEMBER GROWTH YOY
HOME DELIVERY % OF TOTAL SALES
4%
IN–STORE % OF TOTAL SALES
93% 5% 2%
SALES GROWTH YOY
ACTIVE CLUB MEMBERS
STORES
EBIT MARGIN
BRAND AWARENESS
ONLINE SALES GROWTH
86%
7.6% 37%12.0%

18 S U P E R R E TA I L G R O U P L I M I T E D A N N U A L R E P O R T 2020
Creating a new shopping experience with rebel Doncaster
The rebel team are all about inspiring Australians to chase their sporting dreams and passions. The opening of the first rebel Customer Experience (rCX) store in Doncaster in March 2020, providing a personalised and seamless shopping experience, is one way the team is bringing that commitment to life.
rCX Doncaster is rebel’s first Customer Experience store to roll out as part of the team’s strategy to improve the omni experience across the store network and provide multiple dimensions to the customer’s shopping journey. The store is purpose-built with a new design inspiring sport and performance. It offers more storytelling and engaging experiences, exclusive products and a team of rebel experts to help customers every step of the way.
The store’s design is informed by extensive customer and trade partner research, including consumer surveys, best practice trends and industry research on the evolution of retail and the need to create meaningful, in-store experiences.
It also leverages the power of the Super Retail Group network by utilising insights from Supercheap Auto’s successful Customer Experience store in Penrith, NSW.
With a footprint of more than 1,700 square metres, rebel customers can be the first to check out the latest in limited edition or exclusive products as well as an expanded range of men’s, women’s and kids’ performance and lifestyle apparel and footwear. Sports fanatics can touch, feel and try the product before they buy, shoot hoops on the mini basketball court and play a game of soccer in the FIFA games room.
Our team of rebel experts are dedicated to delivering the best customer experience and providing great advice by relaying their own passion for sports, with a major focus on running, football, basketball and training.
The store’s design concept was developed in partnership with Nike and in conjunction with a number of other key trade partners including adidas, Under Armour, Speedo, Garmin and Icon.
Despite opening just before COVID-19 restrictions were introduced, the store has performed exceptionally well with NPS up 21 points in comparison to the previous year and the ‘average transaction value’ increasing 20 per cent after the refurbishment. This success shows the importance of providing a personalised shopping experience and has established a proof-of-concept for future investment.
19S U P E R R E TA I L G R O U P L I M I T E D A N N U A L R E P O R T 2020
rebel helps our customers dream big. We are Australia’s leading sporting goods specialist retailer, bringing the best of global brands direct to our customers. We inspire all Australians to live their sporting passion, by providing the right service, right advice, right brands and right products to help them start right and chase their dreams.
OUR BRANDS
160Data: Stellar Market Research;
Australia FY20
AVERAGE ACTIVE CLUB MEMBER NPS
55
9.3% 49%
2.88m
ACTIVE CLUB MEMBERS % OF TOTAL SALES
CLICK & COLLECT % OF TOTAL SALES
66%
ACTIVE CLUB MEMBER GROWTH YOY
HOME DELIVERY % OF TOTAL SALES
12%
IN–STORE % OF TOTAL SALES
86% 4% 10%
SALES GROWTH YOY
ACTIVE CLUB MEMBERS
STORES
EBIT MARGIN
BRAND AWARENESS
ONLINE SALES GROWTH
3.3%
93%
Excludes Infinite Retail business which has been permanently discontinued
20 S U P E R R E TA I L G R O U P L I M I T E D A N N U A L R E P O R T 2020
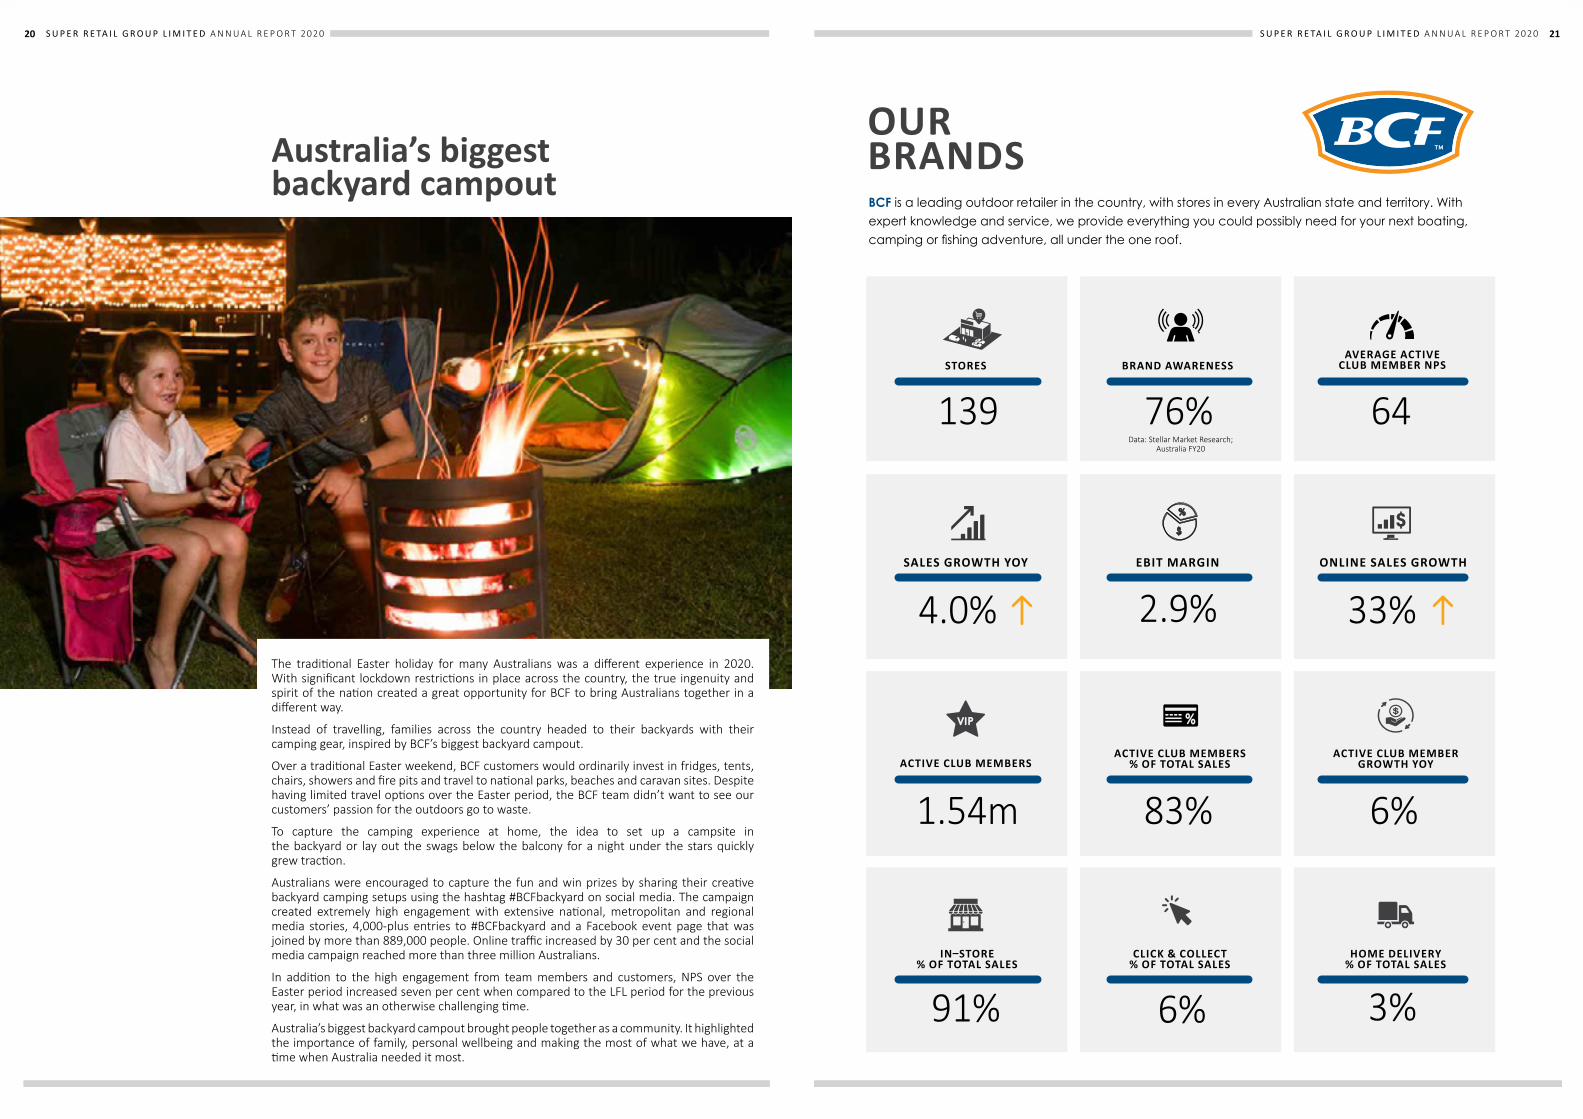
The traditional Easter holiday for many Australians was a different experience in 2020. With significant lockdown restrictions in place across the country, the true ingenuity and spirit of the nation created a great opportunity for BCF to bring Australians together in a different way.
Instead of travelling, families across the country headed to their backyards with their camping gear, inspired by BCF’s biggest backyard campout.
Over a traditional Easter weekend, BCF customers would ordinarily invest in fridges, tents, chairs, showers and fire pits and travel to national parks, beaches and caravan sites. Despite having limited travel options over the Easter period, the BCF team didn’t want to see our customers’ passion for the outdoors go to waste.
To capture the camping experience at home, the idea to set up a campsite in the backyard or lay out the swags below the balcony for a night under the stars quickly grew traction.
Australians were encouraged to capture the fun and win prizes by sharing their creative backyard camping setups using the hashtag #BCFbackyard on social media. The campaign created extremely high engagement with extensive national, metropolitan and regional media stories, 4,000-plus entries to #BCFbackyard and a Facebook event page that was joined by more than 889,000 people. Online traffic increased by 30 per cent and the social media campaign reached more than three million Australians.
In addition to the high engagement from team members and customers, NPS over the Easter period increased seven per cent when compared to the LFL period for the previous year, in what was an otherwise challenging time.
Australia’s biggest backyard campout brought people together as a community. It highlighted the importance of family, personal wellbeing and making the most of what we have, at a time when Australia needed it most.
Australia’s biggest backyard campout
21S U P E R R E TA I L G R O U P L I M I T E D A N N U A L R E P O R T 2020
BCF is a leading outdoor retailer in the country, with stores in every Australian state and territory. With expert knowledge and service, we provide everything you could possibly need for your next boating, camping or fishing adventure, all under the one roof.
OUR BRANDS
139Data: Stellar Market Research;
Australia FY20
AVERAGE ACTIVE CLUB MEMBER NPS
64
2.9% 33%
1.54m
ACTIVE CLUB MEMBERS % OF TOTAL SALES
CLICK & COLLECT % OF TOTAL SALES
83%
ACTIVE CLUB MEMBER GROWTH YOY
HOME DELIVERY % OF TOTAL SALES
6%
IN–STORE % OF TOTAL SALES
91% 6% 3%
SALES GROWTH YOY
ACTIVE CLUB MEMBERS
STORES
EBIT MARGIN
BRAND AWARENESS
ONLINE SALES GROWTH
4.0%
76%
22 S U P E R R E TA I L G R O U P L I M I T E D A N N U A L R E P O R T 2020
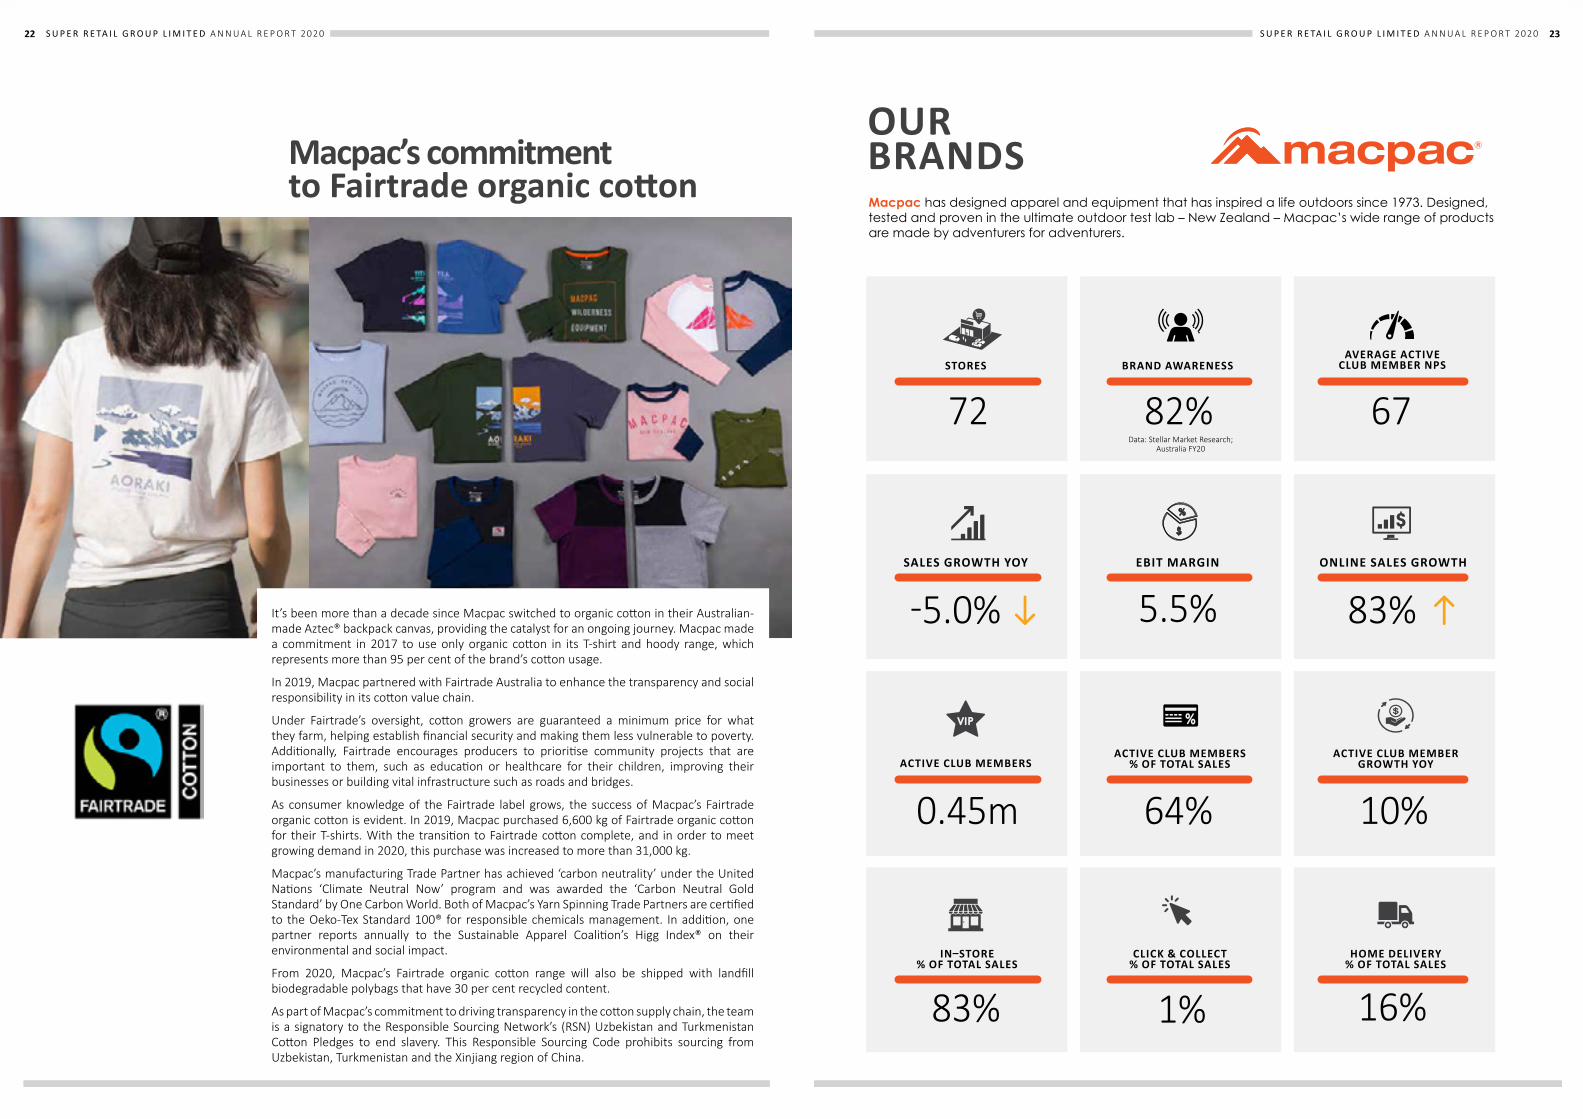
Macpac’s commitment to Fairtrade organic cotton
It’s been more than a decade since Macpac switched to organic cotton in their Australian-made Aztec® backpack canvas, providing the catalyst for an ongoing journey. Macpac made a commitment in 2017 to use only organic cotton in its T-shirt and hoody range, which represents more than 95 per cent of the brand’s cotton usage.
In 2019, Macpac partnered with Fairtrade Australia to enhance the transparency and social responsibility in its cotton value chain.
Under Fairtrade’s oversight, cotton growers are guaranteed a minimum price for what they farm, helping establish financial security and making them less vulnerable to poverty. Additionally, Fairtrade encourages producers to prioritise community projects that are important to them, such as education or healthcare for their children, improving their businesses or building vital infrastructure such as roads and bridges.
As consumer knowledge of the Fairtrade label grows, the success of Macpac’s Fairtrade organic cotton is evident. In 2019, Macpac purchased 6,600 kg of Fairtrade organic cotton for their T-shirts. With the transition to Fairtrade cotton complete, and in order to meet growing demand in 2020, this purchase was increased to more than 31,000 kg.
Macpac’s manufacturing Trade Partner has achieved ‘carbon neutrality’ under the United Nations ‘Climate Neutral Now’ program and was awarded the ‘Carbon Neutral Gold Standard’ by One Carbon World. Both of Macpac’s Yarn Spinning Trade Partners are certified to the Oeko-Tex Standard 100® for responsible chemicals management. In addition, one partner reports annually to the Sustainable Apparel Coalition’s Higg Index® on their environmental and social impact.
From 2020, Macpac’s Fairtrade organic cotton range will also be shipped with landfill biodegradable polybags that have 30 per cent recycled content.
As part of Macpac’s commitment to driving transparency in the cotton supply chain, the team is a signatory to the Responsible Sourcing Network’s (RSN) Uzbekistan and Turkmenistan Cotton Pledges to end slavery. This Responsible Sourcing Code prohibits sourcing from Uzbekistan, Turkmenistan and the Xinjiang region of China.
23S U P E R R E TA I L G R O U P L I M I T E D A N N U A L R E P O R T 2020
Macpac has designed apparel and equipment that has inspired a life outdoors since 1973. Designed, tested and proven in the ultimate outdoor test lab – New Zealand – Macpac’s wide range of products are made by adventurers for adventurers.
OUR BRANDS
72 82%Data: Stellar Market Research;
Australia FY20
AVERAGE ACTIVE CLUB MEMBER NPS
67
5.5% 83%
0.45m
ACTIVE CLUB MEMBERS % OF TOTAL SALES
CLICK & COLLECT % OF TOTAL SALES
64%
ACTIVE CLUB MEMBER GROWTH YOY
HOME DELIVERY % OF TOTAL SALES
10%
IN–STORE % OF TOTAL SALES
83% 1% 16%
SALES GROWTH YOY
ACTIVE CLUB MEMBERS
STORES
EBIT MARGIN
BRAND AWARENESS
ONLINE SALES GROWTH
-5.0%

24 S U P E R R E TA I L G R O U P L I M I T E D A N N U A L R E P O R T 2020
SALLY PITKINIndependent Non-Executive Chair
ANTHONY HERAGHTYGroup Managing Director and Chief Executive Officer
BOARD OF DIRECTORS
Appointed
Committees
Experience
Other Roles
Leisure Passion
Chair – 23 October 2017 Board – 1 July 2010
20 February 2019
Chair of the Nomination Committee, Member (ex-officio) of the Human Resources and Remuneration Committee
Member of the Nomination Committee
Chair of the Human Resources and Remuneration Committee
Sally has more than 20 years’ experience as a Non-Executive Director in the listed, private, public and non-profit sectors, including experience in international markets, and more than 15 years’ experience as a non-executive director of ASX200 companies. Sally served as an Independent Non-Executive Director for Super Retail Group (1 July 2010 – 23 Oct 2017) prior to her appointment as Chair and is an ex-officio member of the Human Resources and Remuneration Committee. She is a lawyer and former partner of a national law firm with banking law, corporate law and corporate governance expertise. Sally holds a Doctor of Philosophy (Governance), a Master of Laws and Bachelor of Laws.
Anthony has more than 20 years’ leadership experience across the retail, apparel, FMCG and marketing services industries. Prior to his appointment as Group Managing Director and Chief Executive Officer, Anthony was Managing Director – Outdoor Retailing (2015 – 2019) where he was responsible for the BCF, Rays and Macpac businesses. Anthony has served in a variety of senior roles including Group General Manager of Underwear for Pacific Brands Limited, where he led the overhaul of the Bonds business from a wholesale operation to an omni-retailer, Global Marketing Director for Foster’s Group Limited and Managing Director for George Patterson and McCann Erickson.
Director of ASX listed companies The Star Entertainment Group Limited and Link Administration Holdings Limited, Fellow of the Australian Institute of Company Directors and Chair of the Institute’s Corporate Governance Committee.
DIANA EILERTIndependent Non-Executive Director
21 October 2015
Diana is an experienced Non-Executive Director with strong strategic and operational experience. As a former Suncorp Group executive and as a CEO, she has broad experience running large businesses. Combined with her Strategy Partner and executive experience, Diana brings to the Board particular skills in strategy, with an emphasis on customer and data, technology, digital disruption and business models. Diana’s non-executive focus is mid-cap companies, with previous board roles including realestate.com, Veda and Navitas. Diana holds a Bachelor of Science (Pure Mathematics) (University of Sydney) and a Master of Commerce (UNSW).
Independent Non-Executive Director of Domain Holdings Australia Limited and Elders Limited. Member (part-time) of the Australian Competition Tribunal and Member of the Advisory Group for AT Kearney.
REG ROWENon-Executive Director
8 April 2004
Director of a number of private family companies.
Bush walking and skiing Fishing, camping, hiking, cycling, running and cars
Enjoying time with family, walking and gardening
Skiing, cycling, hiking, swimming and jazz
Reg and Hazel Rowe founded an automotive accessories mail order business in 1972, which they ran from their Queensland home. In 1974 they commenced retail operations of the business that evolved into the thriving specialty retail business – Supercheap Auto.
Reg served as Managing Director until 1996 and then Chairman from 1996 to 2004. Prior to this, Reg had 13 years’ experience in various retail and merchandise roles at Myer department stores.
Reg brings to the Board extensive retail industry and general management expertise and skills in retail and merchandise operations, property and strategy.
25S U P E R R E TA I L G R O U P L I M I T E D A N N U A L R E P O R T 2020
GARY DUNNE Independent Non-Executive Director
PETER EVERINGHAM Independent Non-Executive Director
31 March 202019 December 2017
Member of the Audit and Risk Committee, Human Resources and Remuneration Committee and Nomination Committee
Member of the Audit and Risk Committee
Member of the Audit and Risk Committee
Member of the Australian Institute of Company Directors.
Non-Executive Director of ME Bank, iCar Asia Limited and Member of the WWF-Australia, Australia’s largest conservation organisation.
Gary has deep retail sector experience with extensive careers at Woolworths, Coles, and ALDI. He has executive experience with private equity, and, most recently, held the Chief Operations role at Sigma Healthcare. Gary was formerly Chair of NostraData (a market- leading pharmacy data provider) and a former director of National Pharmaceutical Services Australia and Members Benefits Australia. He holds a Graduate Certificate of Management from Adelaide University, Master of Enterprise from Melbourne University and is a graduate of the Advanced Management Program from Harvard Business School in Boston. Gary is a recipient of the Joe Berry Memorial Award.
Peter is an experienced executive with more than 25 years’ corporate experience, including 18 years in senior executive roles in the digital sector. He was formerly Managing Director of SEEK Limited’s International Division, and served as a Non-Executive Director of the education businesses, IDP Education, Online Education Services and THINK Education, as well as Chairman of Seek’s China subsidiary, Zhaopin Limited. His previous executive roles include Director of Strategy for Yahoo! in Australia and Southeast Asia. Peter holds a Master of Business Administration from IESE, a Bachelor of Economics from The University of Sydney, and is a graduate member of the Australian Institute of Company Directors.
Hiking, travel and reading Golf Golf, AFL and walkingOcean swimming
ANNABELLE CHAPLAIN AMIndependent Non-Executive Director
HOWARD MOWLEMIndependent Non-Executive Director
31 March 202013 June 2017
Chair of the Audit and Risk Committee, Member of the Human Resources and Remuneration Committee
Chair of Canstar Pty Ltd and MFF Capital Investments Limited, Director of Seven Group Holdings Ltd and Member of the Australian Ballet board of directors.
Annabelle brings broad-ranging experience in financial services, industrial and infrastructure services. Previously, Annabelle was a director of Downer EDI Ltd, Credible Labs Inc and EFIC (Australia’s export credit agency).
Annabelle holds an MBA (University of Melbourne), a BA majoring in Economics and Mandarin (Griffith University), a diploma from the Securities Institute of Australia and is a Fellow of the Australian Institute of Company Directors. In 2016, Griffith University conferred on her an honorary doctorate for her service to banking, finance and the community.
Howard is experienced in many segments of the Australian and international retail industry and brings extensive experience in corporate finance, mergers and acquisitions, financial reporting, treasury, tax, audit and governance. From 2001 – 2010, he was Chief Financial Officer and board member of Dairy Farm International Holdings, a Hong Kong-based pan-Asian retailer. Prior to that, he held the position of Finance Director for Coles Supermarkets for 12 years. Howard was formerly a Non-Executive Director of Billabong International Ltd. He holds a Bachelor of Economics (Hons), a Master of Business Administration and Securities Industry Diploma, and is a Fellow of CPA Australia.

26 S U P E R R E TA I L G R O U P L I M I T E D A N N U A L R E P O R T 2020
EXECUTIVE LEADERSHIP TEAM
Alex was appointed as Macpac’s Chief Executive Officer in July 2012 and continues to serve in this role after Super Retail Group acquired the outdoor adventure specialist retailer in April 2018. Originally from England, Alex holds a Bachelor of Economics and Marketing degree from the London Guildhall University. Alex has more than 20 years’ of retailing experience across the US, Australia and New Zealand with companies including Bath and Body Works, Express, Surf Dive ‘n’ Ski, Rip Curl and Just Kids. He is based in Christchurch, New Zealand.
ALEX BRANDONChief Executive Officer –
Macpac
Katie joined Super Retail Group in April 2019 as Chief Strategy and Customer Officer, where she has responsibility for corporate strategy integration and execution, analytics, marketing and customer strategy. Katie holds a Bachelor of Pharmacy degree and a Master of Business Administration from Melbourne Business School and Cornell University. She has completed executive programs in Digital Marketing at INSEAD and both Digital Transformation and Marketing at Harvard Business School. Katie brings more than 20 years’ experience in top-tier consulting, retail and FMCG businesses. She was previously Vice President Asia-Pacific for IBM, leading Digital Strategy and iX.
KATIE McNAMARA Chief Strategy and Customer Officer
Paul joined Super Retail Group in December 2019 as Managing Director for BCF and brings deep retail expertise from more than 30 years in executive and management leadership roles at successful retailers in both Australia and internationally. After working in various managerial roles at Safeway in the United Kingdom, Paul joined ASDA Stores working in regional and headquarters planning and strategy positions. Paul worked for nearly a decade with the Coles Group, holding a number of leadership positions including Group General Manager, Store Development and Chief Store Operations Officer where he was responsible for creating and driving the operations strategy.
PAUL BRADSHAW Managing Director –
BCF
Jane joined Super Retail Group in July 2016 as Chief Human Resources Officer and is responsible for advancing Super Retail Group’s strong focus on team engagement, culture and capability development. Jane is also responsible for the Group’s corporate affairs function. She holds a Master of Commerce and Employee Relations with Honours from the University of Melbourne and a Bachelor of Commerce from the University of New South Wales. Jane was previously the Human Resources and Corporate Affairs Director at BT Financial Group and also held senior roles as Head of Reward for St. George Bank and Head of Human Resources - Australian Financial Services at Westpac.
JANE KELLY Chief Human
Resources Officer
27S U P E R R E TA I L G R O U P L I M I T E D A N N U A L R E P O R T 2020
Since joining Super Retail Group in December 2015 as Chief Information Officer, Paul has focused on the digital transformation of the Group’s technology capability. He has implemented innovative and cost-effective technologies that drive real business value and support the Group’s continued growth to be a leading omni-retailer. Paul has an extensive retailing background that include Head of Information Systems Delivery at UK retailer John Lewis, IBM managing consultant positions leading projects for premier retailers including Tesco, Argos and Woolworths and a variety of other roles including Head of Merchandising at British Home Stores.
PAUL HAYES Chief Information Officer
Gary joined Super Retail Group in April 2019 as Managing Director – rebel. Gary has more than 30 years’ of global retail, brand and property experience, including senior executive roles in Australia - where he has served for the past 20 years – the US, UK, Asia Pacific and South Africa. Previously Gary was the Chief Operating Officer for the Alceon Retail Group and has also held executive, board and senior retail leadership roles with brands including David Jones/Country Road Group, Myer, OK Bazaars, Puma, Reebok, Coca-Cola, Westfield and Topshop.
GARY WILLIAMSManaging Director –
rebel
Benjamin joined Super Retail Group in July 2019 as Managing Director – Supercheap Auto. Benjamin holds a Bachelor of Business (Marketing) from the University of Newcastle, and is an experienced retail executive with almost 25 years in senior management roles across Australia, UK, US and Europe, including two decades with international supermarket giant ALDI. Previously, he was Managing Director, Global Business Coordination for ALDI Supermarkets based in Germany. Benjamin also held various senior leadership roles at ALDI in Operations, Merchandising, Transformation and Change Management.
BENJAMIN WARDManaging Director –
Supercheap Auto
Darren joined Super Retail Group in January 2019 as Chief Supply Chain Officer. Darren has more than 30 years’ experience in supply chain and logistics having served in a broad array of industries including military, steel manufacturing, FMCG, retail and third party logistics, with nine of his past eleven years based in Asia. Darren holds a Bachelor of Business Degree, Graduate Diploma of Business and a Master of Business Administration from the University of Southern Queensland. Prior to joining Super Retail Group, Darren worked in a regional operations role for Zuellig Pharma serving their Asian operations.
DARREN WEDDINGChief Supply Chain Officer
Rebecca joined Super Retail Group in February 2020 as Chief Legal Officer and Company Secretary, and is responsible for leading our legal, risk, compliance and group secretariat functions. She has extensive executive experience in legal and corporate governance, gained through roles in top tier law firms and blue chip corporates throughout the US, Europe, Asia and Australia including IAG, Amcor and Westpac. Rebecca holds a Bachelor of Laws (first class honours) from Monash University and a Bachelor of Arts.
REBECCA FARRELLChief Legal Officer and
Company Secretary
David joined Super Retail Group in December 2012 in the role of Chief Financial Officer. David has overall responsibility for the finance, investor relations, and property and store improvement portfolios. David holds a degree in Economics from the University of Sydney and is a FCPA. He has more than 30 years of finance experience in a number of industry sectors, and previously held senior management positions at Qantas, Spotless and Lend Lease.
DAVID BURNSChief Financial Officer
28 S U P E R R E TA I L G R O U P L I M I T E D A N N U A L R E P O R T 2020
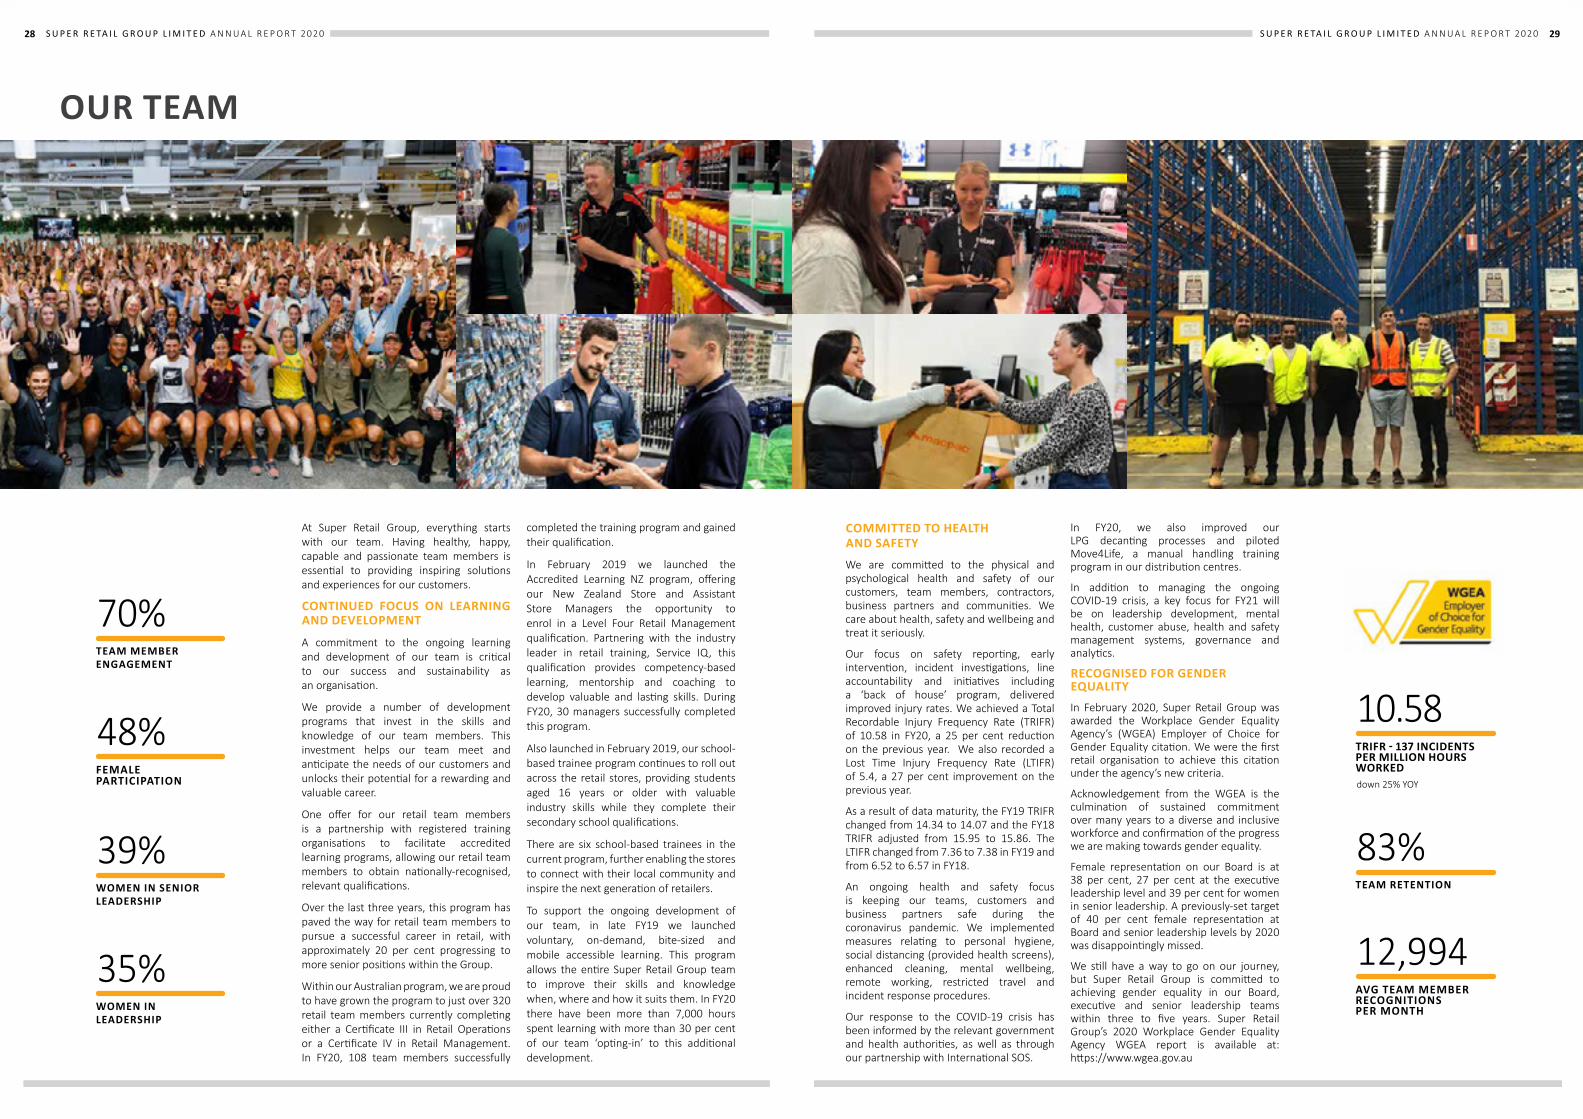
At Super Retail Group, everything starts with our team. Having healthy, happy, capable and passionate team members is essential to providing inspiring solutions and experiences for our customers.
CONTINUED FOCUS ON LEARNING AND DEVELOPMENT
A commitment to the ongoing learning and development of our team is critical to our success and sustainability as an organisation.
We provide a number of development programs that invest in the skills and knowledge of our team members. This investment helps our team meet and anticipate the needs of our customers and unlocks their potential for a rewarding and valuable career.
One offer for our retail team members is a partnership with registered training organisations to facilitate accredited learning programs, allowing our retail team members to obtain nationally-recognised, relevant qualifications.
Over the last three years, this program has paved the way for retail team members to pursue a successful career in retail, with approximately 20 per cent progressing to more senior positions within the Group.
Within our Australian program, we are proud to have grown the program to just over 320 retail team members currently completing either a Certificate III in Retail Operations or a Certificate IV in Retail Management. In FY20, 108 team members successfully
completed the training program and gained their qualification.
In February 2019 we launched the Accredited Learning NZ program, offering our New Zealand Store and Assistant Store Managers the opportunity to enrol in a Level Four Retail Management qualification. Partnering with the industry leader in retail training, Service IQ, this qualification provides competency-based learning, mentorship and coaching to develop valuable and lasting skills. During FY20, 30 managers successfully completed this program.
Also launched in February 2019, our school-based trainee program continues to roll out across the retail stores, providing students aged 16 years or older with valuable industry skills while they complete their secondary school qualifications.
There are six school-based trainees in the current program, further enabling the stores to connect with their local community and inspire the next generation of retailers.
To support the ongoing development of our team, in late FY19 we launched voluntary, on-demand, bite-sized and mobile accessible learning. This program allows the entire Super Retail Group team to improve their skills and knowledge when, where and how it suits them. In FY20 there have been more than 7,000 hours spent learning with more than 30 per cent of our team ‘opting-in’ to this additional development.
FEMALE PARTICIPATION
48%
WOMEN IN SENIOR LEADERSHIP
39%
TEAM MEMBER ENGAGEMENT
70%
WOMEN IN LEADERSHIP
35%
OUR TEAM
29S U P E R R E TA I L G R O U P L I M I T E D A N N U A L R E P O R T 2020
COMMITTED TO HEALTH AND SAFETY
We are committed to the physical and psychological health and safety of our customers, team members, contractors, business partners and communities. We care about health, safety and wellbeing and treat it seriously.
Our focus on safety reporting, early intervention, incident investigations, line accountability and initiatives including a ‘back of house’ program, delivered improved injury rates. We achieved a Total Recordable Injury Frequency Rate (TRIFR) of 10.58 in FY20, a 25 per cent reduction on the previous year. We also recorded a Lost Time Injury Frequency Rate (LTIFR) of 5.4, a 27 per cent improvement on the previous year.
As a result of data maturity, the FY19 TRIFR changed from 14.34 to 14.07 and the FY18 TRIFR adjusted from 15.95 to 15.86. The LTIFR changed from 7.36 to 7.38 in FY19 and from 6.52 to 6.57 in FY18.
An ongoing health and safety focus is keeping our teams, customers and business partners safe during the coronavirus pandemic. We implemented measures relating to personal hygiene, social distancing (provided health screens), enhanced cleaning, mental wellbeing, remote working, restricted travel and incident response procedures.
Our response to the COVID-19 crisis has been informed by the relevant government and health authorities, as well as through our partnership with International SOS.
In FY20, we also improved our LPG decanting processes and piloted Move4Life, a manual handling training program in our distribution centres.
In addition to managing the ongoing COVID-19 crisis, a key focus for FY21 will be on leadership development, mental health, customer abuse, health and safety management systems, governance and analytics.
RECOGNISED FOR GENDER EQUALITYIn February 2020, Super Retail Group was awarded the Workplace Gender Equality Agency’s (WGEA) Employer of Choice for Gender Equality citation. We were the first retail organisation to achieve this citation under the agency’s new criteria.
Acknowledgement from the WGEA is the culmination of sustained commitment over many years to a diverse and inclusive workforce and confirmation of the progress we are making towards gender equality.
Female representation on our Board is at 38 per cent, 27 per cent at the executive leadership level and 39 per cent for women in senior leadership. A previously-set target of 40 per cent female representation at Board and senior leadership levels by 2020 was disappointingly missed.
We still have a way to go on our journey, but Super Retail Group is committed to achieving gender equality in our Board, executive and senior leadership teams within three to five years. Super Retail Group’s 2020 Workplace Gender Equality Agency WGEA report is available at: https://www.wgea.gov.au
TEAM RETENTION
83%
AVG TEAM MEMBER RECOGNITIONS PER MONTH
12,994
TRIFR - 137 INCIDENTS PER MILLION HOURS WORKED
10.58
down 25% YOY
30 S U P E R R E TA I L G R O U P L I M I T E D A N N U A L R E P O R T 2020
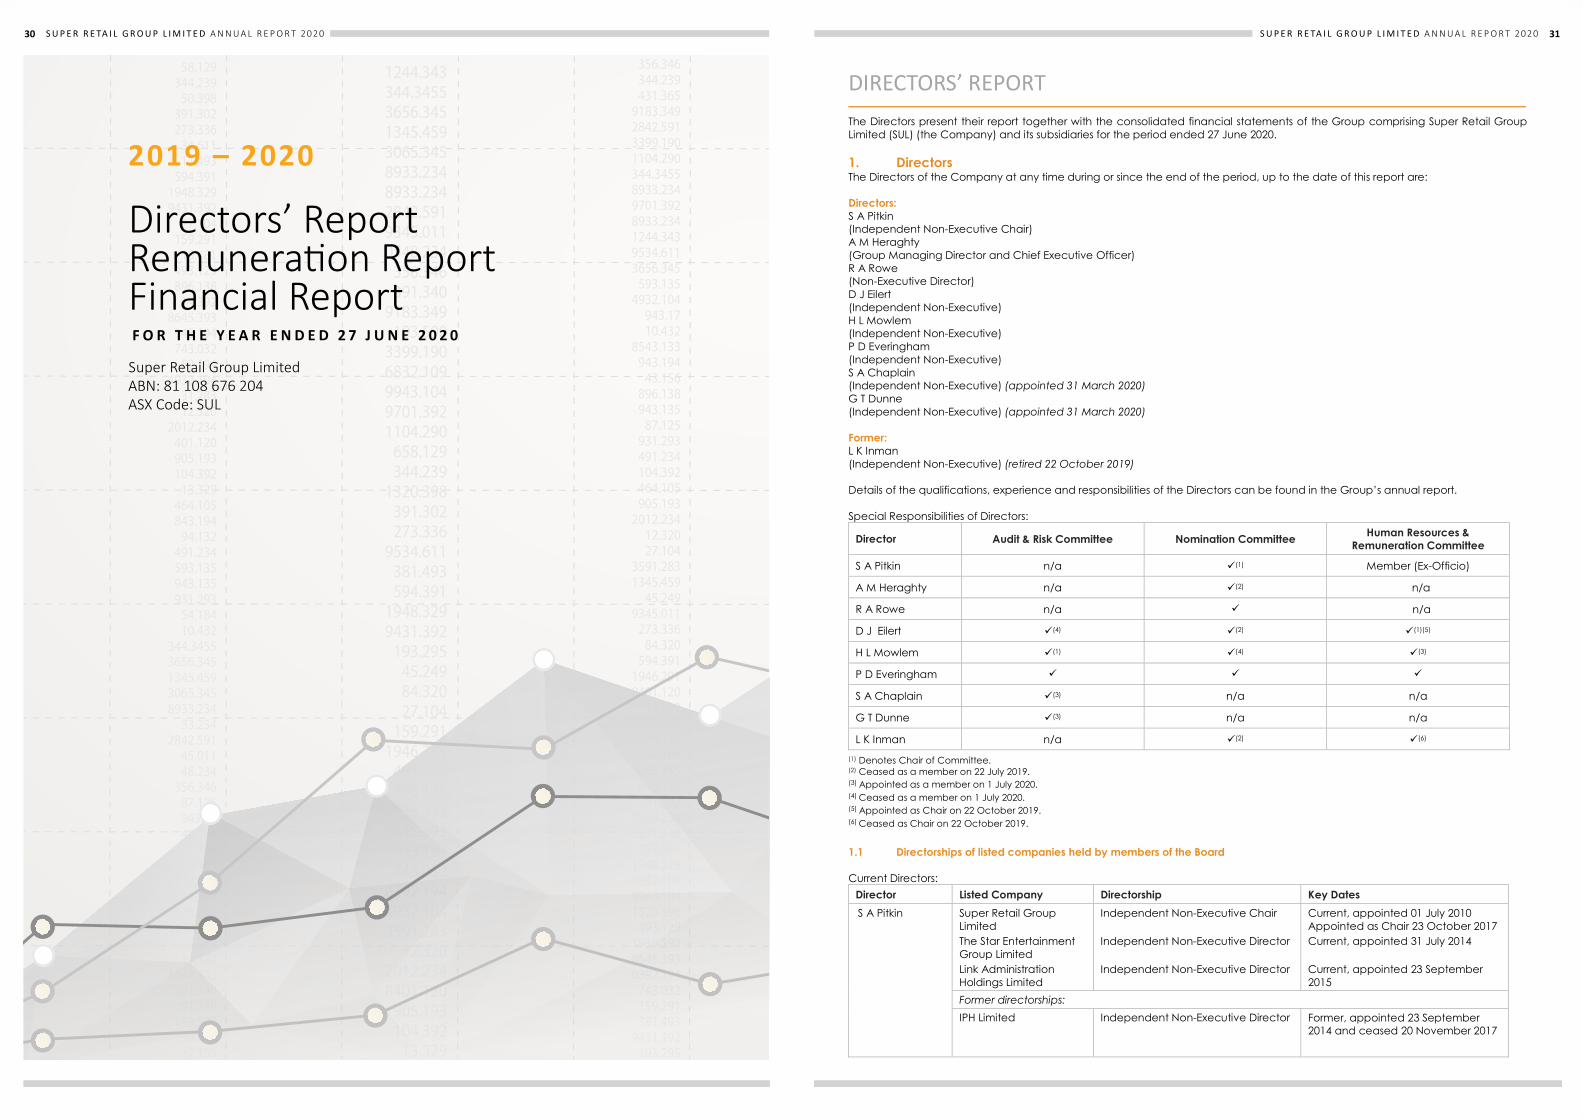
Directors’ Report Remuneration Report Financial Report
2019 – 2020
F O R T H E Y E A R E N D E D 2 7 J U N E 2 0 2 0
Super Retail Group Limited ABN: 81 108 676 204 ASX Code: SUL
31S U P E R R E TA I L G R O U P L I M I T E D A N N U A L R E P O R T 2020S U P E R R E T A I L G R O U P L I M I T E D A N N U A L R E P O R T 2 0 2 0 31
DIRECTORS’ REPORT
The Directors present their report together with the consolidated financial statements of the Group comprising Super Retail Group Limited (SUL) (the Company) and its subsidiaries for the period ended 27 June 2020. 1. Directors The Directors of the Company at any time during or since the end of the period, up to the date of this report are: Directors: S A Pitkin (Independent Non-Executive Chair) A M Heraghty (Group Managing Director and Chief Executive Officer) R A Rowe (Non-Executive Director) D J Eilert (Independent Non-Executive) H L Mowlem (Independent Non-Executive) P D Everingham (Independent Non-Executive) S A Chaplain (Independent Non-Executive) (appointed 31 March 2020) G T Dunne (Independent Non-Executive) (appointed 31 March 2020) Former: L K Inman (Independent Non-Executive) (retired 22 October 2019) Details of the qualifications, experience and responsibilities of the Directors can be found in the Group’s annual report. Special Responsibilities of Directors:
Director Audit & Risk Committee Nomination Committee Human Resources & Remuneration Committee
S A Pitkin n/a (1) Member (Ex-Officio)
A M Heraghty n/a (2) n/a
R A Rowe n/a n/a
D J Eilert (4) (2) (1)(5)
H L Mowlem (1) (4) (3)
P D Everingham
S A Chaplain (3) n/a n/a
G T Dunne (3) n/a n/a
L K Inman n/a (2) (6) (1) Denotes Chair of Committee. (2) Ceased as a member on 22 July 2019. (3) Appointed as a member on 1 July 2020. (4) Ceased as a member on 1 July 2020. (5) Appointed as Chair on 22 October 2019. (6) Ceased as Chair on 22 October 2019. 1.1 Directorships of listed companies held by members of the Board Current Directors:
Director Listed Company Directorship Key Dates S A Pitkin
Super Retail Group Limited The Star Entertainment Group Limited Link Administration Holdings Limited
Independent Non-Executive Chair Independent Non-Executive Director Independent Non-Executive Director
Current, appointed 01 July 2010 Appointed as Chair 23 October 2017 Current, appointed 31 July 2014 Current, appointed 23 September 2015
Former directorships: IPH Limited Independent Non-Executive Director Former, appointed 23 September
2014 and ceased 20 November 2017
32 S U P E R R E TA I L G R O U P L I M I T E D A N N U A L R E P O R T 202032 S U P E R R E T A I L G R O U P L I M I T E D A N N U A L R E P O R T 2 0 2 0
DIRECTORS’ REPORT (continued)
1. Directors (continued) 1.1 Directorships of listed companies held by members of the Board (continued) Current Directors:
Director Listed Company Directorship Key Dates
A M Heraghty Super Retail Group Limited
Group Managing Director and Chief Executive Officer
Current, appointed 20 February 2019
R A Rowe Super Retail Group Limited
Non-Executive Director Current, appointed 08 April 2004
D J Eilert
Super Retail Group Limited Elders Limited Domain Holdings Australia Limited
Independent Non-Executive Director Independent Non-Executive Director Independent Non-Executive Director
Current, appointed 21 October 2015 Current appointed 14 November 2017 Current appointed 16 November 2017
Former directorships: Navitas Limited Independent Non-Executive Director
Former, appointed 28 July 2014 and delisted 5 July 2019
H L Mowlem
Super Retail Group Limited
Independent Non-Executive Director Current, appointed 13 June 2017
Former directorships:
Billabong International Limited
Independent Non-Executive Director
Former, appointed 24 October 2012 and delisted 26 April 2018
P D Everingham
Super Retail Group Limited iCar Asia Limited
Independent Non-Executive Director Independent Non-Executive Director
Current, appointed 19 December 2017 Current, appointed 1 July 2017
S A Chaplain Super Retail Group Limited MFF Capital Investments Limited Seven Group Holdings Limited
Independent Non-Executive Director Independent Non-Executive Director Independent Non-Executive Director
Current, appointed 31 March 2020 Current, appointed 21 May 2019 (Chair from 1 August 2019) Current, appointed 24 November 2015
G T Dunne Super Retail Group Limited
Independent Non-Executive Director
Current, appointed 31 March 2020
Former Director:
Director Listed Company Directorship Key Dates
L K Inman
Precinct Properties New Zealand Limited The PAS Group Limited
Independent Non-Executive Director Independent Non-Executive Chair
Current, appointed 28 October 2015 Current, appointed Chair on 1 February 2020
Former directorships: Super Retail Group Limited Commonwealth Bank of Australia Bellamy’s Australia Limited Jaxsta Limited
Independent Non-Executive Director Independent Non-Executive Director Independent Non-Executive Director Independent Non-Executive Director
Former, appointed 21 October 2015 and ceased 22 October 2019 Former, appointed 16 March 2011 and ceased 16 November 2017 Former, appointed 15 February 2015 and ceased 28 February 2017 Former, appointed 28 December 2018 and ceased 28 February 2019
33S U P E R R E TA I L G R O U P L I M I T E D A N N U A L R E P O R T 202032 S U P E R R E T A I L G R O U P L I M I T E D A N N U A L R E P O R T 2 0 2 0
DIRECTORS’ REPORT (continued)
1. Directors (continued) 1.1 Directorships of listed companies held by members of the Board (continued) Current Directors:
Director Listed Company Directorship Key Dates
A M Heraghty Super Retail Group Limited
Group Managing Director and Chief Executive Officer
Current, appointed 20 February 2019
R A Rowe Super Retail Group Limited
Non-Executive Director Current, appointed 08 April 2004
D J Eilert
Super Retail Group Limited Elders Limited Domain Holdings Australia Limited
Independent Non-Executive Director Independent Non-Executive Director Independent Non-Executive Director
Current, appointed 21 October 2015 Current appointed 14 November 2017 Current appointed 16 November 2017
Former directorships: Navitas Limited Independent Non-Executive Director
Former, appointed 28 July 2014 and delisted 5 July 2019
H L Mowlem
Super Retail Group Limited
Independent Non-Executive Director Current, appointed 13 June 2017
Former directorships:
Billabong International Limited
Independent Non-Executive Director
Former, appointed 24 October 2012 and delisted 26 April 2018
P D Everingham
Super Retail Group Limited iCar Asia Limited
Independent Non-Executive Director Independent Non-Executive Director
Current, appointed 19 December 2017 Current, appointed 1 July 2017
S A Chaplain Super Retail Group Limited MFF Capital Investments Limited Seven Group Holdings Limited
Independent Non-Executive Director Independent Non-Executive Director Independent Non-Executive Director
Current, appointed 31 March 2020 Current, appointed 21 May 2019 (Chair from 1 August 2019) Current, appointed 24 November 2015
G T Dunne Super Retail Group Limited
Independent Non-Executive Director
Current, appointed 31 March 2020
Former Director:
Director Listed Company Directorship Key Dates
L K Inman
Precinct Properties New Zealand Limited The PAS Group Limited
Independent Non-Executive Director Independent Non-Executive Chair
Current, appointed 28 October 2015 Current, appointed Chair on 1 February 2020
Former directorships: Super Retail Group Limited Commonwealth Bank of Australia Bellamy’s Australia Limited Jaxsta Limited
Independent Non-Executive Director Independent Non-Executive Director Independent Non-Executive Director Independent Non-Executive Director
Former, appointed 21 October 2015 and ceased 22 October 2019 Former, appointed 16 March 2011 and ceased 16 November 2017 Former, appointed 15 February 2015 and ceased 28 February 2017 Former, appointed 28 December 2018 and ceased 28 February 2019
S U P E R R E T A I L G R O U P L I M I T E D A N N U A L R E P O R T 2 0 2 0 33 DIRECTORS’ REPORT (continued)
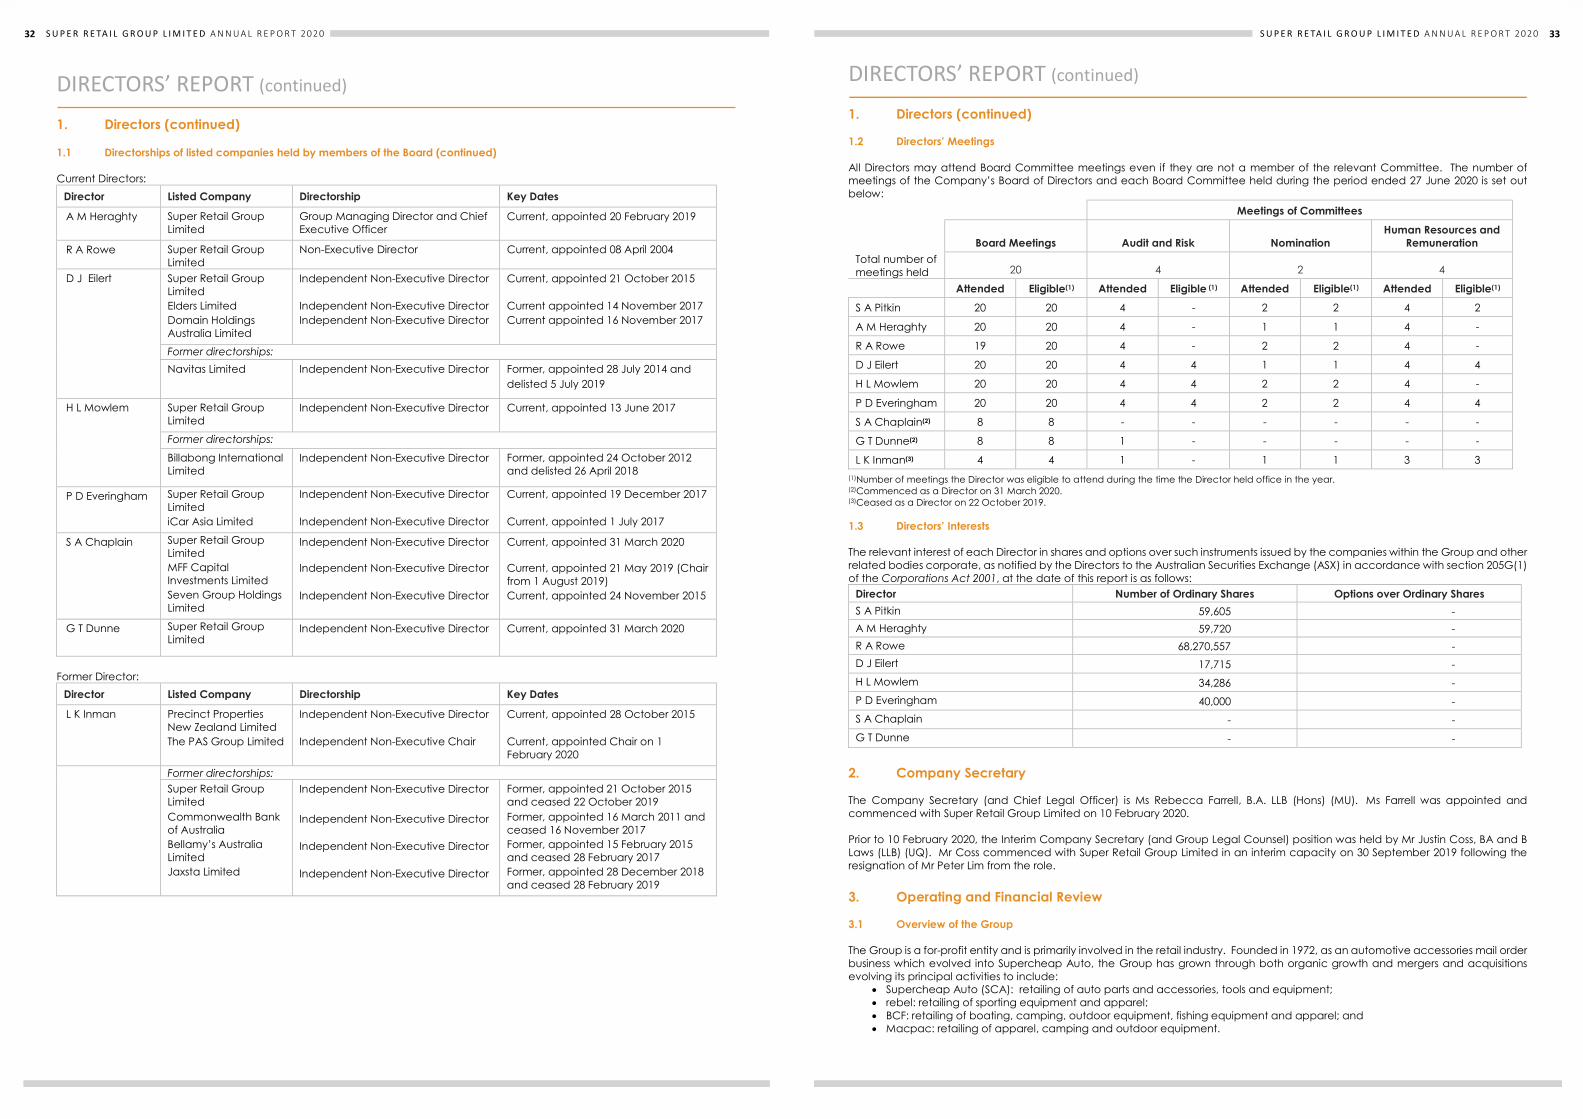
1. Directors (continued) 1.2 Directors’ Meetings All Directors may attend Board Committee meetings even if they are not a member of the relevant Committee. The number of meetings of the Company’s Board of Directors and each Board Committee held during the period ended 27 June 2020 is set out below:
Meetings of Committees
Board Meetings Audit and Risk Nomination Human Resources and
Remuneration Total number of meetings held 20 4 2 4
Attended Eligible(1) Attended Eligible (1) Attended Eligible(1) Attended Eligible(1) S A Pitkin 20 20 4 - 2 2 4 2
A M Heraghty 20 20 4 - 1 1 4 -
R A Rowe 19 20 4 - 2 2 4 -
D J Eilert 20 20 4 4 1 1 4 4
H L Mowlem 20 20 4 4 2 2 4 -
P D Everingham 20 20 4 4 2 2 4 4
S A Chaplain(2) 8 8 - - - - - -
G T Dunne(2) 8 8 1 - - - - -
L K Inman(3) 4 4 1 - 1 1 3 3 (1)Number of meetings the Director was eligible to attend during the time the Director held office in the year. (2)Commenced as a Director on 31 March 2020. (3)Ceased as a Director on 22 October 2019. 1.3 Directors’ Interests The relevant interest of each Director in shares and options over such instruments issued by the companies within the Group and other related bodies corporate, as notified by the Directors to the Australian Securities Exchange (ASX) in accordance with section 205G(1) of the Corporations Act 2001, at the date of this report is as follows:
Director Number of Ordinary Shares Options over Ordinary Shares S A Pitkin 59,605 - A M Heraghty 59,720 - R A Rowe 68,270,557 - D J Eilert 17,715 - H L Mowlem 34,286 - P D Everingham 40,000 - S A Chaplain - - G T Dunne - -
2. Company Secretary
The Company Secretary (and Chief Legal Officer) is Ms Rebecca Farrell, B.A. LLB (Hons) (MU). Ms Farrell was appointed and commenced with Super Retail Group Limited on 10 February 2020. Prior to 10 February 2020, the Interim Company Secretary (and Group Legal Counsel) position was held by Mr Justin Coss, BA and B Laws (LLB) (UQ). Mr Coss commenced with Super Retail Group Limited in an interim capacity on 30 September 2019 following the resignation of Mr Peter Lim from the role. 3. Operating and Financial Review
3.1 Overview of the Group The Group is a for-profit entity and is primarily involved in the retail industry. Founded in 1972, as an automotive accessories mail order business which evolved into Supercheap Auto, the Group has grown through both organic growth and mergers and acquisitions evolving its principal activities to include:
Supercheap Auto (SCA): retailing of auto parts and accessories, tools and equipment; rebel: retailing of sporting equipment and apparel; BCF: retailing of boating, camping, outdoor equipment, fishing equipment and apparel; and Macpac: retailing of apparel, camping and outdoor equipment.

34 S U P E R R E TA I L G R O U P L I M I T E D A N N U A L R E P O R T 202034 S U P E R R E T A I L G R O U P L I M I T E D A N N U A L R E P O R T 2 0 2 0
DIRECTORS’ REPORT (continued)
3. Operating and Financial Review (continued)
3.2 Review of Financial Condition A number of factors are influencing the financial results of the Group which will need to be considered when reviewing the financial performance of the business. The key factors to be considered are:
COVID-19 Equity Raising Implementation of AASB 16 Leases
(a) Group Results 2020 2019 $m $m Revenue from continuing operations 2,825.2 2,710.4 Segment earnings before interest, taxes, depreciation and amortisation (EBITDA) 328.1 314.7 Segment earnings before interest and taxes (EBIT) 236.1 228.1 Normalised net profit after tax (NPAT) 154.1 152.5 Profit for the period attributable to owners(1) 110.2 139.3 Profit for the period(1) 110.2 139.2 Operating cash flow(1) 610.7 240.9 Earnings per share (EPS) – basic (cents) 55.8 70.6 Dividends per share (cents) 19.5 50.0
(1) Impacted by AASB 16 The Group achieved total sales growth of 4.2 per cent which included like-for-like sales growth across the three largest divisions of SCA, rebel and BCF. Macpac experienced a sales decline of 5.0 per cent and negative like-for-like sales of 9.1 per cent. The 4.2 per cent sales growth for the Group translated into a 4.3 per cent increase in Segment EBITDA, a 3.5 per cent increase in Segment EBIT and a 1.0 per cent increase in normalised net profit after tax. Net profit after tax (NPAT) attributable to owners was $110.2 million compared to $139.3 million in the prior period representing a decrease of 20.9 per cent. Normalised NPAT was $154.1 million compared to $152.5 million in the prior period, an increase of 1.0 per cent. The table below provides the reconciliation to the statutory profit.
Impacts of COVID-19 COVID-19 has had a significant impact on the Group since March 2020. There have been major shifts in customer purchasing behaviour from March, when restrictions were first put in place. Pre-emptive actions were initiated to protect team members, liquidity and profit. These actions have positioned the Group to trade through an extremely volatile period. The Group traded all stores through this period, with the exception of stores that were government mandated for closure including New Zealand stores for seven weeks and three stores in Tasmania for two weeks. The Group was therefore able to provide permanent store-based team members with continuity of wages through this period whilst implementing appropriate safety procedures to protect team members. In July 2020, government mandated restrictions in Victoria have increased with stage four restrictions impacting 94 stores in Melbourne (35 Supercheap Auto; 32 rebel; 14 Macpac; 13 BCF) from week six, all stores continue to operate contact-free Click & Collect. From 12 August, New Zealand government level three restrictions have impacted 21 stores in Auckland (12 Supercheap Auto; 9 Macpac), all stores continue to operate contact-free Click & Collect. Specific actions taken to improve liquidity were announced on 26 March 2020, including the cancelation of the interim dividend of $42.5 million. The Group secured an additional $100.0 million debt funding facility. Project activity was suspended and all discretionary expenditure was curtailed. The Group was well supported by its trade partners who re-scheduled committed inventory purchases and provided extended payment terms. As a result, the trade payables balance at June 2020 is $60.4 million or 22.0 per cent higher than the comparative period. Additionally, rental relief was negotiated with a number of landlords, and approximately $18.0 million of rent remains in arrears at balance date. Rent abatement of $2.4 million was agreed representing approximately 0.9 per cent of the pre AASB 16 Leases expense, which was realised in the profit and loss results. Following a 26.2 per cent decline in Group like-for-like sales in April 2020, like-for-like sales increased by 26.5 per cent in May and 27.7 per cent in June. Through this period customer purchasing patterns have shifted significantly between categories and channels (stores and online). In the fourth quarter of the year, Group online sales increased 102.7 per cent to represent approximately 15 per cent of Group sales. This acceleration of online has tested the omni-retailing strategy, validated its importance and provided the Group with flexibility to quickly respond to customer needs. As a result of a significant decline in sales in April, Macpac Australia qualified for the Australian Government JobKeeper payment. The New Zealand operations of SCA and Macpac were impacted by government mandated store closures for seven weeks. The total of government wage support received in the 2020 financial year was $6.5 million. The New Zealand government wage subsidy covered a 12 week period and ended in June 2020. Jobkeeper subsidy for Macpac Australia is expected to end in September 2020. Equity Raising On 15 June 2020, the Group announced an underwritten one for seven accelerated pro rata non-renounceable entitlement offer to raise equity of approximately $203 million at a fixed price of $7.19 per share. The equity raising comprised an institutional entitlement offer which settled on 24 June 2020 and a retail entitlement offer which settled on 9 July 2020, subsequent to the end of the financial year. The institutional entitlement resulted in cash proceeds net of transaction costs of $157.0 million being received in June. The retail entitlement settled post year end with $43.6 million being received in July 2020. The equity raising has reduced the Group’s leverage and provides flexibility for the business to continue to execute its strategy in a more uncertain period.
35S U P E R R E TA I L G R O U P L I M I T E D A N N U A L R E P O R T 2020S U P E R R E T A I L G R O U P L I M I T E D A N N U A L R E P O R T 2 0 2 0 35 DIRECTORS’ REPORT (continued)
3. Operating and Financial Review (continued) 3.2 Review of Financial Condition (continued) (a) Group results (continued) At the time of the equity raising the Group identified that there was approximately $58.0 million of pre-tax costs to be included in the result for the year that will not be included in the normalised net profit after tax due to their size or nature. The finalised value is $54.1 pre-tax ($38.0 million post-tax). A schedule of these items is outlined below.
2020 2019 $m $m Profit for the period 110.2 139.2 Loss for the period attributable to non-controlling interests - 0.1 Profit for the period attributable to owners of Super Retail Group Limited 110.2 139.3 Lease Accounting Standard – AASB 16 Leases adjustment 5.9 - Pre-AASB 16 116.1 139.3 Wages underpayment and remediation costs(1) 17.1 6.2 Accelerated asset amortisation(1) 9.6 - Business restructuring costs(1) 5.5 3.1 Break costs on interest rate swaps(1) 4.2 - Loss on divestment of investments/Closure of non-core businesses(1) 2.0 1.7 Losses from associates accounted for using the equity method 0.6 2.2 Reversals of provisions previously excluded from normalised NPAT(1) (1.0) - Total of items not included in total segment NPAT 38.0 13.2 Normalised net profit after tax 154.1 152.5
(1) Net of tax While the impact of COVID-19 demonstrated the benefits of the Group’s strategy of building omni-channel capability, it also required actions to be undertaken to ensure agile strategy execution. As a result, there was an acceleration of the amortisation reflecting the revision of useful lives of selected technology assets reflecting the shift to digital strategies. The business restructuring costs relate to a reduction in support office team members. As a result of the equity raising, interest rate swaps were terminated as the underlying debt was repaid. As part of the implementation of the Group’s four core brands business strategy, closure activities were undertaken for Autocrew (in which the Group had a 50 per cent investment) and Infinite Retail businesses. These businesses made a small loss in the 2020 financial year. There was an increase in the estimate for team member underpayments. The movement in this estimate has two elements. The total amount of retail manager and set-up team member underpayments is lower than initially estimated. Offsetting this decrease is the identification of additional team members also impacted by overtime underpayments. (b) Impact of AASB 16 Leases Given the significance of the impact that the new accounting standard AASB 16 Leases has on the financial year and balance sheet at 27 June 2020, the following tables are included to assist with comparison with the prior period. This is non-IFRS information. In accordance with the standard the Group is not required to restate the prior year comparative. AASB 16 Leases impact on Consolidated Income Statement (Non-IFRS)
27-Jun-20 Statutory
$m
27-Jun-20 AASB 16
Adjustment $m
27-Jun-20 Pre-AASB 16
$m
29-Jun-19 Pre-AASB 16
Statutory $m
Revenue from continuing operations 2,825.2 - 2,825.2 2,710.4 Other income from continuing operations 0.2 - 0.2 2.8 Total revenues and other income 2,825.4 - 2,825.4 2,713.2
Expenses Cost of sales of goods (1,555.1) - (1,555.1) (1,488.2) Other expenses from ordinary activities - selling and distribution (371.2) - (371.2) (347.8) - marketing (79.1) - (79.1) (81.9) - occupancy(1) (204.9) (28.3) (233.2) (215.5) - administration(1) (403.6) (0.6) (404.2) (366.4) Net finance costs (55.1) 37.3 (17.8) (21.3) Share of net loss of associates and joint ventures (0.6) - (0.6) (2.6) Total expenses (2,669.6) 8.4 (2,661.2) (2,523.7) Profit before income tax 155.8 8.4 164.2 189.5 Income tax expense (45.6) (2.5) (48.1) (50.3) Profit for the period 110.2 5.9 116.1 139.2 (1) Occupancy expense movement is a reduction in depreciation and amortisation of $176.2m and an increase in rental expense of $204.5m.
Administration expense movement is an increase in loss on sale of property, plant and equipment of $0.6m.

36 S U P E R R E TA I L G R O U P L I M I T E D A N N U A L R E P O R T 202036 S U P E R R E T A I L G R O U P L I M I T E D A N N U A L R E P O R T 2 0 2 0
DIRECTORS’ REPORT (continued)
3. Operating and Financial Review (continued) 3.2 Review of Financial Condition (continued) (b) Impact of AASB 16 Leases (continued) AASB 16 Leases impact on Consolidated Balance Sheet (Non IFRS)
27-Jun-20 Statutory
$m
27-Jun-20 AASB 16
Adjustment $m
27-Jun-20 Pre-AASB 16
$m
29-Jun-19 Pre-AASB 16
Statutory $m
ASSETS Current assets Cash and cash equivalents 285.1 - 285.1 7.5 Trade and other receivables 26.3 1.6 27.9 37.6 Inventories 502.4 - 502.4 560.2 Current tax asset - - - 1.9 Derivative financial instruments - - - 2.8 Total current assets 813.8 1.6 815.4 610.0
Non-current assets Property, plant and equipment 227.8 22.8 250.6 267.9 Right-of-use assets 848.0 (848.0) - - Intangible assets 874.3 0.7 875.0 894.2 Deferred tax assets 4.9 (4.9) - - Other financial assets 6.3 - 6.3 6.9 Total non-current assets 1,961.3 (829.4) 1,131.9 1,169.0 Total assets 2,775.1 (827.8) 1,947.3 1,779.0
LIABILITIES Current liabilities Trade and other payables 442.3 3.1 445.4 362.7 Borrowings - 3.8 3.8 3.4 Lease liabilities 178.4 (178.4) - - Current tax liabilities 17.1 - 17.1 - Provisions 111.1 (0.5) 110.6 107.3 Derivative financial instruments 1.9 - 1.9 6.2 Total current liabilities 750.8 (172.0) 578.8 479.6
Non-current liabilities Trade and other payables - 51.0 51.0 49.5 Borrowings 247.8 0.9 248.7 390.8 Lease liabilities 760.9 (760.9) - - Deferred tax liabilities - 12.0 12.0 23.4 Provisions 24.3 1.1 25.4 19.7 Total non-current liabilities 1,033.0 (695.9) 377.1 483.4 Total liabilities 1,783.8 (867.9) 915.9 963.0
NET ASSETS 991.3 40.1 1,031.4 816.0
EQUITY Contributed equity 698.1 - 698.1 542.3 Reserves 7.5 - 7.5 8.2 Retained earnings 285.7 40.1 325.8 265.9 Capital and reserves attributable to owners of Super Retail Group Limited 991.3 40.1 1,031.4 816.4 Non-controlling interests - - - (0.4)
TOTAL EQUITY 991.3 40.1 1,031.4 816.0
37S U P E R R E TA I L G R O U P L I M I T E D A N N U A L R E P O R T 2020S U P E R R E T A I L G R O U P L I M I T E D A N N U A L R E P O R T 2 0 2 0 37 DIRECTORS’ REPORT (continued)
3. Operating and Financial Review (continued) 3.2 Review of Financial Condition (continued) (b) Impact of AASB 16 Leases (continued) AASB 16 Leases impact on Consolidated Statement of Cash Flows (Non IFRS)
27-Jun-20 Statutory
$m
27-Jun-20 AASB 16
Adjustment $m
27-Jun-20 Pre-AASB 16
$m
29-Jun-19 Pre-AASB 16
Statutory $m
Cash flows from operating activities Receipts from customers (inclusive of goods and services tax) 3,139.0 - 3,139.0 2,995.8 Payments to suppliers and employees (inclusive of goods and services tax) (2,436.6) - (2,436.6) (2,438.0) Rental payments (51.1) (205.8) (256.9) (262.7) Income taxes paid (40.6) - (40.6) (54.2) Net cash inflow from operating activities 610.7 (205.8) 404.9 240.9 Cash flows from investing activities Payments for property, plant and equipment and software (68.4) - (68.4) (89.8) Proceeds from sale of property, plant and equipment 0.6 - 0.6 - Payments for acquisitions of investments in associates/joint ventures - - - (0.7) Acquisition of subsidiary, net of cash acquired (0.1) - (0.1) - Net cash (outflow) from investing activities (67.9) - (67.9) (90.5) Cash flows from financing activities Proceeds from borrowings 963.0 - 963.0 946.0 Repayment of borrowings (1,103.0) - (1,103.0) (986.0) Lease principal payments (171.8) 168.5 (3.3) (3.3) Borrowing costs paid (0.2) - (0.2) (2.4) Interest paid (53.6) 37.3 (16.3) (16.0) Proceeds from issue of shares, net of transaction costs 157.0 - 157.0 - Dividend paid to Company’s shareholders (56.2) - (56.2) (96.7) Net cash (outflow) from financing activities (264.8) 205.8 (59.0) (158.4) Net increase/(decrease) in cash and cash equivalents 278.0 - 278.0 (8.0) Cash and cash equivalents at the beginning of the period 7.5 - 7.5 15.2 Effects of exchange rate changes on cash and cash equivalents (0.4) - (0.4) 0.3 Cash and cash equivalents at the end of the interim period 285.1 - 285.1 7.5

38 S U P E R R E TA I L G R O U P L I M I T E D A N N U A L R E P O R T 202038 S U P E R R E T A I L G R O U P L I M I T E D A N N U A L R E P O R T 2 0 2 0
DIRECTORS’ REPORT (continued)
3. Operating and Financial Review (continued) 3.2 Review of Financial Condition (continued) (b) Impact of AASB 16 Leases (continued) AASB 16 Leases impact on Segment Note
For the period ended 27 June 2020
SCA $m
rebel $m
BCF $m
Macpac $m
Total continuing operations
$m
Inter-segment eliminations/ unallocated
$m
Consolidated $m
Segment Revenue and Other Income External segment revenue 1,119.7 1,038.6 535.0 131.9 2,825.2 - 2,825.2 Other income - 0.1 0.1 - 0.2 - 0.2 Total segment revenue and other income 1,119.7 1,038.7 535.1 131.9 2,825.4 - 2,825.4 Segment EBITDA 242.0 205.1 79.3 25.0 551.4 (18.2) 533.2 Segment depreciation and amortisation (100.4) (94.5) (55.9) (17.3) (268.1) (0.1) (268.2) Segment EBIT result 141.6 110.6 23.4 7.7 283.3 (18.3) 265.0 Net finance costs (12.4) (14.6) (8.4) (1.9) (37.3) (17.8) (55.1) Total segment NPBT 129.2 96.0 15.0 5.8 246.0 (36.1) 209.9 Segment income tax expense (61.7) Normalised NPAT 148.2 Other items not included in the total segment NPAT (38.0) Profit for the period attributable to: Owners of Super Retail Group Limited 110.2 Non-controlling interests - Profit for the period 110.2
Management do not review the operating segments or make strategic decisions utilising this information. It is shown here to provide additional information on the impact of the new lease accounting standard. The implementation of AASB 16 Leases has required operating leases to be recognised as right-of-use assets and lease liabilities, and for lease expenses to be treated as depreciation and interest. Cash lease payments are classified as lease principal payments and interest paid. The impact of the implementation of the standard has a net negative impact on Net Profit After Tax of $5.9m in the year. (c) Division Results
Sales EBITDA EBIT 2020 2019 2020 2019 2020 2019 $m $m $m $m $m $m Supercheap Auto 1,119.7 1,040.6 174.7 156.1 134.9 120.6 rebel 1,038.6 1,016.4 126.6 122.6 96.6 93.8 BCF 535.0 514.6 34.9 40.2 15.7 20.8 Macpac 131.9 138.8 10.1 15.6 7.2 13.0 Unallocated - - (18.2) (19.8) (18.3) (20.1) 2,825.2 2,710.4 328.1 314.7 236.1 228.1
Supercheap Auto Sales increased by 7.6 per cent to $1,119.7 million. Like-for-like sales growth of 6.3 per cent reflected both transaction growth and increased units per sale driving higher average transaction value. Sales declined in April due to government restrictions, but rebounded during the fourth quarter off the back of 33.6 per cent like-for-like sales growth in May and June. Sales growth was strongest in Queensland, Western Australia and South Australia. All Australian States delivered positive like-for-like sales growth. Trading in New Zealand was impacted by the closure of 45 stores for approximately seven weeks due to a government mandated shutdown for COVID-19. Gross margin was slightly lower than prior comparative period and operating expenses as a percentage of sales were lower benefiting from operating leverage due to strong sales. Segment EBITDA increased by 11.9 per cent to $174.7 million and EBITDA margin of 15.6 per cent was 0.6 per cent higher than the prior comparative period. Segment EBIT increased by 11.9 per cent to $134.9 million and EBIT margin of 12.0 per cent was 0.4 per cent higher than the prior comparative period.
39S U P E R R E TA I L G R O U P L I M I T E D A N N U A L R E P O R T 202038 S U P E R R E T A I L G R O U P L I M I T E D A N N U A L R E P O R T 2 0 2 0
DIRECTORS’ REPORT (continued)
3. Operating and Financial Review (continued) 3.2 Review of Financial Condition (continued) (b) Impact of AASB 16 Leases (continued) AASB 16 Leases impact on Segment Note
For the period ended 27 June 2020
SCA $m
rebel $m
BCF $m
Macpac $m
Total continuing operations
$m
Inter-segment eliminations/ unallocated
$m
Consolidated $m
Segment Revenue and Other Income External segment revenue 1,119.7 1,038.6 535.0 131.9 2,825.2 - 2,825.2 Other income - 0.1 0.1 - 0.2 - 0.2 Total segment revenue and other income 1,119.7 1,038.7 535.1 131.9 2,825.4 - 2,825.4 Segment EBITDA 242.0 205.1 79.3 25.0 551.4 (18.2) 533.2 Segment depreciation and amortisation (100.4) (94.5) (55.9) (17.3) (268.1) (0.1) (268.2) Segment EBIT result 141.6 110.6 23.4 7.7 283.3 (18.3) 265.0 Net finance costs (12.4) (14.6) (8.4) (1.9) (37.3) (17.8) (55.1) Total segment NPBT 129.2 96.0 15.0 5.8 246.0 (36.1) 209.9 Segment income tax expense (61.7) Normalised NPAT 148.2 Other items not included in the total segment NPAT (38.0) Profit for the period attributable to: Owners of Super Retail Group Limited 110.2 Non-controlling interests - Profit for the period 110.2
Management do not review the operating segments or make strategic decisions utilising this information. It is shown here to provide additional information on the impact of the new lease accounting standard. The implementation of AASB 16 Leases has required operating leases to be recognised as right-of-use assets and lease liabilities, and for lease expenses to be treated as depreciation and interest. Cash lease payments are classified as lease principal payments and interest paid. The impact of the implementation of the standard has a net negative impact on Net Profit After Tax of $5.9m in the year. (c) Division Results
Sales EBITDA EBIT 2020 2019 2020 2019 2020 2019 $m $m $m $m $m $m Supercheap Auto 1,119.7 1,040.6 174.7 156.1 134.9 120.6 rebel 1,038.6 1,016.4 126.6 122.6 96.6 93.8 BCF 535.0 514.6 34.9 40.2 15.7 20.8 Macpac 131.9 138.8 10.1 15.6 7.2 13.0 Unallocated - - (18.2) (19.8) (18.3) (20.1) 2,825.2 2,710.4 328.1 314.7 236.1 228.1
Supercheap Auto Sales increased by 7.6 per cent to $1,119.7 million. Like-for-like sales growth of 6.3 per cent reflected both transaction growth and increased units per sale driving higher average transaction value. Sales declined in April due to government restrictions, but rebounded during the fourth quarter off the back of 33.6 per cent like-for-like sales growth in May and June. Sales growth was strongest in Queensland, Western Australia and South Australia. All Australian States delivered positive like-for-like sales growth. Trading in New Zealand was impacted by the closure of 45 stores for approximately seven weeks due to a government mandated shutdown for COVID-19. Gross margin was slightly lower than prior comparative period and operating expenses as a percentage of sales were lower benefiting from operating leverage due to strong sales. Segment EBITDA increased by 11.9 per cent to $174.7 million and EBITDA margin of 15.6 per cent was 0.6 per cent higher than the prior comparative period. Segment EBIT increased by 11.9 per cent to $134.9 million and EBIT margin of 12.0 per cent was 0.4 per cent higher than the prior comparative period.
S U P E R R E T A I L G R O U P L I M I T E D A N N U A L R E P O R T 2 0 2 0 39 DIRECTORS’ REPORT (continued)
3. Operating and Financial Review (continued) 3.2 Review of Financial Condition (continued) (c) Division Results (continued) Supercheap Auto (continued) Auto accessories and auto maintenance, which represent approximately three quarters of divisional revenue, were the strongest performing categories. Like-for-like sales growth was achieved in all categories including tools and outdoors. Sales in Supercheap Auto reflected a shift towards essential, DIY auto and household project products during the peak COVID-19 restriction period. Online sales increased by 37 per cent to $82.0 million. Online sales represented seven per cent of Supercheap Auto’s total sales and Click & Collect accounted for over 60 per cent of these online sales. Supercheap Auto active Club Plus membership increased by approximately four per cent during the financial year to 1.71 million members. Sales attributable to club members increased to 40 per cent of total sales. Average club member net promotor score (NPS) increased to 63 from 61 in the prior comparative period. During the 2020 financial year, the business opened four new stores and closed one store. As at the end of the financial year, the business had a total of 281 stores in Australia and 45 stores in New Zealand. rebel Sales increased by 3.3 per cent to $1,038.6 million (excluding Infinite Retail) with like-for-like growth of 2.7 per cent. Like-for-like growth was driven by higher average transaction value. Sales declined in April due to government restrictions, but rebounded during the fourth quarter following 9.1 per cent like-for-like sales growth in May and June. Sales growth in June was impacted by the annual June clearance sale being deferred to July due to a lower in-stock position. Queensland and Western Australia achieved the strongest like-for-like sales growth. Gross margin increased due to lower promotional activity. Operating expenses increased in rebel mostly due to an increased share of group infrastructure as the business fully migrated into group distribution centres and expanded online. The operating expense increase partially offsetting gross margin expansion. Segment EBITDA increased by 3.3 per cent to $126.6 million and EBITDA margin of 12.2 per cent was 0.1 per cent higher than the prior comparative period. Segment EBIT increased by 3.0 per cent to $96.6 million and EBIT margin of 9.3 per cent was 0.1 per cent higher than the prior comparative period. Fitness and hardgoods were the best performing categories as COVID-19 restrictions led to strong demand for home fitness products. Apparel and footwear sales were impacted by lower foot traffic in stores due to COVID-19 but recovered during the fourth quarter as restrictions eased. Online sales increased by 49 per cent to $141.2 million reflecting the strong channel shift during COVID-19. Online sales represented 14 per cent of total rebel sales and Click & Collect accounted for approximately 30 per cent of these online sales. Rebel active club membership increased by approximately 12 per cent during the financial year to 2.88 million members. Sales to club members increased to 66 per cent of rebel sales. Average club member NPS was 55. During the 2020 financial year, rebel closed one store. As at the end of the financial year, rebel had 160 stores. The Infinite Retail business has been permanently discontinued. Infinite Retail reported $15.9 million of sales in the financial year representing a decline of $10.8 million to the prior comparative period. BCF Sales increased by 4.0 per cent to $535.0 million. Like-for-like grew 3.0 per cent driven by both increased transactions and higher average transaction value. Sales declined in April due to government restrictions particularly impacting the Easter holiday period, but rebounded during the fourth quarter following 68.1 per cent like-for-like sales growth in May and June. Western Australia and Queensland were the strongest performing States. Fishing was the strongest performing category. Fishing, camping and apparel all delivered positive like-for-like sales growth while boating sales declined modestly. Gross margin declined compared to the previous period due to competitive intensity, while operating expenses as a percentage of total sales were consistent with the prior year. Segment EBITDA decreased to $34.9 million and EBITDA margin of 6.5 per cent was 1.3 per cent lower than the prior comparative period.

40 S U P E R R E TA I L G R O U P L I M I T E D A N N U A L R E P O R T 202040 S U P E R R E T A I L G R O U P L I M I T E D A N N U A L R E P O R T 2 0 2 0
DIRECTORS’ REPORT (continued)
3. Operating and Financial Review (continued) 3.2 Review of Financial Condition (continued) (c) Division Results (continued) BCF (continued) Segment EBIT decreased to $15.7 million and overall EBIT margin declined from 4.0 per cent in the prior comparative period to 2.9 per cent. The BCF club loyalty program experienced strong growth with active memberships increasing by approximately 6 per cent to 1.54 million. BCF club members increased to 83 per cent of total BCF sales. Average club member NPS increased to 64 from 61 in the prior comparative period. Online sales grew by 33 per cent to $45.3 million reflecting a shift to the online channel due to COVID-19. Online sales represented 9 per cent of total BCF sales and Click & Collect accounted for just over two thirds of these online sales. BCF opened four stores and closed one store during the financial year. As at the end of the financial year, BCF had 139 stores. Macpac Sales fell by 5.0 per cent to $131.9 million and like-for-like sales decreased by 9.1 per cent. In Australia, like-for-like sales decreased by 9.7 per cent as a result of the impact of summer bushfires on peak Christmas trading and the impact of COVID-19 on store foot traffic during the key Easter trading period. In New Zealand, like-for-like sales decreased by 8.2 per cent mainly due to a government mandated seven week store shutdown relating to COVID-19. Sales in both Australia and New Zealand rebounded during the fourth quarter with 7.8 per cent like-for-like sales growth in May and June. Segment EBIT decreased to $7.2 million and segment EBIT margin decreased to 5.5 per cent. The majority of this decline was recorded in the first half of the financial year. Online sales increased by 83 per cent to $22.0 million and represented 17 per cent of Macpac sales. Click & Collect, which was only recently introduced in New Zealand stores, represented approximately 5 per cent of online sales. Macpac club membership increased by approximately 10 per cent to 0.45 million and these club members represented 64 per cent of total Macpac sales. Average club membership NPS was 67 per cent. During the 2020 financial year, Macpac opened three stores and closed one store. As at the end of the financial year, Macpac had 72 stores comprising 62 small format stores and ten Adventure Hub stores. The weaker financial performance of Macpac this year has reduced the amount of headroom when assessing the carrying value of brand name and goodwill intangibles. The value-in-use cash flow analysis is based on the business improving financial performance consistent with the 2019 financial year by financial year 2022 and delivering growth levels consistent with historical levels. Refer to Note 10(b) of the financial statements for details of these assumptions. Group Costs Group costs for the period were $18.3 million, which was $1.8 million lower than the prior comparative period. Group costs included corporate costs of $12.1 million, $3.4 million of un-allocated distribution centre costs and $2.8 million relating to omni-retail development and digital investment.
41S U P E R R E TA I L G R O U P L I M I T E D A N N U A L R E P O R T 2020S U P E R R E T A I L G R O U P L I M I T E D A N N U A L R E P O R T 2 0 2 0 41 DIRECTORS’ REPORT (continued)
3. Operating and Financial Review (continued) 3.2 Review of Financial Condition (continued) (d) Financial Position and Cash Flow
2020 2019 $m $m BALANCE SHEET Trade and other receivables 26.3 37.6 Inventories 502.4 560.2 Trade and other payables (442.3) (412.2) Current tax assets / (liabilities) (17.1) 1.9 Total working capital 69.3 187.5 Cash and cash equivalents 285.1 7.5 Borrowings (247.8) (394.2) Lease liabilities (939.3) - Net debt (902.0) (386.7) Property, plant and equipment 227.8 267.9 Right-of-use assets 848.0 - Intangible assets 874.3 894.2 Other financial assets 6.3 6.9 Derivatives (1.9) (3.4) Provisions (135.4) (127.0) Deferred taxes 4.9 (23.4) NET ASSETS 991.3 816.0 CASH FLOW Net cash inflow from operations 610.7 240.9 Net cash (outflow) from investing (67.9) (90.5) Net cash (outflow) from financing (264.8) (158.4) Net increase / (decrease) in cash 278.0 (8.0) Cash at the beginning of the period 7.5 15.2 Effects of exchange rates on cash (0.4) 0.3 Cash at the end of the period 285.1 7.5
Net cash inflow from operations has increased by $205.8 million due to the change in treatment of rental expenses under AASB 16 Leases and an improvement in working capital. Excluding the impact of AASB 16 Leases, operating cash flow improved by $164.0 million. This improvement was mainly driven by a lower net inventory investment, lease payment deferrals and a shift in tax payments, the benefits of which are expected to reverse in the next financial year. Working capital investment declined $118.2 million due to the significant decline in inventory of $57.8 million which was impacted by both COVID-19 liquidity management measures and the strong increase in sales in May and June. Trade and other payables increased by $79.6 million due a shift in purchases and improved trading terms agreed with major trading partners, rent deferral of $18.0 million on certain leases and reduced tax payments of $13.6 million. Net debt of $902.0 million included $939.3 million of lease liabilities. Excluding lease liabilities, the Group was in a net cash position of $37.3 million an improvement of $424.0 million compared to the prior year. All borrowings were repaid in July 2020. The $100 million ANZ bilateral facility was cancelled in August 2020. The Group has sufficient facilities in place to fund its strategy and remains comfortably within banking covenants. The impact of the implementation of AASB 16 Leases this financial year has reduced net assets by $40.1 million. Net assets for the Group increased by $175.3 million primarily due to the proceeds of the institutional component of the equity raising. Capital expenditure reduced from $90.5 million in 2019 to $67.9 million as liquidity measures were implemented during the COVID-19 trading period. Expenditure included $28.0 million in new and refurbished store fitout and $39.8 million in building omni-retail capabilities, data and analytics, and other information technology projects. (e) Dividends The interim dividend of 22.0 cents was cancelled on 26 March 2020 to preserve cash in view of the uncertain economic outlook at the onset of COVID-19. The Group has declared a 19.5 cents per share fully franked final dividend for the financial year. The amount of the final dividend represents a dividend payout ratio of 55 per cent of second half underlying NPAT totalling a cash payment of $44.0 million.

42 S U P E R R E TA I L G R O U P L I M I T E D A N N U A L R E P O R T 202042 S U P E R R E T A I L G R O U P L I M I T E D A N N U A L R E P O R T 2 0 2 0
DIRECTORS’ REPORT (continued)
3. Operating and Financial Review (continued)
3.2 Review of Financial Condition (continued) (f) Material Business Risks The Group recognises that all of its businesses operate in an environment of change and uncertainty and is committed to managing the potential risks associated with this uncertainty in a continuous, active and systematic way. The Group regularly reviews the possible impact of these risks and seeks to minimise this impact through a commitment to its corporate governance principles and its risk management functions. The business risks faced by the Group that are likely to have a material effect on its financial prospects are listed below, including an overview of the Group’s mitigating actions:
Risks Mitigating Actions (including but not limited to) 1. Pandemic (Impact of COVID-19)
There is continuing uncertainty as to the duration and further impact of the COVID-19 pandemic, including in relation to the timing and nature of government approaches to easing containment measures (including travel restrictions) and the depth and length of the negative impacts on domestic and global economic activity.
The COVID-19 pandemic has altered and may further alter consumer behaviour (for example, it may cause a long-term shift toward online shopping or cause consumers to reduce household spending) and such changes may adversely affect the Group’s financial performance.
The stand-up of the Incident Management Team and Crisis Management Teams;
The pandemic response plan was activated with the help of International SOS;
COVID-19 Safety Plans have been implemented to promote personal hygiene, physical distancing and mental health;
Incident response procedures have been developed to trace ‘close and casual’ contact, for deep cleaning and regulatory reporting;
The securing of an additional $100 million bilateral facility from ANZ which was fully drawn down (this was subsequently repaid on 1 June 2020 as was surplus to requirements and then cancelled on 7 August 2020);
Implementation of a range of countermeasures to ensure ongoing liquidity of the Group including rent abatement and deferral and revised trading terms with larger stock and non-stock suppliers;
Identification and implementation of a range of measures relating to profit protection including the request for team members to utilise existing leave liabilities;
Implementation of contact-free Click & Collect; Shifting merchandising activity to match demand profile; Shifting to digital marketing; Re-aligning marketing investment to demand profile; and Adjusting marketing plans to support online trading.
2. Health and Safety
The Group is committed to the health and safety of its team members, customers and contractors. While a strong emphasis is placed on the implementation of work health and safety standards, the risk of a serious injury or fatality remains possible. The occurrence of such events may have an adverse effect on the productivity, operations and reputation of the Group.
The Group has an established Health and Safety Management System including resources, training and procedures, and this is supported through active reporting of incidents, regular monitoring and assurance activities such as: Group Health and Safety Governance Framework; Health and safety management systems; Continued investment to address health and safety risks,
including mental health; Performance reporting and monitoring; and Health and safety training.
3. Omni-Retail Transformation
The markets in which the Group competes (being automotive parts and accessories and outdoor, sporting and leisure goods) are subject to changing consumer preferences and buying patterns, including as a result of new technologies and offerings from competitors (including online retail experiences), macroeconomic conditions and the impact of events such as COVID-19.
If the Group is not able to develop or access new technologies and anticipate or respond to disruptions in the markets in which it competes, including if there are new or improved products or retail experiences (including online retail experiences) that are, or are perceived to be, superior to those offered by the Group, then the Group may suffer a decrease in the demand for its products, which may have a material adverse impact on the Group’s financial position, performance and prospects.
Investment in analytical insight and customer strategy leadership;
Customer behavioural analytics and insights leveraged to inform campaign activity;
Execution of pricing strategy delivering positive results; IS five year strategy, acceleration of migration to cloud
based services; Click & Collect roll out for Macpac; and Contact-free Click & Collect implementation across all
Australian standalone stores.
43S U P E R R E TA I L G R O U P L I M I T E D A N N U A L R E P O R T 202042 S U P E R R E T A I L G R O U P L I M I T E D A N N U A L R E P O R T 2 0 2 0
DIRECTORS’ REPORT (continued)
3. Operating and Financial Review (continued)
3.2 Review of Financial Condition (continued) (f) Material Business Risks The Group recognises that all of its businesses operate in an environment of change and uncertainty and is committed to managing the potential risks associated with this uncertainty in a continuous, active and systematic way. The Group regularly reviews the possible impact of these risks and seeks to minimise this impact through a commitment to its corporate governance principles and its risk management functions. The business risks faced by the Group that are likely to have a material effect on its financial prospects are listed below, including an overview of the Group’s mitigating actions:
Risks Mitigating Actions (including but not limited to) 1. Pandemic (Impact of COVID-19)
There is continuing uncertainty as to the duration and further impact of the COVID-19 pandemic, including in relation to the timing and nature of government approaches to easing containment measures (including travel restrictions) and the depth and length of the negative impacts on domestic and global economic activity.
The COVID-19 pandemic has altered and may further alter consumer behaviour (for example, it may cause a long-term shift toward online shopping or cause consumers to reduce household spending) and such changes may adversely affect the Group’s financial performance.
The stand-up of the Incident Management Team and Crisis Management Teams;
The pandemic response plan was activated with the help of International SOS;
COVID-19 Safety Plans have been implemented to promote personal hygiene, physical distancing and mental health;
Incident response procedures have been developed to trace ‘close and casual’ contact, for deep cleaning and regulatory reporting;
The securing of an additional $100 million bilateral facility from ANZ which was fully drawn down (this was subsequently repaid on 1 June 2020 as was surplus to requirements and then cancelled on 7 August 2020);
Implementation of a range of countermeasures to ensure ongoing liquidity of the Group including rent abatement and deferral and revised trading terms with larger stock and non-stock suppliers;
Identification and implementation of a range of measures relating to profit protection including the request for team members to utilise existing leave liabilities;
Implementation of contact-free Click & Collect; Shifting merchandising activity to match demand profile; Shifting to digital marketing; Re-aligning marketing investment to demand profile; and Adjusting marketing plans to support online trading.
2. Health and Safety
The Group is committed to the health and safety of its team members, customers and contractors. While a strong emphasis is placed on the implementation of work health and safety standards, the risk of a serious injury or fatality remains possible. The occurrence of such events may have an adverse effect on the productivity, operations and reputation of the Group.
The Group has an established Health and Safety Management System including resources, training and procedures, and this is supported through active reporting of incidents, regular monitoring and assurance activities such as: Group Health and Safety Governance Framework; Health and safety management systems; Continued investment to address health and safety risks,
including mental health; Performance reporting and monitoring; and Health and safety training.
3. Omni-Retail Transformation
The markets in which the Group competes (being automotive parts and accessories and outdoor, sporting and leisure goods) are subject to changing consumer preferences and buying patterns, including as a result of new technologies and offerings from competitors (including online retail experiences), macroeconomic conditions and the impact of events such as COVID-19.
If the Group is not able to develop or access new technologies and anticipate or respond to disruptions in the markets in which it competes, including if there are new or improved products or retail experiences (including online retail experiences) that are, or are perceived to be, superior to those offered by the Group, then the Group may suffer a decrease in the demand for its products, which may have a material adverse impact on the Group’s financial position, performance and prospects.
Investment in analytical insight and customer strategy leadership;
Customer behavioural analytics and insights leveraged to inform campaign activity;
Execution of pricing strategy delivering positive results; IS five year strategy, acceleration of migration to cloud
based services; Click & Collect roll out for Macpac; and Contact-free Click & Collect implementation across all
Australian standalone stores.
S U P E R R E T A I L G R O U P L I M I T E D A N N U A L R E P O R T 2 0 2 0 43 DIRECTORS’ REPORT (continued)
3. Operating and Financial Review (continued)
3.2 Review of Financial Condition (continued) (f) Material Business Risks (continued)
Risks Mitigating Actions (including but not limited to) 4. Competition Intensity
The Group operates in a competitive retail market exhibiting low barriers to entry. The growth and intensity of competition in the increasingly globalised retail market continues which means that the Group faces increased competition from existing competitors and new entrants, particularly into the Australian and New Zealand retail markets. The Group’s performance and profitability could be adversely affected if the actions of competitors or potential competitors become more effective, new competitors enter the market or current economic conditions (including as a result of COVID-19) lead to significant promotional or clearance activity by competitors in financial distress, particularly if the Group is unable to respond effectively to such activity or its response is delayed.
There are a number of initiatives in progress to mitigate this risk including pricing and promotion, supply chain efficiency, e-commerce experience, programmatic marketing and the order management system.
5. Industrial Relations
Failure by an employer to comply with relevant employment laws, awards or enterprise agreements can lead to potential regulatory investigations or enforcement actions or other civil or criminal fines or penalties. As disclosed on 12 February 2019, the Group identified underpayments of overtime and some allowances to retail managers and other staff members, in breach of the applicable award and enterprise agreement, and self-reported the underpayments to the Fair Work Ombudsman. This followed an earlier self-disclosure to the Fair Work Ombudsman of the underpayment of overtime and some allowances to the Group's new store set up employees. Although a significant proportion of the remediation work necessitated by these underpayments has been completed, there are ongoing efforts to contact former team members and liaise with current team members in relation to their entitlements and the Group continues to liaise with the Fair Work Ombudsman in relation to the oversight and investigation of these issues.
Mandatory training for retail managers; Team member management and monitoring processes; Segregation of duties; Supervision and oversight; System access and controls; System validation controls; Formal grievance response tracking; Group remuneration oversight committee; Rostering principles; Register of awards; Automated retail award audits; Reconfiguration of status adjustments; Mutual agreements and approval process; and Implementation of a new time and attendance system.
6. Supply Chain and Inventory Agility for Omni-Retail
Any disruptions, adverse changes or inefficiencies in the Group’s supply chain (including as a result of COVID-19, geopolitical tensions or instability or changes in macroeconomic conditions) could have an adverse impact on the Group’s ability to supply products to its customers. The supply and distribution of the Group’s products (including delivery of products direct to consumers) is reliant on the effective and continued operation of third party logistics providers.
The Group continues to pursue opportunities to reduce the cost of the supply chain and working cost of capital through improved delivery models with major trade partners;
The Group has made substantial investments in an updated supply chain network and supporting information systems to improve agility and meet changing customer expectations;
Monitor last mile fulfilment capacity to meet customer demand;
Monitor supplier impacts; Review local supply options for key lines; Contracts in place with critical vendors; Monitoring and regular contact with critical suppliers; Confirmation of critical supplier; Alternative suppliers; Business continuity plans; and Monitor supplier impacts.

44 S U P E R R E TA I L G R O U P L I M I T E D A N N U A L R E P O R T 202044 S U P E R R E T A I L G R O U P L I M I T E D A N N U A L R E P O R T 2 0 2 0
DIRECTORS’ REPORT (continued)
3. Operating and Financial Review (continued)
3.2 Review of Financial Condition (continued) (f) Material Business Risks (continued)
Risks Mitigating Actions (including but not limited to) 7. Cyber Security and Information Technology
A significant breach of customer, employee, third party or company data could attract media attention, damage the Group’s team members, customer or supplier relationships and reputation and result in lost sales, penalties or litigation.
The Group relies on various information technology systems for its business operations and to maximise efficiency, including through inventory management software, payment systems and online sales platforms. Any sustained and unplanned downtime of these systems, including as a result of cybersecurity attacks, system failures, network disruptions and other malicious or non-malicious incidents, could have a material adverse impact on the Group’s ability to operate its business and consequently its reputation and financial performance.
As a retailer, the protection of customer, team, third party and company data is critical to Super Retail Group’s operations. Controls include: Cyber policy; Cyber Security training; Incident response procedures; Antivirus scanning; Intrusion detection; Security Operations Centre; Hardening of devices; Disaster recovery plan; and Business continuity plan.
Additional controls implemented to mitigate the impacts of COVID-19 include: Refresher for enhanced security awareness training
(phishing); and Active monitoring by Information Security.
8. Business Continuity
Inadequate business continuity capability across the Group could lead to significant business disruption which may have a material adverse impact on the Group’s financial performance and profitability.
Business continuity policy; Brand and Divisional business continuity plans; Disaster recovery plan; Training and awareness program; Enhanced bandwidth to support work from home; and Review IT disaster recovery plans to enhance our offsite
backup and recovery capabilities.
9. Natural Disasters
The Group’s operations (including its ability to open stores), supply chain and profitability could be materially impacted by natural disasters, extreme weather events (such as floods, drought and bushfires), and other catastrophic events outside of the Group’s control. In addition, demand for certain products supplied by the Group could be impacted by levels of consumer participation in activities that may be affected by catastrophic or extreme weather events. There is also a risk that, with time, the frequency and intensity of natural disasters and extreme weather events may increase if climate change accelerates or worsens.
Local store emergency plans; The Group Incident Management Plan; and Monitor weather conditions.
10. Sustainability
The sustainability of the Group’s business involves maintaining and improving a number of practices including identifying issues in the Group’s supply chain (including modern slavery practices), sourcing sustainable materials and packaging, fostering product compliance systems that improve product safety, promoting gender equality and reducing carbon emissions. An actual or perceived failure to adequately address sustainability-related issues may have an adverse impact on the Group’s financial performance, reputation and operations.
The Group’s Sustainability Strategy sets out the commitments we aim to achieve by 2030, with key sustainability indicators such as safety, product, compliance with safety standards and responsible sourcing practices monitored and reported monthly to the Executive Leadership Team and the Board of Directors;
Commitment to reduce our carbon emissions by 20 per cent by 2030 and the Group continues to invest in a range of energy efficiency initiatives across the Brands and supply chain;
Monitoring and managing energy consumption in support offices, distribution centres and the store retail network;
Commitment for gender equality in leadership roles; Product compliance system; and Responsible sourcing framework.
11. Legal, Regulatory and Compliance
The Group is required to maintain compliance with all applicable laws and regulations, including those relating to consumer protection, product quality, ethical sourcing and transport. Failure to comply with these laws and regulations could result in regulatory enforcement action and other claims which could have a material adverse impact on the Group’s reputation, financial performance and profitability. Refer also to the separate risk factor outlined above under ‘Industrial relations’.
Group Compliance Framework; Policies, procedures and compliance systems; Code of Conduct; Whistle-blower hotline; Dedicated in‑house legal team; Monitor changes to regulations and laws; Compliance training modules; and Evaluate any litigation claims and legal proceedings to
assess our risks on a principled basis and endeavour to manage our exposure to such litigation or other legal proceedings effectively.
45S U P E R R E TA I L G R O U P L I M I T E D A N N U A L R E P O R T 202044 S U P E R R E T A I L G R O U P L I M I T E D A N N U A L R E P O R T 2 0 2 0
DIRECTORS’ REPORT (continued)
3. Operating and Financial Review (continued)
3.2 Review of Financial Condition (continued) (f) Material Business Risks (continued)
Risks Mitigating Actions (including but not limited to) 7. Cyber Security and Information Technology
A significant breach of customer, employee, third party or company data could attract media attention, damage the Group’s team members, customer or supplier relationships and reputation and result in lost sales, penalties or litigation.
The Group relies on various information technology systems for its business operations and to maximise efficiency, including through inventory management software, payment systems and online sales platforms. Any sustained and unplanned downtime of these systems, including as a result of cybersecurity attacks, system failures, network disruptions and other malicious or non-malicious incidents, could have a material adverse impact on the Group’s ability to operate its business and consequently its reputation and financial performance.
As a retailer, the protection of customer, team, third party and company data is critical to Super Retail Group’s operations. Controls include: Cyber policy; Cyber Security training; Incident response procedures; Antivirus scanning; Intrusion detection; Security Operations Centre; Hardening of devices; Disaster recovery plan; and Business continuity plan.
Additional controls implemented to mitigate the impacts of COVID-19 include: Refresher for enhanced security awareness training
(phishing); and Active monitoring by Information Security.
8. Business Continuity
Inadequate business continuity capability across the Group could lead to significant business disruption which may have a material adverse impact on the Group’s financial performance and profitability.
Business continuity policy; Brand and Divisional business continuity plans; Disaster recovery plan; Training and awareness program; Enhanced bandwidth to support work from home; and Review IT disaster recovery plans to enhance our offsite
backup and recovery capabilities.
9. Natural Disasters
The Group’s operations (including its ability to open stores), supply chain and profitability could be materially impacted by natural disasters, extreme weather events (such as floods, drought and bushfires), and other catastrophic events outside of the Group’s control. In addition, demand for certain products supplied by the Group could be impacted by levels of consumer participation in activities that may be affected by catastrophic or extreme weather events. There is also a risk that, with time, the frequency and intensity of natural disasters and extreme weather events may increase if climate change accelerates or worsens.
Local store emergency plans; The Group Incident Management Plan; and Monitor weather conditions.
10. Sustainability
The sustainability of the Group’s business involves maintaining and improving a number of practices including identifying issues in the Group’s supply chain (including modern slavery practices), sourcing sustainable materials and packaging, fostering product compliance systems that improve product safety, promoting gender equality and reducing carbon emissions. An actual or perceived failure to adequately address sustainability-related issues may have an adverse impact on the Group’s financial performance, reputation and operations.
The Group’s Sustainability Strategy sets out the commitments we aim to achieve by 2030, with key sustainability indicators such as safety, product, compliance with safety standards and responsible sourcing practices monitored and reported monthly to the Executive Leadership Team and the Board of Directors;
Commitment to reduce our carbon emissions by 20 per cent by 2030 and the Group continues to invest in a range of energy efficiency initiatives across the Brands and supply chain;
Monitoring and managing energy consumption in support offices, distribution centres and the store retail network;
Commitment for gender equality in leadership roles; Product compliance system; and Responsible sourcing framework.
11. Legal, Regulatory and Compliance
The Group is required to maintain compliance with all applicable laws and regulations, including those relating to consumer protection, product quality, ethical sourcing and transport. Failure to comply with these laws and regulations could result in regulatory enforcement action and other claims which could have a material adverse impact on the Group’s reputation, financial performance and profitability. Refer also to the separate risk factor outlined above under ‘Industrial relations’.
Group Compliance Framework; Policies, procedures and compliance systems; Code of Conduct; Whistle-blower hotline; Dedicated in‑house legal team; Monitor changes to regulations and laws; Compliance training modules; and Evaluate any litigation claims and legal proceedings to
assess our risks on a principled basis and endeavour to manage our exposure to such litigation or other legal proceedings effectively.
S U P E R R E T A I L G R O U P L I M I T E D A N N U A L R E P O R T 2 0 2 0 45 DIRECTORS’ REPORT (continued)
3. Operating and Financial Review (continued)
3.2 Review of Financial Condition (continued) (f) Material Business Risks (continued)
Risks Mitigating Actions (including but not limited to) 12. Financial Risk
The Group’s activities expose it to a number of financial risks. The Group adopts a financial risk management program which seeks to minimise potential adverse impacts on the financial performance of the Group.
There are also other changes in the domestic and global macroeconomic environment associated with the events relating to COVID-19 that are beyond the control of the Group and may be exacerbated in an economic recession or downturn. These include, but are not limited to: • changes in inflation, interest rates and foreign currency
exchange rates; • changes in employment levels and labour costs; • changes in aggregate investment and economic output;
and • other changes in economic conditions which may affect
the revenue or costs of the Group.
Financial risks and specific risk management approaches are reported in more detail in the Notes to the Consolidated Financial Statements.
3.3 Dividends Dividends paid or declared by the Group to members since the end of the previous financial year were:
Cents per share Total amount $m
Payment date
Declared and paid during the year: 2019 final fully franked dividend 28.5 56.2 26 September 2019 2020 interim fully franked dividend – cancelled - - n/a Declared after end of year: 2020 final fully franked dividend 19.5 44.0 2 October 2020
3.4 Significant Changes in the State of Affairs There were no significant changes in the Group’s state of affairs during the period other than that described in section 3.5 below. 3.5 Matters Subsequent to the End of the Financial Year On 15 June 2020, the Group announced an underwritten 1 for 7 accelerated pro rata non-renounceable entitlement offer to raise equity of approximately $202.9 million at a fixed price of $7.19 per share. The equity raising comprised an institutional entitlement offer which settled on 24 June 2020 and a retail entitlement offer which settled on 9 July 2020. As a result of the retail entitlement 6,073,995 new shares were issued on 10 July 2020 for proceeds of $43.6 million. The total number of ordinary shares after the equity raising was 225,771,702. On 7 August 2020, the Group cancelled its bilateral liquidity facility with ANZ for $100 million as it had been fully repaid on 1 June 2020 and was surplus to requirements. 3.6 Likely Developments and Future Prospects Information on likely developments in the operations of the Group is set out in this report under the section Review of Financial Condition. Further information on the expected results of operations has not been included in this report because the Directors believe it would be likely to result in unreasonable prejudice to the Group. 3.7 Environmental Regulation The Group’s environmental obligations are regulated under State, Territory, Federal and International Law. The Group has an Environmental Management System in place and a policy of complying with its environmental performance obligations. All material environmental performance obligations are monitored by the Board. No environmental breaches have been notified to the Group during the period ended 27 June 2020.

46 S U P E R R E TA I L G R O U P L I M I T E D A N N U A L R E P O R T 202046 S U P E R R E T A I L G R O U P L I M I T E D A N N U A L R E P O R T 2 0 2 0
DIRECTORS’ REPORT (continued)
4. Non-Audit Services The Company may decide to employ the auditor on assignments additional to their statutory audit duties where the auditor’s expertise and experience with the Company and/or the Group are important. The Board of Directors has considered the position and, in accordance with the advice received from the Audit and Risk Committee, is satisfied that the provision of the non-audit services is compatible with the general standard of independence for auditors imposed by the Corporations Act 2001. The Directors are satisfied that the provision of non-audit services by the auditor, as set out below, did not compromise the auditor independence requirements of the Corporations Act 2001 for the following reasons: all non-audit services have been reviewed by the Audit and Risk Committee to ensure they do not impact the impartiality and
objectivity of the auditor; none of the services undermine the general principles relating to auditor independence as set out in APES 110 Code of Ethics for
Professional Accountants, including reviewing or auditing the auditor’s own work, acting in a management or a decision-making capacity for the Company, acting as advocate for the Company or jointly sharing economic risk and rewards.
During the period the following fees were paid or payable for services provided by the auditor PricewaterhouseCoopers and its network firms for audit and non-audit services provided during the year:
2020 $
2019 $
Audit Services PricewaterhouseCoopers Australian firm: Remuneration for audit and review services 855,736 807,976 Other assurance(1) - 13,407 Total remuneration for audit and review services 855,736 821,383
Taxation and Other Services PricewaterhouseCoopers Australian firm: Taxation Services 258,577 295,484 Equity raise procedures 45,900 - Network firms of PricewaterhouseCoopers Australia: Taxation Services 80,380 56,283 Total remuneration for non-audit services 384,857 351,767
(1) Cyber security review. 5. Corporate Governance Statement The Group’s Corporate Governance Statement sets out the corporate governance framework adopted by the Board of Super Retail Group Limited. This statement is available on the Super Retail Group external website: http://superretailgroup.com.au 6. Proceedings on behalf of the Company No proceedings have been brought or intervened in on behalf of the Company with leave of the Court under section 237 of the Corporations Act 2001. 7. Auditors Independence Declaration A copy of the auditor’s independence declaration as required under section 307C of the Corporations Act 2001 is set out on page 48. 8. Remuneration Report (Audited) The audited remuneration report is set out on pages 50 to 78.
47S U P E R R E TA I L G R O U P L I M I T E D A N N U A L R E P O R T 202046 S U P E R R E T A I L G R O U P L I M I T E D A N N U A L R E P O R T 2 0 2 0
DIRECTORS’ REPORT (continued)
4. Non-Audit Services The Company may decide to employ the auditor on assignments additional to their statutory audit duties where the auditor’s expertise and experience with the Company and/or the Group are important. The Board of Directors has considered the position and, in accordance with the advice received from the Audit and Risk Committee, is satisfied that the provision of the non-audit services is compatible with the general standard of independence for auditors imposed by the Corporations Act 2001. The Directors are satisfied that the provision of non-audit services by the auditor, as set out below, did not compromise the auditor independence requirements of the Corporations Act 2001 for the following reasons: all non-audit services have been reviewed by the Audit and Risk Committee to ensure they do not impact the impartiality and
objectivity of the auditor; none of the services undermine the general principles relating to auditor independence as set out in APES 110 Code of Ethics for
Professional Accountants, including reviewing or auditing the auditor’s own work, acting in a management or a decision-making capacity for the Company, acting as advocate for the Company or jointly sharing economic risk and rewards.
During the period the following fees were paid or payable for services provided by the auditor PricewaterhouseCoopers and its network firms for audit and non-audit services provided during the year:
2020 $
2019 $
Audit Services PricewaterhouseCoopers Australian firm: Remuneration for audit and review services 855,736 807,976 Other assurance(1) - 13,407 Total remuneration for audit and review services 855,736 821,383
Taxation and Other Services PricewaterhouseCoopers Australian firm: Taxation Services 258,577 295,484 Equity raise procedures 45,900 - Network firms of PricewaterhouseCoopers Australia: Taxation Services 80,380 56,283 Total remuneration for non-audit services 384,857 351,767
(1) Cyber security review. 5. Corporate Governance Statement The Group’s Corporate Governance Statement sets out the corporate governance framework adopted by the Board of Super Retail Group Limited. This statement is available on the Super Retail Group external website: http://superretailgroup.com.au 6. Proceedings on behalf of the Company No proceedings have been brought or intervened in on behalf of the Company with leave of the Court under section 237 of the Corporations Act 2001. 7. Auditors Independence Declaration A copy of the auditor’s independence declaration as required under section 307C of the Corporations Act 2001 is set out on page 48. 8. Remuneration Report (Audited) The audited remuneration report is set out on pages 50 to 78.
S U P E R R E T A I L G R O U P L I M I T E D A N N U A L R E P O R T 2 0 2 0 47 DIRECTORS’ REPORT (continued)
9. Rounding of amounts The Company is of a kind referred to in ASIC Corporations (Rounding in Financial/Directors’ Reports) Instrument 2016/191, issued by the Australian Securities and Investments Commission, relating to the ‘rounding off’ of amounts in the Directors’ Report. Amounts in the Directors’ Report have been rounded off in accordance with that instrument to the nearest hundred thousand dollars or in certain cases to the nearest dollar. This report is made in accordance with a resolution of the Directors. S A Pitkin A M Heraghty Chair Group Managing Director and Chief Executive Officer Brisbane 24 August 2020

48 S U P E R R E TA I L G R O U P L I M I T E D A N N U A L R E P O R T 202048 S U P E R R E T A I L G R O U P L I M I T E D A N N U A L R E P O R T 2 0 2 0
PricewaterhouseCoopers, ABN 52 780 433 757 480 Queen Street, BRISBANE QLD 4000, GPO Box 150, BRISBANE QLD 4001 T: +61 7 3257 5000, F: +61 7 3257 5999, www.pwc.com.au
Liability limited by a scheme approved under Professional Standards Legislation.
Auditor’s Independence Declaration As lead auditor for the audit of Super Retail Group Limited for the year ended 27 June 2020, I declare that to the best of my knowledge and belief, there have been:
(a) no contraventions of the auditor independence requirements of the Corporations Act 2001 in relation to the audit; and
(b) no contraventions of any applicable code of professional conduct in relation to the audit.
This declaration is in respect of Super Retail Group Limited and the entities it controlled during the period.
Paddy Carney Brisbane Partner PricewaterhouseCoopers
24 August 2020
49S U P E R R E TA I L G R O U P L I M I T E D A N N U A L R E P O R T 2020
Remuneration Report Audited F O R T H E Y E A R E N D E D 2 7 J U N E 2 0 2 0
Super Retail Group Limited ABN: 81 108 676 204 ASX Code: SUL
2019 – 2020
48 S U P E R R E T A I L G R O U P L I M I T E D A N N U A L R E P O R T 2 0 2 0
PricewaterhouseCoopers, ABN 52 780 433 757 480 Queen Street, BRISBANE QLD 4000, GPO Box 150, BRISBANE QLD 4001 T: +61 7 3257 5000, F: +61 7 3257 5999, www.pwc.com.au
Liability limited by a scheme approved under Professional Standards Legislation.
Auditor’s Independence Declaration As lead auditor for the audit of Super Retail Group Limited for the year ended 27 June 2020, I declare that to the best of my knowledge and belief, there have been:
(a) no contraventions of the auditor independence requirements of the Corporations Act 2001 in relation to the audit; and
(b) no contraventions of any applicable code of professional conduct in relation to the audit.
This declaration is in respect of Super Retail Group Limited and the entities it controlled during the period.
Paddy Carney Brisbane Partner PricewaterhouseCoopers
24 August 2020

50 S U P E R R E TA I L G R O U P L I M I T E D A N N U A L R E P O R T 2020
Remuneration Report (Audited) FOR THE YEAR
ENDED 27 JUNE 2020
50 S U P E R R E T A I L G R O U P L I M I T E D A N N U A L R E P O R T 2 0 2 0
CONTENTS Section 1 Summary Section 2 Key Management Personnel Section 3 FY20 Executive Remuneration Overview Section 4 FY20 Performance and Remuneration Outcomes Section 5 Detail of the FY20 Executive Total Reward Framework Section 6 Executive Remuneration Changes for FY21 Section 7 Non-Executive Directors’ Remuneration Arrangements Section 8 Executive KMP Remuneration Outcomes for FY20 Section 9 Remuneration Governance
Introduction The Directors of Super Retail Group present this Remuneration Report for the 52-week period ended 27 June 2020. The Remuneration Report outlines the Group’s remuneration philosophy and practices, explains how the Group’s 2020 performance has driven executive remuneration outcomes, and provides the details of specific remuneration arrangements that apply to Key Management Personnel (KMP) in accordance with section 300A of the Corporations Act 2001 (Cth) (Corporations Act) and applicable accounting standards.
REMUNERATION REPORT APPROVAL AT 2019 ANNUAL GENERAL MEETING (AGM)
Our Remuneration Report for the 2019 financial year received positive shareholder support at the 2019 AGM, with 95.3 per cent of votes in favour of adoption.
SECTION 1 Summary
GROUP FINANCIAL PERFORMANCE
Overall, the Group delivered a solid trading performance, particularly in light of the impact of the COVID-19 pandemic. After a challenging first half, the Group’s omni-retail strategy has enabled the business to adapt quickly to changing consumer behaviour and deliver a strong second-half performance. This has resulted in a full-year result that includes:
Total Group sales of $2.83 billion - an increase of 4.2 per cent
Segment EBITDA of $328.1 million - an increase of 4.3 per cent
Segment EBIT of $236.1 million - an increase of 3.5 per cent
Normalised NPAT of $154.1 million - an increase of 1 per cent
Cash flow from operating activities increased $164.0 million compared to prior corresponding period.
Segment results exclude pre-tax abnormal items of $54.1 million that include remediation of prior years’ team member underpayments, the exit of certain non-core businesses, support office restructure costs, accelerated amortisation of certain assets and termination of interest rate swaps.
Segment results exclude the impact of AASB 16 Leases to enable a meaningful comparison with the prior corresponding period.
IMPACT OF COVID-19
The Group continued to trade throughout the period of government restrictions, with the exception of stores that were mandated for closure by government including New Zealand and three stores in Tasmania.
COVID-19 has had a significant impact on the Group. Pre-emptive actions were initiated to protect the health and safety of team members and customers.
In addition, a number of measures were taken to protect liquidity and profit, including the cancellation of the interim dividend of $42.5 million and the securing of an additional $100 million liquidity facility. The Group was also well supported by trade partners who rescheduled committed inventory purchases and extended payment terms. These actions have positioned the Group to trade through an extremely volatile period.
The Group’s omni-retail capability enabled it to respond quickly to the changing environment, which led to elevated levels of online demand.
Keeping stores open while pivoting to meet increased demand in online sales channels enabled the Group to successfully navigate an extremely challenging period and deliver 44 per cent annual online sales growth.
51S U P E R R E TA I L G R O U P L I M I T E D A N N U A L R E P O R T 2020
Remuneration Report (Audited) FOR THE YEAR
ENDED 27 JUNE 2020
50 S U P E R R E T A I L G R O U P L I M I T E D A N N U A L R E P O R T 2 0 2 0
CONTENTS Section 1 Summary Section 2 Key Management Personnel Section 3 FY20 Executive Remuneration Overview Section 4 FY20 Performance and Remuneration Outcomes Section 5 Detail of the FY20 Executive Total Reward Framework Section 6 Executive Remuneration Changes for FY21 Section 7 Non-Executive Directors’ Remuneration Arrangements Section 8 Executive KMP Remuneration Outcomes for FY20 Section 9 Remuneration Governance
Introduction The Directors of Super Retail Group present this Remuneration Report for the 52-week period ended 27 June 2020. The Remuneration Report outlines the Group’s remuneration philosophy and practices, explains how the Group’s 2020 performance has driven executive remuneration outcomes, and provides the details of specific remuneration arrangements that apply to Key Management Personnel (KMP) in accordance with section 300A of the Corporations Act 2001 (Cth) (Corporations Act) and applicable accounting standards.
REMUNERATION REPORT APPROVAL AT 2019 ANNUAL GENERAL MEETING (AGM)
Our Remuneration Report for the 2019 financial year received positive shareholder support at the 2019 AGM, with 95.3 per cent of votes in favour of adoption.
SECTION 1 Summary
GROUP FINANCIAL PERFORMANCE
Overall, the Group delivered a solid trading performance, particularly in light of the impact of the COVID-19 pandemic. After a challenging first half, the Group’s omni-retail strategy has enabled the business to adapt quickly to changing consumer behaviour and deliver a strong second-half performance. This has resulted in a full-year result that includes:
Total Group sales of $2.83 billion - an increase of 4.2 per cent
Segment EBITDA of $328.1 million - an increase of 4.3 per cent
Segment EBIT of $236.1 million - an increase of 3.5 per cent
Normalised NPAT of $154.1 million - an increase of 1 per cent
Cash flow from operating activities increased $164.0 million compared to prior corresponding period.
Segment results exclude pre-tax abnormal items of $54.1 million that include remediation of prior years’ team member underpayments, the exit of certain non-core businesses, support office restructure costs, accelerated amortisation of certain assets and termination of interest rate swaps.
Segment results exclude the impact of AASB 16 Leases to enable a meaningful comparison with the prior corresponding period.
IMPACT OF COVID-19
The Group continued to trade throughout the period of government restrictions, with the exception of stores that were mandated for closure by government including New Zealand and three stores in Tasmania.
COVID-19 has had a significant impact on the Group. Pre-emptive actions were initiated to protect the health and safety of team members and customers.
In addition, a number of measures were taken to protect liquidity and profit, including the cancellation of the interim dividend of $42.5 million and the securing of an additional $100 million liquidity facility. The Group was also well supported by trade partners who rescheduled committed inventory purchases and extended payment terms. These actions have positioned the Group to trade through an extremely volatile period.
The Group’s omni-retail capability enabled it to respond quickly to the changing environment, which led to elevated levels of online demand.
Keeping stores open while pivoting to meet increased demand in online sales channels enabled the Group to successfully navigate an extremely challenging period and deliver 44 per cent annual online sales growth.
Remuneration Report (Audited) FOR THE YEAR
ENDED 27 JUNE 2020
S U P E R R E T A I L G R O U P L I M I T E D A N N U A L R E P O R T 2 0 2 0 51
Group sales rebounded strongly during the fourth quarter as the easing of COVID-19 restrictions led to a significant uplift in domestic tourism and travel, personal fitness and outdoor leisure activities. Following a 26.2 per cent decline in monthly like-for-like sales in April (versus prior corresponding period) during peak COVID-19 lockdown, monthly like-for like sales increased by 26.5 per cent in May and 27.7 per cent in June.
Following a successful $203 million equity raising that was completed in July, the Group has a strong balance sheet, with no net debt (excluding lease liabilities) and is well positioned to execute its omni-retail strategy and pursue organic market share growth opportunities.
Remuneration outcomes recognise the impact of COVID-19 on the business and the interests of stakeholders.
EXECUTIVE SHORT-TERM INCENTIVE (STI)
The Group’s financial performance has resulted in the opening of the normalised PBT performance gate to the STI Scheme. The Executive KMP STI achievement, as detailed in Section 4 of this report, was commensurate with the performance of the Company during the FY20 year. The Board considered the application of discretion as a result of the COVID-19 pandemic, with reference to the guidance issued by ASIC.(1)
Recognising the impact of COVID-19 on a range of the Group’s stakeholders, the Board applied a COVID-19 adjustment and moderated the in-year STI outcomes downward for Executive KMP.
In considering COVID-19’s impact on performance, the Board sought to moderate and contextualise the strong Group performance by considering adverse impacts on stakeholders, and in particular:
The cancellation of the interim dividend of $42.5 million on 26 March 2020.
The Group had two businesses qualify for government wage support during March to June of $6.5 million. Both Supercheap Auto and Macpac qualified for the ‘wage subsidy’ in New Zealand and Macpac qualified for the JobKeeper allowance in Australia. The effect of the government support was that $1.5 million subsidised store wages and $5.0 million paid team members who were impacted by government mandated restrictions.
The impact on team members with a 13 per cent reduction of Support Office team members, and temporary reduction in available hours for casual team members during April and May.
Further, the Board took into account the unprecedented challenge and complexity faced by management in achieving many positive outcomes, including in particular:
During FY20 Total Shareholder Return for the Group for the 52-week period ended 27 June 2020 of +2.9 per cent outperformed peers in the index (+1.7 per cent Consumer Discretionary sector).
Normalised EPS at 78.0 cents was an increase of one per cent on the prior year of 77.3 cents. EPS was slightly diluted (by 0.1 cents) due to the capital raising.
No reductions in permanent store-based team member employment, together with the full payment of any team member earned incentive during the period.
Accordingly, the Board determined management’s STI outcomes be partially reduced and deferred. The Board followed a rigorous process to assess impacts to stakeholders and the approach was externally reviewed. This outcome is a fair recognition of both the adverse impacts on stakeholders and the positive impacts of good management execution delivering strong company performance in the period.
The COVID-19 adjustment moderates the STI outcomes by applying a 7.4 percentage point reduction to the raw STI score and requiring a further 7.4 percentage points of STI outcome to be
deferred into performance rights for a 12-month period. The quantum of the adjustment was determined by the Board, using a sliding scale based on the performance of the PBT measures’ distance from target. An above target result for PBT resulted in the adjustment of 14.8 percentage points.
Additionally, as communicated in 2019, in FY20 the STI award for all Executive KMP will be paid 80 per cent cash and 20 per cent equity, which will vest 10 per cent in September 2021, and 10 per cent in September 2022. This supports an increase in executive shareholding, enhances risk management, executive retention, and reflects broader market practice.
FRONTLINE TEAM THANK YOU
Super Retail Group’s long-held belief that our frontline leaders and their teams are a significant business advantage has been strengthened during the year. We have asked a lot from teams in stores and distribution centres during the bushfire and COVID-19 events. For many, this has been a stressful and challenging period. Nevertheless, they have maintained a strong focus on team wellbeing and delivered for our customers.
In recognition of this significant contribution the Group will pay these frontline leaders and their teams a one-off thank you payment of up to $1,000.
LONG-TERM INCENTIVE (LTI) The FY18 LTI grant reached the end of its three-year performance period on 27 June 2020. Only the threshold Return on Capital (ROC) hurdle was achieved. As a result 38.3 per cent of the total FY18 grant will vest. For further detail, refer to Section 4.
Following approval at the 2019 AGM, a one-off co-investment grant of Performance Rights was awarded to Mr Heraghty, to the value of $400,000 (vesting over a three to five-year period).
(1) 12 June 2020, ASIC Guidance Note: Board oversight of executive variable pay decisions during the COVID-19 pandemic.

52 S U P E R R E TA I L G R O U P L I M I T E D A N N U A L R E P O R T 2020
Remuneration Report (Audited) FOR THE YEAR
ENDED 27 JUNE 2020
52 S U P E R R E T A I L G R O U P L I M I T E D A N N U A L R E P O R T 2 0 2 0
EXECUTIVE REMUNERATION FRAMEWORK CHANGES FOR FY21
The Group will revise the Executive total reward framework and opportunity in response to the two-year business plan formulated in the context of the COVID-19 pandemic. The revisions seek to align the reward structure with the measurements of performance set by the Board for the medium term.
It is planned to issue one grant of performance share rights for FY21 and FY22 and set the metrics by reference to the two-year business plan.
It is expected that the metrics setting for the LTI plan and timing of grants will revert to prior practice in FY23.
GROUP MANAGING DIRECTOR AND CHIEF EXECUTIVE OFFICER
Mr Heraghty’s remuneration was set by the Board in accordance with the Group’s Remuneration Framework upon his commencement on 20 February 2019.
There will be a moderate increase to Mr Heraghty’s base salary in FY21. Mr Heraghty will be eligible to participate in the Group’s revised STI and LTI schemes for FY21 and FY22. The LTI grant will be subject to shareholder approval at the 2020 AGM.
For further detail refer to Section 6.
NON-EXECUTIVE DIRECTOR (NED) FEES
There was no change to NED fees (including Committee fees) in FY20.
Subject to shareholder approval at the 2020 AGM, an increase to the NED fee pool is proposed for FY21 to accommodate the addition of a seventh NED as well as future NED fee and Committee fee increases.
There will be no change to the base fees for NEDs in FY21.
53S U P E R R E TA I L G R O U P L I M I T E D A N N U A L R E P O R T 2020
Remuneration Report (Audited) FOR THE YEAR
ENDED 27 JUNE 2020
52 S U P E R R E T A I L G R O U P L I M I T E D A N N U A L R E P O R T 2 0 2 0
EXECUTIVE REMUNERATION FRAMEWORK CHANGES FOR FY21
The Group will revise the Executive total reward framework and opportunity in response to the two-year business plan formulated in the context of the COVID-19 pandemic. The revisions seek to align the reward structure with the measurements of performance set by the Board for the medium term.
It is planned to issue one grant of performance share rights for FY21 and FY22 and set the metrics by reference to the two-year business plan.
It is expected that the metrics setting for the LTI plan and timing of grants will revert to prior practice in FY23.
GROUP MANAGING DIRECTOR AND CHIEF EXECUTIVE OFFICER
Mr Heraghty’s remuneration was set by the Board in accordance with the Group’s Remuneration Framework upon his commencement on 20 February 2019.
There will be a moderate increase to Mr Heraghty’s base salary in FY21. Mr Heraghty will be eligible to participate in the Group’s revised STI and LTI schemes for FY21 and FY22. The LTI grant will be subject to shareholder approval at the 2020 AGM.
For further detail refer to Section 6.
NON-EXECUTIVE DIRECTOR (NED) FEES
There was no change to NED fees (including Committee fees) in FY20.
Subject to shareholder approval at the 2020 AGM, an increase to the NED fee pool is proposed for FY21 to accommodate the addition of a seventh NED as well as future NED fee and Committee fee increases.
There will be no change to the base fees for NEDs in FY21.
Remuneration Report (Audited) FOR THE YEAR
ENDED 27 JUNE 2020
S U P E R R E T A I L G R O U P L I M I T E D A N N U A L R E P O R T 2 0 2 0 53
SECTION 2 Key Management Personnel
The names and titles of the Group’s KMP, being those persons having authority and responsibility for planning, directing and controlling the activities of the entity, are set out below.
Name Position Term as KMP
Chair S A Pitkin Chair and Independent Non-Executive Director 1 July 2010
Non-Executive Directors
R A Rowe Non-Executive Director 8 April 2004
D J Eilert Independent Non-Executive Director 21 October 2015
H L Mowlem Independent Non-Executive Director 13 June 2017
P D Everingham Independent Non-Executive Director 19 December 2017
S A Chaplain Independent Non-Executive Director 31 March 2020
G T Dunne Independent Non-Executive Director 31 March 2020
Former Non-Executive Directors
L K Inman Independent Non-Executive Director 21 October 2015 to 22 October 2019
Managing Director and CEO
A M Heraghty(1) Group Managing Director and Chief Executive Officer (Group MD and CEO)
27 April 2015
Executives
D J Burns Chief Financial Officer 3 December 2012
G S Williams Managing Director - rebel 2 April 2019
A Brandon Chief Executive Officer - Macpac 1 May 2019
B L Ward(2) Managing Director - Supercheap Auto 1 August 2019
P A Bradshaw Managing Director - BCF 25 November 2019
Former Executives
C D Wilesmith Managing Director - Supercheap Auto 29 June 2014 to 31 July 2019
(1) A M Heraghty commenced in the role of Group MD & CEO on 20 February 2019. (2) B L Ward commenced with the Group on 29 July 2019.
B L Ward, Managing Director - Supercheap Auto, joined the business in August 2019. Mr Ward is an experienced retail executive with almost 25 years’ experience and was previously Managing Director, Global Business Coordination for ALDI Supermarkets based in Germany.
P A Bradshaw, Managing Director - BCF, joined the business in November 2019. Mr Bradshaw was previously Chief Store Operations Officer at Coles Group and brings more than 30 years of global retailing experience to the Group.

54 S U P E R R E TA I L G R O U P L I M I T E D A N N U A L R E P O R T 2020
Remuneration Report (Audited) FOR THE YEAR
ENDED 27 JUNE 2020
54 S U P E R R E T A I L G R O U P L I M I T E D A N N U A L R E P O R T 2 0 2 0
SECTION 3 FY20 Executive Remuneration Overview Our philosophy is to provide flexible and market competitive remuneration arrangements that reflect the performance of the Group and its businesses.
The key elements are:
Market competitive
Aligned to shareholders’ sustainable
value
Pay-for- performance environment -specific and measurable
Equitable and consistent across the
group
Recognise performance
and experience
Aligned to values and prudent risk
management
FY20 EXECUTIVE REMUNERATION FRAMEWORK
The Group MD and CEO, together with the other Executive KMP, are remunerated under a Total Reward Framework. The diagram below summarises the FY20 remuneration framework over the period for which FY20 remuneration is delivered and when the awards may vest.
YEAR 1 YEAR 2 YEAR 3 YEAR 4
FIXED REMUNERATION Base pay, superannuation, non-
monetary benefits
STI Received as 80 per cent cash, 20 per cent deferral; Measured across a Balanced Scorecard including Group PBT; Divisional
EBIT; Working Capital efficiency; individual performance targets
LTI Performance Rights, granted in year one and subject to service and
performance conditions for three and four years from grant date. Earnings per share (EPS); Return on Capital (ROC).
FY20 EXECUTIVE REMUNERATION OBJECTIVES
The Total Reward Framework is designed to appropriately reward executives for their contribution to the success of the Group by aligning all remuneration elements to the delivery of both short-term milestones and long-term sustainable value to the Group’s shareholders. Further detail about the FY20 Executive Total Reward Framework is provided in Section 5 of this report.
50 per cent of deferred STI award to vest
50 per cent of deferred STI award to vest
50 per cent of rights vest
50 per cent of rights vest
55S U P E R R E TA I L G R O U P L I M I T E D A N N U A L R E P O R T 2020
Remuneration Report (Audited) FOR THE YEAR
ENDED 27 JUNE 2020
54 S U P E R R E T A I L G R O U P L I M I T E D A N N U A L R E P O R T 2 0 2 0
SECTION 3 FY20 Executive Remuneration Overview Our philosophy is to provide flexible and market competitive remuneration arrangements that reflect the performance of the Group and its businesses.
The key elements are:
Market competitive
Aligned to shareholders’ sustainable
value
Pay-for- performance environment -specific and measurable
Equitable and consistent across the
group
Recognise performance
and experience
Aligned to values and prudent risk
management
FY20 EXECUTIVE REMUNERATION FRAMEWORK
The Group MD and CEO, together with the other Executive KMP, are remunerated under a Total Reward Framework. The diagram below summarises the FY20 remuneration framework over the period for which FY20 remuneration is delivered and when the awards may vest.
YEAR 1 YEAR 2 YEAR 3 YEAR 4
FIXED REMUNERATION Base pay, superannuation, non-
monetary benefits
STI Received as 80 per cent cash, 20 per cent deferral; Measured across a Balanced Scorecard including Group PBT; Divisional
EBIT; Working Capital efficiency; individual performance targets
LTI Performance Rights, granted in year one and subject to service and
performance conditions for three and four years from grant date. Earnings per share (EPS); Return on Capital (ROC).
FY20 EXECUTIVE REMUNERATION OBJECTIVES
The Total Reward Framework is designed to appropriately reward executives for their contribution to the success of the Group by aligning all remuneration elements to the delivery of both short-term milestones and long-term sustainable value to the Group’s shareholders. Further detail about the FY20 Executive Total Reward Framework is provided in Section 5 of this report.
50 per cent of deferred STI award to vest
50 per cent of deferred STI award to vest
50 per cent of rights vest
50 per cent of rights vest
Remuneration Report (Audited) FOR THE YEAR
ENDED 27 JUNE 2020
S U P E R R E T A I L G R O U P L I M I T E D A N N U A L R E P O R T 2 0 2 0 55
Our Remuneration Objectives
Attract, motivate and retain executive talent.
Differentiate reward to drive performance, including values and behaviours.
Alignment to shareholder interests and value creation through equity components granted as part of long-term incentives or through the deferral of cash based short-term incentives into equity.
An appropriate balance of fixed and ‘at-risk’ components focused on long-term strategy and short-term milestones.
ALIGNMENT OF OBJECTIVES TO OUR REMUNERATION FRAMEWORK
Base Salary Package Short Term Incentive (STI) Long Term Incentive (LTI) Remuneration Mix
Strategic Intent and Market Positioning
Positioned at the median compared to relevant market-based data (similarly sized S&P/ ASX200 companies), taking into consideration expertise and performance in the role.
To achieve Board approved targets, in support of the execution of the Group’s strategy.
Total target cash, (base salary package and STI combined) is intended to be positioned within the third quartile of relevant benchmark comparisons.
To reward Executive KMP for sustainable long-term growth aligned to shareholders interests.
Combined, base salary package, STI and LTI are intended to be positioned within the third quartile of relevant benchmark comparisons.
‘At-risk’ remuneration consistent with the broader market.
Deferral of STI into equity extends the timeframe for receipt of variable reward outcomes.
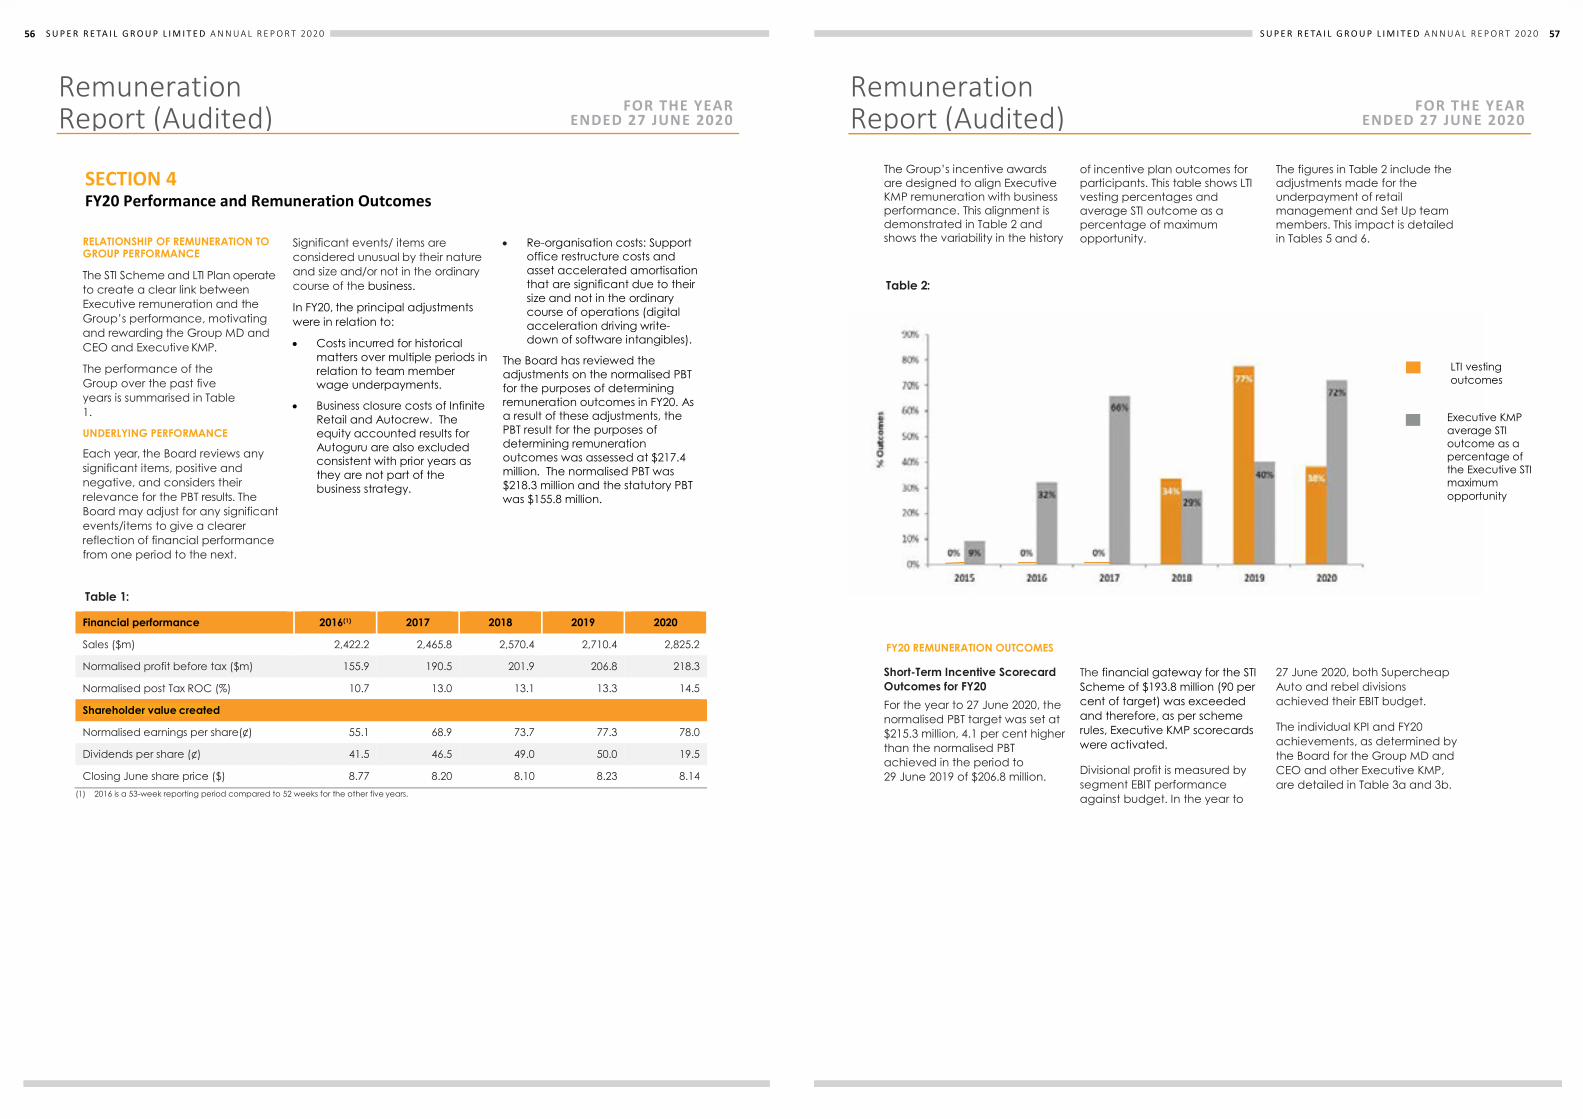
56 S U P E R R E TA I L G R O U P L I M I T E D A N N U A L R E P O R T 2020
Remuneration Report (Audited) FOR THE YEAR
ENDED 27 JUNE 2020
56 S U P E R R E T A I L G R O U P L I M I T E D A N N U A L R E P O R T 2 0 2 0
SECTION 4 FY20 Performance and Remuneration Outcomes
RELATIONSHIP OF REMUNERATION TO GROUP PERFORMANCE
The STI Scheme and LTI Plan operate to create a clear link between Executive remuneration and the Group’s performance, motivating and rewarding the Group MD and CEO and Executive KMP.
The performance of the Group over the past five years is summarised in Table 1.
UNDERLYING PERFORMANCE
Each year, the Board reviews any significant items, positive and negative, and considers their relevance for the PBT results. The Board may adjust for any significant events/items to give a clearer reflection of financial performance from one period to the next.
Significant events/ items are considered unusual by their nature and size and/or not in the ordinary course of the business.
In FY20, the principal adjustments were in relation to:
Costs incurred for historical matters over multiple periods in relation to team member wage underpayments.
Business closure costs of Infinite Retail and Autocrew. The equity accounted results for Autoguru are also excluded consistent with prior years as they are not part of the business strategy.
Re-organisation costs: Support office restructure costs and asset accelerated amortisation that are significant due to their size and not in the ordinary course of operations (digital acceleration driving write-down of software intangibles).
The Board has reviewed the adjustments on the normalised PBT for the purposes of determining remuneration outcomes in FY20. As a result of these adjustments, the PBT result for the purposes of determining remuneration outcomes was assessed at $217.4 million. The normalised PBT was $218.3 million and the statutory PBT was $155.8 million.
Table 1:
Financial performance 2016(1) 2017 2018 2019 2020
Sales ($m) 2,422.2 2,465.8 2,570.4 2,710.4 2,825.2
Normalised profit before tax ($m) 155.9 190.5 201.9 206.8 218.3
Normalised post Tax ROC (%) 10.7 13.0 13.1 13.3 14.5
Shareholder value created Normalised earnings per share(¢) 55.1 68.9 73.7 77.3 78.0
Dividends per share (¢) 41.5 46.5 49.0 50.0 19.5
Closing June share price ($) 8.77 8.20 8.10 8.23 8.14 (1) 2016 is a 53-week reporting period compared to 52 weeks for the other five years.
57S U P E R R E TA I L G R O U P L I M I T E D A N N U A L R E P O R T 2020
Remuneration Report (Audited) FOR THE YEAR
ENDED 27 JUNE 2020
56 S U P E R R E T A I L G R O U P L I M I T E D A N N U A L R E P O R T 2 0 2 0
SECTION 4 FY20 Performance and Remuneration Outcomes
RELATIONSHIP OF REMUNERATION TO GROUP PERFORMANCE
The STI Scheme and LTI Plan operate to create a clear link between Executive remuneration and the Group’s performance, motivating and rewarding the Group MD and CEO and Executive KMP.
The performance of the Group over the past five years is summarised in Table 1.
UNDERLYING PERFORMANCE
Each year, the Board reviews any significant items, positive and negative, and considers their relevance for the PBT results. The Board may adjust for any significant events/items to give a clearer reflection of financial performance from one period to the next.
Significant events/ items are considered unusual by their nature and size and/or not in the ordinary course of the business.
In FY20, the principal adjustments were in relation to:
Costs incurred for historical matters over multiple periods in relation to team member wage underpayments.
Business closure costs of Infinite Retail and Autocrew. The equity accounted results for Autoguru are also excluded consistent with prior years as they are not part of the business strategy.
Re-organisation costs: Support office restructure costs and asset accelerated amortisation that are significant due to their size and not in the ordinary course of operations (digital acceleration driving write-down of software intangibles).
The Board has reviewed the adjustments on the normalised PBT for the purposes of determining remuneration outcomes in FY20. As a result of these adjustments, the PBT result for the purposes of determining remuneration outcomes was assessed at $217.4 million. The normalised PBT was $218.3 million and the statutory PBT was $155.8 million.
Table 1:
Financial performance 2016(1) 2017 2018 2019 2020
Sales ($m) 2,422.2 2,465.8 2,570.4 2,710.4 2,825.2
Normalised profit before tax ($m) 155.9 190.5 201.9 206.8 218.3
Normalised post Tax ROC (%) 10.7 13.0 13.1 13.3 14.5
Shareholder value created Normalised earnings per share(¢) 55.1 68.9 73.7 77.3 78.0
Dividends per share (¢) 41.5 46.5 49.0 50.0 19.5
Closing June share price ($) 8.77 8.20 8.10 8.23 8.14 (1) 2016 is a 53-week reporting period compared to 52 weeks for the other five years.
Remuneration Report (Audited) FOR THE YEAR
ENDED 27 JUNE 2020
S U P E R R E T A I L G R O U P L I M I T E D A N N U A L R E P O R T 2 0 2 0 57
The Group’s incentive awards are designed to align Executive KMP remuneration with business performance. This alignment is demonstrated in Table 2 and shows the variability in the history
of incentive plan outcomes for participants. This table shows LTI vesting percentages and average STI outcome as a percentage of maximum opportunity.
The figures in Table 2 include the adjustments made for the underpayment of retail management and Set Up team members. This impact is detailed in Tables 5 and 6.
Table 2:
FY20 REMUNERATION OUTCOMES
Short-Term Incentive Scorecard Outcomes for FY20 For the year to 27 June 2020, the normalised PBT target was set at $215.3 million, 4.1 per cent higher than the normalised PBT achieved in the period to 29 June 2019 of $206.8 million.
The financial gateway for the STI Scheme of $193.8 million (90 per cent of target) was exceeded and therefore, as per scheme rules, Executive KMP scorecards were activated.
Divisional profit is measured by segment EBIT performance against budget. In the year to
27 June 2020, both Supercheap Auto and rebel divisions achieved their EBIT budget.
The individual KPI and FY20 achievements, as determined by the Board for the Group MD and CEO and other Executive KMP, are detailed in Table 3a and 3b.
LTI vesting outcomes
Executive KMP average STI outcome as a percentage of the Executive STI maximum opportunity
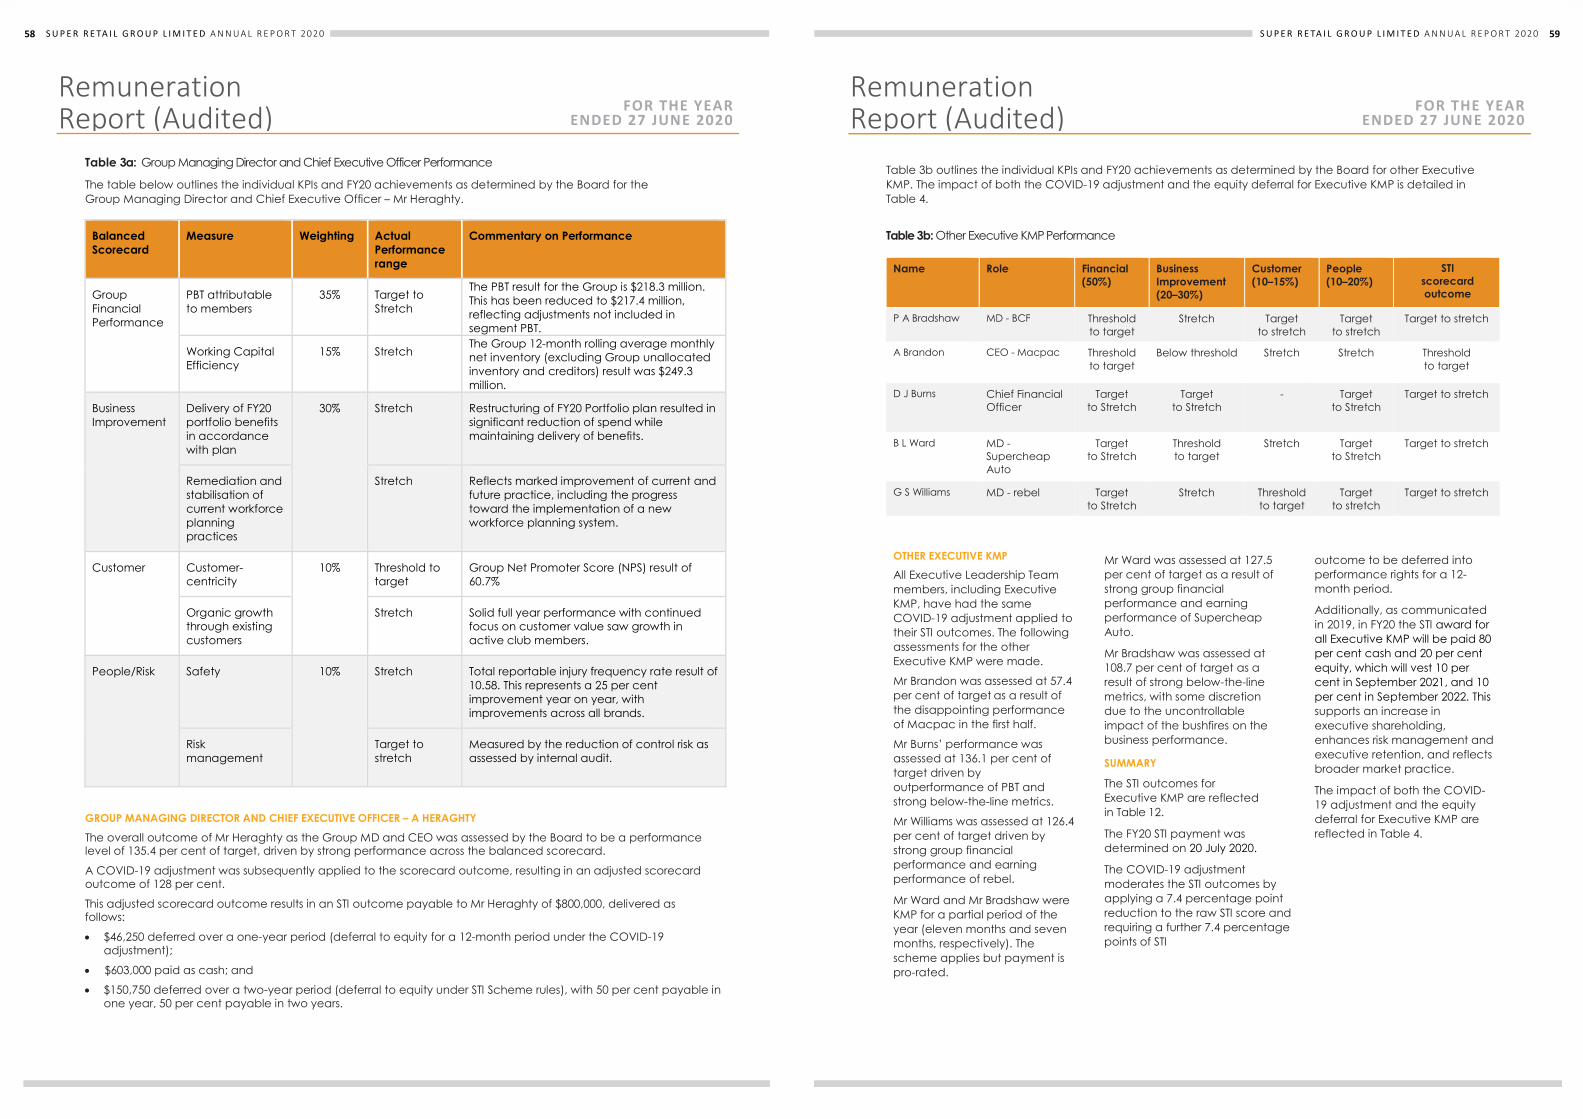
58 S U P E R R E TA I L G R O U P L I M I T E D A N N U A L R E P O R T 2020
Remuneration Report (Audited) FOR THE YEAR
ENDED 27 JUNE 2020
58 S U P E R R E T A I L G R O U P L I M I T E D A N N U A L R E P O R T 2 0 2 0
Table 3a: Group Managing Director and Chief Executive Officer Performance
The table below outlines the individual KPIs and FY20 achievements as determined by the Board for the Group Managing Director and Chief Executive Officer – Mr Heraghty.
Balanced Scorecard
Measure Weighting Actual Performance range
Commentary on Performance
Group Financial Performance
PBT attributable to members
35% Target to Stretch
The PBT result for the Group is $218.3 million. This has been reduced to $217.4 million, reflecting adjustments not included in segment PBT.
Working Capital Efficiency
15% Stretch The Group 12-month rolling average monthly net inventory (excluding Group unallocated inventory and creditors) result was $249.3 million.
Business Improvement
Delivery of FY20 portfolio benefits in accordance with plan
30% Stretch Restructuring of FY20 Portfolio plan resulted in significant reduction of spend while maintaining delivery of benefits.
Remediation and stabilisation of current workforce planning practices
Stretch Reflects marked improvement of current and future practice, including the progress toward the implementation of a new workforce planning system.
Customer Customer-centricity
10% Threshold to target
Group Net Promoter Score (NPS) result of 60.7%
Organic growth through existing customers
Stretch Solid full year performance with continued focus on customer value saw growth in active club members.
People/Risk Safety 10% Stretch Total reportable injury frequency rate result of 10.58. This represents a 25 per cent improvement year on year, with improvements across all brands.
Risk management
Target to stretch
Measured by the reduction of control risk as assessed by internal audit.
GROUP MANAGING DIRECTOR AND CHIEF EXECUTIVE OFFICER – A HERAGHTY
The overall outcome of Mr Heraghty as the Group MD and CEO was assessed by the Board to be a performance level of 135.4 per cent of target, driven by strong performance across the balanced scorecard.
A COVID-19 adjustment was subsequently applied to the scorecard outcome, resulting in an adjusted scorecard outcome of 128 per cent.
This adjusted scorecard outcome results in an STI outcome payable to Mr Heraghty of $800,000, delivered as follows:
$46,250 deferred over a one-year period (deferral to equity for a 12-month period under the COVID-19 adjustment);
$603,000 paid as cash; and
$150,750 deferred over a two-year period (deferral to equity under STI Scheme rules), with 50 per cent payable in one year, 50 per cent payable in two years.
59S U P E R R E TA I L G R O U P L I M I T E D A N N U A L R E P O R T 2020
Remuneration Report (Audited) FOR THE YEAR
ENDED 27 JUNE 2020
S U P E R R E T A I L G R O U P L I M I T E D A N N U A L R E P O R T 2 0 2 0 59
Table 3b outlines the individual KPIs and FY20 achievements as determined by the Board for other Executive KMP. The impact of both the COVID-19 adjustment and the equity deferral for Executive KMP is detailed in Table 4.
Table 3b: Other Executive KMP Performance
Name Role Financial (50%)
Business Improvement (20–30%)
Customer (10–15%)
People (10–20%)
STI scorecard outcome
P A Bradshaw MD - BCF Threshold to target
Stretch Target to stretch
Target to stretch
Target to stretch
A Brandon CEO - Macpac Threshold to target
Below threshold Stretch Stretch Threshold to target
D J Burns Chief Financial Officer
Target to Stretch
Target to Stretch
- Target to Stretch
Target to stretch
B L Ward MD - Supercheap Auto
Target to Stretch
Threshold to target
Stretch Target to Stretch
Target to stretch
G S Williams MD - rebel Target to Stretch
Stretch Threshold to target
Target to stretch
Target to stretch
OTHER EXECUTIVE KMP
All Executive Leadership Team members, including Executive KMP, have had the same COVID-19 adjustment applied to their STI outcomes. The following assessments for the other Executive KMP were made.
Mr Brandon was assessed at 57.4 per cent of target as a result of the disappointing performance of Macpac in the first half.
Mr Burns’ performance was assessed at 136.1 per cent of target driven by outperformance of PBT and strong below-the-line metrics.
Mr Williams was assessed at 126.4 per cent of target driven by strong group financial performance and earning performance of rebel.
Mr Ward and Mr Bradshaw were KMP for a partial period of the year (eleven months and seven months, respectively). The scheme applies but payment is pro-rated.
Mr Ward was assessed at 127.5 per cent of target as a result of strong group financial performance and earning performance of Supercheap Auto.
Mr Bradshaw was assessed at 108.7 per cent of target as a result of strong below-the-line metrics, with some discretion due to the uncontrollable impact of the bushfires on the business performance.
SUMMARY
The STI outcomes for Executive KMP are reflected in Table 12.
The FY20 STI payment was determined on 20 July 2020.
The COVID-19 adjustment moderates the STI outcomes by applying a 7.4 percentage point reduction to the raw STI score and requiring a further 7.4 percentage points of STI
outcome to be deferred into performance rights for a 12-month period.
Additionally, as communicated in 2019, in FY20 the STI award for all Executive KMP will be paid 80 per cent cash and 20 per cent equity, which will vest 10 per cent in September 2021, and 10 per cent in September 2022. This supports an increase in executive shareholding, enhances risk management and executive retention, and reflects broader market practice.
The impact of both the COVID-19 adjustment and the equity deferral for Executive KMP are reflected in Table 4.
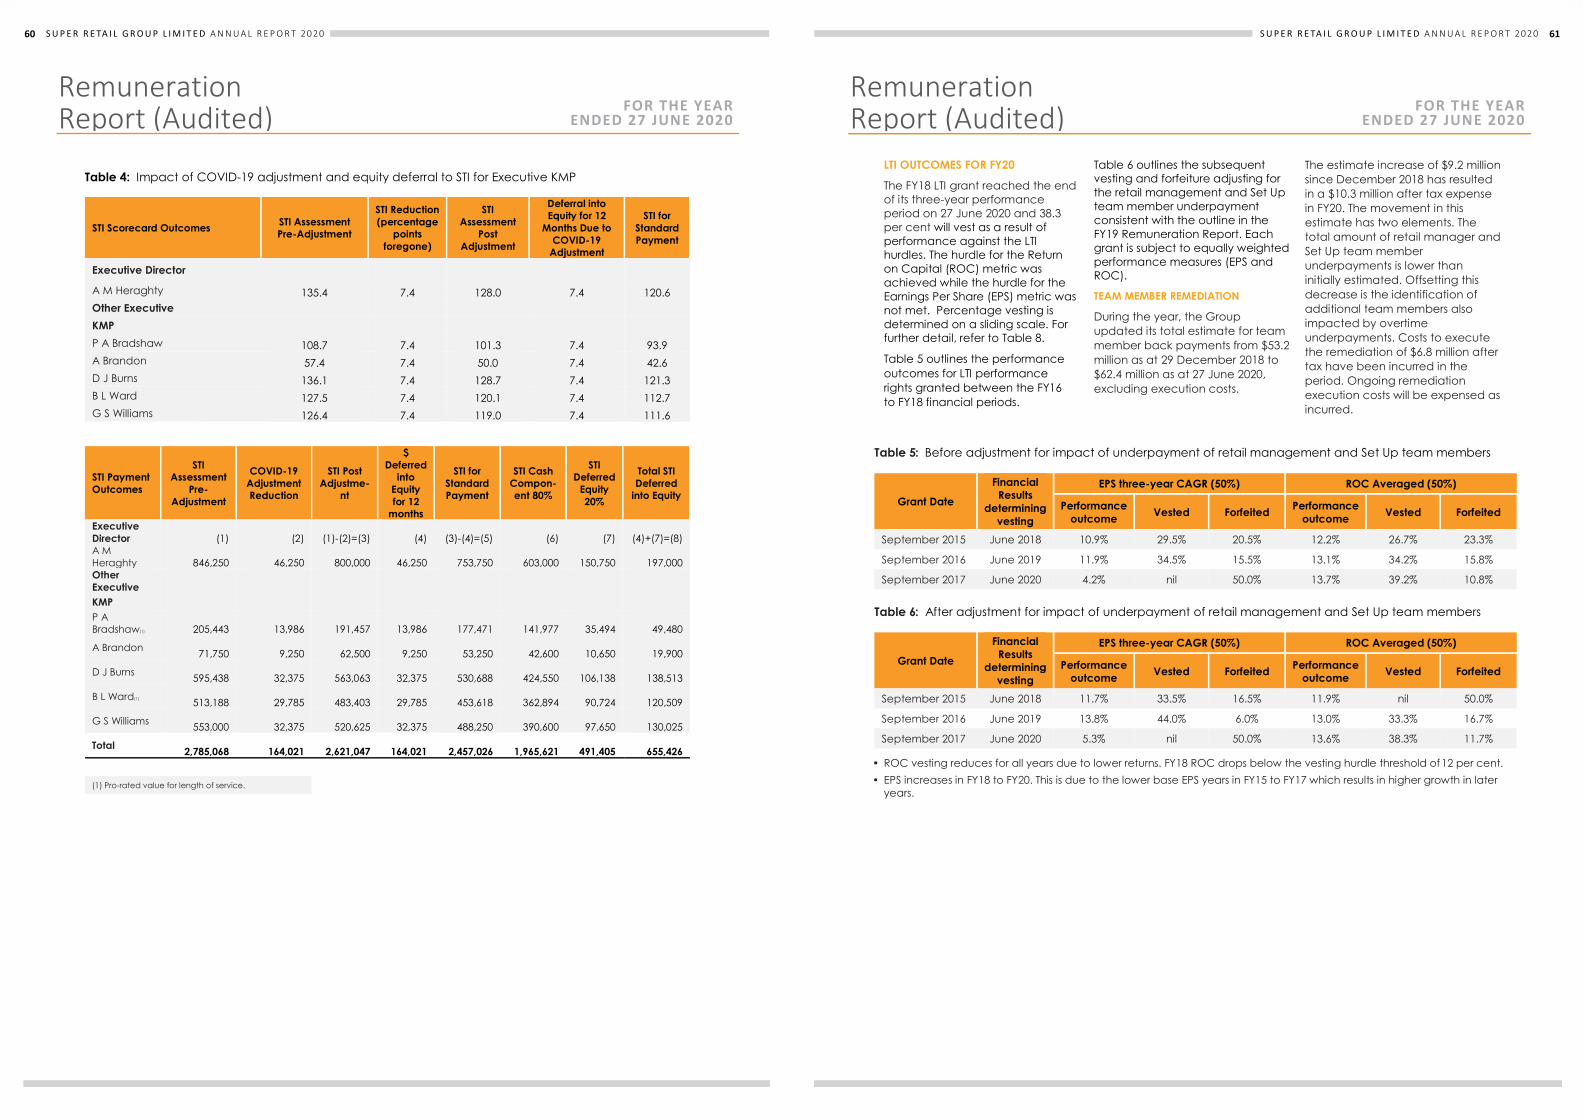
60 S U P E R R E TA I L G R O U P L I M I T E D A N N U A L R E P O R T 2020
Remuneration Report (Audited) FOR THE YEAR
ENDED 27 JUNE 2020
60 S U P E R R E T A I L G R O U P L I M I T E D A N N U A L R E P O R T 2 0 2 0
Table 4: Impact of COVID-19 adjustment and equity deferral to STI for Executive KMP
STI Scorecard Outcomes STI Assessment Pre-Adjustment
STI Reduction (percentage
points foregone)
STI Assessment
Post Adjustment
Deferral into Equity for 12
Months Due to COVID-19
Adjustment
STI for Standard Payment
Executive Director A M Heraghty 135.4 7.4 128.0 7.4 120.6 Other Executive KMP P A Bradshaw 108.7 7.4 101.3 7.4 93.9 A Brandon 57.4 7.4 50.0 7.4 42.6 D J Burns 136.1 7.4 128.7 7.4 121.3 B L Ward 127.5 7.4 120.1 7.4 112.7 G S Williams 126.4 7.4 119.0 7.4 111.6
STI Payment Outcomes
STI Assessment
Pre-Adjustment
COVID-19 Adjustment Reduction
STI Post Adjustme-
nt
$ Deferred
into Equity for 12
months
STI for Standard Payment
STI Cash Compon-ent 80%
STI Deferred
Equity 20%
Total STI Deferred
into Equity
Executive Director (1) (2) (1)-(2)=(3) (4) (3)-(4)=(5) (6) (7) (4)+(7)=(8) A M Heraghty
846,250
46,250
800,000
46,250
753,750
603,000
150,750 197,000
Other Executive KMP P A Bradshaw(1)
205,443
13,986
191,457
13,986
177,471
141,977
35,494 49,480
A Brandon 71,750
9,250
62,500
9,250
53,250
42,600
10,650 19,900
D J Burns 595,438
32,375
563,063
32,375
530,688
424,550
106,138
138,513
B L Ward(1) 513,188
29,785
483,403
29,785
453,618
362,894
90,724 120,509
G S Williams 553,000
32,375
520,625
32,375
488,250
390,600
97,650 130,025
Total 2,785,068 164,021
2,621,047
164,021 2,457,026
1,965,621
491,405 655,426
(1) Pro-rated value for length of service.
61S U P E R R E TA I L G R O U P L I M I T E D A N N U A L R E P O R T 2020
Remuneration Report (Audited) FOR THE YEAR
ENDED 27 JUNE 2020
60 S U P E R R E T A I L G R O U P L I M I T E D A N N U A L R E P O R T 2 0 2 0
Table 4: Impact of COVID-19 adjustment and equity deferral to STI for Executive KMP
STI Scorecard Outcomes STI Assessment Pre-Adjustment
STI Reduction (percentage
points foregone)
STI Assessment
Post Adjustment
Deferral into Equity for 12
Months Due to COVID-19
Adjustment
STI for Standard Payment
Executive Director A M Heraghty 135.4 7.4 128.0 7.4 120.6 Other Executive KMP P A Bradshaw 108.7 7.4 101.3 7.4 93.9 A Brandon 57.4 7.4 50.0 7.4 42.6 D J Burns 136.1 7.4 128.7 7.4 121.3 B L Ward 127.5 7.4 120.1 7.4 112.7 G S Williams 126.4 7.4 119.0 7.4 111.6
STI Payment Outcomes
STI Assessment
Pre-Adjustment
COVID-19 Adjustment Reduction
STI Post Adjustme-
nt
$ Deferred
into Equity for 12
months
STI for Standard Payment
STI Cash Compon-ent 80%
STI Deferred
Equity 20%
Total STI Deferred
into Equity
Executive Director (1) (2) (1)-(2)=(3) (4) (3)-(4)=(5) (6) (7) (4)+(7)=(8) A M Heraghty
846,250
46,250
800,000
46,250
753,750
603,000
150,750 197,000
Other Executive KMP P A Bradshaw(1)
205,443
13,986
191,457
13,986
177,471
141,977
35,494 49,480
A Brandon 71,750
9,250
62,500
9,250
53,250
42,600
10,650 19,900
D J Burns 595,438
32,375
563,063
32,375
530,688
424,550
106,138
138,513
B L Ward(1) 513,188
29,785
483,403
29,785
453,618
362,894
90,724 120,509
G S Williams 553,000
32,375
520,625
32,375
488,250
390,600
97,650 130,025
Total 2,785,068 164,021
2,621,047
164,021 2,457,026
1,965,621
491,405 655,426
(1) Pro-rated value for length of service.
Remuneration Report (Audited) FOR THE YEAR
ENDED 27 JUNE 2020
S U P E R R E T A I L G R O U P L I M I T E D A N N U A L R E P O R T 2 0 2 0 61
LTI OUTCOMES FOR FY20
The FY18 LTI grant reached the end of its three-year performance period on 27 June 2020 and 38.3 per cent will vest as a result of performance against the LTI hurdles. The hurdle for the Return on Capital (ROC) metric was achieved while the hurdle for the Earnings Per Share (EPS) metric was not met. Percentage vesting is determined on a sliding scale. For further detail, refer to Table 8.
Table 5 outlines the performance outcomes for LTI performance rights granted between the FY16 to FY18 financial periods.
Table 6 outlines the subsequent vesting and forfeiture adjusting for the retail management and Set Up team member underpayment consistent with the outline in the FY19 Remuneration Report. Each grant is subject to equally weighted performance measures (EPS and ROC).
TEAM MEMBER REMEDIATION
During the year, the Group updated its total estimate for team member back payments from $53.2 million as at 29 December 2018 to $62.4 million as at 27 June 2020, excluding execution costs.
The estimate increase of $9.2 million since December 2018 has resulted in a $10.3 million after tax expense in FY20. The movement in this estimate has two elements. The total amount of retail manager and Set Up team member underpayments is lower than initially estimated. Offsetting this decrease is the identification of additional team members also impacted by overtime underpayments. Costs to execute the remediation of $6.8 million after tax have been incurred in the period. Ongoing remediation execution costs will be expensed as incurred.
Table 5: Before adjustment for impact of underpayment of retail management and Set Up team members
Grant Date Financial
Results determining
vesting
EPS three-year CAGR (50%) ROC Averaged (50%) Performance
outcome Vested Forfeited Performance outcome Vested Forfeited
September 2015 June 2018 10.9% 29.5% 20.5% 12.2% 26.7% 23.3% September 2016 June 2019 11.9% 34.5% 15.5% 13.1% 34.2% 15.8% September 2017 June 2020 4.2% nil 50.0% 13.7% 39.2% 10.8%
Table 6: After adjustment for impact of underpayment of retail management and Set Up team members
Grant Date Financial
Results determining
vesting
EPS three-year CAGR (50%) ROC Averaged (50%) Performance
outcome Vested Forfeited Performance outcome Vested Forfeited
September 2015 June 2018 11.7% 33.5% 16.5% 11.9% nil 50.0% September 2016 June 2019 13.8% 44.0% 6.0% 13.0% 33.3% 16.7% September 2017 June 2020 5.3% nil 50.0% 13.6% 38.3% 11.7%
• ROC vesting reduces for all years due to lower returns. FY18 ROC drops below the vesting hurdle threshold of 12 per cent. • EPS increases in FY18 to FY20. This is due to the lower base EPS years in FY15 to FY17 which results in higher growth in later
years.

62 S U P E R R E TA I L G R O U P L I M I T E D A N N U A L R E P O R T 2020
Remuneration Report (Audited) FOR THE YEAR
ENDED 27 JUNE 2020
62 S U P E R R E T A I L G R O U P L I M I T E D A N N U A L R E P O R T 2 0 2 0
SECTION 5 Detail of the FY20 Executive Total Reward Framework
The Group is committed to creating a high-performance culture.
Remuneration and benefits are set in the context of an overall policy to provide market-competitive remuneration arrangements that support the attraction, development, engagement and retention of passionate team members. These are also aligned with the interests of shareholders.
For FY20, remuneration benchmarking for all Executive KMP was sourced from Ernst & Young. The Board referenced two sets of comparator groups to benchmark remuneration:
Market Capitalisation comparator group: S&P/ASX 200 companies within 50 per cent to 200 per cent of Super Retail Group’s 12-month average market capitalisation; and
Market Capitalisation and GICS comparator group: S&P/ASX 200 companies within the ‘Consumer Discretionary Sector’ Global Industry Classification Standard (GICS).
TARGET REMUNERATION MIX The mix of remuneration between fixed and variable components is determined with regard to the seniority of the role, the responsibilities of the role for driving business performance, developing and implementing business strategy, and external remuneration practices. Figure 1 shows the remuneration mix based on the base salary package (as at 27 June 2020) and the incentives payable, assuming maximum STI is received and full vesting of the LTI Plan for:
• the Group MD and CEO; and • other Executive KMP’s.
Figure 1: GROUP MANAGING DIRECTOR AND CHIEF EXECUTIVE OFFICER
CHIEF FINANCIAL OFFICER
DIVISIONAL MANAGING DIRECTORS (rebel and Supercheap Auto) DIVISIONAL MANAGING DIRECTOR (BCF)
Base STI LTI Salary Package
The remuneration mix for the Group MD and CEO and for CFO has moved from the prior year as a result of the increase in STI target with the introduction of deferral. This has resulted in a greater proportion of reward being at risk. The Chief Executive Officer –Macpac currently participates in a cash-based retention scheme, agreed at the time of acquisition, with vesting dependent on the performance of the Macpac business.
BASE SALARY
Base salary comprises base pay and superannuation, and may include prescribed non-financial benefits at the discretion of the individual executive on a salary-sacrifice basis. The Group provides superannuation contributions in line with statutory obligations.
No guaranteed base salary increases are included in any Executive KMP’s service contract. Approved amendments to base salary packages are effective from the commencement of the new financial year.
VARIABLE OR ‘AT-RISK’ REMUNERATION Variable or ‘at-risk’ remuneration forms a significant portion of the Executive KMP remuneration opportunity. The purpose of variable remuneration is to focus executives on the execution of the Group’s strategy and delivery of long-term sustainable value.
The information below provides detail of the Group’s short-term and long-term incentives.
SHORT TERM INCENTIVE REWARD
Consistent with the prior year, the FY20 STI Scheme (the scheme) for Executive Leadership Team, including Executive KMP, is based on a balanced scorecard. Taking a scorecard approach allows Executive performance to be assessed in a holistic way for four key drivers of performance, which is outlined in Table 7. The Human Resources and Remuneration Committee (the Committee) governs the design of the STI Scheme, KPI and target setting, and the Board holds approval and discretion over the outcomes.
MINIMUM SECURITIES HOLDING POLICY Commencing FY15, the Board introduced a minimum shareholding requirement for NEDs valued at a minimum of 100 per cent of one year’s pre-tax base fees. The Group MD and CEO is to be 150 per cent of one year’s pre-tax base salary and other Executive KMP are to be 100 per cent of one year’s pre-tax base salary. This is to be achieved within five years of the commencement of employment. This requirement may be extended due to reduced vesting. This is to further align the interest of NEDs and Executive KMP with those of shareholders (referenced in Tables 14 and 16).
26% 31% 43%
24% 37% 39%
30% 33% 37%
24% 37% 39%
63S U P E R R E TA I L G R O U P L I M I T E D A N N U A L R E P O R T 2020
Remuneration Report (Audited) FOR THE YEAR
ENDED 27 JUNE 2020
S U P E R R E T A I L G R O U P L I M I T E D A N N U A L R E P O R T 2 0 2 0 63
Table 7: Key aspects of the FY20 Scheme
Scheme STI awards are made under the Super Retail Group Short-Term Incentive Scheme (the scheme).
Participation The scheme allows for the invitation to participate to Executive KMP and other executives.
Purpose The scheme rewards a combination of Board approved financial and non- financial performance measures that articulate performance expectations at both target and over-achievement that are aligned to the execution of the Group’s strategy.
Performance Period The performance period is for 12 months ending 27 June 2020.
Financial Gateway A minimum Group PBT of at least 90 per cent of target must be met before any short-term incentives are payable. If this level is not reached, the scheme is deemed to be discretionary and any payment made to Executive KMP will be at the Board’s discretion.
Performance Targets The achievement of individual KPI targets (once the financial gateway has been achieved) shall determine the proportion of the potential bonus entitlement that will be granted.
For FY20, the following primary performance goals and weightings were selected. These goals are aligned to the Group’s strategic plan.
Measures Category Weighting (% of STI) Performance Goals
Financial Financial 50 Net Profit Before Tax (PBT) Divisional Earnings Before
Interest and Tax (EBIT) Working Capital
Efficiency
Non-Financial Business Improvement
20 - 30 Division business plan delivery
Customer 10 - 15 Net Promotor Score (NPS)
People 10 - 20 • Total Recordable Injury Frequency Rate (TRIFR)
The significant weighting of financial outcomes, at a minimum of 50 per cent, maintains a strong link between actual financial performance and incentive paid.
FY20 Target and Maximum Stretch Opportunity
For the Group MD and CEO and other Executives, the target STI opportunity is 100 per cent, and the maximum stretch STI opportunity is 150 per cent of target. For each measure, a threshold level of performance is set. This level must be met to achieve a score. In setting this threshold, consideration is given to prior year performance and target.

64 S U P E R R E TA I L G R O U P L I M I T E D A N N U A L R E P O R T 2020
Remuneration Report (Audited) FOR THE YEAR
ENDED 27 JUNE 2020
64 S U P E R R E T A I L G R O U P L I M I T E D A N N U A L R E P O R T 2 0 2 0
Use of Discretion The Committee, in its advisory role, reviews proposed adjustments to STI outcomes and makes recommendations for any changes to performance measures, which may only be approved by the Board. The Committee also reviews the nature of the adjustments to earnings to assess the impacts (if any) on remuneration.
Governance and Approval Process
The Group MD and CEO’s STI is recommended by the Committee based on his balanced scorecard performance and is approved by the Board.
The amount of STI paid to other Executive KMP is recommended by the Group MD and CEO to the Committee based on each executive’s balanced scorecard performance and is recommended by the Committee for approval by the Board.
The Board may apply discretion in determining the STI outcomes to ensure they are appropriate. By way of illustration, the Board may take into consideration the Executive KMP’s alignment to Company values, prudent risk management and the Company’s long-term financial soundness.
Payment Vehicle FY20 STI awards are delivered as 80 per cent cash and 20 per cent deferral to equity, with 50 per cent to vest in year two and 50 per cent to vest in year three. For FY20, there is a higher deferral due to the COVID-19 adjustment.
Payment Frequency STI awards are paid annually. Payments are made in September following the end of the performance period.
LONG-TERM INCENTIVE REWARD
The Group’s remuneration structure aims to align long-term incentives for Executive KMPs and other executives with the delivery of sustainable value to shareholders. The alignment of interests is important in ensuring that Executive KMPs and other executives are focused on delivering sustainable returns to shareholders, whilst allowing the Group to attract and retain high-calibre executives. The Board has determined that the combination of EPS and ROC are appropriate measures of sustainable shareholder returns. Table 8: Key aspects of the LTI Plan
Plan LTI awards are granted under the Super Retail Group Employee Performance Rights Plan (the plan).
Participation The plan allows for the annual grant of Performance Rights to Executive KMP and other executives.
LTI Instrument Performance rights are granted by the Group for nil consideration. Each performance right is a right to receive a fully-paid ordinary share at no cost if service-based and performance-based vesting conditions are met.
65S U P E R R E TA I L G R O U P L I M I T E D A N N U A L R E P O R T 2020
Remuneration Report (Audited) FOR THE YEAR
ENDED 27 JUNE 2020
S U P E R R E T A I L G R O U P L I M I T E D A N N U A L R E P O R T 2 0 2 0 65
Allocation Methodology The number of performance rights granted to each Executive KMP is determined in accordance with the Executive Remuneration Framework and have a value of between 50 per cent and 100 per cent of their base salary package. The notional value of performance rights granted to Executive KMP and other executives is determined on a face value basis using the volume-weighted average price for Super Retail Group shares traded on the ASX over the first five trading days from the day following the release of the Group’s results for the preceding reporting period. The value of performance rights for grant purposes may differ from the accounting valuation shown in the financial statements, which considers probability of vesting and other factors.
Performance Period The performance period is three years commencing 1 July in the year the award is made. For the FY20 awards, this is the three-year period from 1 July 2019 to 2 July 2022.
Performance Hurdles and Vesting Schedules
Equity grants to Executive KMP and other executives are in two equal tranches of 50 per cent for the three-year compound annual growth rate in normalised EPS and 50 per cent for normalised three-year averaged ROC.
Performance Hurdles and Vesting Schedules (continued)
The performance conditions for performance rights granted in September 2019 are:
Measures Normalised EPS CAGR Averaged ROC
Weight 50% 50%
Nature Growth of Group Group Absolute Performance Zone (Threshold to Maximum)
8% to 13% compound annual growth
10% to 15% annual average
Payout Below threshold (<8%): 0% of elements vested
Below threshold (<10%): 0% of elements vested
Threshold (8%): 30% of elements vested
Threshold (10%): 30% of elements vested
Target (10%): 50% of elements vested
Target (12%): 50% of elements vested
Maximum (13%): 100% of elements vested
Maximum (15%): 100% of elements vested
Straight-line vesting: Between threshold (8%) and target (10%) and then target and maximum (13%)
Straight-line vesting: Between threshold (10%) and target (12%) and then target and maximum (15%)
Performance Period If the performance conditions are satisfied within the performance period, the performance rights will vest over the subsequent years in accordance with the following schedule:
Time after grant of performance rights: 3 years 4 years
Percentage of performance rights that vest: 50% 50%
Under these performance hurdles, for the plan to achieve 100 per cent vesting, the compound EPS growth must be at least 13 per cent and ROC must average at least 15 per cent. The normalised EPS measure excludes the value of franking credits being generated, which are transferred to shareholders through the Group’s fully franked dividend.
For performance rights granted in September 2017 and prior, the normalised earnings performance hurdle was as follows:

66 S U P E R R E TA I L G R O U P L I M I T E D A N N U A L R E P O R T 2020
Remuneration Report (Audited) FOR THE YEAR
ENDED 27 JUNE 2020
66 S U P E R R E T A I L G R O U P L I M I T E D A N N U A L R E P O R T 2 0 2 0
Normalised EPS CAGR % vesting of Performance Rights
10% (threshold) 50%
15% (maximum) 100%
The Performance rights for this period will vest on a pro rata basis between these compound annual growth ranges.
Performance Period If the performance conditions are satisfied within the performance period, the performance rights will vest over the subsequent years in accordance with the following schedule:
Time after grant of performance rights: 3 years 4 years 5 years
Percentage of performance rights that vest: 50% 25% 25%
For the performance rights granted in September 2018, the plan details are the same as the performance rights granted in September 2017 with the exception of the normalised EPS CAGR performance hurdle which has an 8 per cent threshold and a 13 per cent maximum. Each year, the Board reviews any significant items, positive and negative, and considers their relevance for the PBT, ROC and EPS results. The Board may include or exclude any significant events/items to give a clearer reflection of normalised financial performance from one period to the next. Significant events/items are considered unusual by their nature and size and/or not in the ordinary course of the business, (including prior period store underpayment and remediation costs, business restructuring costs and equity accounted losses – refer to note 4b in the financial statements for the details). In addition, the impact of the accounting standard AASB16 Leases, which has been applied for the first year in FY20, has been excluded as it was not included in the financial targets established for FY20.
Testing and Time Restrictions
At the end of three financial years, equity grants are tested against the performance hurdles set. Awards will only vest once the Board, in its discretion, determines that relevant conditions have been satisfied. If the performance hurdles are not met at the vesting date, the performance rights will lapse. There is no retesting of performance hurdles under the plan. The Board has discretion to determine that an Award vests prior to the end of the relevant period and retains a discretion to adjust performance related outcomes.
Dividends and Voting Rights Performance rights do not carry voting or dividend rights.
Hedging Arrangements Participating executives are prohibited from entering into any hedging arrangements in relation to performance rights.
Clawback Policy There is a Clawback Policy within the plan. The Board may determine any treatment in relation to an Award, both vested and unvested, without limitation, in certain circumstances such as fraud, dishonesty, or breach of obligations (including, without limitation, a material misstatement of financial information). The plan document is available on the Group’s website.
Termination Provisions Executive KMP must be employed at the time of vesting to receive the allotment of shares. The Board has discretion to amend the employment requirement based on the circumstances associated with the Executive KMP and other executives leaving. The Board has previously exercised its discretion where an employee left due to retirement, retrenchment or redundancy, or termination by mutual consent. The employee may, in these circumstances, retain entitlement to a portion of the performance rights pro-rated to reflect the period of service from the start of the performance period to the date of departure. After the
67S U P E R R E TA I L G R O U P L I M I T E D A N N U A L R E P O R T 2020
Remuneration Report (Audited) FOR THE YEAR
ENDED 27 JUNE 2020
S U P E R R E T A I L G R O U P L I M I T E D A N N U A L R E P O R T 2 0 2 0 67
employee’s departure the performance rights would only be available to vest to the extent that the performance conditions are met. In the event the Board has not exercised discretion, when an employee leaves due to resignation or termination with cause, all unvested performance rights will lapse.
Change of Control Provisions
Any unvested performance rights may vest at the Board’s discretion, having regard to pro-rated performance.
Any unvested cash LTI as applicable to the Chief Executive Officer – Macpac, outlined in Table 9, may vest at the Board’s discretion, having regard to pro-rated performance.
The Super Retail Group Employee Performance Rights Plan rules are available on the Group’s website: https://www.superretailgroup.com.au/investors-and-media/corporate-governance/
PERFORMANCE-BASED RETENTION ARRANGEMENTS FOR CHIEF EXECUTIVE OFFICER – MACPAC
As part of the acquisition of Macpac, an executive retention scheme was established for the Chief Executive Officer – Macpac, Mr Brandon. The performance hurdles of the retention scheme align to the five-year business strategy disclosed to the market in May 2018. Note, Mr Brandon does not currently participate in the SRG LTI Plan. The retention scheme arrangements for Chief Executive Officer – Macpac are outlined in Table 9.
Table 9: Retention Scheme arrangements for Chief Executive Officer - Macpac Vehicle Cash Incentive Opportunity NZ$1,500,000 Performance Period Five years (2018 – 2023) Performance Conditions Vesting is tied to the EBIT (CAGR over five years) measured
at three intervals (30 June 2021, 30 June 2022 and 30 June 2023) against the consolidated Macpac business plan as approved by the Board.
Payment schedule On the basis that the performance conditions are met at each interval, the retention payment will be made in the following manner: 1 July 2021: NZ$500,000 1 July 2022: NZ$500,000 1 July 2023: NZ$500,000
Eligibility The executive is eligible to receive payment if EBIT achieves plan and he remains employed on 1 July immediately following each testing date.

68 S U P E R R E TA I L G R O U P L I M I T E D A N N U A L R E P O R T 2020
Remuneration Report (Audited) FOR THE YEAR
ENDED 27 JUNE 2020
68 S U P E R R E T A I L G R O U P L I M I T E D A N N U A L R E P O R T 2 0 2 0
SECTION 6 Executive Remuneration Changes for FY21
BASE SALARY CHANGES
The Group MD and CEO base salary for FY21 will increase by $60,000 (5.5 per cent) to $1,150,000, positioning base pay at the 64th percentile against the market capitilisation comparator group, inclusive of an allowance for car and home office usage.
The comparator benchmarks show that overall Executive KMP base salary package and short-term incentive packages for FY21 year will be in the range of the 50th and 75th percentile of the respective market comparator group.
The base salary for Mr Ward for FY21 will increase by $25,000 (four per cent) to $725,000, positioning base pay between the 62.5 and 75th percentile against the All ASX Retail comparator group.
The base salary for Mr Williams for FY21 will increase by $25,000 (four per cent) to $725,000, positioning base pay between the 62.5 and 75th percentile against the All ASX Retail comparator group.
Other Executive KMP are not receiving a base salary increase for FY21.
CONTINUED IMPLEMENTATION OF DEFERRED SHORT TERM INCENTIVE
As indicated in FY19, the Executive KMP are transitioning towards a 30 per cent deferral over two years. FY21 is the second year of the transition and, as such, STI outcomes in FY21 will be subjected to an increased deferral from 20 per cent to 30 per cent. Accordingly, there is a further increase to the target STI for each KMP of 14.8 per cent.
Vesting of the deferred STI will occur in two, equal tranches (i.e. 50 per cent of rights vest one year after grant and the remaining 50 per cent will vest two years after grant).
Accumulated dividend equivalent payments will be received when awards are fully vested.
The deferred STI awards will be subject to the same clawback provisions as the LTI (for further detail on the LTI Clawback Policy, refer to Table 8).
VARIABLE REWARD FRAMEWORK
The Group will revise the Executive total reward framework and opportunity in response to a two-year business plan formulated for the context of the COVID-19 pandemic.
This will apply to all Executive Leadership Team members (inclusive of KMP).
The revisions seek to align the reward structure with the measurements of performance set by the Board for the medium term.
In considering these revisions, the Board plans to replace elements of the current LTI arrangement for FY21 and FY22 for all Executive Leadership Team members (inclusive of KMP). The Board is focused on revisions that:
Are aligned to shareholder interests;
Allow for flexibility in the face of unprecedented times;
Maintain total target variable reward over FY21 and FY22.
The Board anticipates issuing one grant covering FY21 and FY22 and aligning the metrics to the two-year business plan.
APPLICATION OF DISCRETION FOR EQUITY BASED INCENTIVES
The Board has approved the following principles to guide Board discretion (if any), in relation to the outcomes for awards under existing equity-based incentive plans:
Preserve the purpose and integrity of the LTI Plan;
Maintain the integrity of each year’s remuneration as awarded;
Maintain the level of performance expected when the original targets were set;
Be consistent with general market/security-holder expectations, particularly for the alignment of performance-based remuneration with the interests of shareholders;
Be able to be implemented without requiring special approvals, for example from the ASX or security-holders;
Not hinder the success of any transaction (such as a significant acquisition) given that executives do not otherwise receive incentive type payments for merger and acquisition activity;
Discretion should only be exercised for events or items over the performance period that have a material impact on the outcome; and
Adjustments (positive and negative) are made at the time of vesting (there may be more than one relevant event during the performance period).
69S U P E R R E TA I L G R O U P L I M I T E D A N N U A L R E P O R T 2020
Remuneration Report (Audited) FOR THE YEAR
ENDED 27 JUNE 2020
68 S U P E R R E T A I L G R O U P L I M I T E D A N N U A L R E P O R T 2 0 2 0
SECTION 6 Executive Remuneration Changes for FY21
BASE SALARY CHANGES
The Group MD and CEO base salary for FY21 will increase by $60,000 (5.5 per cent) to $1,150,000, positioning base pay at the 64th percentile against the market capitilisation comparator group, inclusive of an allowance for car and home office usage.
The comparator benchmarks show that overall Executive KMP base salary package and short-term incentive packages for FY21 year will be in the range of the 50th and 75th percentile of the respective market comparator group.
The base salary for Mr Ward for FY21 will increase by $25,000 (four per cent) to $725,000, positioning base pay between the 62.5 and 75th percentile against the All ASX Retail comparator group.
The base salary for Mr Williams for FY21 will increase by $25,000 (four per cent) to $725,000, positioning base pay between the 62.5 and 75th percentile against the All ASX Retail comparator group.
Other Executive KMP are not receiving a base salary increase for FY21.
CONTINUED IMPLEMENTATION OF DEFERRED SHORT TERM INCENTIVE
As indicated in FY19, the Executive KMP are transitioning towards a 30 per cent deferral over two years. FY21 is the second year of the transition and, as such, STI outcomes in FY21 will be subjected to an increased deferral from 20 per cent to 30 per cent. Accordingly, there is a further increase to the target STI for each KMP of 14.8 per cent.
Vesting of the deferred STI will occur in two, equal tranches (i.e. 50 per cent of rights vest one year after grant and the remaining 50 per cent will vest two years after grant).
Accumulated dividend equivalent payments will be received when awards are fully vested.
The deferred STI awards will be subject to the same clawback provisions as the LTI (for further detail on the LTI Clawback Policy, refer to Table 8).
VARIABLE REWARD FRAMEWORK
The Group will revise the Executive total reward framework and opportunity in response to a two-year business plan formulated for the context of the COVID-19 pandemic.
This will apply to all Executive Leadership Team members (inclusive of KMP).
The revisions seek to align the reward structure with the measurements of performance set by the Board for the medium term.
In considering these revisions, the Board plans to replace elements of the current LTI arrangement for FY21 and FY22 for all Executive Leadership Team members (inclusive of KMP). The Board is focused on revisions that:
Are aligned to shareholder interests;
Allow for flexibility in the face of unprecedented times;
Maintain total target variable reward over FY21 and FY22.
The Board anticipates issuing one grant covering FY21 and FY22 and aligning the metrics to the two-year business plan.
APPLICATION OF DISCRETION FOR EQUITY BASED INCENTIVES
The Board has approved the following principles to guide Board discretion (if any), in relation to the outcomes for awards under existing equity-based incentive plans:
Preserve the purpose and integrity of the LTI Plan;
Maintain the integrity of each year’s remuneration as awarded;
Maintain the level of performance expected when the original targets were set;
Be consistent with general market/security-holder expectations, particularly for the alignment of performance-based remuneration with the interests of shareholders;
Be able to be implemented without requiring special approvals, for example from the ASX or security-holders;
Not hinder the success of any transaction (such as a significant acquisition) given that executives do not otherwise receive incentive type payments for merger and acquisition activity;
Discretion should only be exercised for events or items over the performance period that have a material impact on the outcome; and
Adjustments (positive and negative) are made at the time of vesting (there may be more than one relevant event during the performance period).
Remuneration Report (Audited) FOR THE YEAR
ENDED 27 JUNE 2020
S U P E R R E T A I L G R O U P L I M I T E D A N N U A L R E P O R T 2 0 2 0 69
SECTION 7 Non-Executive Directors’ Remuneration Arrangements
NON-EXECUTIVE DIRECTORS’ REMUNERATION STRUCTURE
The Group’s remuneration strategy is designed to attract and retain experienced, qualified Non-Executive Directors and to remunerate appropriately to reflect the responsibilities of the position. Non-Executive Directors receive fees to recognise their contribution to the work of the Board and the associated Committees on which they serve.
The Nominations Committee reviews the level of fees annually. Under the current fee framework, Non-Executive Directors are remunerated by way of a base fee, with additional fees paid to the Chairs and members of Committees; namely, the Audit and Risk, and the Human Resources and Remuneration committees. This reflects the additional time commitment required by the Chairs and members of these committees.
There has not been an increase to the base fee for Non-Executive Directors since 2018.
The Board Chair receives an all-inclusive fee and no other fees (e.g. Committee fees) are paid. Fees are inclusive of superannuation contributions required by the Superannuation Guarantee legislation.
Non-Executive Directors do not receive any performance-related remuneration. Non-Executive Directors may opt each year to receive a proportion of their remuneration in Super Retail Group Limited shares, which would be acquired on market. Non-Executive Directors are not eligible for termination payments or to receive retirement benefits other than superannuation on resignation or retirement from the Board.
Non-Executive Directors’ fees are determined within an aggregate directors’ fee pool approved by shareholders. The fee pool of $1.2 million per annum was approved at the AGM on 23 October 2013.
NON-EXECUTIVE DIRECTORS’ FEES
The fees paid to Non-Executive Directors are set out in Table 10a and are annual fees, inclusive of superannuation, unless otherwise stated.
NON-EXECUTIVE DIRECTORS’ POOL AND COMMITTEE CHANGES- FY21
Subject to shareholder approval at the 2020 AGM, the fee pool will increase to $1.5 million to accommodate a new director, taking the number of Non-Executive Directors from six to seven and to support a modest increase in Committee Chair and Committee member fees commensurate with market benchmarking. If approved, the increases will be effective from the date of the AGM. For further detail, refer to Table 10b. There will be no increase to base fees for NEDs in FY21.
Table 10a: FY20
Annual Fees Board Audit and Risk Committee
Human Resources and Remuneration Committee
Nomination Committee
Chair(1) $313,650 $25,000 $25,000 Nil
Members $141,143 $10,000 $10,000 Nil
(1) Committee fees are not paid to the Chair.
There was no change to Non–Executive Directors’ fees (including Committee fees) in FY20.
Table 10b: FY21
Annual Fees Board Audit and Risk Committee
Human Resources and Remuneration Committee
Nomination Committee
Chair(1) $313,650 $35,000 $35,000 Nil
Members $141,143 $15,000 $15,000 Nil
(1) Committee fees are not paid to the Chair of the Board.

70 S U P E R R E TA I L G R O U P L I M I T E D A N N U A L R E P O R T 2020
Remuneration Report (Audited) FOR THE YEAR
ENDED 27 JUNE 2020
70 S U P E R R E T A I L G R O U P L I M I T E D A N N U A L R E P O R T 2 0 2 0
Details of the remuneration of the Non-Executive Directors of the Group are set out in Table 11.
Table 11:
FY20 Short-term Benefits Post- employment Share based
Name
Cash salary
and fees $
Cash bonus
$
Non- monetary benefits
$
Super-annuation
$
Performance Rights
$ Other
$ Total
$
Non-Executive
S A Pitkin 313,650 – – – – – 313,650
S A Chaplain(1) 32,720 – – 3,108 – – 35,828
G T Dunne(1) 32,720 – – 3,108 – – 35,828
D J Eilert (2) 156,716 – – 14,888 – – 171,604
P D Everingham 147,163 – – 13,980 – – 161,143
H L Mowlem 151,729 – – 14,414 – – 166,143
R A Rowe 128,898 – – 12,245 – – 141,143
L K Inman(3) 51,550 – – – – – 51,550
Total 1,015,146 – – 61,743 – – 1,076,889
FY19 Short-term Benefits Post- employment Share based
Name
Cash salary
and fees $
Cash bonus
$
Non- monetary benefits
$
Super-annuation
$
Performance Rights
$ Other
$ Total
$
Non-Executive
S A Pitkin 313,650 – – – – – 313,650
D J Eilert 147,163 – – 13,980 – – 161,143
P D Everingham 147,163 – – 13,980 – – 161,143
H L Mowlem 151,729 – – 14,414 – – 166,143
R A Rowe 121,371 – – 19,771 – – 141,142
L K Inman 166,143 – – – – – 166,143
Total 1,047,219 – – 62,145 – – 1,109,364
(1) S A Chaplain and G T Dunne commenced as Directors on 31 March 2020. (2) D J Eilert commenced as Chair of the Human Resources & Remuneration Committee from 22 October 2019. (3) L K Inman ceased to be a Director with effect from 22 October 2019.
71S U P E R R E TA I L G R O U P L I M I T E D A N N U A L R E P O R T 2020
Remuneration Report (Audited) FOR THE YEAR
ENDED 27 JUNE 2020
S U P E R R E T A I L G R O U P L I M I T E D A N N U A L R E P O R T 2 0 2 0 71
SECTION 8 Executive KMP Remuneration Outcomes for FY20
Details of the remuneration of the Executive KMP of the Group are set out in Table 12:
Table 12:
FY20 Short-term Benefits Post- employment Share based
Name
Cash salary and fees
$
Cash bonus
$
Non- monetary benefits
$
Annual Leave
$
Super-annuation
$
Termin-ation
Benefits $
Performance Rights
$
Other long term
benefits(1) $
Total $
Executive Director
A M Heraghty(2) 1,025,648 603,000 43,349 84,019 21,003 - 205,288 11,148 1,993,455
Other Executive KMP
P A Bradshaw(3) 372,560 141,977 - 18,170 15,752 - 51,017 599 600,075
A Brandon 379,877 42,600 2,384 61,040 11,396 - 9,063 48,801 555,161
D J Burns 651,297 424,550 2,700 5,563 21,003 - 238,172 9,362 1,352,647
B L Ward(4) 593,141 612,894 33,625 17,895 21,003 - 96,676 993 1,376,227
G S Williams(5) 676,297 503,614 2,700 - 21,003 - 106,644 1,736 1,311,994
C D Wilesmith(6) 50,077 - 3,692 5,122 5,251 - 4,882 1,165 70,189
Total 3,748,897 2,328,635 88,450 191,809 116,411 - 711,742 73,804 7,259,748
FY19 Short-term Benefits Post- employment Share based
Name
Cash salary and
fees $
Cash bonus
$
Non- monetary benefits
$
Annual Leave
$
Super-annuation
$
Termin-ation
Benefits $
Performance Rights
$
Other long term
benefits(1) $
Total $
Executive Director
A M Heraghty(2,9) 838,014 317,400 25,916 32,303 20,531 - 336,949 6,971 1,578,084
P A Birtles(7) 790,582 - 2,380 41,079 15,399 132,952 (339,972) 17,366 659,786
Other Executive KMP
A Brandon(8) 54,825 15,454 2,952 7 3,550 - - 61,764 138,552
D J Burns(9) 654,468 249,375 - (2,779) 20,531 - 37,228 8,245 967,068
G S Williams(5) 167,254 136,986 - 14,215 5,133 - - 270 323,858
E A Berchtold(10) 203,841 - - 30,956 15,231 188,160 (248,965) 6,999 196,222
C D Wilesmith(6,9) 651,469 276,000 48,000 40,905 20,531 445,469 45,525 13,228 1,541,127
Total 3,360,453 995,215 79,248 156,686 100,906 766,581 (169,235) 114,843 5,404,697

72 S U P E R R E TA I L G R O U P L I M I T E D A N N U A L R E P O R T 2020
Remuneration Report (Audited) FOR THE YEAR
ENDED 27 JUNE 2020
72 S U P E R R E T A I L G R O U P L I M I T E D A N N U A L R E P O R T 2 0 2 0
(1) Includes accruals for long service leave entitlements and accrued long term retention bonus for A Brandon of $48,801 ($61,764 in 2019).
(2) A M Heraghty was Managing Director of Outdoor from 1 July 2018 to 19 February 2019 and commenced as Group Managing Director and Chief Executive Officer from 20 February 2019. As approved at the Annual General Meeting held on 22 October 2019, A M Heraghty received a Long-Term Incentive grant of 86,294 performance rights and 53,262 performance rights in relation to a one-off co-investment grant. The Long-Term Incentive grant was valued in 2019 based on the Long-Term Incentive Plan in place at the date of commencement as Group Managing Director and Chief Executive Officer. This has been revised to be based on the share price at the date of the Annual General Meeting and reflecting the Long-Term Incentive Plan conditions that commenced in FY20. The co-investment grant is valued using the VWAP of the Company’s shares traded on the ASX over the first five trading days of the first trading window following commencement as Group Managing Director and Chief Executive Officer being 21 February 2019 to 27 February 2019, inclusive.
(3) P A Bradshaw commenced as KMP on 25 November 2019. Outcome pro-rated for length of service.
(4) B L Ward commenced as KMP on 1 August 2019. Included in the cash bonus total is a sign on bonus of $250,000. Outcome pro-rated for length of service.
(5) G S Williams commenced on 2 April 2019. Included in the cash bonus is a sign on bonus for G S Williams of $113,014 ($136,986 in 2019).
(6) C D Wilesmith resignation effective 9 August 2019. Termination benefits are accrued obligations as at 29 June 2019. Mr Wilesmith ceased as KMP on 31 July 2019.
(7) P A Birtles retired as Group Managing Director and Chief Executive Officer on 19 February 2019.
(8) A Brandon commenced as a KMP effective 1 May 2019.
(9) Cash bonus for FY19 is reflective of a 25 per cent reduction to recognise the impact of the underpayment of retail management.
(10) E A Berchtold resigned 11 January 2019.
73S U P E R R E TA I L G R O U P L I M I T E D A N N U A L R E P O R T 2020
Remuneration Report (Audited) FOR THE YEAR
ENDED 27 JUNE 2020
72 S U P E R R E T A I L G R O U P L I M I T E D A N N U A L R E P O R T 2 0 2 0
(1) Includes accruals for long service leave entitlements and accrued long term retention bonus for A Brandon of $48,801 ($61,764 in 2019).
(2) A M Heraghty was Managing Director of Outdoor from 1 July 2018 to 19 February 2019 and commenced as Group Managing Director and Chief Executive Officer from 20 February 2019. As approved at the Annual General Meeting held on 22 October 2019, A M Heraghty received a Long-Term Incentive grant of 86,294 performance rights and 53,262 performance rights in relation to a one-off co-investment grant. The Long-Term Incentive grant was valued in 2019 based on the Long-Term Incentive Plan in place at the date of commencement as Group Managing Director and Chief Executive Officer. This has been revised to be based on the share price at the date of the Annual General Meeting and reflecting the Long-Term Incentive Plan conditions that commenced in FY20. The co-investment grant is valued using the VWAP of the Company’s shares traded on the ASX over the first five trading days of the first trading window following commencement as Group Managing Director and Chief Executive Officer being 21 February 2019 to 27 February 2019, inclusive.
(3) P A Bradshaw commenced as KMP on 25 November 2019. Outcome pro-rated for length of service.
(4) B L Ward commenced as KMP on 1 August 2019. Included in the cash bonus total is a sign on bonus of $250,000. Outcome pro-rated for length of service.
(5) G S Williams commenced on 2 April 2019. Included in the cash bonus is a sign on bonus for G S Williams of $113,014 ($136,986 in 2019).
(6) C D Wilesmith resignation effective 9 August 2019. Termination benefits are accrued obligations as at 29 June 2019. Mr Wilesmith ceased as KMP on 31 July 2019.
(7) P A Birtles retired as Group Managing Director and Chief Executive Officer on 19 February 2019.
(8) A Brandon commenced as a KMP effective 1 May 2019.
(9) Cash bonus for FY19 is reflective of a 25 per cent reduction to recognise the impact of the underpayment of retail management.
(10) E A Berchtold resigned 11 January 2019.
Remuneration Report (Audited) FOR THE YEAR
ENDED 27 JUNE 2020
S U P E R R E T A I L G R O U P L I M I T E D A N N U A L R E P O R T 2 0 2 0 73
PERFORMANCE RIGHTS OVER EQUITY INSTRUMENTS OF SUPER RETAIL GROUP LIMITED
The movement during the reporting period in the number of performance rights over ordinary shares in the Company held (directly, indirectly or beneficially) by each Executive KMP, including their related parties, is detailed in Table 13. Table 13:
Held at 30 June
2019 Granted
(1) Vested Lapsed or Forfeited
Other Changes(2)
Held at 27 June
2020
Value of performance
rights granted in year(3)
Financial year in which grant
vests
2020 Number Number Number Number Number Number $ Year
A M Heraghty 2016 14,685 - (1,411) (11,863) - 1,411 n/a 2019, 2020, 2021 2017 45,586 - (17,618) (10,349) - 17,619 n/a 2020, 2021, 2022 2018(4) 59,526 - - - - 59,526 n/a 2021, 2022, 2023 2019 50,200 - - - - 50,200 n/a 2022, 2023, 2024 2020(6) - 139,556 - - - 139,556 1,006,644 2023, 2024
P A Bradshaw 2020 - 40,913 - - - 40,913 315,848 2023, 2024
D J Burns
2016 9,834 - (945) (7,945) - 944 n/a 2019, 2020, 2021 2017 30,685 - (11,859) (6,966) - 11,860 n/a 2020, 2021, 2022 2018(4) 50,860 - - - - 50,860 n/a 2021, 2022, 2023 2019 44,006 - - - - 44,006 n/a 2022, 2023, 2024 2020 - 44,060 - - - 44,060 340,143 2023, 2024
B L Ward 2020 - 44,060 - - - 44,060 340,143 2023, 2024
G S Williams 2019 - - - - - - - n/a 2020 - 44,060 - - - 44,060 340,143 2023, 2024
C D Wilesmith
2016 12,335 - (1,185) (9,965) (1,185) - n/a 2019, 2020, 2021 2017 39,666 - (15,330) (9,005) (15,331) - n/a 2020, 2021, 2022 2018 54,114 - - (16,096) (38,018) - n/a 2021, 2022, 2023 2019 46,940 - - (46,940) - - n/a 2022, 2023, 2024 2020(2) - - - - - - n/a 2023, 2024
(1) Performance rights provided as remuneration to each of the Executive KMP of the Group during the financial year. (2) Ceased as Executive KMP on 31 July therefore Performance Rights disclosed as being Executive KMP become nil. (3) The maximum possible total financial value in future years is dependent on the Group share price at exercise date, the minimum possible total value is nil. (4) These performance rights will partially vest with the announcement of the FY20 results. (5) All vested performance rights are exercisable. (6) As approved at the Annual General Meeting held on 22 October 2019, A M Heraghty received a Long-Term Incentive grant of 86,294 performance rights and
53,262 performance rights in relation to a one-off co-investment grant. (7) A Brandon has not received any performance rights.

74 S U P E R R E TA I L G R O U P L I M I T E D A N N U A L R E P O R T 2020
Remuneration Report (Audited) FOR THE YEAR
ENDED 27 JUNE 2020
74 S U P E R R E T A I L G R O U P L I M I T E D A N N U A L R E P O R T 2 0 2 0
The performance rights granted in the current reporting period were valued for the purpose of the financial statements using a fair value of $7.72 (with the exception of A M Heraghty – refer Table 13 and Table 17), which is the share price at the grant date of 1 September 2019.
The performance rights are expensed over their vesting period in line with the vesting conditions of the performance rights. Refer to Section 5 for details of these vesting conditions.
The value at exercise date for performance rights is the Group share price.
There are no amounts unpaid on the shares issued as a result of the exercise of the options in the 2020 financial year.
OPTION OVER EQUITY INSTRUMENTS OF SUPER RETAIL GROUP LIMITED
No options were granted or vested during the financial year.
REMUNERATION EXPENSE OF DIRECTORS AND EXECUTIVE KEY MANAGEMENT PERSONNEL
Table 14: 2016(1)
$m 2017(2)
$m 2018(3)
$m 2019(4)
$m 2020 $m
Base Salary Package 5.4 5.1 5.2 5.6 5.2 Short-Term Incentive 0.8 2.1 0.8 1.1 2.3
Long-Term Incentive 0.5 1.1 0.5 (0.2) 0.8 Total 6.7 8.3 6.5 6.5 8.3
(1) 2016 is a 53-week reporting period compared to 52 weeks for the other five years and excludes “Other” remuneration. (2) During 2017 the number of Executive KMP decreased from six to five which impacts year-on-year comparisons. (3) The 2018 remuneration expense attributable to Executive KMP accounts for the impact of the underpayment of Set Up team members. (4) The 2019 remuneration expense attributable to Executive KMP accounts for the impact of the underpayment of retail management.
Total remuneration paid to KMP as a proportion of normalised profit before tax was 4.3 per cent in FY16, reaching 4.4 per cent in FY17.
The FY18 and FY19 outcomes for Executive KMP were reduced for the team member underpayments and a period of transition across the Executive KMP, with a transition to a new Group MD and CEO and temporary reduction in the number of Executive KMP.
In FY20 remuneration paid to KMP was 3.8 per cent of normalised profit before tax (refer to Table 1 and Table 14).
(A) EQUITY INSTRUMENTS HELD BY KMP
(i) Shares provided on exercise of performance rights and options
The table below lists the ordinary shares in the Company issued during the year as a result of the exercise of performance rights. There were no shares issued during the year ended 27 June 2020 on the exercise of options.
Table 15:
Name Incentive Scheme(1) Number of Ordinary Shares Issued on Exercise of Share
Plans During the Year(2)
Market Value at Exercise Date(3)
A M Heraghty Performance Rights Plan 19,029 187,436 P A Bradshaw n/a n/a n/a A Brandon n/a n/a n/a D J Burns Performance Rights Plan 12,804 126,119 B L Ward n/a n/a n/a G S Williams n/a n/a n/a C D Wilesmith n/a 16,515 162,673
Total 48,348 476,228 (1) Refer to Section 4 – Performance Rights Plan. (2) The FY16 and FY17 grants vesting due to hurdles being met. (3) The value at exercise date for performance rights is determined using the Company share price.
75S U P E R R E TA I L G R O U P L I M I T E D A N N U A L R E P O R T 2020
Remuneration Report (Audited) FOR THE YEAR
ENDED 27 JUNE 2020
74 S U P E R R E T A I L G R O U P L I M I T E D A N N U A L R E P O R T 2 0 2 0
The performance rights granted in the current reporting period were valued for the purpose of the financial statements using a fair value of $7.72 (with the exception of A M Heraghty – refer Table 13 and Table 17), which is the share price at the grant date of 1 September 2019.
The performance rights are expensed over their vesting period in line with the vesting conditions of the performance rights. Refer to Section 5 for details of these vesting conditions.
The value at exercise date for performance rights is the Group share price.
There are no amounts unpaid on the shares issued as a result of the exercise of the options in the 2020 financial year.
OPTION OVER EQUITY INSTRUMENTS OF SUPER RETAIL GROUP LIMITED
No options were granted or vested during the financial year.
REMUNERATION EXPENSE OF DIRECTORS AND EXECUTIVE KEY MANAGEMENT PERSONNEL
Table 14: 2016(1)
$m 2017(2)
$m 2018(3)
$m 2019(4)
$m 2020 $m
Base Salary Package 5.4 5.1 5.2 5.6 5.2 Short-Term Incentive 0.8 2.1 0.8 1.1 2.3
Long-Term Incentive 0.5 1.1 0.5 (0.2) 0.8 Total 6.7 8.3 6.5 6.5 8.3
(1) 2016 is a 53-week reporting period compared to 52 weeks for the other five years and excludes “Other” remuneration. (2) During 2017 the number of Executive KMP decreased from six to five which impacts year-on-year comparisons. (3) The 2018 remuneration expense attributable to Executive KMP accounts for the impact of the underpayment of Set Up team members. (4) The 2019 remuneration expense attributable to Executive KMP accounts for the impact of the underpayment of retail management.
Total remuneration paid to KMP as a proportion of normalised profit before tax was 4.3 per cent in FY16, reaching 4.4 per cent in FY17.
The FY18 and FY19 outcomes for Executive KMP were reduced for the team member underpayments and a period of transition across the Executive KMP, with a transition to a new Group MD and CEO and temporary reduction in the number of Executive KMP.
In FY20 remuneration paid to KMP was 3.8 per cent of normalised profit before tax (refer to Table 1 and Table 14).
(A) EQUITY INSTRUMENTS HELD BY KMP
(i) Shares provided on exercise of performance rights and options
The table below lists the ordinary shares in the Company issued during the year as a result of the exercise of performance rights. There were no shares issued during the year ended 27 June 2020 on the exercise of options.
Table 15:
Name Incentive Scheme(1) Number of Ordinary Shares Issued on Exercise of Share
Plans During the Year(2)
Market Value at Exercise Date(3)
A M Heraghty Performance Rights Plan 19,029 187,436 P A Bradshaw n/a n/a n/a A Brandon n/a n/a n/a D J Burns Performance Rights Plan 12,804 126,119 B L Ward n/a n/a n/a G S Williams n/a n/a n/a C D Wilesmith n/a 16,515 162,673
Total 48,348 476,228 (1) Refer to Section 4 – Performance Rights Plan. (2) The FY16 and FY17 grants vesting due to hurdles being met. (3) The value at exercise date for performance rights is determined using the Company share price.
Remuneration Report (Audited) FOR THE YEAR
ENDED 27 JUNE 2020
S U P E R R E T A I L G R O U P L I M I T E D A N N U A L R E P O R T 2 0 2 0 75
(ii) Movement in shares
The movement during the year in the number of ordinary shares in the company held directly or indirectly or beneficially, by each KMP, including their related parties is detailed in Table 16.
Table 16:
2020
Held at 30 June
2019
Exercise of performance
rights Purchases Entitlement
offer In lieu of
dividends (1) Other
changes
Held at 27 June
2020 Non-Executive Directors
S A Pitkin 42,153 - 10,000 - - - 52,153 R A Rowe 59,936,866 - - 8,236,305 6,098 - 68,179,269 D J Eilert 15,500 - - - - - 15,550 H L Mowlem 30,000 - - - - - 30,000 P D Everingham 17,000 - 23,000 - - - 40,000 S A Chaplain - - - - - - - G T Dunne - - - - - - - L K Inman(2,4) 22,175 - - - - (22,175) - Executive Director A M Heraghty 40,691 19,029 - - - - 59,720 Other Executive KMP
P A Bradshaw - - - - - - - A Brandon - - - - - - - D J Burns 20,833 12,804 - - - - 33,637 B L Ward - - - - - - - G S Williams - - - - - - - C D Wilesmith(3,4) 4,347 - - - - (4,347) -
(1) Shareholders are eligible to receive dividends in cash or choose to participate in the dividend reinvestment plan. (2) L K Inman ceased to be a KMP on 22 October 2019. (3) C D Wilesmith ceased to be a KMP on 31 July 2019. (4) Ceased as KMP therefore shares disclosed as KMP become nil. (iii) Unissued shares under performance rights and options plans
Unissued ordinary shares of Super Retail Group Limited under the Performance Rights Plan at the date of this report is detailed in Table 17.
Table 17:
Grant date Value per performance right at grant date
Number of performance rights
1 September 2015 $8.17 9,952 1 September 2016 $7.99 147,054 1 September 2017 $6.38 465,885 1 September 2018 $7.65 339,700 1 September 2019 $7.72(1) 674,154 Total 1,636,745
(1) The performance rights value for the 1 September 2019 grant was $7.72 with the exception of A M Heraghty who received a long-term incentive Grant of 86,294 performance rights and 53,262 performance rights in relation to a one-off co-investment grant with these grants averaging a value of $7.21.
(2) Refer to Section 5 for details of vesting conditions.
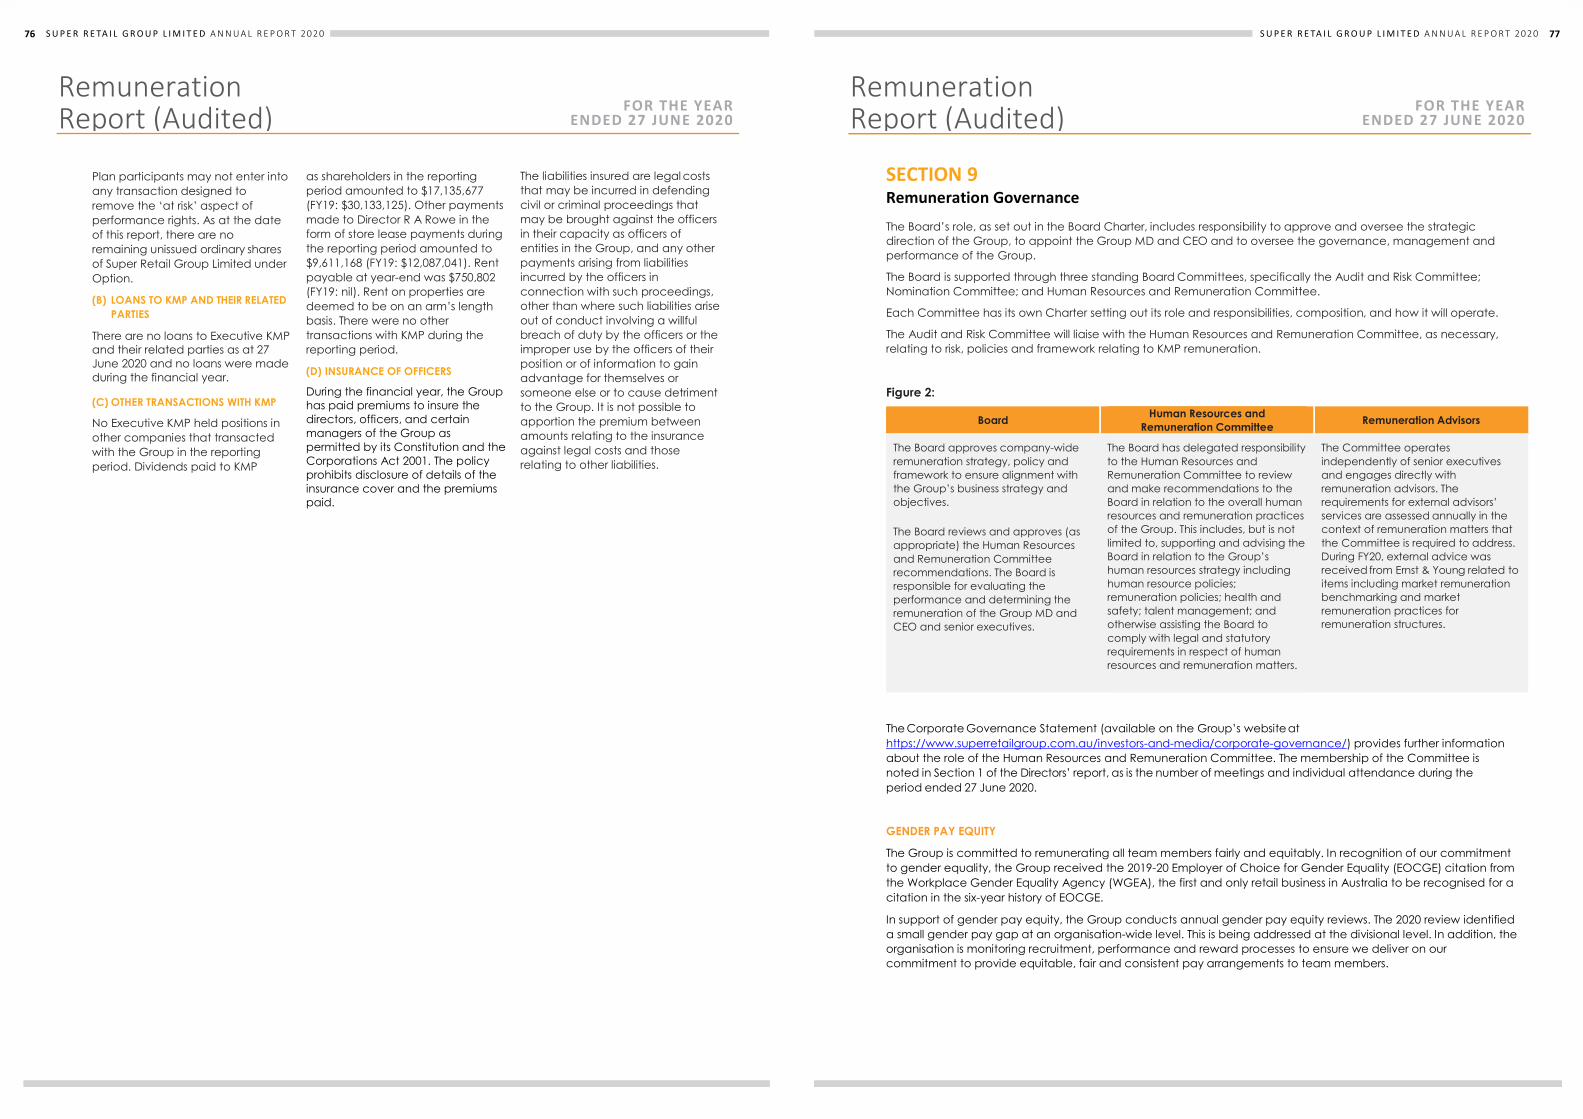
76 S U P E R R E TA I L G R O U P L I M I T E D A N N U A L R E P O R T 2020
Remuneration Report (Audited) FOR THE YEAR
ENDED 27 JUNE 2020
76 S U P E R R E T A I L G R O U P L I M I T E D A N N U A L R E P O R T 2 0 2 0
Plan participants may not enter into any transaction designed to remove the ‘at risk’ aspect of performance rights. As at the date of this report, there are no remaining unissued ordinary shares of Super Retail Group Limited under Option.
(B) LOANS TO KMP AND THEIR RELATED PARTIES
There are no loans to Executive KMP and their related parties as at 27 June 2020 and no loans were made during the financial year.
(C) OTHER TRANSACTIONS WITH KMP
No Executive KMP held positions in other companies that transacted with the Group in the reporting period. Dividends paid to KMP
as shareholders in the reporting period amounted to $17,135,677 (FY19: $30,133,125). Other payments made to Director R A Rowe in the form of store lease payments during the reporting period amounted to $9,611,168 (FY19: $12,087,041). Rent payable at year-end was $750,802 (FY19: nil). Rent on properties are deemed to be on an arm’s length basis. There were no other transactions with KMP during the reporting period.
(D) INSURANCE OF OFFICERS
During the financial year, the Group has paid premiums to insure the directors, officers, and certain managers of the Group as permitted by its Constitution and the Corporations Act 2001. The policy prohibits disclosure of details of the insurance cover and the premiums paid.
The liabilities insured are legal costs that may be incurred in defending civil or criminal proceedings that may be brought against the officers in their capacity as officers of entities in the Group, and any other payments arising from liabilities incurred by the officers in connection with such proceedings, other than where such liabilities arise out of conduct involving a willful breach of duty by the officers or the improper use by the officers of their position or of information to gain advantage for themselves or someone else or to cause detriment to the Group. It is not possible to apportion the premium between amounts relating to the insurance against legal costs and those relating to other liabilities.
77S U P E R R E TA I L G R O U P L I M I T E D A N N U A L R E P O R T 2020
Remuneration Report (Audited) FOR THE YEAR
ENDED 27 JUNE 2020
S U P E R R E T A I L G R O U P L I M I T E D A N N U A L R E P O R T 2 0 2 0 77
SECTION 9 Remuneration Governance
The Board’s role, as set out in the Board Charter, includes responsibility to approve and oversee the strategic direction of the Group, to appoint the Group MD and CEO and to oversee the governance, management and performance of the Group.
The Board is supported through three standing Board Committees, specifically the Audit and Risk Committee; Nomination Committee; and Human Resources and Remuneration Committee.
Each Committee has its own Charter setting out its role and responsibilities, composition, and how it will operate.
The Audit and Risk Committee will liaise with the Human Resources and Remuneration Committee, as necessary, relating to risk, policies and framework relating to KMP remuneration.
Figure 2:
Board Human Resources and Remuneration Committee Remuneration Advisors
The Board approves company-wide remuneration strategy, policy and framework to ensure alignment with the Group’s business strategy and objectives. The Board reviews and approves (as appropriate) the Human Resources and Remuneration Committee recommendations. The Board is responsible for evaluating the performance and determining the remuneration of the Group MD and CEO and senior executives.
The Board has delegated responsibility to the Human Resources and Remuneration Committee to review and make recommendations to the Board in relation to the overall human resources and remuneration practices of the Group. This includes, but is not limited to, supporting and advising the Board in relation to the Group’s human resources strategy including human resource policies; remuneration policies; health and safety; talent management; and otherwise assisting the Board to comply with legal and statutory requirements in respect of human resources and remuneration matters.
The Committee operates independently of senior executives and engages directly with remuneration advisors. The requirements for external advisors’ services are assessed annually in the context of remuneration matters that the Committee is required to address. During FY20, external advice was received from Ernst & Young related to items including market remuneration benchmarking and market remuneration practices for remuneration structures.
The Corporate Governance Statement (available on the Group’s website at https://www.superretailgroup.com.au/investors-and-media/corporate-governance/) provides further information about the role of the Human Resources and Remuneration Committee. The membership of the Committee is noted in Section 1 of the Directors’ report, as is the number of meetings and individual attendance during the period ended 27 June 2020.
GENDER PAY EQUITY
The Group is committed to remunerating all team members fairly and equitably. In recognition of our commitment to gender equality, the Group received the 2019-20 Employer of Choice for Gender Equality (EOCGE) citation from the Workplace Gender Equality Agency (WGEA), the first and only retail business in Australia to be recognised for a citation in the six-year history of EOCGE.
In support of gender pay equity, the Group conducts annual gender pay equity reviews. The 2020 review identified a small gender pay gap at an organisation-wide level. This is being addressed at the divisional level. In addition, the organisation is monitoring recruitment, performance and reward processes to ensure we deliver on our commitment to provide equitable, fair and consistent pay arrangements to team members.

78 S U P E R R E TA I L G R O U P L I M I T E D A N N U A L R E P O R T 2020
Remuneration Report (Audited) FOR THE YEAR
ENDED 27 JUNE 2020
78 S U P E R R E T A I L G R O U P L I M I T E D A N N U A L R E P O R T 2 0 2 0
SERVICE AGREEMENTS
Remuneration and other terms of employment for ongoing Executive KMP are formalised in service agreements. Each of these agreements provide for the provision of performance related cash bonuses, other benefits and when eligible, participation in the Performance Rights Plans and Option Plans. Restraint provisions are detailed below.
All contracts with Executive KMP may be terminated early by either party as shown in Table 18.
Table 18:
Name Term of Agreement
Agreement Commencement
Date(1)
Termination payment
Commencement date with
Super Retail Group A M Heraghty Ongoing 20 February 2019 12 months(2) 27 April 2015 P A Bradshaw Ongoing 25 November 2019 6 months(2) 25 November 2019 A Brandon Ongoing 31 March 2018 6 months(2) 31 March 2018 D J Burns Ongoing 3 October 2018 6 months(2) 3 December 2012 B L Ward Ongoing 1 August 2019 6 months(2) 29 July 2019 G S Williams Ongoing 2 April 2019 6 months(2) 2 April 2019
(1) Commencement date of service agreement. (2) Payment of a termination benefit on early termination by the Company, other than for cause, equal to the base salary for the period detailed.
PERIOD OF RESTRAINT
Executive KMP have post-employment restraints within their service contracts.
After cessation of employment for any reason, the employee must not compete with the company’s relevant specialty retailing businesses (including direct or indirect involvement as a principal, agent, partner, employee, shareholder, unit holder, director, trustee, beneficiary, manager, contractor, adviser or financier), without first obtaining the consent of the company in writing. These restraints range from periods of 12 months for Group MD and CEO to 3 –12 months for other Executive KMP.
79S U P E R R E TA I L G R O U P L I M I T E D A N N U A L R E P O R T 2020
Financial Report
Super Retail Group Limited ABN: 81 108 676 204 ASX Code: SUL
F O R T H E Y E A R E N D E D 2 7 J U N E 2 0 2 0
2019 – 2020
Remuneration Report (Audited) FOR THE YEAR
ENDED 27 JUNE 2020
78 S U P E R R E T A I L G R O U P L I M I T E D A N N U A L R E P O R T 2 0 2 0
SERVICE AGREEMENTS
Remuneration and other terms of employment for ongoing Executive KMP are formalised in service agreements. Each of these agreements provide for the provision of performance related cash bonuses, other benefits and when eligible, participation in the Performance Rights Plans and Option Plans. Restraint provisions are detailed below.
All contracts with Executive KMP may be terminated early by either party as shown in Table 18.
Table 18:
Name Term of Agreement
Agreement Commencement
Date(1)
Termination payment
Commencement date with
Super Retail Group A M Heraghty Ongoing 20 February 2019 12 months(2) 27 April 2015 P A Bradshaw Ongoing 25 November 2019 6 months(2) 25 November 2019 A Brandon Ongoing 31 March 2018 6 months(2) 31 March 2018 D J Burns Ongoing 3 October 2018 6 months(2) 3 December 2012 B L Ward Ongoing 1 August 2019 6 months(2) 29 July 2019 G S Williams Ongoing 2 April 2019 6 months(2) 2 April 2019
(1) Commencement date of service agreement. (2) Payment of a termination benefit on early termination by the Company, other than for cause, equal to the base salary for the period detailed.
PERIOD OF RESTRAINT
Executive KMP have post-employment restraints within their service contracts.
After cessation of employment for any reason, the employee must not compete with the company’s relevant specialty retailing businesses (including direct or indirect involvement as a principal, agent, partner, employee, shareholder, unit holder, director, trustee, beneficiary, manager, contractor, adviser or financier), without first obtaining the consent of the company in writing. These restraints range from periods of 12 months for Group MD and CEO to 3 –12 months for other Executive KMP.

80 S U P E R R E TA I L G R O U P L I M I T E D A N N U A L R E P O R T 202080 S U P E R R E T A I L G R O U P L I M I T E D A N N U A L R E P O R T 2 0 2 0
CONSOLIDATED STATEMENT OF COMPREHENSIVE INCOME For the period ended 27 June 2020
Notes 2020
$m 2019
$m CONTINUING OPERATIONS Revenue from continuing operations 2,825.2 2,710.4 Other income from continuing operations 0.2 2.8 Total revenues and other income 5 2,825.4 2,713.2 Expenses Cost of sales of goods (1,555.1) (1,488.2) Other expenses from ordinary activities - selling and distribution (371.2) (347.8) - marketing (79.1) (81.9) - occupancy (204.9) (215.5) - administration (403.6) (366.4) Net finance costs 6 (55.1) (21.3) Share of net loss of associates and joint ventures 6 (0.6) (2.6) Total expenses (2,669.6) (2,523.7) Profit before income tax 155.8 189.5 Income tax expense 14 (45.6) (50.3) Profit for the period 110.2 139.2 Profit for the period is attributable to: Owners of Super Retail Group Limited 110.2 139.3 Non-controlling interests - (0.1)
110.2 139.2
OTHER COMPREHENSIVE INCOME Items that may be reclassified to profit or loss Changes in the fair value of cash flow hedges 19 1.0 (6.3) Exchange differences on translation of foreign operations 19 (1.5) 2.7 Other comprehensive income for the period, net of tax (0.5) (3.6) Total comprehensive income for the period 109.7 135.6 Total comprehensive income for the period is attributable to: Owners of Super Retail Group Limited 109.7 135.7 Non-controlling interests - (0.1)
109.7 135.6
Earnings per share for profit attributable to the ordinary equity holders of the Company: Basic earnings per share 17 55.8 70.6 Diluted earnings per share 17 55.3 69.9 The above consolidated statement of comprehensive income should be read in conjunction with the accompanying notes.
81S U P E R R E TA I L G R O U P L I M I T E D A N N U A L R E P O R T 202080 S U P E R R E T A I L G R O U P L I M I T E D A N N U A L R E P O R T 2 0 2 0
CONSOLIDATED STATEMENT OF COMPREHENSIVE INCOME For the period ended 27 June 2020
Notes 2020
$m 2019
$m CONTINUING OPERATIONS Revenue from continuing operations 2,825.2 2,710.4 Other income from continuing operations 0.2 2.8 Total revenues and other income 5 2,825.4 2,713.2 Expenses Cost of sales of goods (1,555.1) (1,488.2) Other expenses from ordinary activities - selling and distribution (371.2) (347.8) - marketing (79.1) (81.9) - occupancy (204.9) (215.5) - administration (403.6) (366.4) Net finance costs 6 (55.1) (21.3) Share of net loss of associates and joint ventures 6 (0.6) (2.6) Total expenses (2,669.6) (2,523.7) Profit before income tax 155.8 189.5 Income tax expense 14 (45.6) (50.3) Profit for the period 110.2 139.2 Profit for the period is attributable to: Owners of Super Retail Group Limited 110.2 139.3 Non-controlling interests - (0.1)
110.2 139.2
OTHER COMPREHENSIVE INCOME Items that may be reclassified to profit or loss Changes in the fair value of cash flow hedges 19 1.0 (6.3) Exchange differences on translation of foreign operations 19 (1.5) 2.7 Other comprehensive income for the period, net of tax (0.5) (3.6) Total comprehensive income for the period 109.7 135.6 Total comprehensive income for the period is attributable to: Owners of Super Retail Group Limited 109.7 135.7 Non-controlling interests - (0.1)
109.7 135.6
Earnings per share for profit attributable to the ordinary equity holders of the Company: Basic earnings per share 17 55.8 70.6 Diluted earnings per share 17 55.3 69.9 The above consolidated statement of comprehensive income should be read in conjunction with the accompanying notes.
S U P E R R E T A I L G R O U P L I M I T E D A N N U A L R E P O R T 2 0 2 0 81
CONSOLIDATED BALANCE SHEET As at 27 June 2020
Notes
2020
$m 2019
$m ASSETS Current assets Cash and cash equivalents 285.1 7.5 Trade and other receivables 7 26.3 37.6 Inventories 8 502.4 560.2 Current tax asset 14 - 1.9 Derivative financial instruments 16 - 2.8 Total current assets 813.8 610.0 Non-current assets Property, plant and equipment 9 227.8 267.9 Right-of-use assets 11 848.0 - Intangible assets 10 874.3 894.2 Deferred tax assets 14 4.9 - Other financial assets 24(b) 6.3 6.9 Total non-current assets 1,961.3 1,169.0 Total assets 2,775.1 1,779.0 LIABILITIES Current liabilities Trade and other payables 12 442.3 362.7 Borrowings 13 - 3.4 Lease liabilities 11 178.4 - Current tax liabilities 14 17.1 - Provisions 15 111.1 107.3 Derivative financial instruments 16 1.9 6.2 Total current liabilities 750.8 479.6 Non-current liabilities Trade and other payables 12 - 49.5 Borrowings 13 247.8 390.8 Lease liabilities 11 760.9 - Deferred tax liabilities 14 - 23.4 Provisions 15 24.3 19.7 Total non-current liabilities 1,033.0 483.4 Total liabilities 1,783.8 963.0
NET ASSETS 991.3 816.0
EQUITY Contributed equity 18 698.1 542.3 Reserves 19 7.5 8.2 Retained earnings 19 285.7 265.9 Capital and reserves attributable to owners of Super Retail Group Limited 991.3 816.4 Non-controlling interests - (0.4)
TOTAL EQUITY 991.3 816.0 The above consolidated balance sheet should be read in conjunction with the accompanying notes.
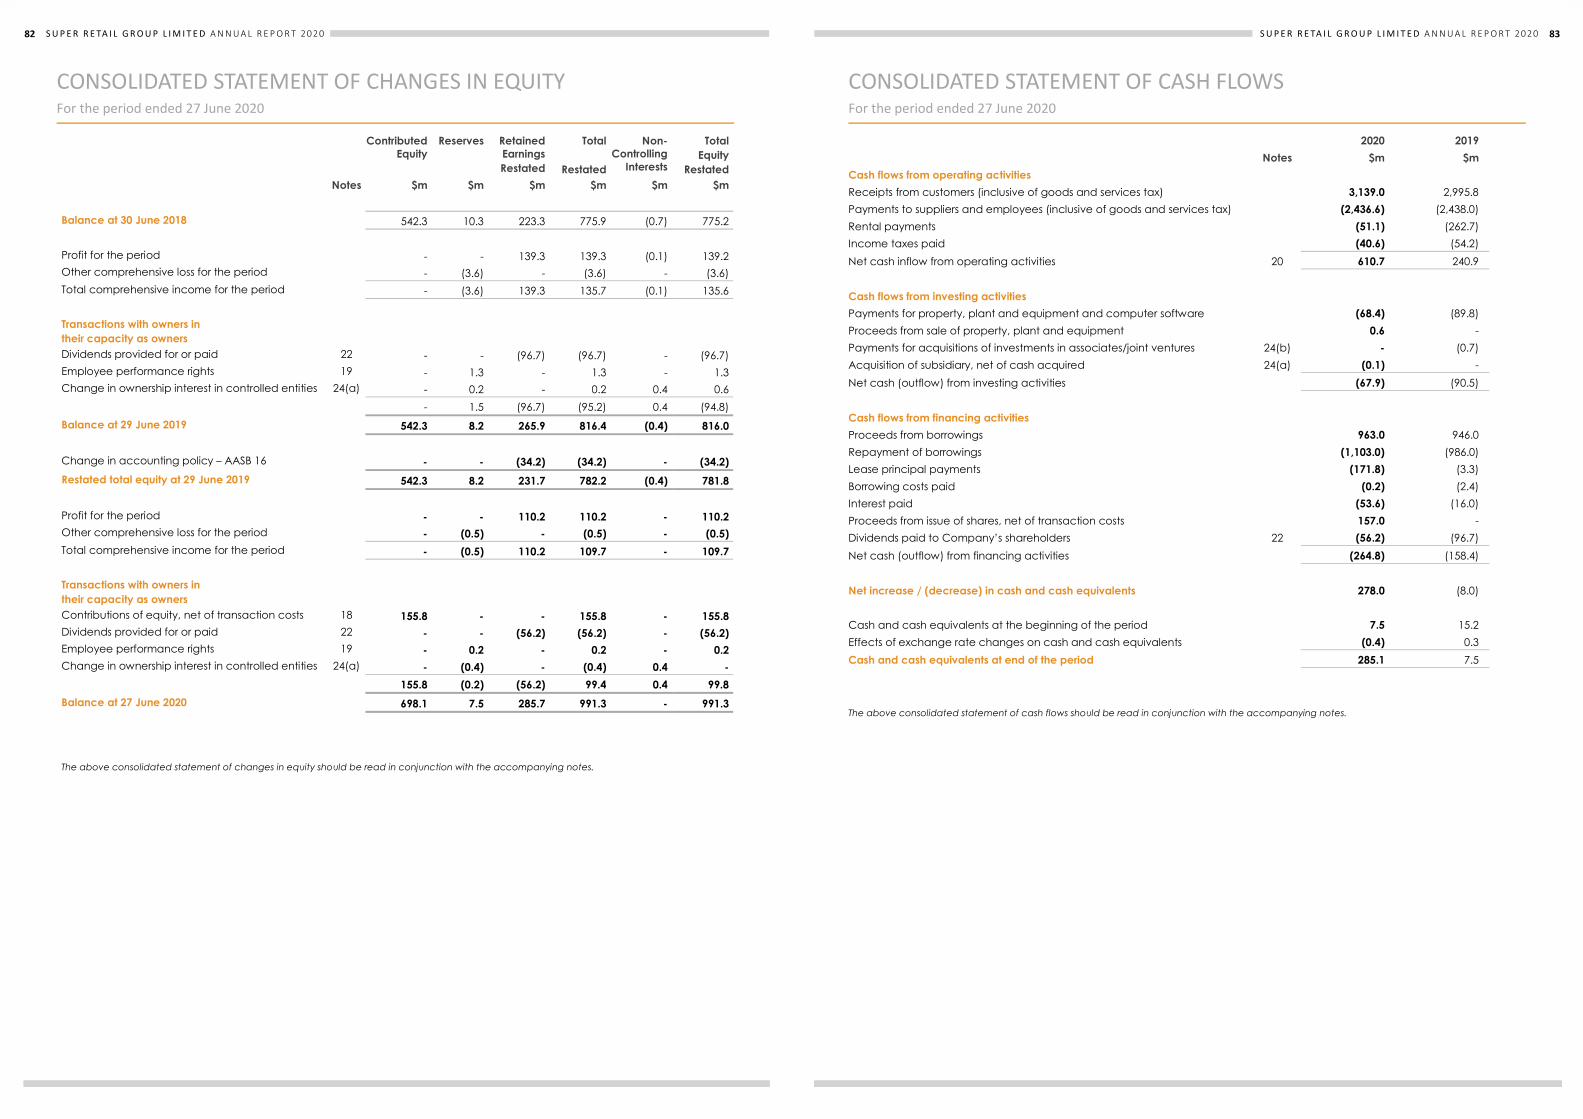
82 S U P E R R E TA I L G R O U P L I M I T E D A N N U A L R E P O R T 202082 S U P E R R E T A I L G R O U P L I M I T E D A N N U A L R E P O R T 2 0 2 0
CONSOLIDATED STATEMENT OF CHANGES IN EQUITY For the period ended 27 June 2020
Contributed Equity
Reserves Retained Earnings Restated
Total
Restated
Non-Controlling
Interests
Total Equity
Restated Notes $m $m $m $m $m $m Balance at 30 June 2018 542.3 10.3 223.3 775.9 (0.7) 775.2 Profit for the period - - 139.3 139.3 (0.1) 139.2 Other comprehensive loss for the period - (3.6) - (3.6) - (3.6) Total comprehensive income for the period - (3.6) 139.3 135.7 (0.1) 135.6 Transactions with owners in their capacity as owners
Dividends provided for or paid 22 - - (96.7) (96.7) - (96.7) Employee performance rights 19 - 1.3 - 1.3 - 1.3 Change in ownership interest in controlled entities 24(a) - 0.2 - 0.2 0.4 0.6 - 1.5 (96.7) (95.2) 0.4 (94.8) Balance at 29 June 2019 542.3 8.2 265.9 816.4 (0.4) 816.0 Change in accounting policy – AASB 16 - - (34.2) (34.2) - (34.2) Restated total equity at 29 June 2019 542.3 8.2 231.7 782.2 (0.4) 781.8 Profit for the period - - 110.2 110.2 - 110.2 Other comprehensive loss for the period - (0.5) - (0.5) - (0.5) Total comprehensive income for the period - (0.5) 110.2 109.7 - 109.7 Transactions with owners in their capacity as owners
Contributions of equity, net of transaction costs 18 155.8 - - 155.8 - 155.8 Dividends provided for or paid 22 - - (56.2) (56.2) - (56.2) Employee performance rights 19 - 0.2 - 0.2 - 0.2 Change in ownership interest in controlled entities 24(a) - (0.4) - (0.4) 0.4 - 155.8 (0.2) (56.2) 99.4 0.4 99.8 Balance at 27 June 2020 698.1 7.5 285.7 991.3 - 991.3
The above consolidated statement of changes in equity should be read in conjunction with the accompanying notes.
83S U P E R R E TA I L G R O U P L I M I T E D A N N U A L R E P O R T 202082 S U P E R R E T A I L G R O U P L I M I T E D A N N U A L R E P O R T 2 0 2 0
CONSOLIDATED STATEMENT OF CHANGES IN EQUITY For the period ended 27 June 2020
Contributed Equity
Reserves Retained Earnings Restated
Total
Restated
Non-Controlling
Interests
Total Equity
Restated Notes $m $m $m $m $m $m Balance at 30 June 2018 542.3 10.3 223.3 775.9 (0.7) 775.2 Profit for the period - - 139.3 139.3 (0.1) 139.2 Other comprehensive loss for the period - (3.6) - (3.6) - (3.6) Total comprehensive income for the period - (3.6) 139.3 135.7 (0.1) 135.6 Transactions with owners in their capacity as owners
Dividends provided for or paid 22 - - (96.7) (96.7) - (96.7) Employee performance rights 19 - 1.3 - 1.3 - 1.3 Change in ownership interest in controlled entities 24(a) - 0.2 - 0.2 0.4 0.6 - 1.5 (96.7) (95.2) 0.4 (94.8) Balance at 29 June 2019 542.3 8.2 265.9 816.4 (0.4) 816.0 Change in accounting policy – AASB 16 - - (34.2) (34.2) - (34.2) Restated total equity at 29 June 2019 542.3 8.2 231.7 782.2 (0.4) 781.8 Profit for the period - - 110.2 110.2 - 110.2 Other comprehensive loss for the period - (0.5) - (0.5) - (0.5) Total comprehensive income for the period - (0.5) 110.2 109.7 - 109.7 Transactions with owners in their capacity as owners
Contributions of equity, net of transaction costs 18 155.8 - - 155.8 - 155.8 Dividends provided for or paid 22 - - (56.2) (56.2) - (56.2) Employee performance rights 19 - 0.2 - 0.2 - 0.2 Change in ownership interest in controlled entities 24(a) - (0.4) - (0.4) 0.4 - 155.8 (0.2) (56.2) 99.4 0.4 99.8 Balance at 27 June 2020 698.1 7.5 285.7 991.3 - 991.3
The above consolidated statement of changes in equity should be read in conjunction with the accompanying notes.
S U P E R R E T A I L G R O U P L I M I T E D A N N U A L R E P O R T 2 0 2 0 83
CONSOLIDATED STATEMENT OF CASH FLOWS For the period ended 27 June 2020
2020 2019 Notes $m $m Cash flows from operating activities Receipts from customers (inclusive of goods and services tax) 3,139.0 2,995.8 Payments to suppliers and employees (inclusive of goods and services tax) (2,436.6) (2,438.0) Rental payments (51.1) (262.7) Income taxes paid (40.6) (54.2) Net cash inflow from operating activities 20 610.7 240.9 Cash flows from investing activities Payments for property, plant and equipment and computer software (68.4) (89.8) Proceeds from sale of property, plant and equipment 0.6 - Payments for acquisitions of investments in associates/joint ventures 24(b) - (0.7) Acquisition of subsidiary, net of cash acquired 24(a) (0.1) - Net cash (outflow) from investing activities (67.9) (90.5) Cash flows from financing activities Proceeds from borrowings 963.0 946.0 Repayment of borrowings (1,103.0) (986.0) Lease principal payments (171.8) (3.3) Borrowing costs paid (0.2) (2.4) Interest paid (53.6) (16.0) Proceeds from issue of shares, net of transaction costs 157.0 - Dividends paid to Company’s shareholders 22 (56.2) (96.7) Net cash (outflow) from financing activities (264.8) (158.4)
Net increase / (decrease) in cash and cash equivalents 278.0 (8.0) Cash and cash equivalents at the beginning of the period 7.5 15.2 Effects of exchange rate changes on cash and cash equivalents (0.4) 0.3 Cash and cash equivalents at end of the period 285.1 7.5
The above consolidated statement of cash flows should be read in conjunction with the accompanying notes.

84 S U P E R R E TA I L G R O U P L I M I T E D A N N U A L R E P O R T 202084 S U P E R R E T A I L G R O U P L I M I T E D A N N U A L R E P O R T 2 0 2 0
NOTES TO THE CONSOLIDATED FINANCIAL STATEMENTS For the period ended 27 June 2020
TABLE OF CONTENTS Basis of Preparation 1. Reporting entity 85 2. Summary of significant accounting policies 85 3. Critical accounting estimates and judgements 87 Group Performance 4. Segment information 88 5. Revenue and other income from continuing operations 91 6. Expenses from continuing operations 91 Assets and Liabilities 7. Trade and other receivables 93 8. Inventories 94 9. Property, plant and equipment 94 10. Intangible assets 96 11. Leases 100 12. Trade and other payables 101 13. Borrowings 102 14. Income taxes 103 15. Provisions 107 16. Financial assets and financial liabilities 109 Capital Structure, Financing and Risk Management 17. Earnings per share 112 18. Contributed equity 113 19. Reserves and retained earnings 114 20. Reconciliation of profit from ordinary activities after income tax to net cash inflow from operating activities 115 21. Financial risk management 116 22. Capital management 122 Group Structure 23. Related party transactions 123 24. Business combinations 124 25. Deed of cross guarantee 125 26. Parent entity financial information 127 27. Investments in controlled entities 128 Other 28. Key management personnel disclosures 129 29. Share-based payments 129 30. Remuneration of auditors 130 31. Contingencies 131 32. Commitments 131 33. Net tangible asset backing 131 34. Changes in accounting policy 132 35. Events occurring after balance date 133
85S U P E R R E TA I L G R O U P L I M I T E D A N N U A L R E P O R T 202084 S U P E R R E T A I L G R O U P L I M I T E D A N N U A L R E P O R T 2 0 2 0
NOTES TO THE CONSOLIDATED FINANCIAL STATEMENTS For the period ended 27 June 2020
TABLE OF CONTENTS Basis of Preparation 1. Reporting entity 85 2. Summary of significant accounting policies 85 3. Critical accounting estimates and judgements 87 Group Performance 4. Segment information 88 5. Revenue and other income from continuing operations 91 6. Expenses from continuing operations 91 Assets and Liabilities 7. Trade and other receivables 93 8. Inventories 94 9. Property, plant and equipment 94 10. Intangible assets 96 11. Leases 100 12. Trade and other payables 101 13. Borrowings 102 14. Income taxes 103 15. Provisions 107 16. Financial assets and financial liabilities 109 Capital Structure, Financing and Risk Management 17. Earnings per share 112 18. Contributed equity 113 19. Reserves and retained earnings 114 20. Reconciliation of profit from ordinary activities after income tax to net cash inflow from operating activities 115 21. Financial risk management 116 22. Capital management 122 Group Structure 23. Related party transactions 123 24. Business combinations 124 25. Deed of cross guarantee 125 26. Parent entity financial information 127 27. Investments in controlled entities 128 Other 28. Key management personnel disclosures 129 29. Share-based payments 129 30. Remuneration of auditors 130 31. Contingencies 131 32. Commitments 131 33. Net tangible asset backing 131 34. Changes in accounting policy 132 35. Events occurring after balance date 133
S U P E R R E T A I L G R O U P L I M I T E D A N N U A L R E P O R T 2 0 2 0 85
NOTES TO THE CONSOLIDATED FINANCIAL STATEMENTS (continued) For the period ended 27 June 2020
1. Reporting entity Super Retail Group Limited (the Company or parent entity) is a company domiciled in Australia. The address of the Company’s registered office and principal place of business is 6 Coulthards Avenue, Strathpine, Queensland. The consolidated annual financial report of the Company as at and for the period ended 27 June 2020 comprises: the Company and its subsidiaries (together referred to as the Group, and individually as Group entities). The Group is a for-profit entity and is primarily involved in the retail industry. Principal activities of the Group consist of: retailing of auto parts and accessories, tools and equipment; retailing of boating, camping, outdoor equipment, fishing equipment and apparel; and retailing of sporting equipment and apparel.
2. Summary of significant accounting policies This section sets out the principal accounting policies upon which the Group’s consolidated financial statements are prepared as a whole. Specific accounting policies are described in their respective Notes to the Consolidated Financial Statements. These policies have been consistently applied to all the years presented, unless otherwise stated. (a) Basis of preparation Statement of compliance This general purpose financial report has been prepared in accordance with Australian Accounting Standards, other authoritative pronouncements of the Australian Accounting Standards Board, Urgent Issues Group Interpretations and the Corporations Act 2001. The consolidated financial statements and accompanying notes of Super Retail Group Limited comply with International Financial Reporting Standards (IFRS) as issued by the International Accounting Standards Board. Basis of measurement These financial statements have been prepared under the historical cost convention, unless otherwise stated. (b) Principles of consolidation The consolidated financial statements incorporate the assets and liabilities of all entities controlled by Super Retail Group Limited as at 27 June 2020 and the results of its controlled entities for the period then ended. The effects of all transactions between entities in the consolidated entity are fully eliminated. (i) Transactions eliminated on consolidation Intra-group balances and transactions, and any unrealised income and expenses arising from intra-group transactions, are eliminated in preparing the consolidated financial statements. Unrealised losses are eliminated in the same way as unrealised gains, but only to the extent that there is no evidence of impairment. (ii) Subsidiaries Subsidiaries are all entities (including structured entities) over which the Group has control. The Group controls an entity when the Group is exposed to, or has rights to, variable returns from its involvement with the entity and has the ability to affect those returns through its power to direct the activities of the entity. Subsidiaries are fully consolidated from the date on which control is transferred to the Group. These are deconsolidated from the date that control ceases. Intercompany transactions, balances and unrealised gains on transactions between Group companies are eliminated. Unrealised losses are also eliminated unless the transaction provides evidence of an impairment of the transferred asset. Accounting policies of subsidiaries have been changed where necessary to ensure consistency with the policies adopted by the Group. Non-controlling interests in the results and equity of subsidiaries are shown separately in the consolidated income statement, statement of comprehensive income, balance sheet and statement of changes in equity respectively. (iii) Business combinations The acquisition method of accounting is used to account for all business combinations (refer Note 23 - Business combinations), regardless of whether equity instruments or other assets are acquired. The consideration transferred for the acquisition of a subsidiary comprises the fair value of the assets transferred, the liabilities incurred and the equity interests issued by the Group. The consideration transferred also includes the fair value of any contingent consideration arrangement and the fair value of any pre-existing equity interest in the subsidiary. Acquisition-related costs are expensed as incurred. Identifiable assets acquired and liabilities and contingent liabilities assumed in a business combination are, with limited exceptions, measured initially at their fair values as at the acquisition date. On an acquisition-by-acquisition basis, the Group recognises any non-controlling interest in the acquiree either at fair value or at the non-controlling interest’s proportionate share of the acquiree’s net identifiable assets. The excess of the consideration transferred, the amount of any non-controlling interest in the acquiree and the acquisition-date fair value of any previous equity interest in the acquiree over the fair value of the Group’s share of the net identifiable assets acquired is recorded as goodwill. If those amounts are less than the fair value of the net identifiable assets of the subsidiary acquired and the measurement of all amounts has been reviewed, the difference is recognised directly in profit or loss as a bargain purchase.

86 S U P E R R E TA I L G R O U P L I M I T E D A N N U A L R E P O R T 202086 S U P E R R E T A I L G R O U P L I M I T E D A N N U A L R E P O R T 2 0 2 0
NOTES TO THE CONSOLIDATED FINANCIAL STATEMENTS (continued) For the period ended 27 June 2020
2. Summary of significant accounting policies (continued) (b) Principles of consolidation (continued) (iii) Business combinations (continued) Where settlement of any part of cash consideration is deferred, the amounts payable in the future are discounted to their present value as at the date of exchange. The discount rate used is the entity’s incremental borrowing rate, being the rate at which a similar borrowing could be obtained from an independent financier under comparable terms and conditions. Contingent consideration is classified either as equity or a financial liability. Amounts classified as a financial liability are subsequently remeasured to fair value with changes in fair value recognised in profit or loss. (iv) Investments in associates and joint ventures Associates and joint ventures are entities over which the Group has significant influence or joint control but not control. They are accounted for using the equity method (see (v) below), after initially being recognised at cost in the consolidated balance sheet. (v) Equity method Under the equity method of accounting, the investments are initially recognised at cost and adjusted thereafter to recognise the Group’s share of the post-acquisition profits or losses of the investee in profit or loss, and the Group’s share of movements in other comprehensive income of the investee in other comprehensive income. Dividends received or receivable from associates and joint ventures are recognised as a reduction in the carrying amount of the investment. When the Group’s share of losses in an equity-accounted investment equals or exceeds its interest in the entity, including any other unsecured long-term receivables, the Group does not recognise further losses, unless it has incurred obligations or made payments on behalf of the other entity. Unrealised gains on transactions between the Group and its associates and joint ventures are eliminated to the extent of the Group’s interest in these entities. Unrealised losses are also eliminated unless the transaction provides evidence of an impairment of the asset transferred. Accounting policies of equity accounted investees have been changed where necessary to ensure consistency with the policies adopted by the Group. The Group treats transactions with non-controlling interests that do not result in a loss of control as transactions with equity owners of the Group. A change in ownership interest results in an adjustment between the carrying amounts of the controlling and non-controlling interests to reflect their relative interests in the subsidiary. Any difference between the amount of the adjustment to non-controlling interests and any consideration paid or received is recognised in a separate reserve within equity attributable to the owners of Super Retail Group Limited. (vi) Comparatives Where applicable, various comparative balances have been reclassified to align with current period presentation. These amendments have no material impact on the consolidated financial statements.
(c) Foreign currency translation (i) Functional and presentation currency Items included in the financial statements of each of the Group’s entities are measured using the currency of the primary economic environment in which the entity operates (‘the functional currency’). The consolidated financial statements are presented in Australian dollars, which is Super Retail Group Limited’s functional and presentation currency. (ii) Transactions and balances Foreign currency transactions are translated into the functional currency using the exchange rates prevailing at the dates of the transactions. Foreign exchange gains and losses resulting from the settlement of such transactions and from the translation at year-end exchange rates of monetary assets and liabilities denominated in foreign currencies are recognised in the income statement, except when deferred in equity as qualifying cash flow hedges and qualifying net investment hedges. Translation differences on non-monetary items such as equities held at fair value through profit or loss, are reported as part of the fair value gain or loss. Translation differences on non-monetary items, such as equities classified as available-for-sale financial assets, are included in the fair value reserve in equity. (iii) Group companies The results and financial position of all the Group entities (none of which has the currency of a hyperinflationary economy) that have a functional currency different from the presentation currency are translated into the presentation currency as follows: assets and liabilities for each statement of financial position presented are translated at the closing rate at the date of that
statement of financial position; income and expenses for each income statement are translated at average exchange rates (unless this is not a reasonable
approximation of the cumulative effect of the rates prevailing on the transaction dates, in which case income and expenses are translated at the dates of the transactions); and
all resulting exchange differences are recognised as a separate component of equity.
87S U P E R R E TA I L G R O U P L I M I T E D A N N U A L R E P O R T 202086 S U P E R R E T A I L G R O U P L I M I T E D A N N U A L R E P O R T 2 0 2 0
NOTES TO THE CONSOLIDATED FINANCIAL STATEMENTS (continued) For the period ended 27 June 2020
2. Summary of significant accounting policies (continued) (b) Principles of consolidation (continued) (iii) Business combinations (continued) Where settlement of any part of cash consideration is deferred, the amounts payable in the future are discounted to their present value as at the date of exchange. The discount rate used is the entity’s incremental borrowing rate, being the rate at which a similar borrowing could be obtained from an independent financier under comparable terms and conditions. Contingent consideration is classified either as equity or a financial liability. Amounts classified as a financial liability are subsequently remeasured to fair value with changes in fair value recognised in profit or loss. (iv) Investments in associates and joint ventures Associates and joint ventures are entities over which the Group has significant influence or joint control but not control. They are accounted for using the equity method (see (v) below), after initially being recognised at cost in the consolidated balance sheet. (v) Equity method Under the equity method of accounting, the investments are initially recognised at cost and adjusted thereafter to recognise the Group’s share of the post-acquisition profits or losses of the investee in profit or loss, and the Group’s share of movements in other comprehensive income of the investee in other comprehensive income. Dividends received or receivable from associates and joint ventures are recognised as a reduction in the carrying amount of the investment. When the Group’s share of losses in an equity-accounted investment equals or exceeds its interest in the entity, including any other unsecured long-term receivables, the Group does not recognise further losses, unless it has incurred obligations or made payments on behalf of the other entity. Unrealised gains on transactions between the Group and its associates and joint ventures are eliminated to the extent of the Group’s interest in these entities. Unrealised losses are also eliminated unless the transaction provides evidence of an impairment of the asset transferred. Accounting policies of equity accounted investees have been changed where necessary to ensure consistency with the policies adopted by the Group. The Group treats transactions with non-controlling interests that do not result in a loss of control as transactions with equity owners of the Group. A change in ownership interest results in an adjustment between the carrying amounts of the controlling and non-controlling interests to reflect their relative interests in the subsidiary. Any difference between the amount of the adjustment to non-controlling interests and any consideration paid or received is recognised in a separate reserve within equity attributable to the owners of Super Retail Group Limited. (vi) Comparatives Where applicable, various comparative balances have been reclassified to align with current period presentation. These amendments have no material impact on the consolidated financial statements.
(c) Foreign currency translation (i) Functional and presentation currency Items included in the financial statements of each of the Group’s entities are measured using the currency of the primary economic environment in which the entity operates (‘the functional currency’). The consolidated financial statements are presented in Australian dollars, which is Super Retail Group Limited’s functional and presentation currency. (ii) Transactions and balances Foreign currency transactions are translated into the functional currency using the exchange rates prevailing at the dates of the transactions. Foreign exchange gains and losses resulting from the settlement of such transactions and from the translation at year-end exchange rates of monetary assets and liabilities denominated in foreign currencies are recognised in the income statement, except when deferred in equity as qualifying cash flow hedges and qualifying net investment hedges. Translation differences on non-monetary items such as equities held at fair value through profit or loss, are reported as part of the fair value gain or loss. Translation differences on non-monetary items, such as equities classified as available-for-sale financial assets, are included in the fair value reserve in equity. (iii) Group companies The results and financial position of all the Group entities (none of which has the currency of a hyperinflationary economy) that have a functional currency different from the presentation currency are translated into the presentation currency as follows: assets and liabilities for each statement of financial position presented are translated at the closing rate at the date of that
statement of financial position; income and expenses for each income statement are translated at average exchange rates (unless this is not a reasonable
approximation of the cumulative effect of the rates prevailing on the transaction dates, in which case income and expenses are translated at the dates of the transactions); and
all resulting exchange differences are recognised as a separate component of equity.
S U P E R R E T A I L G R O U P L I M I T E D A N N U A L R E P O R T 2 0 2 0 87
NOTES TO THE CONSOLIDATED FINANCIAL STATEMENTS (continued) For the period ended 27 June 2020
2. Summary of significant accounting policies (continued)
(d) Goods and Services Tax Revenues, expenses and assets are recognised net of the amount of goods and services tax, except where the amount of goods and services tax incurred is not recoverable. In these circumstances the goods and services tax is recognised as part of the cost of acquisition of the asset or as part of the item of expense. Receivables and payables in the consolidated statement of financial position are shown inclusive of goods and services tax. Cash flows are presented on a gross basis. The GST components of cash flows arising from investing or financing activities which are recoverable from, or payable to, the taxation authority, are presented as operating cash flow. (e) Rounding of amounts The economic entity is of a kind referred to in ASIC Corporations (Rounding in Financial/Directors’ Reports) Instrument 2016/191, issued by the Australian Securities and Investments Commission, relating to the ‘rounding off’ of amounts in the financial report. Amounts in the financial report have been rounded off in accordance with that instrument to the nearest hundred thousand dollars. (f) Financial year As allowed under Section 323D(2) of the Corporations Act 2001, the Directors have determined the financial year to be a fixed period of 52 calendar or 53 calendar weeks. For the period to 27 June 2020, the Group is reporting on the 52 week period that began 30 June 2019 and ended 27 June 2020. For the period to 29 June 2019, the Group is reporting on the 52 week period that began 1 July 2018 and ended 29 June 2019. (g) New and amended standards adopted by the Group The following new accounting standards and amendments to accounting standards became applicable in the current reporting period: AASB 16 Leases The Group had to change its accounting policies and make retrospective adjustments as at 29 June 2019 as a result of adopting AASB 16 Leases. The impact of adoption of the leasing standard and the new accounting policies are disclosed in Note 34 – Changes in Accounting Policies. (h) Impact of standards issued but not yet applied by the Group Certain new accounting standards and interpretations have been published that are not mandatory for 27 June 2020 reporting periods and have not been early adopted by the Group and are listed below. These standards are not expected to have a material impact on the entity in the current or future reporting periods and on foreseeable future transactions. AASB 2018-7 Amendments to Australian Accounting Standards – Definition of Material [AASB 101 and AASB 108] AASB 2018-6 Amendments to Australian Accounting Standards – Definition of a Business [AASB 3] AASB 2019-1 Amendments to Australian Accounting Standards – References to the Conceptual Framework 3. Critical accounting estimates and judgements Estimates and judgements are continually evaluated and are based on historical experience and other factors, including expectations of future events that may have a financial impact on the entity and that are believed to be reasonable under the circumstances. (a) Critical accounting estimates and assumptions The Group makes estimates and assumptions concerning the future. The resulting accounting estimates will, by definition, seldom equal the related actual results. The estimates and assumptions that have a significant risk of causing a material adjustment to the carrying amounts of assets and liabilities within the next financial year are included in the following Notes to the consolidated financial statements: Note 8 – Inventories; Note 9 – Property, plant and equipment; Note 10 – Intangible assets; Note 11 – Leases; Note 15 – Provisions; Note 24 – Business combinations.
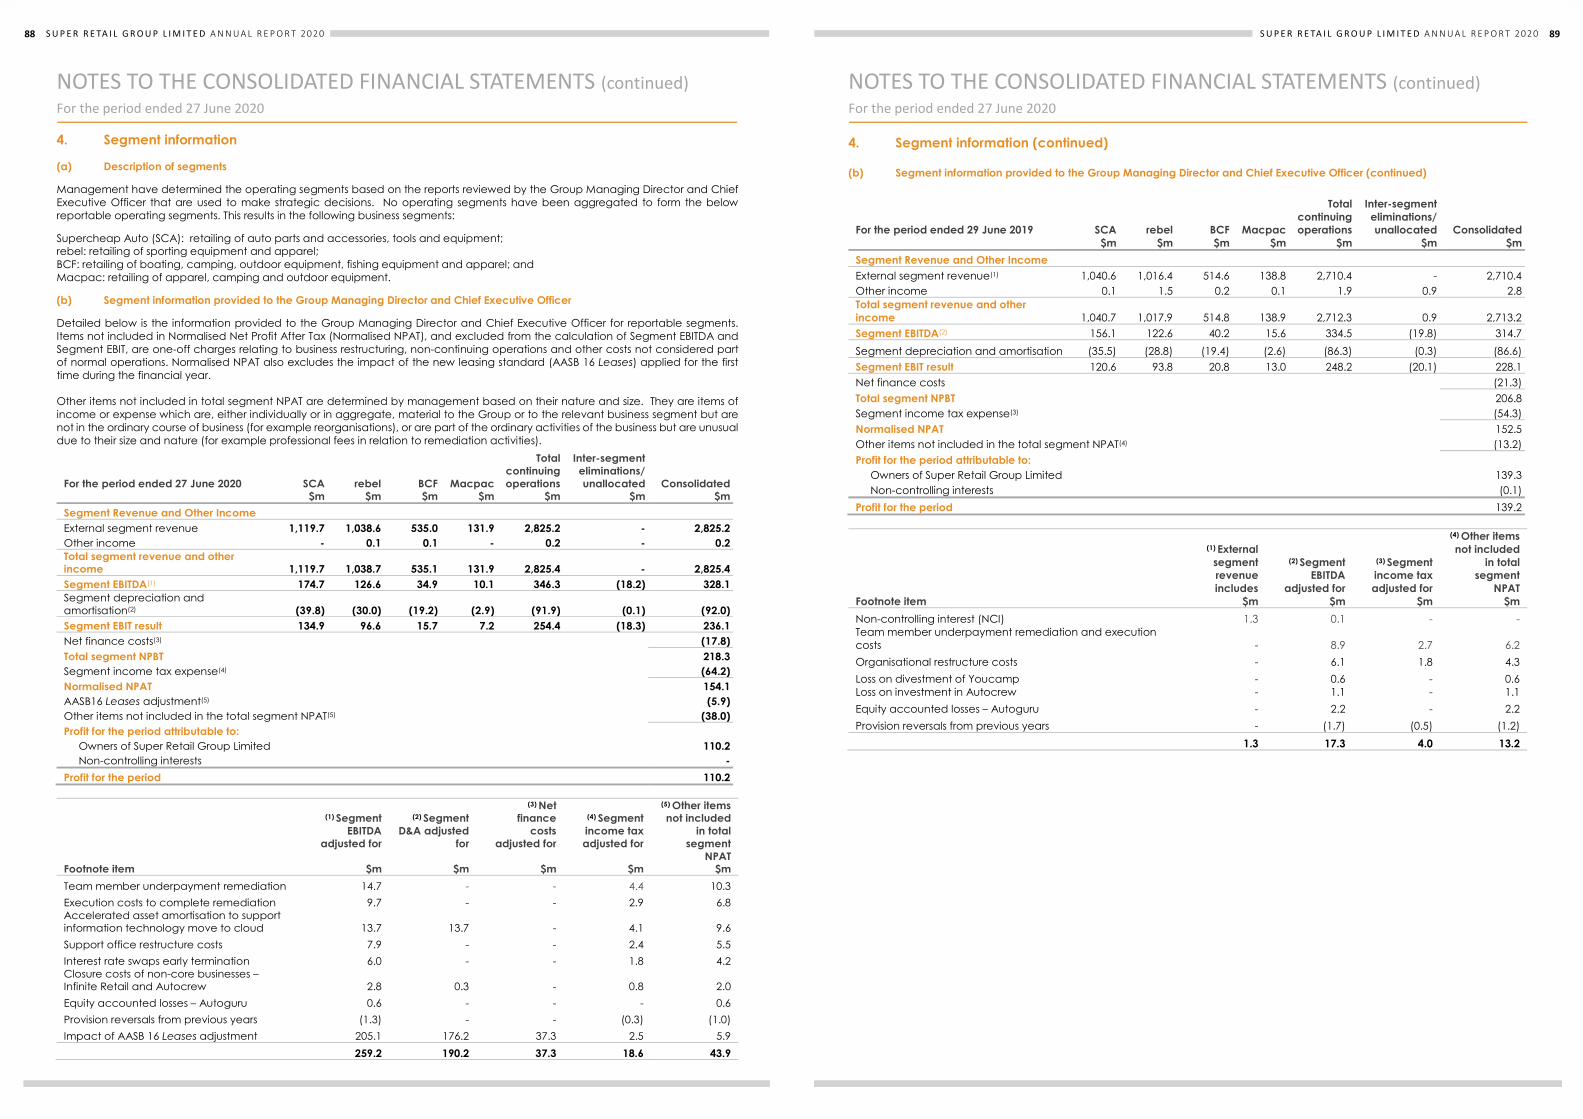
88 S U P E R R E TA I L G R O U P L I M I T E D A N N U A L R E P O R T 202088 S U P E R R E T A I L G R O U P L I M I T E D A N N U A L R E P O R T 2 0 2 0
NOTES TO THE CONSOLIDATED FINANCIAL STATEMENTS (continued) For the period ended 27 June 2020
4. Segment information (a) Description of segments Management have determined the operating segments based on the reports reviewed by the Group Managing Director and Chief Executive Officer that are used to make strategic decisions. No operating segments have been aggregated to form the below reportable operating segments. This results in the following business segments: Supercheap Auto (SCA): retailing of auto parts and accessories, tools and equipment; rebel: retailing of sporting equipment and apparel; BCF: retailing of boating, camping, outdoor equipment, fishing equipment and apparel; and Macpac: retailing of apparel, camping and outdoor equipment. (b) Segment information provided to the Group Managing Director and Chief Executive Officer Detailed below is the information provided to the Group Managing Director and Chief Executive Officer for reportable segments. Items not included in Normalised Net Profit After Tax (Normalised NPAT), and excluded from the calculation of Segment EBITDA and Segment EBIT, are one-off charges relating to business restructuring, non-continuing operations and other costs not considered part of normal operations. Normalised NPAT also excludes the impact of the new leasing standard (AASB 16 Leases) applied for the first time during the financial year. Other items not included in total segment NPAT are determined by management based on their nature and size. They are items of income or expense which are, either individually or in aggregate, material to the Group or to the relevant business segment but are not in the ordinary course of business (for example reorganisations), or are part of the ordinary activities of the business but are unusual due to their size and nature (for example professional fees in relation to remediation activities).
For the period ended 27 June 2020
SCA $m
rebel $m
BCF $m
Macpac $m
Total continuing operations
$m
Inter-segment eliminations/ unallocated
$m
Consolidated $m
Segment Revenue and Other Income External segment revenue 1,119.7 1,038.6 535.0 131.9 2,825.2 - 2,825.2 Other income - 0.1 0.1 - 0.2 - 0.2 Total segment revenue and other income 1,119.7 1,038.7 535.1 131.9 2,825.4 - 2,825.4 Segment EBITDA(1) 174.7 126.6 34.9 10.1 346.3 (18.2) 328.1 Segment depreciation and amortisation(2) (39.8) (30.0) (19.2) (2.9) (91.9) (0.1) (92.0) Segment EBIT result 134.9 96.6 15.7 7.2 254.4 (18.3) 236.1 Net finance costs(3) (17.8) Total segment NPBT 218.3 Segment income tax expense(4) (64.2) Normalised NPAT 154.1 AASB16 Leases adjustment(5) (5.9) Other items not included in the total segment NPAT(5) (38.0) Profit for the period attributable to: Owners of Super Retail Group Limited 110.2 Non-controlling interests - Profit for the period 110.2
Footnote item
(1) Segment EBITDA
adjusted for
$m
(2) Segment D&A adjusted
for
$m
(3) Net finance
costs adjusted for
$m
(4) Segment income tax adjusted for
$m
(5) Other items not included
in total segment
NPAT $m
Team member underpayment remediation 14.7 - - 4.4 10.3 Execution costs to complete remediation 9.7 - - 2.9 6.8 Accelerated asset amortisation to support information technology move to cloud 13.7 13.7 - 4.1 9.6 Support office restructure costs 7.9 - - 2.4 5.5 Interest rate swaps early termination 6.0 - - 1.8 4.2 Closure costs of non-core businesses – Infinite Retail and Autocrew 2.8 0.3 - 0.8 2.0 Equity accounted losses – Autoguru 0.6 - - - 0.6 Provision reversals from previous years (1.3) - - (0.3) (1.0) Impact of AASB 16 Leases adjustment 205.1 176.2 37.3 2.5 5.9 259.2 190.2 37.3 18.6 43.9
88 S U P E R R E T A I L G R O U P L I M I T E D A N N U A L R E P O R T 2 0 2 0
NOTES TO THE CONSOLIDATED FINANCIAL STATEMENTS (continued) For the period ended 27 June 2020
4. Segment information (a) Description of segments Management have determined the operating segments based on the reports reviewed by the Group Managing Director and Chief Executive Officer that are used to make strategic decisions. No operating segments have been aggregated to form the below reportable operating segments. This results in the following business segments: Supercheap Auto (SCA): retailing of auto parts and accessories, tools and equipment; rebel: retailing of sporting equipment and apparel; BCF: retailing of boating, camping, outdoor equipment, fishing equipment and apparel; and Macpac: retailing of apparel, camping and outdoor equipment. (b) Segment information provided to the Group Managing Director and Chief Executive Officer Detailed below is the information provided to the Group Managing Director and Chief Executive Officer for reportable segments. Items not included in Normalised Net Profit After Tax (Normalised NPAT), and excluded from the calculation of Segment EBITDA and Segment EBIT, are one-off charges relating to business restructuring, non-continuing operations and other costs not considered part of normal operations. Normalised NPAT also excludes the impact of the new leasing standard (AASB 16 Leases) applied for the first time during the financial year. Other items not included in total segment NPAT are determined by management based on their nature and size. They are items of income or expense which are, either individually or in aggregate, material to the Group or to the relevant business segment but are not in the ordinary course of business (for example reorganisations), or are part of the ordinary activities of the business but are unusual due to their size and nature (for example professional fees in relation to remediation activities).
For the period ended 27 June 2020
SCA $m
rebel $m
BCF $m
Macpac $m
Total continuing operations
$m
Inter-segment eliminations/ unallocated
$m
Consolidated $m
Segment Revenue and Other Income External segment revenue 1,119.7 1,038.6 535.0 131.9 2,825.2 - 2,825.2 Other income - 0.1 0.1 - 0.2 - 0.2 Total segment revenue and other income 1,119.7 1,038.7 535.1 131.9 2,825.4 - 2,825.4 Segment EBITDA(1) 174.7 126.6 34.9 10.1 346.3 (18.2) 328.1 Segment depreciation and amortisation(2) (39.8) (30.0) (19.2) (2.9) (91.9) (0.1) (92.0) Segment EBIT result 134.9 96.6 15.7 7.2 254.4 (18.3) 236.1 Net finance costs(3) (17.8) Total segment NPBT 218.3 Segment income tax expense(4) (64.2) Normalised NPAT 154.1 AASB16 Leases adjustment(5) (5.9) Other items not included in the total segment NPAT(5) (38.0) Profit for the period attributable to: Owners of Super Retail Group Limited 110.2 Non-controlling interests - Profit for the period 110.2
Footnote item
(1) Segment EBITDA
adjusted for
$m
(2) Segment D&A adjusted
for
$m
(3) Net finance
costs adjusted for
$m
(4) Segment income tax adjusted for
$m
(5) Other items not included
in total segment
NPAT $m
Team member underpayment remediation 14.7 - - 4.4 10.3 Execution costs to complete remediation 9.7 - - 2.9 6.8 Accelerated asset amortisation to support information technology move to cloud 13.7 13.7 - 4.1 9.6 Support office restructure costs 7.9 - - 2.4 5.5 Interest rate swaps early termination 6.0 - - 1.8 4.2 Closure costs of non-core businesses – Infinite Retail and Autocrew 2.8 0.3 - 0.8 2.0 Equity accounted losses – Autoguru 0.6 - - - 0.6 Provision reversals from previous years (1.3) - - (0.3) (1.0) Impact of AASB 16 Leases adjustment 205.1 176.2 37.3 2.5 5.9 259.2 190.2 37.3 18.6 43.9
89S U P E R R E TA I L G R O U P L I M I T E D A N N U A L R E P O R T 202088 S U P E R R E T A I L G R O U P L I M I T E D A N N U A L R E P O R T 2 0 2 0
NOTES TO THE CONSOLIDATED FINANCIAL STATEMENTS (continued) For the period ended 27 June 2020
4. Segment information (a) Description of segments Management have determined the operating segments based on the reports reviewed by the Group Managing Director and Chief Executive Officer that are used to make strategic decisions. No operating segments have been aggregated to form the below reportable operating segments. This results in the following business segments: Supercheap Auto (SCA): retailing of auto parts and accessories, tools and equipment; rebel: retailing of sporting equipment and apparel; BCF: retailing of boating, camping, outdoor equipment, fishing equipment and apparel; and Macpac: retailing of apparel, camping and outdoor equipment. (b) Segment information provided to the Group Managing Director and Chief Executive Officer Detailed below is the information provided to the Group Managing Director and Chief Executive Officer for reportable segments. Items not included in Normalised Net Profit After Tax (Normalised NPAT), and excluded from the calculation of Segment EBITDA and Segment EBIT, are one-off charges relating to business restructuring, non-continuing operations and other costs not considered part of normal operations. Normalised NPAT also excludes the impact of the new leasing standard (AASB 16 Leases) applied for the first time during the financial year. Other items not included in total segment NPAT are determined by management based on their nature and size. They are items of income or expense which are, either individually or in aggregate, material to the Group or to the relevant business segment but are not in the ordinary course of business (for example reorganisations), or are part of the ordinary activities of the business but are unusual due to their size and nature (for example professional fees in relation to remediation activities).
For the period ended 27 June 2020
SCA $m
rebel $m
BCF $m
Macpac $m
Total continuing operations
$m
Inter-segment eliminations/ unallocated
$m
Consolidated $m
Segment Revenue and Other Income External segment revenue 1,119.7 1,038.6 535.0 131.9 2,825.2 - 2,825.2 Other income - 0.1 0.1 - 0.2 - 0.2 Total segment revenue and other income 1,119.7 1,038.7 535.1 131.9 2,825.4 - 2,825.4 Segment EBITDA(1) 174.7 126.6 34.9 10.1 346.3 (18.2) 328.1 Segment depreciation and amortisation(2) (39.8) (30.0) (19.2) (2.9) (91.9) (0.1) (92.0) Segment EBIT result 134.9 96.6 15.7 7.2 254.4 (18.3) 236.1 Net finance costs(3) (17.8) Total segment NPBT 218.3 Segment income tax expense(4) (64.2) Normalised NPAT 154.1 AASB16 Leases adjustment(5) (5.9) Other items not included in the total segment NPAT(5) (38.0) Profit for the period attributable to: Owners of Super Retail Group Limited 110.2 Non-controlling interests - Profit for the period 110.2
Footnote item
(1) Segment EBITDA
adjusted for
$m
(2) Segment D&A adjusted
for
$m
(3) Net finance
costs adjusted for
$m
(4) Segment income tax adjusted for
$m
(5) Other items not included
in total segment
NPAT $m
Team member underpayment remediation 14.7 - - 4.4 10.3 Execution costs to complete remediation 9.7 - - 2.9 6.8 Accelerated asset amortisation to support information technology move to cloud 13.7 13.7 - 4.1 9.6 Support office restructure costs 7.9 - - 2.4 5.5 Interest rate swaps early termination 6.0 - - 1.8 4.2 Closure costs of non-core businesses – Infinite Retail and Autocrew 2.8 0.3 - 0.8 2.0 Equity accounted losses – Autoguru 0.6 - - - 0.6 Provision reversals from previous years (1.3) - - (0.3) (1.0) Impact of AASB 16 Leases adjustment 205.1 176.2 37.3 2.5 5.9 259.2 190.2 37.3 18.6 43.9
88 S U P E R R E T A I L G R O U P L I M I T E D A N N U A L R E P O R T 2 0 2 0
NOTES TO THE CONSOLIDATED FINANCIAL STATEMENTS (continued) For the period ended 27 June 2020
4. Segment information (a) Description of segments Management have determined the operating segments based on the reports reviewed by the Group Managing Director and Chief Executive Officer that are used to make strategic decisions. No operating segments have been aggregated to form the below reportable operating segments. This results in the following business segments: Supercheap Auto (SCA): retailing of auto parts and accessories, tools and equipment; rebel: retailing of sporting equipment and apparel; BCF: retailing of boating, camping, outdoor equipment, fishing equipment and apparel; and Macpac: retailing of apparel, camping and outdoor equipment. (b) Segment information provided to the Group Managing Director and Chief Executive Officer Detailed below is the information provided to the Group Managing Director and Chief Executive Officer for reportable segments. Items not included in Normalised Net Profit After Tax (Normalised NPAT), and excluded from the calculation of Segment EBITDA and Segment EBIT, are one-off charges relating to business restructuring, non-continuing operations and other costs not considered part of normal operations. Normalised NPAT also excludes the impact of the new leasing standard (AASB 16 Leases) applied for the first time during the financial year. Other items not included in total segment NPAT are determined by management based on their nature and size. They are items of income or expense which are, either individually or in aggregate, material to the Group or to the relevant business segment but are not in the ordinary course of business (for example reorganisations), or are part of the ordinary activities of the business but are unusual due to their size and nature (for example professional fees in relation to remediation activities).
For the period ended 27 June 2020
SCA $m
rebel $m
BCF $m
Macpac $m
Total continuing operations
$m
Inter-segment eliminations/ unallocated
$m
Consolidated $m
Segment Revenue and Other Income External segment revenue 1,119.7 1,038.6 535.0 131.9 2,825.2 - 2,825.2 Other income - 0.1 0.1 - 0.2 - 0.2 Total segment revenue and other income 1,119.7 1,038.7 535.1 131.9 2,825.4 - 2,825.4 Segment EBITDA(1) 174.7 126.6 34.9 10.1 346.3 (18.2) 328.1 Segment depreciation and amortisation(2) (39.8) (30.0) (19.2) (2.9) (91.9) (0.1) (92.0) Segment EBIT result 134.9 96.6 15.7 7.2 254.4 (18.3) 236.1 Net finance costs(3) (17.8) Total segment NPBT 218.3 Segment income tax expense(4) (64.2) Normalised NPAT 154.1 AASB16 Leases adjustment(5) (5.9) Other items not included in the total segment NPAT(5) (38.0) Profit for the period attributable to: Owners of Super Retail Group Limited 110.2 Non-controlling interests - Profit for the period 110.2
Footnote item
(1) Segment EBITDA
adjusted for
$m
(2) Segment D&A adjusted
for
$m
(3) Net finance
costs adjusted for
$m
(4) Segment income tax adjusted for
$m
(5) Other items not included
in total segment
NPAT $m
Team member underpayment remediation 14.7 - - 4.4 10.3 Execution costs to complete remediation 9.7 - - 2.9 6.8 Accelerated asset amortisation to support information technology move to cloud 13.7 13.7 - 4.1 9.6 Support office restructure costs 7.9 - - 2.4 5.5 Interest rate swaps early termination 6.0 - - 1.8 4.2 Closure costs of non-core businesses – Infinite Retail and Autocrew 2.8 0.3 - 0.8 2.0 Equity accounted losses – Autoguru 0.6 - - - 0.6 Provision reversals from previous years (1.3) - - (0.3) (1.0) Impact of AASB 16 Leases adjustment 205.1 176.2 37.3 2.5 5.9 259.2 190.2 37.3 18.6 43.9
S U P E R R E T A I L G R O U P L I M I T E D A N N U A L R E P O R T 2 0 2 0 89
NOTES TO THE CONSOLIDATED FINANCIAL STATEMENTS (continued) For the period ended 27 June 2020
4. Segment information (continued) (b) Segment information provided to the Group Managing Director and Chief Executive Officer (continued)
For the period ended 29 June 2019
SCA $m
rebel $m
BCF $m
Macpac $m
Total continuing operations
$m
Inter-segment eliminations/ unallocated
$m
Consolidated $m
Segment Revenue and Other Income External segment revenue(1) 1,040.6 1,016.4 514.6 138.8 2,710.4 - 2,710.4 Other income 0.1 1.5 0.2 0.1 1.9 0.9 2.8 Total segment revenue and other income 1,040.7 1,017.9 514.8 138.9 2,712.3 0.9 2,713.2 Segment EBITDA(2) 156.1 122.6 40.2 15.6 334.5 (19.8) 314.7 Segment depreciation and amortisation (35.5) (28.8) (19.4) (2.6) (86.3) (0.3) (86.6) Segment EBIT result 120.6 93.8 20.8 13.0 248.2 (20.1) 228.1 Net finance costs (21.3) Total segment NPBT 206.8 Segment income tax expense(3) (54.3) Normalised NPAT 152.5 Other items not included in the total segment NPAT(4) (13.2) Profit for the period attributable to: Owners of Super Retail Group Limited 139.3 Non-controlling interests (0.1) Profit for the period 139.2
Footnote item
(1) External segment revenue includes
$m
(2) Segment EBITDA
adjusted for $m
(3) Segment income tax adjusted for
$m
(4) Other items not included
in total segment
NPAT $m
Non-controlling interest (NCI) 1.3 0.1 - - Team member underpayment remediation and execution costs - 8.9 2.7 6.2 Organisational restructure costs - 6.1 1.8 4.3 Loss on divestment of Youcamp - 0.6 - 0.6 Loss on investment in Autocrew - 1.1 - 1.1 Equity accounted losses – Autoguru - 2.2 - 2.2 Provision reversals from previous years - (1.7) (0.5) (1.2) 1.3 17.3 4.0 13.2
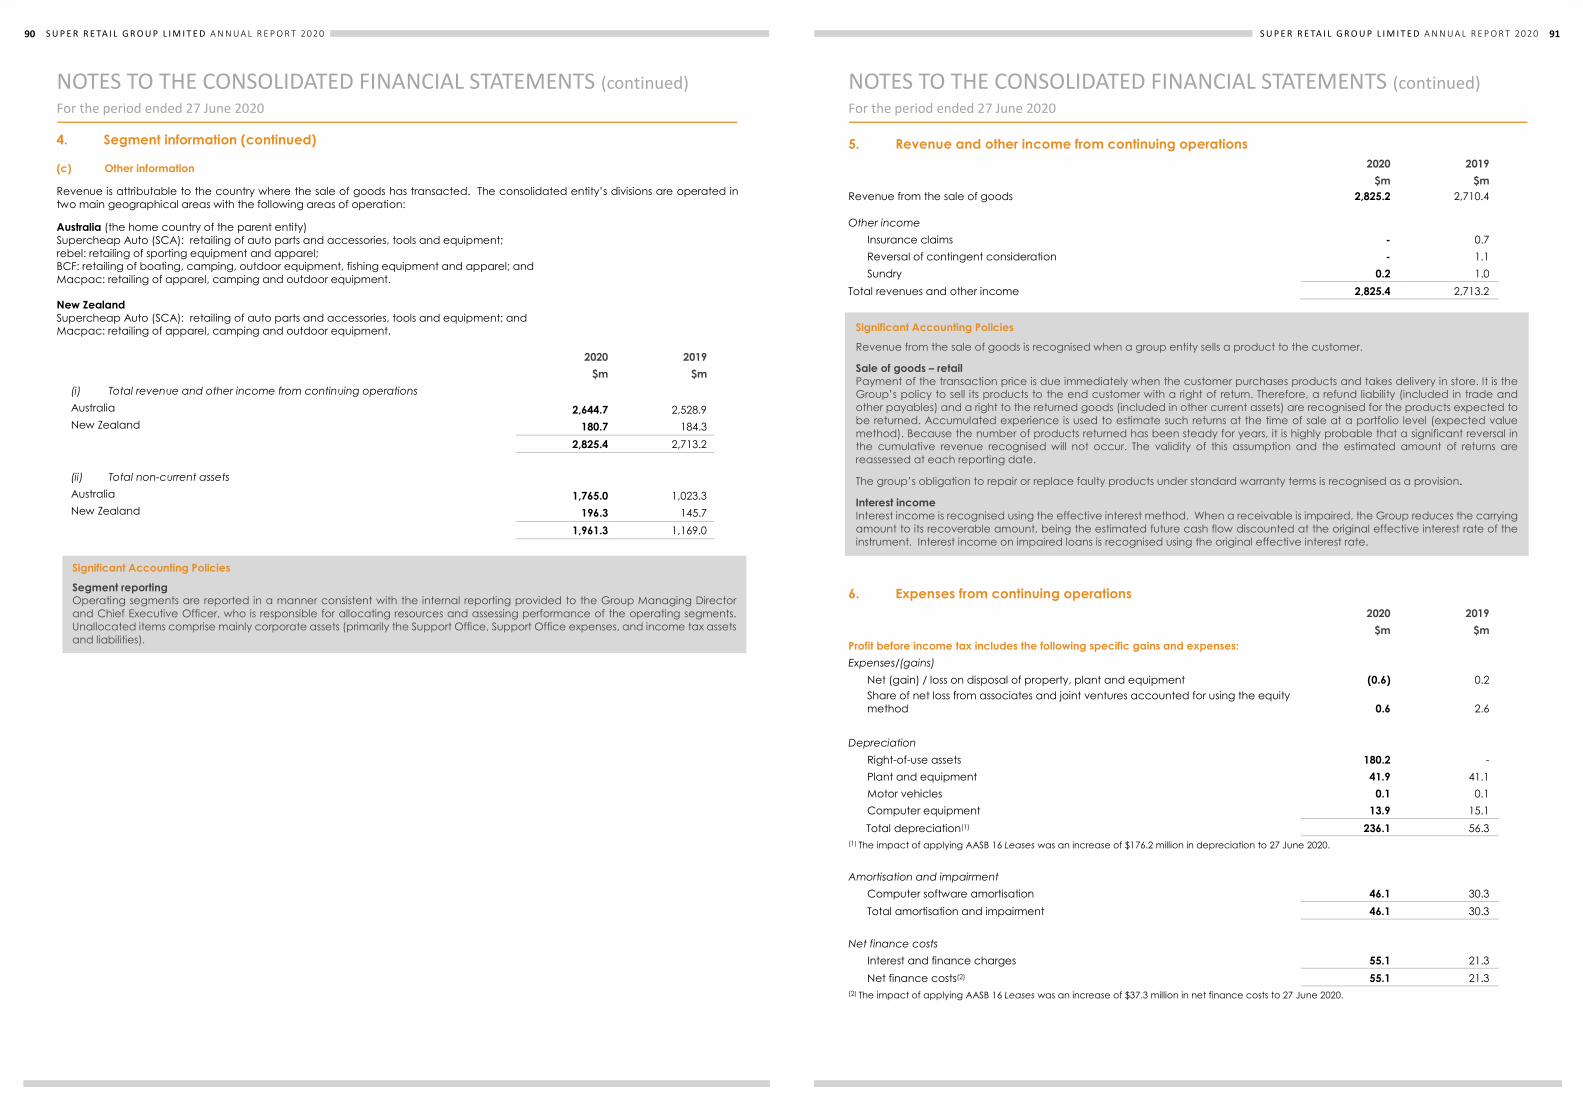
90 S U P E R R E TA I L G R O U P L I M I T E D A N N U A L R E P O R T 202090 S U P E R R E T A I L G R O U P L I M I T E D A N N U A L R E P O R T 2 0 2 0
NOTES TO THE CONSOLIDATED FINANCIAL STATEMENTS (continued) For the period ended 27 June 2020
4. Segment information (continued) (c) Other information Revenue is attributable to the country where the sale of goods has transacted. The consolidated entity’s divisions are operated in two main geographical areas with the following areas of operation: Australia (the home country of the parent entity) Supercheap Auto (SCA): retailing of auto parts and accessories, tools and equipment; rebel: retailing of sporting equipment and apparel; BCF: retailing of boating, camping, outdoor equipment, fishing equipment and apparel; and Macpac: retailing of apparel, camping and outdoor equipment.
New Zealand Supercheap Auto (SCA): retailing of auto parts and accessories, tools and equipment; and Macpac: retailing of apparel, camping and outdoor equipment.
2020 2019 $m $m (i) Total revenue and other income from continuing operations Australia 2,644.7 2,528.9 New Zealand 180.7 184.3 2,825.4 2,713.2 (ii) Total non-current assets Australia 1,765.0 1,023.3 New Zealand 196.3 145.7 1,961.3 1,169.0
Significant Accounting Policies
Segment reporting Operating segments are reported in a manner consistent with the internal reporting provided to the Group Managing Director and Chief Executive Officer, who is responsible for allocating resources and assessing performance of the operating segments. Unallocated items comprise mainly corporate assets (primarily the Support Office, Support Office expenses, and income tax assets and liabilities).
91S U P E R R E TA I L G R O U P L I M I T E D A N N U A L R E P O R T 2020S U P E R R E T A I L G R O U P L I M I T E D A N N U A L R E P O R T 2 0 2 0 91
NOTES TO THE CONSOLIDATED FINANCIAL STATEMENTS (continued) For the period ended 27 June 2020
5. Revenue and other income from continuing operations 2020 2019 $m $m Revenue from the sale of goods 2,825.2 2,710.4 Other income
Insurance claims - 0.7 Reversal of contingent consideration - 1.1 Sundry 0.2 1.0
Total revenues and other income 2,825.4 2,713.2
6. Expenses from continuing operations 2020 2019 $m $m Profit before income tax includes the following specific gains and expenses: Expenses/(gains)
Net (gain) / loss on disposal of property, plant and equipment (0.6) 0.2 Share of net loss from associates and joint ventures accounted for using the equity method 0.6 2.6
Depreciation
Right-of-use assets 180.2 - Plant and equipment 41.9 41.1 Motor vehicles 0.1 0.1 Computer equipment 13.9 15.1 Total depreciation(1) 236.1 56.3
(1) The impact of applying AASB 16 Leases was an increase of $176.2 million in depreciation to 27 June 2020.
Amortisation and impairment Computer software amortisation 46.1 30.3 Total amortisation and impairment 46.1 30.3
Net finance costs
Interest and finance charges 55.1 21.3 Net finance costs(2) 55.1 21.3
(2) The impact of applying AASB 16 Leases was an increase of $37.3 million in net finance costs to 27 June 2020.
Significant Accounting Policies
Revenue from the sale of goods is recognised when a group entity sells a product to the customer.
Sale of goods – retail Payment of the transaction price is due immediately when the customer purchases products and takes delivery in store. It is the Group’s policy to sell its products to the end customer with a right of return. Therefore, a refund liability (included in trade and other payables) and a right to the returned goods (included in other current assets) are recognised for the products expected to be returned. Accumulated experience is used to estimate such returns at the time of sale at a portfolio level (expected value method). Because the number of products returned has been steady for years, it is highly probable that a significant reversal in the cumulative revenue recognised will not occur. The validity of this assumption and the estimated amount of returns are reassessed at each reporting date.
The group’s obligation to repair or replace faulty products under standard warranty terms is recognised as a provision.
Interest income Interest income is recognised using the effective interest method. When a receivable is impaired, the Group reduces the carrying amount to its recoverable amount, being the estimated future cash flow discounted at the original effective interest rate of the instrument. Interest income on impaired loans is recognised using the original effective interest rate.

92 S U P E R R E TA I L G R O U P L I M I T E D A N N U A L R E P O R T 202092 S U P E R R E T A I L G R O U P L I M I T E D A N N U A L R E P O R T 2 0 2 0
NOTES TO THE CONSOLIDATED FINANCIAL STATEMENTS (continued) For the period ended 27 June 2020
6. Expenses from continuing operations (continued) 2020 2019 $m $m Profit before income tax includes the following specific gains and expenses: Employee benefits expense
Superannuation 39.3 38.0 Salaries and wages(3) 544.4 502.2 Total employee benefits expense 583.7 540.2
(3) Excludes impact of government grant received disclosed below. Government grant received
Australian JobKeeper for Macpac Retail Pty Ltd(4) (1.6) - New Zealand wage subsidy for Super Cheap Auto (New Zealand) Pty Limited and Macpac New Zealand Limited (4.9) - Total government grant revenue (6.5) -
(4) The amounts above have been offset against expenses. Rental expense relating to leases
Lease expenses 47.3 232.8 Equipment hire 3.2 3.3 Total rental expense relating to leases(5) 50.5 236.1
(5) The impact of applying AASB 16 Leases was a decrease of $204.5 million in rental expense to 27 June 2020. Foreign exchange gains and losses
Net foreign exchange (gain) (7.7) (3.4)
Significant Accounting Policies
Depreciation, amortisation and impairment Refer to Notes 9 and 10 for details on depreciation, amortisation and impairment. Finance costs Finance costs are recognised in the period in which these are incurred and are expensed in the period to which the costs relate. Generally costs such as discounts and premiums incurred in raising borrowings are amortised on an effective yield basis over the period of the borrowing. Finance costs include: interest on bank overdrafts and short-term and long-term borrowings; amortisation of discounts or premiums relating to borrowings; amortisation of ancillary costs incurred in connection with the arrangement of borrowings; finance lease charges; and interest revenue. Employee benefits Refer to Note 15 for details on employee provisions and superannuation. Leases As explained in Note 2(g), the Group has changed its accounting policy for leases where the Group is the lessee. The new policy is described in Note 11 and the impact of the change in Note 34. Until 29 June 2019, Leases in which a significant portion of the risks and rewards of ownership were retained by the lessor were classified as operating leases. Payments made under operating leases (net of any incentives received from the lessor) were charged to the income statement on a straight-line basis over the period of the lease term. Foreign exchange gains and losses Refer to Note 2 (c) for details on foreign exchange gains and losses. Government grants Government grants relating to costs are deferred and recognised in profit or loss over the period necessary to match them with the costs that they are intended to compensate.
93S U P E R R E TA I L G R O U P L I M I T E D A N N U A L R E P O R T 2020S U P E R R E T A I L G R O U P L I M I T E D A N N U A L R E P O R T 2 0 2 0 93
NOTES TO THE CONSOLIDATED FINANCIAL STATEMENTS (continued) For the period ended 27 June 2020
7. Trade and other receivables 2020 2019 Current $m $m Trade receivables 10.9 16.0 Loss allowance (0.5) (0.3) Net trade receivables 10.4 15.7 Other receivables 7.7 14.2 Prepayments 8.2 7.7 Net current trade and other receivables 26.3 37.6 (a) Impaired trade receivables As at 27 June 2020 current trade receivables of the Group with a nominal value of $0.5 million (2019: $0.3 million) were impaired and provided for. The individually impaired receivables mainly relate to wholesalers with whom the Group no longer trades. (b) Past due but not impaired As at 27 June 2020, trade receivables of $4.4 million (2019: $3.5 million) were past due but not impaired. These relate to a number of independent customers for whom there is no recent history of default. The ageing analysis of these trade receivables is as follows: 2020 2019 $m $m 30 to 60 days 1.6 0.8 60 to 90 days 0.2 0.3 90 days and over 2.6 2.4 4.4 3.5
Significant Accounting Policies
Trade receivables Trade receivables are amounts due from customers for goods sold or services performed in the ordinary course of business. They are generally due for settlement within 30 days and therefore are all classified as current. Trade receivables are recognised initially at the amount of consideration that is unconditional unless they contain significant financing components, when they are recognised at fair value. The Group holds the trade receivables with the objective to collect the contractual cash flows and therefore measures them subsequently at amortised cost using the effective interest method. Details about the Group’s impairment policies and the calculation of the loss allowance are provided in Note 16. The Group applies the AASB 9 simplified approach to measuring expected credit losses which uses a lifetime expected loss allowance for all trade receivables and contract assets. To measure the expected credit losses, trade receivables and contract assets have been grouped based on shared credit risk characteristics and the days past due. The contract assets relate to unbilled work in progress and have substantially the same risk characteristics as the trade receivables for the same types of contracts. The Group has therefore concluded that the expected loss rates for trade receivables are a reasonable approximation of the loss rates for the contract assets. The expected loss rates are based on the payment profiles of sales over a period of 24 months and the corresponding historical credit losses experienced within this period. The historical loss rates are adjusted to reflect current and forward-looking information on macroeconomic factors affecting the ability of the customers to settle the receivables. The Group has identified the GDP and the unemployment rate of the countries in which it sells its goods and services to be the most relevant factors, and accordingly adjusts the historical loss rates based on expected changes in these factors. On that basis, the loss allowance as at period end was determined for trade receivables to be minor.
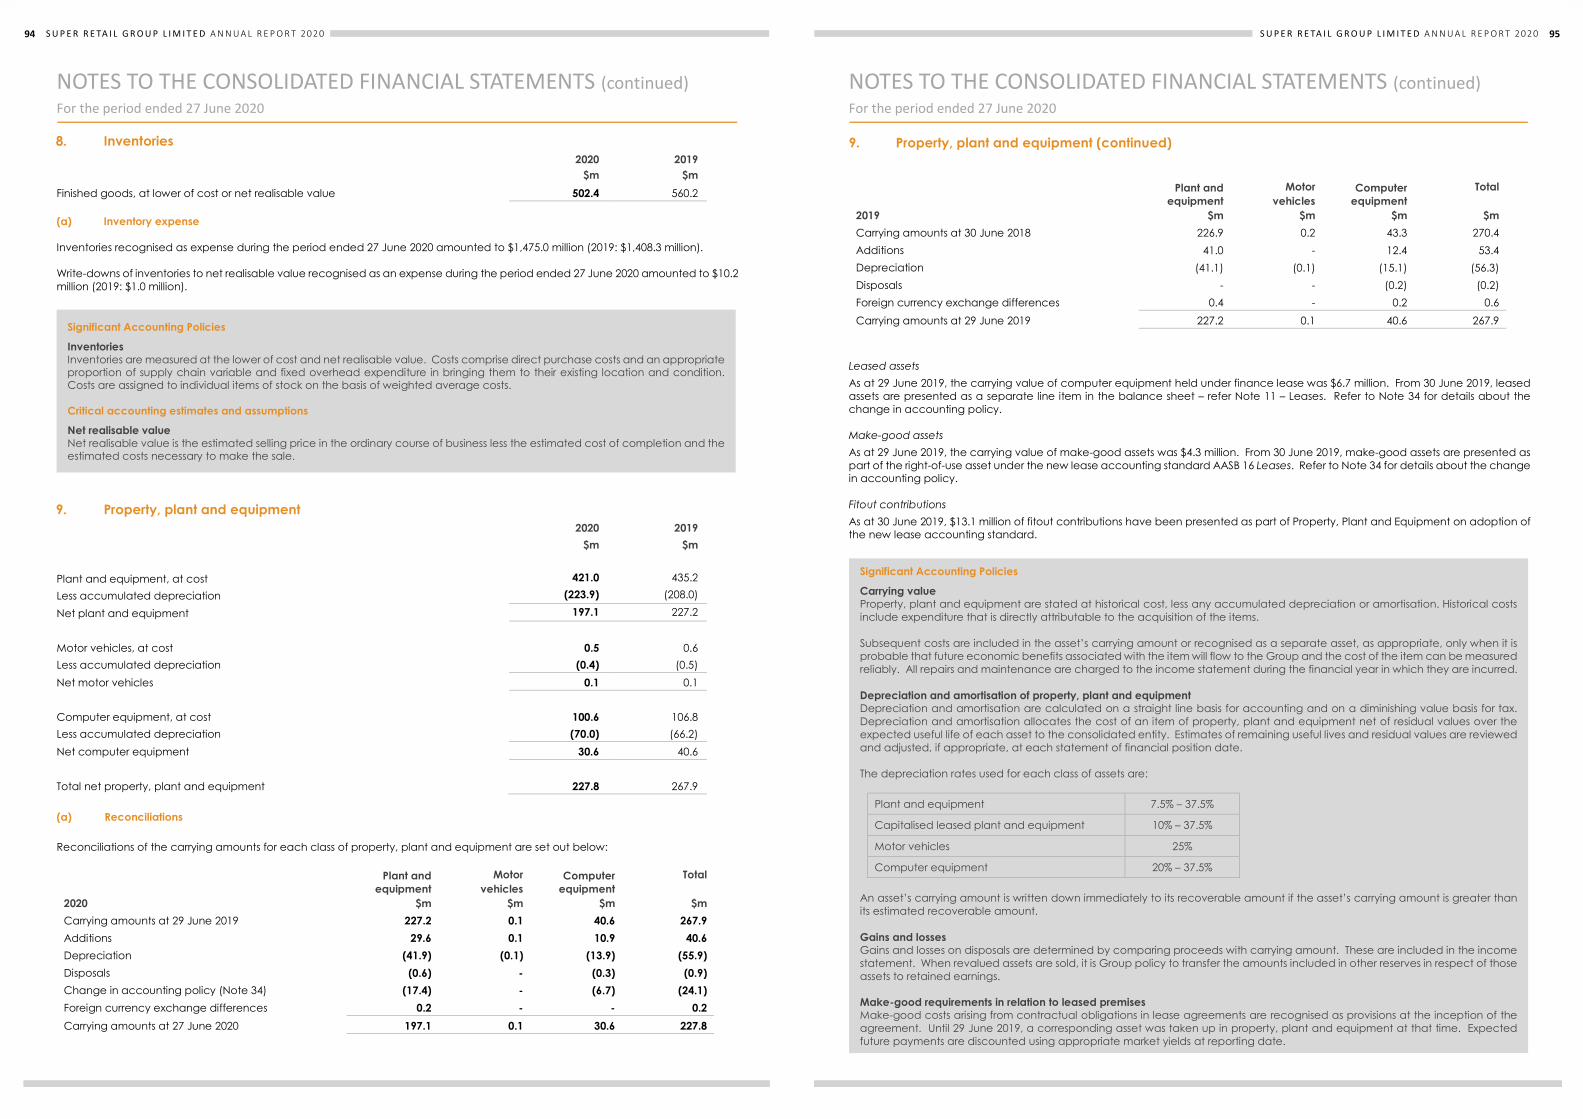
94 S U P E R R E TA I L G R O U P L I M I T E D A N N U A L R E P O R T 202094 S U P E R R E T A I L G R O U P L I M I T E D A N N U A L R E P O R T 2 0 2 0
NOTES TO THE CONSOLIDATED FINANCIAL STATEMENTS (continued) For the period ended 27 June 2020
8. Inventories 2020 2019 $m $m Finished goods, at lower of cost or net realisable value 502.4 560.2 (a) Inventory expense Inventories recognised as expense during the period ended 27 June 2020 amounted to $1,475.0 million (2019: $1,408.3 million). Write-downs of inventories to net realisable value recognised as an expense during the period ended 27 June 2020 amounted to $10.2 million (2019: $1.0 million).
9. Property, plant and equipment 2020 2019 $m $m
Plant and equipment, at cost 421.0 435.2 Less accumulated depreciation (223.9) (208.0)
Net plant and equipment 197.1 227.2
Motor vehicles, at cost 0.5 0.6 Less accumulated depreciation (0.4) (0.5) Net motor vehicles 0.1 0.1 Computer equipment, at cost 100.6 106.8 Less accumulated depreciation (70.0) (66.2) Net computer equipment 30.6 40.6 Total net property, plant and equipment 227.8 267.9 (a) Reconciliations
Reconciliations of the carrying amounts for each class of property, plant and equipment are set out below:
2020
Plant and equipment
$m
Motor
vehicles $m
Computer equipment
$m
Total
$m
Carrying amounts at 29 June 2019 227.2 0.1 40.6 267.9 Additions 29.6 0.1 10.9 40.6 Depreciation (41.9) (0.1) (13.9) (55.9) Disposals (0.6) - (0.3) (0.9) Change in accounting policy (Note 34) (17.4) - (6.7) (24.1) Foreign currency exchange differences 0.2 - - 0.2 Carrying amounts at 27 June 2020 197.1 0.1 30.6 227.8
Significant Accounting Policies
Inventories Inventories are measured at the lower of cost and net realisable value. Costs comprise direct purchase costs and an appropriate proportion of supply chain variable and fixed overhead expenditure in bringing them to their existing location and condition. Costs are assigned to individual items of stock on the basis of weighted average costs. Critical accounting estimates and assumptions
Net realisable value Net realisable value is the estimated selling price in the ordinary course of business less the estimated cost of completion and the estimated costs necessary to make the sale.
95S U P E R R E TA I L G R O U P L I M I T E D A N N U A L R E P O R T 2020S U P E R R E T A I L G R O U P L I M I T E D A N N U A L R E P O R T 2 0 2 0 95
NOTES TO THE CONSOLIDATED FINANCIAL STATEMENTS (continued) For the period ended 27 June 2020
9. Property, plant and equipment (continued)
2019
Plant and equipment
$m
Motor
vehicles $m
Computer equipment
$m
Total
$m
Carrying amounts at 30 June 2018 226.9 0.2 43.3 270.4 Additions 41.0 - 12.4 53.4 Depreciation (41.1) (0.1) (15.1) (56.3) Disposals - - (0.2) (0.2) Foreign currency exchange differences 0.4 - 0.2 0.6 Carrying amounts at 29 June 2019 227.2 0.1 40.6 267.9
Leased assets As at 29 June 2019, the carrying value of computer equipment held under finance lease was $6.7 million. From 30 June 2019, leased assets are presented as a separate line item in the balance sheet – refer Note 11 – Leases. Refer to Note 34 for details about the change in accounting policy. Make-good assets As at 29 June 2019, the carrying value of make-good assets was $4.3 million. From 30 June 2019, make-good assets are presented as part of the right-of-use asset under the new lease accounting standard AASB 16 Leases. Refer to Note 34 for details about the change in accounting policy. Fitout contributions As at 30 June 2019, $13.1 million of fitout contributions have been presented as part of Property, Plant and Equipment on adoption of the new lease accounting standard.
Significant Accounting Policies
Carrying value Property, plant and equipment are stated at historical cost, less any accumulated depreciation or amortisation. Historical costs include expenditure that is directly attributable to the acquisition of the items. Subsequent costs are included in the asset’s carrying amount or recognised as a separate asset, as appropriate, only when it is probable that future economic benefits associated with the item will flow to the Group and the cost of the item can be measured reliably. All repairs and maintenance are charged to the income statement during the financial year in which they are incurred. Depreciation and amortisation of property, plant and equipment Depreciation and amortisation are calculated on a straight line basis for accounting and on a diminishing value basis for tax. Depreciation and amortisation allocates the cost of an item of property, plant and equipment net of residual values over the expected useful life of each asset to the consolidated entity. Estimates of remaining useful lives and residual values are reviewed and adjusted, if appropriate, at each statement of financial position date. The depreciation rates used for each class of assets are:
Plant and equipment 7.5% – 37.5%
Capitalised leased plant and equipment 10% – 37.5%
Motor vehicles 25%
Computer equipment 20% – 37.5% An asset’s carrying amount is written down immediately to its recoverable amount if the asset’s carrying amount is greater than its estimated recoverable amount. Gains and losses Gains and losses on disposals are determined by comparing proceeds with carrying amount. These are included in the income statement. When revalued assets are sold, it is Group policy to transfer the amounts included in other reserves in respect of those assets to retained earnings. Make-good requirements in relation to leased premises Make-good costs arising from contractual obligations in lease agreements are recognised as provisions at the inception of the agreement. Until 29 June 2019, a corresponding asset was taken up in property, plant and equipment at that time. Expected future payments are discounted using appropriate market yields at reporting date.
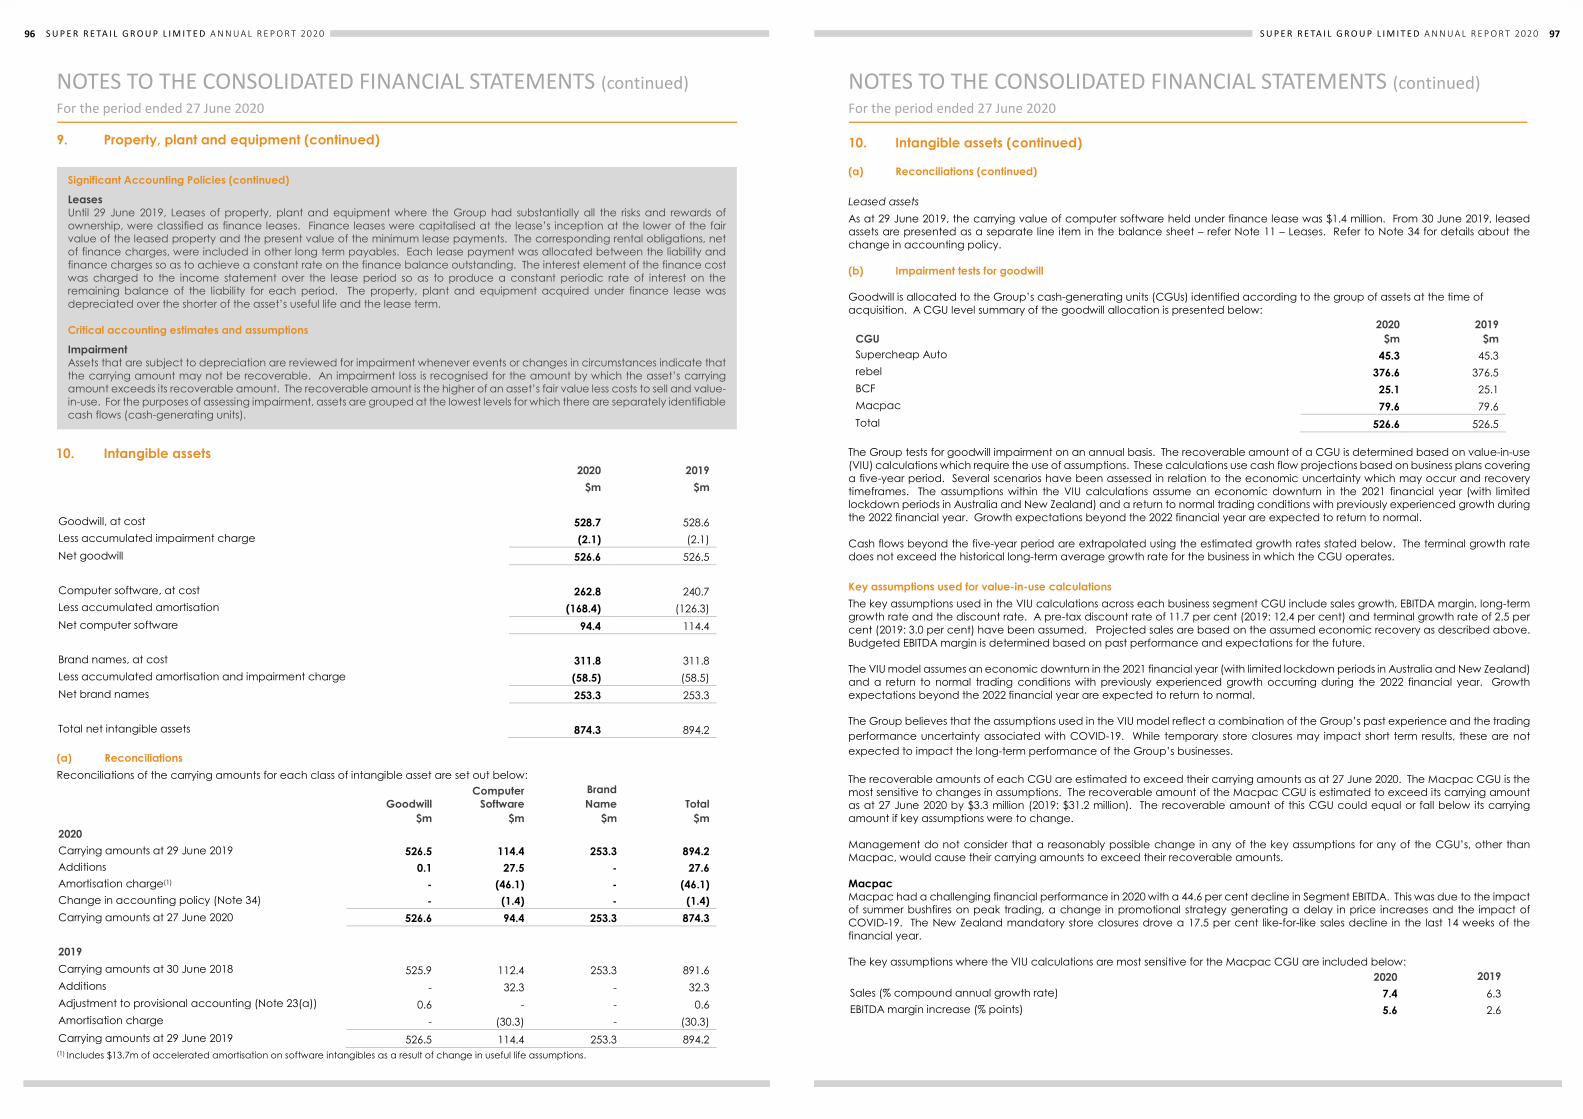
96 S U P E R R E TA I L G R O U P L I M I T E D A N N U A L R E P O R T 2020
96 S U P E R R E T A I L G R O U P L I M I T E D A N N U A L R E P O R T 2 0 2 0
NOTES TO THE CONSOLIDATED FINANCIAL STATEMENTS (continued) For the period ended 27 June 2020
9. Property, plant and equipment (continued)
10. Intangible assets
2020 2019 $m $m
Goodwill, at cost 528.7 528.6 Less accumulated impairment charge (2.1) (2.1) Net goodwill 526.6 526.5 Computer software, at cost 262.8 240.7 Less accumulated amortisation (168.4) (126.3) Net computer software 94.4 114.4 Brand names, at cost 311.8 311.8 Less accumulated amortisation and impairment charge (58.5) (58.5) Net brand names 253.3 253.3 Total net intangible assets 874.3 894.2 (a) Reconciliations Reconciliations of the carrying amounts for each class of intangible asset are set out below:
Goodwill
$m
Computer Software
$m
Brand Name
$m
Total
$m 2020 Carrying amounts at 29 June 2019 526.5 114.4 253.3 894.2 Additions 0.1 27.5 - 27.6 Amortisation charge(1) - (46.1) - (46.1) Change in accounting policy (Note 34) - (1.4) - (1.4) Carrying amounts at 27 June 2020 526.6 94.4 253.3 874.3
2019 Carrying amounts at 30 June 2018 525.9 112.4 253.3 891.6 Additions - 32.3 - 32.3 Adjustment to provisional accounting (Note 23(a)) 0.6 - - 0.6 Amortisation charge - (30.3) - (30.3) Carrying amounts at 29 June 2019 526.5 114.4 253.3 894.2 (1) Includes $13.7m of accelerated amortisation on software intangibles as a result of change in useful life assumptions.
Significant Accounting Policies (continued)
Leases Until 29 June 2019, Leases of property, plant and equipment where the Group had substantially all the risks and rewards of ownership, were classified as finance leases. Finance leases were capitalised at the lease’s inception at the lower of the fair value of the leased property and the present value of the minimum lease payments. The corresponding rental obligations, net of finance charges, were included in other long term payables. Each lease payment was allocated between the liability and finance charges so as to achieve a constant rate on the finance balance outstanding. The interest element of the finance cost was charged to the income statement over the lease period so as to produce a constant periodic rate of interest on the remaining balance of the liability for each period. The property, plant and equipment acquired under finance lease was depreciated over the shorter of the asset’s useful life and the lease term. Critical accounting estimates and assumptions
Impairment Assets that are subject to depreciation are reviewed for impairment whenever events or changes in circumstances indicate that the carrying amount may not be recoverable. An impairment loss is recognised for the amount by which the asset’s carrying amount exceeds its recoverable amount. The recoverable amount is the higher of an asset’s fair value less costs to sell and value-in-use. For the purposes of assessing impairment, assets are grouped at the lowest levels for which there are separately identifiable cash flows (cash-generating units).
S U P E R R E T A I L G R O U P L I M I T E D A N N U A L R E P O R T 2 0 2 0 97
NOTES TO THE CONSOLIDATED FINANCIAL STATEMENTS (continued) For the period ended 27 June 2020
10. Intangible assets (continued) (a) Reconciliations (continued) Leased assets As at 29 June 2019, the carrying value of computer software held under finance lease was $1.4 million. From 30 June 2019, leased assets are presented as a separate line item in the balance sheet – refer Note 11 – Leases. Refer to Note 34 for details about the change in accounting policy. (b) Impairment tests for goodwill Goodwill is allocated to the Group’s cash-generating units (CGUs) identified according to the group of assets at the time of acquisition. A CGU level summary of the goodwill allocation is presented below:
CGU 2020
$m 2019
$m Supercheap Auto 45.3 45.3 rebel 376.6 376.5 BCF 25.1 25.1 Macpac 79.6 79.6 Total 526.6 526.5
The Group tests for goodwill impairment on an annual basis. The recoverable amount of a CGU is determined based on value-in-use (VIU) calculations which require the use of assumptions. These calculations use cash flow projections based on business plans covering a five-year period. Several scenarios have been assessed in relation to the economic uncertainty which may occur and recovery timeframes. The assumptions within the VIU calculations assume an economic downturn in the 2021 financial year (with limited lockdown periods in Australia and New Zealand) and a return to normal trading conditions with previously experienced growth during the 2022 financial year. Growth expectations beyond the 2022 financial year are expected to return to normal. Cash flows beyond the five-year period are extrapolated using the estimated growth rates stated below. The terminal growth rate does not exceed the historical long-term average growth rate for the business in which the CGU operates. Key assumptions used for value-in-use calculations The key assumptions used in the VIU calculations across each business segment CGU include sales growth, EBITDA margin, long-term growth rate and the discount rate. A pre-tax discount rate of 11.7 per cent (2019: 12.4 per cent) and terminal growth rate of 2.5 per cent (2019: 3.0 per cent) have been assumed. Projected sales are based on the assumed economic recovery as described above. Budgeted EBITDA margin is determined based on past performance and expectations for the future. The VIU model assumes an economic downturn in the 2021 financial year (with limited lockdown periods in Australia and New Zealand) and a return to normal trading conditions with previously experienced growth occurring during the 2022 financial year. Growth expectations beyond the 2022 financial year are expected to return to normal. The Group believes that the assumptions used in the VIU model reflect a combination of the Group’s past experience and the trading performance uncertainty associated with COVID-19. While temporary store closures may impact short term results, these are not expected to impact the long-term performance of the Group’s businesses. The recoverable amounts of each CGU are estimated to exceed their carrying amounts as at 27 June 2020. The Macpac CGU is the most sensitive to changes in assumptions. The recoverable amount of the Macpac CGU is estimated to exceed its carrying amount as at 27 June 2020 by $3.3 million (2019: $31.2 million). The recoverable amount of this CGU could equal or fall below its carrying amount if key assumptions were to change. Management do not consider that a reasonably possible change in any of the key assumptions for any of the CGU’s, other than Macpac, would cause their carrying amounts to exceed their recoverable amounts. Macpac Macpac had a challenging financial performance in 2020 with a 44.6 per cent decline in Segment EBITDA. This was due to the impact of summer bushfires on peak trading, a change in promotional strategy generating a delay in price increases and the impact of COVID-19. The New Zealand mandatory store closures drove a 17.5 per cent like-for-like sales decline in the last 14 weeks of the financial year. The key assumptions where the VIU calculations are most sensitive for the Macpac CGU are included below: 2020 2019 Sales (% compound annual growth rate) 7.4 6.3 EBITDA margin increase (% points) 5.6 2.6
97S U P E R R E TA I L G R O U P L I M I T E D A N N U A L R E P O R T 2020
96 S U P E R R E T A I L G R O U P L I M I T E D A N N U A L R E P O R T 2 0 2 0
NOTES TO THE CONSOLIDATED FINANCIAL STATEMENTS (continued) For the period ended 27 June 2020
9. Property, plant and equipment (continued)
10. Intangible assets
2020 2019 $m $m
Goodwill, at cost 528.7 528.6 Less accumulated impairment charge (2.1) (2.1) Net goodwill 526.6 526.5 Computer software, at cost 262.8 240.7 Less accumulated amortisation (168.4) (126.3) Net computer software 94.4 114.4 Brand names, at cost 311.8 311.8 Less accumulated amortisation and impairment charge (58.5) (58.5) Net brand names 253.3 253.3 Total net intangible assets 874.3 894.2 (a) Reconciliations Reconciliations of the carrying amounts for each class of intangible asset are set out below:
Goodwill
$m
Computer Software
$m
Brand Name
$m
Total
$m 2020 Carrying amounts at 29 June 2019 526.5 114.4 253.3 894.2 Additions 0.1 27.5 - 27.6 Amortisation charge(1) - (46.1) - (46.1) Change in accounting policy (Note 34) - (1.4) - (1.4) Carrying amounts at 27 June 2020 526.6 94.4 253.3 874.3
2019 Carrying amounts at 30 June 2018 525.9 112.4 253.3 891.6 Additions - 32.3 - 32.3 Adjustment to provisional accounting (Note 23(a)) 0.6 - - 0.6 Amortisation charge - (30.3) - (30.3) Carrying amounts at 29 June 2019 526.5 114.4 253.3 894.2 (1) Includes $13.7m of accelerated amortisation on software intangibles as a result of change in useful life assumptions.
Significant Accounting Policies (continued)
Leases Until 29 June 2019, Leases of property, plant and equipment where the Group had substantially all the risks and rewards of ownership, were classified as finance leases. Finance leases were capitalised at the lease’s inception at the lower of the fair value of the leased property and the present value of the minimum lease payments. The corresponding rental obligations, net of finance charges, were included in other long term payables. Each lease payment was allocated between the liability and finance charges so as to achieve a constant rate on the finance balance outstanding. The interest element of the finance cost was charged to the income statement over the lease period so as to produce a constant periodic rate of interest on the remaining balance of the liability for each period. The property, plant and equipment acquired under finance lease was depreciated over the shorter of the asset’s useful life and the lease term. Critical accounting estimates and assumptions
Impairment Assets that are subject to depreciation are reviewed for impairment whenever events or changes in circumstances indicate that the carrying amount may not be recoverable. An impairment loss is recognised for the amount by which the asset’s carrying amount exceeds its recoverable amount. The recoverable amount is the higher of an asset’s fair value less costs to sell and value-in-use. For the purposes of assessing impairment, assets are grouped at the lowest levels for which there are separately identifiable cash flows (cash-generating units).
S U P E R R E T A I L G R O U P L I M I T E D A N N U A L R E P O R T 2 0 2 0 97
NOTES TO THE CONSOLIDATED FINANCIAL STATEMENTS (continued) For the period ended 27 June 2020
10. Intangible assets (continued) (a) Reconciliations (continued) Leased assets As at 29 June 2019, the carrying value of computer software held under finance lease was $1.4 million. From 30 June 2019, leased assets are presented as a separate line item in the balance sheet – refer Note 11 – Leases. Refer to Note 34 for details about the change in accounting policy. (b) Impairment tests for goodwill Goodwill is allocated to the Group’s cash-generating units (CGUs) identified according to the group of assets at the time of acquisition. A CGU level summary of the goodwill allocation is presented below:
CGU 2020
$m 2019
$m Supercheap Auto 45.3 45.3 rebel 376.6 376.5 BCF 25.1 25.1 Macpac 79.6 79.6 Total 526.6 526.5
The Group tests for goodwill impairment on an annual basis. The recoverable amount of a CGU is determined based on value-in-use (VIU) calculations which require the use of assumptions. These calculations use cash flow projections based on business plans covering a five-year period. Several scenarios have been assessed in relation to the economic uncertainty which may occur and recovery timeframes. The assumptions within the VIU calculations assume an economic downturn in the 2021 financial year (with limited lockdown periods in Australia and New Zealand) and a return to normal trading conditions with previously experienced growth during the 2022 financial year. Growth expectations beyond the 2022 financial year are expected to return to normal. Cash flows beyond the five-year period are extrapolated using the estimated growth rates stated below. The terminal growth rate does not exceed the historical long-term average growth rate for the business in which the CGU operates. Key assumptions used for value-in-use calculations The key assumptions used in the VIU calculations across each business segment CGU include sales growth, EBITDA margin, long-term growth rate and the discount rate. A pre-tax discount rate of 11.7 per cent (2019: 12.4 per cent) and terminal growth rate of 2.5 per cent (2019: 3.0 per cent) have been assumed. Projected sales are based on the assumed economic recovery as described above. Budgeted EBITDA margin is determined based on past performance and expectations for the future. The VIU model assumes an economic downturn in the 2021 financial year (with limited lockdown periods in Australia and New Zealand) and a return to normal trading conditions with previously experienced growth occurring during the 2022 financial year. Growth expectations beyond the 2022 financial year are expected to return to normal. The Group believes that the assumptions used in the VIU model reflect a combination of the Group’s past experience and the trading performance uncertainty associated with COVID-19. While temporary store closures may impact short term results, these are not expected to impact the long-term performance of the Group’s businesses. The recoverable amounts of each CGU are estimated to exceed their carrying amounts as at 27 June 2020. The Macpac CGU is the most sensitive to changes in assumptions. The recoverable amount of the Macpac CGU is estimated to exceed its carrying amount as at 27 June 2020 by $3.3 million (2019: $31.2 million). The recoverable amount of this CGU could equal or fall below its carrying amount if key assumptions were to change. Management do not consider that a reasonably possible change in any of the key assumptions for any of the CGU’s, other than Macpac, would cause their carrying amounts to exceed their recoverable amounts. Macpac Macpac had a challenging financial performance in 2020 with a 44.6 per cent decline in Segment EBITDA. This was due to the impact of summer bushfires on peak trading, a change in promotional strategy generating a delay in price increases and the impact of COVID-19. The New Zealand mandatory store closures drove a 17.5 per cent like-for-like sales decline in the last 14 weeks of the financial year. The key assumptions where the VIU calculations are most sensitive for the Macpac CGU are included below: 2020 2019 Sales (% compound annual growth rate) 7.4 6.3 EBITDA margin increase (% points) 5.6 2.6

98 S U P E R R E TA I L G R O U P L I M I T E D A N N U A L R E P O R T 202098 S U P E R R E T A I L G R O U P L I M I T E D A N N U A L R E P O R T 2 0 2 0
NOTES TO THE CONSOLIDATED FINANCIAL STATEMENTS (continued) For the period ended 27 June 2020
10. Intangible assets (continued) (b) Impairment tests for goodwill (continued) Management have determined the values assigned to each of the above key assumptions as follows: Sales Compound average annual growth rate over the five-year period projection period of 7.4 per cent, based on past performance and management’s expectations of market development. In the 2020 financial year, sales declined by 5.0 per cent and like-for-like sales declined 9.1 per cent. The VIU model assumes that the 2021 financial year will deliver the same revenue per store as achieved in 2019. From 2022, revenue is projected to increase by average annual growth rates which are typical of those achieved in the past. The pilot of the sale of Macpac products in BCF was successful and its expansion will support future revenue growth. The VIU compound growth rate of 7.4 per cent is impacted by the low base in 2020. If the compound growth rate declines to 7.0 per cent this would cause the carrying amount of the Macpac CGU to exceed its recoverable amount. EBITDA margin increase – percentage points In the 2020 financial year, EBITDA declined by 35.3 per cent with the EBITDA margin reducing from 11.2 per cent in 2019 to 7.7 per cent. The VIU model assumes that the 2021 financial year will deliver constrained EBITDA margins in line with 2020. From 2022, the EBITDA margin will return to levels achieved in 2019. EBITDA margin will grow from 2023 to 2025 based on initiatives already in place to lower the cost of sales and fractionalise fixed costs over growing revenue. The EBITDA margin expansion of 5.6 percentage points over five years is impacted by the low base in 2020. If the EBITDA margin rate expansion only achieves 5.5 percentage points this would cause the carrying amount of the Macpac CGU to exceed its recoverable amount. Long-term growth rate This is the weighted average growth rate used to extrapolate cash flows beyond the five year period. A terminal growth rate decrease from 2.5 per cent to 2.3 per cent would could cause the carrying amount of the Macpac CGU to exceed its recoverable amount. Pre-tax discount rates A pre-tax discount rate increase from 11.7 per cent to 11.8 per cent would cause the carrying amount of the Macpac CGU to exceed its recoverable amount. Management have considered and assessed the reasonably possible changes for other key assumptions and have not identified any instances that could cause the carrying amount of the Macpac CGU to exceed its recoverable amount. (c) Impairment tests for the useful life for brands No amortisation is provided against the carrying value of purchased brand names on the basis that they are considered to have indefinite useful lives. Key factors taken into account in assessing the useful life of brands were: the strong recognition of brands; and there is an absence of legal, technical or commercial factors indicating that the life should be considered limited. The carrying values of the purchased brand names are:
Brand 2020
$m 2019
$m rebel 209.0 209.0 Macpac 44.3 44.3 Total 253.3 253.3
Key assumptions used for value-in-use calculations Management have consistently applied two key assumptions in the VIU analysis across each business segment CGU, a pre-tax discount rate of 11.7 per cent (2019: 12.4 per cent) and terminal growth rate of 2.5 per cent (2019: 3.0 per cent). Budgeted gross margin is determined based on past performance and expectations for the future. The recoverable amount of the brand names currently exceeds their carrying values. Management do not consider that a reasonably possible change in any of the key assumptions would cause the carrying value of any of the brand names to exceed their recoverable amounts.
99S U P E R R E TA I L G R O U P L I M I T E D A N N U A L R E P O R T 202098 S U P E R R E T A I L G R O U P L I M I T E D A N N U A L R E P O R T 2 0 2 0
NOTES TO THE CONSOLIDATED FINANCIAL STATEMENTS (continued) For the period ended 27 June 2020
10. Intangible assets (continued) (b) Impairment tests for goodwill (continued) Management have determined the values assigned to each of the above key assumptions as follows: Sales Compound average annual growth rate over the five-year period projection period of 7.4 per cent, based on past performance and management’s expectations of market development. In the 2020 financial year, sales declined by 5.0 per cent and like-for-like sales declined 9.1 per cent. The VIU model assumes that the 2021 financial year will deliver the same revenue per store as achieved in 2019. From 2022, revenue is projected to increase by average annual growth rates which are typical of those achieved in the past. The pilot of the sale of Macpac products in BCF was successful and its expansion will support future revenue growth. The VIU compound growth rate of 7.4 per cent is impacted by the low base in 2020. If the compound growth rate declines to 7.0 per cent this would cause the carrying amount of the Macpac CGU to exceed its recoverable amount. EBITDA margin increase – percentage points In the 2020 financial year, EBITDA declined by 35.3 per cent with the EBITDA margin reducing from 11.2 per cent in 2019 to 7.7 per cent. The VIU model assumes that the 2021 financial year will deliver constrained EBITDA margins in line with 2020. From 2022, the EBITDA margin will return to levels achieved in 2019. EBITDA margin will grow from 2023 to 2025 based on initiatives already in place to lower the cost of sales and fractionalise fixed costs over growing revenue. The EBITDA margin expansion of 5.6 percentage points over five years is impacted by the low base in 2020. If the EBITDA margin rate expansion only achieves 5.5 percentage points this would cause the carrying amount of the Macpac CGU to exceed its recoverable amount. Long-term growth rate This is the weighted average growth rate used to extrapolate cash flows beyond the five year period. A terminal growth rate decrease from 2.5 per cent to 2.3 per cent would could cause the carrying amount of the Macpac CGU to exceed its recoverable amount. Pre-tax discount rates A pre-tax discount rate increase from 11.7 per cent to 11.8 per cent would cause the carrying amount of the Macpac CGU to exceed its recoverable amount. Management have considered and assessed the reasonably possible changes for other key assumptions and have not identified any instances that could cause the carrying amount of the Macpac CGU to exceed its recoverable amount. (c) Impairment tests for the useful life for brands No amortisation is provided against the carrying value of purchased brand names on the basis that they are considered to have indefinite useful lives. Key factors taken into account in assessing the useful life of brands were: the strong recognition of brands; and there is an absence of legal, technical or commercial factors indicating that the life should be considered limited. The carrying values of the purchased brand names are:
Brand 2020
$m 2019
$m rebel 209.0 209.0 Macpac 44.3 44.3 Total 253.3 253.3
Key assumptions used for value-in-use calculations Management have consistently applied two key assumptions in the VIU analysis across each business segment CGU, a pre-tax discount rate of 11.7 per cent (2019: 12.4 per cent) and terminal growth rate of 2.5 per cent (2019: 3.0 per cent). Budgeted gross margin is determined based on past performance and expectations for the future. The recoverable amount of the brand names currently exceeds their carrying values. Management do not consider that a reasonably possible change in any of the key assumptions would cause the carrying value of any of the brand names to exceed their recoverable amounts.
S U P E R R E T A I L G R O U P L I M I T E D A N N U A L R E P O R T 2 0 2 0 99
NOTES TO THE CONSOLIDATED FINANCIAL STATEMENTS (continued) For the period ended 27 June 2020
10. Intangible assets (continued)
Significant Accounting Policies
Goodwill Goodwill represents the excess of the cost of an acquisition over the fair value of the Group’s share of the net identifiable assets of the acquired subsidiary or business at the date of the acquisition. Goodwill on acquisitions of subsidiaries is included in intangible assets. Goodwill is not amortised. Instead, it is tested for impairment annually, or more frequently if events or changes in circumstances indicate that it might be impaired, and is carried at cost less accumulated impairment losses. Any impairment is recognised as an expense and is not subsequently reversed. Gains and losses on the disposal of an entity include the carrying amount of goodwill relating to the entity sold. Goodwill is allocated to cash-generating units for the purpose of impairment testing. The allocation is made to those cash-generating units or groups of cash-generating units that are expected to benefit from the business combination in which the goodwill arose, identified according to operating segments. Intangible assets with indefinite useful lives Separately acquired trademarks and licences are shown at historical cost. Trademarks and licences acquired in a business combination are recognised at fair value at the acquisition date. Trademarks are amortised over their useful lives. Other intangible assets Amortisation is calculated on a straight line basis. Estimates of remaining useful lives and residual values are reviewed and adjusted, if appropriate, at each statement of financial position date. The amortisation rates used for each class of intangible assets are as follows:
Computer software 10% – 33.3% Brand names Nil
Computer software Costs incurred in developing products or systems and costs incurred in acquiring software and licences that will contribute to future period financial benefits through revenue generation and/or cost reduction are capitalised to software and systems. Costs capitalised include external direct costs of materials and service, employee costs and an appropriate portion of relevant overheads. IT development costs include only those costs directly attributable to the development phase and are only recognised following completion of technical feasibility and where the Group has an intention and ability to use the asset. Brand names Brand names that are acquired as part of a business combination are recognised separately from goodwill. These assets are carried at their fair value at the date of acquisition less impairment losses. Brand names are valued using the relief from royalty method. Brand names are determined to have indefinite useful lives and therefore do not attract amortisation. Research and development Research expenditure is recognised as an expense as incurred. Costs incurred on development projects (relating to the design and testing of new or improved products) are recognised as intangible assets when it is probable that the project will, after considering its commercial and technical feasibility, be completed and generate future economic benefits and its costs can be measured reliably. The expenditure capitalised comprises all directly attributable costs, including costs of materials, services, direct labour and an appropriate proportion of overheads. Other development expenditures that do not meet these criteria are recognised as an expense as incurred. Development costs previously recognised as an expense are not recognised as an asset in a subsequent period. Capitalised development costs are recorded as intangible assets and amortised from the point at which the asset is ready for use. Other items of expenditure Significant items of expenditure, such as costs incurred in store set-ups, are expensed in the financial year in which these costs are incurred. Critical accounting estimates and assumptions
Capitalised software costs and useful lives The Group has undertaken significant development of software in relation to the multi-channel customer programme and mutli-channel supply chain and inventory programme. The useful lives have been determined based on the intended period of use of this software. Estimated impairment of indefinite useful life non-financial assets The Group tests annually whether indefinite useful life non-financial assets have suffered any impairment, in accordance with the accounting policy stated above. The recoverable amounts of cash-generating units have been determined based on value-in-use calculations. These calculations require the use of assumptions. Refer above for details of these assumptions.

100 S U P E R R E TA I L G R O U P L I M I T E D A N N U A L R E P O R T 2020100 S U P E R R E T A I L G R O U P L I M I T E D A N N U A L R E P O R T 2 0 2 0
NOTES TO THE CONSOLIDATED FINANCIAL STATEMENTS (continued) For the period ended 27 June 2020
11. Leases
2020 30 June
2019(1) Right-of-use assets $m $m Properties 842.0 835.3 Computer equipment 6.0 8.1 Total right-of-use assets 848.0 843.4 Lease liabilities Current 178.4 184.3 Non-current 760.9 745.8 Total lease liabilities 939.3 930.1 (1) In the previous year, the Group only recognised lease assets and lease liabilities in relation to leases that were classified as ‘finance leases’ under
AASB 117 Leases. The assets were presented in property, plant and equipment and the liabilities as part of the Group’s borrowings. For adjustments recognised on adoption of AASB 16 Leases on 30 June 2019, refer to Note 34 – Changes in accounting policy.
Additions to the right-of-use assets during the year were $194.0 million.
2020 2019 Depreciation charge on right-of-use assets $m $m Properties 177.3 - Computer equipment 2.9 - Total depreciation charge on right-of-use assets 180.2 - Interest expenses (included in Net finance costs) 37.3 - Expense relating to short-term leases (included in Occupancy expenses) 20.0 - Expense relating to leases of low-value assets (included in Cost of Goods Sold and Administrative expenses) 3.2 - Expense relating to variable lease payments not included in lease liabilities (included in Occupancy expenses) 28.4 - The total cash outflow for leases during the year were $209.1 million. Impact of COVID-19 The Group has adopted the practical expedient in paragraph 46A of AASB 16 Leases and elected not to account for any rent concessions granted as a result of the COVID-19 pandemic as a lease modification. The amount recognised in profit or loss due to changes in lease payments arising from such concessions was $2.4 million.
Significant Accounting Policies
Leases The Group leases various offices, warehouses, retail stores, equipment and cars. Rental contracts are typically made for fixed periods of 1 to 20 years but may have extension options as described below. Lease terms are negotiated on an individual basis and contain a wide range of different terms and conditions. The lease agreements do not impose any covenants, but leased assets may not be used as security for borrowing purposes. Until 29 June 2019, leases of property, plant and equipment were classified as either finance or operating leases. Payments made under operating leases (net of any incentives received from the lessor) were charged to profit or loss on a straight-line basis over the period of the lease. From 30 June 2019, leases are recognised as a right-of-use asset and a corresponding liability at the date at which the leased asset is available for use by the Group. Each lease payment is allocated between the liability and finance cost. The finance cost is charged to profit or loss over the lease period so as to produce a constant periodic rate of interest on the remaining balance of the liability for each period. The right-of-use asset is depreciated over the shorter of the asset's useful life and the lease term on a straight-line basis. Assets and liabilities arising from a lease are initially measured on a present value basis. Lease liabilities include the net present value of the following lease payments: fixed payments (including in-substance fixed payments), less any lease incentives receivable variable lease payments that are based on an index or a rate amounts expected to be payable by the lessee under residual value guarantees the exercise price of a purchase option if the lessee is reasonably certain to exercise that option, and payments of penalties for terminating the lease, if the lease term reflects the lessee exercising that option.
101S U P E R R E TA I L G R O U P L I M I T E D A N N U A L R E P O R T 2020S U P E R R E T A I L G R O U P L I M I T E D A N N U A L R E P O R T 2 0 2 0 101
NOTES TO THE CONSOLIDATED FINANCIAL STATEMENTS (continued) For the period ended 27 June 2020
11. Leases (continued)
12. Trade and other payables 2020 2019 Current $m $m Trade payables 335.2 274.8 Other payables 107.1 82.5 Straight line lease adjustment(1) - 5.4 Total current trade and other payables 442.3 362.7 Non-current Straight line lease adjustment(1) - 49.5 Total non-current trade and other payables - 49.5 (1) The impact of applying AASB 16 Leases was to adjust straight line lease balances to nil as at 30 June 2019.
Significant Accounting Policies
Trade and other payables Trade and other payables are payables for goods and services provided to the consolidated entity prior to the end of the financial year and which are unpaid at that date. The amounts are unsecured and are normally paid within 60 days of recognition. Trade and other payables are presented as current liabilities unless payment is not due within 12 months from the reporting date.
Significant Accounting Policies (continued)
Leases (continued) The lease payments are discounted using the interest rate implicit in the lease. If that rate cannot be determined, the lessee’s incremental borrowing rate is used, being the rate that the lessee would have to pay to borrow the funds necessary to obtain an asset of similar value in a similar economic environment with similar terms and conditions. Right-of-use assets are measured at cost comprising the following: the amount of the initial measurement of lease liability any lease payments made at or before the commencement date less any lease incentives received any initial direct costs, and restoration costs. Payments associated with short-term leases and leases of low-value assets are recognised on a straight-line basis as an expense in profit or loss. Short-term leases are leases with a lease term of 12 months or less. Low-value assets comprise small items of office equipment and furniture, and other immaterial assets. Extension and termination options are included in a number of property leases across the Group. These terms are used to maximise operational flexibility in terms of managing contracts. The majority of extension and termination options held are exercisable only by the Group and not by the respective lessor. Critical accounting estimates and assumptions
Variable lease payments Some property leases contain variable payment terms that are linked to sales generated from a store. For individual stores, up to 100% of lease payments are on the basis of variable payment terms and there is a wide range of sales percentages applied. Variable payment terms are used for a variety of reasons, including minimising the fixed costs base for newly established stores. Variable lease payments that depend on sales are recognised in profit or loss in the period in which the condition that triggers those payments occurs.
Extension and termination options In determining the lease term, management considers all facts and circumstances that create an economic incentive to exercise an extension option, or not exercise a termination option. Extension options (or periods after termination options) are included in the lease term only if the lease is reasonably certain to be extended (or not terminated).
Given the uncertainties that exist within the retail market, management considers leases with more than 2 years to expiry as not reasonably certain to be extended. Of the Group’s lease portfolio 65% of leases contain option renewals. The lease liability currently includes extension options in the calculation of lease term for 14% of leases with those options. The assessment is reviewed if a significant event or a significant change in circumstances occurs which affects this assessment and that is within the control of the lessee.
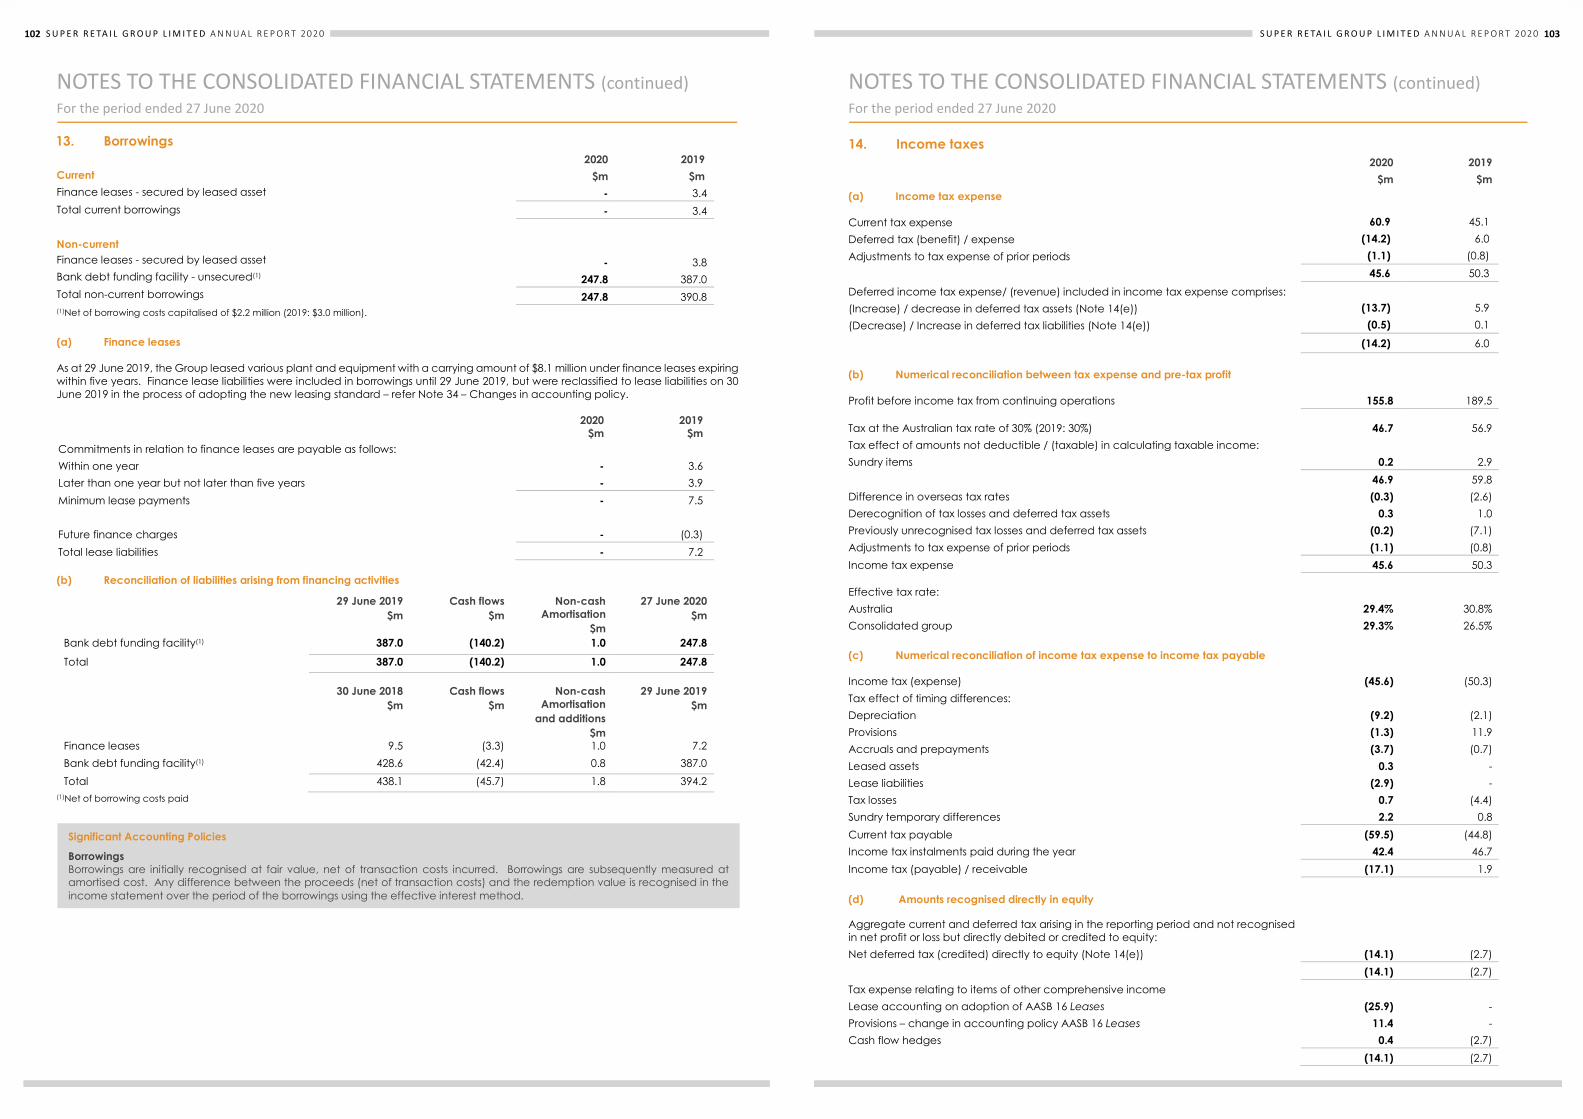
102 S U P E R R E TA I L G R O U P L I M I T E D A N N U A L R E P O R T 2020102 S U P E R R E T A I L G R O U P L I M I T E D A N N U A L R E P O R T 2 0 2 0
NOTES TO THE CONSOLIDATED FINANCIAL STATEMENTS (continued) For the period ended 27 June 2020
13. Borrowings 2020 2019 Current $m $m Finance leases - secured by leased asset - 3.4 Total current borrowings - 3.4 Non-current Finance leases - secured by leased asset - 3.8 Bank debt funding facility - unsecured(1) 247.8 387.0 Total non-current borrowings 247.8 390.8 (1)Net of borrowing costs capitalised of $2.2 million (2019: $3.0 million).
(a) Finance leases As at 29 June 2019, the Group leased various plant and equipment with a carrying amount of $8.1 million under finance leases expiring within five years. Finance lease liabilities were included in borrowings until 29 June 2019, but were reclassified to lease liabilities on 30 June 2019 in the process of adopting the new leasing standard – refer Note 34 – Changes in accounting policy.
2020
$m 2019
$m Commitments in relation to finance leases are payable as follows: Within one year - 3.6 Later than one year but not later than five years - 3.9 Minimum lease payments - 7.5 Future finance charges - (0.3) Total lease liabilities - 7.2 (b) Reconciliation of liabilities arising from financing activities
29 June 2019 $m
Cash flows $m
Non-cash Amortisation
$m
27 June 2020 $m
Bank debt funding facility(1) 387.0 (140.2) 1.0 247.8 Total 387.0 (140.2) 1.0 247.8 30 June 2018
$m Cash flows
$m Non-cash
Amortisation and additions
$m
29 June 2019 $m
Finance leases 9.5 (3.3) 1.0 7.2 Bank debt funding facility(1) 428.6 (42.4) 0.8 387.0 Total 438.1 (45.7) 1.8 394.2
(1)Net of borrowing costs paid
Significant Accounting Policies
Borrowings Borrowings are initially recognised at fair value, net of transaction costs incurred. Borrowings are subsequently measured at amortised cost. Any difference between the proceeds (net of transaction costs) and the redemption value is recognised in the income statement over the period of the borrowings using the effective interest method.
103S U P E R R E TA I L G R O U P L I M I T E D A N N U A L R E P O R T 2020S U P E R R E T A I L G R O U P L I M I T E D A N N U A L R E P O R T 2 0 2 0 103
NOTES TO THE CONSOLIDATED FINANCIAL STATEMENTS (continued) For the period ended 27 June 2020
14. Income taxes 2020 2019 $m $m (a) Income tax expense
Current tax expense 60.9 45.1 Deferred tax (benefit) / expense (14.2) 6.0 Adjustments to tax expense of prior periods (1.1) (0.8)
45.6 50.3
Deferred income tax expense/ (revenue) included in income tax expense comprises: (Increase) / decrease in deferred tax assets (Note 14(e)) (13.7) 5.9 (Decrease) / Increase in deferred tax liabilities (Note 14(e)) (0.5) 0.1
(14.2) 6.0
(b) Numerical reconciliation between tax expense and pre-tax profit
Profit before income tax from continuing operations 155.8 189.5
Tax at the Australian tax rate of 30% (2019: 30%) 46.7 56.9 Tax effect of amounts not deductible / (taxable) in calculating taxable income: Sundry items 0.2 2.9
46.9 59.8 Difference in overseas tax rates (0.3) (2.6) Derecognition of tax losses and deferred tax assets 0.3 1.0 Previously unrecognised tax losses and deferred tax assets (0.2) (7.1) Adjustments to tax expense of prior periods (1.1) (0.8) Income tax expense 45.6 50.3
Effective tax rate: Australia 29.4% 30.8% Consolidated group 29.3% 26.5%
(c) Numerical reconciliation of income tax expense to income tax payable
Income tax (expense) (45.6) (50.3) Tax effect of timing differences: Depreciation (9.2) (2.1) Provisions (1.3) 11.9 Accruals and prepayments (3.7) (0.7) Leased assets 0.3 - Lease liabilities (2.9) - Tax losses 0.7 (4.4) Sundry temporary differences 2.2 0.8 Current tax payable (59.5) (44.8) Income tax instalments paid during the year 42.4 46.7 Income tax (payable) / receivable (17.1) 1.9
(d) Amounts recognised directly in equity
Aggregate current and deferred tax arising in the reporting period and not recognised in net profit or loss but directly debited or credited to equity: Net deferred tax (credited) directly to equity (Note 14(e)) (14.1) (2.7)
(14.1) (2.7) Tax expense relating to items of other comprehensive income Lease accounting on adoption of AASB 16 Leases (25.9) - Provisions – change in accounting policy AASB 16 Leases 11.4 - Cash flow hedges 0.4 (2.7) (14.1) (2.7)
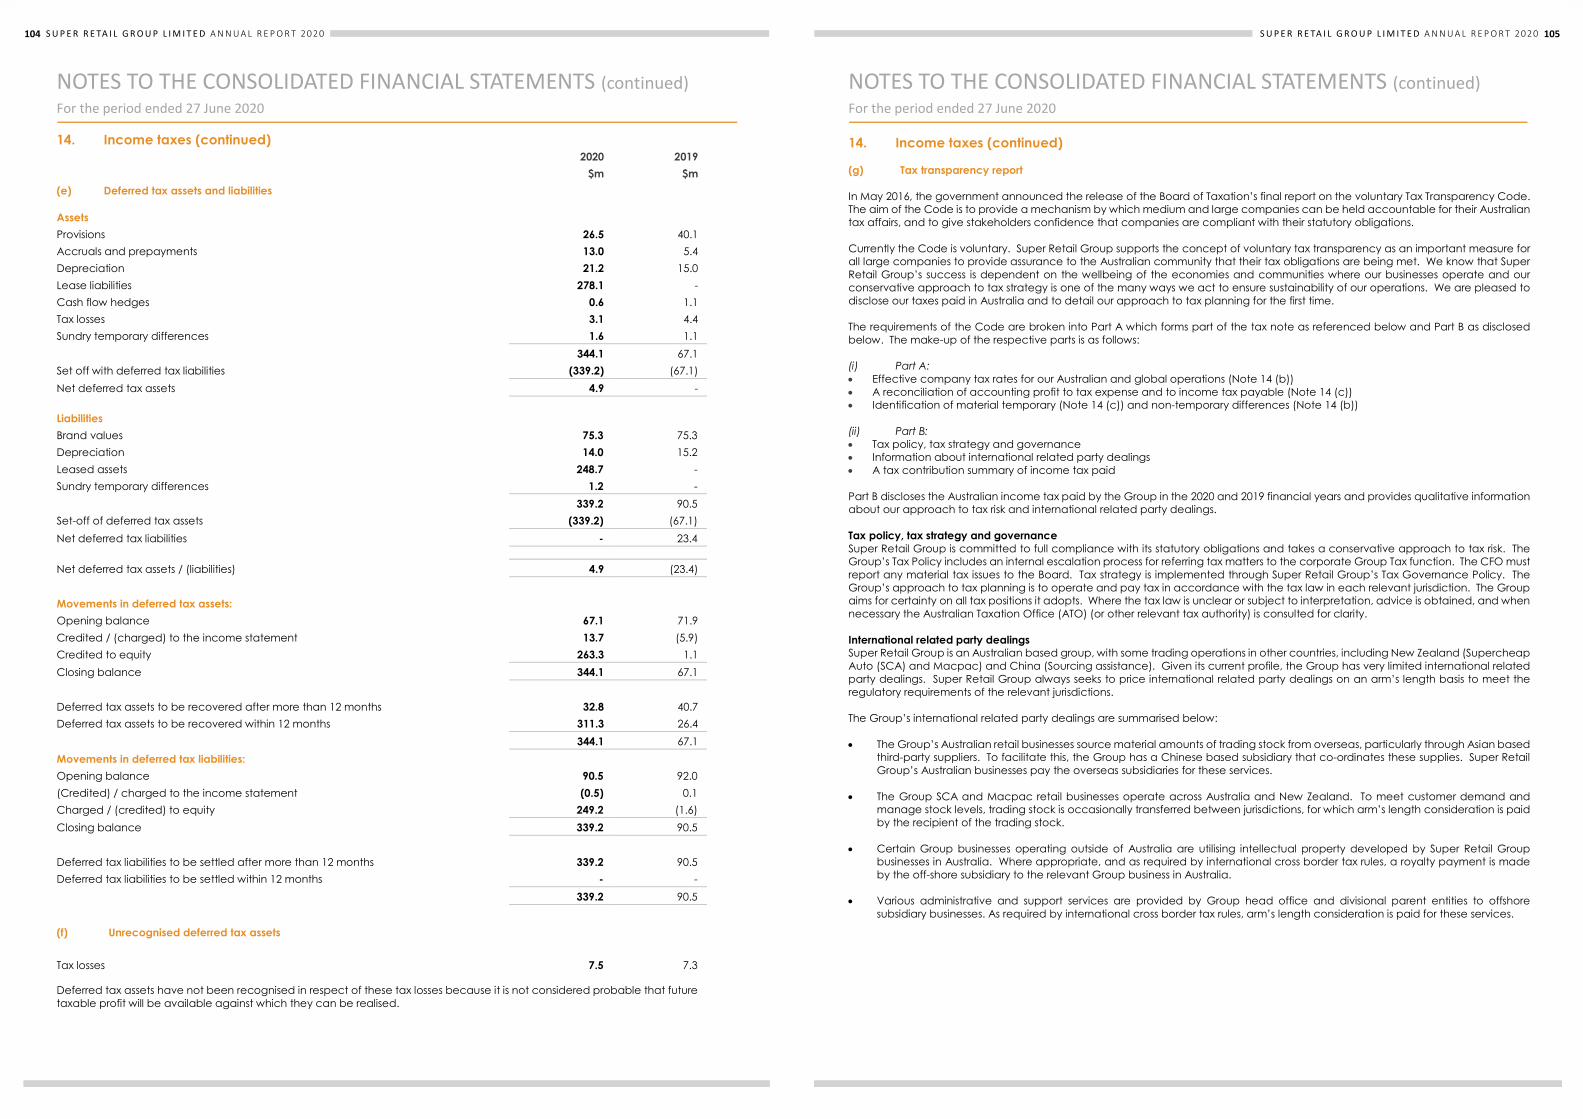
104 S U P E R R E TA I L G R O U P L I M I T E D A N N U A L R E P O R T 2020104 S U P E R R E T A I L G R O U P L I M I T E D A N N U A L R E P O R T 2 0 2 0
NOTES TO THE CONSOLIDATED FINANCIAL STATEMENTS (continued) For the period ended 27 June 2020
14. Income taxes (continued) 2020 2019 $m $m (e) Deferred tax assets and liabilities Assets Provisions 26.5 40.1 Accruals and prepayments 13.0 5.4 Depreciation 21.2 15.0 Lease liabilities 278.1 - Cash flow hedges 0.6 1.1 Tax losses 3.1 4.4 Sundry temporary differences 1.6 1.1 344.1 67.1 Set off with deferred tax liabilities (339.2) (67.1) Net deferred tax assets 4.9 -
Liabilities Brand values 75.3 75.3 Depreciation 14.0 15.2 Leased assets 248.7 - Sundry temporary differences 1.2 - 339.2 90.5 Set-off of deferred tax assets (339.2) (67.1) Net deferred tax liabilities - 23.4
Net deferred tax assets / (liabilities) 4.9 (23.4) Movements in deferred tax assets: Opening balance 67.1 71.9 Credited / (charged) to the income statement 13.7 (5.9) Credited to equity 263.3 1.1 Closing balance 344.1 67.1 Deferred tax assets to be recovered after more than 12 months 32.8 40.7 Deferred tax assets to be recovered within 12 months 311.3 26.4 344.1 67.1 Movements in deferred tax liabilities: Opening balance 90.5 92.0 (Credited) / charged to the income statement (0.5) 0.1 Charged / (credited) to equity 249.2 (1.6) Closing balance 339.2 90.5 Deferred tax liabilities to be settled after more than 12 months 339.2 90.5 Deferred tax liabilities to be settled within 12 months - - 339.2 90.5 (f) Unrecognised deferred tax assets Tax losses 7.5 7.3
Deferred tax assets have not been recognised in respect of these tax losses because it is not considered probable that future taxable profit will be available against which they can be realised.
105S U P E R R E TA I L G R O U P L I M I T E D A N N U A L R E P O R T 2020104 S U P E R R E T A I L G R O U P L I M I T E D A N N U A L R E P O R T 2 0 2 0
NOTES TO THE CONSOLIDATED FINANCIAL STATEMENTS (continued) For the period ended 27 June 2020
14. Income taxes (continued) 2020 2019 $m $m (e) Deferred tax assets and liabilities Assets Provisions 26.5 40.1 Accruals and prepayments 13.0 5.4 Depreciation 21.2 15.0 Lease liabilities 278.1 - Cash flow hedges 0.6 1.1 Tax losses 3.1 4.4 Sundry temporary differences 1.6 1.1 344.1 67.1 Set off with deferred tax liabilities (339.2) (67.1) Net deferred tax assets 4.9 -
Liabilities Brand values 75.3 75.3 Depreciation 14.0 15.2 Leased assets 248.7 - Sundry temporary differences 1.2 - 339.2 90.5 Set-off of deferred tax assets (339.2) (67.1) Net deferred tax liabilities - 23.4
Net deferred tax assets / (liabilities) 4.9 (23.4) Movements in deferred tax assets: Opening balance 67.1 71.9 Credited / (charged) to the income statement 13.7 (5.9) Credited to equity 263.3 1.1 Closing balance 344.1 67.1 Deferred tax assets to be recovered after more than 12 months 32.8 40.7 Deferred tax assets to be recovered within 12 months 311.3 26.4 344.1 67.1 Movements in deferred tax liabilities: Opening balance 90.5 92.0 (Credited) / charged to the income statement (0.5) 0.1 Charged / (credited) to equity 249.2 (1.6) Closing balance 339.2 90.5 Deferred tax liabilities to be settled after more than 12 months 339.2 90.5 Deferred tax liabilities to be settled within 12 months - - 339.2 90.5 (f) Unrecognised deferred tax assets Tax losses 7.5 7.3
Deferred tax assets have not been recognised in respect of these tax losses because it is not considered probable that future taxable profit will be available against which they can be realised.
S U P E R R E T A I L G R O U P L I M I T E D A N N U A L R E P O R T 2 0 2 0 105
NOTES TO THE CONSOLIDATED FINANCIAL STATEMENTS (continued) For the period ended 27 June 2020
14. Income taxes (continued) (g) Tax transparency report In May 2016, the government announced the release of the Board of Taxation’s final report on the voluntary Tax Transparency Code. The aim of the Code is to provide a mechanism by which medium and large companies can be held accountable for their Australian tax affairs, and to give stakeholders confidence that companies are compliant with their statutory obligations. Currently the Code is voluntary. Super Retail Group supports the concept of voluntary tax transparency as an important measure for all large companies to provide assurance to the Australian community that their tax obligations are being met. We know that Super Retail Group’s success is dependent on the wellbeing of the economies and communities where our businesses operate and our conservative approach to tax strategy is one of the many ways we act to ensure sustainability of our operations. We are pleased to disclose our taxes paid in Australia and to detail our approach to tax planning for the first time. The requirements of the Code are broken into Part A which forms part of the tax note as referenced below and Part B as disclosed below. The make-up of the respective parts is as follows: (i) Part A: Effective company tax rates for our Australian and global operations (Note 14 (b)) A reconciliation of accounting profit to tax expense and to income tax payable (Note 14 (c)) Identification of material temporary (Note 14 (c)) and non-temporary differences (Note 14 (b)) (ii) Part B: Tax policy, tax strategy and governance Information about international related party dealings A tax contribution summary of income tax paid Part B discloses the Australian income tax paid by the Group in the 2020 and 2019 financial years and provides qualitative information about our approach to tax risk and international related party dealings. Tax policy, tax strategy and governance Super Retail Group is committed to full compliance with its statutory obligations and takes a conservative approach to tax risk. The Group’s Tax Policy includes an internal escalation process for referring tax matters to the corporate Group Tax function. The CFO must report any material tax issues to the Board. Tax strategy is implemented through Super Retail Group’s Tax Governance Policy. The Group’s approach to tax planning is to operate and pay tax in accordance with the tax law in each relevant jurisdiction. The Group aims for certainty on all tax positions it adopts. Where the tax law is unclear or subject to interpretation, advice is obtained, and when necessary the Australian Taxation Office (ATO) (or other relevant tax authority) is consulted for clarity. International related party dealings Super Retail Group is an Australian based group, with some trading operations in other countries, including New Zealand (Supercheap Auto (SCA) and Macpac) and China (Sourcing assistance). Given its current profile, the Group has very limited international related party dealings. Super Retail Group always seeks to price international related party dealings on an arm’s length basis to meet the regulatory requirements of the relevant jurisdictions. The Group’s international related party dealings are summarised below: The Group’s Australian retail businesses source material amounts of trading stock from overseas, particularly through Asian based
third-party suppliers. To facilitate this, the Group has a Chinese based subsidiary that co-ordinates these supplies. Super Retail Group’s Australian businesses pay the overseas subsidiaries for these services.
The Group SCA and Macpac retail businesses operate across Australia and New Zealand. To meet customer demand and
manage stock levels, trading stock is occasionally transferred between jurisdictions, for which arm’s length consideration is paid by the recipient of the trading stock.
Certain Group businesses operating outside of Australia are utilising intellectual property developed by Super Retail Group
businesses in Australia. Where appropriate, and as required by international cross border tax rules, a royalty payment is made by the off-shore subsidiary to the relevant Group business in Australia.
Various administrative and support services are provided by Group head office and divisional parent entities to offshore
subsidiary businesses. As required by international cross border tax rules, arm’s length consideration is paid for these services.
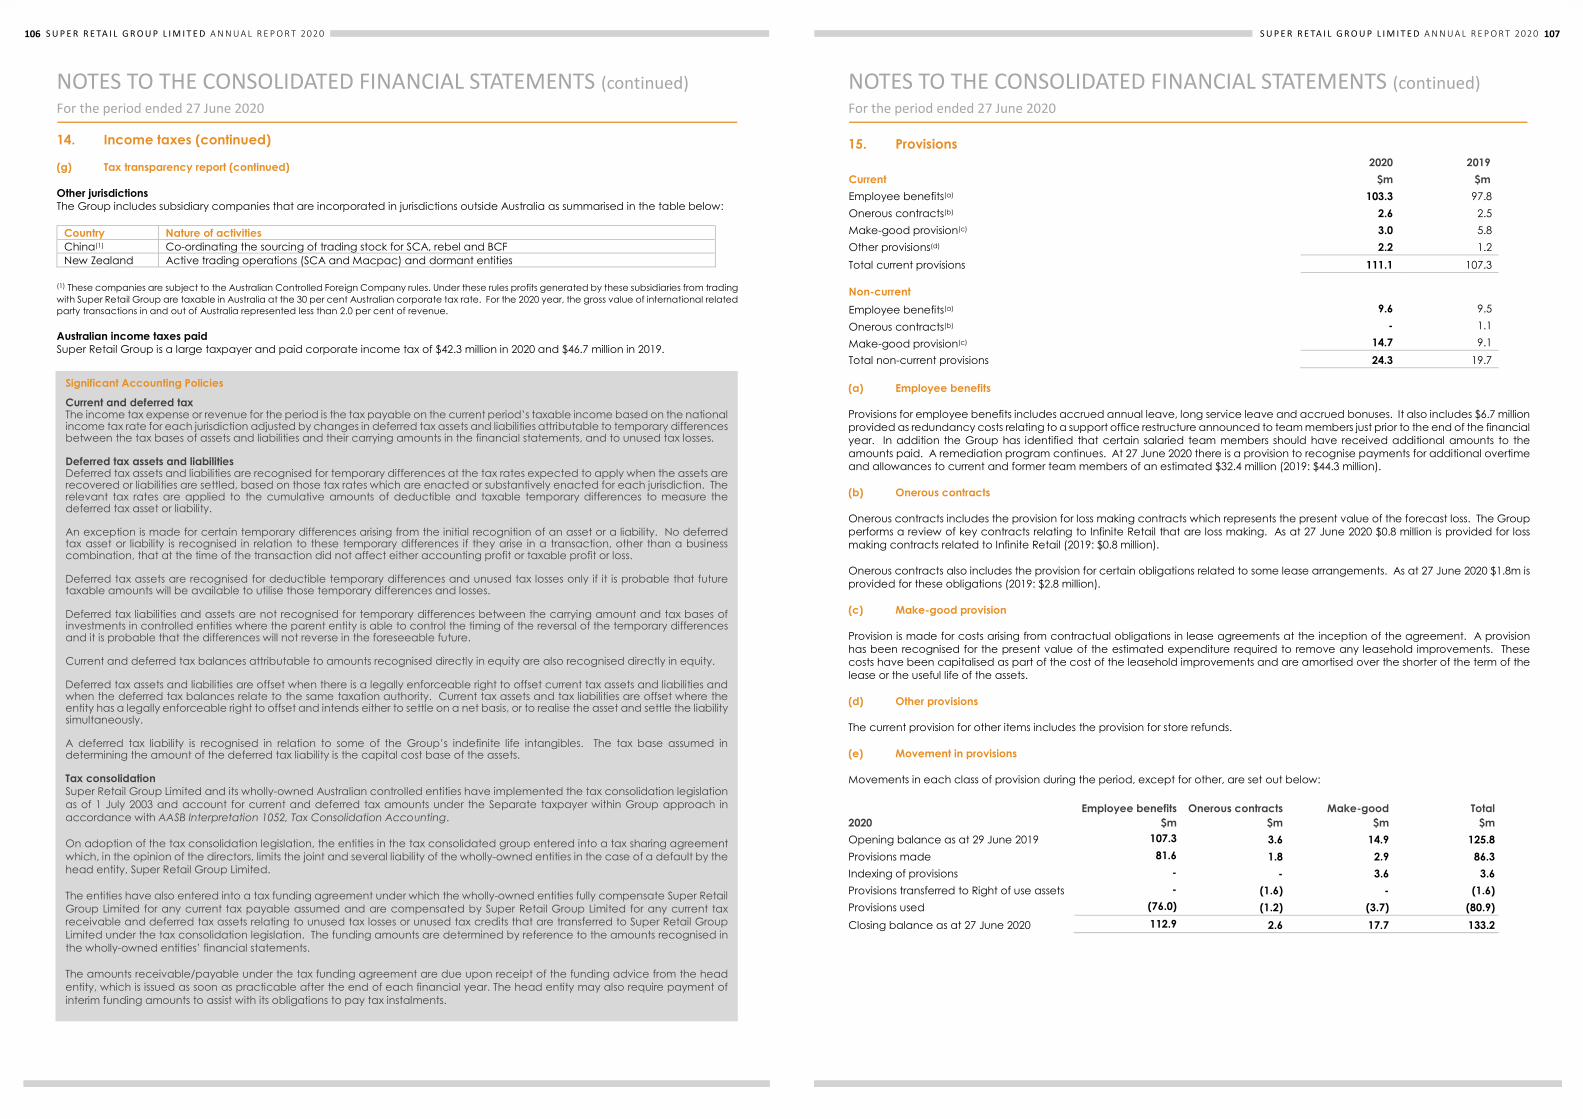
106 S U P E R R E TA I L G R O U P L I M I T E D A N N U A L R E P O R T 2020106 S U P E R R E T A I L G R O U P L I M I T E D A N N U A L R E P O R T 2 0 2 0
NOTES TO THE CONSOLIDATED FINANCIAL STATEMENTS (continued) For the period ended 27 June 2020
14. Income taxes (continued) (g) Tax transparency report (continued) Other jurisdictions The Group includes subsidiary companies that are incorporated in jurisdictions outside Australia as summarised in the table below:
Country Nature of activities China(1) Co-ordinating the sourcing of trading stock for SCA, rebel and BCF New Zealand Active trading operations (SCA and Macpac) and dormant entities
(1) These companies are subject to the Australian Controlled Foreign Company rules. Under these rules profits generated by these subsidiaries from trading with Super Retail Group are taxable in Australia at the 30 per cent Australian corporate tax rate. For the 2020 year, the gross value of international related party transactions in and out of Australia represented less than 2.0 per cent of revenue. Australian income taxes paid Super Retail Group is a large taxpayer and paid corporate income tax of $42.3 million in 2020 and $46.7 million in 2019.
Significant Accounting Policies
Current and deferred tax The income tax expense or revenue for the period is the tax payable on the current period’s taxable income based on the national income tax rate for each jurisdiction adjusted by changes in deferred tax assets and liabilities attributable to temporary differences between the tax bases of assets and liabilities and their carrying amounts in the financial statements, and to unused tax losses. Deferred tax assets and liabilities Deferred tax assets and liabilities are recognised for temporary differences at the tax rates expected to apply when the assets are recovered or liabilities are settled, based on those tax rates which are enacted or substantively enacted for each jurisdiction. The relevant tax rates are applied to the cumulative amounts of deductible and taxable temporary differences to measure the deferred tax asset or liability. An exception is made for certain temporary differences arising from the initial recognition of an asset or a liability. No deferred tax asset or liability is recognised in relation to these temporary differences if they arise in a transaction, other than a business combination, that at the time of the transaction did not affect either accounting profit or taxable profit or loss. Deferred tax assets are recognised for deductible temporary differences and unused tax losses only if it is probable that future taxable amounts will be available to utilise those temporary differences and losses. Deferred tax liabilities and assets are not recognised for temporary differences between the carrying amount and tax bases of investments in controlled entities where the parent entity is able to control the timing of the reversal of the temporary differences and it is probable that the differences will not reverse in the foreseeable future. Current and deferred tax balances attributable to amounts recognised directly in equity are also recognised directly in equity. Deferred tax assets and liabilities are offset when there is a legally enforceable right to offset current tax assets and liabilities and when the deferred tax balances relate to the same taxation authority. Current tax assets and tax liabilities are offset where the entity has a legally enforceable right to offset and intends either to settle on a net basis, or to realise the asset and settle the liability simultaneously. A deferred tax liability is recognised in relation to some of the Group’s indefinite life intangibles. The tax base assumed in determining the amount of the deferred tax liability is the capital cost base of the assets. Tax consolidation Super Retail Group Limited and its wholly-owned Australian controlled entities have implemented the tax consolidation legislation as of 1 July 2003 and account for current and deferred tax amounts under the Separate taxpayer within Group approach in accordance with AASB Interpretation 1052, Tax Consolidation Accounting. On adoption of the tax consolidation legislation, the entities in the tax consolidated group entered into a tax sharing agreement which, in the opinion of the directors, limits the joint and several liability of the wholly-owned entities in the case of a default by the head entity, Super Retail Group Limited. The entities have also entered into a tax funding agreement under which the wholly-owned entities fully compensate Super Retail Group Limited for any current tax payable assumed and are compensated by Super Retail Group Limited for any current tax receivable and deferred tax assets relating to unused tax losses or unused tax credits that are transferred to Super Retail Group Limited under the tax consolidation legislation. The funding amounts are determined by reference to the amounts recognised in the wholly-owned entities’ financial statements. The amounts receivable/payable under the tax funding agreement are due upon receipt of the funding advice from the head entity, which is issued as soon as practicable after the end of each financial year. The head entity may also require payment of interim funding amounts to assist with its obligations to pay tax instalments.
S U P E R R E T A I L G R O U P L I M I T E D A N N U A L R E P O R T 2 0 2 0 107
NOTES TO THE CONSOLIDATED FINANCIAL STATEMENTS (continued) For the period ended 27 June 2020
15. Provisions 2020 2019 Current $m $m Employee benefits(a) 103.3 97.8 Onerous contracts(b) 2.6 2.5 Make-good provision(c) 3.0 5.8 Other provisions(d) 2.2 1.2 Total current provisions 111.1 107.3
Non-current Employee benefits(a) 9.6 9.5 Onerous contracts(b) - 1.1 Make-good provision(c) 14.7 9.1 Total non-current provisions 24.3 19.7 (a) Employee benefits Provisions for employee benefits includes accrued annual leave, long service leave and accrued bonuses. It also includes $6.7 million provided as redundancy costs relating to a support office restructure announced to team members just prior to the end of the financial year. In addition the Group has identified that certain salaried team members should have received additional amounts to the amounts paid. A remediation program continues. At 27 June 2020 there is a provision to recognise payments for additional overtime and allowances to current and former team members of an estimated $32.4 million (2019: $44.3 million). (b) Onerous contracts Onerous contracts includes the provision for loss making contracts which represents the present value of the forecast loss. The Group performs a review of key contracts relating to Infinite Retail that are loss making. As at 27 June 2020 $0.8 million is provided for loss making contracts related to Infinite Retail (2019: $0.8 million). Onerous contracts also includes the provision for certain obligations related to some lease arrangements. As at 27 June 2020 $1.8m is provided for these obligations (2019: $2.8 million). (c) Make-good provision Provision is made for costs arising from contractual obligations in lease agreements at the inception of the agreement. A provision has been recognised for the present value of the estimated expenditure required to remove any leasehold improvements. These costs have been capitalised as part of the cost of the leasehold improvements and are amortised over the shorter of the term of the lease or the useful life of the assets. (d) Other provisions The current provision for other items includes the provision for store refunds. (e) Movement in provisions Movements in each class of provision during the period, except for other, are set out below:
2020
Employee benefits
$m Onerous contracts
$m Make-good
$m
Total
$m Opening balance as at 29 June 2019 107.3 3.6 14.9 125.8 Provisions made 81.6 1.8 2.9 86.3 Indexing of provisions - - 3.6 3.6 Provisions transferred to Right of use assets - (1.6) - (1.6) Provisions used (76.0) (1.2) (3.7) (80.9) Closing balance as at 27 June 2020 112.9 2.6 17.7 133.2
107S U P E R R E TA I L G R O U P L I M I T E D A N N U A L R E P O R T 2020106 S U P E R R E T A I L G R O U P L I M I T E D A N N U A L R E P O R T 2 0 2 0
NOTES TO THE CONSOLIDATED FINANCIAL STATEMENTS (continued) For the period ended 27 June 2020
14. Income taxes (continued) (g) Tax transparency report (continued) Other jurisdictions The Group includes subsidiary companies that are incorporated in jurisdictions outside Australia as summarised in the table below:
Country Nature of activities China(1) Co-ordinating the sourcing of trading stock for SCA, rebel and BCF New Zealand Active trading operations (SCA and Macpac) and dormant entities
(1) These companies are subject to the Australian Controlled Foreign Company rules. Under these rules profits generated by these subsidiaries from trading with Super Retail Group are taxable in Australia at the 30 per cent Australian corporate tax rate. For the 2020 year, the gross value of international related party transactions in and out of Australia represented less than 2.0 per cent of revenue. Australian income taxes paid Super Retail Group is a large taxpayer and paid corporate income tax of $42.3 million in 2020 and $46.7 million in 2019.
Significant Accounting Policies
Current and deferred tax The income tax expense or revenue for the period is the tax payable on the current period’s taxable income based on the national income tax rate for each jurisdiction adjusted by changes in deferred tax assets and liabilities attributable to temporary differences between the tax bases of assets and liabilities and their carrying amounts in the financial statements, and to unused tax losses. Deferred tax assets and liabilities Deferred tax assets and liabilities are recognised for temporary differences at the tax rates expected to apply when the assets are recovered or liabilities are settled, based on those tax rates which are enacted or substantively enacted for each jurisdiction. The relevant tax rates are applied to the cumulative amounts of deductible and taxable temporary differences to measure the deferred tax asset or liability. An exception is made for certain temporary differences arising from the initial recognition of an asset or a liability. No deferred tax asset or liability is recognised in relation to these temporary differences if they arise in a transaction, other than a business combination, that at the time of the transaction did not affect either accounting profit or taxable profit or loss. Deferred tax assets are recognised for deductible temporary differences and unused tax losses only if it is probable that future taxable amounts will be available to utilise those temporary differences and losses. Deferred tax liabilities and assets are not recognised for temporary differences between the carrying amount and tax bases of investments in controlled entities where the parent entity is able to control the timing of the reversal of the temporary differences and it is probable that the differences will not reverse in the foreseeable future. Current and deferred tax balances attributable to amounts recognised directly in equity are also recognised directly in equity. Deferred tax assets and liabilities are offset when there is a legally enforceable right to offset current tax assets and liabilities and when the deferred tax balances relate to the same taxation authority. Current tax assets and tax liabilities are offset where the entity has a legally enforceable right to offset and intends either to settle on a net basis, or to realise the asset and settle the liability simultaneously. A deferred tax liability is recognised in relation to some of the Group’s indefinite life intangibles. The tax base assumed in determining the amount of the deferred tax liability is the capital cost base of the assets. Tax consolidation Super Retail Group Limited and its wholly-owned Australian controlled entities have implemented the tax consolidation legislation as of 1 July 2003 and account for current and deferred tax amounts under the Separate taxpayer within Group approach in accordance with AASB Interpretation 1052, Tax Consolidation Accounting. On adoption of the tax consolidation legislation, the entities in the tax consolidated group entered into a tax sharing agreement which, in the opinion of the directors, limits the joint and several liability of the wholly-owned entities in the case of a default by the head entity, Super Retail Group Limited. The entities have also entered into a tax funding agreement under which the wholly-owned entities fully compensate Super Retail Group Limited for any current tax payable assumed and are compensated by Super Retail Group Limited for any current tax receivable and deferred tax assets relating to unused tax losses or unused tax credits that are transferred to Super Retail Group Limited under the tax consolidation legislation. The funding amounts are determined by reference to the amounts recognised in the wholly-owned entities’ financial statements. The amounts receivable/payable under the tax funding agreement are due upon receipt of the funding advice from the head entity, which is issued as soon as practicable after the end of each financial year. The head entity may also require payment of interim funding amounts to assist with its obligations to pay tax instalments.
S U P E R R E T A I L G R O U P L I M I T E D A N N U A L R E P O R T 2 0 2 0 107
NOTES TO THE CONSOLIDATED FINANCIAL STATEMENTS (continued) For the period ended 27 June 2020
15. Provisions 2020 2019 Current $m $m Employee benefits(a) 103.3 97.8 Onerous contracts(b) 2.6 2.5 Make-good provision(c) 3.0 5.8 Other provisions(d) 2.2 1.2 Total current provisions 111.1 107.3
Non-current Employee benefits(a) 9.6 9.5 Onerous contracts(b) - 1.1 Make-good provision(c) 14.7 9.1 Total non-current provisions 24.3 19.7 (a) Employee benefits Provisions for employee benefits includes accrued annual leave, long service leave and accrued bonuses. It also includes $6.7 million provided as redundancy costs relating to a support office restructure announced to team members just prior to the end of the financial year. In addition the Group has identified that certain salaried team members should have received additional amounts to the amounts paid. A remediation program continues. At 27 June 2020 there is a provision to recognise payments for additional overtime and allowances to current and former team members of an estimated $32.4 million (2019: $44.3 million). (b) Onerous contracts Onerous contracts includes the provision for loss making contracts which represents the present value of the forecast loss. The Group performs a review of key contracts relating to Infinite Retail that are loss making. As at 27 June 2020 $0.8 million is provided for loss making contracts related to Infinite Retail (2019: $0.8 million). Onerous contracts also includes the provision for certain obligations related to some lease arrangements. As at 27 June 2020 $1.8m is provided for these obligations (2019: $2.8 million). (c) Make-good provision Provision is made for costs arising from contractual obligations in lease agreements at the inception of the agreement. A provision has been recognised for the present value of the estimated expenditure required to remove any leasehold improvements. These costs have been capitalised as part of the cost of the leasehold improvements and are amortised over the shorter of the term of the lease or the useful life of the assets. (d) Other provisions The current provision for other items includes the provision for store refunds. (e) Movement in provisions Movements in each class of provision during the period, except for other, are set out below:
2020
Employee benefits
$m Onerous contracts
$m Make-good
$m
Total
$m Opening balance as at 29 June 2019 107.3 3.6 14.9 125.8 Provisions made 81.6 1.8 2.9 86.3 Indexing of provisions - - 3.6 3.6 Provisions transferred to Right of use assets - (1.6) - (1.6) Provisions used (76.0) (1.2) (3.7) (80.9) Closing balance as at 27 June 2020 112.9 2.6 17.7 133.2
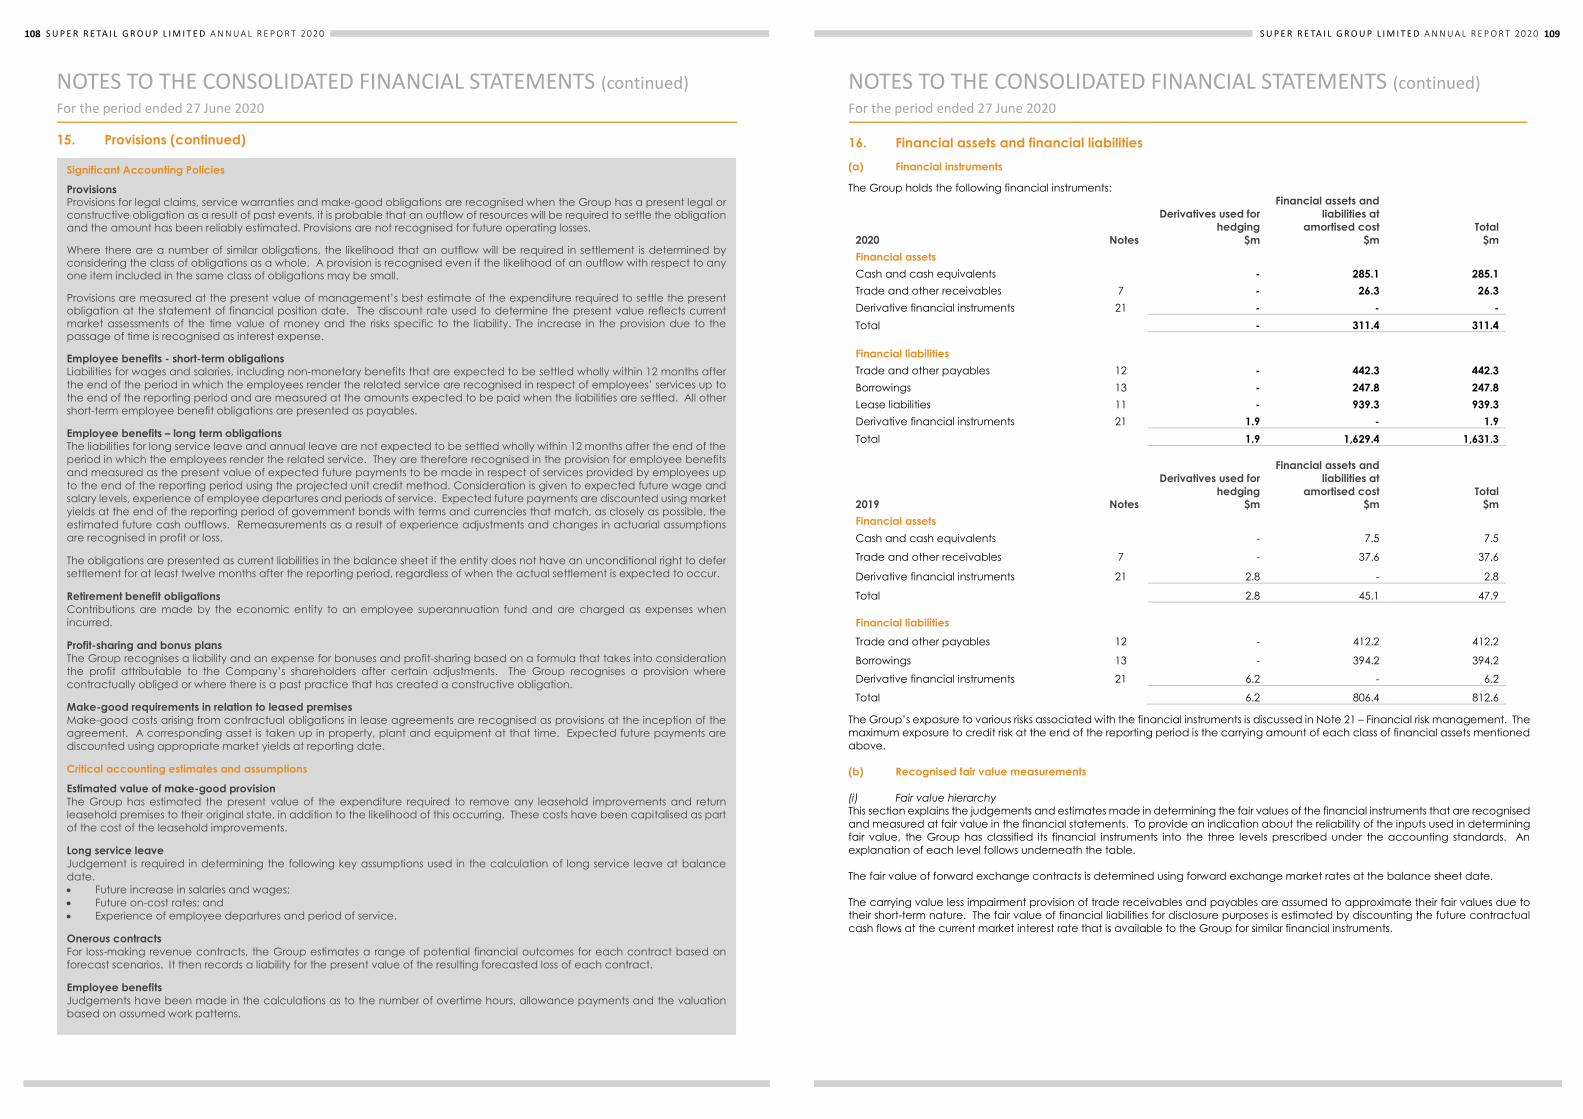
108 S U P E R R E TA I L G R O U P L I M I T E D A N N U A L R E P O R T 2020108 S U P E R R E T A I L G R O U P L I M I T E D A N N U A L R E P O R T 2 0 2 0
NOTES TO THE CONSOLIDATED FINANCIAL STATEMENTS (continued) For the period ended 27 June 2020
15. Provisions (continued)
Significant Accounting Policies
Provisions Provisions for legal claims, service warranties and make-good obligations are recognised when the Group has a present legal or constructive obligation as a result of past events, it is probable that an outflow of resources will be required to settle the obligation and the amount has been reliably estimated. Provisions are not recognised for future operating losses. Where there are a number of similar obligations, the likelihood that an outflow will be required in settlement is determined by considering the class of obligations as a whole. A provision is recognised even if the likelihood of an outflow with respect to any one item included in the same class of obligations may be small. Provisions are measured at the present value of management’s best estimate of the expenditure required to settle the present obligation at the statement of financial position date. The discount rate used to determine the present value reflects current market assessments of the time value of money and the risks specific to the liability. The increase in the provision due to the passage of time is recognised as interest expense. Employee benefits - short-term obligations Liabilities for wages and salaries, including non-monetary benefits that are expected to be settled wholly within 12 months after the end of the period in which the employees render the related service are recognised in respect of employees’ services up to the end of the reporting period and are measured at the amounts expected to be paid when the liabilities are settled. All other short-term employee benefit obligations are presented as payables. Employee benefits – long term obligations The liabilities for long service leave and annual leave are not expected to be settled wholly within 12 months after the end of the period in which the employees render the related service. They are therefore recognised in the provision for employee benefits and measured as the present value of expected future payments to be made in respect of services provided by employees up to the end of the reporting period using the projected unit credit method. Consideration is given to expected future wage and salary levels, experience of employee departures and periods of service. Expected future payments are discounted using market yields at the end of the reporting period of government bonds with terms and currencies that match, as closely as possible, the estimated future cash outflows. Remeasurements as a result of experience adjustments and changes in actuarial assumptions are recognised in profit or loss. The obligations are presented as current liabilities in the balance sheet if the entity does not have an unconditional right to defer settlement for at least twelve months after the reporting period, regardless of when the actual settlement is expected to occur. Retirement benefit obligations Contributions are made by the economic entity to an employee superannuation fund and are charged as expenses when incurred. Profit-sharing and bonus plans The Group recognises a liability and an expense for bonuses and profit-sharing based on a formula that takes into consideration the profit attributable to the Company’s shareholders after certain adjustments. The Group recognises a provision where contractually obliged or where there is a past practice that has created a constructive obligation. Make-good requirements in relation to leased premises Make-good costs arising from contractual obligations in lease agreements are recognised as provisions at the inception of the agreement. A corresponding asset is taken up in property, plant and equipment at that time. Expected future payments are discounted using appropriate market yields at reporting date. Critical accounting estimates and assumptions
Estimated value of make-good provision The Group has estimated the present value of the expenditure required to remove any leasehold improvements and return leasehold premises to their original state, in addition to the likelihood of this occurring. These costs have been capitalised as part of the cost of the leasehold improvements. Long service leave Judgement is required in determining the following key assumptions used in the calculation of long service leave at balance date. Future increase in salaries and wages; Future on-cost rates; and Experience of employee departures and period of service. Onerous contracts For loss-making revenue contracts, the Group estimates a range of potential financial outcomes for each contract based on forecast scenarios. It then records a liability for the present value of the resulting forecasted loss of each contract. Employee benefits Judgements have been made in the calculations as to the number of overtime hours, allowance payments and the valuation based on assumed work patterns.
109S U P E R R E TA I L G R O U P L I M I T E D A N N U A L R E P O R T 2020108 S U P E R R E T A I L G R O U P L I M I T E D A N N U A L R E P O R T 2 0 2 0
NOTES TO THE CONSOLIDATED FINANCIAL STATEMENTS (continued) For the period ended 27 June 2020
15. Provisions (continued)
Significant Accounting Policies
Provisions Provisions for legal claims, service warranties and make-good obligations are recognised when the Group has a present legal or constructive obligation as a result of past events, it is probable that an outflow of resources will be required to settle the obligation and the amount has been reliably estimated. Provisions are not recognised for future operating losses. Where there are a number of similar obligations, the likelihood that an outflow will be required in settlement is determined by considering the class of obligations as a whole. A provision is recognised even if the likelihood of an outflow with respect to any one item included in the same class of obligations may be small. Provisions are measured at the present value of management’s best estimate of the expenditure required to settle the present obligation at the statement of financial position date. The discount rate used to determine the present value reflects current market assessments of the time value of money and the risks specific to the liability. The increase in the provision due to the passage of time is recognised as interest expense. Employee benefits - short-term obligations Liabilities for wages and salaries, including non-monetary benefits that are expected to be settled wholly within 12 months after the end of the period in which the employees render the related service are recognised in respect of employees’ services up to the end of the reporting period and are measured at the amounts expected to be paid when the liabilities are settled. All other short-term employee benefit obligations are presented as payables. Employee benefits – long term obligations The liabilities for long service leave and annual leave are not expected to be settled wholly within 12 months after the end of the period in which the employees render the related service. They are therefore recognised in the provision for employee benefits and measured as the present value of expected future payments to be made in respect of services provided by employees up to the end of the reporting period using the projected unit credit method. Consideration is given to expected future wage and salary levels, experience of employee departures and periods of service. Expected future payments are discounted using market yields at the end of the reporting period of government bonds with terms and currencies that match, as closely as possible, the estimated future cash outflows. Remeasurements as a result of experience adjustments and changes in actuarial assumptions are recognised in profit or loss. The obligations are presented as current liabilities in the balance sheet if the entity does not have an unconditional right to defer settlement for at least twelve months after the reporting period, regardless of when the actual settlement is expected to occur. Retirement benefit obligations Contributions are made by the economic entity to an employee superannuation fund and are charged as expenses when incurred. Profit-sharing and bonus plans The Group recognises a liability and an expense for bonuses and profit-sharing based on a formula that takes into consideration the profit attributable to the Company’s shareholders after certain adjustments. The Group recognises a provision where contractually obliged or where there is a past practice that has created a constructive obligation. Make-good requirements in relation to leased premises Make-good costs arising from contractual obligations in lease agreements are recognised as provisions at the inception of the agreement. A corresponding asset is taken up in property, plant and equipment at that time. Expected future payments are discounted using appropriate market yields at reporting date. Critical accounting estimates and assumptions
Estimated value of make-good provision The Group has estimated the present value of the expenditure required to remove any leasehold improvements and return leasehold premises to their original state, in addition to the likelihood of this occurring. These costs have been capitalised as part of the cost of the leasehold improvements. Long service leave Judgement is required in determining the following key assumptions used in the calculation of long service leave at balance date. Future increase in salaries and wages; Future on-cost rates; and Experience of employee departures and period of service. Onerous contracts For loss-making revenue contracts, the Group estimates a range of potential financial outcomes for each contract based on forecast scenarios. It then records a liability for the present value of the resulting forecasted loss of each contract. Employee benefits Judgements have been made in the calculations as to the number of overtime hours, allowance payments and the valuation based on assumed work patterns.
S U P E R R E T A I L G R O U P L I M I T E D A N N U A L R E P O R T 2 0 2 0 109
NOTES TO THE CONSOLIDATED FINANCIAL STATEMENTS (continued) For the period ended 27 June 2020
16. Financial assets and financial liabilities (a) Financial instruments
The Group holds the following financial instruments:
2020
Notes
Derivatives used for hedging
$m
Financial assets and liabilities at
amortised cost $m
Total $m
Financial assets Cash and cash equivalents - 285.1 285.1 Trade and other receivables 7 - 26.3 26.3 Derivative financial instruments 21 - - - Total - 311.4 311.4 Financial liabilities Trade and other payables 12 - 442.3 442.3 Borrowings 13 - 247.8 247.8 Lease liabilities 11 - 939.3 939.3 Derivative financial instruments 21 1.9 - 1.9 Total 1.9 1,629.4 1,631.3
2019 Notes
Derivatives used for hedging
$m
Financial assets and liabilities at
amortised cost $m
Total $m
Financial assets Cash and cash equivalents - 7.5 7.5
Trade and other receivables 7 - 37.6 37.6
Derivative financial instruments 21 2.8 - 2.8
Total 2.8 45.1 47.9 Financial liabilities
Trade and other payables 12 - 412.2 412.2
Borrowings 13 - 394.2 394.2
Derivative financial instruments 21 6.2 - 6.2
Total 6.2 806.4 812.6
The Group’s exposure to various risks associated with the financial instruments is discussed in Note 21 – Financial risk management. The maximum exposure to credit risk at the end of the reporting period is the carrying amount of each class of financial assets mentioned above. (b) Recognised fair value measurements (i) Fair value hierarchy This section explains the judgements and estimates made in determining the fair values of the financial instruments that are recognised and measured at fair value in the financial statements. To provide an indication about the reliability of the inputs used in determining fair value, the Group has classified its financial instruments into the three levels prescribed under the accounting standards. An explanation of each level follows underneath the table. The fair value of forward exchange contracts is determined using forward exchange market rates at the balance sheet date. The carrying value less impairment provision of trade receivables and payables are assumed to approximate their fair values due to their short-term nature. The fair value of financial liabilities for disclosure purposes is estimated by discounting the future contractual cash flows at the current market interest rate that is available to the Group for similar financial instruments.
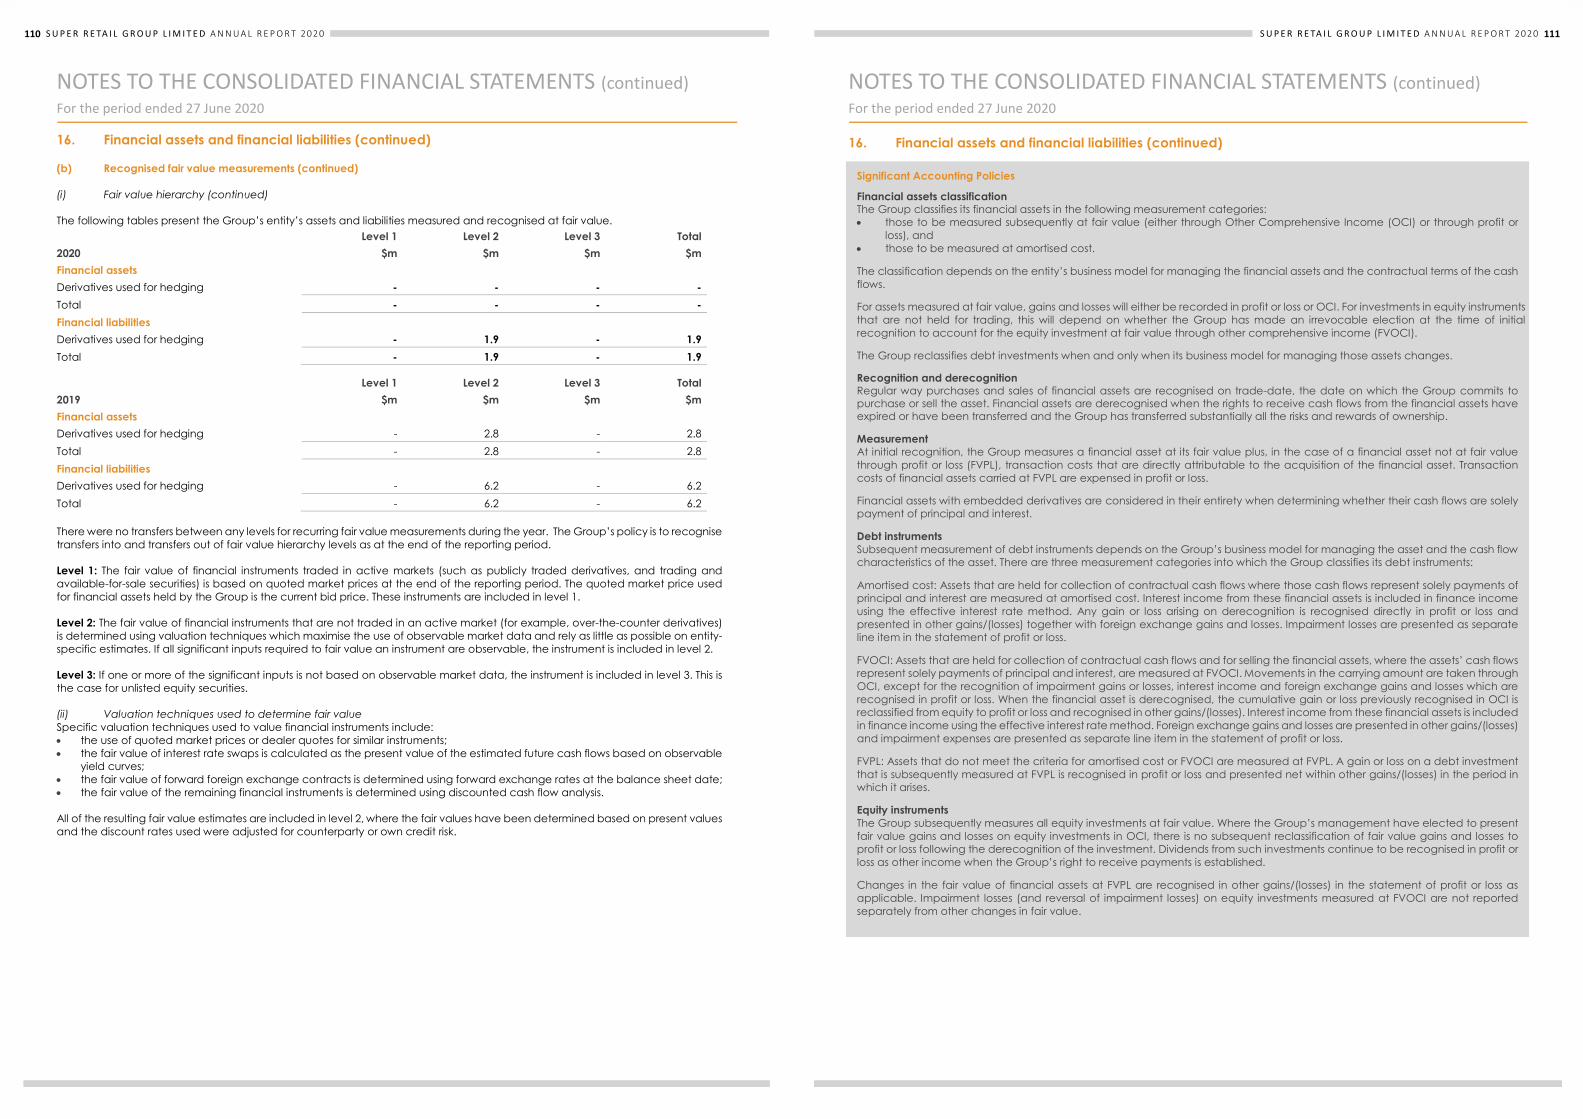
110 S U P E R R E TA I L G R O U P L I M I T E D A N N U A L R E P O R T 2020110 S U P E R R E T A I L G R O U P L I M I T E D A N N U A L R E P O R T 2 0 2 0
NOTES TO THE CONSOLIDATED FINANCIAL STATEMENTS (continued) For the period ended 27 June 2020
16. Financial assets and financial liabilities (continued) (b) Recognised fair value measurements (continued) (i) Fair value hierarchy (continued) The following tables present the Group’s entity’s assets and liabilities measured and recognised at fair value. Level 1 Level 2 Level 3 Total 2020 $m $m $m $m Financial assets Derivatives used for hedging - - - - Total - - - - Financial liabilities Derivatives used for hedging - 1.9 - 1.9 Total - 1.9 - 1.9
Level 1 Level 2 Level 3 Total 2019 $m $m $m $m Financial assets Derivatives used for hedging - 2.8 - 2.8 Total - 2.8 - 2.8 Financial liabilities Derivatives used for hedging - 6.2 - 6.2 Total - 6.2 - 6.2 There were no transfers between any levels for recurring fair value measurements during the year. The Group’s policy is to recognise transfers into and transfers out of fair value hierarchy levels as at the end of the reporting period. Level 1: The fair value of financial instruments traded in active markets (such as publicly traded derivatives, and trading and available-for-sale securities) is based on quoted market prices at the end of the reporting period. The quoted market price used for financial assets held by the Group is the current bid price. These instruments are included in level 1. Level 2: The fair value of financial instruments that are not traded in an active market (for example, over-the-counter derivatives) is determined using valuation techniques which maximise the use of observable market data and rely as little as possible on entity-specific estimates. If all significant inputs required to fair value an instrument are observable, the instrument is included in level 2. Level 3: If one or more of the significant inputs is not based on observable market data, the instrument is included in level 3. This is the case for unlisted equity securities. (ii) Valuation techniques used to determine fair value Specific valuation techniques used to value financial instruments include: the use of quoted market prices or dealer quotes for similar instruments; the fair value of interest rate swaps is calculated as the present value of the estimated future cash flows based on observable
yield curves; the fair value of forward foreign exchange contracts is determined using forward exchange rates at the balance sheet date; the fair value of the remaining financial instruments is determined using discounted cash flow analysis. All of the resulting fair value estimates are included in level 2, where the fair values have been determined based on present values and the discount rates used were adjusted for counterparty or own credit risk.
111S U P E R R E TA I L G R O U P L I M I T E D A N N U A L R E P O R T 2020110 S U P E R R E T A I L G R O U P L I M I T E D A N N U A L R E P O R T 2 0 2 0
NOTES TO THE CONSOLIDATED FINANCIAL STATEMENTS (continued) For the period ended 27 June 2020
16. Financial assets and financial liabilities (continued) (b) Recognised fair value measurements (continued) (i) Fair value hierarchy (continued) The following tables present the Group’s entity’s assets and liabilities measured and recognised at fair value. Level 1 Level 2 Level 3 Total 2020 $m $m $m $m Financial assets Derivatives used for hedging - - - - Total - - - - Financial liabilities Derivatives used for hedging - 1.9 - 1.9 Total - 1.9 - 1.9
Level 1 Level 2 Level 3 Total 2019 $m $m $m $m Financial assets Derivatives used for hedging - 2.8 - 2.8 Total - 2.8 - 2.8 Financial liabilities Derivatives used for hedging - 6.2 - 6.2 Total - 6.2 - 6.2 There were no transfers between any levels for recurring fair value measurements during the year. The Group’s policy is to recognise transfers into and transfers out of fair value hierarchy levels as at the end of the reporting period. Level 1: The fair value of financial instruments traded in active markets (such as publicly traded derivatives, and trading and available-for-sale securities) is based on quoted market prices at the end of the reporting period. The quoted market price used for financial assets held by the Group is the current bid price. These instruments are included in level 1. Level 2: The fair value of financial instruments that are not traded in an active market (for example, over-the-counter derivatives) is determined using valuation techniques which maximise the use of observable market data and rely as little as possible on entity-specific estimates. If all significant inputs required to fair value an instrument are observable, the instrument is included in level 2. Level 3: If one or more of the significant inputs is not based on observable market data, the instrument is included in level 3. This is the case for unlisted equity securities. (ii) Valuation techniques used to determine fair value Specific valuation techniques used to value financial instruments include: the use of quoted market prices or dealer quotes for similar instruments; the fair value of interest rate swaps is calculated as the present value of the estimated future cash flows based on observable
yield curves; the fair value of forward foreign exchange contracts is determined using forward exchange rates at the balance sheet date; the fair value of the remaining financial instruments is determined using discounted cash flow analysis. All of the resulting fair value estimates are included in level 2, where the fair values have been determined based on present values and the discount rates used were adjusted for counterparty or own credit risk.
S U P E R R E T A I L G R O U P L I M I T E D A N N U A L R E P O R T 2 0 2 0 111
NOTES TO THE CONSOLIDATED FINANCIAL STATEMENTS (continued) For the period ended 27 June 2020
16. Financial assets and financial liabilities (continued)
Significant Accounting Policies
Financial assets classification The Group classifies its financial assets in the following measurement categories: those to be measured subsequently at fair value (either through Other Comprehensive Income (OCI) or through profit or
loss), and those to be measured at amortised cost. The classification depends on the entity’s business model for managing the financial assets and the contractual terms of the cash flows. For assets measured at fair value, gains and losses will either be recorded in profit or loss or OCI. For investments in equity instruments that are not held for trading, this will depend on whether the Group has made an irrevocable election at the time of initial recognition to account for the equity investment at fair value through other comprehensive income (FVOCI). The Group reclassifies debt investments when and only when its business model for managing those assets changes. Recognition and derecognition Regular way purchases and sales of financial assets are recognised on trade-date, the date on which the Group commits to purchase or sell the asset. Financial assets are derecognised when the rights to receive cash flows from the financial assets have expired or have been transferred and the Group has transferred substantially all the risks and rewards of ownership. Measurement At initial recognition, the Group measures a financial asset at its fair value plus, in the case of a financial asset not at fair value through profit or loss (FVPL), transaction costs that are directly attributable to the acquisition of the financial asset. Transaction costs of financial assets carried at FVPL are expensed in profit or loss. Financial assets with embedded derivatives are considered in their entirety when determining whether their cash flows are solely payment of principal and interest. Debt instruments Subsequent measurement of debt instruments depends on the Group’s business model for managing the asset and the cash flow characteristics of the asset. There are three measurement categories into which the Group classifies its debt instruments: Amortised cost: Assets that are held for collection of contractual cash flows where those cash flows represent solely payments of principal and interest are measured at amortised cost. Interest income from these financial assets is included in finance income using the effective interest rate method. Any gain or loss arising on derecognition is recognised directly in profit or loss and presented in other gains/(losses) together with foreign exchange gains and losses. Impairment losses are presented as separate line item in the statement of profit or loss. FVOCI: Assets that are held for collection of contractual cash flows and for selling the financial assets, where the assets’ cash flows represent solely payments of principal and interest, are measured at FVOCI. Movements in the carrying amount are taken through OCI, except for the recognition of impairment gains or losses, interest income and foreign exchange gains and losses which are recognised in profit or loss. When the financial asset is derecognised, the cumulative gain or loss previously recognised in OCI is reclassified from equity to profit or loss and recognised in other gains/(losses). Interest income from these financial assets is included in finance income using the effective interest rate method. Foreign exchange gains and losses are presented in other gains/(losses) and impairment expenses are presented as separate line item in the statement of profit or loss. FVPL: Assets that do not meet the criteria for amortised cost or FVOCI are measured at FVPL. A gain or loss on a debt investment that is subsequently measured at FVPL is recognised in profit or loss and presented net within other gains/(losses) in the period in which it arises. Equity instruments The Group subsequently measures all equity investments at fair value. Where the Group’s management have elected to present fair value gains and losses on equity investments in OCI, there is no subsequent reclassification of fair value gains and losses to profit or loss following the derecognition of the investment. Dividends from such investments continue to be recognised in profit or loss as other income when the Group’s right to receive payments is established. Changes in the fair value of financial assets at FVPL are recognised in other gains/(losses) in the statement of profit or loss as applicable. Impairment losses (and reversal of impairment losses) on equity investments measured at FVOCI are not reported separately from other changes in fair value.
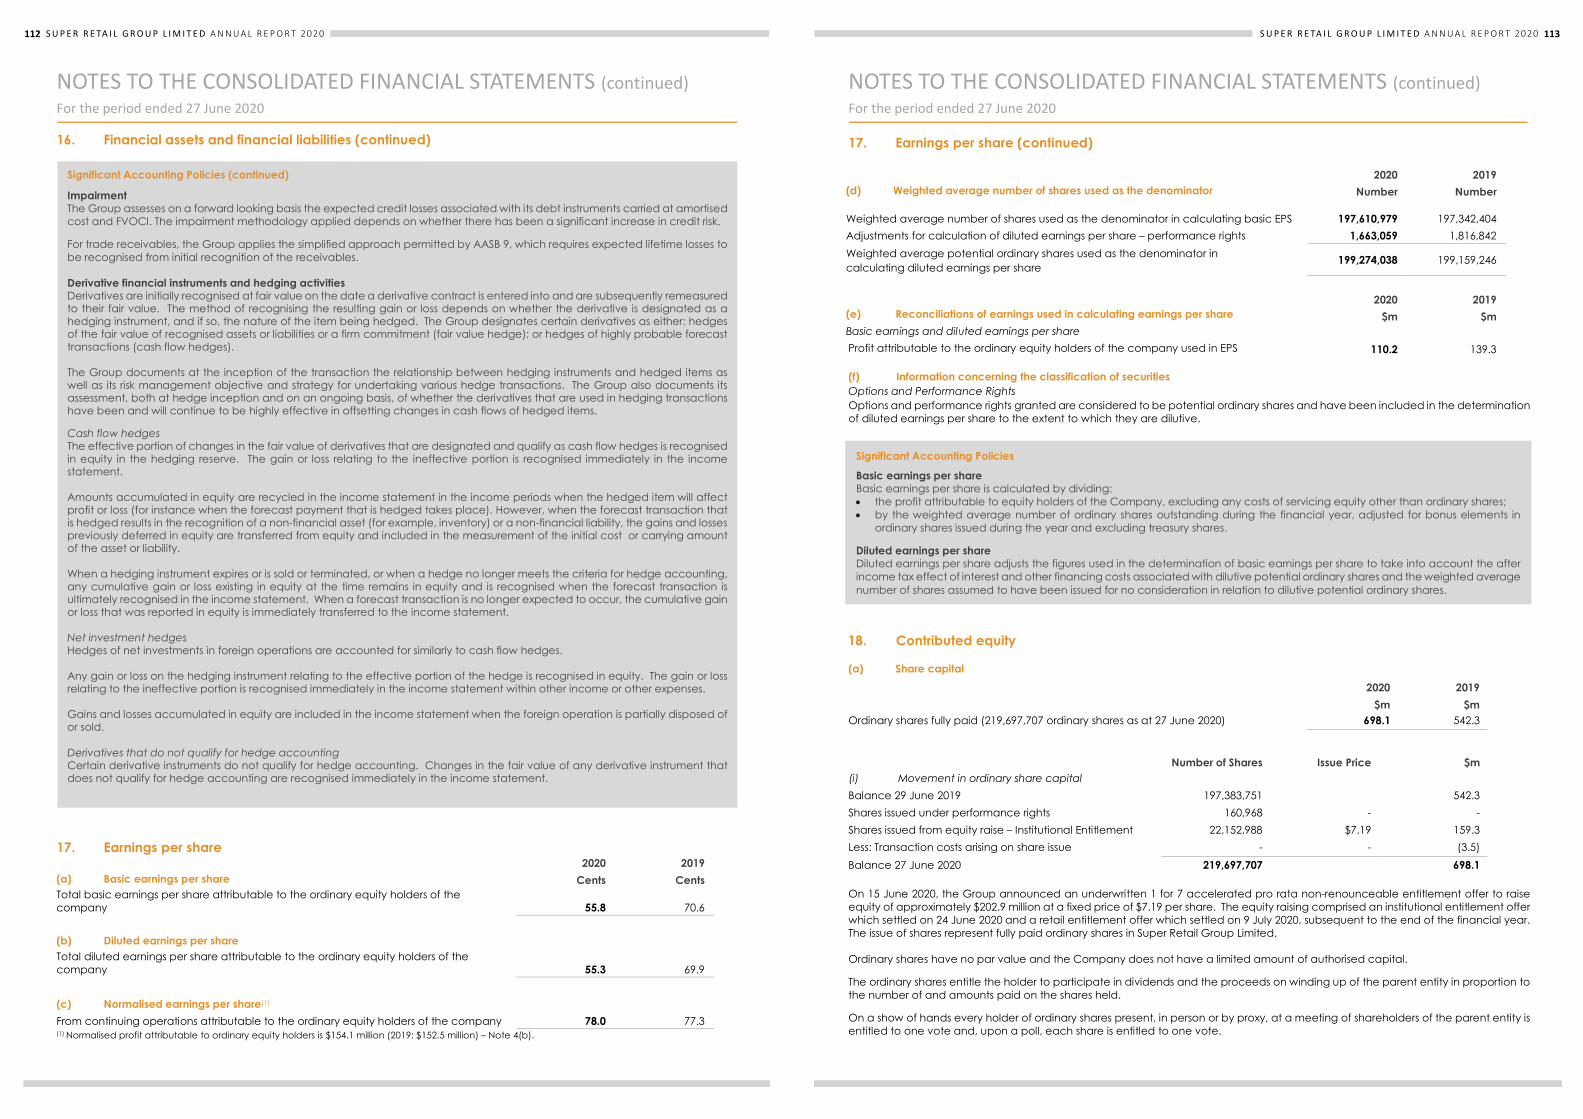
112 S U P E R R E TA I L G R O U P L I M I T E D A N N U A L R E P O R T 2020112 S U P E R R E T A I L G R O U P L I M I T E D A N N U A L R E P O R T 2 0 2 0
NOTES TO THE CONSOLIDATED FINANCIAL STATEMENTS (continued) For the period ended 27 June 2020
16. Financial assets and financial liabilities (continued) 17. Earnings per share
2020 2019 (a) Basic earnings per share Cents Cents Total basic earnings per share attributable to the ordinary equity holders of the company 55.8 70.6
(b) Diluted earnings per share Total diluted earnings per share attributable to the ordinary equity holders of the company 55.3 69.9 (c) Normalised earnings per share(1) From continuing operations attributable to the ordinary equity holders of the company 78.0 77.3 (1) Normalised profit attributable to ordinary equity holders is $154.1 million (2019: $152.5 million) – Note 4(b).
Significant Accounting Policies (continued)
Impairment The Group assesses on a forward looking basis the expected credit losses associated with its debt instruments carried at amortised cost and FVOCI. The impairment methodology applied depends on whether there has been a significant increase in credit risk. For trade receivables, the Group applies the simplified approach permitted by AASB 9, which requires expected lifetime losses to be recognised from initial recognition of the receivables. Derivative financial instruments and hedging activities Derivatives are initially recognised at fair value on the date a derivative contract is entered into and are subsequently remeasured to their fair value. The method of recognising the resulting gain or loss depends on whether the derivative is designated as a hedging instrument, and if so, the nature of the item being hedged. The Group designates certain derivatives as either: hedges of the fair value of recognised assets or liabilities or a firm commitment (fair value hedge); or hedges of highly probable forecast transactions (cash flow hedges). The Group documents at the inception of the transaction the relationship between hedging instruments and hedged items as well as its risk management objective and strategy for undertaking various hedge transactions. The Group also documents its assessment, both at hedge inception and on an ongoing basis, of whether the derivatives that are used in hedging transactions have been and will continue to be highly effective in offsetting changes in cash flows of hedged items. Cash flow hedges The effective portion of changes in the fair value of derivatives that are designated and qualify as cash flow hedges is recognised in equity in the hedging reserve. The gain or loss relating to the ineffective portion is recognised immediately in the income statement. Amounts accumulated in equity are recycled in the income statement in the income periods when the hedged item will affect profit or loss (for instance when the forecast payment that is hedged takes place). However, when the forecast transaction that is hedged results in the recognition of a non-financial asset (for example, inventory) or a non-financial liability, the gains and losses previously deferred in equity are transferred from equity and included in the measurement of the initial cost or carrying amount of the asset or liability. When a hedging instrument expires or is sold or terminated, or when a hedge no longer meets the criteria for hedge accounting, any cumulative gain or loss existing in equity at the time remains in equity and is recognised when the forecast transaction is ultimately recognised in the income statement. When a forecast transaction is no longer expected to occur, the cumulative gain or loss that was reported in equity is immediately transferred to the income statement. Net investment hedges Hedges of net investments in foreign operations are accounted for similarly to cash flow hedges. Any gain or loss on the hedging instrument relating to the effective portion of the hedge is recognised in equity. The gain or loss relating to the ineffective portion is recognised immediately in the income statement within other income or other expenses. Gains and losses accumulated in equity are included in the income statement when the foreign operation is partially disposed of or sold. Derivatives that do not qualify for hedge accounting Certain derivative instruments do not qualify for hedge accounting. Changes in the fair value of any derivative instrument that does not qualify for hedge accounting are recognised immediately in the income statement.
113S U P E R R E TA I L G R O U P L I M I T E D A N N U A L R E P O R T 2020S U P E R R E T A I L G R O U P L I M I T E D A N N U A L R E P O R T 2 0 2 0 113
NOTES TO THE CONSOLIDATED FINANCIAL STATEMENTS (continued) For the period ended 27 June 2020
17. Earnings per share (continued)
2020 2019 (d) Weighted average number of shares used as the denominator Number Number
Weighted average number of shares used as the denominator in calculating basic EPS 197,610,979 197,342,404 Adjustments for calculation of diluted earnings per share – performance rights 1,663,059 1,816,842 Weighted average potential ordinary shares used as the denominator in calculating diluted earnings per share
199,274,038 199,159,246
2020 2019
(e) Reconciliations of earnings used in calculating earnings per share $m $m Basic earnings and diluted earnings per share Profit attributable to the ordinary equity holders of the company used in EPS calculating basic earnings per share:
110.2 139.3 (f) Information concerning the classification of securities Options and Performance Rights Options and performance rights granted are considered to be potential ordinary shares and have been included in the determination of diluted earnings per share to the extent to which they are dilutive.
18. Contributed equity
(a) Share capital 2020 2019 $m $m Ordinary shares fully paid (219,697,707 ordinary shares as at 27 June 2020) 698.1 542.3
Number of Shares
Issue Price
$m
(i) Movement in ordinary share capital Balance 29 June 2019 197,383,751 542.3 Shares issued under performance rights 160,968 - - Shares issued from equity raise – Institutional Entitlement 22,152,988 $7.19 159.3 Less: Transaction costs arising on share issue - - (3.5) Balance 27 June 2020 219,697,707 698.1 On 15 June 2020, the Group announced an underwritten 1 for 7 accelerated pro rata non-renounceable entitlement offer to raise equity of approximately $202.9 million at a fixed price of $7.19 per share. The equity raising comprised an institutional entitlement offer which settled on 24 June 2020 and a retail entitlement offer which settled on 9 July 2020, subsequent to the end of the financial year. The issue of shares represent fully paid ordinary shares in Super Retail Group Limited. Ordinary shares have no par value and the Company does not have a limited amount of authorised capital. The ordinary shares entitle the holder to participate in dividends and the proceeds on winding up of the parent entity in proportion to the number of and amounts paid on the shares held. On a show of hands every holder of ordinary shares present, in person or by proxy, at a meeting of shareholders of the parent entity is entitled to one vote and, upon a poll, each share is entitled to one vote.
Significant Accounting Policies
Basic earnings per share Basic earnings per share is calculated by dividing: the profit attributable to equity holders of the Company, excluding any costs of servicing equity other than ordinary shares; by the weighted average number of ordinary shares outstanding during the financial year, adjusted for bonus elements in
ordinary shares issued during the year and excluding treasury shares. Diluted earnings per share Diluted earnings per share adjusts the figures used in the determination of basic earnings per share to take into account the after income tax effect of interest and other financing costs associated with dilutive potential ordinary shares and the weighted average number of shares assumed to have been issued for no consideration in relation to dilutive potential ordinary shares.

114 S U P E R R E TA I L G R O U P L I M I T E D A N N U A L R E P O R T 2020114 S U P E R R E T A I L G R O U P L I M I T E D A N N U A L R E P O R T 2 0 2 0
NOTES TO THE CONSOLIDATED FINANCIAL STATEMENTS (continued) For the period ended 27 June 2020
18. Contributed equity (continued) (a) Share capital (continued) Performance rights over 727,470 (2019: 622,684) ordinary shares were issued during the period with 160,968 (2019: 143,731) performance rights vesting during the period. Under the share option plan, no ordinary shares were issued during the period (2019: nil). Information relating to performance rights and options outstanding at the end of the financial year are set out in Note 29 – Share-based payments. Dividend reinvestment plan The Company has established a dividend reinvestment plan under which holders of ordinary shares may elect to have all or part of their dividend entitlements satisfied by shares purchased on market rather than by being paid in cash.
19. Reserves and retained earnings
2020 2019 $m $m (a) Reserves Foreign currency translation reserve 3.7 5.2 Share based payments reserve 13.1 12.9 Hedging reserve (1.3) (2.3) NCI equity reserve (8.0) (7.6) Total 7.5 8.2
(i) Movements Foreign currency translation reserve Balance at the beginning of the financial period 5.2 2.5 Net exchange difference on translation of foreign controlled entities (1.5) 2.7 Balance at the end of the financial period 3.7 5.2
Share-based payments reserve Balance at the beginning of the financial period 12.9 11.6 Options and performance rights expense 0.2 1.3 Balance at the end of the financial period 13.1 12.9
Hedging reserve Balance at the beginning of the financial period (2.3) 4.0 Revaluation – gross 1.4 (9.0) Deferred tax (0.4) 2.7 Balance at the end of the financial period (1.3) (2.3) NCI equity reserve Balance at the beginning of the financial period (7.6) (7.8) Change in ownership interest in controlled entities (0.4) 0.2 Balance at the end of the financial period (8.0) (7.6)
Significant Accounting Policies
Contributed equity Ordinary shares are classified as equity. Incremental costs directly attributable to the issue of new shares or options are shown in equity as a deduction, net of tax, from the proceeds. Incremental costs directly attributable to the issue of new shares or options, or for the acquisition of a business, are included in the cost of the acquisition as part of the purchase consideration.
115S U P E R R E TA I L G R O U P L I M I T E D A N N U A L R E P O R T 2020S U P E R R E T A I L G R O U P L I M I T E D A N N U A L R E P O R T 2 0 2 0 115
NOTES TO THE CONSOLIDATED FINANCIAL STATEMENTS (continued) For the period ended 27 June 2020
19. Reserves and retained earnings (continued) (a) Reserves (continued) (ii) Nature and purpose of reserves Hedging reserve - cash flow hedges The hedging reserve is used to record gains or losses on a hedging instrument in a cash flow hedge that are recognised directly in equity, as described in Note 16 – Financial assets and financial liabilities. Amounts are recognised in profit and loss when the associated hedged transaction affects profit and loss. Share-based payments reserve The share-based payments reserve is used to recognise the grant date fair value of options and performance rights issued. Foreign currency translation reserve Exchange differences arising on translation of the foreign controlled entity are taken to the foreign currency translation reserve, as described in Note 2(c). The reserve is recognised in profit and loss when the net investment is disposed of. NCI equity reserve The NCI equity reserve is used to recognise the change in ownership interest in controlled entities. (b) Retained earnings 2020 2019 $m $m Balance at the beginning of the financial period 265.9 223.3 Change in accounting policy – AASB 16 Leases (34.2) - Restated balance at the beginning of the financial period 231.7 223.3 Net profit for the period attributable to owners of Super Retail Group Limited 110.2 139.3 Dividends paid (56.2) (96.7) Retained profits at the end of the financial period 285.7 265.9 20. Reconciliation of profit from ordinary activities after income tax to net cash inflow from operating
activities 2020
$m 2019
$m Profit from ordinary activities after related income tax 110.2 139.3 Depreciation and amortisation 282.2 86.6 Net (gain) / loss on sale of non-current assets (0.6) 0.2 Non-cash employee benefits expense/share based payments 0.2 1.3 Loss on divestment - 1.1 Equity accounting loss 0.6 2.6 Profit for the period attributable to non-controlling interests - (0.1) Net finance costs 55.1 21.3 Change in operating assets and liabilities, net of effects from the purchase of controlled entities - decrease / (increase) in receivables 10.6 (13.8) - decrease / (increase) in net current tax liability 19.0 (11.5) - decrease / (increase) in inventories 57.8 (14.7) - increase in payables 84.1 25.3 - increase / (decrease) in provisions 5.9 (4.1) - (decrease) / increase in deferred taxes (14.4) 7.4 Net cash inflow from operating activities 610.7 240.9
Significant Accounting Policies
Cash and cash equivalents For the purposes of the cash flow statement, cash includes cash on hand, cash at bank and at call deposits with banks or financial institutions, other short term, highly liquid investments with original maturities of three months or less that are readily convertible to known amounts of cash and which are subject to an insignificant risk of changes in value, and bank overdrafts.

116 S U P E R R E TA I L G R O U P L I M I T E D A N N U A L R E P O R T 2020116 S U P E R R E T A I L G R O U P L I M I T E D A N N U A L R E P O R T 2 0 2 0
NOTES TO THE CONSOLIDATED FINANCIAL STATEMENTS (continued) For the period ended 27 June 2020
21. Financial risk management This note explains the Group’s exposure to financial risks and how these risks could affect the Group’s future financial performance. Current year profit and loss information has been included where relevant to add further context.
Market risk Credit risk Liquidity risk
Foreign exchange Interest rate
Exposure arising from
Future commercial transactions Recognised financial assets and liabilities not denominated in AUD
Long-term borrowings at variable rates
Cash and cash equivalents, trade and other receivables and derivative financial instruments
Borrowings and other liabilities
Measurement Cash flow forecasting Sensitivity analysis Sensitivity analysis Aging analysis
Credit ratings
Credit limits and retention of title over goods sold
Management Forward foreign exchange contracts and options
Interest rate swaps Rolling cash flow forecasts
Availability of committed credit lines and borrowing facilities
The Group’s risk management is carried out by the finance department under policies approved by the Board. The finance department identifies, evaluates and hedges financial risks in close co-operation with the Group’s operating units. The Board provides a formal policy for overall risk management, as well as policies covering specific areas, such as foreign exchange risk, interest rate risk, credit risk, use of derivative financial instruments and non-derivative financial instruments, and investment of excess liquidity. (a) Derivative Financial Instruments Derivative Financial Instruments are used only for economic hedging purposes and not as trading or speculative instruments. The Group has the following derivative financial instruments: 2020 2019 $m $m Current assets Forward foreign exchange contracts – cash flow hedges - 2.8 Total current derivative financial instrument assets - 2.8 Current liabilities Forward foreign exchange contracts – cash flow hedges 1.9 - Interest rate swap contracts – cash flow hedges - 6.2 Total current derivative financial instrument liabilities 1.9 6.2 (i) Classification of derivatives Derivatives are classified as held for trading and accounted for at fair value through profit or loss unless they are designated as hedges. They are presented as current assets or liabilities if they are expected to be settled within 12 months after the end of the reporting period. The Group’s accounting policy for its cash flow hedges is set out in Note 16 – Financial assets and financial liabilities. For hedged forecast transactions that result in the recognition of a non-financial asset, the Group has elected to include related hedging gains and losses in the initial measurement of the cost of the asset. (ii) Fair value measurement For information about the methods and assumptions used in determining the fair value of derivatives please refer to Note 16 – Financial assets and financial liabilities. (b) Market risk (i) Foreign exchange risk Group companies are required to hedge their foreign exchange risk exposure using forward contracts transacted by the finance department.
117S U P E R R E TA I L G R O U P L I M I T E D A N N U A L R E P O R T 2020116 S U P E R R E T A I L G R O U P L I M I T E D A N N U A L R E P O R T 2 0 2 0
NOTES TO THE CONSOLIDATED FINANCIAL STATEMENTS (continued) For the period ended 27 June 2020
21. Financial risk management This note explains the Group’s exposure to financial risks and how these risks could affect the Group’s future financial performance. Current year profit and loss information has been included where relevant to add further context.
Market risk Credit risk Liquidity risk
Foreign exchange Interest rate
Exposure arising from
Future commercial transactions Recognised financial assets and liabilities not denominated in AUD
Long-term borrowings at variable rates
Cash and cash equivalents, trade and other receivables and derivative financial instruments
Borrowings and other liabilities
Measurement Cash flow forecasting Sensitivity analysis Sensitivity analysis Aging analysis
Credit ratings
Credit limits and retention of title over goods sold
Management Forward foreign exchange contracts and options
Interest rate swaps Rolling cash flow forecasts
Availability of committed credit lines and borrowing facilities
The Group’s risk management is carried out by the finance department under policies approved by the Board. The finance department identifies, evaluates and hedges financial risks in close co-operation with the Group’s operating units. The Board provides a formal policy for overall risk management, as well as policies covering specific areas, such as foreign exchange risk, interest rate risk, credit risk, use of derivative financial instruments and non-derivative financial instruments, and investment of excess liquidity. (a) Derivative Financial Instruments Derivative Financial Instruments are used only for economic hedging purposes and not as trading or speculative instruments. The Group has the following derivative financial instruments: 2020 2019 $m $m Current assets Forward foreign exchange contracts – cash flow hedges - 2.8 Total current derivative financial instrument assets - 2.8 Current liabilities Forward foreign exchange contracts – cash flow hedges 1.9 - Interest rate swap contracts – cash flow hedges - 6.2 Total current derivative financial instrument liabilities 1.9 6.2 (i) Classification of derivatives Derivatives are classified as held for trading and accounted for at fair value through profit or loss unless they are designated as hedges. They are presented as current assets or liabilities if they are expected to be settled within 12 months after the end of the reporting period. The Group’s accounting policy for its cash flow hedges is set out in Note 16 – Financial assets and financial liabilities. For hedged forecast transactions that result in the recognition of a non-financial asset, the Group has elected to include related hedging gains and losses in the initial measurement of the cost of the asset. (ii) Fair value measurement For information about the methods and assumptions used in determining the fair value of derivatives please refer to Note 16 – Financial assets and financial liabilities. (b) Market risk (i) Foreign exchange risk Group companies are required to hedge their foreign exchange risk exposure using forward contracts transacted by the finance department.
S U P E R R E T A I L G R O U P L I M I T E D A N N U A L R E P O R T 2 0 2 0 117
NOTES TO THE CONSOLIDATED FINANCIAL STATEMENTS (continued) For the period ended 27 June 2020
21. Financial risk management (continued) (b) Market risk (continued) (i) Foreign exchange risk (continued) The Group operates internationally and is exposed to foreign exchange risk arising from currency exposures to the United States dollar (USD) and Chinese Yuan (CNY). Foreign exchange risk arises when future commercial transactions and recognised assets and liabilities are denominated in a currency that is not the entity’s functional currency. The Group’s risk management policy is to hedge between 50 per cent and 75 per cent of anticipated foreign currency purchases for the subsequent 4 months and up to 50 per cent of anticipated foreign currency purchases for the following 5 to 12 month period. Instruments used by the Group The economic entity retails products including some that have been imported from Asia, with contract pricing denominated in USD. In order to protect against exchange rate movements, the economic entity has entered into forward exchange rate contracts to purchase USD. The contracts are timed to mature in line with forecast payments for imports and cover forecast purchases for the subsequent twelve months, on a rolling basis. The Group does not currently enter into forward exchange rate contracts to purchase CNY. Exposure The Group’s exposure to foreign currency risk at the end of the reporting period was as follows:
The portion of the gain or loss on the hedging instrument that is determined to be an effective hedge is recognised directly in equity. When the cash flows occur, the Group adjusts the initial measurement of the component recognised in the consolidated balance sheet by the related amount deferred in equity. In the year ended 27 June 2020, no hedges were designated as ineffective (2019: nil). Gains and losses arising from hedging contracts terminated prior to maturity are also carried forward until the designated hedged transaction occurs. The following gains, losses and costs have been deferred as at the balance date:
2020 2019 USD USD $m $m Trade receivables 3.5 1.8 Trade payables 30.2 27.8 Forward exchange contract - foreign currency (cash flow hedges) Buy United States dollars and sell Australian/New Zealand dollars with maturity - 0 to 4 months 55.3 46.0 - 5 to 12 months 30.7 48.0 86.0 94.0 2020 2019 CNY CNY $m $m Trade receivables 0.2 0.2 Trade payables 23.8 29.7
2020 2019 $m $m - unrealised (losses) / gains on USD foreign exchange contracts (1.9) 2.8 - unrealised (losses) on interest rate swaps - (6.2) Total unrealised (losses) (1.9) (3.4)

118 S U P E R R E TA I L G R O U P L I M I T E D A N N U A L R E P O R T 2020118 S U P E R R E T A I L G R O U P L I M I T E D A N N U A L R E P O R T 2 0 2 0
NOTES TO THE CONSOLIDATED FINANCIAL STATEMENTS (continued) For the period ended 27 June 2020
21. Financial risk management (continued) (b) Market risk (continued) (i) Foreign exchange risk (continued) Group sensitivity Based on the financial instruments held at 27 June 2020, had the Australian dollar weakened/strengthened by 10 per cent against other currencies with all other variables held constant, the impact on the Group’s post-tax profit would have been nil, on the basis that the financial instruments would have been designated as cash flow hedges and the impact upon the foreign exchange movements of other financial assets and liabilities is negligible. Equity would have been $8.1 million lower/$9.9 million higher (2019: $8.3 million lower/$10.2 million higher) had the Australian dollar weakened/strengthened by 10 per cent against other currencies, arising mainly from forward foreign exchange contracts designated as cash flow hedges. The impact on other Group assets and liabilities as a result of movements in exchange rates is not material. A sensitivity of 10 per cent was selected following review of historic trends. (ii) Cashflow and fair value interest rate risk Instruments used by the Group - interest rate swap contracts An assessment of the forecast core debt requirements subsequent to the equity raising announced on 15 June 2020 indicated that core debt was minimal. In accordance with the treasury policy, all interest rate swaps were terminated prior to the end of the financial year. Therefore future interest expense will be subject to variable rates. At the prior period end, the Group was a party to multiple interest rate swaps for a total nominal value of $215.0 million. These swaps on the prior debt balance covered approximately 55.1 per cent of the loan principal outstanding. The average fixed interest rate was 2.36 per cent. Interest rate risk exposures The economic entity’s exposure to interest rate risk and the effective weighted average interest rate by maturity periods is set out in the following table:
Fixed interest maturing in
Notes
Floating interest rate
$m
1 year or
less $m
Over 1 to 5
years $m
More than
5 years $m
Non-interest
bearing $m
Total $m
2020 Financial assets Cash and cash equivalents 283.5 - - - 1.6 285.1 Trade and other receivables 7 - - - - 26.3 26.3 Total financial assets 283.5 - - - 27.9 311.4 Weighted average rate of interest
0.25%
Financial liabilities Lease liabilities 11 - 177.8 556.7 204.8 - 939.3 Trade and other payables 12 - - - - 442.3 442.3 Borrowings 13 247.8 - - - - 247.8 Provisions (employee benefits) 15 - - - - 112.9 112.9 Total financial liabilities 247.8 177.8 556.7 204.8 555.2 1,742.3 Weighted average rate of interest 2.15%
Net financial (liabilities) / assets 35.7 (177.8) (556.7) (204.8) (527.3) (1,430.9)
119S U P E R R E TA I L G R O U P L I M I T E D A N N U A L R E P O R T 2020S U P E R R E T A I L G R O U P L I M I T E D A N N U A L R E P O R T 2 0 2 0 119
NOTES TO THE CONSOLIDATED FINANCIAL STATEMENTS (continued) For the period ended 27 June 2020
21. Financial risk management (continued) (b) Market risk (continued) (ii) Cashflow and fair value interest rate risk (continued)
Group sensitivity The Group’s main interest rate risk arises from long-term borrowings. Borrowings issued at variable rates expose the Group to cash flow interest rate risk. Borrowings issued at fixed rates expose the Group to fair value interest rate risk. During the 2020 and 2019 financial years, the Group’s borrowings were at variable rates and were denominated in Australian dollars. As at the reporting date, the Group had the following variable rate borrowings and interest rate swap contracts outstanding:
An analysis by maturities is provided in (d) below. The Group risk management policy is to maintain fixed interest rate hedges of approximately 40 per cent of anticipated core debt levels over a 3 year period. The Group utilises interest rate swaps to hedge its interest rate exposure on borrowings but as disclosed above all interest rate swaps were terminated prior to the end of the financial year as core debt was significantly reduced. As at 27 June 2020, if interest rates had changed by +/- 100 basis points from the year-end rates with all other variables held constant, post-tax profit and equity for the year would have been $1.7 million lower/higher (2019: $1.2 million lower/higher), mainly as a result of higher/lower interest expense on bank loans. (c) Credit risk Credit risk arises from cash and cash equivalents, favourable derivative financial instruments and deposits with banks and financial institutions, as well as credit exposures to wholesale and retail customers, including outstanding receivables and committed transactions. (i) Risk management Credit risk is managed on a Group basis. For banks and financial institutions, only independently rated parties with a minimum rating of ‘A’ are accepted. If wholesale customers are independently rated, these ratings are used. Otherwise, if there is no independent rating, risk control assesses the credit quality of the customer, taking into account its financial position, past experience and other factors. Individual risk limits are set based on internal or external ratings in accordance with limits set by the Board. The compliance with credit limits by wholesale customers is regularly monitored by management.
Fixed interest maturing in
Notes
Floating interest rate
$m
1 year or
less $m
Over 1 to
5 years $m
More than
5 years $m
Non-interest
bearing Restated
$m
Total Restated
$m 2019 Financial assets Cash and cash equivalents 5.8 - - - 1.7 7.5 Trade and other receivables 7 - - - - 37.6 37.6 Total financial assets 5.8 - - - 39.3 45.1 Weighted average rate of interest
1.00%
Financial liabilities Trade and other payables 12 - - - - 412.2 412.2 Borrowings 13 387.0 3.4 3.8 - - 394.2 Provisions (employee benefits) 15 - - - - 107.3 107.3 Total financial liabilities 387.0 3.4 3.8 - 519.5 913.7 Weighted average rate of interest 3.18%
Net financial (liabilities) / assets (381.2) (3.4) (3.8) - (480.2) (868.6)
2020 2019 $m $m Bank overdrafts and bank loans 250.0 390.0 Interest rate swaps - 215.0
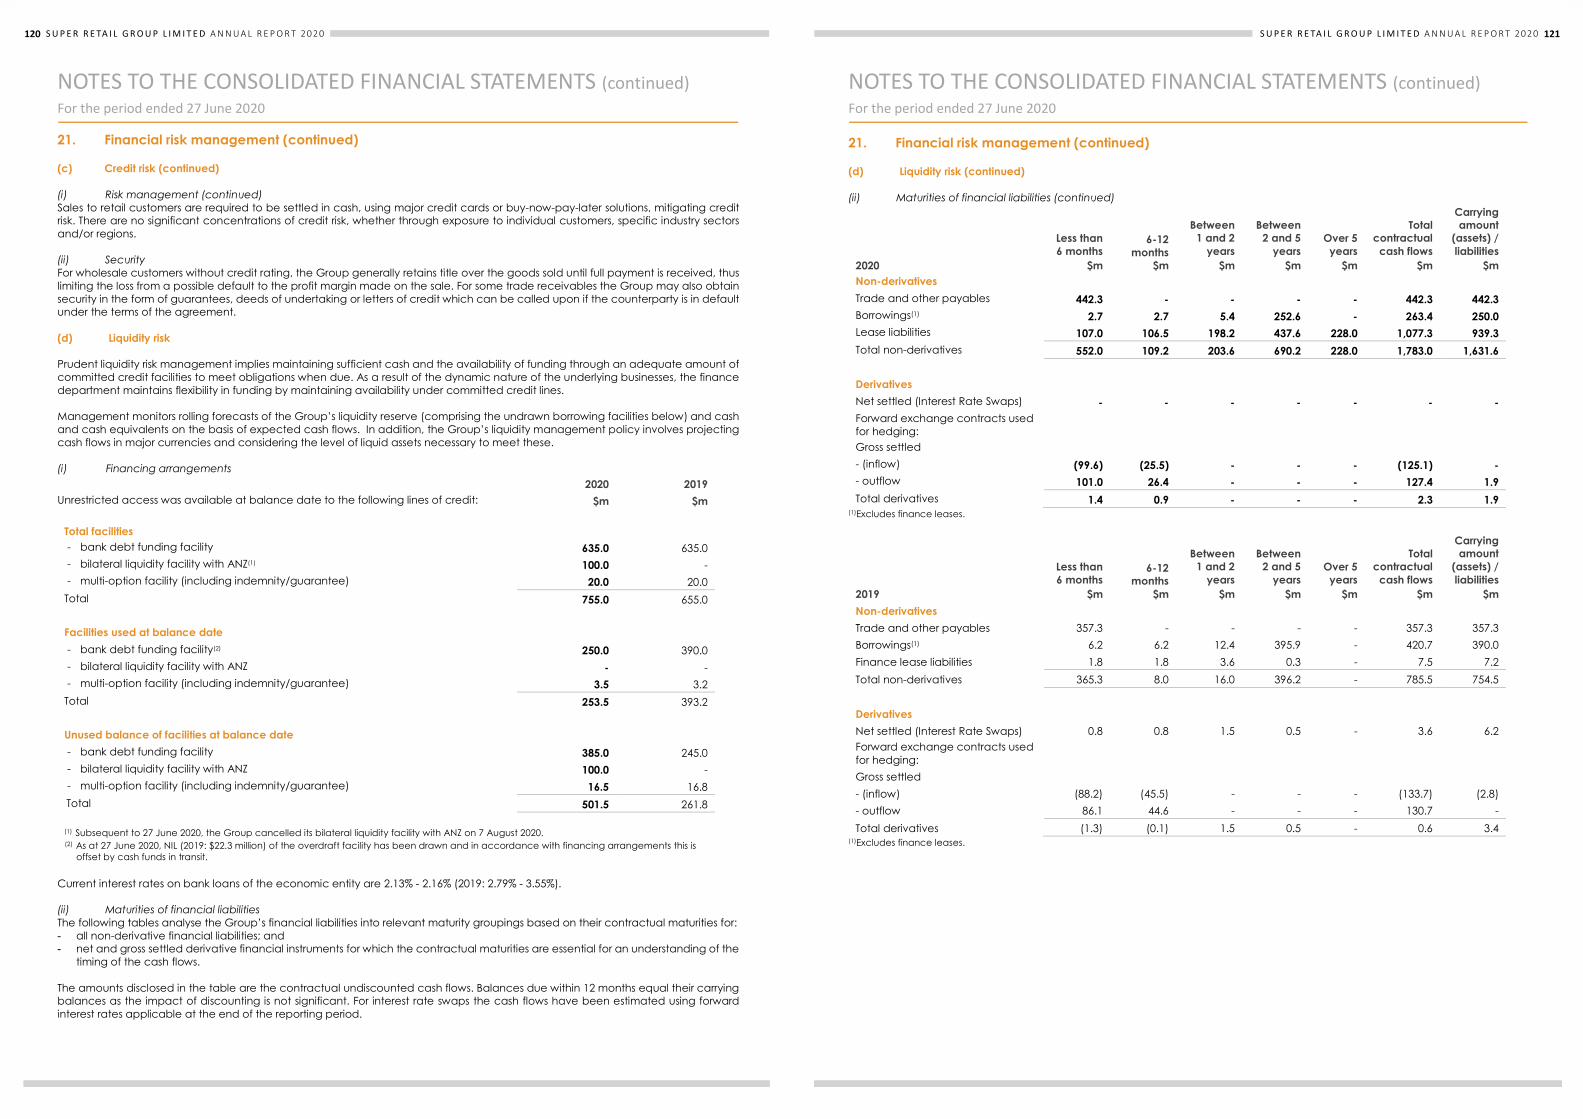
120 S U P E R R E TA I L G R O U P L I M I T E D A N N U A L R E P O R T 2020120 S U P E R R E T A I L G R O U P L I M I T E D A N N U A L R E P O R T 2 0 2 0
NOTES TO THE CONSOLIDATED FINANCIAL STATEMENTS (continued) For the period ended 27 June 2020
21. Financial risk management (continued) (c) Credit risk (continued) (i) Risk management (continued) Sales to retail customers are required to be settled in cash, using major credit cards or buy-now-pay-later solutions, mitigating credit risk. There are no significant concentrations of credit risk, whether through exposure to individual customers, specific industry sectors and/or regions. (ii) Security For wholesale customers without credit rating, the Group generally retains title over the goods sold until full payment is received, thus limiting the loss from a possible default to the profit margin made on the sale. For some trade receivables the Group may also obtain security in the form of guarantees, deeds of undertaking or letters of credit which can be called upon if the counterparty is in default under the terms of the agreement. (d) Liquidity risk Prudent liquidity risk management implies maintaining sufficient cash and the availability of funding through an adequate amount of committed credit facilities to meet obligations when due. As a result of the dynamic nature of the underlying businesses, the finance department maintains flexibility in funding by maintaining availability under committed credit lines. Management monitors rolling forecasts of the Group’s liquidity reserve (comprising the undrawn borrowing facilities below) and cash and cash equivalents on the basis of expected cash flows. In addition, the Group’s liquidity management policy involves projecting cash flows in major currencies and considering the level of liquid assets necessary to meet these. (i) Financing arrangements
2020 2019 Unrestricted access was available at balance date to the following lines of credit: $m $m
Total facilities - bank debt funding facility 635.0 635.0 - bilateral liquidity facility with ANZ(1) 100.0 - - multi-option facility (including indemnity/guarantee) 20.0 20.0 Total 755.0 655.0
Facilities used at balance date - bank debt funding facility(2) 250.0 390.0 - bilateral liquidity facility with ANZ - - - multi-option facility (including indemnity/guarantee) 3.5 3.2 Total 253.5 393.2
Unused balance of facilities at balance date - bank debt funding facility 385.0 245.0 - bilateral liquidity facility with ANZ 100.0 - - multi-option facility (including indemnity/guarantee) 16.5 16.8 Total 501.5 261.8
(1) Subsequent to 27 June 2020, the Group cancelled its bilateral liquidity facility with ANZ on 7 August 2020. (2) As at 27 June 2020, NIL (2019: $22.3 million) of the overdraft facility has been drawn and in accordance with financing arrangements this is
offset by cash funds in transit.
Current interest rates on bank loans of the economic entity are 2.13% - 2.16% (2019: 2.79% - 3.55%). (ii) Maturities of financial liabilities The following tables analyse the Group’s financial liabilities into relevant maturity groupings based on their contractual maturities for: - all non-derivative financial liabilities; and - net and gross settled derivative financial instruments for which the contractual maturities are essential for an understanding of the
timing of the cash flows. The amounts disclosed in the table are the contractual undiscounted cash flows. Balances due within 12 months equal their carrying balances as the impact of discounting is not significant. For interest rate swaps the cash flows have been estimated using forward interest rates applicable at the end of the reporting period.
121S U P E R R E TA I L G R O U P L I M I T E D A N N U A L R E P O R T 2020120 S U P E R R E T A I L G R O U P L I M I T E D A N N U A L R E P O R T 2 0 2 0
NOTES TO THE CONSOLIDATED FINANCIAL STATEMENTS (continued) For the period ended 27 June 2020
21. Financial risk management (continued) (c) Credit risk (continued) (i) Risk management (continued) Sales to retail customers are required to be settled in cash, using major credit cards or buy-now-pay-later solutions, mitigating credit risk. There are no significant concentrations of credit risk, whether through exposure to individual customers, specific industry sectors and/or regions. (ii) Security For wholesale customers without credit rating, the Group generally retains title over the goods sold until full payment is received, thus limiting the loss from a possible default to the profit margin made on the sale. For some trade receivables the Group may also obtain security in the form of guarantees, deeds of undertaking or letters of credit which can be called upon if the counterparty is in default under the terms of the agreement. (d) Liquidity risk Prudent liquidity risk management implies maintaining sufficient cash and the availability of funding through an adequate amount of committed credit facilities to meet obligations when due. As a result of the dynamic nature of the underlying businesses, the finance department maintains flexibility in funding by maintaining availability under committed credit lines. Management monitors rolling forecasts of the Group’s liquidity reserve (comprising the undrawn borrowing facilities below) and cash and cash equivalents on the basis of expected cash flows. In addition, the Group’s liquidity management policy involves projecting cash flows in major currencies and considering the level of liquid assets necessary to meet these. (i) Financing arrangements
2020 2019 Unrestricted access was available at balance date to the following lines of credit: $m $m
Total facilities - bank debt funding facility 635.0 635.0 - bilateral liquidity facility with ANZ(1) 100.0 - - multi-option facility (including indemnity/guarantee) 20.0 20.0 Total 755.0 655.0
Facilities used at balance date - bank debt funding facility(2) 250.0 390.0 - bilateral liquidity facility with ANZ - - - multi-option facility (including indemnity/guarantee) 3.5 3.2 Total 253.5 393.2
Unused balance of facilities at balance date - bank debt funding facility 385.0 245.0 - bilateral liquidity facility with ANZ 100.0 - - multi-option facility (including indemnity/guarantee) 16.5 16.8 Total 501.5 261.8
(1) Subsequent to 27 June 2020, the Group cancelled its bilateral liquidity facility with ANZ on 7 August 2020. (2) As at 27 June 2020, NIL (2019: $22.3 million) of the overdraft facility has been drawn and in accordance with financing arrangements this is
offset by cash funds in transit.
Current interest rates on bank loans of the economic entity are 2.13% - 2.16% (2019: 2.79% - 3.55%). (ii) Maturities of financial liabilities The following tables analyse the Group’s financial liabilities into relevant maturity groupings based on their contractual maturities for: - all non-derivative financial liabilities; and - net and gross settled derivative financial instruments for which the contractual maturities are essential for an understanding of the
timing of the cash flows. The amounts disclosed in the table are the contractual undiscounted cash flows. Balances due within 12 months equal their carrying balances as the impact of discounting is not significant. For interest rate swaps the cash flows have been estimated using forward interest rates applicable at the end of the reporting period.
S U P E R R E T A I L G R O U P L I M I T E D A N N U A L R E P O R T 2 0 2 0 121
NOTES TO THE CONSOLIDATED FINANCIAL STATEMENTS (continued) For the period ended 27 June 2020
21. Financial risk management (continued) (d) Liquidity risk (continued) (ii) Maturities of financial liabilities (continued)
2020
Less than 6 months
$m
6-12 months
$m
Between 1 and 2
years $m
Between 2 and 5
years $m
Over 5 years
$m
Total contractual
cash flows $m
Carrying amount
(assets) / liabilities
$m Non-derivatives Trade and other payables 442.3 - - - - 442.3 442.3 Borrowings(1) 2.7 2.7 5.4 252.6 - 263.4 250.0 Lease liabilities 107.0 106.5 198.2 437.6 228.0 1,077.3 939.3 Total non-derivatives 552.0 109.2 203.6 690.2 228.0 1,783.0 1,631.6 Derivatives Net settled (Interest Rate Swaps) - - - - - - - Forward exchange contracts used for hedging: Gross settled - (inflow) (99.6) (25.5) - - - (125.1) - - outflow 101.0 26.4 - - - 127.4 1.9 Total derivatives 1.4 0.9 - - - 2.3 1.9
(1)Excludes finance leases.
2019
Less than 6 months
$m
6-12 months
$m
Between 1 and 2
years $m
Between 2 and 5
years $m
Over 5 years
$m
Total contractual
cash flows $m
Carrying amount
(assets) / liabilities
$m Non-derivatives Trade and other payables 357.3 - - - - 357.3 357.3 Borrowings(1) 6.2 6.2 12.4 395.9 - 420.7 390.0 Finance lease liabilities 1.8 1.8 3.6 0.3 - 7.5 7.2 Total non-derivatives 365.3 8.0 16.0 396.2 - 785.5 754.5 Derivatives Net settled (Interest Rate Swaps) 0.8 0.8 1.5 0.5 - 3.6 6.2 Forward exchange contracts used for hedging: Gross settled - (inflow) (88.2) (45.5) - - - (133.7) (2.8) - outflow 86.1 44.6 - - - 130.7 - Total derivatives (1.3) (0.1) 1.5 0.5 - 0.6 3.4
(1)Excludes finance leases.

122 S U P E R R E TA I L G R O U P L I M I T E D A N N U A L R E P O R T 2020122 S U P E R R E T A I L G R O U P L I M I T E D A N N U A L R E P O R T 2 0 2 0
NOTES TO THE CONSOLIDATED FINANCIAL STATEMENTS (continued) For the period ended 27 June 2020
22. Capital management (a) Risk management The Group’s objectives when managing capital are to safeguard its ability to continue as a going concern, so that it can continue to provide returns for shareholders and benefits for other stakeholders, and maintain an optimal capital structure to reduce the cost of capital. In order to maintain or adjust the capital structure, the Group may adjust the amount of dividends paid to shareholders, return capital to shareholders, issue new shares or sell assets to reduce debt. The Group monitors overall capital on the basis of the gearing ratio. The ratio is calculated as net debt divided by total capital. Net debt is calculated as total borrowings less cash and cash equivalents. Total capital is calculated as equity as shown in the consolidated balance sheet (including non-controlling interests) plus net debt. During 2020 the Group’s strategy, which was unchanged from 2019, was to ensure that the gearing ratio remained below 50 per cent. This target ratio range excludes the short-term impact of acquisitions. The gearing ratios at 27 June 2020 and 29 June 2019 were as follows:
2020 Pre-AASB 16
2020 2019 $m $m $m Total borrowings 247.8 252.5 394.2 Total lease liabilities 939.3 - - Less: Cash & cash equivalents (285.1) (285.1) (7.5) Net Debt 902.0 (32.6) 386.7 Total Equity 991.3 1,031.4 816.0 Total Capital 1,893.3 998.8 1,202.7 Gearing Ratio 47.6% (3.3%) 32.2%
The Group monitors ongoing capital on the basis of the fixed charge cover ratio. The ratio is calculated as earnings before net finance costs, income tax, depreciation, amortisation and store and rental expense divided by fixed charge obligations (being finance costs and store and distribution centre rental expenses). Rental expenses are calculated net of straight line lease adjustments, while finance costs exclude non-cash mark-to-market losses or gains on interest rate swaps. During financial year 2020 the Group’s strategy, which was unchanged from financial year 2019, was to maintain a fixed charge cover ratio of around 2.0 times and a net debt to EBITDA of below 2.5 times. The fixed charge cover and net debt to EBITDA ratios at 27 June 2020 and 29 June 2019 were as follows:
2020 Pre-AASB 16
2020 2019 $m $m $m Profit attributable to Owners of Super Retail Group Limited 110.2 116.1 139.3 Add: Taxation expense 45.6 48.1 50.3
Net finance costs 55.1 17.8 21.3 Depreciation and amortisation (excludes impairment) 282.2 106.0 86.6
EBITDA 493.1 288.0 297.5 Rental expense 50.5 255.0 236.1
EBITDAR 543.6 543.0 533.6 Net finance costs 55.1 17.8 21.3 Rental expense 50.5 255.0 236.1
Fixed charges 105.6 272.8 257.4 Fixed charge cover ratio 5.15 1.99 2.07 Net debt to EBITDA ratio 1.82 (0.11) 1.30 Fixed charge cover ratio from normalised net profit after tax(1) 2.14 2.14 Net debt to EBITDA ratio from normalised net profit after tax(1) (0.10) 1.23 (1) Normalised EBITDAR is $583.0m (2019: $551.2m) and normalised EBITDA is $328.1m (2019: $314.7m). Normalised net debt is positive $32.6m. (i) Loan Covenants Financial covenants are provided by Super Retail Group Limited with respect to leverage, gearing, fixed charges coverage and shareholder funds. The Group has complied with the financial covenants of its borrowing facilities during the 2020 and 2019 financial years. There are no assets pledged as security in relation to the unsecured debt in the 2020 financial year (2019: nil).
S U P E R R E T A I L G R O U P L I M I T E D A N N U A L R E P O R T 2 0 2 0 123
NOTES TO THE CONSOLIDATED FINANCIAL STATEMENTS (continued) For the period ended 27 June 2020
22. Capital management (continued) (b) Dividends
2020 $m
2019 $m
Ordinary shares Dividends paid by Super Retail Group Limited during the financial year were as follows:
Final dividend for the period ended 29 June 2019 of 28.5 cents per share (2018: 27.5 cents per share) paid on 26 September 2019. Fully franked based on tax paid at 30% 56.2 54.3
Interim dividend for the period ended 28 December 2019 of 21.5 cents (2019: 21.5 cents per share) declared but subsequently cancelled. Fully franked based on tax paid at 30% - 42.4 Total dividends provided and paid 56.2 96.7
Dividends paid in cash or satisfied by the issue of shares under the dividend reinvestment plan were as follows:
- paid in cash 54.5 95.0 - satisfied by issue of shares purchased on market 1.7 1.7 56.2 96.7
Dividends not recognised at year end Subsequent to year end, the Directors have declared the payment of a final dividend of 19.5 cents per ordinary share (2019: 28.5 cents per ordinary share), fully franked based on tax paid at 30%. The aggregate amount of the dividend expected to be paid on 2 October 2020, out of retained profits as at 27 June 2020, but not recognised as a liability at year end, is 44.0 56.3
Franking credits The franked portions of dividends paid after 27 June 2020 will be franked out of existing franking credits and out of franking credits arising from the payments of income tax in the years ending after 27 June 2020. Franking credits remaining at balance date available for dividends declared after the current balance date based on a tax rate of 30% 157.2 138.7
The above amounts represent the balance of the franking account as at the end of the financial year, adjusted for: - franking credits that will arise from the payment of the current tax liability; and - franking debits that will arise from the payment of the dividend as a liability at the reporting date.
The amount recorded above as the franking credit amount is based on the amount of Australian income tax paid or to be paid in respect of the liability for income tax at the balance date.
The impact on the franking account of the dividend recommended by the Directors since year end will be a reduction in the franking account of $18.9 million (2019: $24.1 million). The recommended dividend has not been recognised as a liability at year end.
23. Related party transactions Transactions with related parties are at arm’s length unless otherwise stated. (a) Parent entities The parent entity within the Group is Super Retail Group Limited, which is the ultimate Australian parent. (b) Subsidiaries, associates and joint ventures Interests in subsidiaries are set out in Note 27 – Investments in controlled entities. Details on associates and joint ventures can be found at Note 24(b) – Business combinations. (c) Key Management Personnel Disclosures relating to key management personnel are set out in Note 28 – Key management personnel disclosures.
Significant Accounting Policies
Dividend distribution Provision is made for the amount of any dividend declared, being appropriately authorised and no longer at the discretion of the entity, on or before the end of the financial year but not distributed at balance date.
123S U P E R R E TA I L G R O U P L I M I T E D A N N U A L R E P O R T 2020122 S U P E R R E T A I L G R O U P L I M I T E D A N N U A L R E P O R T 2 0 2 0
NOTES TO THE CONSOLIDATED FINANCIAL STATEMENTS (continued) For the period ended 27 June 2020
22. Capital management (a) Risk management The Group’s objectives when managing capital are to safeguard its ability to continue as a going concern, so that it can continue to provide returns for shareholders and benefits for other stakeholders, and maintain an optimal capital structure to reduce the cost of capital. In order to maintain or adjust the capital structure, the Group may adjust the amount of dividends paid to shareholders, return capital to shareholders, issue new shares or sell assets to reduce debt. The Group monitors overall capital on the basis of the gearing ratio. The ratio is calculated as net debt divided by total capital. Net debt is calculated as total borrowings less cash and cash equivalents. Total capital is calculated as equity as shown in the consolidated balance sheet (including non-controlling interests) plus net debt. During 2020 the Group’s strategy, which was unchanged from 2019, was to ensure that the gearing ratio remained below 50 per cent. This target ratio range excludes the short-term impact of acquisitions. The gearing ratios at 27 June 2020 and 29 June 2019 were as follows:
2020 Pre-AASB 16
2020 2019 $m $m $m Total borrowings 247.8 252.5 394.2 Total lease liabilities 939.3 - - Less: Cash & cash equivalents (285.1) (285.1) (7.5) Net Debt 902.0 (32.6) 386.7 Total Equity 991.3 1,031.4 816.0 Total Capital 1,893.3 998.8 1,202.7 Gearing Ratio 47.6% (3.3%) 32.2%
The Group monitors ongoing capital on the basis of the fixed charge cover ratio. The ratio is calculated as earnings before net finance costs, income tax, depreciation, amortisation and store and rental expense divided by fixed charge obligations (being finance costs and store and distribution centre rental expenses). Rental expenses are calculated net of straight line lease adjustments, while finance costs exclude non-cash mark-to-market losses or gains on interest rate swaps. During financial year 2020 the Group’s strategy, which was unchanged from financial year 2019, was to maintain a fixed charge cover ratio of around 2.0 times and a net debt to EBITDA of below 2.5 times. The fixed charge cover and net debt to EBITDA ratios at 27 June 2020 and 29 June 2019 were as follows:
2020 Pre-AASB 16
2020 2019 $m $m $m Profit attributable to Owners of Super Retail Group Limited 110.2 116.1 139.3 Add: Taxation expense 45.6 48.1 50.3
Net finance costs 55.1 17.8 21.3 Depreciation and amortisation (excludes impairment) 282.2 106.0 86.6
EBITDA 493.1 288.0 297.5 Rental expense 50.5 255.0 236.1
EBITDAR 543.6 543.0 533.6 Net finance costs 55.1 17.8 21.3 Rental expense 50.5 255.0 236.1
Fixed charges 105.6 272.8 257.4 Fixed charge cover ratio 5.15 1.99 2.07 Net debt to EBITDA ratio 1.82 (0.11) 1.30 Fixed charge cover ratio from normalised net profit after tax(1) 2.14 2.14 Net debt to EBITDA ratio from normalised net profit after tax(1) (0.10) 1.23 (1) Normalised EBITDAR is $583.0m (2019: $551.2m) and normalised EBITDA is $328.1m (2019: $314.7m). Normalised net debt is positive $32.6m. (i) Loan Covenants Financial covenants are provided by Super Retail Group Limited with respect to leverage, gearing, fixed charges coverage and shareholder funds. The Group has complied with the financial covenants of its borrowing facilities during the 2020 and 2019 financial years. There are no assets pledged as security in relation to the unsecured debt in the 2020 financial year (2019: nil).
S U P E R R E T A I L G R O U P L I M I T E D A N N U A L R E P O R T 2 0 2 0 123
NOTES TO THE CONSOLIDATED FINANCIAL STATEMENTS (continued) For the period ended 27 June 2020
22. Capital management (continued) (b) Dividends
2020 $m
2019 $m
Ordinary shares Dividends paid by Super Retail Group Limited during the financial year were as follows:
Final dividend for the period ended 29 June 2019 of 28.5 cents per share (2018: 27.5 cents per share) paid on 26 September 2019. Fully franked based on tax paid at 30% 56.2 54.3
Interim dividend for the period ended 28 December 2019 of 21.5 cents (2019: 21.5 cents per share) declared but subsequently cancelled. Fully franked based on tax paid at 30% - 42.4 Total dividends provided and paid 56.2 96.7
Dividends paid in cash or satisfied by the issue of shares under the dividend reinvestment plan were as follows:
- paid in cash 54.5 95.0 - satisfied by issue of shares purchased on market 1.7 1.7 56.2 96.7
Dividends not recognised at year end Subsequent to year end, the Directors have declared the payment of a final dividend of 19.5 cents per ordinary share (2019: 28.5 cents per ordinary share), fully franked based on tax paid at 30%. The aggregate amount of the dividend expected to be paid on 2 October 2020, out of retained profits as at 27 June 2020, but not recognised as a liability at year end, is 44.0 56.3
Franking credits The franked portions of dividends paid after 27 June 2020 will be franked out of existing franking credits and out of franking credits arising from the payments of income tax in the years ending after 27 June 2020. Franking credits remaining at balance date available for dividends declared after the current balance date based on a tax rate of 30% 157.2 138.7
The above amounts represent the balance of the franking account as at the end of the financial year, adjusted for: - franking credits that will arise from the payment of the current tax liability; and - franking debits that will arise from the payment of the dividend as a liability at the reporting date.
The amount recorded above as the franking credit amount is based on the amount of Australian income tax paid or to be paid in respect of the liability for income tax at the balance date.
The impact on the franking account of the dividend recommended by the Directors since year end will be a reduction in the franking account of $18.9 million (2019: $24.1 million). The recommended dividend has not been recognised as a liability at year end.
23. Related party transactions Transactions with related parties are at arm’s length unless otherwise stated. (a) Parent entities The parent entity within the Group is Super Retail Group Limited, which is the ultimate Australian parent. (b) Subsidiaries, associates and joint ventures Interests in subsidiaries are set out in Note 27 – Investments in controlled entities. Details on associates and joint ventures can be found at Note 24(b) – Business combinations. (c) Key Management Personnel Disclosures relating to key management personnel are set out in Note 28 – Key management personnel disclosures.
Significant Accounting Policies
Dividend distribution Provision is made for the amount of any dividend declared, being appropriately authorised and no longer at the discretion of the entity, on or before the end of the financial year but not distributed at balance date.

124 S U P E R R E TA I L G R O U P L I M I T E D A N N U A L R E P O R T 2020124 S U P E R R E T A I L G R O U P L I M I T E D A N N U A L R E P O R T 2 0 2 0
NOTES TO THE CONSOLIDATED FINANCIAL STATEMENTS (continued) For the period ended 27 June 2020
23. Related party transactions (continued) (d) Directors The names of the persons who were Directors of Super Retail Group Limited during the financial year are S A Pitkin, R A Rowe, D J Eilert, H L Mowlem, P D Everingham, S A Chaplain, G T Dunne, L K Inman and A M Heraghty. (e) Amounts due from related parties There are no amounts due from Directors of the consolidated entity and their director-related entities (2019: nil). (f) Transactions with other related parties
Aggregate amounts included in the determination of profit from ordinary activities before income tax that resulted from transactions with related parties:
2020 $
2019 $
Store lease payment(1) 9,611,168 12,087,041 Inventories(2) 3,266,427 3,034,241
(1) Rent on properties, with rates which are deemed to be on an arms-length basis. Rent payable at year-end was $750,802 (2019: nil). (2) Purchases of inventories from Robert Bosch (Australia) Pty Ltd on an arms-length basis. Amounts payable at year-end are $513,389 (2019: $78,844).
Robert Bosch (Australia) Pty Ltd is a related party of the Group as it owns 50% of Autocrew Australia Pty Ltd in joint ownership with the Group. 24. Business combinations (a) Subsidiaries 2020 The Group’s subsidiaries at 27 June 2020 are as detailed in Note 27 - Investments in controlled entities. With the exception of changes to the Group’s ownership interest in Infinite Retail Pty Ltd, detailed below, there were no changes to the Group’s ownership interest in these entities. Infinite Retail Pty Ltd – October 2019 On the 23 October 2019, the Group entered into an agreement with Mulawa Pty Ltd to purchase the last 5 per cent ownership interest in Infinite Retail Pty Ltd for $75,000. As a result Infinite Retail Pty Ltd is now a wholly-owned subsidiary of the Group. 2019 During the 2019 financial year the Group changed its ownership interest in Youcamp Pty Ltd as detailed below. Youcamp Pty Ltd – December 2018 On 7 December 2018, the Group entered into an agreement with James Woodford Pty Ltd to sell all of its shares in Youcamp Pty Ltd for a total consideration of $850,000. As a result the Group no longer has an ownership interest in Youcamp and the entity has been deconsolidated from December 2018. On divestment the Group has deconsolidated Youcamp by derecognising the assets and liabilities resulting in a loss on divestment of $0.6 million which has been recognised in the Group’s consolidated statement of comprehensive income. (b) Associates and joint ventures 2020 Autoguru Australia Pty Ltd – February 2020 On 13 February 2020, shares in Autoguru Australia Pty Ltd were issued to the management of Autoguru. As a result. Super Retail Group’s ownership interest in Autoguru reduced from 49.52 per cent to 38.29 per cent. 2019 Autocrew Australia Pty Ltd – June 2019 During the period the Group injected additional capital of $675,000 into Autocrew Australia Pty Ltd, a joint venture with Robert Bosch (Australia) Pty Ltd where the Group has a 50 per cent ownership interest. Autocrew opened its second workshop in February 2019. Equity accounted losses of $0.5 million are included in the Group’s consolidated statement of comprehensive income. Based on initial trading results the value of the Groups investment in Autocrew has been impaired to nil resulting in a further loss of $0.6 million also being recognised in the Group’s consolidated statement of comprehensive income.
S U P E R R E T A I L G R O U P L I M I T E D A N N U A L R E P O R T 2 0 2 0 125
NOTES TO THE CONSOLIDATED FINANCIAL STATEMENTS (continued) For the period ended 27 June 2020
25. Deed of cross guarantee Super Retail Group Limited, A-Mart All Sports Pty Ltd, Auto Trade Direct Pty Ltd, Workout World Pty Ltd, Coyote Retail Pty Limited, Foghorn Holdings Pty Ltd, Goldcross Cycles Pty Ltd, Ray’s Outdoors Pty Ltd, Rebel Pty Ltd, Rebel Group Limited, Rebel Management Services Pty Limited, Rebel Sport Limited, Rebel Wholesale Pty Limited, Rebelsport.com Pty Limited, SRG Equity Plan Pty Ltd, SRG Leisure Retail Pty Ltd, SRGS Pty Ltd, Supercheap Auto Pty Ltd, Super Retail Commercial Pty Ltd, Super Retail Group Services Pty Ltd, Macpac Holdings Pty Ltd, Macpac Retail Pty Ltd, Mouton Noir Management Pty Ltd, MP Finco Pty Limited, Macpac Group Holdings Pty Limited, Infinite Retail Pty Ltd and Oceania Bicycles Pty Ltd are parties to a Deed of Cross Guarantee under which each company guarantees the debts of the others. By entering into the Deed, the wholly-owned entities have been relieved from the requirement to prepare a financial report and directors’ report under ASIC Corporations (Wholly-owned Companies) Instrument 2016/785 issued by the Australian Securities and Investments Commission. (a) Consolidated Comprehensive Income Statement and Summary of Movements in Consolidated Retained Earnings The above companies represent a Closed Group for the purposes of the Class Order, and as there are no other parties to the Deed of Cross Guarantee that are controlled by Super Retail Group Limited, they also represent the Extended Closed Group. Set out below is a consolidated comprehensive income statement and a summary of movements in consolidated retained earnings for the period ended 27 June 2020 of the Closed Group. 2020 2019 Consolidated Comprehensive Income Statement $m $m Revenue from continuing operations 2,644.9 2,441.4 Other income from continuing operations 28.5 1.6 Total revenues and other income 2,673.4 2,443.0 Cost of sales of goods (1,458.4) (1,346.9) Other expenses from ordinary activities - selling and distribution (352.4) (314.8) - marketing (74.4) (73.3) - occupancy (191.5) (193.6) - administration (368.7) (306.7) Net finance costs (53.5) (20.8) Share of net loss of associates and joint ventures (0.6) (2.6) Total expenses (2,499.5) (2,258.7) Profit before income tax 173.9 184.3 Income tax expense (42.6) (51.6) Profit for the period 131.3 132.7 Statement of comprehensive income $m $m Profit for the period 131.3 132.7 Other comprehensive income Items that may be reclassified to profit or loss Changes in the fair value of cash flow hedges 1.0 (4.9) Other comprehensive income for the period, net of tax 1.0 (4.9) Total comprehensive income for the period 132.3 127.8 (a) Consolidated Comprehensive Income Statement and Summary of Movements in Consolidated Retained Earnings
(continued)
2020 2019 Summary of movements in consolidated retained earnings $m $m Retained profits at the beginning of the financial period 245.5 209.5 Change in accounting policy – AASB 16 Leases (33.4) - Change in Closed Group 82.2 - Restated balance at the beginning of the financial period 294.3 209.5 Profit for the period 131.3 132.7 Dividends paid (56.2) (96.7) Retained profits at the end of the financial period 369.4 245.5
125S U P E R R E TA I L G R O U P L I M I T E D A N N U A L R E P O R T 2020S U P E R R E T A I L G R O U P L I M I T E D A N N U A L R E P O R T 2 0 2 0 125
NOTES TO THE CONSOLIDATED FINANCIAL STATEMENTS (continued) For the period ended 27 June 2020
25. Deed of cross guarantee Super Retail Group Limited, A-Mart All Sports Pty Ltd, Auto Trade Direct Pty Ltd, Workout World Pty Ltd, Coyote Retail Pty Limited, Foghorn Holdings Pty Ltd, Goldcross Cycles Pty Ltd, Ray’s Outdoors Pty Ltd, Rebel Pty Ltd, Rebel Group Limited, Rebel Management Services Pty Limited, Rebel Sport Limited, Rebel Wholesale Pty Limited, Rebelsport.com Pty Limited, SRG Equity Plan Pty Ltd, SRG Leisure Retail Pty Ltd, SRGS Pty Ltd, Supercheap Auto Pty Ltd, Super Retail Commercial Pty Ltd, Super Retail Group Services Pty Ltd, Macpac Holdings Pty Ltd, Macpac Retail Pty Ltd, Mouton Noir Management Pty Ltd, MP Finco Pty Limited, Macpac Group Holdings Pty Limited, Infinite Retail Pty Ltd and Oceania Bicycles Pty Ltd are parties to a Deed of Cross Guarantee under which each company guarantees the debts of the others. By entering into the Deed, the wholly-owned entities have been relieved from the requirement to prepare a financial report and directors’ report under ASIC Corporations (Wholly-owned Companies) Instrument 2016/785 issued by the Australian Securities and Investments Commission. (a) Consolidated Comprehensive Income Statement and Summary of Movements in Consolidated Retained Earnings The above companies represent a Closed Group for the purposes of the Class Order, and as there are no other parties to the Deed of Cross Guarantee that are controlled by Super Retail Group Limited, they also represent the Extended Closed Group. Set out below is a consolidated comprehensive income statement and a summary of movements in consolidated retained earnings for the period ended 27 June 2020 of the Closed Group. 2020 2019 Consolidated Comprehensive Income Statement $m $m Revenue from continuing operations 2,644.9 2,441.4 Other income from continuing operations 28.5 1.6 Total revenues and other income 2,673.4 2,443.0 Cost of sales of goods (1,458.4) (1,346.9) Other expenses from ordinary activities - selling and distribution (352.4) (314.8) - marketing (74.4) (73.3) - occupancy (191.5) (193.6) - administration (368.7) (306.7) Net finance costs (53.5) (20.8) Share of net loss of associates and joint ventures (0.6) (2.6) Total expenses (2,499.5) (2,258.7) Profit before income tax 173.9 184.3 Income tax expense (42.6) (51.6) Profit for the period 131.3 132.7 Statement of comprehensive income $m $m Profit for the period 131.3 132.7 Other comprehensive income Items that may be reclassified to profit or loss Changes in the fair value of cash flow hedges 1.0 (4.9) Other comprehensive income for the period, net of tax 1.0 (4.9) Total comprehensive income for the period 132.3 127.8 (a) Consolidated Comprehensive Income Statement and Summary of Movements in Consolidated Retained Earnings
(continued)
2020 2019 Summary of movements in consolidated retained earnings $m $m Retained profits at the beginning of the financial period 245.5 209.5 Change in accounting policy – AASB 16 Leases (33.4) - Change in Closed Group 82.2 - Restated balance at the beginning of the financial period 294.3 209.5 Profit for the period 131.3 132.7 Dividends paid (56.2) (96.7) Retained profits at the end of the financial period 369.4 245.5

126 S U P E R R E TA I L G R O U P L I M I T E D A N N U A L R E P O R T 2020126 S U P E R R E T A I L G R O U P L I M I T E D A N N U A L R E P O R T 2 0 2 0
NOTES TO THE CONSOLIDATED FINANCIAL STATEMENTS (continued) For the period ended 27 June 2020
25. Deed of cross guarantee (continued) (b) Consolidated Balance Sheet Set out below is a consolidated balance sheet as at 27 June 2020 of the Closed Group. ASSETS 2020 2019 Current assets $m $m Cash and cash equivalents 260.9 - Trade and other receivables 36.6 28.1 Inventories 451.3 489.7 Current tax receivables - 1.9 Derivative financial instruments - 2.8 Total current assets 748.8 522.5 Non-current assets Other financial assets 196.7 277.7 Deferred tax assets 11.6 - Property, plant and equipment 219.6 243.3 Right-of-use assets 789.0 - Intangible assets 806.9 761.9 Total non-current assets 2,023.8 1,282.9 Total assets 2,772.6 1,805.4 LIABILITIES Current liabilities Trade and other payables 419.7 415.3 Borrowings - 11.4 Lease liabilities 166.6 - Current tax liabilities 17.2 - Derivative financial instruments 1.9 6.2 Provisions 107.8 98.8 Total current liabilities 713.2 531.7 Non-current liabilities Trade and other payables - 48.1 Borrowings 247.8 390.8 Lease liabilities 717.4 - Deferred tax liabilities - 17.2 Provisions 23.4 19.2 Total non-current liabilities 988.6 475.3 Total liabilities 1,701.8 1,007.0 NET ASSETS 1,070.8 798.4 EQUITY Contributed equity 698.1 542.3 Reserves 3.3 10.6 Retained profits 369.4 245.5 TOTAL EQUITY 1,070.8 798.4
127S U P E R R E TA I L G R O U P L I M I T E D A N N U A L R E P O R T 2020126 S U P E R R E T A I L G R O U P L I M I T E D A N N U A L R E P O R T 2 0 2 0
NOTES TO THE CONSOLIDATED FINANCIAL STATEMENTS (continued) For the period ended 27 June 2020
25. Deed of cross guarantee (continued) (b) Consolidated Balance Sheet Set out below is a consolidated balance sheet as at 27 June 2020 of the Closed Group. ASSETS 2020 2019 Current assets $m $m Cash and cash equivalents 260.9 - Trade and other receivables 36.6 28.1 Inventories 451.3 489.7 Current tax receivables - 1.9 Derivative financial instruments - 2.8 Total current assets 748.8 522.5 Non-current assets Other financial assets 196.7 277.7 Deferred tax assets 11.6 - Property, plant and equipment 219.6 243.3 Right-of-use assets 789.0 - Intangible assets 806.9 761.9 Total non-current assets 2,023.8 1,282.9 Total assets 2,772.6 1,805.4 LIABILITIES Current liabilities Trade and other payables 419.7 415.3 Borrowings - 11.4 Lease liabilities 166.6 - Current tax liabilities 17.2 - Derivative financial instruments 1.9 6.2 Provisions 107.8 98.8 Total current liabilities 713.2 531.7 Non-current liabilities Trade and other payables - 48.1 Borrowings 247.8 390.8 Lease liabilities 717.4 - Deferred tax liabilities - 17.2 Provisions 23.4 19.2 Total non-current liabilities 988.6 475.3 Total liabilities 1,701.8 1,007.0 NET ASSETS 1,070.8 798.4 EQUITY Contributed equity 698.1 542.3 Reserves 3.3 10.6 Retained profits 369.4 245.5 TOTAL EQUITY 1,070.8 798.4
S U P E R R E T A I L G R O U P L I M I T E D A N N U A L R E P O R T 2 0 2 0 127
NOTES TO THE CONSOLIDATED FINANCIAL STATEMENTS (continued) For the period ended 27 June 2020
26. Parent entity financial information The individual financial statements for the parent entity show the following aggregate amounts:
2020
$m 2019
$m Balance Sheet Current assets 325.9 265.8 Total assets 1,134.3 1,072.1
Current liabilities 30.6 35.9 Total liabilities 279.4 423.5
NET ASSETS 854.9 648.6
Contributed equity 698.1 542.3 Reserves - share-based payments 13.1 12.9 - cash flow hedges - (4.3) Retained earnings 143.7 97.7 Total Equity 854.9 648.6
Profit after tax for the period 102.2 111.8 Total comprehensive income 106.5 108.5
Significant Accounting Policies
Parent entity financial information The financial information for the parent entity, Super Retail Group Limited has been prepared on the same basis as the consolidated financial statements, except as set out below. Investments in subsidiaries Investments in subsidiaries are accounted for at cost in the financial statements of Super Retail Group Limited. Tax consolidation legislation Super Retail Group Limited and its wholly-owned Australian controlled entities have implemented the tax consolidation legislation. The head entity, Super Retail Group Limited, and the controlled entities in the tax consolidated group account for current and deferred tax amounts under the Separate taxpayer within Group approach in accordance with AASB Interpretation 1052, Tax Consolidation Accounting. In addition to its own current and deferred tax amounts, Super Retail Group Limited also recognises the current tax liabilities (or assets) and the deferred tax assets arising from unused tax losses and unused tax credits assumed from controlled entities in the tax consolidated group. The entities have also entered into a tax funding agreement under which the wholly-owned entities fully compensate Super Retail Group Limited for any current tax payable assumed and are compensated by Super Retail Group Limited for any current tax receivable and deferred tax assets relating to unused tax losses or unused tax credits that are transferred to Super Retail Group Limited under the tax consolidation legislation. The funding amounts are determined by reference to the amounts recognised in the wholly-owned entities’ financial statements. The amounts receivable/payable under the tax funding agreement are due upon receipt of the funding advice from the head entity, which is issued as soon as practicable after the end of each financial year. The head entity may also require payment of interim funding amounts to assist with its obligations to pay tax instalments. Assets or liabilities arising under tax funding agreements with the tax consolidated entities are recognised as current amounts receivable from or payable to other entities in the Group. Any difference between the amounts assumed and amounts receivable or payable under the tax funding agreement are recognised as a contribution to (or distribution from) wholly-owned tax consolidated entities. Financial guarantees Where the parent entity has provided financial guarantees in relation to loans and payables of subsidiaries for no compensation, the fair values of these guarantees are accounted for as contributions and recognised as part of the cost of the investment.

128 S U P E R R E TA I L G R O U P L I M I T E D A N N U A L R E P O R T 2020128 S U P E R R E T A I L G R O U P L I M I T E D A N N U A L R E P O R T 2 0 2 0
NOTES TO THE CONSOLIDATED FINANCIAL STATEMENTS (continued) For the period ended 27 June 2020
27. Investments in controlled entities The Group’s subsidiaries at 27 June 2020 are set out below. Unless otherwise stated, they have share capital consisting of ordinary shares that are held directly by the Group, and the proportion of ownership interests held equals the voting rights held by the Group. The country of incorporation is also their principal place of business.
Equity Holding
Name of Entity Country of
Incorporation Principal Activities 2020
% 2019
% A-Mart All Sports Pty Ltd(1) Australia Sports retail 100 100 Auto Trade Direct (NZ) Limited New Zealand Auto retail 100 100 Auto Trade Direct Pty Ltd(1) Australia Auto retail 100 100 BCF New Zealand Limited New Zealand Outdoor retail 100 100 Workout World Pty Limited(1) Australia Sports retail 100 100 Coyote Retail Pty Limited(1) Australia Sports retail 100 100 Foghorn Holdings Pty Ltd(1) Australia Sports retail 100 100 Goldcross Cycles Pty Ltd(1) Australia Sports retail 100 100 Infinite Retail Pty Ltd(1) Australia Sports retail 100 95 VBM Retail (HK) Limited(2) Hong Kong Sports retail 100 95 Infinite Retail UK Limited(2) United Kingdom Sports retail 100 95 VBM Retail NZ Limited(2) New Zealand Sports retail 100 95 Macpac Holdings Pty Ltd(1) Australia Outdoor retail 100 100 Macpac Group Holdings Pty Limited(1) (4) Australia Outdoor retail 100 100 Macpac New Zealand Limited New Zealand Outdoor retail 100 100 Macpac Retail Pty Ltd(1) Australia Outdoor retail 100 100 Macpac Limited New Zealand Outdoor retail 100 100 Macpac Enterprise New Zealand Outdoor retail 100 100 MP Finco Pty Limited(1) (4) Australia Outdoor retail 100 100 Mouton Noir Management Pty Ltd(1) Australia Outdoor retail 100 100 Mouton NOIR IP Limited New Zealand Outdoor retail 100 100 Oceania Bicycles Pty Ltd(1) Australia Sports retail 100 100 Oceania Bicycles Limited(3) New Zealand Sports retail 100 100 Ray’s Outdoors New Zealand Limited New Zealand Outdoor retail 100 100 Ray’s Outdoors Pty Ltd(1) Australia Outdoor retail 100 100 Rebel Pty Ltd(1) Australia Sports retail 100 100 Rebel Group Limited(1) Australia Sports retail 100 100 Rebel Management Services Pty Limited(1) Australia Sports retail 100 100 Rebel Sport Limited(1) Australia Sports retail 100 100 Rebel Wholesale Pty Limited(1) Australia Sports retail 100 100 Rebelsport.com Pty Limited(1) Australia Sports retail 100 100 SRG Equity Plan Pty Ltd(1) Australia Investments 100 100 SRG Leisure Retail Pty Ltd(1) Australia Outdoor retail 100 100 SRGS (New Zealand) Limited New Zealand Product acquisition and distribution 100 100 SRGS Pty Ltd(1) Australia Product acquisition and distribution 100 100 Super Cheap Auto (New Zealand) Pty Limited New Zealand Auto retail 100 100 Super Cheap Auto Pty Ltd(1) Australia Auto retail 100 100 Super Retail Commercial Pty Ltd(1) Australia Auto retail 100 100 Super Retail Group Services (New Zealand) Limited New Zealand Support services 100 100 Super Retail Group Services Pty Ltd(1) Australia Support services 100 100 Super Retail Group Trading (Shanghai) Ltd China Product sourcing 100 100
(1) These controlled entities have been granted relief from the necessity to prepare financial reports in accordance with ASIC Corporations (Wholly-owned Companies) Instrument 2016/785 issued by the Australian Securities and Investments Commission.
(2) Investment is held directly by Infinite Retail Pty Ltd. (3) Investment is held directly by Oceania Bicycles Pty Ltd. (4) Previously incorporated in New Zealand. Re-domiciled during the financial year ended 27 June 2020.
129S U P E R R E TA I L G R O U P L I M I T E D A N N U A L R E P O R T 2020S U P E R R E T A I L G R O U P L I M I T E D A N N U A L R E P O R T 2 0 2 0 129
NOTES TO THE CONSOLIDATED FINANCIAL STATEMENTS (continued) For the period ended 27 June 2020
28. Key Management Personnel disclosures (a) Key Management Personnel compensation 2020 2019 $ $ Short-term employee benefits 7,421,738 5,638,821 Long-term employee benefits 25,003 114,843 Post-employment benefits 178,154 929,632 Share-based payments 711,742 (169,235) 8,336,637 6,514,061 The key management personnel remuneration in some instances has been paid by a subsidiary. Loans to key management personnel There were no loans to individuals at any time. Other transactions with key management personnel Aggregate amounts of each of the above types of other transactions with key management personnel of Super Retail Group Limited: 2020 2019 Amounts paid to key management personnel as shareholders $ $ Dividends(1) 17,135,677 30,133,125 (1) Dividends paid to KMP shareholders is down on the prior year due to the cancellation of the FY20 interim dividend. 29. Share-based payments (a) Executive Performance Rights The Company has established the Super Retail Group Executive Performance Rights Plan (“the plan”) to assist in the retention and motivation of executives of Super Retail Group (Participants). It is intended that the Performance Rights will enable the Company to retain and attract skilled and experienced executives and provide them with the motivation to enhance the success of the Company. Under the Performance Rights, rights may be offered to Participants selected by the Board. Unless otherwise determined by the Board, no payment is required for the grant of rights under the plan. Subject to any adjustment in the event of a bonus issue, each right is an option to subscribe for one share. Upon the exercise of a right by a Participant, each Share issued will rank equally with other Shares of the Company. Performance Rights issued under the plan may not be transferred unless approved by the Board. The table below summarises rights granted under the plan.
Number of Rights Issued Grant Date 2020
Balance at start of the
year (Number)
Granted during the
year (Number)
Exercised during the
year (Number)
Forfeited during the
year (Number)
Balance at the end of
the year (Number)
Unvested at the end of
the year (Number)
1 September 2015 136,707 - (10,089) (116,666) 9,952 9,952 1 September 2016 453,535 - (150,879) (155,602) 147,054 147,054 1 September 2017 633,916 - - (168,031) 465,885 465,885 1 September 2018 592,684 - - (247,986) 344,698 344,698 1 September 2019 - 727,470 - (32,000) 695,470 695,470 1,816,842 727,470 (160,968) (720,285) 1,663,059 1,663,059 2019 1 September 2015 511,500 - (143,731) (231,062) 136,707 136,707 1 September 2016 536,775 - - (83,240) 453,535 453,535 1 September 2017 724,862 - - (90,946) 633,916 633,916 1 September 2018 - 622,684 - (30,000) 592,684 592,684 1,773,137 622,684 (143,731) (435,248) 1,816,842 1,816,842

130 S U P E R R E TA I L G R O U P L I M I T E D A N N U A L R E P O R T 2020130 S U P E R R E T A I L G R O U P L I M I T E D A N N U A L R E P O R T 2 0 2 0
NOTES TO THE CONSOLIDATED FINANCIAL STATEMENTS (continued) For the period ended 27 June 2020
29. Share-based payments (continued) Expenses arising from share based payments transactions: 2020
$m 2019
$m Executive Performance Rights 0.2 1.3
30. Remuneration of auditors During the period the following fees were paid or payable for services provided by the auditor of the parent entity, its related practices and non-related audit firms.
2020
$ 2019
$ (a) PricewaterhouseCoopers Australia (i) Assurance services Audit and review of financial statements 855,736 807,976 Other assurance(1) - 13,407 Total remuneration for audit and other assurance services 855,736 821,383 (ii) Taxation services Tax compliance services, including review of Company income tax returns 258,577 295,484 Total remuneration for taxation services 258,577 295,484 (iii) Other services Advisory services 45,900 - Total remuneration for advisory services 45,900 - Total remuneration of PricewaterhouseCoopers Australia 1,160,213 1,116,867 (b) Network firms of PricewaterhouseCoopers Australia (i) Taxation services Tax compliance services, including review of Company income tax returns 80,380 56,283 Total remuneration for taxation services 80,380 56,283 Total remuneration of network firms of PricewaterhouseCoopers Australia 80,380 56,283 Total auditors’ remuneration 1,240,593 1,173,150 (1) Cyber security review.
Significant Accounting Policies
Share-based payments Share-based compensation benefits are provided to certain employees via the Super Retail Group Performance Rights Plan. The fair value of performance rights granted under the plan are recognised as an employee benefit expense with a corresponding increase in equity. The fair value is measured at grant date and recognised over the period during which the employees become unconditionally entitled to the performance rights. For performance rights, the fair value at grant date is determined using a binomial option pricing model that takes into account the exercise price, the term of the performance rights, the vesting and performance criteria, the impact of dilution, the non-tradeable nature of the performance rights, the share price at grant date and expected price volatility of the underlying share, the expected dividend yield and the risk-free interest rate for the term of the performance rights. The fair value of the performance rights granted excludes the impact of any non-market vesting conditions (for example, profitability and sales growth targets). Non-market vesting conditions are included in assumptions about the number of performance rights that are expected to become exercisable. At each balance sheet date, the entity revises its estimate of the number of performance rights that are expected to become exercisable. The employee benefit expense recognised each period takes into account the most recent estimate. Upon exercise of the performance rights, the balance of the share-based payments reserve relating to those performance rights remains in the share-based payments reserve.
131S U P E R R E TA I L G R O U P L I M I T E D A N N U A L R E P O R T 2020S U P E R R E T A I L G R O U P L I M I T E D A N N U A L R E P O R T 2 0 2 0 131
NOTES TO THE CONSOLIDATED FINANCIAL STATEMENTS (continued) For the period ended 27 June 2020
30. Remuneration of auditors (continued) The Group’s auditor is PricewaterhouseCoopers. The Group may employ PricewaterhouseCoopers on assignments additional to their statutory audit duties where PricewaterhouseCoopers’ expertise and experience with the Group are important. These assignments are principally tax advice and due diligence reporting on acquisitions, or where the auditor is awarded assignments on a competitive basis. It is the Group’s policy to seek competitive tenders for all major consulting projects. The Board has considered the non-audit services provided during the year by the auditor, and in accordance with written advice provided by resolution of the Audit and Risk Committee, is satisfied that the provision of those non-audit services during the year by the auditor is compatible with, and did not compromise, the auditor independence requirements of the Corporations Act 2001. 31. Contingencies 2020 2019 $m $m Guarantees Guarantees issued by the bankers of the Group in support of various rental arrangements. The maximum future rental payments guaranteed amount to: 4.9 5.2 Other Contingencies The Group continues to work with the Fair Work Ombudsman as the underpayment of retail team members is remediated. This may result in regulator undertakings and further amounts becoming payable at the direction of the regulator. Future professional advisory fees will be incurred to finalise remediation outcomes.
From time to time the Group is subject to legal claims as a result of its operations. An immaterial contingent liability may exist for any exposure over and above current provisioning levels. 32. Commitments
2020 $m
2019 $m
Capital commitments Commitments for the acquisition of plant and equipment contracted for at the reporting date but not recognised as liabilities payable: Within one year 2.6 0.9 Total capital commitments 2.6 0.9 Lease commitments Commitments in relation to operating lease payments for property and motor vehicles under non-cancellable operating leases are payable as follows: Within one year - 224.1 Later than one year but not later than five years - 655.4 Later than five years - 132.6 Less lease straight lining adjustment (Note 12) - (54.9) Total lease commitments - 957.2 Future minimum lease payments expected to be received in relation to non-cancellable sub-leases of operating leases - 3.2
The Group leases various offices, warehouses and retail stores under non-cancellable operating leases. The leases have varying terms, escalation clauses and renewal rights. On renewal the terms of the leases are renegotiated. From 30 June 2019, the Group has recognised right-of-use assets for these leases, except for short-term and low-value leases - refer Note 11 – Leases and Note 34 – Changes in accounting policy. 33. Net tangible asset backing 2020 2019
Cents Cents Net tangible asset per ordinary share $0.88 ($0.01) Net tangible asset per ordinary share is calculated based on Net Assets of $991.3 million (2019: $816.0 million) less intangible assets of $874.3 million (2019: $894.2 million) adjusted for the associated deferred tax liability of $75.3 million (2019: $75.3 million). The number of shares used in the calculation was 219,697,707 (2019: 197,383,751).
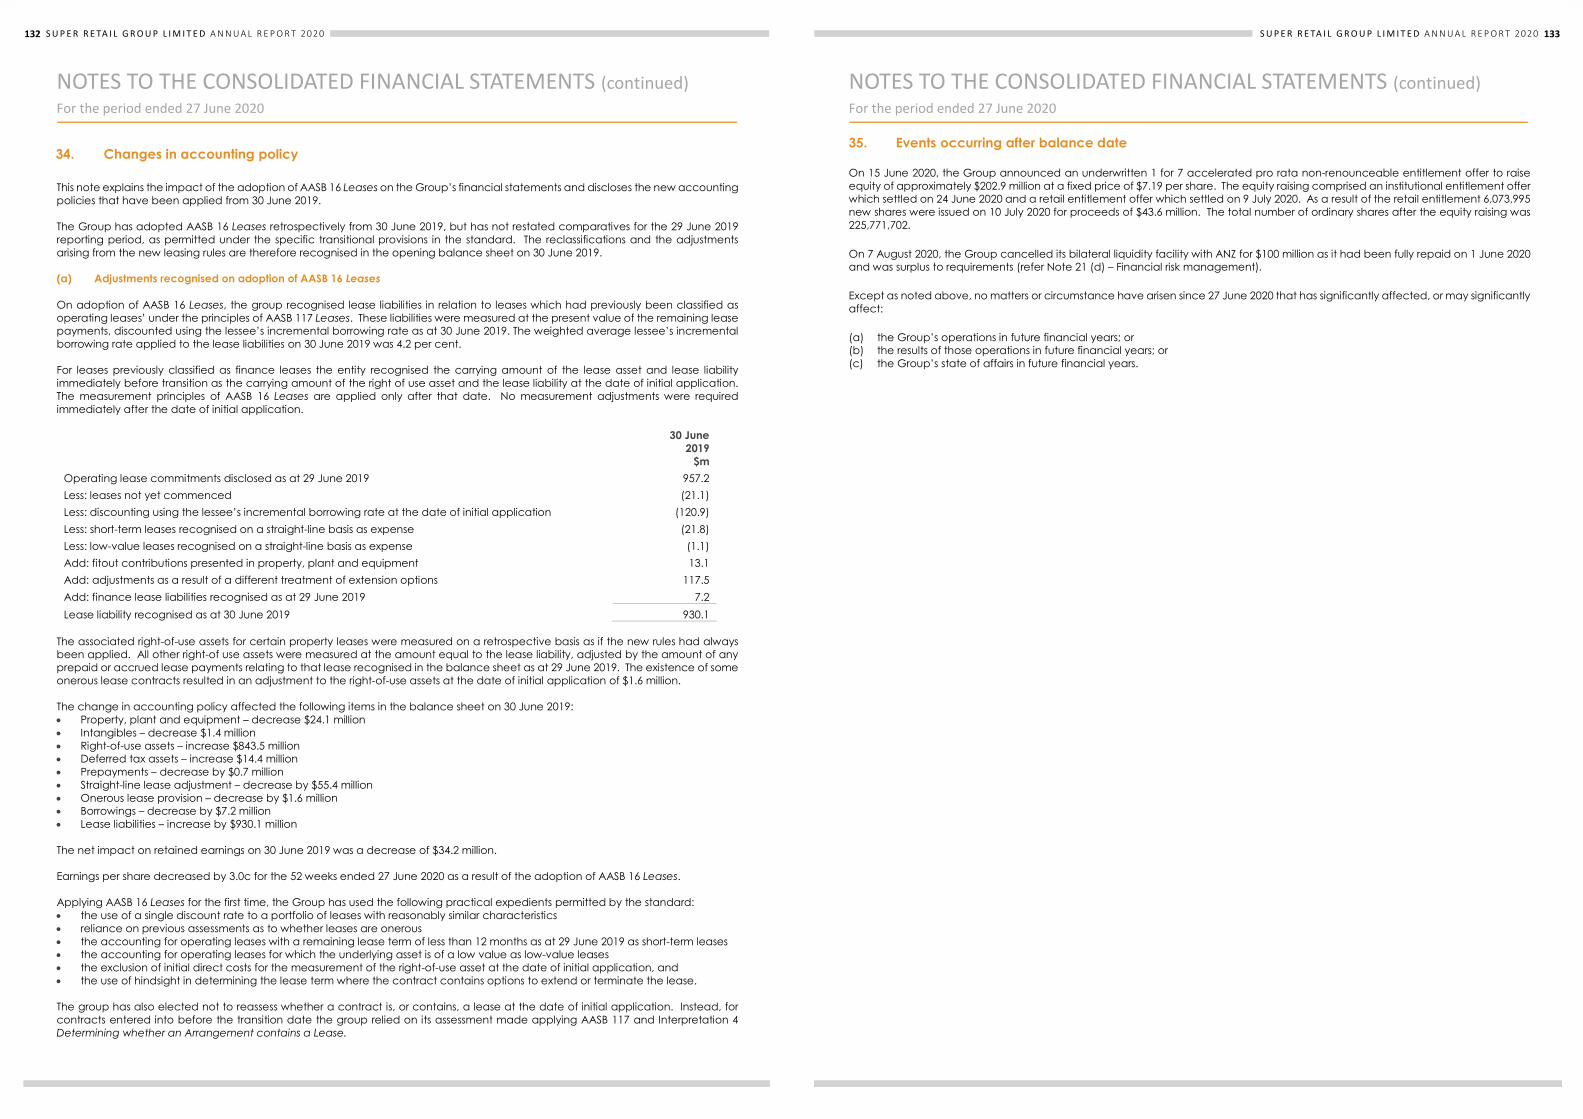
132 S U P E R R E TA I L G R O U P L I M I T E D A N N U A L R E P O R T 2020132 S U P E R R E T A I L G R O U P L I M I T E D A N N U A L R E P O R T 2 0 2 0
NOTES TO THE CONSOLIDATED FINANCIAL STATEMENTS (continued) For the period ended 27 June 2020
34. Changes in accounting policy This note explains the impact of the adoption of AASB 16 Leases on the Group’s financial statements and discloses the new accounting policies that have been applied from 30 June 2019. The Group has adopted AASB 16 Leases retrospectively from 30 June 2019, but has not restated comparatives for the 29 June 2019 reporting period, as permitted under the specific transitional provisions in the standard. The reclassifications and the adjustments arising from the new leasing rules are therefore recognised in the opening balance sheet on 30 June 2019.
(a) Adjustments recognised on adoption of AASB 16 Leases
On adoption of AASB 16 Leases, the group recognised lease liabilities in relation to leases which had previously been classified as operating leases’ under the principles of AASB 117 Leases. These liabilities were measured at the present value of the remaining lease payments, discounted using the lessee’s incremental borrowing rate as at 30 June 2019. The weighted average lessee’s incremental borrowing rate applied to the lease liabilities on 30 June 2019 was 4.2 per cent. For leases previously classified as finance leases the entity recognised the carrying amount of the lease asset and lease liability immediately before transition as the carrying amount of the right of use asset and the lease liability at the date of initial application. The measurement principles of AASB 16 Leases are applied only after that date. No measurement adjustments were required immediately after the date of initial application.
30 June 2019
$m Operating lease commitments disclosed as at 29 June 2019 957.2 Less: leases not yet commenced (21.1) Less: discounting using the lessee’s incremental borrowing rate at the date of initial application (120.9) Less: short-term leases recognised on a straight-line basis as expense (21.8) Less: low-value leases recognised on a straight-line basis as expense (1.1) Add: fitout contributions presented in property, plant and equipment 13.1 Add: adjustments as a result of a different treatment of extension options 117.5 Add: finance lease liabilities recognised as at 29 June 2019 7.2 Lease liability recognised as at 30 June 2019 930.1
The associated right-of-use assets for certain property leases were measured on a retrospective basis as if the new rules had always been applied. All other right-of use assets were measured at the amount equal to the lease liability, adjusted by the amount of any prepaid or accrued lease payments relating to that lease recognised in the balance sheet as at 29 June 2019. The existence of some onerous lease contracts resulted in an adjustment to the right-of-use assets at the date of initial application of $1.6 million. The change in accounting policy affected the following items in the balance sheet on 30 June 2019: Property, plant and equipment – decrease $24.1 million Intangibles – decrease $1.4 million Right-of-use assets – increase $843.5 million Deferred tax assets – increase $14.4 million Prepayments – decrease by $0.7 million Straight-line lease adjustment – decrease by $55.4 million Onerous lease provision – decrease by $1.6 million Borrowings – decrease by $7.2 million Lease liabilities – increase by $930.1 million The net impact on retained earnings on 30 June 2019 was a decrease of $34.2 million. Earnings per share decreased by 3.0c for the 52 weeks ended 27 June 2020 as a result of the adoption of AASB 16 Leases. Applying AASB 16 Leases for the first time, the Group has used the following practical expedients permitted by the standard: the use of a single discount rate to a portfolio of leases with reasonably similar characteristics reliance on previous assessments as to whether leases are onerous the accounting for operating leases with a remaining lease term of less than 12 months as at 29 June 2019 as short-term leases the accounting for operating leases for which the underlying asset is of a low value as low-value leases the exclusion of initial direct costs for the measurement of the right-of-use asset at the date of initial application, and the use of hindsight in determining the lease term where the contract contains options to extend or terminate the lease.
The group has also elected not to reassess whether a contract is, or contains, a lease at the date of initial application. Instead, for contracts entered into before the transition date the group relied on its assessment made applying AASB 117 and Interpretation 4 Determining whether an Arrangement contains a Lease.
133S U P E R R E TA I L G R O U P L I M I T E D A N N U A L R E P O R T 2020S U P E R R E T A I L G R O U P L I M I T E D A N N U A L R E P O R T 2 0 2 0 133
NOTES TO THE CONSOLIDATED FINANCIAL STATEMENTS (continued) For the period ended 27 June 2020
35. Events occurring after balance date On 15 June 2020, the Group announced an underwritten 1 for 7 accelerated pro rata non-renounceable entitlement offer to raise equity of approximately $202.9 million at a fixed price of $7.19 per share. The equity raising comprised an institutional entitlement offer which settled on 24 June 2020 and a retail entitlement offer which settled on 9 July 2020. As a result of the retail entitlement 6,073,995 new shares were issued on 10 July 2020 for proceeds of $43.6 million. The total number of ordinary shares after the equity raising was 225,771,702. On 7 August 2020, the Group cancelled its bilateral liquidity facility with ANZ for $100 million as it had been fully repaid on 1 June 2020 and was surplus to requirements (refer Note 21 (d) – Financial risk management). Except as noted above, no matters or circumstance have arisen since 27 June 2020 that has significantly affected, or may significantly affect: (a) the Group’s operations in future financial years; or (b) the results of those operations in future financial years; or (c) the Group’s state of affairs in future financial years.

134 S U P E R R E TA I L G R O U P L I M I T E D A N N U A L R E P O R T 2020134 S U P E R R E T A I L G R O U P L I M I T E D A N N U A L R E P O R T 2 0 2 0
DIRECTORS’ DECLARATION
In the Directors’ opinion: (a) the financial statements and notes set out on pages 80 to 133 are in accordance with the Corporations Act 2001,
including: (i) complying with Accounting Standards, the Corporations Regulations 2001 and other mandatory professional
reporting requirements; and (ii) giving a true and fair view of the consolidated entity's financial position as at 27 June 2020 and of its
performance for the financial year ended on that date; and (b) there are reasonable grounds to believe that the Compacny will be able to pay its debts as and when they become
due and payable; and (c) at the date of this declaration, there are reasonable grounds to believe that the members of the Extended Closed
Group identified in Note 25 will be able to meet any obligations or liabilities to which they are, or may become, subject by virtue of the deed of cross guarantee described in Note 25.
Note 2(a) confirms that the financial statements also comply with International Financial Reporting Standards as issued by the International Accounting Standards Board.
The Directors have been given the declarations by the Group Managing Director and Chief Financial Officer required by section 295A of the Corporations Act 2001.
This declaration is made in accordance with a resolution of the Directors.
S A Pitkin A M Heraghty Director Director Brisbane 24 August 2020
135S U P E R R E TA I L G R O U P L I M I T E D A N N U A L R E P O R T 2020134 S U P E R R E T A I L G R O U P L I M I T E D A N N U A L R E P O R T 2 0 2 0
DIRECTORS’ DECLARATION
In the Directors’ opinion: (a) the financial statements and notes set out on pages 80 to 133 are in accordance with the Corporations Act 2001,
including: (i) complying with Accounting Standards, the Corporations Regulations 2001 and other mandatory professional
reporting requirements; and (ii) giving a true and fair view of the consolidated entity's financial position as at 27 June 2020 and of its
performance for the financial year ended on that date; and (b) there are reasonable grounds to believe that the Compacny will be able to pay its debts as and when they become
due and payable; and (c) at the date of this declaration, there are reasonable grounds to believe that the members of the Extended Closed
Group identified in Note 25 will be able to meet any obligations or liabilities to which they are, or may become, subject by virtue of the deed of cross guarantee described in Note 25.
Note 2(a) confirms that the financial statements also comply with International Financial Reporting Standards as issued by the International Accounting Standards Board.
The Directors have been given the declarations by the Group Managing Director and Chief Financial Officer required by section 295A of the Corporations Act 2001.
This declaration is made in accordance with a resolution of the Directors.
S A Pitkin A M Heraghty Director Director Brisbane 24 August 2020
135 S U P E R R E T A I L G R O U P L I M I T E D A N N U A L R E P O R T 2 0 2 0
PricewaterhouseCoopers, ABN 52 780 433 757 480 Queen Street, BRISBANE QLD 4000, GPO Box 150, BRISBANE QLD 4001 T: +61 7 3257 5000, F: +61 7 3257 5999, www.pwc.com.au
Liability limited by a scheme approved under Professional Standards Legislation.
Independent auditor’s report To the members of Super Retail Group Limited
Report on the audit of the financial report
Our opinion In our opinion:
The accompanying financial report of Super Retail Group Limited (the Company) and its controlled entities (together the Group) is in accordance with the Corporations Act 2001, including:
(a) giving a true and fair view of the Group's financial position as at 27 June 2020 and of its financial performance for the period from 30 June 2019 to 27 June 2020 (the year)
(b) complying with Australian Accounting Standards and the Corporations Regulations 2001.
What we have audited The Group financial report comprises:
● the consolidated balance sheet as at 27 June 2020 ● the consolidated statement of comprehensive income for the year then ended ● the consolidated statement of changes in equity for the year then ended ● the consolidated statement of cash flows for the year then ended ● the notes to the consolidated financial statements, which include a summary of significant
accounting policies ● the directors’ declaration.
Basis for opinion We conducted our audit in accordance with Australian Auditing Standards. Our responsibilities under those standards are further described in the Auditor’s responsibilities for the audit of the financial report section of our report.
We believe that the audit evidence we have obtained is sufficient and appropriate to provide a basis for our opinion.
Independence We are independent of the Group in accordance with the auditor independence requirements of the Corporations Act 2001 and the ethical requirements of the Accounting Professional and Ethical Standards Board’s APES 110 Code of Ethics for Professional Accountants (including Independence Standards) (the Code) that are relevant to our audit of the financial report in Australia. We have also fulfilled our other ethical responsibilities in accordance with the Code.

136 S U P E R R E TA I L G R O U P L I M I T E D A N N U A L R E P O R T 2020 S U P E R R E T A I L G R O U P L I M I T E D A N N U A L R E P O R T 2 0 2 0 136
Our audit approach An audit is designed to provide reasonable assurance about whether the financial report is free from material misstatement. Misstatements may arise due to fraud or error. They are considered material if individually or in aggregate, they could reasonably be expected to influence the economic decisions of users taken on the basis of the financial report.
We tailored the scope of our audit to ensure that we performed enough work to be able to give an opinion on the financial report as a whole, taking into account the geographic and management structure of the Group, its accounting processes and controls and the industry in which it operates.
Materiality Audit scope
● For the purpose of our audit we used overall Group materiality of $8.1 million, which represents approximately 5% of the Group’s profit before tax adjusted for the redundancy costs recorded in the current year.
● We applied this threshold, together with qualitative considerations, to determine the scope of our audit and the nature, timing and extent of our audit procedures and to evaluate the effect of misstatements on the financial report as a whole.
● We chose the adjusted Group profit before tax because, in our view, it is the benchmark against which the performance of the Group is most commonly measured. We adjusted for redundancy costs as they are unusual or infrequently occurring items impacting profit and loss.
● We utilised a 5% threshold based on our professional judgement, noting it is within the range of commonly acceptable thresholds.
● Our audit focused on where the Group made subjective judgements; for example, significant accounting estimates involving assumptions and inherently uncertain future events.
● Our audit procedures in the current year were
performed at the Brisbane head office and included site visits to stores and distribution centres in Australia and New Zealand to perform audit procedures over inventory. Our team included specialists in information technology, taxation, payroll and data and experts in valuations.
137S U P E R R E TA I L G R O U P L I M I T E D A N N U A L R E P O R T 2020137 S U P E R R E T A I L G R O U P L I M I T E D A N N U A L R E P O R T 2 0 2 0
Key audit matters Key audit matters are those matters that, in our professional judgement, were of most significance in our audit of the financial report for the current period. The key audit matters were addressed in the context of our audit of the financial report as a whole, and in forming our opinion thereon, and we do not provide a separate opinion on these matters. Further, any commentary on the outcomes of a particular audit procedure is made in that context. We communicated the key audit matters to the Audit and Risk Committee.
Key audit matter How our audit addressed the key audit matter
Carrying value of Goodwill and Brand names (Refer to note 10) Goodwill:$526.6m, Brand names: $253.3m
Goodwill is allocated to the Group’s cash generating units (CGUs) which are consistent with the Group’s segments. During the annual review for impairment, the Group determined the recoverable amount for each CGU using discounted cash flow valuation models which relied on significant assumptions and estimates of future trading performance. The carrying value of goodwill and brand names was a key audit matter due to its size and the judgements involved in estimating the cash flow forecasts, including consideration of the assumed economic recovery in relation to COVID-19 applied to the forecasts.
Amongst other procedures, we assessed the valuation models by:
● Developed an understanding of and evaluated the Group’s processes and controls relating to annual impairment tests of the CGUs in light of the requirements of Australian Accounting Standards.
● Compared actual results with historical forecasts to assess the reliability of the forecasts used in the cash flow models.
● Evaluated how the Group has considered the ongoing impact of COVID-19 in the future cash flow forecasts.
● Together with PwC valuation experts, assessed the valuation methodology and mathematical accuracy of the models and compared the discount rate and growth rate assumptions to historical company data and market observable inputs.
● Evaluated the Group’s assessment that the indefinite life assumption for brand names remains appropriate at period end.
● Evaluated the adequacy of the disclosures made in the financial report, in light of the requirements of Australian Accounting Standards.

138 S U P E R R E TA I L G R O U P L I M I T E D A N N U A L R E P O R T 2020 S U P E R R E T A I L G R O U P L I M I T E D A N N U A L R E P O R T 2 0 2 0 138
Provision for underpayment of employees (Refer to note 15 and 31) Provision for underpayment : $32.4m
The provision for employee underpayments was a key audit matter due to its size, nature and the complexity of the model used to estimate the provision. Judgement was required to determine relevant assumptions, such as the number of incurred overtime hours, allowance payments and assumed work patterns.
In assessing the provision, our procedures included the following:
● Developed an understanding of the basis for the Group’s estimate of the provision and the nature of the estimation uncertainty at balance date.
● Together with PwC data and payroll specialists, we evaluated the Group’s methodologies and assumptions used to determine the underpayment provision, including developing an understanding of the Group’s interpretation of the General Retail Industry Award (GRIA) and relevant Enterprise Agreements applied.
● Reperformed the calculation of the underpayment provision, and agreed inputs used to source data for a sample of employees.
● Evaluated the Group’s accounting treatment and the adequacy of the disclosures in light of the requirements of Australian Accounting Standards.
Implementation of new lease accounting standard (Refer to note 11 and 34) Right-of-use Assets: $848.0m, Lease Liabilities : $939.3m
The Group’s adoption of Australian Accounting Standard AASB 16 Leases (AASB 16) was a key audit matter due to the significant impact transition to the new standard had on the financial report, including the judgement required when determining lease option renewals.
We performed the following audit procedures, amongst others:
● Assessed the Group’s new accounting policies against the requirements of AASB 16.
● Evaluated the adequacy of the disclosures in the financial statements, in light of the requirements of Australian Accounting Standards.
For a sample of lease agreements, we: ● Evaluated the lease calculations against the
terms of the lease agreement and the requirements of Australian Accounting Standards.
● Tested the mathematical accuracy of the lease calculations.
● Evaluated the evidence relating to variable lease payments and option renewals.
139 S U P E R R E T A I L G R O U P L I M I T E D A N N U A L R E P O R T 2 0 2 0
Inventory valuation (Refer to note 8) Inventories : $502.4m
The valuation of inventory was a key audit matter because of the judgements involved in:
● Estimating the stock loss provision required at year end due to the performance of cycle counts throughout the year.
● Estimating the net realisable value (NRV) of inventory.
● Capitalising attributable overheads and rebates to inventory.
We performed the following audit procedures, amongst others:
● Assessed the Group’s accounting policies against the requirements of Australian Accounting Standards.
● For a sample of inventory items we agreed movements between stocktake date and year end to supporting documentation.
● We tested the mathematical accuracy of the stock loss provision.
● We assessed the NRV provision, using data analysis techniques to compare the carrying value to the most recent sales price across the inventory balance.
● We evaluated the Group's methodology for capitalising overheads and rebates to inventory, as well as considering the nature of a sample of the costs capitalised during the year, in light of the requirements of the Australian Accounting Standards.
Other information The directors are responsible for the other information. The other information comprises the information included in the annual report for the year ended 27 June 2020, but does not include the financial report and our auditor’s report thereon. Prior to the date of this auditor's report, the other information we obtained included the Director’s report and the Shareholder information. We expect the remaining other information to be made available to us after the date of this auditor's report.
Our opinion on the financial report does not cover the other information and we do not and will not express an opinion or any form of assurance conclusion thereon.
In connection with our audit of the financial report, our responsibility is to read the other information and, in doing so, consider whether the other information is materially inconsistent with the financial report or our knowledge obtained in the audit, or otherwise appears to be materially misstated.
If, based on the work we have performed on the other information that we obtained prior to the date of this auditor’s report, we conclude that there is a material misstatement of this other information, we are required to report that fact. We have nothing to report in this regard.
When we read the other information not yet received, if we conclude that there is a material misstatement therein, we are required to communicate the matter to the directors and use our professional judgement to determine the appropriate action to take.
139S U P E R R E TA I L G R O U P L I M I T E D A N N U A L R E P O R T 2020S U P E R R E T A I L G R O U P L I M I T E D A N N U A L R E P O R T 2 0 2 0 138
Provision for underpayment of employees (Refer to note 15 and 31) Provision for underpayment : $32.4m
The provision for employee underpayments was a key audit matter due to its size, nature and the complexity of the model used to estimate the provision. Judgement was required to determine relevant assumptions, such as the number of incurred overtime hours, allowance payments and assumed work patterns.
In assessing the provision, our procedures included the following:
● Developed an understanding of the basis for the Group’s estimate of the provision and the nature of the estimation uncertainty at balance date.
● Together with PwC data and payroll specialists, we evaluated the Group’s methodologies and assumptions used to determine the underpayment provision, including developing an understanding of the Group’s interpretation of the General Retail Industry Award (GRIA) and relevant Enterprise Agreements applied.
● Reperformed the calculation of the underpayment provision, and agreed inputs used to source data for a sample of employees.
● Evaluated the Group’s accounting treatment and the adequacy of the disclosures in light of the requirements of Australian Accounting Standards.
Implementation of new lease accounting standard (Refer to note 11 and 34) Right-of-use Assets: $848.0m, Lease Liabilities : $939.3m
The Group’s adoption of Australian Accounting Standard AASB 16 Leases (AASB 16) was a key audit matter due to the significant impact transition to the new standard had on the financial report, including the judgement required when determining lease option renewals.
We performed the following audit procedures, amongst others:
● Assessed the Group’s new accounting policies against the requirements of AASB 16.
● Evaluated the adequacy of the disclosures in the financial statements, in light of the requirements of Australian Accounting Standards.
For a sample of lease agreements, we: ● Evaluated the lease calculations against the
terms of the lease agreement and the requirements of Australian Accounting Standards.
● Tested the mathematical accuracy of the lease calculations.
● Evaluated the evidence relating to variable lease payments and option renewals.
139 S U P E R R E T A I L G R O U P L I M I T E D A N N U A L R E P O R T 2 0 2 0
Inventory valuation (Refer to note 8) Inventories : $502.4m
The valuation of inventory was a key audit matter because of the judgements involved in:
● Estimating the stock loss provision required at year end due to the performance of cycle counts throughout the year.
● Estimating the net realisable value (NRV) of inventory.
● Capitalising attributable overheads and rebates to inventory.
We performed the following audit procedures, amongst others:
● Assessed the Group’s accounting policies against the requirements of Australian Accounting Standards.
● For a sample of inventory items we agreed movements between stocktake date and year end to supporting documentation.
● We tested the mathematical accuracy of the stock loss provision.
● We assessed the NRV provision, using data analysis techniques to compare the carrying value to the most recent sales price across the inventory balance.
● We evaluated the Group's methodology for capitalising overheads and rebates to inventory, as well as considering the nature of a sample of the costs capitalised during the year, in light of the requirements of the Australian Accounting Standards.
Other information The directors are responsible for the other information. The other information comprises the information included in the annual report for the year ended 27 June 2020, but does not include the financial report and our auditor’s report thereon. Prior to the date of this auditor's report, the other information we obtained included the Director’s report and the Shareholder information. We expect the remaining other information to be made available to us after the date of this auditor's report.
Our opinion on the financial report does not cover the other information and we do not and will not express an opinion or any form of assurance conclusion thereon.
In connection with our audit of the financial report, our responsibility is to read the other information and, in doing so, consider whether the other information is materially inconsistent with the financial report or our knowledge obtained in the audit, or otherwise appears to be materially misstated.
If, based on the work we have performed on the other information that we obtained prior to the date of this auditor’s report, we conclude that there is a material misstatement of this other information, we are required to report that fact. We have nothing to report in this regard.
When we read the other information not yet received, if we conclude that there is a material misstatement therein, we are required to communicate the matter to the directors and use our professional judgement to determine the appropriate action to take.
140 S U P E R R E TA I L G R O U P L I M I T E D A N N U A L R E P O R T 2020 S U P E R R E T A I L G R O U P L I M I T E D A N N U A L R E P O R T 2 0 2 0 140
Responsibilities of the directors for the financial report The directors of the Company are responsible for the preparation of the financial report that gives a true and fair view in accordance with Australian Accounting Standards and the Corporations Act 2001 and for such internal control as the directors determine is necessary to enable the preparation of the financial report that gives a true and fair view and is free from material misstatement, whether due to fraud or error.
In preparing the financial report, the directors are responsible for assessing the ability of the Group to continue as a going concern, disclosing, as applicable, matters related to going concern and using the going concern basis of accounting unless the directors either intend to liquidate the Group or to cease operations, or have no realistic alternative but to do so.
Auditor’s responsibilities for the audit of the financial report Our objectives are to obtain reasonable assurance about whether the financial report as a whole is free from material misstatement, whether due to fraud or error, and to issue an auditor’s report that includes our opinion. Reasonable assurance is a high level of assurance, but is not a guarantee that an audit conducted in accordance with the Australian Auditing Standards will always detect a material misstatement when it exists. Misstatements can arise from fraud or error and are considered material if, individually or in the aggregate, they could reasonably be expected to influence the economic decisions of users taken on the basis of the financial report.
A further description of our responsibilities for the audit of the financial report is located at the Auditing and Assurance Standards Board website at: https://www.auasb.gov.au/admin/file/content102/c3/ar1_2020.pdf. This description forms part of our auditor's report.
141S U P E R R E TA I L G R O U P L I M I T E D A N N U A L R E P O R T 2020141 S U P E R R E T A I L G R O U P L I M I T E D A N N U A L R E P O R T 2 0 2 0
Report on the remuneration report
Our opinion on the remuneration report We have audited the remuneration report included in pages 50 to 78 of the directors’ report for the year ended 27 June 2020.
In our opinion, the remuneration report of Super Retail Group Limited for the year ended 27 June 2020 complies with section 300A of the Corporations Act 2001.
Responsibilities The directors of the Company are responsible for the preparation and presentation of the remuneration report in accordance with section 300A of the Corporations Act 2001. Our responsibility is to express an opinion on the remuneration report, based on our audit conducted in accordance with Australian Auditing Standards.
PricewaterhouseCooopers
Paddy Carney Brisbane Partner 24 August 2020

142 S U P E R R E TA I L G R O U P L I M I T E D A N N U A L R E P O R T 2020142 S U P E R R E T A I L G R O U P L I M I T E D A N N U A L R E P O R T 2 0 2 0
SHAREHOLDER INFORMATION For the period ended 27 June 2020
The shareholder information set out below was applicable as at 17 August 2020. Number of Shareholders There were 13,287 shareholders, holding 225,771,702 fully paid ordinary shares. A. Distribution of equity securities Analysis of numbers of equity security holders by size of holding:
Range Ordinary
Shareholders Percentage of
Shareholders Performance Rights
holders Percentage of Rights holders
1-1000 7,141 53.7% - - 1,001-5,000 4,911 37.0% 3 3.5% 5,001-10,000 782 5.9% 37 43.5% 10,001-100,000 413 3.1% 43 50.6% 100,001 and over 40 0.3% 2 2.4%
Total 13,287 100.0% 85 100.0% There were 624 holders of less than a marketable parcel of ordinary shares. B. Equity security holders The names of the twenty largest holders of quoted equity securities are listed below:
Name Ordinary shares
Number held Percentage of issued shares
SCA FT PTY LTD 64,657,627 28.64% HSBC CUSTODY NOMINEES (AUSTRALIA) LIMITED 50,974,372 22.58% J P MORGAN NOMINEES AUSTRALIA PTY LIMITED 28,209,347 12.49% CITICORP NOMINEES PTY LIMITED 17,129,021 7.59% NATIONAL NOMINEES LIMITED 13,023,731 5.77% BNP PARIBAS NOMS PTY LTD 5,147,706 2.28% BNP PARIBAS NOMINEES PTY LTD 4,496,989 1.99% CITICORP NOMINEES PTY LIMITED 2,782,614 1.23% SCCASP HOLDINGS PTY LTD 1,232,804 0.55% SANTOS L HELPER PTY LTD 904,246 0.40% MR KENNETH JOSEPH HALL 777,143 0.34% BUTTONWOOD NOMINEES PTY LTD 736,247 0.33% EQUITAS NOMINEES PTY LIMITED 706,997 0.31% EQUITAS NOMINEES PTY LIMITED 648,346 0.29% EQUITAS NOMINEES PTY LIMITED 625,298 0.28% EQUITAS NOMINEES PTY LIMITED 611,876 0.27% PACIFIC CUSTODIANS PTY LIMITED 549,475 0.24% AMP LIFE LIMITED 541,531 0.24% MR ROBERT EDWARD THORN 474,607 0.21% HSBC CUSTODY NOMINEES (AUSTRALIA) LIMITED - A/C 2 381,033 0.17% 194,611,010 86.20%
143S U P E R R E TA I L G R O U P L I M I T E D A N N U A L R E P O R T 2020S U P E R R E T A I L G R O U P L I M I T E D A N N U A L R E P O R T 2 0 2 0 143
SHAREHOLDER INFORMATION (continued) For the period ended 27 June 2020
C. Substantial shareholdings As at 17 August 2020, there are two substantial shareholders that the Company is aware of:
Name Ordinary shares
Number held Percentage of issued
shares Date of most
Recent notice
REGINALD ALLEN ROWE 65,890,431 29.18% 29/06/2020
UBS GROUP AG 11,295,902 5.02% 13/08/2020
D. Unquoted equity securities As at 24 August 2020, there were 1,663,059 unlisted performance rights, granted to 85 holders, over unissued ordinary shares in the Company. E. Voting rights The voting rights relating to each class of equity securities is as follows: a) Ordinary Shares On a show of hands at a General Meeting of the Company, every member present in person or by proxy shall have one vote and upon poll each person present in person or by proxy shall have one vote for each ordinary share held. b) Options and Performance Rights Performance Rights and Options do not have any voting rights. F. Market buy-back There is currently no on market buy-back.

144 S U P E R R E TA I L G R O U P L I M I T E D A N N U A L R E P O R T 2020
Corporate Directory
Name of Entity SUPER RETAIL GROUP LIMITED
ABN 81 108 676 204
Company Secretary Ms Rebecca Farrell
Principal Registered Office 6 Coulthards Avenue STRATHPINE QLD 4500 Australia Telephone: +61 7 3482 7900 Facsimile: +61 7 3205 8522
Website Address www.superretailgroup.com.au
Securities Exchange Super Retail Group Limited (SUL) shares are quoted on the Australian Securities Exchange
Share Registry Link Market Services Level 12, 680 George Street SYDNEY NSW 2000 Australia Telephone: 1300 554 474 +61 2 8280 7100 www.linkmarketservices.com.au
Auditors PricewaterhouseCoopers
145S U P E R R E TA I L G R O U P L I M I T E D A N N U A L R E P O R T 2020
Key dates for shareholders(1)
(1) If there are any changes to these dates, the Australian Securities Exchange will be notified accordingly.
(2) The 2020 Annual General Meeting of the Shareholders of Super Retail Group Limited will be held virtually. Further details are available on the ASX and our website at:
https://www.superretailgroup.com.au/investor-centre/AGM2020.aspx
Annual General Meeting (2)
28 October 2020
Full Year DRP Election Date
3 September 2020
Interim Dividend Ex-Date
25 February 2021
Interim Dividend Payment Date
2 April 2021
Final Dividend Ex-Date
1 September 2020
Full Year Dividend Payment Date
2 October 2020
Interim Dividend Record Date
26 February 2021
Final Dividend Record Date
2 September 2020
Interim Results Announcement
17 February 2021
Interim DRP Election Date
1 March 2021
Financial Calendar

146 S U P E R R E TA I L G R O U P L I M I T E D A N N U A L R E P O R T 2020
Notes
147S U P E R R E TA I L G R O U P L I M I T E D A N N U A L R E P O R T 2020
I N S P I R I N G Y O U T O L I V E Y O U R P A S S I O N

ABN: 81 108 676 204www.superretailgroup.com.au