
Super Decisions Software GuideWhether creating or editing a cluster, the same dialog box appears for...
43
Super Decisions Software Guide William J. L. Adams and Rozann Saaty
Transcript of Super Decisions Software GuideWhether creating or editing a cluster, the same dialog box appears for...

Super Decisions Software Guide
William J. L. Adams and Rozann Saaty

Copyright c© 1999/2003 Thomas L. SaatyThe software for the Analytic Network Process for decision making with dependence andfeedback was developed by William Adams in 1999-2003.

i
Short Contents
1 Introduction . . . . . . . . . . . . . . . . . . . . . . . . . . . . . . . . . . . . . . . . . 1
2 Building Models . . . . . . . . . . . . . . . . . . . . . . . . . . . . . . . . . . . . . . 2
3 Formulas . . . . . . . . . . . . . . . . . . . . . . . . . . . . . . . . . . . . . . . . . . . 16
4 Making Judgments/Assessments . . . . . . . . . . . . . . . . . . . . . . . . 20
5 Supermatrix Computations . . . . . . . . . . . . . . . . . . . . . . . . . . . . 25
6 Synthesizing for Results and Sensitivity . . . . . . . . . . . . . . . . . . 28
7 printing . . . . . . . . . . . . . . . . . . . . . . . . . . . . . . . . . . . . . . . . . . . . 32
8 Other Important Features . . . . . . . . . . . . . . . . . . . . . . . . . . . . . 33
9 Sample Models . . . . . . . . . . . . . . . . . . . . . . . . . . . . . . . . . . . . . . 34
Chapter 1: Introduction 1
1 Introduction
The Super Decisions software implements the Analytic Network Process (ANP) for decisionmaking with dependence and feedback, a mathematical theory for decision making devel-oped by Thomas L. Saaty. It is an extension of his Analytic Hierarchy Process (AHP) fordecision making which involves breaking down a problem into its decision elements, arrang-ing them in a hierarchical structure, making judgments on the relative importance of pairsof elements and synthesizing the results. With the AHP the process is top-down. Withthe ANP it is recognized that there is feedback between the elements in different levels ofthe hierarchy and also between elements in the same level, so the decision elements areorganized into networks of clusters and nodes. The ANP was briefly introduced in Saaty’sfirst book on decision making, The Analytic Hierarchy Process. There is now a book on theAnalytic Network Process (new edition 2001) by Saaty, The Analytic Network Process: De-cision Making with Dependence and Feedback. It is available from RWS Publications, 4922Ellsworth Avenue, Pittsburgh, PA 15213; Telephone: 412-414-5984; Fax: 412-681-4510.
The Super Decisions software is a simple easy-to-use package for constructing decisionmodels with dependence and feedback and computing results using the supermatrices of theAnalytic Network Process. This software was designed to run in many different computingenvironments from Windows 3.1/95/98/NT to Macintosh to Unix systems such as Linux,SGI’s, Sun Systems, etc. There is also a Web version.

Chapter 2: Building Models 2
2 Building Models
Models range in complexity from a single network to two-layer networks to multi-levelcomplex networks. Each network in a model is in a separate window. Model-buildingalways starts with creating a simple network of clusters, elements within clusters and makinglinks between the elements (which in turn causes a link to appear visually connecting theclusters).
2.1 Simple Networks
By a simple network, we mean any network composed of clusters containing elements (ornodes), the links between the nodes, the links between the clusters that result from the linksbetween the nodes, and perhaps the assessments/comparisons. A model that is comprisedof a simple network has only one window. This chapter gives the steps for creating, editing,making comparisons and calculating results in a simple network. An example of a simplenetwork is the Hamburger model in the sample models.
Hint: To load a sample model go the Help command on the main menu and click theSample Models sub-command to see a list of available sample models. Click on the one youwant to load it.
A simple network contains clusters, nodes, and connections or links. When a parent nodeis linked to nodes in another cluster, these are known as its children nodes. The childrennodes are to be compared with respect to the parent node. When a parent node is linked tochildren nodes in another cluster, a line or link appears between the clusters with an arrowon it from the cluster containing the parent node. When the parent node and children arein the same cluster there will be a self-loop on that cluster.
When the Super Decisions program starts a blank window appears. You can createclusters and their nodes directly in this window using the Design command. If you selectthe File New command, and then select Simple Network Template, the same thing happenswith a blank window appearing where you will create a network.
A simple network can be turned into a two-layer model by right-clicking on a node in oneof its clusters then selecting the Make/show subnetwork command; or, equivalently, use theDesign command on the main menu. A new window will appear and you can then createclusters and nodes in it in the usual way. A three-level model can be created by selectingone of these nodes and following the same process. There is no limit to the number of levelsthat can be created.
2.1.1 Creating Clusters
The first step in constructing a simple network is to create at least one cluster and then tocreate nodes within it. Newly created clusters look like Windows. Nodes are then createdwithin the cluster, appearing as small text boxes within the cluster.
Use the Design command on the main menu to add and remove clusters and nodes. Tochange the size of a cluster window click on the button on the lower right-hand corner anddrag. Clusters can also appear as icons. To select the icon you want associated with thecluster, use the Design, Cluster, Edit command and select the change icon button from thecluster editing window. Or, alternately, you may right click on the cluster or left click on

Chapter 2: Building Models 3
the minus sign at the top left corner of the window and select Edit cluster from the dropdown menu that appears to reach the cluster editing window.
To switch from a cluster window to an iconified view, double-click on the cluster window.To switch back double click on the icon.
You must create at least one cluster in each simple network with the name "alternatives"or some variation such as "1alternatives" to contain the nodes representing the alternativesof choice. The final priorities of these nodes are used in the synthesis computations. Theorder of clusters in the supermatrix is alphabetical. To control the order preface the clusternames with 1,2,3,... as, for example, 1Actors, 2Environmental forces, 3Economic, and soon. It is usually helpful to make the cluster of the alternatives either first or last so it iseasy to find in the supermatrix. A Selected Cluster had its title bar slightly darker than themain background of the cluster window. To de-select all clusters click on the backgroundof the network window.
Cluster Menus:
Design Cluster commands
New, Edit and Remove commands may be accessed from the main menu.Other Cluster commands
Right-click on the background of a cluster window or left-click on the top left corner ofa cluster window to drop down the cluster menu containing additional commands:
Edit cluster - brings up the cluster properties dialog box.Remove cluster - deletes the cluster, connections and comparisons related to it.Iconify/Expand cluster - a toggle that will collapse a cluster into an incon (if no icon has
been chosen it will collapse to its name only) or, alternately, expand from an icon or namebox into the full cluster view showing the nodes in the cluster.
Cluster comparisons - starts the process of cluster comparisons from the currently se-lected cluster with it as parent, and clusters it is connected to as children.
Create node in cluster - brings up a new node dialog box for creating a node. Shortcut:Pressing the n key with your cursor located over the background of a cluster will also bringup the new node dialog box.
Organize Nodes - allows you to organize the nodes in a cluster vertically, horizontally,or rectangularly. The organization is in alphabetical order. This command is handy forfinding nodes that may have scrolled offscreen.
Creating a Cluster
You can edit clusters and nodes using your mouse or equivalent keyboard shortcut keys.Here are the different ways you can create a cluster. All of these commands will bring upthe same new cluster dialog box. To change the default fonts and colors for clusters, selectthe File Configure command from the main menu. Pressing the <Enter> key after typingthe name of a node or its description will create another cluster. Select the Cancel buttonwhen you want to stop creating clusters. See [ValCluster], page 4.
Keyboard The command is the key N (this must be capitalized). Press Shift and n withyour mouse located where you want to create the cluster.
Mouse Press Shift and Left-Mouse-Button where you want the cluster to be created.
Chapter 2: Building Models 4
Menu Choose the Design menu. From that menu choose the Cluster submenu. Finallychoose the New menu item from the Cluster submenu.
Editing a Cluster
There are several ways to start the editing process of a cluster. All of these commands willbring up a dialog to change that cluster’s values. See [ValCluster], page 4.
Keyboard Your mouse must be over the cluster you are going to edit. With your mouseover that cluster, press the Shift key and the e key for a capital E to bring upthe editing menu for that cluster.
Menu CommandChoose the Design menu. From that menu choose the Cluster submenu. Finallychoose the Edit menu item from the Cluster submenu. It will bring up a dialogbox asking you to select the cluster you want to edit.
Popup Menu CommandWith your mouse on the background in the cluster you wish to edit (but notover any node in that cluster), click the right mouse button. This will bring upa popup menu. Choose the Edit menu item.
Removing a Cluster
There are several ways to remove a cluster from a network. All of these commands willbring up a dialog box, asking you if you really want to remove that cluster. Here are themethods one can use to remove a cluster.
Keyboard Your mouse must be over the cluster you wish to remove (and not over any nodein that cluster). With your mouse over the background of the cluster window,press the Shift and R keys simultaneously.
Menu CommandChoose the Design menu. From that menu choose the Cluster submenu. Finallychoose the Remove menu item from the Cluster submenu. It will bring up adialog box asking for the cluster to be removed.
Popup Menu CommandWith your mouse over the cluster you wish to edit (but not over any node inthat cluster), click the right mouse button. This will bring up a popup menu.Choose the Remove menu item.
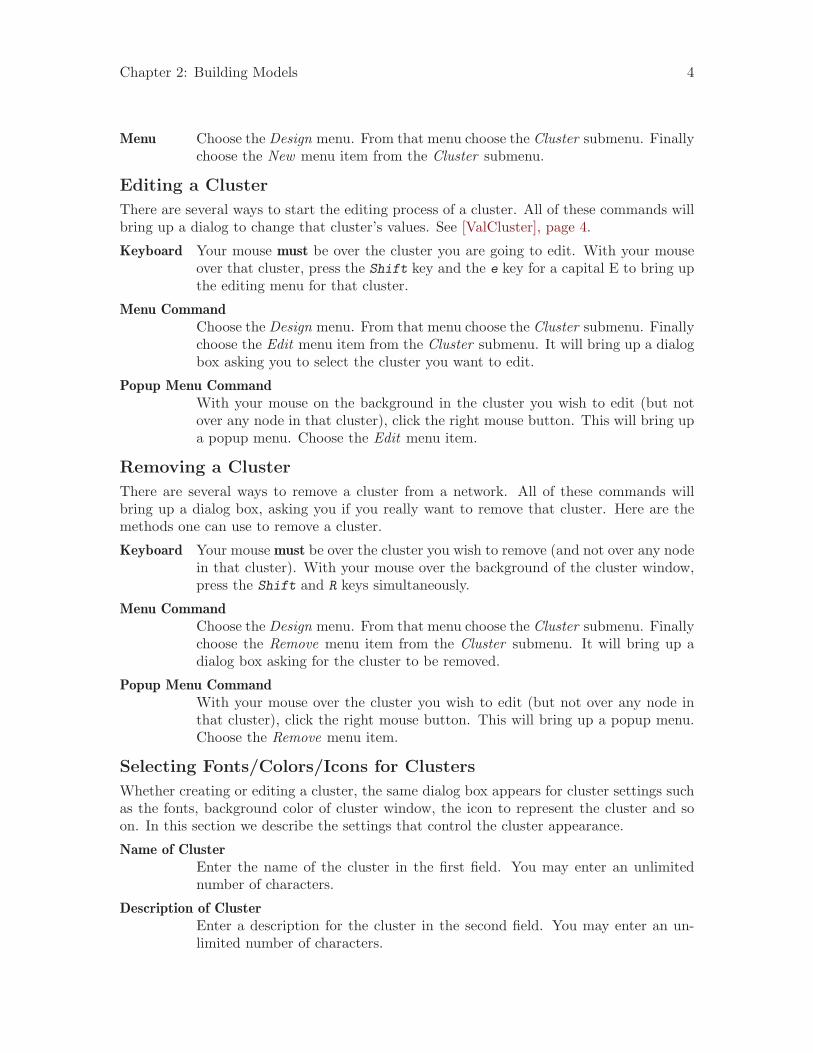
Selecting Fonts/Colors/Icons for Clusters
Whether creating or editing a cluster, the same dialog box appears for cluster settings suchas the fonts, background color of cluster window, the icon to represent the cluster and soon. In this section we describe the settings that control the cluster appearance.
Name of ClusterEnter the name of the cluster in the first field. You may enter an unlimitednumber of characters.
Description of ClusterEnter a description for the cluster in the second field. You may enter an un-limited number of characters.

Chapter 2: Building Models 5
Selecting font for titleSelect the type of font, size of font and style of font(italics, bold, etc.) for thecluster window title using the three buttons here.
Selecting font for iconSelect the type of font, size of font and style of font(italics, bold, etc.) for thecluster icon title using the three buttons here.
Changing IconClick the Change Icon button with your mouse and select a new icon by doubleclicking on the one you want from among those that appear in the Icon Chooserdialog box. You can also browse for and select fonts from a different directorythan the default one. The selected new icon will appear in the Editing dialogbox. Save to exit the dialog. To switch back and forth from the icon to thewindow double click on the icon or the background of the cluster window.
Changing Window ColorClick the Change Color button with your mouse and select a new color bydouble clicking on the one you want from the Color dialog box that appears.Select the OK button to effect the color change.
Saving ChangesClick the Save button to permanently change to the creating/editing selectionsyou have made for this cluster window. If the dialog box disappears before youhave had a chance to save the changes, it may have morphed into a minimizedicon on the Windows menu bar at the bottom of the screen. Double-click on itto open it again and then click the Save button.
2.2 Creating Nodes within Clusters
After you create the clusters you need to create nodes in them and then connect the nodesbetween clusters or within a single cluster. This section explains how to add, edit, removeand connect nodes.
Creating Nodes
You can edit clusters and nodes in the Create/Edit Node dialog box using your mouse orequivalent keyboard shortcut keys. The Create Node and Edit Node dialog boxes allow oneto set the node’s values, such as font size and type, select a new icon, and select a color forthe node name text box. Select the "Create another" button at the bottom of the dialogbox to continue creating new nodes.
Keyboard Press Alt and n with your mouse located over the background of the clusterwindow in which you want to create the node to bring up the New Node Dialogbox where node values are set.
Mouse Press Shift and Left-Mouse-Button in the cluster window where you wantthe node to be created. The new node will be placed where the mouse pointerwas.
Menu Choose the Design menu. From that menu choose the Node submenu. Finallychoose the New menu item and when the list of possible clusters appears selectthe cluster where you want the new node.

Chapter 2: Building Models 6
Editing Nodes
There are several ways to start the editing process of a node. All of these commands willbring up the Creating/Editing Node dialog box to change that node’s values.
Keyboard Your mouse must be over the node you are going to edit. With your mouseover that cluster, press the Alt key and the e key to bring up the editing menufor that node.
Menu CommandChoose the Design menu. From that menu choose the Node submenu. Finallychoose the Edit menu item from the Node submenu. It will bring up a dialogbox asking you to select the cluster and node you want to edit.
Popup Menu CommandWith your mouse on the background in the node you wish to edit, click theright mouse button. This will bring up a popup menu. Choose the Edit nodemenu item.
Removing Nodes
There are several ways to remove a node from a network. All of these commands will bringup a dialog box, asking if you really want to remove that node. Here are the methods onecan use to remove a node.
Keyboard Your mouse must be over the node you wish to remove. With your mouse overthe node, press the Alt key simultaneously with the r key and confirm that youwish to remove the node.
Menu CommandChoose the Design menu. From that menu choose the Node submenu. Finallychoose the Remove menu item from the Node submenu. It will bring up a dialogbox asking you to select the cluster and the node in that cluster to be removed.
Popup Menu CommandWith your mouse over the node you wish to edit, click the right mouse button.This will bring up a popup menu. Choose the Remove node menu item.
Selecting fonts/colors/icons for Nodes
When you are creating and when you are editing a node, you use the same dialog box forsetting values. In this section we describe the various inputs this dialog expects, and whatthey are used for.
Name of NodeEnter the name of the node in the first field. You may enter an unlimitednumber of characters.
Description of NodeEnter a description for the node in the second field. You may enter an unlimitednumber of characters. Carriage returns are not recognized.
Main Font selectionSelect the type of font, size of font and style of font(italics, bold, etc.) for thenode text box title using the three buttons here.

Chapter 2: Building Models 7
Icon Font selectionSelect the type of font, size of font and style of font(italics, bold, etc.) for thenode icon title using the three buttons here.
Changing IconClick the Change Icon button with your mouse and select a new icon by doubleclicking on the one you want from among those that appear in the Icon Chooserdialog box. You can also browse for and select fonts from a different directorythan the default one. The selected new icon will appear in the Editing dialogbox. Save to exit the dialog. To switch back and forth from the icon to thewindow double click on the icon or the node text box window.
Changing Node Text Box ColorClick the Change Color button with your mouse and select a new color bydouble clicking on the one you want from the Color dialog box that appears.Select the OK button to effect the color change.
Saving ChangesClick the Save button to permanently effect the creating/editing selections youhave made for this node. If the dialog box disappears before you have a chanceto save your changes, it has probably been minimized and is now located onthe bottom Window Menu bar. Double-click on it to open it up again and clickon the Save button.
2.3 Making Connections between Nodes
After you have created clusters and nodes in your network, they must be connected. Con-nections in a Super Decisions model are determined by asking, for a particular node, whatother nodes need to be compared with respect to it. A comparison group is formed havingthat node as the parent node and the nodes to which it is linked as children. The childrennodes of such a comparison group may all be in the same cluster as the parent (inner de-pendence) or a different cluster (outer dependence). A node may serve as a parent in morethan one comparison group. Connections may only be created between nodes. Clustersbecome connected as a consequence of node connections.
Cluster ConnectionsWhen a parent node has children nodes in another cluster, then those twoclusters are automatically connected and a line appears going from the parentnode’s cluster to the children nodes’ cluster. When the children nodes are in thesame cluster as the parent node, then that cluster becomes connected to itself.This is called inner dependence. To get a line going the opposite direction, youmust connect a parent node in the second cluster to some children in the firstcluster. There must be an alternatives cluster in every lowest level, or terminal,sub-network.
Node ConnectionsTo form a comparison group select a node, the node that you wish to become theparent node, right click on it to drop down a menu, select the "Node connexionsfrom" command and follow the instructions to connect to the desired childrennodes in another cluster (or in the same cluster). The children nodes must be
Chapter 2: Building Models 8
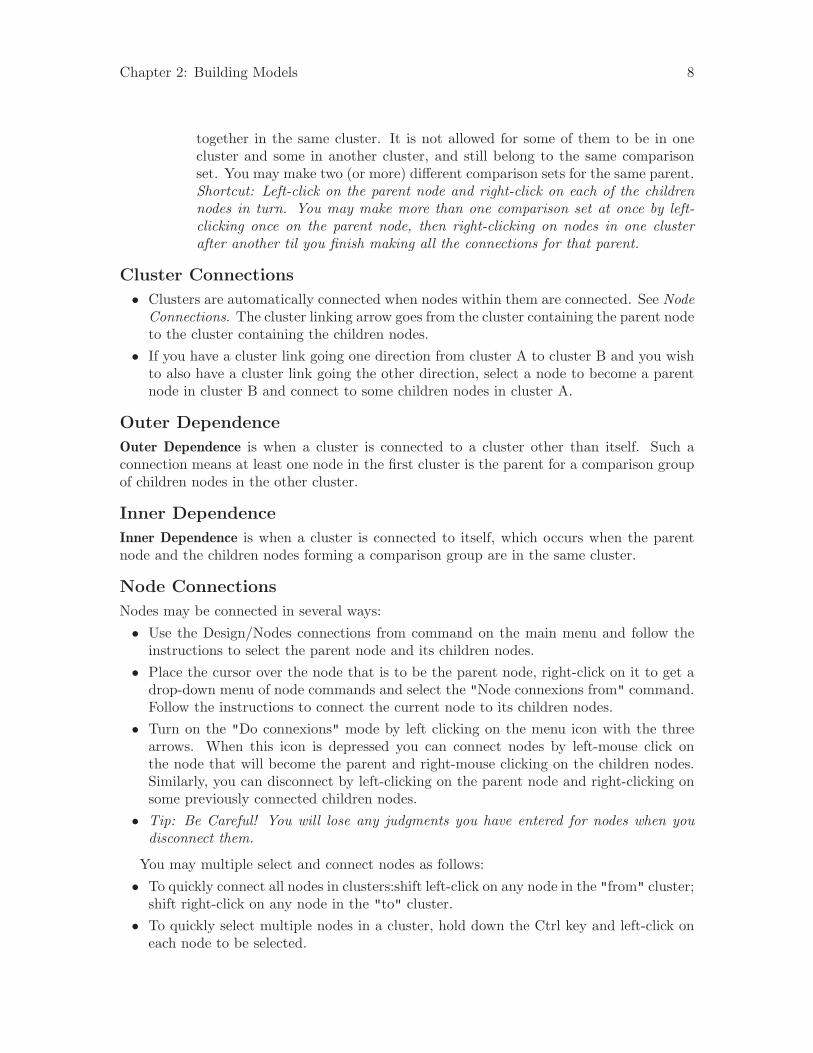
together in the same cluster. It is not allowed for some of them to be in onecluster and some in another cluster, and still belong to the same comparisonset. You may make two (or more) different comparison sets for the same parent.Shortcut: Left-click on the parent node and right-click on each of the childrennodes in turn. You may make more than one comparison set at once by left-clicking once on the parent node, then right-clicking on nodes in one clusterafter another til you finish making all the connections for that parent.
Cluster Connections
• Clusters are automatically connected when nodes within them are connected. See NodeConnections. The cluster linking arrow goes from the cluster containing the parent nodeto the cluster containing the children nodes.
• If you have a cluster link going one direction from cluster A to cluster B and you wishto also have a cluster link going the other direction, select a node to become a parentnode in cluster B and connect to some children nodes in cluster A.
Outer Dependence
Outer Dependence is when a cluster is connected to a cluster other than itself. Such aconnection means at least one node in the first cluster is the parent for a comparison groupof children nodes in the other cluster.
Inner Dependence
Inner Dependence is when a cluster is connected to itself, which occurs when the parentnode and the children nodes forming a comparison group are in the same cluster.
Node Connections
Nodes may be connected in several ways:• Use the Design/Nodes connections from command on the main menu and follow the
instructions to select the parent node and its children nodes.• Place the cursor over the node that is to be the parent node, right-click on it to get a
drop-down menu of node commands and select the "Node connexions from" command.Follow the instructions to connect the current node to its children nodes.
• Turn on the "Do connexions" mode by left clicking on the menu icon with the threearrows. When this icon is depressed you can connect nodes by left-mouse click onthe node that will become the parent and right-mouse clicking on the children nodes.Similarly, you can disconnect by left-clicking on the parent node and right-clicking onsome previously connected children nodes.
• Tip: Be Careful! You will lose any judgments you have entered for nodes when youdisconnect them.
You may multiple select and connect nodes as follows:• To quickly connect all nodes in clusters:shift left-click on any node in the "from" cluster;
shift right-click on any node in the "to" cluster.• To quickly select multiple nodes in a cluster, hold down the Ctrl key and left-click on
each node to be selected.

Chapter 2: Building Models 9
• Tip: Do not make spurious links where you do not plan to make judgments; the impliedequal judgments that will be input as a result will affect your answer in unintended ways.
2.4 Rating networks
The Design command on the main menu is used to create or remove a Ratings Windowattached to the current network. Networks with Ratings windows attached have the wordRatings on the title bar.
An Example
——————-For example, a network to evaluate employees might have two nodes under which the
alternatives (the people) are to be rated. They are leadership and years of experience.These categories are established for Leadership: excellent, above average, average, belowaverage, and poor. These categories are established for Years of Experience: hi, medium,low.
The categories for Leadership are pairwise compared to establish priorities for excellent,above average, etc. Then those for Years of Experience are pairwise compared to establishpriorities for hi, medium, and low. Then each person (the people are the alternatives ofthe decision) is rated by being assigned a category under each node, for example, the firstperson gets average for Leadership and hi for Years of Experience; and the second persongets excellent for Leadership and low for Years of Experience. This rating process leads topriorities for the alternatives and replaces direct pairwise comparison of the people underLeadership and Years of Experience.
A "multiply and add" process across the rows in the Ratings Window gives the total foreach row. That total is the answer. It is the performance number for that alternative.
——————–The Commands to start or open a Ratings Window
The command below will cause a Ratings window to appear that will be associated withthe current network. If one has already been created it will open up. You must selectthe nodes from the network with respect to which the alternatives will be evaluated inthe Ratings window. These are called the criteria. Next create rating categories for eachof these criteria, prioritize the categories, and finally enter the alternatives. When this isfinished the structure is done and you must perform the actual assessments by rating eachalternative under each "criterion" node. To see the results of your work select Calculationsin the Ratings window. Close the Ratings window to return to the network. To reopen ituse the Design Ratings command again. The alternatives will not appear in the network.To see the results within the network for the alternatives use the Synthesize command.These priorities are passed up to the next higher network, if there is one, and processed asusual.
Design, RatingsorDesign, Remove RatingsCommands in the Ratings Window
The Edit command is used to select criteria from the model that will then appear ascolumn headings in the Ratings window, or to add alternatives.
Chapter 2: Building Models 10
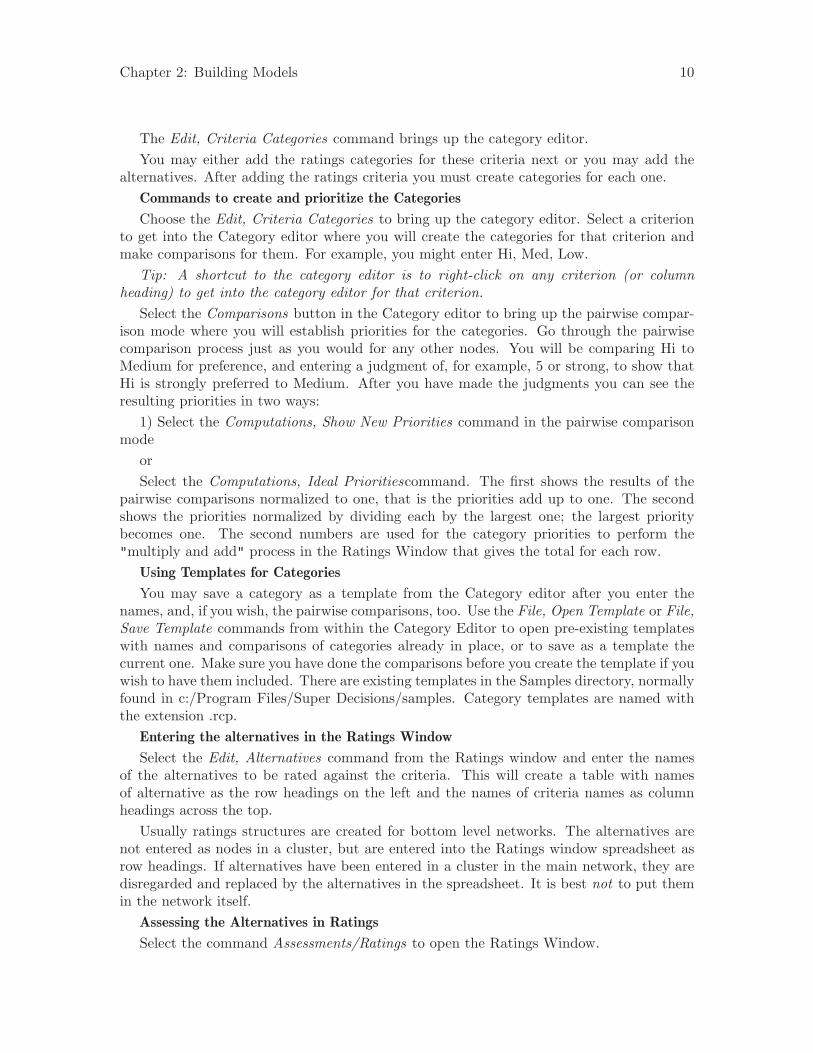
The Edit, Criteria Categories command brings up the category editor.You may either add the ratings categories for these criteria next or you may add the
alternatives. After adding the ratings criteria you must create categories for each one.Commands to create and prioritize the Categories
Choose the Edit, Criteria Categories to bring up the category editor. Select a criterionto get into the Category editor where you will create the categories for that criterion andmake comparisons for them. For example, you might enter Hi, Med, Low.
Tip: A shortcut to the category editor is to right-click on any criterion (or columnheading) to get into the category editor for that criterion.
Select the Comparisons button in the Category editor to bring up the pairwise compar-ison mode where you will establish priorities for the categories. Go through the pairwisecomparison process just as you would for any other nodes. You will be comparing Hi toMedium for preference, and entering a judgment of, for example, 5 or strong, to show thatHi is strongly preferred to Medium. After you have made the judgments you can see theresulting priorities in two ways:
1) Select the Computations, Show New Priorities command in the pairwise comparisonmode
orSelect the Computations, Ideal Prioritiescommand. The first shows the results of the
pairwise comparisons normalized to one, that is the priorities add up to one. The secondshows the priorities normalized by dividing each by the largest one; the largest prioritybecomes one. The second numbers are used for the category priorities to perform the"multiply and add" process in the Ratings Window that gives the total for each row.
Using Templates for Categories
You may save a category as a template from the Category editor after you enter thenames, and, if you wish, the pairwise comparisons, too. Use the File, Open Template or File,Save Template commands from within the Category Editor to open pre-existing templateswith names and comparisons of categories already in place, or to save as a template thecurrent one. Make sure you have done the comparisons before you create the template if youwish to have them included. There are existing templates in the Samples directory, normallyfound in c:/Program Files/Super Decisions/samples. Category templates are named withthe extension .rcp.
Entering the alternatives in the Ratings Window
Select the Edit, Alternatives command from the Ratings window and enter the namesof the alternatives to be rated against the criteria. This will create a table with namesof alternative as the row headings on the left and the names of criteria names as columnheadings across the top.
Usually ratings structures are created for bottom level networks. The alternatives arenot entered as nodes in a cluster, but are entered into the Ratings window spreadsheet asrow headings. If alternatives have been entered in a cluster in the main network, they aredisregarded and replaced by the alternatives in the spreadsheet. It is best not to put themin the network itself.
Assessing the Alternatives in Ratings
Select the command Assessments/Ratings to open the Ratings Window.
Chapter 2: Building Models 11
Left-click on a cell in Ratings to get a list of the categories for the criterion listed at thetop of the column. Left-click on the category that best represents the assessment for thealternative at the left of the row.
The score for an alternative is computed by multiplying the idealized priority of theselected category times the limiting priority for the criterion obtained in the network foreach cell and summing across the row.
The Calculations command in Ratings
To show the results in ratings select the Calculations command on the Ratings windowmenu.
Priorities gives the scores normalized by dividing by the total of all the alternatives’scores.
Totals gives the scores without normalizingColumn Priorities shows the priorities of the column headings, the criteria.Matrix Priorities shows the numbers in each cell and the column priorities. These
numbers can be blocked and copied into a spreadsheet. You may first need to expand thewindow so that the numbers line up right.
2.5 Subnetworks
Nodes in any network may have subnetworks attached to them. Such nodes are calledcontrol nodes and are identified by having the word Subnet in red at the bottom of thenode . A subnetwork is a simple network made up of clusters, elements, connections, andcomparisons just as simple networks are. Each subnetwork is in its own separate windowwith the name of its control node in the network "above" on its title bar.
The window containing the top network in a Super Decisions model is titled the SuperDecisions Main Window. Super Decisions models must have a main network and may havesubnetworks, sub-subnetworks and sub-sub-sub... networks. There can be any number oflevels of subnetworks. However, the usual model is composed of three levels:
1)The top-level or Main network contains the Benefits, Opportunities, Costs and Risksnodes (often called the BOCR nodes).
2)Attached to each of the BOCR nodes is a subnetwork containing control criteria nodes.Not every node in the subnetwork is a control criterion node - often only those that havehigh priorities are chosen to become control nodes.
3)The bottom level consists of subnetworks attached to these control criteria. Suchbottom level networks are often referred to as decision networks because they must have acluster containing nodes that are the alternatives of the decision as well as other clusters.
To Create a Subnetwork: Right-click on the node that will become the control node andselect the command Make/show subnetwork. This will bring up a new window where youwill build the subnetwork.
Hint: You may open an existing network in the new subnet window. Sometimes subnet-works have the same or very similar structures, so it may be useful to save a "template" ofsuch a network and open it in multiple subnetworks, then make any changes that may beneeded. Such a template must be a single network. Be sure to save your entire model after"opening" such a template. The original network model that served as a template will stillbe there unchanged.

Chapter 2: Building Models 12
To Show an Existing Subnetwork: To get into an existing subnetwork, right-click on itscontrol node to get the drop-down menu and select the Make/show subnetwork command,or left double-click on the control node to which the subnetwork is attached (click on thename of the node, not on the word Subnet below the node name), or use the Networkscommand on the menu bar of any network window in the model and go to the subnetworkyou want.
Removing Subnetworks: To remove a subnetwork, right-click on its control node to getthe drop-down node menu and select the Remove subnetwork command. Or, alternately,select the Design menu and the Create or Remove Subnetwork command.
2.6 Basic Control Networks
A control network is any network that contains nodes with subnetworks attached to them.The top level network of a full model contains merit nodes: Benefits, Opportunities, Costsand Risks, the BOCR nodes, that have subnetworks attached to them. The networks inthis level contain nodes known as controlcriteria that then have subnetworks. The criterianodes are often general concepts such as Environmental, Social, or Political. The subnetsunder the control criteria are called the decision networks as they contain a cluster with thealternatives of the decision appearing as nodes in it. The networks with the control criteriain them are often hierarchical in nature with no feedback links.
In most decisions it is possible to identify the factors that offer benefits or opportunities,or have to do with costs or risks. The factors are best evaluated by grouping those thatinfluence benefits together, and similarly grouping the others. This is done through a systemof control nodes. The BOCR nodes are control nodes with networks beneath them thatcontain their control criteria nodes. Each of the control criteria nodes in turn have a decisionsubnetwork containing the alternatives of the decision.
A complete model consists of the following parts:1. A Rating model of personal criteria to evaluate the importance of Benefits, Oppor-
tunities, Costs and Risks in this decision;2. A main control network containing the Merit control nodes: Benefits, Opportunities,
Costs and Risks, to which the importance weights from the first model are applied;3. Subnetworks of control criteria for each of the merits;4. The decision subnetworks that contain other factors of the problem and the alterna-
tives. Each control criterion has a decision subnetwork.In some complex models it becomes clear that benefits, opportunities and costs, for
example, do not have equal weights in the decision. An example of this type of model isthe National Missile Defense Model in the sample models. In this case it is possible to putstrategic criteria in the main network to weight the BOCR. Personal criteria include thingslike growth, security, survival, and stability; things that have nothing to do directly withthe problem itself, but that are important for determining the imiportance of the BOCR.To set up the Ratings spreadsheet use the Assess/Compare Ratings command.
When you start a new model with the File, New command you will be given a choice ofstarting templates.
Ratings networks Networks that have Rating modules attached are identified by the wordRatings on their title bars. The Rating module resembles a spreadsheet with alternatives

Chapter 2: Building Models 13
listed for the rows and selected nodes in the network listed as the columns. The alternativesmust be entered in the spreadsheet by typing at this time. The alternatives are evaluatedunder each column node using the Rating categories for that column, for example, excellent,very good, good, etc. The Ratings module is created using the Design, Ratings commandand may be removed using the Design, Remove Ratings command. It may also be accessedunder the Assess/Compare, Ratings command.
2.7 Full Models
A full model is composed of a control network and its associated sub-networks. The aejcarmodel is an example. A simple model is a single network without a control network, suchas the Hamburger model.
See Section 2.6 [Basic Control Networks], page 12. See Section 2.1 [Simple Networks],page 2.
2.8 Templates
Use the File New command and select one of the templates from the screen that appearsto start a new model.
Open File Template
Selecting this template will open an existing model in the current window, clearing thepreviously loaded model if there is one.
Selecting the New Window command will open a new window. If you then use the OpenFile Template to open a model, you will have the previously loaded model open in onewindow and the newly opened model in another window.
Simple Network Template
The entire model for a simple network is contained in a single window. Thus this templatesimply leaves a blank window where you will make the network by using the Design com-mand to create clusters and their nodes. All clusters and their nodes are in this window, soyou need a cluster with the name alternatives for the Synthesize command to find results.
A hierarchy is a special kind of network with all the connections leading in one directionaway from the goal cluster. For a hierarchy create a cluster for the goal node with a singlegoal element in it; a cluster for criteria with the criterion nodes in it; and a cluster foralternatives with alternative nodes in it. Then make the proper connections by left-clickingon each parent node and right-clicking on each of its children nodes. Do this for all nodesthat have descendants. You must name the alternatives cluster with the word alternativesor some close variation of it.
Clusters are arranged alphabetically in the supermatrix, so if there are five clusters andyou want the alternatives to show up at the bottom of the supermatrix, preface their clustername with a number 5.
Small Network Template
The small template creates a model with a top-level network that has a goal in a goal clusterand the Merits of Benefits, Opportunities, Costs, and Risks in a cluster titled Model. We

Chapter 2: Building Models 14
refer to these as the BOCR. The second level consists of four subnetworks, one attachedto each of the BOCR. These networks are started for you by having an alternative clusteralready in place. You then need to complete each of them by adding the appropriate clusters,nodes and connections to create a network.
The template wizard walks you through selecting which of the BOCR you want toinclude (it is not necessary to include all four), and entering the names of the alternatives.It then creates three levels of networks, beginning with the BOCR control network, next thecontrol criteria networks for each of these, and finally the bottom level “decision networks”containing a cluster with the alternatives in it.
The top-level control model will then appear. This network is actually the same asa hierarchy having a goal and the four BOCR as descendants of the goal. By defaultthe selected merits have equal weights; i.e. if you selected all four BOCR, each has aweight of 0.25. It is possible to change the weights by going into the comparison modefrom the goal and entering pairwise judgments, or setting the weights directly using theMiscellaneous, Direct Data entry command in the pairwise comparison mode. Or you maycreate a structure to rate the BOCR there in the network with a goal, criteria and perhapssubcriteria and create a Ratings module with the Design Ratings command, select thecriteria as Ratings columns, enter the BOCR as alternatives, and rate them. The BOCRvalues from the Ratings module will override any values in the network.
The default formula used in all templates is the additive(negative) formula. In the Costsand Risks subnets one must ask which alternative is most costly or risky.To change toanother formula go to the Design Standard Formula command.
Additive(negative) Formula $NormalNet(Benefits)*$SmartAlt(Benefits) +$NormalNet(Costs)*(-$SmartAlt(Costs)) + $NormalNet(Opportunities)*$SmartAlt(Opportunities)+ $NormalNet(Risks)*(-$SmartAlt(Risks))
Using a template will assure that the formula is correct for combining the results inthe top-level network as they feed up from the subnets. Formulas are applied only in top-level networks. Bottom level subnets simply feed the synthesized values for the alternativesupward, and they are combined by applying a formula in the top-level network. Select thecommand Design, Standard formulasto see which formula is selected with a check mark.
Full Template
Select the File, New command and Full Template to get the template that creates a fullmodel comprised of a top network which may have Benefits, Opportunities, Costs and Risksnodes. The most general model would contain all four, but the template allows you to selectwhich of the BOCR you want.
The selected nodes from the BOCR will have attached control criteria subnet-workscreated for them. The template walks you through entering the names of yourcontrol criteria, and produces a simple hierarchy with a goal connected to the controlcriteria. Control criteria are often in the form of a hierarchy. The template puts the samecontrol criteria in each of the BOCR subnetworks;for example, Economic, Social, Political.You may add nodes (subcriteria for example), in any of the subnetworks, change the namesand make judgments to prioritize the control critera. You may modify these subnetworksat any time.

Chapter 2: Building Models 15
Each of the original control criteria you entered will have what is called a decisionsubnetwork attached that contains one cluster of alternatives. You are expected to add theother clusters and make the connections.
Tip: Often decision networks are similar in their clusters, connections and even judg-ments. You may complete the first one, including connections and the judgments where theyare the same, then save it to a separate file name. You may then go into another decisionnetwork, clear it of the automatically created alternative cluster, and open the saved decisionnetwork in it using the File, Open command, then modify as necessary.
2.9 Saving Models
Saving is automatic and you can set the interval at which the automatic save occurs fromevery 10 seconds to every 30 minutes by selecting the File, Configure command and theGeneral tab.
The normal way is to save a complete model in a file which will have a .mod extension.You may also save parts of a model:
1) save the current network only;
2) save the current network and its subnetworks.
You may also save models in a compressed format with the extension .mod.gz. Modelssaved in a compressed format take 2 or 3 seconds longer to save and to load, but maybe considerably smaller, depending on what attached files are included in it that may notcompress so well. Models that have been saved in compressed format are opened in thesame way as regularly saved models using the File Open command.
Use the File Save command to save the currently loaded model as a file with a .modextension.
Use the File Save As command to save the currently loaded model under a new name.Use the Advanced Save to save the currently loaded model in a compressed format, or
to save only portions of the currently loaded model. Using the Advanced Save Options youcan select how much of the model you wish to save, and whether or not to compress:
Save this much:
-Whole Model-Only this network and its subnets-Only this network (no subnetworks of it)Compression Options:
-No compression-Compress this model only-Compress models from now on
Chapter 3: Formulas 16
3 Formulas
Formulas are needed in a top-level network of a complex model to control how the resultsare fed up from the bottom level networks and synthesized. Formulas are not needed insimple models consisting of a single network.
Formulas and Formulaic Networks
A network is formulaic when it is a top-level network with a formula that controls howthe synthesized values of the alternatives are being fed up from subnetworks attached tonodes in it and combined with priorities of nodes in the top network. Only networks thathave subnetworks are allowed to have formulas. Otherwise it is a simple network that getsits synthesized priorities directly from the Limit supermatrix.
A pre-set formula, the Additive(negative), is automatically associated with a new modelwhen it is started using either the “full” or “small” template. To use templates select thecommand:
File, Newthen select:Full template - a three level complex modelSmall template - a two level complex modelOpen file - opens an existing modelSimple Network - starts with blank window for user to build own model.There are five possible formulas. You may switch from one to the other at any time, or
select one in the first place, by using the command:Design,Standard FormulasThe currently selected formula has a check mark by it.The default formula for a model started from a template is:1) Additive(negative)$NormalNet(Benefits)*$SmartAlt(Benefits) + $NormalNet(Costs)*(-$SmartAlt(Costs))
+ $NormalNet(Opportunities)*$SmartAlt(Opportunities) + $NormalNet(Risks)*(-$SmartAlt(Risks))
The other formulas are:2) Additive(reciprocal)$NormalNet(Benefits)*$SmartAlt(Benefits) + $NormalNet(Costs)*$SmartInvAlt(Costs)
+ $NormalNet(Opportunities)*$SmartAlt(Opportunities) + $NormalNet(Risks)*$SmartInvAlt(Risks)3) Additive(probabilistic)$NormalNet(Benefits)*$SmartAlt(Benefits) + $NormalNet(Costs)*(1-
$SmartAlt(Costs)) + $NormalNet(Opportunities)*$SmartAlt(Opportunities) +$NormalNet(Risks)*(1-$SmartAlt(Risks))
Note: There is a similarity between priorities of alternatives and probabilities. If x is theprobability of something happening, then 1-x is the probability of not happening. If x is thepriority of an alternative being risky, then 1-x is the priority of it not being risky.
4) Multiplicative

Chapter 3: Formulas 17
$SmartAlt(Benefits) * [invert $SmartAlt(Costs)] * $SmartAlt(Opportunities) * [invert$SmartAlt(Risks)]
Note: With this formula there is no use weighting with the priorities of the BOCR aswhatever values are used simply cancel out. For the same reason doing sensitivity on theBOCR when this formula has been used is useless.
5) Multiplicative power weighted[root $SmartAlt(Benefits) $IdealNet(Benefits)] * [neg root $SmartAlt(Costs)
$IdealNet(Costs)] * [root $SmartAlt(Opportunities) $IdealNet(Opportunities)] * [neg root$SmartAlt(Risks) $IdealNet(Risks)]
Note: This formula is experimental. It raised the priority of the alternative coming upfrom the subnet to the power of the priority of the merit (Benefits, for example.)
6) User defined You may create your own formula if you build the model from scratchnot using a template. Select the command Design, Standard formulas and type a formulain yourself.
To edit the currently selected formula use the commands:Design, Add/Edit FormulaThis opens the Edit Formula dialog box and you can then modify the formula as you
wish. Anytime this dialog box is closed with the Save button rather than the X in theupper right hand corner, it is assumed that this is now a user-defined formula and that willbe checked as the selected formula. You can change it back to any of the other formulas byselecting the one you want.
Caution: An additive formula is automatically created for any user-built model thathas subnets attached to nodes in its top-level network. It weights the alternative prioritiescoming up from the subnet under each node by the priority of that node in the top-levelnetwork, then sums for all such nodes with subnets. This is almost never what you wouldwant and you are strongly advised to visit that formula, which will be identified as a userdefined formula, and fix it.
More About What Formulas Do The formula tells in what form priorities of alternativesare being passed up: Ideals (the largest value in any vector is 1.000), Normals(normalizedso that the values in the vector sum to 1.000) or Totals (raw values are passed up withno normalizing of any kind being used) and Smart(which uses the best of the three for thegiven situation). Formulas also specify how to combine priorities of nodes in the formulaicnetwork with the priorities of the alternatives from the subnets.
Usually, the top-level control network is the only one that has a formula, althoughintermediate evel networks may also have formulas. Any network with a formula is identifiedby the word formulaic on the title bar. Bottom level networks should not be formulaic (forthere are no alternatives feeding up from lower level networks that have to be combined).Intermediate levels might be formulaic, but in general are not. The Synthesis results for thealternatives in a bottom level, or simple, network are obtained directly from the values inthe limit supermatrix and presented in three ways: ideal, normalized and total(which arethe raw values that appear in the limit supermatrix).
It is also possible to use formulas in the intermediate networks between the top-levelone and the decision networks at the bottom, but it is not required, nor very usual at thecurrent stage of development of the theory.

Chapter 3: Formulas 18
Rules for Constructing Formulas
There are two types of terms involving node names that appear in formulas: termsinvolving the priorities of the named nodes in the current network where the formula is,and terms involving the priorities of alternatives that are being fed up under the namednode. The node name is always enclosed in parentheses in the formula.
The meaning of $ when used in a formula: The $ in the formula means compute theresults using the formula for each alternative.
For priorities of nodes in the current network use these conventions:
• IdealNet The term Net means with respect to the current network. IdealNet(Benefits),for example, means idealize the priorities of all the nodes in the network that havesubnets by dividing by the priority of the largest, and use the resulting priority ofBenefits.
• NormalNet NormalNet(Benefits), for example, means use the normalized priority ofthe Benefits node. The normalization is carried out only among the nodes that havesubnets.
• TotalNet TotalNet(Benefits), for example, means use the direct priority that Benefitshas in the network.
• Rat The term Rat means use the value for the named node from the ratings spreadsheetattached to the current network
• IdealRat IdealRat(Benefits) means use the idealized value for Benefits as it appears inthe ratings spreadsheet.
• NormalRat NormalRat(Benefits) means use the value for Benefits obtained by normal-izing rating results.
• TotalRat TotalRat(Benefits) means use the total value for Benefits as it appears in theratings spreadsheet.
For terms involving priorities of alternatives being fed up under the named node usethese conventions:
• SmartAlt Picks the best form of the alternative values to pass up: if the subnet is abottom level one, pass up the Ideal values from synthesis in the subnet; if it is a bottomlevel subnet where the alternatives’ values come from ratings, or if it is an intermediatelevel subnet, pass up the Raw values from synthesis in the subnet.
• IdealAlt If, for example, the node with the subnet is Benefits, IdealAlt(Benefits) meansuse the idealized values for the alternatives from its subnet.
• NormalAlt NormalAlt(Benefits) means use the normalized values for the alternativesfrom the subnet under Benefits.
• TotalAlt TotalAlt(Benefits) means use the normalized values for the alternatives fromthe subnet under Benefits.
The synthesis results for the alternatives can be displayed from any network or subnet-work and they are given in three ways for a given network:
Raw If the network is a bottom level decision network the values for each alternative aredrawn directly from the Limit Matrix for that network. If the network is an intermediatenetwork containing control criteria, the nodes that are the control criteria are normalized

Chapter 3: Formulas 19
and multiplied times the Ideal values of the alternative vectors coming from the networksbelow each of them. These weighted vectors are then added to yield the Raw vector.
Normals A vector of priorities for the alternatives is normalized by adding the elementsin it, and dividing each element by the sum to yield the normalized vector. The elementsin the normalized vector sum to 1. The Normals column in the synthesis table is computedthis way from the Raw values.
Ideals The Raw priority vectors are converted to Idealized values by dividing each ele-ment in the vector by the largest, so that the best alternative gets a priority of 1 and theothers get their proper proportion less than 1. These are the values in the Ideals column inthe synthesis table.
The default formula at the beginning of this section may be summarized this way: In theeach bottom-level decision network compute the Ideal priority vector for the alternatives.Pass that vector up to the next higher level, the control criterion level. Normalize thecontrol criteria in that level and multiply times the vectors being passed up and add. Theresulting vector is now in Raw form. There should be four of them, one for each of theBOCR control networks. Pass these vectors up to the top-level main network.
Finally, the priority vectors for the alternatives that are passed up to the top levelare weighted by the priority of Benefits, Costs, Opportunities and Risks to yield an overallnormalized priority vector for the alternatives. The Costs and Risks vectors have the largestpriority associated with the most costly or most risky alternative. So we take 1 minus eachelement in the formula for these vectors to convert them so the best alternative will havethe largest value. This is somewhat analogous to Probability theory. If p is the probabilityof something occurring, then 1-p is the probability of it not occurring.

Chapter 4: Making Judgments/Assessments 20
4 Making Judgments/Assessments
When all of the cluster and node connections have been created, you will want to com-pare/assess nodes and clusters in each network. Nodes are compared with respect to anothernode and clusters are compared with respect to another cluster.
Judgments/assessments are done for the nodes in each network. Nodes that form a com-parison group must be in the same cluster. These nodes, the children nodes are connectedfrom the same parent node, and are assessed with respect to how they influence that node,or how that node influences them. The parent node may be in a different cluster from thechildren, or the same cluster.
Influence must be treated consistently, how the parent influences the children, or vice-versa, but the flow direction should be kept the same throughout the network and through-out the model.
4.0.1 Making Comparisons
To start the comparison process click on the cluster or node that will be the parent of thecomparison, then:1. Select the command Assess/compare from the main menu of the network window.2. Select the sub-menu command Cluster comparisons or Node comparisonsto start the
comparison process. If a cluster or node has been previously selected, by left-clickingon it, the comparison process will start there. If nothing is selected, the process beginswith the first cluster or node (alphabetically organized).
3. Left-click on the Do Comparison button to get into the comparison dialog box. Thereare five comparison/assessment modes as shown in the table below. The first four arefor making paired comparisons, the fifth is for entering direct data.Troubleshooting TipsQuestion: Why am I not able to do cluster comparisons when there are only twoclusters? Answer: There are no comparisons possible with only two clusters. If one isthe parent, the other is the only child and there is nothing to compare it to. Solution:Do not try to do cluster comparisons when the network has only two clusters. Thecluster weights are automatically set at 1/2 for each.
Shortcuts to the Comparison Window. As the following shortcuts are started from aselected cluster or node, one does not have to specify which cluster or node is to be theparent:1. Pop-up the cluster menu by right mouse-clicking on the background in a cluster. Select
the command Cluster comparisons to enter the Comparison Window in the Question-naire mode; or, alternately;
2. Simultaneously press the shortcut keys Shift F5 to start the cluster comparison process.
In every comparison mode, a verbal comparison phrase for the selected pair appearsat the top of the window. It shows the dominance order with the more dominant of thepair first, and the less dominant second. The node at the beginning is the more dominant:for example, more important, more preferred, more likely, more beautiful. Enter whatevercomparison word you wish to have appear in the verbal comparison phrase.
The AHP Fundamental Scale

Chapter 4: Making Judgments/Assessments 21
1 Equal
2 Equally to Moderately more dominant3 Moderately more dominant4 Moderately to Strongly more dominant5 Strongly more dominant6 Strongly to Very Strongly more dominant7 Very Strongly more dominant8 Very Strongly to Extremely more dominant9 Extremely more dominant
Reciprocals A reciprocal, such as 1/3, is used for the other judgment in the matrixinvolving the pair. For example, if the judgment 3 is entered in cell (a,b), the judgment 1/3is automatically entered in cell (b,a). A matrix with this special form is called a reciprocalmatrix.
Decimal Values For elements which are close to each other, you may use the judgments,1.1, 1.2, 1.3, ...1.9, to make finer distinctions.• To switch to another pairwise comparison mode, left-mouse-click on the tabs at the
top of the dialog box that are labeled Graphic, Verbal, Matrix, Questionnaire.• To switch to the direct data entry mode, left-mouse click on the menu command Misc.
and select the sub-command Direct data entry.• To select your own comparison word, left-mouse click on the menu command Misc.,
select the sub-command Comparison words and select from the following four choices:Importance, Preference, Likelihood, Other If you select Other, type in the word youwant.
In every pairwise comparison mode the current judgment is shown by the depressedsquare in the tracking boxes at the right-hand side of the screen. If there are n comparisonelements, then there are n(n-1)/2 judgments. It is not necessary to enter all the judgments,though it is better to do so in order toextract the most information from the user aboutthe real dominance relationships.
The first four modes are for making pairwise comparisons. The fifth mode is for enteringdata directly. The questionnaire mode is the default pairwise comparison mode - that is,the Comparison Window always starts in this mode.
Questionnaire ModeSelect the numerical judgment that best expresses your judgment by right-mouse-clicking on the number closest to the dominant element. If A is preferred"strongly" to B, click on the 5 on the same side of the line as the A, in the rowthat has A on one side and B on the other. Use the mouse to complete all thejudgments.
Graphic ModeThe ratio of the bar lengths is used for the judgment for the current pair ofelements. To change the bar lengths, left click with the mouse on a radius linein the pie chart display and drag to change the relative sizes of the areas. Theratio of these areas is the same as the ratio of the bars. Click with the mouse onthe judgment tracking boxes at the right of the screen to advance to the nextpair. To reset to equal, click the "No Comparison" button. The judgments are
Chapter 4: Making Judgments/Assessments 22
continuous (unlike in the questionnaire mode where they are limited to integers)and thus can assume decimal values as well as the whole numbers of the AHPFundamental Scale.
Verbal ModeIn the verbal mode words are used on the scale. The lines on the scale representthe judgment numbers of the AHP Fundamental Scale. Left-mouse-click tobring a red bar up to your selected judgmen. As in the Graphic Mode, thevalues are continuous and are not limited to whole numbers from 1 to 9, but canbe decimals if the red bar does not rest exactly on one of the lines representinga whole number.
Matrix ModeEach cell in the matrix mode corresponds to the pair of elements being com-pared. The judgments are shown as decimal numbers, rounded off to the nearesttenth.When a judgment is displayed in red,and the arrow points up, the ele-ment at the top is dominant, in blue, with the arrow pointing left, the elementat the side is dominant. To invert the dominance order, double-click with yourmouse on the arrow in the cell you wish to invert. Inconsistency improvementis always done from the matrix mode. Click on the Inconsistency button tohave the most inconsistent judgment selected. The most consistent value onecould enter for that judgment is displayed on the screen. You may enter thatvalue, or enter another value, or do not change the judgment. Calculations arealways based on what is being displayed in the matrix mode. As judgments arechanged in the other comparison modes or data is input, the matrix entries areconstantly being revised to reflect the last entered values.
Cluster Comparisons/Assessments
Clusters themselves may be compared as well as nodes to determine their weights. Theweights of the clusters in a network add up to 1.0. If you choose to treat them as equaland not compare them, each is assigned a weight of 1/n where n is the number of clusters.Clusters are compared when there are three or more in the same network. Cluster compar-ison groups consist of the clusters linked to a particular cluster. If cluster A is linked toB, C, and D, then B, C, and D must be compared for the importance of their influence onA. Or the importance of A’s influence on them. It is important to keep the influence ques-tions parallel. Do not ask "influence on" in one comparison and "influenced by" in anotherone. The cluster comparisons take place in a sub-network and are done with respect to thecontrol criterion the sub-network is attached to.
Example 1 - cluster comparisons when there is outer dependence - A typical pairwisecomparison question for the example above is: "With respect to benefits (assuming thecontrol criterion is benefits), which has more influence on A, B or C?" There would also becomparison questions for B versus D and C versus D to complete the comparisons for thisgroup.
If A is also linked to itself (inner dependence), it appears in its own comparison group.If A is linked to itself as well as B, C and D, then one would would be comparing A, B, andC with respect to influence on (or by) A.

Chapter 4: Making Judgments/Assessments 23
Example 2 - cluster comparisons when there is inner dependence - An example of clustercomparisons where there is inner dependence. Suppose the clusters are industries: electric,coal, and steel. And suppose the electric industry group is connected to itself as well asto the coal and steel groups. Then the comparison question might be: "Which benefitsthe electric industry more, electricity, coal or steel?" The electric industry would benefitmost from coal, its basic raw material, then steel, to make its machines, but not much fromelectricity, which it uses only to light the offices.
A single matrix of cluster weights results from comparing all the linked clusters in thenetwork. This matrix is used to weight the cluster blocks of the supermatrix. Each sub-network has a supermatrix. The supermatrix consists of blocks of priority vectors for theclusters in the network. The clusters in the sub-network are listed across the top anddown the left side of the supermatrix. Beneath each cluster name on the top are severalcolumns labeled with the names of nodes belonging to the cluster, and similarly for therows. Consider the (A,B) cluster block which is the second block down in the first columnof blocks. It is made up of the priority vectors formed by comparing nodes in the B clusterwith respect to parent nodes in the A cluster make up the (A,B) cluster block. For it tohave non-zero entries, the A cluster must have a link to the B cluster.
The cluster weight matrix derived by comparing the clusters is used to weight the clusterblocks in the supermatrix. Before weighting the supermatrix is called the unweighted supermatrix. After weighting is called the weighted supermatrix. The effect of such weightingis to make the entries in an entire column in the supermatrix add up to 1.0. A matrix is astochastic matrix when all its columns sum to one.
To understand and facilitate the comparisons of clusters, the following should be helpful.If there are some elements in a cluster that influence some elements in another cluster, thenthat cluster itself must influence the other cluster.
Cluster A influences Cluster C more than Cluster B does if:1. A has more elements that interact more strongly with C than does B.2. The elements in A have greater synergy and work together more than those in B.3. The activities in A are more strongly flowing toward or influencing the activities in C
(directly and indirectly) than those in B.4. The elements in C respond more strongly (with its use of materials, energy, purpose
and operation) to the elements in A than to those in B.5. Elements in A have more of a structural relationship with C than elements in B (that
is, A and C is more of a system than A and B; this is kind of like 4).
Node Comparisons/Assessments
Node comparisons are started by selecting the node which is to be the parent node, thenselecting the Assess/Compare menu command; or right-click on the node and select As-sess/Compare from the drop down menu that appears.
Shortcuts to the Comparison Window. As the following shortcuts are started from aselected node, one does not have to specify which cluster or node is to be the parent:1. Select a node within a cluster by passing your mouse over it until it is framed with a
black outline. Pop-up the node menu by right mouse-clicking on the it.Select the com-mand Node compare interface to enter the Comparison Window in the Questionnairemode; or, alternately;

Chapter 4: Making Judgments/Assessments 24
2. Press the shortcut key F5.
See Chapter 4 [Making Judgments/Entering Data], page 20, for detailed informationabout the comparison modes and commands.
Ratings Assessments
Assessing the Alternatives in Ratings
Select the command Assessments/Ratings to open the Ratings Window.Left-click on a cell in Ratings to get a list of the categories for the criterion listed at the
top of the column. Left-click on the category that best represents the assessment for thealternative at the left of the row.
The score for an alternative is computed by multiplying the idealized priority of theselected category times the limiting priority for the criterion obtained in the network foreach cell and summing across the row.
The Calculations command in Ratings
To show the results in ratings select the Calculations command on the Ratings windowmenu.
Priorities gives the scores normalized by dividing by the total of all the alternatives’scores.
Totals gives the scores without normalizingColumn Priorities shows the priorities of the column headings, the criteria.Matrix Priorities shows the numbers in each cell and the column priorities. These
numbers can be blocked and copied into a spreadsheet. You may first need to expand thewindow so that the numbers line up right.
Cycling through Comparisons
Select the Assess/Compare command from the menu of a network. You may then selecteither cluster comparisons or node comparisons. If there is no currently selected clusteror node, the comparison cycle begins with the first one. A cluster comparison (or nodecomparison) window will appear. Left-click on the "Do Comparisons" button. This willbring up the comparison window for the cluster or node. Make the comparisons as describedunder Making Comparisons. When the comparisons are completed, close the window. Ifyou are doing node comparisons, mark the comparison as completed by selecting yes. Thiswill allow the cluster to be shown as having comparisons completed for that node by beingoutlined in red when "show completed comparisons" is turned on.

Chapter 5: Supermatrix Computations 25
5 Supermatrix Computations
Once you have created a network, you will want to make some judgments and do compu-tations(i.e. find out which alternatives are the best).
The Computations command is used to obtain results. All of the subcommands under theComputations command may be used to display results in a simple network that occupies asingle window. The Synthesize and Sensitivity commands are also used to obtain results forany network that has subnetworks attached to control nodes within it. The subcommandsare, briefly described:• Unweighted Super Matrix - made up of the local priority vectors obtained from the
comparison groups. The node at the top of a column is the parent of the variouscomparison groups made up of the nodes at the left. There may be more than onepriority vector in a column - there is one for each cluster that contains nodes beingcompared with respect to that parent node. A super matrix is arranged by componentswith each cluster and its elements being listed across the top and down the side. Theblocks formed by the cluster intersections are the components. To see this best selectthe Graphical view sub-menu command. The Text view is good for showing moreentries on a single screen.
• Weighted Super Matrix - the local priority vectors in the unweighted supermatrix havebeen multiplied times the cluster weights. See the Cluster Matrix command below.The process here is to multiply every element in a component of the unweighted supermatrix by the corresponding component value in the cluster matrix. The values inthe cluster matrix are established by pairwise comparing linked clusters with respectto their influence on the "parent" cluster. If no cluster comparisons are done, defaultvalues of equally important are put into the cluster matrix. The result is that thepriority vectors in each column are weighted by their cluster importance weight andthis makes each column stochastic (i.e., sum to 1) in the weighted supermatrix.
• Limit Matrix - in a simple straightforward network the process of obtaining the limitmatrix is to raise the weighted super matrix to powers until it stabilizes - that is, all thecolumns in the matrix have the same values. The entries in a column are the prioritiesof the nodes at the left (they are "weighted" by cluster weights though, so each cluster’snodes need to be normalized to make their priorities add up to 1.0. There are, however,"difficult" cases to handle. We summarize those as follows:• Sufficiently connected networks - the calculation of the limit matrix is relatively
easy and involves raising the weighted supermatrix to powers (the 2,4,16,32 powers,for example, by successively squaring the supermatrix) until it converges so thateach column is the same.• Cycling in the limit - sometimes successive powers of the supermatrix get into
a stable cycle having two or evem more limit states. In this case, correspondingcolumns are averaged from the different states to give the final result.
• Multiple unit eigenvalue case - There is some discussion as to whether thiscase should be handled in the same way as any other sufficiently connectednetworks, or whether a more complicated formula devised by Luis Vargasshould be used. The complicated formula is included in the software and maybe turned on or off using the limit matrix options below.
Chapter 5: Supermatrix Computations 26
• Insufficiently connected network, e.g. a hierarchy - this is a network with sinks,that is, nodes which are not "with respect to nodes" for any comparison. Thesenodes can be identified by the columns they head in the supermatrix being com-pletely zero. In this case, taking larger and larger powers of the supermatrix causeit to simply vanish, and we are left with no information. One way to fix this isto replace those zero columns by the same column from the identity matrix (i.e.if column 7 of a 12x12 matrix is zero, replace it by column 7 of a 12x12 identitymatrix). We call these columns identity columns. The different ways of remedyingthis situation are given in the limit matrix options below.
• Limit Matrix Options - currently the software contains a number of ways of calculatingthe limit matrix. This is because there are sometimes unusual network configurations,or pathological cases where different methods of calculating may be appropriate. Thesewill be investigated more thoroughly and those that prove useful retained in laterversions of this software. The following is a list of the options, their strengths andweaknesses, and a "suitability" score we have given them (10 would be the best). Formore about the actual calculations see the Calculations White Paper by W.J. Adams inthe papers database of the Creative Decisions Foundation: www.creativedecisions.net.
• Calculus type (9.0) - Normally this is the type you should select. It is the bestavailable overall. It handles all cases, and gives meaningful answers. Strengths -Handles networks with sinks correctly. Also handles networks with sinks in a fairlymeaningful way (it never gives bizarre answers, like an alternative getting 100%for no reason). It handles all hierarchies correctly, but it will not give intermediatehierarchy synthesized values. Weaknesses - Does not give intermediate hierarchysynthesized values.
• Scaling By Scalar (8.5) This algorithm was designed on the spur of the moment. Ihad the idea to scale by scalars, instead of but matrix multiplication. That way itwould be commutative. It appears to always work the same as the calculus type,and for good reason. With a little work the proof is straight-forward. Strengths]-Same as Calculus Type. In addition it is rescaled always, which makes some folksmore comfortable. Weaknesses - Same as Calculus Type.
• New Hierarchy (8.0) - This algorithm exists to give intermediate results of synthesisin the hierarchy case. Strengths - This algorithm gives the intermediate resultsfor hierarchies. It also handles networks without sinks correctly always. Alsohandles degenerate hierarchy cases better than all other algorithms. Weaknesses- Its handling of networks with sinks is not at all canonical. The algorithm doesstand on its own merits, but the results don’t always work with the logic I wouldlike to see.
• Identity at Sinks (7) - This algorithm works the same as the calculus type in thehierarchy case, and the network without sinks case. However if you have a networkwith sinks, it puts self-loops on the sinks. Strengths - Works well in hierarchies, andnetworks without sinks cases. Weaknesses - Does not give intermediate synthesizedvalues back in the hierarchy case. Also in the network with sinks case, it placesundue emphasis on the alternatives. This can result in an alternative getting 100%in cases where it makes no sense (apply it to the national missile defense model inour samples).
Chapter 5: Supermatrix Computations 27
• Sinks formula (6.5) - This algorithm was the attempt just before the New Hier-archyalgorithm. It never gives completely bizarre results (as a matter of a fact ittends to be very close to the Calculus Type algorithm). The reason it gets such alow value is that it fails to handle unbalanced hierarchies, because of weaknesses inthe method of putting identity columns at sinks for hierarchies. Strengths - Is aneasy to understand algorithm. It seems to separate the world into easy parts. Itworks fine with networks with sinks. Weaknesses - It does not handle unbalancedhierarchies correctly because of the logic of adding ones to the diagonal of sinks(For the B^(infinity) part, it uses the Calculus Typealgorithm, which adds ones todiagonals of hierarchies. This causes our problems in unbalanced hierarchy cases.However, if we used the SM limitNonHierarchy algorithm instead, this weaknesswould leave. Since this is mostly for experimental purposes, this change will not bemade anytime soon. Another weakness is in the logic of the algorithm. The NewHierarchy algorithm was developed to repair this. However this weakness turnsout to be a strength as well (since the simplifying assumption which bothers us,makes the overall calculation easier). Oh yes, it also doesn’t give the intermediatesynthesis values for a hierarchy.
• Pre-2001 Version (3) - This algorithm is a fairly stable algorithm for handlingnetworks. It is not as sophisticated as the earlier mentioned ones. However itdoes has some extreme shortcomings, which is why it is rated so low. Strengths -Handles networks, and pure hierarchies correctly (but not unbalanced hierarhies).Weaknesses - If the network has a hard time converging, this will bail before theother algorithms mentioned. It does not handle unbalanced hierarchies correctly.It also doesn’t give the intermediate results for a hierarchy of any kind.
• Pre-2000 Version (2)- This algorithm is all that is left of the first version of the limitmatrix calculation that were included in the code. It is juvenile, but does work fornetworks without sinks, which was all that were considered at that time. Strengths- Not many! It does handle networks without sinks correctly. Weaknesses - Everyother case it will mess up. Never, ever trust this one!
• Priorities - this command gives the priorities of all the nodes in thecurrently selected(or open) network where the command is invoked.Tip: For a control model there are usually no alternatives, nor are there supermatricesas there are no connections, so the first 4 commands in this case will yield zeroes.
• Experimental Priorities is for research purposes and will soon be removed.• Synthesize - gives the priority vector for the Alternatives in a simple model that has
only a single network; it will also synthesize priorities for the alternatives over allthe subnetworks beneath the current network in a complex model. For a standardtop level control network containing Benefits, Opportunities, Costs and Risks nodes anadditive formula is automatically supplied by the software that is used in the Synthesizecommand. See Formulas in the index for more information.
Chapter 6: Synthesizing for Results and Sensitivity 28
6 Synthesizing for Results and Sensitivity
RESULTS
The main results of an ANP model are the overall priorities of the alternatives obtainedby synthesizing the priorities of the alternatives from all the subnetworks. To get the overallresults use the Computations menu in the top-level model. To get intermediate results fora particular subnet you may use the Computations menu in that subnet.
• Synthesis Select the Computations Synthesize command to synthesize the results forthe alternatives. There must be a cluster named alternatives in either that cluster,or in attached subnetworks, for there to be synthesis results. If the results are zero,probably you don’t have alternatives.
The synthesis command will give the priorities of the alternatives for the network wherethe command is invoked and all of its subnetworks, sub-subnetworks, etc.
• Priorities Select the Computations Priorities command to determine the priorities ofall the nodes in a network, normalized by cluster (organized by cluster with the sumof the priorities of the nodes in the cluster adding up to 1.0), and limiting with respectto the network (the sum of the priorities of all the nodes in the network adding up to1.0)
The commands for obtaining final results are:
• Computations Priorities This command gives a list of the priorities of all nodes in thecurrent network; both normalized by cluster so that the weights of the nodes in thecluster add up to one, and limiting so that the weights of all the nodes in the networkadd up to one .
If the network has a hierarchical structure with all influence and links feeding down tonodes in a bottom component, you must use a special command to see the priorities ofthe nodes that are not in the bottom cluster. Select the Computations, Limit MatrixOptions command and click on New Hierarchy without limit. This will then show thepriorities of the intermediate nodes when the Computations, Priorities command isused. The normal limit matrix option is Calculus type. This is the default option foreach network and will automatically be the one used each time you enter that network.You must reset the option each time the network is entered if you want a different one.
or
• Computations Synthesize or
• Computations, Additional Synthesis Command
If you invoke the Synthesize command from a bottom level subnetwork, it gives thesynthesis of priorities for the alternatives in only that network; from an intermediate networkit synthesizes for that network and all the subnets of that network. If you invoke theSynthesize command from the top-level network, it gives the synthesis of priorities for thealternatives throughout the entire model. In a sense the priorities of the alternatives arerolled up from the bottom level decision networks to the networks they are attached to, andfrom there rolled on up to the next network and so on to the top.
Results

Chapter 6: Synthesizing for Results and Sensitivity 29
Formulas Used in Synthesis
Formulas are needed in a top-level network of a complex model to control how theresults are synthesized. In a usual type of network with Benefits, Opportunities,Costs and Risks nodes in the main top level the following formula is used: $Nor-malNet(Benefits)*$TotalAlt(Benefits) + $NormalNet(Costs)*(1-$TotalAlt(Costs))+ $NormalNet(Opportunities)*$TotalAlt(Opportunities) + $NormalNet(Risks)*(1-$TotalAlt(Risks))
If you have generated the network using the BOCR template the formula will alreadybe there. If not you must go into Design, Make Net Formulaic and enter it yourself.
The $ in the formula means compute the results using this formula for each alternative.If there are three alternatives, then there will be three numbers produced that are thesynthesized overall results for the alternatives. These are the results that are displayed bythe Synthesize command.
The results for each alternative are always displayed in three ways for a givennetwork:
Totals: If the network is a bottom level decision network the values for each alternativeare drawn directly from the Limit Matrix for that network. If the network is an intermediatenetwork containing control criteria, the nodes that are the control criteria are normalizedand multiplied times the Ideal values of the alternative vectors coming from the networksbelow each of them. These weighted vectors are then added to yield the Total vector.
Normals: a vector of priorities for the alternatives is normalized by adding the elementsin it, and dividing each element by the sum to yield the normalized vector. The elementsin the normalized vector sum to 1.
Ideals: the Totals priority vectors above are converted to Idealized values by dividingeach element in the vector by the largest, so that the best alternative gets a priority of 1and the others get their proper proportion less than 1.
The above formula may be interpreted this way: In the each bottom-level decisionnetwork compute the Ideal priority vector for the alternatives. Pass that vector up to thenext higher level, the control criterion level. Normalize the control criteria in that level andmultiply times the vectors being passed up and add. The resulting vector is now in Totalsform. There should be four of them, one for each of the BOCR control networks. Pass thesevectors up to the top-level main network.
The Costs and Risks vectors have the largest priority associated with the most costly ormost risky alternative. So we take 1 minus each element in these vectors to convert themso the best alternative will have the largest value. This is analogous to Probability theory.If p is the probability of something occuring, then 1-p is the probability of it not occurring.
Finally, the priority vectors for the alternatives that are passed up to the top level areweighted by the priority of Benefits, Costs, Opportunities and Risks to yield an overallnormalized priority vector for the alternatives.
Performing Sensitivity
SENSITIVITY
To display a sensitivity graph select Computations, Sensitivity from the menu of the toplevel model. (You can also perform sensitivity from lower levels.)
Chapter 6: Synthesizing for Results and Sensitivity 30
This is a what-if type of sensitivity that allows you to select any combination of inde-pendent variables. The initial sensitivity screen that appears always starts with one nodeselected, the first alphabetically in the network where the command was issued. Morethan one dependent variable may be selected. They may be nodes, supermatrix entries, orjudgments. For each dependent variable a range of values, and the number of steps, canbe selected. So many points are generated for all the possible combinations of dependentvariable values. If there is a single dependent variable selected, with a range of priorityfor that variable from .2 to .4 selected, with 4 steps (5 points of calculation) for sensitivityexamination, there would be points for the corresponding alternative values plotted for thedependent variable when its value is .2, .25, .30, .35, and .4. These points would be spreadequally across the x-axis. The numbers on the x-axis relate only indirectly: the .30 value ofBenefits would be plotted at 0.5. The lines for the alternatives are obtained by joining thepoints relating to a given alternative. The Blue Vertical Line is intially located at 0.5 on thex-axis. This just shows the values of the alternatives at the "experiment" that is halfwaythrough all the experimental points being calculated. Move the blue line back and forth byclicking and dragging and read the value of benefits and the alternative values (under thegraph) for the current location of the blue line.
If there are three dependent variables selected, with 4 steps, there would be 53 differentcombinations of dependent variable values plotted. These are "experiments". The results ofthe 125 experiments are plotted along the x-axis (and simply joined to make them look likecontinuous lines). The Dimensions command is especially useful to stretch out the graphalong the x-axis so you can examine more closely where the rank switches occur. Try using800 or 1200 for the x-axis dimension.
Select Dependent Variable from the Edit menu in Sensitivity Analysis to see the Sensitiv-ity input dependent variable list. It always starts with a default initially selected dependentvariable that is first in the list of nodes for that network.
To add a new dependent variable select New or to edit one click on it and select Edit tobring up the New parameter dialog box shown below in Figure 45. You can select a mix ofdependent variable types, networks, number of steps, etc., but you must set the parametersfor each.
1) Type of parameter:
Priorities
Supermatrix
Comparison
2) Network where the sensitivity is being carried out.
The zero network is the top level one, or you could choose:
Benefits subnetwork
Costs subnetwork
Risks subnetwork
3) Enter the starting and ending value of the parameter selected for the range wheresensitivity is to be plotted.
4) Enter the number of steps - don’t get carried away. The calculations can get huge ifyou have selected too many dependent variables and have asked for lots of steps.

Chapter 6: Synthesizing for Results and Sensitivity 31
At any particular experiment, the values for the dependent variables and the alternativesare shown below the graph. You may also elect to have the corresponding values of otherparameters shown by selecting the Extra Params command on the Sensitivity Analysis Editmenu.
Exporting Sensitivity Data To export the data points of the sensitivity plot to Excel,select File Save from the Sensitivity Analysis menu. Use a name ending in .txt when askedfor a file name. Then load Excel, select the File, Open command and open the file. Besure to change the type of file to *.* to display names of all files so the .txt file will showup. The Excel import wizard will then come up. Step through it selecting OK or Next toFinish at the end. The Excel spreadsheet containing the sensitivity data points will thenappear. You can use it then for displaying the data in more ways and for data manipulation- such as arranging one of the alternative columns in decreasing order, so you can see themaximum value obtained.

Chapter 7: printing 32
7 printing
Printing
The File, Print and Computations, Full Report commands both do the same thing.They produce a full report on the model and its results.
The report is produced in an HTML format. You can select "Print Preview", then printfrom the printer icon if you are satisfied with the way it looks.
Or you can save it as an HTML file, and edit it if you like before printing.

Chapter 8: Other Important Features 33
8 Other Important Features
Attaching Files
You can attach other files using the paperclip icon on any network window. Note thatattached files belong to the network they were attached in. Normally you would probablyattach files in the main top-level network. Files you might include:
Word files(with .doc extensions) containing background information and reportsPowerpoint files (with .ppt extensions) containing powerpoint presentationsExcel files (with .txt or .xls extensions)containing other data, exported from the model,
for import to the model, or with external calculations Super Decisions model files (with.mod extensions) containing other associated Super Decisions models; there might be severalmodels for a complex project
Other Things You Might Never Find Out Otherwise
Linking Nodes Turn on the Make Connections mode by clicking on the Insect-lookingicon. Then left click on the parent node and right click on each descendant node to makeconnections quickly.
Or, even quicker, right-click on the node you want to connect from, and select theConnect Nodes command from the node menu that will drop down, then click on the nodesyou want to select (or de-select) from the list that appears.
Show Connections Turn on the Show Connections mode by right-clicking on the star-shaped icon. When this mode is on and you move your cursor over a node, the nodes it isconnected to are highlighted in red.
Show Completed Comparisons Turn on both the Make Connections mode and the ShowConnections mode and left-click on a node to select it. Each cluster that has had thecomparisons completed for the nodes in that cluster with respect to the selected node willbe outlined in red.
Get to a subnetwork Left double-click on any node with a subnet (such nodes are iden-tified by having a red subnet label attached to their bottom - do NOT click on the label,but on the node background or name). This will bring up that subnet.
Or, use the Networks command on the menu of any network to get to the other networksin the model directly. Networks are labeled on the title bar of their window with the nameof their controlling node, except for the top or Main network. It is labeled Super DecisionsMain Window plus the name of the file containing the model, for example, Super DecisionsMain Window Car BCR.mod.
Chapter 9: Sample Models 34
9 Sample Models
This program comes with several sample models. Super Decisions models fall into twogeneral categories: 1) simple network models in which all the elements of the model appearin a single network of clusters containing nodes (nodes are the most basic elements of anySuper Decisions model); and 2) complex models consisting of a control model, containingcontrol criteria nodes to each of which may be attached a simple subnetwork. The samplemodels fall into these two broad categories and were chosen to illustrate the most importantbasic concepts of Super Decisions models. The models currently included are located in thesamples subdirectory.
To quickly load a sample model select the Help command on the menu, then selectSample Models and the model you want.
9.1 Hamburger market share model
The hamburger model was illustrated in the book This hamburger model is the "large" onewith 8 clusters that is presented as a sample model in the Super Decisions software user’smanual. The goal of this model is to estimate market share among fast food hamburgerplaces for the three competitors, McDonald’s, Burger King and Wendy’s. It is a simplenetwork model containing feedback and self-loops among the clusters, but with no controlmodel. There is an implicit control criterion with respect to which all judgments are made inthis model: Market Share. For example, when comparing the clusters indirect competitorsto marketing mix which is more important for gaining market share. Similarly when thenode comparisons are being made.
9.2 US economy model for predicting turnaround time
The US Economy example is a simple network model with no control model. It is a holarchy,meaning it resembles a hierarchy from the top down, but the cluster containing the bottomlevel of alternatives links back to the cluster containing the main criteria. The purposeof this model was to estimate how long, in months, it would be from the time the modelwas done until the US Economy turned around. The priorities for 3 months, 6 months, 18months and 24 months represent likelihoods. For example, a value of .159 for 3 monthsmeans that there is a 15.9% likelihood that the economy would turn around in 3 months.To get the exact time in months use the formula: .159x3 +.129x6+.237x18+.475x24.
There are two US economy projection models. The first, US EconomyHolarchy.mod wasdone in December of 1991 and January of 1992. The prediction of the first was that theeconomy would turn around in October-November 1992, which proved to be correct. Thesecond, US EconomyResurgence2001.mod.gz, is a prediction of when the economy will turnaround in 2001. This model was done in April, 2001, and predicts that the economy willturn around in October-November, 2001.
9.3 National Missile Defense Issue
This is a complex model of three levels to analyze the best strategy for the US in whether ornot to develop a missile defense shield. It is a full model with Benefits, Opportunities, Costsand Risks, control criteria subnetworks, and decision subnetworks. Further, the BOCR are

Chapter 9: Sample Models 35
rated with respect to US national interest criteria. A complete paper on the topic is attachedwithin the model.
9.4 Bridge model to choose between two bridges
This model is not yet available.
9.5 Car Choice (Hierarchy)
The car choice model is a hierarchical model that is re-done here as a simple network model.With a model that is a hierarchy, the alternatives at the bottom level are a "sink". That is,all links go into that cluster and none come out. One must link every node in this cluster toitself. This has the effect of introducing an identity matrix for the alternatives cluster intothe supermatrix. It appears in the lower right hand corner of the supermatrix. It "catches"the priorities flowing into it. The supermatrix has the wonderful property that the synthesisof the alternatives with respect to the elements of every cluster appear as the bottom levelcomponents in the Limiting Supermatrix. This is very apparent in the car model which isalso one of the sample models in the Expert Choice hierarchical decision making software.The results here are the same as in the Expert Choice model: the priorities of the carsVolvo, Mercedes, and so on, and they appear at the bottom of the leftmost column in thesupermatrix labelled Goal at the top. All components are zero, except those across thebottom level for the alternatives which give all the possible syntheses with respect to whatare intermediate levels in the Expert Choice model, but are clusters in the Super Decisionsmodel.
9.6 Carmaker
The model car BCR.mod is to pick the best among Japanese, European, or Americancar-makers. It is a two level model with Benefits, Costs and Risks subnetworks. This modeluses the multiplicative approach to combining the results from the separate BCR networks:B/(C*R). It is intended to illustrate how judgments are made in subnets under controlnodes; for example, when making judgments in the benefits subnet, they are made withrespect to how they impact benefits.
9.7 Technically hard sample model
Technically hard models are those with "sinks" in them. That is, clusters with links tothem, but none out of them. Regular hierarchical models are examples of this, for example,the car hierarchy.mod model.
Reference
$$ . . . . . . . . . . . . . . . . . . . . . . . . . . . . . . . . . . . . . . . . . . . . . . 18
Aadditive(negative) formula . . . . . . . . . . . . . . . . . . . . . 14additive(probabilistic) formula . . . . . . . . . . . . . . . . . 14additive(reciprocal) formula . . . . . . . . . . . . . . . . . . . . 14
advanced save . . . . . . . . . . . . . . . . . . . . . . . . . . . . . . . . . 15AHP fundamental scale . . . . . . . . . . . . . . . . . . . . . . . . 20assessments in ratings . . . . . . . . . . . . . . . . . . . . . . . . . 24assessments, performing . . . . . . . . . . . . . . . . . . . . . . . 20attaching files . . . . . . . . . . . . . . . . . . . . . . . . . . . . . . . . . 33automatic backup . . . . . . . . . . . . . . . . . . . . . . . . . . . . . 15

Chapter 9: Sample Models 36
BBOCR merit nodes . . . . . . . . . . . . . . . . . . . . . . . . . . . . 12BOCR nodes . . . . . . . . . . . . . . . . . . . . . . . . . . . . . . . . . . 11BOCR, formula for combining . . . . . . . . . . . . . . . . . 25bridge sample model . . . . . . . . . . . . . . . . . . . . . . . . . . . 35building models . . . . . . . . . . . . . . . . . . . . . . . . . . . . . . . . . 2
Ccalculating totals in ratings . . . . . . . . . . . . . . . . 11, 24calculations command in ratings . . . . . . . . . . . . 11, 24calculations, supermatrix . . . . . . . . . . . . . . . . . . . . . . 25calculus type . . . . . . . . . . . . . . . . . . . . . . . . . . . . . . . . . . 26calculus type, limit matrix power option . . . . . . . 28car choice hierarchy . . . . . . . . . . . . . . . . . . . . . . . . . . . . 35carmaker . . . . . . . . . . . . . . . . . . . . . . . . . . . . . . . . . . . . . . 35categories in Ratings . . . . . . . . . . . . . . . . . . . . . . . . . . 10Category Editor . . . . . . . . . . . . . . . . . . . . . . . . . . . . . . . 10category templates . . . . . . . . . . . . . . . . . . . . . . . . . . . . 10cluster color, changing . . . . . . . . . . . . . . . . . . . . . . . . . . 5cluster comparisons . . . . . . . . . . . . . . . . . . . . . . . . . . . . . 3cluster description, entering . . . . . . . . . . . . . . . . . . . . . 4cluster font, selecting . . . . . . . . . . . . . . . . . . . . . . . . . . . 5cluster icon font, selecting . . . . . . . . . . . . . . . . . . . . . . . 5cluster icon, changing . . . . . . . . . . . . . . . . . . . . . . . . . . . 5cluster menus . . . . . . . . . . . . . . . . . . . . . . . . . . . . . . . . . . . 3cluster name, entering . . . . . . . . . . . . . . . . . . . . . . . . . . 4cluster, comparisons . . . . . . . . . . . . . . . . . . . . . . . . . . . 22cluster, connections . . . . . . . . . . . . . . . . . . . . . . . . . . . . . 8clusters, creating . . . . . . . . . . . . . . . . . . . . . . . . . . . . . . . . 3clusters, deleting . . . . . . . . . . . . . . . . . . . . . . . . . . . . . . . . 4clusters, editing . . . . . . . . . . . . . . . . . . . . . . . . . . . . . . . . . 4clusters, general . . . . . . . . . . . . . . . . . . . . . . . . . . . . . . . . 2clusters, organizing nodes in . . . . . . . . . . . . . . . . . . . . 3clusters, removing . . . . . . . . . . . . . . . . . . . . . . . . . . . . . . 4color of cluster, changing . . . . . . . . . . . . . . . . . . . . . . . . 5color of node, changing . . . . . . . . . . . . . . . . . . . . . . . . . 7colors, for nodes . . . . . . . . . . . . . . . . . . . . . . . . . . . . . . . . 6command to create node . . . . . . . . . . . . . . . . . . . . . . . . 5command to edit cluster . . . . . . . . . . . . . . . . . . . . . . . . 4command to edit node . . . . . . . . . . . . . . . . . . . . . . . . . . 6command to remove node . . . . . . . . . . . . . . . . . . . . . . . 6command, to create cluster . . . . . . . . . . . . . . . . . . . . . 4comparing clusters . . . . . . . . . . . . . . . . . . . . . . . . . . . . . 22comparisons, completed . . . . . . . . . . . . . . . . . . . . . . . . 24comparisons, cycling through . . . . . . . . . . . . . . . . . . 24comparisons, entering . . . . . . . . . . . . . . . . . . . . . . . . . . 20comparisons, show completed . . . . . . . . . . . . . . . . . . 33compressed mode, saving . . . . . . . . . . . . . . . . . . . . . . 15computations, full report . . . . . . . . . . . . . . . . . . . . . . 32computations, general . . . . . . . . . . . . . . . . . . . . . . . . . 25computations, priorities . . . . . . . . . . . . . . . . . . . . . . . . 28computations, supermatrix . . . . . . . . . . . . . . . . . . . . . 25computing priorities . . . . . . . . . . . . . . . . . . . . . . . . . . . 27connecting nodes . . . . . . . . . . . . . . . . . . . . . . . . . . . . . . 33connections, cluster . . . . . . . . . . . . . . . . . . . . . . . . . . . . . 8connections, general . . . . . . . . . . . . . . . . . . . . . . . . . . . . 7connections, node . . . . . . . . . . . . . . . . . . . . . . . . . . . . . . . 8
connections, showing . . . . . . . . . . . . . . . . . . . . . . . . . . 33consistency improvement . . . . . . . . . . . . . . . . . . . . . . 22consistency of judgments . . . . . . . . . . . . . . . . . . . . . . . 22control criteria nodes . . . . . . . . . . . . . . . . . . . . . . . . . . 11control network . . . . . . . . . . . . . . . . . . . . . . . . . . . . . . . . 12control nodes . . . . . . . . . . . . . . . . . . . . . . . . . . . . . . . . . . 11create cluster, shortcut . . . . . . . . . . . . . . . . . . . . . . . . . . 3create cluster, using mouse . . . . . . . . . . . . . . . . . . . . . . 3create node in cluster . . . . . . . . . . . . . . . . . . . . . . . . . . . 3create node, mouse command . . . . . . . . . . . . . . . . . . . 5create node, mouse shortcut . . . . . . . . . . . . . . . . . . . . 5creating models . . . . . . . . . . . . . . . . . . . . . . . . . . . . . . . . . 2creating rating networks . . . . . . . . . . . . . . . . . . . . . . . . 9creating subnetworks . . . . . . . . . . . . . . . . . . . . . . . . . . 11cycling thru comparisons . . . . . . . . . . . . . . . . . . . . . . 24
Ddata, entering directly . . . . . . . . . . . . . . . . . . . . . . . . . 20data, for comparisons . . . . . . . . . . . . . . . . . . . . . . . . . . 20decision networks . . . . . . . . . . . . . . . . . . . . . . . . . . . . . . 11design menu, create node . . . . . . . . . . . . . . . . . . . . . . . 5design menu, remove cluster . . . . . . . . . . . . . . . . . . . . 4
Eedit cluster, popup menu . . . . . . . . . . . . . . . . . . . . . . . . 4edit node, menu command . . . . . . . . . . . . . . . . . . . . . . 6edit node, popup menu . . . . . . . . . . . . . . . . . . . . . . . . . 6entering comparisons . . . . . . . . . . . . . . . . . . . . . . . . . . 20entering judgments . . . . . . . . . . . . . . . . . . . . . . . . . . . . 20exporting sensitivity data . . . . . . . . . . . . . . . . . . . . . . 31extra params . . . . . . . . . . . . . . . . . . . . . . . . . . . . . . . . . . 31
Ffile print command . . . . . . . . . . . . . . . . . . . . . . . . . . . . 32files, attaching . . . . . . . . . . . . . . . . . . . . . . . . . . . . . . . . . 33fonts, for nodes . . . . . . . . . . . . . . . . . . . . . . . . . . . . . . . . . 6formula, additive(negative) . . . . . . . . . . . . . . . . . . . . 14formula, additive(probabilistic) . . . . . . . . . . . . . . . . 14formula, additive(reciprocal) . . . . . . . . . . . . . . . . . . . 14formula, for combining BOCR . . . . . . . . . . . . . . . . . 25formula, inverted values in . . . . . . . . . . . . . . . . . . . . . 14formula, multiplicative . . . . . . . . . . . . . . . . . . . . . . . . . 14formula, multiplicative(power weighted) . . . . . . . . 14formula, template . . . . . . . . . . . . . . . . . . . . . . . . . . . . . . 14formulaic control networks . . . . . . . . . . . . . . . . . . . . . 16formulaic network . . . . . . . . . . . . . . . . . . . . . . . . . . . . . 14formulaic networks . . . . . . . . . . . . . . . . . . . . . . . . . . . . 16formulas . . . . . . . . . . . . . . . . . . . . . . . . . . . . . . . . . . . . . . . 16formulas, conventions in . . . . . . . . . . . . . . . . . . . . . . . 17full models . . . . . . . . . . . . . . . . . . . . . . . . . . . . . . . . . . . . 13full report, printing . . . . . . . . . . . . . . . . . . . . . . . . . . . . 32full template . . . . . . . . . . . . . . . . . . . . . . . . . . . . . . . . . . 14fundamental scale . . . . . . . . . . . . . . . . . . . . . . . . . . . . . 20
Chapter 9: Sample Models 37
Ggraphic comparison mode . . . . . . . . . . . . . . . . . . . . . . 20graphical view, supermatrix . . . . . . . . . . . . . . . . . . . . 25
Hhamburger model . . . . . . . . . . . . . . . . . . . . . . . . . . . . . . 34hardtech, model with sinks . . . . . . . . . . . . . . . . . . . . 35help command, loading sample models from . . . . . 2hierarchy, constructing . . . . . . . . . . . . . . . . . . . . . . . . . 13holarchy, US economy model . . . . . . . . . . . . . . . . . . . 34
IIconify/Expand cluster . . . . . . . . . . . . . . . . . . . . . . . . . 3Ideal . . . . . . . . . . . . . . . . . . . . . . . . . . . . . . . . . . . . . . . . . . 18IdealAlt . . . . . . . . . . . . . . . . . . . . . . . . . . . . . . . . . . . . . . . 18Ideals . . . . . . . . . . . . . . . . . . . . . . . . . . . . . . . . . . . . . . . . . 19importing files into Excel . . . . . . . . . . . . . . . . . . . . . . 31improving consistency . . . . . . . . . . . . . . . . . . . . . . . . . 22inner dependence . . . . . . . . . . . . . . . . . . . . . . . . . . . . . . . 8inverted values, in formula . . . . . . . . . . . . . . . . . . . . . 14inverting alternative results . . . . . . . . . . . . . . . . . . . . 14
Jjudgments, making . . . . . . . . . . . . . . . . . . . . . . . . . . . . 20
Kkey to remove node . . . . . . . . . . . . . . . . . . . . . . . . . . . . . 6key used to create cluster . . . . . . . . . . . . . . . . . . . . . . . 3key used to create node . . . . . . . . . . . . . . . . . . . . . . . . . 5key used to edit cluster . . . . . . . . . . . . . . . . . . . . . . . . . 4key used to edit nodes . . . . . . . . . . . . . . . . . . . . . . . . . . 6key used to remove cluster . . . . . . . . . . . . . . . . . . . . . . 4
Llimit matrix . . . . . . . . . . . . . . . . . . . . . . . . . . . . . . . . . . . 26limit matrix options . . . . . . . . . . . . . . . . . . . . . . . . . . . 28limit matrix power option, default selection . . . . 28limit power types . . . . . . . . . . . . . . . . . . . . . . . . . . . . . . 28linking nodes . . . . . . . . . . . . . . . . . . . . . . . . . . . . . . . . . . 33
Mmain window . . . . . . . . . . . . . . . . . . . . . . . . . . . . . . . . . . 33making assessments in ratings . . . . . . . . . . . . . . . . . 24making connections . . . . . . . . . . . . . . . . . . . . . . . . . . . . 33making judgments/assessments . . . . . . . . . . . . . . . . 20matrix comparison mode . . . . . . . . . . . . . . . . . . . . . . . 20menu, design command . . . . . . . . . . . . . . . . . . . . . . . . . 4menu, remove cluster . . . . . . . . . . . . . . . . . . . . . . . . . . . 4menus for cluster operations . . . . . . . . . . . . . . . . . . . . 3merit nodes . . . . . . . . . . . . . . . . . . . . . . . . . . . . . . . . . . . 12models, building . . . . . . . . . . . . . . . . . . . . . . . . . . . . . . . . 2
models, creating . . . . . . . . . . . . . . . . . . . . . . . . . . . . . . . . 2models, opening simultaneously . . . . . . . . . . . . . . . . 13models, saving . . . . . . . . . . . . . . . . . . . . . . . . . . . . . . . . . 15mouse shortcut, create node . . . . . . . . . . . . . . . . . . . . 5mouse, create cluster . . . . . . . . . . . . . . . . . . . . . . . . . . . . 3mouse, use to create node . . . . . . . . . . . . . . . . . . . . . . . 5multiplicative formula . . . . . . . . . . . . . . . . . . . . . . . . . 14multiplicative(power weighted) formula . . . . . . . . 14multiply selecting nodes . . . . . . . . . . . . . . . . . . . . . . . . 8
NNational Missile Defense model . . . . . . . . . . . . . . . . 34Net . . . . . . . . . . . . . . . . . . . . . . . . . . . . . . . . . . . . . . . . . . . 18networks with formulas . . . . . . . . . . . . . . . . . . . . . . . . 16Networks with Ratings . . . . . . . . . . . . . . . . . . . . . . . . 12networks, simple . . . . . . . . . . . . . . . . . . . . . . . . . . . . . . . . 2new hierarchy, limit matrix power option . . . . . . . 28new model, templates for . . . . . . . . . . . . . . . . . . . . . . 13node color, changing . . . . . . . . . . . . . . . . . . . . . . . . . . . . 7node description, entering . . . . . . . . . . . . . . . . . . . . . . . 6node icon font, selecting . . . . . . . . . . . . . . . . . . . . . . . . 7node icon, changing . . . . . . . . . . . . . . . . . . . . . . . . . . . . . 7node name, entering . . . . . . . . . . . . . . . . . . . . . . . . . . . . 6node title font, selecting . . . . . . . . . . . . . . . . . . . . . . . . 6node, command to create . . . . . . . . . . . . . . . . . . . . . . . 5node, comparisons . . . . . . . . . . . . . . . . . . . . . . . . . . . . . 23node, connections . . . . . . . . . . . . . . . . . . . . . . . . . . . . . . . 8node, create from design menu . . . . . . . . . . . . . . . . . . 5node, values dialog box . . . . . . . . . . . . . . . . . . . . . . . . . 6nodes, creating . . . . . . . . . . . . . . . . . . . . . . . . . . . . . . . . . 5Nodes, creating in cluster . . . . . . . . . . . . . . . . . . . . . . . 3nodes, deleting . . . . . . . . . . . . . . . . . . . . . . . . . . . . . . . . . 6nodes, editing . . . . . . . . . . . . . . . . . . . . . . . . . . . . . . . . . . 6nodes, general . . . . . . . . . . . . . . . . . . . . . . . . . . . . . . . . . . 5Nodes, organizing in a cluster . . . . . . . . . . . . . . . . . . . 3nodes, removing . . . . . . . . . . . . . . . . . . . . . . . . . . . . . . . . 6nodes, selecting multiple . . . . . . . . . . . . . . . . . . . . . . . . 8nodes, setting fonts and colors . . . . . . . . . . . . . . . . . . 6Normal . . . . . . . . . . . . . . . . . . . . . . . . . . . . . . . . . . . . . . . . 18NormalAlt . . . . . . . . . . . . . . . . . . . . . . . . . . . . . . . . . . . . . 18Normals . . . . . . . . . . . . . . . . . . . . . . . . . . . . . . . . . . . . . . . 19
Oopen file template . . . . . . . . . . . . . . . . . . . . . . . . . . . . . 13opening models simultaneously . . . . . . . . . . . . . . . . . 13Organize nodes in a cluster . . . . . . . . . . . . . . . . . . . . . 3outer dependence . . . . . . . . . . . . . . . . . . . . . . . . . . . . . . . 8
Ppopup menu to edit node . . . . . . . . . . . . . . . . . . . . . . . 6popup menu, edit cluster . . . . . . . . . . . . . . . . . . . . . . . . 4popup menu, remove cluster . . . . . . . . . . . . . . . . . . . . 4popup menu, remove node . . . . . . . . . . . . . . . . . . . . . . 6printing . . . . . . . . . . . . . . . . . . . . . . . . . . . . . . . . . . . . . . . 32priorities of nodes, computations . . . . . . . . . . . . . . . 28

Chapter 9: Sample Models 38
priorities, computing . . . . . . . . . . . . . . . . . . . . . . . . . . . 27
Qquestionnaire, in comparisons . . . . . . . . . . . . . . . . . . 20quick access, sample models . . . . . . . . . . . . . . . . . . . 34
RRat . . . . . . . . . . . . . . . . . . . . . . . . . . . . . . . . . . . . . . . . . . . 18Rating module, creating . . . . . . . . . . . . . . . . . . . . . . . 12Rating module, removing . . . . . . . . . . . . . . . . . . . . . . 12rating networks . . . . . . . . . . . . . . . . . . . . . . . . . . . . . . . . . 9rating networks, creating . . . . . . . . . . . . . . . . . . . . . . . . 9ratings assessments . . . . . . . . . . . . . . . . . . . . . . . . . . . . 24ratings calculations command . . . . . . . . . . . . . . 11, 24Ratings Category Editor . . . . . . . . . . . . . . . . . . . . . . . 10Ratings networks . . . . . . . . . . . . . . . . . . . . . . . . . . . . . . 12Raw . . . . . . . . . . . . . . . . . . . . . . . . . . . . . . . . . . . . . . . . . . . 19Remove cluster . . . . . . . . . . . . . . . . . . . . . . . . . . . . . . . . . 3remove cluster, design menu . . . . . . . . . . . . . . . . . . . . 4remove cluster, popup menu . . . . . . . . . . . . . . . . . . . . 4remove node, menu command . . . . . . . . . . . . . . . . . . . 6remove node, popup menu . . . . . . . . . . . . . . . . . . . . . . 6results, synthesizing . . . . . . . . . . . . . . . . . . . . . . . . . . . 28rules for constructing formulas . . . . . . . . . . . . . . . . . 17
Ssample models, accessing from Help . . . . . . . . . . . . . 2sample models, Help menu . . . . . . . . . . . . . . . . . . . . . 34sample models, quick access . . . . . . . . . . . . . . . . . . . 34sample models, where they are . . . . . . . . . . . . . . . . . . 2samples . . . . . . . . . . . . . . . . . . . . . . . . . . . . . . . . . . . . . . . 34save interval, setting . . . . . . . . . . . . . . . . . . . . . . . . . . . 15save, advanced . . . . . . . . . . . . . . . . . . . . . . . . . . . . . . . . . 15saving models . . . . . . . . . . . . . . . . . . . . . . . . . . . . . . . . . 15saving subnets . . . . . . . . . . . . . . . . . . . . . . . . . . . . . . . . . 15saving, compressed mode . . . . . . . . . . . . . . . . . . . . . . 15scale, fundamental . . . . . . . . . . . . . . . . . . . . . . . . . . . . . 20Selected cluster . . . . . . . . . . . . . . . . . . . . . . . . . . . . . . . . . 3selecting multiple nodes . . . . . . . . . . . . . . . . . . . . . . . . . 8sensitivity . . . . . . . . . . . . . . . . . . . . . . . . . . . . . . . . . . . . . 28shortcut key, edit cluster . . . . . . . . . . . . . . . . . . . . . . . . 4shortcut key, edit node . . . . . . . . . . . . . . . . . . . . . . . . . . 6shortcut key, remove node . . . . . . . . . . . . . . . . . . . . . . 6show completed comparisons . . . . . . . . . . . . . . . . . . . 33show connections . . . . . . . . . . . . . . . . . . . . . . . . . . . . . . 33simple network template . . . . . . . . . . . . . . . . . . . . . . . 13simple networks . . . . . . . . . . . . . . . . . . . . . . . . . . . . . . . . 2
small template . . . . . . . . . . . . . . . . . . . . . . . . . . . . . . . . . 13SmartAlt . . . . . . . . . . . . . . . . . . . . . . . . . . . . . . . . . . . . . . 18stochastic matrix . . . . . . . . . . . . . . . . . . . . . . . . . . 22, 25stochastic supermatrix columns . . . . . . . . . . . . . . . . 25subnet, importing structure . . . . . . . . . . . . . . . . . . . . 14subnet, importing template . . . . . . . . . . . . . . . . . . . . 14subnets, saving . . . . . . . . . . . . . . . . . . . . . . . . . . . . . . . . 15subnetworks . . . . . . . . . . . . . . . . . . . . . . . . . . . . . . . . . . . 11subnetworks, accessing . . . . . . . . . . . . . . . . . . . . . . . . . 11subnetworks, creating . . . . . . . . . . . . . . . . . . . . . . . . . . 11Super Decisions Main window . . . . . . . . . . . . . . . . . 33supermatrix . . . . . . . . . . . . . . . . . . . . . . . . . . . . . . . . . . . 22supermatrix calculations . . . . . . . . . . . . . . . . . . . . . . . 25supermatrix computations . . . . . . . . . . . . . . . . . . . . . 25supermatrix, graphical view . . . . . . . . . . . . . . . . . . . . 25supermatrix, text view . . . . . . . . . . . . . . . . . . . . . . . . . 25synthesize for a control network . . . . . . . . . . . . . . . . 27synthesize for a sub-network . . . . . . . . . . . . . . . . . . . 27synthesizing . . . . . . . . . . . . . . . . . . . . . . . . . . . . . . . . . . . 28
Ttemplate formula, default . . . . . . . . . . . . . . . . . . . . . . 14template, for simple network . . . . . . . . . . . . . . . . . . . 13template, full . . . . . . . . . . . . . . . . . . . . . . . . . . . . . . . . . . 14template, open file . . . . . . . . . . . . . . . . . . . . . . . . . . . . . 13template, Open file . . . . . . . . . . . . . . . . . . . . . . . . . . . . 13template, small . . . . . . . . . . . . . . . . . . . . . . . . . . . . . . . . 13template, use to make subnet . . . . . . . . . . . . . . . . . . 14templates . . . . . . . . . . . . . . . . . . . . . . . . . . . . . . . . . . . . . . 13templates for categories . . . . . . . . . . . . . . . . . . . . . . . . 10text view, supermatrix . . . . . . . . . . . . . . . . . . . . . . . . . 25Total . . . . . . . . . . . . . . . . . . . . . . . . . . . . . . . . . . . . . . . . . . 18TotalAlt . . . . . . . . . . . . . . . . . . . . . . . . . . . . . . . . . . . . . . . 18totals, calculating in ratings . . . . . . . . . . . . . . . . 11, 24
Uunweighted supermatrix . . . . . . . . . . . . . . . . . . . . 22, 25US economy, sample model . . . . . . . . . . . . . . . . . . . . 34using templates for categories . . . . . . . . . . . . . . . . . . 10
VVargas, Luis . . . . . . . . . . . . . . . . . . . . . . . . . . . . . . . . . . . 25verbal comparison mode . . . . . . . . . . . . . . . . . . . . . . . 20
Wweighted supermatrix . . . . . . . . . . . . . . . . . . . . . . 22, 25

ii
Table of Contents
1 Introduction . . . . . . . . . . . . . . . . . . . . . . . . . . . . . . . . . . . . . 1
2 Building Models . . . . . . . . . . . . . . . . . . . . . . . . . . . . . . . . 22.1 Simple Networks . . . . . . . . . . . . . . . . . . . . . . . . . . . . . . . . . . . . . . . . . . . . . . . 2
2.1.1 Creating Clusters . . . . . . . . . . . . . . . . . . . . . . . . . . . . . . . . . . . . . . . . . . 2Creating a Cluster . . . . . . . . . . . . . . . . . . . . . . . . . . . . . . . . . . . . . . . . . . . . . . . 3Editing a Cluster . . . . . . . . . . . . . . . . . . . . . . . . . . . . . . . . . . . . . . . . . . . . . . . . . 4Removing a Cluster . . . . . . . . . . . . . . . . . . . . . . . . . . . . . . . . . . . . . . . . . . . . . . 4Selecting Fonts/Colors/Icons for Clusters . . . . . . . . . . . . . . . . . . . . . . . . . 4
2.2 Creating Nodes within Clusters . . . . . . . . . . . . . . . . . . . . . . . . . . . . . . . . . 5Creating Nodes . . . . . . . . . . . . . . . . . . . . . . . . . . . . . . . . . . . . . . . . . . . . . . . . . . 5Editing Nodes . . . . . . . . . . . . . . . . . . . . . . . . . . . . . . . . . . . . . . . . . . . . . . . . . . . . 6Removing Nodes . . . . . . . . . . . . . . . . . . . . . . . . . . . . . . . . . . . . . . . . . . . . . . . . . 6Selecting fonts/colors/icons for Nodes . . . . . . . . . . . . . . . . . . . . . . . . . . . . 6
2.3 Making Connections between Nodes . . . . . . . . . . . . . . . . . . . . . . . . . . . . 7Cluster Connections . . . . . . . . . . . . . . . . . . . . . . . . . . . . . . . . . . . . . . . . . . . . . . 8Outer Dependence . . . . . . . . . . . . . . . . . . . . . . . . . . . . . . . . . . . . . . . . . . . . . . . 8Inner Dependence . . . . . . . . . . . . . . . . . . . . . . . . . . . . . . . . . . . . . . . . . . . . . . . . 8Node Connections . . . . . . . . . . . . . . . . . . . . . . . . . . . . . . . . . . . . . . . . . . . . . . . . 8
2.4 Rating networks . . . . . . . . . . . . . . . . . . . . . . . . . . . . . . . . . . . . . . . . . . . . . . . . 92.5 Subnetworks . . . . . . . . . . . . . . . . . . . . . . . . . . . . . . . . . . . . . . . . . . . . . . . . . . 112.6 Basic Control Networks . . . . . . . . . . . . . . . . . . . . . . . . . . . . . . . . . . . . . . . 122.7 Full Models . . . . . . . . . . . . . . . . . . . . . . . . . . . . . . . . . . . . . . . . . . . . . . . . . . . 132.8 Templates . . . . . . . . . . . . . . . . . . . . . . . . . . . . . . . . . . . . . . . . . . . . . . . . . . . . 13
Open File Template . . . . . . . . . . . . . . . . . . . . . . . . . . . . . . . . . . . . . . . . . . . . . 13Simple Network Template . . . . . . . . . . . . . . . . . . . . . . . . . . . . . . . . . . . . . . . 13Small Network Template . . . . . . . . . . . . . . . . . . . . . . . . . . . . . . . . . . . . . . . . 13Full Template . . . . . . . . . . . . . . . . . . . . . . . . . . . . . . . . . . . . . . . . . . . . . . . . . . . 14
2.9 Saving Models . . . . . . . . . . . . . . . . . . . . . . . . . . . . . . . . . . . . . . . . . . . . . . . . 15
3 Formulas . . . . . . . . . . . . . . . . . . . . . . . . . . . . . . . . . . . . . . . 16
4 Making Judgments/Assessments . . . . . . . . . . . . . 204.0.1 Making Comparisons . . . . . . . . . . . . . . . . . . . . . . . . . . . . . . . . . . . . . 20Cluster Comparisons/Assessments . . . . . . . . . . . . . . . . . . . . . . . . . . . . . . . 22Node Comparisons/Assessments . . . . . . . . . . . . . . . . . . . . . . . . . . . . . . . . . 23Ratings Assessments . . . . . . . . . . . . . . . . . . . . . . . . . . . . . . . . . . . . . . . . . . . . 24Cycling through Comparisons . . . . . . . . . . . . . . . . . . . . . . . . . . . . . . . . . . . 24
5 Supermatrix Computations . . . . . . . . . . . . . . . . . . . 25

iii
6 Synthesizing for Results and Sensitivity . . . . . 28Results . . . . . . . . . . . . . . . . . . . . . . . . . . . . . . . . . . . . . . . . . . . . . . . . . . . . . . . . . 28Formulas Used in Synthesis . . . . . . . . . . . . . . . . . . . . . . . . . . . . . . . . . . . . . 29Performing Sensitivity . . . . . . . . . . . . . . . . . . . . . . . . . . . . . . . . . . . . . . . . . . . 29
7 printing . . . . . . . . . . . . . . . . . . . . . . . . . . . . . . . . . . . . . . . . 32
8 Other Important Features . . . . . . . . . . . . . . . . . . . . 33
9 Sample Models . . . . . . . . . . . . . . . . . . . . . . . . . . . . . . . . 349.1 Hamburger market share model . . . . . . . . . . . . . . . . . . . . . . . . . . . . . . . 349.2 US economy model for predicting turnaround time . . . . . . . . . . . . . 349.3 National Missile Defense Issue . . . . . . . . . . . . . . . . . . . . . . . . . . . . . . . . . 349.4 Bridge model to choose between two bridges . . . . . . . . . . . . . . . . . . . 359.5 Car Choice (Hierarchy) . . . . . . . . . . . . . . . . . . . . . . . . . . . . . . . . . . . . . . . . 359.6 Carmaker . . . . . . . . . . . . . . . . . . . . . . . . . . . . . . . . . . . . . . . . . . . . . . . . . . . . . 359.7 Technically hard sample model . . . . . . . . . . . . . . . . . . . . . . . . . . . . . . . . 35
Reference . . . . . . . . . . . . . . . . . . . . . . . . . . . . . . . . . . . . . . . . . . . . . . . . . . . . . . . 35