Super-Cell From Inner Sectors of Active Antenna System ... · PDF fileSuper-Cell From Inner...
6
Super-Cell From Inner Sectors of Active Antenna System (AAS) - Vertical Sectorization Dereje W. Kifle * , Bernhard Wegmann * , Petri Eskelinen † , Ingo Viering ‡ , Anja Klein § * Nokia Solutions and Networks, Munich, Germany: {dereje.woldemedhin.ext; bernhard.wegmann @nsn.com} † Magister Solutions Ltd, Finland: { petri.eskelinen@magister.fi} ‡ Nomor Research GmbH, Munich, Germany: { [email protected]} § Technische Universit¨ at Darmstadt Communications Engineering Lab, Darmstadt, Germany: { [email protected]} Abstract—Active Antenna System (AAS) is an advanced an- tenna technology that features the ability of advanced beam- forming techniques to provide a great flexibility in cellular network deployment which enables improvements in network capacity and coverage. Conventionally, network dimensioning is done based on busy hour traffic leading to cost-intensive over- dimensioning for most of the time via deploying additional macro and small cells. In AAS, however, varying traffic concentrations can be flexibly handled by dynamic cell densification, e.g. by splitting a sector into smaller ”sub-sectors”. Vertical sectorization is a well-known approach where a conventional sector is split vertically in to two, inner and outer sectors, resulting in 3x2 sectors per site for AAS-based tri-sectorized site. In this paper work, an alternative vertical sectorization deployment configu- ration is presented where the inner sectors build a so called super-cell resulting from transmitting the same cell information in all inner sectors. Investigation results show that the super-cell configuration can mitigate unwanted back and side lobe effects in close proximity of the site and, therefore, provides a significant gain for users in this coverage area. Index Terms—Active Antenna Systems, Vertical Sectorization, Super-cell, Mobility I. I NTRODUCTION Cellular communication technology has undergone a dra- matic evolution through different generation (G), i.e. 2G, 3G, and 4G, in the last two decades featuring various advanced service capability. Also cell site architecture was evolving in a way to allow more flexible and cost-efficient cell deployment by means of remote radio heads (RRH) [1]. The next stage in the evolution of the site architecture is the active antenna system (AAS) where separate transceivers and amplifiers are distributed across the antenna elements providing, in addition, flexible beam shaping capability. In 3GPP RAN work group (WG) 4 [2], a study item has been approved on the RF and Electromagnetic Compatibility (EMC) requirements for AAS based on a macro-cell deployment scenarios targeting an improved system capacity and simplified site-deployment. One of the requirements of AAS in [2] [3] is flexibility in cell lay out deployment by cell-splitting using beamforming techniques such as sectorization in horizontal and vertical planes to achieve a better capacity/performance gain compared to a BS installed with a traditional antenna. Vertical Sectoriza- tion (VS) is a scheme where a conventional cellular sector is split into two, inner and outer sectors, by using two dedicated beams each having its own electrical tilt per vertical sector and formed from a group of multiple active array elements of the AAS arranged vertically as shown in Figure 1(a). The total system bandwidth can be used independently in the inner and outer sectors, and this will double the amount of the total radio resources per a conventional sector. System level simulations have been performed for the Long Term Evolution (LTE) systems in [4] and results have shown that vertical sectorization can provide a significant capacity gain. Figure 1(b) depicts a 3x2 sectors per site where a vertical sectorization is applied on a standard tri-sectorized deployment. RATs like LTE and UMTS are spectral efficient and are operated with a frequency reuse of one. As a result, in a sector- ized cell deployment, intra-site co-channel interference is more critical issue, in particular, the sector area in close vicinity to the antenna heavily suffers from interference due to the effect from back and side lobes of antenna radiation leaking to neighboring sectors. The interference level gets worse with vertical sectorization due to the addition of additional adjacent vertical sectors. The 3GPP Adjacent Channel Interference Ratio (ACIR) criteria is investigated in [5] to evaluate the impact of VS and to verify the AAS-based BS capabilities with the existing BS requirements for LTE systems. Furthermore, in the real world propagation environment, the serving cell power signal detected in the inner most area of the inner sectors, called critical area here, depends mainly on the nature of the side and back lobes of the antenna radiation beam pattern. This area where due to back and side lobe effects all six sectors might become dominant is characterized by highly defragmented best server map and bad SINR. This effect is investigated in this paper using a ray tracing approach for a 3D model of urban scenario using a real antenna radiation pattern provided from antenna manufacturer, KATHREIN, and shown in Figure 1(c) for specific tilt settings. Furthermore, the fact that outer sector radiation pattern becomes randomly dominant in the critical area creates more coverage granularities and coverage boundaries inside the inner sectors. This would have impact on user mobility related network operation like handover (HO), radio link failure (RLF) and ping-pong. This paper work presents an alternative VS deployment by introducing a super-cell resulting from combining the inner sectors to act as a quasi omni-directional antenna sector by IEEE ICC 2014 - Wireless Communications Symposium 978-1-4799-2003-7/14/$31.00 ©2014 IEEE 5106
-
Upload
trinhtuong -
Category
Documents
-
view
216 -
download
0
Transcript of Super-Cell From Inner Sectors of Active Antenna System ... · PDF fileSuper-Cell From Inner...
Super-Cell From Inner Sectors of Active Antenna
System (AAS) - Vertical Sectorization
Dereje W. Kifle ∗, Bernhard Wegmann ∗, Petri Eskelinen†, Ingo Viering‡, Anja Klein§
∗Nokia Solutions and Networks, Munich, Germany: {dereje.woldemedhin.ext; bernhard.wegmann
@nsn.com}†Magister Solutions Ltd, Finland: { [email protected]}
‡Nomor Research GmbH, Munich, Germany: { [email protected]}§Technische Universitat Darmstadt Communications Engineering Lab, Darmstadt, Germany: { [email protected]}
Abstract—Active Antenna System (AAS) is an advanced an-tenna technology that features the ability of advanced beam-forming techniques to provide a great flexibility in cellularnetwork deployment which enables improvements in networkcapacity and coverage. Conventionally, network dimensioning isdone based on busy hour traffic leading to cost-intensive over-dimensioning for most of the time via deploying additional macroand small cells. In AAS, however, varying traffic concentrationscan be flexibly handled by dynamic cell densification, e.g. bysplitting a sector into smaller ”sub-sectors”. Vertical sectorizationis a well-known approach where a conventional sector is splitvertically in to two, inner and outer sectors, resulting in 3x2sectors per site for AAS-based tri-sectorized site. In this paperwork, an alternative vertical sectorization deployment configu-ration is presented where the inner sectors build a so calledsuper-cell resulting from transmitting the same cell informationin all inner sectors. Investigation results show that the super-cellconfiguration can mitigate unwanted back and side lobe effectsin close proximity of the site and, therefore, provides a significantgain for users in this coverage area.
Index Terms—Active Antenna Systems, Vertical Sectorization,Super-cell, Mobility
I. INTRODUCTION
Cellular communication technology has undergone a dra-
matic evolution through different generation (G), i.e. 2G, 3G,
and 4G, in the last two decades featuring various advanced
service capability. Also cell site architecture was evolving in
a way to allow more flexible and cost-efficient cell deployment
by means of remote radio heads (RRH) [1]. The next stage
in the evolution of the site architecture is the active antenna
system (AAS) where separate transceivers and amplifiers are
distributed across the antenna elements providing, in addition,
flexible beam shaping capability. In 3GPP RAN work group
(WG) 4 [2], a study item has been approved on the RF
and Electromagnetic Compatibility (EMC) requirements for
AAS based on a macro-cell deployment scenarios targeting
an improved system capacity and simplified site-deployment.
One of the requirements of AAS in [2] [3] is flexibility in
cell lay out deployment by cell-splitting using beamforming
techniques such as sectorization in horizontal and vertical
planes to achieve a better capacity/performance gain compared
to a BS installed with a traditional antenna. Vertical Sectoriza-
tion (VS) is a scheme where a conventional cellular sector is
split into two, inner and outer sectors, by using two dedicated
beams each having its own electrical tilt per vertical sector
and formed from a group of multiple active array elements
of the AAS arranged vertically as shown in Figure 1(a). The
total system bandwidth can be used independently in the inner
and outer sectors, and this will double the amount of the
total radio resources per a conventional sector. System level
simulations have been performed for the Long Term Evolution
(LTE) systems in [4] and results have shown that vertical
sectorization can provide a significant capacity gain. Figure
1(b) depicts a 3x2 sectors per site where a vertical sectorization
is applied on a standard tri-sectorized deployment.
RATs like LTE and UMTS are spectral efficient and are
operated with a frequency reuse of one. As a result, in a sector-
ized cell deployment, intra-site co-channel interference is more
critical issue, in particular, the sector area in close vicinity
to the antenna heavily suffers from interference due to the
effect from back and side lobes of antenna radiation leaking
to neighboring sectors. The interference level gets worse with
vertical sectorization due to the addition of additional adjacent
vertical sectors. The 3GPP Adjacent Channel Interference
Ratio (ACIR) criteria is investigated in [5] to evaluate the
impact of VS and to verify the AAS-based BS capabilities with
the existing BS requirements for LTE systems. Furthermore, in
the real world propagation environment, the serving cell power
signal detected in the inner most area of the inner sectors,
called critical area here, depends mainly on the nature of the
side and back lobes of the antenna radiation beam pattern.
This area where due to back and side lobe effects all six
sectors might become dominant is characterized by highly
defragmented best server map and bad SINR. This effect is
investigated in this paper using a ray tracing approach for a 3D
model of urban scenario using a real antenna radiation pattern
provided from antenna manufacturer, KATHREIN, and shown
in Figure 1(c) for specific tilt settings. Furthermore, the fact
that outer sector radiation pattern becomes randomly dominant
in the critical area creates more coverage granularities and
coverage boundaries inside the inner sectors. This would
have impact on user mobility related network operation like
handover (HO), radio link failure (RLF) and ping-pong.
This paper work presents an alternative VS deployment by
introducing a super-cell resulting from combining the inner
sectors to act as a quasi omni-directional antenna sector by
IEEE ICC 2014 - Wireless Communications Symposium
978-1-4799-2003-7/14/$31.00 ©2014 IEEE 5106

10
20
30 30
210
240
90
270
120
300
150
330
180 0
Inner and Outer Sector Elevation Plane Radiation PatternTotal Tilt = Electrical Tilt + 4° Mechanical Tilt
angle in [°]
ele
vation p
att
ern
gain
[dB
]
40
50 60horizontal/vertical plane
Inner Sector: 14° Tilt
Outer Sector: 4° Tilt
()
Inner Sector Outer Sector
(a) (b)
(c)
Fig. 1. Vertical Sectorization
using simulcast concept [6] while the standard sectorized
configuration is still assumed for the outer sectors. Simulative
investigations using a realistic 3D ray tracing propagation
model have shown that the super-cell deployment in VS
significantly improves the performance of users in critical
areas inside the inner sectors by mitigating the interference
problem and reducing the mobility aspect issues mentioned
above.
The rest of the paper is organized as follows: Section II
presents the super-cell deployment concept with respect to VS
for AAS in detail. The scenario and system model utilized for
the investigation is described in Section III. The results of the
performance evaluation are discussed in Section IV and finally
Section V concludes the work.
II. SUPER-CELL DEPLOYMENT IN AAS-VS
Super-cell technology is a scheme of deployment that makes
multiple cells to act as one by assigning identical cell IDs to
each cells and hence eliminates inter-cell boundaries and co-
channel interference among the cells. This involves simulcast
transmission of identical signals to different cell antenna
from the same baseband unit (BBU) [6]. In [7], super-cell
configuration is discussed in a coordinated clustered multi-cell
cellular systems where a number of coordinating BSs serving
a defined super-cell area are linked by fibers and their signals
are jointly processed by a central unit in-order to reduce the
inter-cell interference.
Assuming a standard sectorized site deployment with 3
Fig. 2. Super-cell in AAS-based Vertical Sectorization (VS)
conventional sector per site and corresponding sector index
k, the power received by a user u from a sector located at
a site j, cj,kγ, is described by Pu
cj,kγwhere cj,kγ
represents
a sector with a unique cell ID and the parameter γ is intro-
duced to identify a sub-sector at sector k in case of vertical
sectorization. Thus, γ takes values of 1 and 2 to represent
inner and outer sector respectively when vertical sectorization
scenario is considered. The serving sector of u is represented
by cuju,kuγ
and it is the kuγ sub-sector located at a site ju and the
corresponding received power is given by Pucuj,ku
γ
. Assuming a
3x2 AAS-based VS deployment, and an inner sector user userved by one of the inner sectors, ku1 , the total interference
power received at u, IuTot, from inter-site Iuinter(γ) and intra-
site Iuintra(γ) inner and outer sectors can be described as:
IuTot =Iuinter(1) + Iuinter(2) + Iuintra(1)+ Iuintra(2)
,
=∑
jj 6=ju
∑
k
Pucj,k1
+∑
jj 6=ju
∑
k
Pucj,k2
+∑
kk 6=ku
1
Pucju,k1
+∑
k
Pucju,k2
(1)
And the Signal to Interference and Noise (N) Ratio (SINR)
becomes:
SINRu =Pucuju,k1
IuTot +N(2)
In this paper, a super-cell configuration is implemented
for the inner sectors to eliminate the intra-site inner sectors’
interference contribution and to mitigate the bad effects of the
antenna radiation pattern. Accordingly, the inner sectors will
be virtually combined and assigned identical cell ID giving
rise to one inner-sector called super-cell eliminating the inter-
sector boundaries between the inner sectors as shown in Figure
2. In this configuration, the digital base band signal from one
BBU is split up and transmitted to the AAS of each sector
where the corresponding RF modulated signal is emitted by
the beam pattern determining the inner sectors. As a result, a
user will no longer see three distinct inner sectors from site jrather identical signals from each sectors’ AAS regarded as a
super-cell signal. Hence, the the desired signal power received
by an inner-sector user u from its serving supper-cell located
at a site ju can be seen as the superposition of the signals
IEEE ICC 2014 - Wireless Communications Symposium
5107
∆ SINR
0
2
4
6
8
10
−1 0 1 2 3 4 5 6 7 8 9 100
0.2
0.4
0.6
0.8
1
∆ SINR per PRB [dB]
CD
F
∆ RSRP
0
1
2
3
4
5∆ Interference
−8
−7
−6
−5
−4
−3
−2
−1
0
(c) (d)
(b)(a)
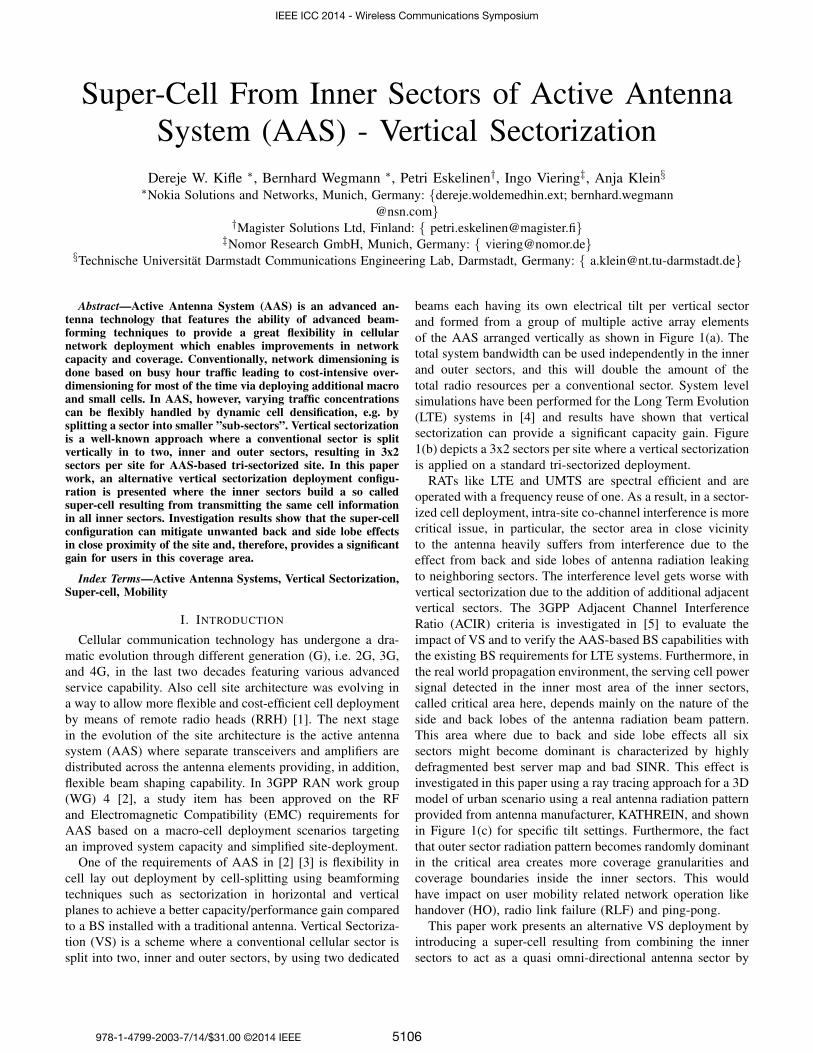
Fig. 3. Observed change in SINR, RSRP and Interference after a super-cell configuration is employed in AAS-based 3x2 VS [colorbar scale in dB].
transmitted by AAS of the sub-sectors of the super-cell:∑
k
Pucuju,k1
(3)
Furthermore, since inner-sector combining lowers the number
of neighboring vertical sectors in the VS configuration, it
significantly reduces the level of the inter-sector interference
inside the inner sectors in particular the intra-site inter-inner
sector interference is eliminated. Thus, equation 1 is reduced
to:
IuTot =∑
jj 6=ju
∑
k
Pucj,k1
+∑
jj 6=ju
∑
k
Pucj,k2
+∑
k
Pucju,k2 (4)
Consequently, the SINR experience is significantly improved:
SINRu =
∑k P
ucuju,k1
IuTot +N(5)
Besides, the stronger desired signal resulted from the super-
position leads to a better and smoother super-cell coverage
by nearly eliminating the defragmented coverage boundaries
and granularities problem from the inner sectors caused by
the radiation pattern effect observed in the case of the 3x2
VS deployment. This improves mobility related issues for
a moving user thereby yielding a better service experience.
Moreover, the super-cell implementation reduces the number
of BBUs needed to have the same sector coverage with
the conventional three sector deployment, hence, it offers
economical benefit to an operator by saving extra cost of
infrastructure. However, the super-cell operation has a trade-
off that while using the same BBU, it allocates the base band
resources available per a conventional sector to the super-cell
resulting in total resource reduction in the super-cell coverage
area. For example, in a 10 MHz LTE system bandwidth, 50
Physical Resource Blocks (PRBs) are assumed per sector, thus,
after combining the three inner sectors and make them to
act as one, only these 50 PRBs are assigned to the super-
cell thereby reducing the total radio resources to 1/3 in the
inner sectors’ coverage area. On the other hand, in contrast
to the 3x2 VS which creates coverage imbalance due to small
inner and larger outer sectors’ size, the super-cell configuration
results in a better balanced sectors’ coverage leading to a more
fairly distributed traffic sharing among the inner and outer
sectors in the system.
III. SCENARIO AND SYSTEM MODEL DESCRIPTION
For the investigation, a 3D model of the city of Mu-
nich, Germany, and corresponding urban clutter behavior is
considered in a network planning tool that employs a ray
tracing technique to predict a propagation map. The scenario
assumes 27 sectorized sites where the site plan and system
parameters configuration settings are done based on realistic
site deployment. The network is divided in to a grid of pixels
with a resolution of 5 m where a pixel represents a potential
location of user u and the received power from a transmitter
is predicted at each pixel point. The tool utilizes real two
2D plane antenna radiation patterns, azimuth and elevation,
provided by antenna manufacturer and a horizontal projection
interpolation (HPI) technique is employed to estimate the
corresponding 3D radiation pattern needed during propagation
map prediction [8]. An LTE down-link operating at 2.6 GHz
carrier frequency and 10 MHz of system bandwidth with a
total of 50 PRBs is assumed. Dominant path Prediction Model
(DPM) setting is used for the ray-tracer to generate an outdoor
IEEE ICC 2014 - Wireless Communications Symposium
5108
propagation map [9]. The indoor propagation is predicted from
the outdoor propagation map by applying 20 dB penetration
loss to strongest of all received signals at the pixels around
a building and an additional attenuation loss of 1 dB/pixel.
The vertical sectorization is realized by configuring the tilt of
the inner and outer sectors’ beam to 14◦ and 4◦ respectively,
and a transmit power of 20 W is assumed for each inner and
outer sectors. Due to the limitation to the extent of electrical
tilt setting of the antenna used, additional mechanical tilt of
4◦ is applied to extend the range of total tilt setting where
maximum electrical tilting considered here is 10◦. For the
mobility aspect investigation, a total of 1000 moving users
are considered where 500 of them are pedestrian moving with
a velocity of 3 km/h walking indoor and outdoor, and the rest
500 are fast moving vehicular users having a velocity of 30
km/h and are always on a street.
IV. RESULTS AND PERFORMANCE EVALUATION
In this section, the performance evaluation in real world LTE
scenario is presented. The investigation shows the advantages
and the tradeoffs of the super-cell deployment compared to
the 3x2 VS and standard sectorized (without VS) deployment
cases.
A. Interference Mitigation and SINR Performance
It is apparent that the inter-sector co-channel interference
level increases with the number of sectors operating with the
same carrier frequency. In the 3x2 vertical sectorization, the
area closer to the base station is suffering from up to 5 strong
interfering intra-site sectors as well as rather degragmented
and frequently changing best server zones. Since the super-
cell deployment combines the three inner sectors to one, it
reduces the number of interfering intra-site sectors leading to
an improved interference situation compared to the 3x2 VS
scenario as discussed before. Previous AAS vertical sectoriza-
tion studies [10] show that the inner and outer sectors’ main
beam should have a reasonably high tilt separation gap in order
to mitigate the resulting sector overlap, i.e. large down-tilts are
needed for the inner-sectors. In this paper, the inner sectors
are configured to 14◦ while outer sectors’ tilts are fixed to 4◦.
Moreover, as explained in [11], electrical downtilting of the
boresight of an antenna causes the side and back lobes to be
downtilted as well with the same amount of tilting. This effect
further worsens the interference situation in the inner sectors
area in the case of the 3x2 vertical sectorization as the side and
back lobes of the three aggressively down-tilted inner sectors
considerably contribute to high interference in close proximity
of the base station. In the super-cell case, however, this effect
is mitigated as those lobes from the inner sectors will no
longer interfere each other, rather contribute to the desired
signal. Thus, the different signals from the corresponding inner
sector’s antenna arrays are seen as a replica signal similar
like the various paths from multi-path propagation as they are
transmitting the identical cell information and carry the same
cell ID. This significantly improves the strength of signal level
at the users as long as the different replicas are received within
−6 −4 −2 0 2 4 6 80
0.1
0.2
0.3
0.4
0.5
0.6
0.7
0.8
0.9
1
SINR per PRB [dB]
CD
F
SINR per PRB, Statistics Sample Area Size: 200X200[m]
0 100 200 300 400 500 600 7000
0.1
0.2
0.3
0.4
0.5
0.6
0.7
0.8
0.9
1Throughput per PRB, Statistics Sample Area Size: 200X200[m]
Throughput per PRB [Kbps]
CD
F
3x2 VS: Site−7
3x2 VS: Site−12
3x2 VS: Site−16
3x2 VS: Site−22
3x2 VS: Site−26
Super−cell VS: Site−7
Super−cell VS: Site−12
Super−cell VS: Site−16
Super−cell VS: Site−22
Super−cell VS: Site−26
Gain
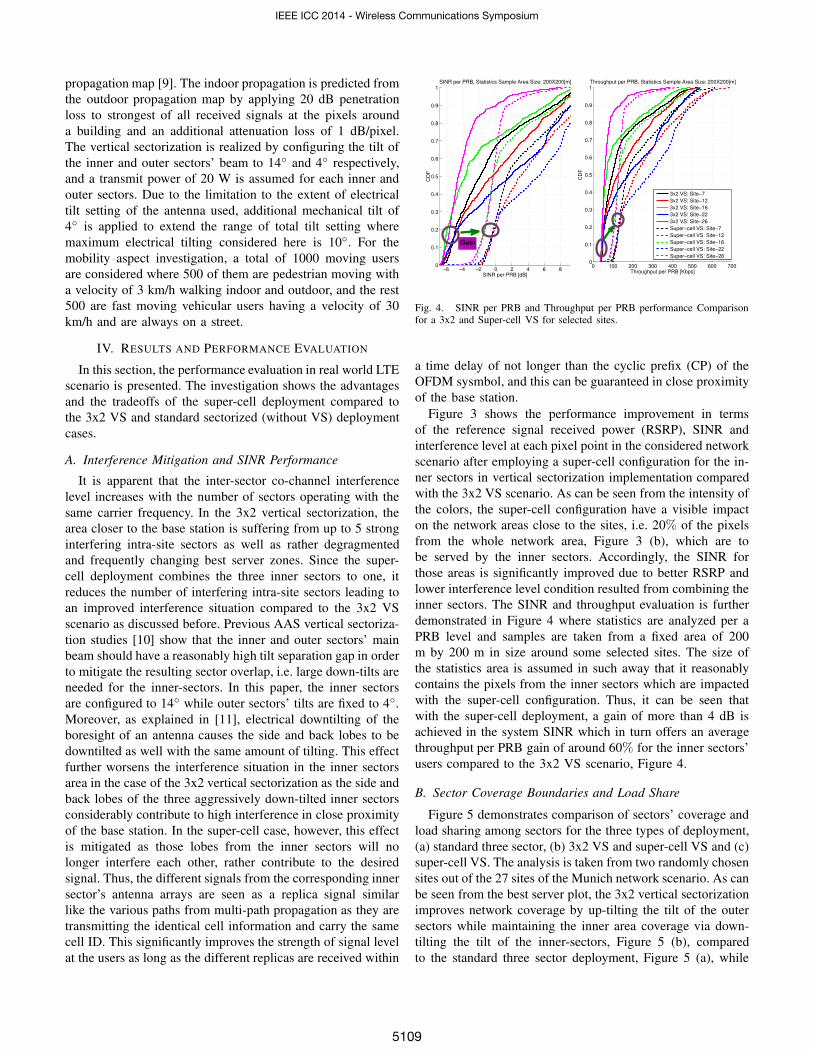
Fig. 4. SINR per PRB and Throughput per PRB performance Comparisonfor a 3x2 and Super-cell VS for selected sites.
a time delay of not longer than the cyclic prefix (CP) of the
OFDM sysmbol, and this can be guaranteed in close proximity
of the base station.
Figure 3 shows the performance improvement in terms
of the reference signal received power (RSRP), SINR and
interference level at each pixel point in the considered network
scenario after employing a super-cell configuration for the in-
ner sectors in vertical sectorization implementation compared
with the 3x2 VS scenario. As can be seen from the intensity of
the colors, the super-cell configuration have a visible impact
on the network areas close to the sites, i.e. 20% of the pixels
from the whole network area, Figure 3 (b), which are to
be served by the inner sectors. Accordingly, the SINR for
those areas is significantly improved due to better RSRP and
lower interference level condition resulted from combining the
inner sectors. The SINR and throughput evaluation is further
demonstrated in Figure 4 where statistics are analyzed per a
PRB level and samples are taken from a fixed area of 200
m by 200 m in size around some selected sites. The size of
the statistics area is assumed in such away that it reasonably
contains the pixels from the inner sectors which are impacted
with the super-cell configuration. Thus, it can be seen that
with the super-cell deployment, a gain of more than 4 dB is
achieved in the system SINR which in turn offers an average
throughput per PRB gain of around 60% for the inner sectors’
users compared to the 3x2 VS scenario, Figure 4.
B. Sector Coverage Boundaries and Load Share
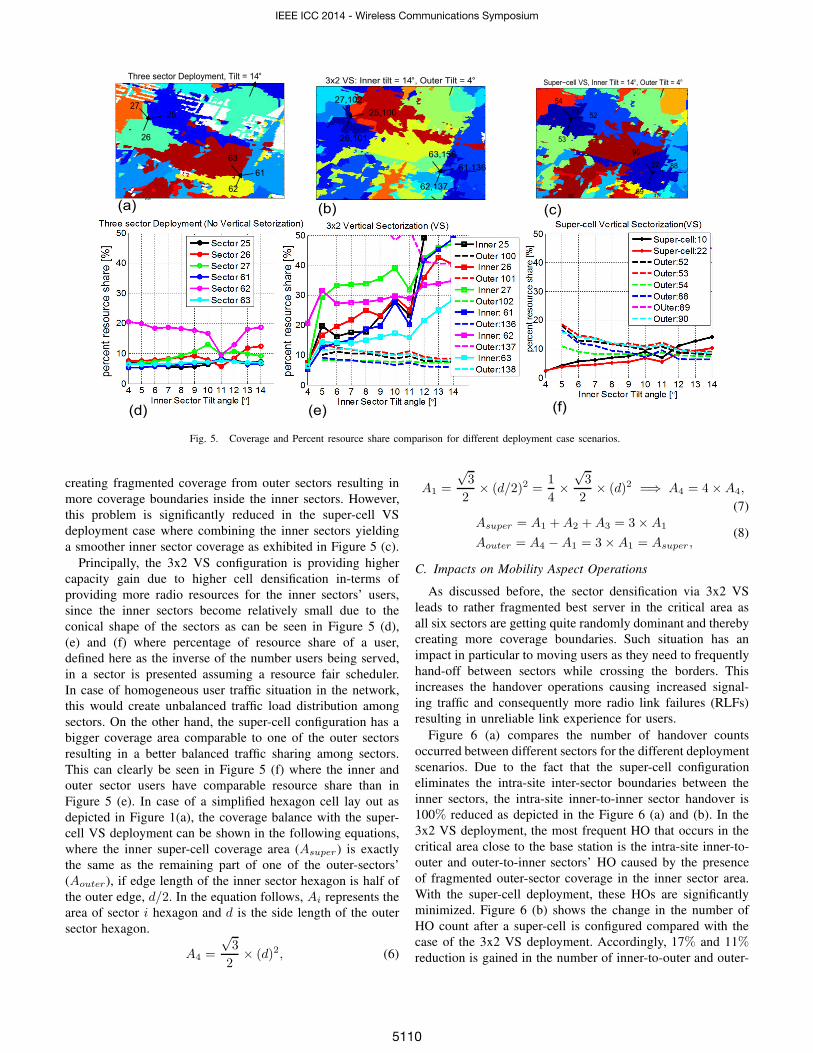
Figure 5 demonstrates comparison of sectors’ coverage and
load sharing among sectors for the three types of deployment,
(a) standard three sector, (b) 3x2 VS and super-cell VS and (c)
super-cell VS. The analysis is taken from two randomly chosen
sites out of the 27 sites of the Munich network scenario. As can
be seen from the best server plot, the 3x2 vertical sectorization
improves network coverage by up-tilting the tilt of the outer
sectors while maintaining the inner area coverage via down-
tilting the tilt of the inner-sectors, Figure 5 (b), compared
to the standard three sector deployment, Figure 5 (a), while
IEEE ICC 2014 - Wireless Communications Symposium
5109
25
26
27
61
62
63
66
Three sector Deployment, Tilt = 14°
3200 3300 3400 3500 3600 3700 3800 3900 4000
4600
4700
4800
4900
5000
5100
5200
5300
5400
5500
25,100
26,101
27,102
58,133
61,136
62,137
63,138
3x2 VS: Inner tilt = 14°, Outer Tilt = 4°
4500
4600
4700
4800
4900
5000
5100
5200
5300
5400
10
17
22
23
52
53
54
73
89
88
90
93
Super−cell VS, Inner Tilt = 14°, Outer Tilt = 4°
3200 3300 3400 3500 3600 3700 3800 3900 40004500
4600
4700
4800
4900
5000
5100
5200
5300
5400
(a)
(f)(e)(d)
(c)(b)
Fig. 5. Coverage and Percent resource share comparison for different deployment case scenarios.
creating fragmented coverage from outer sectors resulting in
more coverage boundaries inside the inner sectors. However,
this problem is significantly reduced in the super-cell VS
deployment case where combining the inner sectors yielding
a smoother inner sector coverage as exhibited in Figure 5 (c).
Principally, the 3x2 VS configuration is providing higher
capacity gain due to higher cell densification in-terms of
providing more radio resources for the inner sectors’ users,
since the inner sectors become relatively small due to the
conical shape of the sectors as can be seen in Figure 5 (d),
(e) and (f) where percentage of resource share of a user,
defined here as the inverse of the number users being served,
in a sector is presented assuming a resource fair scheduler.
In case of homogeneous user traffic situation in the network,
this would create unbalanced traffic load distribution among
sectors. On the other hand, the super-cell configuration has a
bigger coverage area comparable to one of the outer sectors
resulting in a better balanced traffic sharing among sectors.
This can clearly be seen in Figure 5 (f) where the inner and
outer sector users have comparable resource share than in
Figure 5 (e). In case of a simplified hexagon cell lay out as
depicted in Figure 1(a), the coverage balance with the super-
cell VS deployment can be shown in the following equations,
where the inner super-cell coverage area (Asuper) is exactly
the same as the remaining part of one of the outer-sectors’
(Aouter), if edge length of the inner sector hexagon is half of
the outer edge, d/2. In the equation follows, Ai represents the
area of sector i hexagon and d is the side length of the outer
sector hexagon.
A4 =
√3
2× (d)2, (6)
A1 =
√3
2× (d/2)2 =
1
4×
√3
2× (d)2 =⇒ A4 = 4×A4,
(7)
Asuper = A1 +A2 +A3 = 3×A1
Aouter = A4 −A1 = 3×A1 = Asuper ,(8)
C. Impacts on Mobility Aspect Operations
As discussed before, the sector densification via 3x2 VS
leads to rather fragmented best server in the critical area as
all six sectors are getting quite randomly dominant and thereby
creating more coverage boundaries. Such situation has an
impact in particular to moving users as they need to frequently
hand-off between sectors while crossing the borders. This
increases the handover operations causing increased signal-
ing traffic and consequently more radio link failures (RLFs)
resulting in unreliable link experience for users.
Figure 6 (a) compares the number of handover counts
occurred between different sectors for the different deployment
scenarios. Due to the fact that the super-cell configuration
eliminates the intra-site inter-sector boundaries between the
inner sectors, the intra-site inner-to-inner sector handover is
100% reduced as depicted in the Figure 6 (a) and (b). In the
3x2 VS deployment, the most frequent HO that occurs in the
critical area close to the base station is the intra-site inner-to-
outer and outer-to-inner sectors’ HO caused by the presence
of fragmented outer-sector coverage in the inner sector area.
With the super-cell deployment, these HOs are significantly
minimized. Figure 6 (b) shows the change in the number of
HO count after a super-cell is configured compared with the
case of the 3x2 VS deployment. Accordingly, 17% and 11%reduction is gained in the number of inner-to-outer and outer-
IEEE ICC 2014 - Wireless Communications Symposium
5110

−700
−600
−500
−400
−300
−200
−100
0
100
200
∆#H
OC
ou
nt
∆ #HOCount = #HOCountsuper−cell
− #HOCount3x2 VS
intra site in−>out
intra site out−>in
inter site in−>out
inter site out−>in
intra site in−>in
inter site in−>in
in −> any HO RLF
intra site out−>out
inter site out−>out
out −>any HO RLF
Standard Deployment Super−cell VS 3x2 VS0
2000
4000
6000
8000
10000
12000
#H
OC
ou
nt
HO Count Comparisonintra site in−>out
intra site out−>in
inter site in−>out
inter site out−>in
intra site in−>in
inter site in−>in
in −> in HO RLF
intra site out−>out
inter site out−>out
out −>out HO RLF
Standard Deployment Super−cell VS 3x2 VS0
50
100
150
200
250
300
350
400
#R
LF
Vehicular
Pedestrian
Supercell Inner Vehicular
Supercell Outer Vehicular
Supercell Inner Pedestrian
Supercell Outer Pedestrian
VS Inner Vehicular
VS Outer Vehicular
VS Inner Pedestrian
VS Outer Pedestrian
(a) (b)(c)
Fig. 6. Coverage and Percent resource share comparison for different deployment case scenarios.
to-inner sector intra-site HO counts respectively. Moreover, the
fact that the critical area users suffer from high interference
from side and back lobes leads to an increased number of HO
RLF in the case of 3x2 VS deployment where a handover is
triggered but not executed in time and in the meanwhile the
moving user fails to connect any longer due to bad connection
caused by deep interference situation. As can be seen in Figure
6 (b), the super-cell configuration incredibly reduces the HO
RLF in the fragmented critical area by 70% for users served
by the inner sectors and by 21% for users doing handover from
the outer sector coverage region via significantly reducing the
interference situation as illustrated in Figure 3 (d). On the other
hand, the superposition of the signals from the sub-sectors of
a super-cell creates an improved and extended inner sectors’
coverage. This introduces coverage boundaries between inter-
site inner sectors increasing probability of a handover between
inter-site inner-inner and outer-inner sectors unlike to the 3x2
VS deployment case as indicated in Figure 6 (b).
In addition to the HOs, aggressive interference situation in
the critical area results in more RLFs. Figure 6 (c) shows
the number of RLFs comparison for the three deployment
scenarios for pedestrian and vehicular users separately. RLF
ratio is defined here as the ratio of the total number of RLF
to total number of HO. Accordingly, RLF ratio of 3.6% is
observed in the case of 3x2 VS whereas this figure gets
reduced to 2.4% in the case of super-cell deployment and
the absolute number of RLFs in the super-cell is dramatically
reduced by 66% due to aforementioned reason.
V. CONCLUSION
In this paper, a super-cell configuration is presented as
an alternative way of vertical sectorization in AAS-based
deployment. Results have shown that the super-cell compared
to the traditional 3x2 VS deployment offers a significant per-
formance improvement for inner-sectors’ users, in particular
to those in a close proximity of the base station, by mitigating
the intra-site inter-sector interference as well as the spotted
and defragmented best server map resulting from side and
back lobes effects of six overlaying beams each representing
a separate cell. Both effects are dramatically reduced with
the super-cell configuration by emitting the same RF signal
over the inner heavily tilted beams and making those intra-
site inter-sector lobes to combine them into a single cell.
Simulcast of inner sectors yields a stronger serving signal
power thereby leading to a smoother and improved inner-
sector coverage. Besides, the reduction of the coverage granu-
larities and coverage boundaries in those areas considerably
reduces the number of frequent HO operations and RLFs
yielding a better situation for a seamless service experience for
users. Another interesting economical benefit to operators by
saving infrastructure costs results from the fact that the super-
cell deployment is implemented with a reduced number of base
band units compared to the 3x2 AAS-enabled VS deployment.
REFERENCES
[1] G.Kardaras and C.Lanzani, “Advanced multimode radio for wireless andmobile broadband communication,” in European Wireless Technology
Conference, EuWIT 2009, September 2009, pp. 132–135.[2] 3GPP, “Study of RF and EMC requirements for active antenna array
system (AAS) base station, RP-111349,” 3GPP TSG-RAN Mettings #53,Tech. Rep., 2011.
[3] 3GPP, “Application scenarios for aas, R4-120608,” 3GPP TSG-RANWG4 Mettings #62, Tech. Rep., 2011.
[4] O. N. C. Yilmaz, S. Hmlinen, and J. Hmlinen, “System level analysis ofvertical sectorization for 3GPP LTE,” in 6th International Symposium
on Wireless Communication Systems 2009. ISWCS 2009., Sept 2009, pp.453–457.
[5] P. Kang, Q. Cui, S. Chen, and Y. Liu, “Performance evaluation oncoexistence of LTE with active antenna array systems,” in 2012 IEEE
23rd International Symposium on Personal Indoor and Mobile Radio
Communications (PIMRC), Sept 2012, pp. 1066–1070.[6] S. Ariyavisitakul, T. Darcie, L. Greenstein, M. R. Phillips, and N. K.
Shankaranarayanan, “Performance of simulcast wireless techniques forpersonal communication systems,” in IEEE Journal on Selected Areas
in Communications, vol. 14, August 1996, pp. 632–643.[7] J. C. Lin, Recent Advances in Wireless Communications and Networks.
InTech, 2011.[8] R. Hoppe, “Comparison and evaluation of algorithms for the interpo-
lation of 3D antenna patterns based on 2D horizontal and 2D verticalpatterns,” AWE Communications GmbH, Tech. Rep., 2003.
[9] S. Burger, “Accuracy of winprop 3D intelligent ray tracing,” AWECommunications GmbH, Tech. Rep., 2003.
[10] M.Caretti, M.Crozzoli, G.M.D.Aera, and A.Orlando, “Cell splittingbased on active antennas:performance assessment for lte system,” in2012 IEEE 2012 IEEE 13th Annual Wireless and Microwave Technology
Conference (WAMICON), vol. 14, April 2012, pp. 1–5.[11] P. M. J. Louis, “Electrical and mechanical downtilt and their effects on
horizontal pattern performance,” CommScope/ANDREW, Tech. Rep.,2010.
IEEE ICC 2014 - Wireless Communications Symposium
5111