
Sunrise Communications Group AG
27
Sunrise Communications Group AG Q2 2018 financial results – 23 August 2018
Transcript of Sunrise Communications Group AG

Sunrise Communications Group AG
Q2 2018 financial results –23 August 2018

Agenda
1 Summary & operational update O. Swantee (CEO)2 Financials A. Krause (CFO)3 Conclusion O. Swantee (CEO)4 Q & A
2
Summary Q2 confirms strong start to the year – raising FY’18 guidance
3
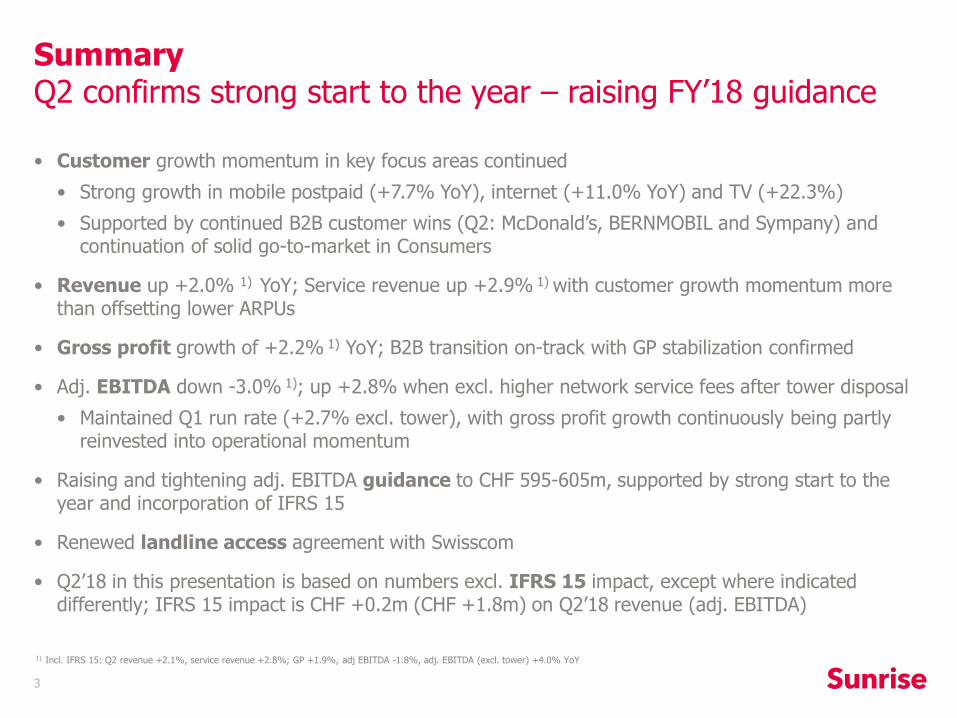
• Customer growth momentum in key focus areas continued
• Strong growth in mobile postpaid (+7.7% YoY), internet (+11.0% YoY) and TV (+22.3%)
• Supported by continued B2B customer wins (Q2: McDonald’s, BERNMOBIL and Sympany) and continuation of solid go-to-market in Consumers
• Revenue up +2.0% 1) YoY; Service revenue up +2.9% 1) with customer growth momentum more than offsetting lower ARPUs
• Gross profit growth of +2.2% 1) YoY; B2B transition on-track with GP stabilization confirmed
• Adj. EBITDA down -3.0% 1); up +2.8% when excl. higher network service fees after tower disposal
• Maintained Q1 run rate (+2.7% excl. tower), with gross profit growth continuously being partly reinvested into operational momentum
• Raising and tightening adj. EBITDA guidance to CHF 595-605m, supported by strong start to the year and incorporation of IFRS 15
• Renewed landline access agreement with Swisscom
• Q2’18 in this presentation is based on numbers excl. IFRS 15 impact, except where indicated differently; IFRS 15 impact is CHF +0.2m (CHF +1.8m) on Q2’18 revenue (adj. EBITDA)
1) Incl. IFRS 15: Q2 revenue +2.1%, service revenue +2.8%; GP +1.9%, adj EBITDA -1.8%, adj. EBITDA (excl. tower) +4.0% YoY

Strong postpaid customer growth continues
4
• Postpaid driven by primary SIMs, leading to 1.66m total subscriptions (+7.7% YoY)
• Primary SIMs driven by B2B, Sunrise ONE, solid contribution of budget brand ‘yallo’ via online channel, strong network quality, broad product offering with attractive price performance ratio, and diversified distribution channels
• Secondary data SIMs supported by demand for mobile broadband and Apple watch
• Prepaid with ongoing pre- to postpaid migration, leading to 687k total subscriptions
• Steady development at Sunrise brand; Q2 impacted by ethnic segment where strengthened focus on value management was applied
19 21 20 20 21
8 6 11 11 9
Q2’18Q4’17
31
Q3’17
2730
Q1’18
31
Q2’17
26
Primary
Secondary
-39
-30
-40
-9-6
Q1’18Q4’17Q3’17Q2’17 Q2’18
Postpaid mobile net adds (‘000) Prepaid mobile net adds (‘000)

11
9
121212
Q2’18Q1’18Q4’17Q3’17Q2’17
Growing internet and TV customer base
5
• TV with solid growth: Sunrise now has 229k TV subscriptions
• Supported by attractive Sunrise TV offering and improved TV sports content with Sky and Teleclub
• 28% YoY increase in 4P billed customer base
• Internet continues to grow customer base: Sunrise now has 442k internet subscriptions
• Converged tariff ‘Sunrise ONE’ supported growth: 60k or 38% of billed 4P customer base already on Sunrise ONE (Q1: 54k or 36%)
• Q2 with dedicated fibre promotions and increase in fibre net adds
• Increased focus on service excellence including hassle-free switching
• ’More for more’ move 1) in mid 2018
97
131312
Q2’18Q1’18Q4’17Q3’17Q2’17
Internet net adds (‘000) TV net adds (‘000)
1) Internet Start tariff moving from CHF45 (40Mbit/s) to CHF50 (50Mbit/s); Internet Comfort moving from CHF65 (100Mbit/s) to CHF70 (200Mbit/s); getting implemented for new (July) and existing (August) customers; customers can choose to opt-out at existing terms

ARPU trends continuingIncl. IFRS 15 1)
6
• Blended internet & TV up CHF +2.3 YoY driven by TV customer growth
• Landline voice down CHF -3.9 YoY due to migration to flat rate packages and fixed to mobile/OTT migration resulting in reduced voice usage
-1.6
• Blended mobile ARPU up CHF +0.3 YoY due to growing postpaid subscribers, which have a higher ARPU than decreasing prepaid subscribers
• Postpaid CHF -0.8 YoY (Q1 CHF -1.0 YoY) mainly due to 2nd SIM dilution; Q1’18 tariff refresh ARPU neutral
• Prepaid decrease accelerated to CHF -1.6 (Q1: CHF -0.9 YoY): continued migration of high value prepaid customers to postpaid, increased OTT impact at ethnic brands and recent product launches (e.g. 24h unlimited offer)
22.923.825.025.126.8
Q2’17 Q2’18
YoY
49.249.248.748.247.0
Q2’17 Q2’18
YoY
-1.1 -1.1 -2.1-0.6
Blended mobile ARPU:
+0.5
-4.2
+1.7
Blended mobile ARPU (CHF)
Landline voice ARPU (CHF)
Blended internet & TV ARPU (CHF)
+0.1
-4.8
+2.1
-4.6
+0.5
+1.8
YoY
-4.8
+0.2
+2.3
-1.6 -1.1 -1.1 -2.1
32.330.5
MTR
31.5
-1.6
33.0
-1.4
32.0
-1.6
Q2’17 Q2’18
+0.5 +0.1 +0.5
YoY
+0.2
1) Q2’18 ARPUs excl. IFRS 15: Blended mobile: CHF 32.3; landline voice CHF 22.9; blended internet & TV: CHF 49.2
+0.3
-3.9
+2.3

Spectrum auction scheduled for 2019
7
• Acquired in 2012 - secured until 2028
• Sunrise’s current spectrum provides an outstanding 2G to 4G+ coverage to Sunrise’s 25% subscriber market share
Spectrum in place (MHz)
30 40 50
4040
110
100
80
452020
2600 MHzpaired
130
2100 MHzpaired
120
1800 MHzpaired
150
900 MHzpaired
70
800 MHzpaired
60
2600 MHzunpaired
45
0
Sunrise
Competitors
Incremental spectrum to be allocated (MHz)
• Auction expected in Jan 2019 based on clock auction format; 15 years duration; much spectrum within 3500 MHz while less within 700 MHz; spectrum important for 5G
• Reduced leverage after tower disposal gives flexibility for strategic investments
• 2018-20 dividend guidance of 4-6% annual dividend growth takes into account near-term cash flow volatility from spectrum
300
10
9060
15
3500 - 3800 MHz
TDD unpaired
2600 MHzpaired
700 MHzpaired
700 MHz SDLunpaired
1400 MHz SDLunpaired
Paired (FDD) 2xMHz (UL & DL)Unpaired (TDD) 1xMHz (UL & DL)SDL (supplementary DL) 1xMHz (DL)
*

Financials
A. Krause (CFO)
8

Financial Overviewexcl. IFRS 15 1)
9
+2.0%
453
Q2’17 Q2’18
462
+2.8%
Q2’18
157
Q2’17
153
• Revenue up +2.0% due to service revenue
• Service revenue up +2.9% driven by mobile postpaid and internet/TV; Q2 run rate roughly in-line with Q1 (+3.0%)
• Adj. EBITDA down -3.0%
• Adj. EBITDA up +2.8% (Q1: +2.7%) when excluding higher network service fees after tower sale, driven by service revenue growth
Tower effect
+7.7%
Q2’18
156
1479
Q2’17
145
• Gross profit growth of +2.2% (Q1: +2.9%), service gross margin slightly down due to mix effects
• Adj. Opex up +7.7% due to tower disposal in Aug 2017 leading to increased network service fees; adj. Opex excl. tower up +1.6% (Q1: +3.1%)
2) Service revenue is total revenue excluding hubbing and mobile hardware revenues, which are low margin
+2.2%
Q2’18
304
Q2’17
298
Gross profit: Adj. Opex:
Total revenue:
+2.9%
Q2’18
375
Q2’17
364
Service revenue 2):
Revenue (CHFm)
Gross profit & adj. Opex (CHFm)
Adj. EBITDA (CHFm)
Adj. EBITDA excl. Tower effect:
Adj. EBITDA:
-3.0%
Tower effectQ2’18
148
157
-9
Q2’17
153
1) Incl. IFRS 15: Q2 revenue +2.1%, service revenue +2.8%; GP +1.9%, adj EBITDA -1.8%, adj. EBITDA (excl. tower) +4.0% YoY

463
9
11
452
5
453
462
0%
+2%
0%
Q2’18 Revenue IFRS 15
Q2’17 Revenue
Δ mobile postpaid
Δ hubbing (low-margin)
-7
Δ mobile hw(low-margin)
-7Δ mobile prepaid
-4Δ landline voice
Δ internet/TV
1
Service Revenue
Δ other
Q2’18 Revenue w/o IFRS 15
0IFRS 15
Revenue driven by postpaid, internet and TV
10
• Hubbing: international trading business which is volatile by nature
• Postpaid: strong customer growth driven by investments into quality, offsetting lower ARPU
• Internet/TV: strong customer growth
• Prepaid: pre- to postpaid migration and shift to OTT; prepaid accounting for ̴ 5% of total revenue
• Landline voice: fixed to mobile substitution, migration to flat rates, and OTT; landline voice accounting for ̴ 7% of total revenue
• Other: includes lower-margin areas such as volatile B2B equipment sales and wholesale
Revenue bridge (CHFm)
• Mobile hardware: depends on handset innovation, launches and pricing; variations across quarters lead to revenue volatility

Gross profit growth partly reinvested into operational momentum
11
+2.3Tower adj.
Tower effect
Q2’18
156
147
9
Q2’17
145
• Adj. Opex up to CHF 156m, mainly due to tower deconsolidation, following disposal in Aug 2017, leading to higher network service fees (CHF 9m)
• Costs excl. tower up to CHF 147m: cost savings reinvested into operational momentum, such as commercial expenses and front line (e.g. shops, B2B staff, B2B support center)
• Q3’18 to be impacted by tougher Opex comps 2)
• Gross profit +2.2% in Q2, driven by service revenue growth
• Service gross margin 1) slightly down: Positive impacts of MTR and utility access deals offset by revenue mix effects
+6.5
Q2’18
304
Q2’17
298
Service GM 1)81.2%81.8%
1) Service gross margin is calculated as total gross profit divided by service revenue (i.e. revenue excluding low-margin hardware and hubbing revenue)
Gross profit Adjusted Opex
2.2%
2.9%
0.3%0.2%
1.0%
Q2’17 Q2’18
Growth YoY
In CHFm
1.6%
3.1%2.4%
-0.9%
0.3%
Q2’17 Q2’18
Growth YoY excl. tower
In CHFm
2) Q3’17 had a slowdown in commercial expenses, which is not expected in Q3’18

eFCF driven by NWC as expected
12
eFCF 142
Other financ.
activities
(23)
Interest (35)
Tax (48)
Capex (322)
Δ NWC (16)
Reported EBITDA
586 588
31
(327)
(47)
(31)
(22)
192
• EBITDA impacted by tower disposal, largely offset by underlying growth
• NWC impacted by settlement of accrued roaming discounts, as highlighted at Q4’17 results
• Capex in-line with company expectation
• Interest with different timing of payments
• Other including installment of 2014 Swisscom access deal payment
• Leverage ratio slightly up due to dividend payment
• Reduced leverage after tower disposal gives flexibility for strategic investments e.g. into landline access and spectrum, while still paying progressive dividends
Q2’18 LTM Q1’18 LTM
Equity Free Cash Flow (CHFm) 1)
Leverage ratio 1)
DividendTower disposal
Q2’18
2.19
Q1’18
1.94
Q2’17
2.76
Net debt/adj. EBITDA
Capex (CHFm)
217 201
4546
4544
31
Q2’18 LTM
322
Q1’18 LTM
32721
Innovation & Development
Infrastructure & Δ Capex payables
Customer growth
Landline access
1) IFRS 15 has no impact on total eFCF as the impact on EBITDA is offset by the impact on NWC; eFCF chart: LTM EBITDA and ∆NWC are based on IFRS 15 for 2018 and are without IFRS 15 for 2017 quarters; Leverage ratio: LTM EBITDA is based on IFRS 15 for 2018 and without IFRS 15 for 2017 quarters; Leverage ratio is pro forma taking into account annualized network service fees related to tower disposal

Successful debt refinancing in Q2
13
• Extended maturity profile
• Weighted average cost of debt reduced from 1.9% to 1.5% based on leverage of 2.0-2.5x 2)
• Expecting slightly lower underlying annual cash interest expenses; expecting CHF 35m in 2018
• Refinancing is net debt neutral (pre transaction costs)
• Increased gross debt used for general corporate purposes, including landline upfront investments and spectrum
Maturity profile (CHFm) 1)
500
910
1,410
2019 2020 2021 2022
Term loan
Bond
As per 31 Mar 2018
200
20212019 2020 2024
1,410
2022 2023
Bond
Term loan
As per 30 Jun 2018
1) Excluding CHF 200m undrawn revolving credit facility, where the maturity was extended from 2021 to 2023
2) Interest rate on Term Loan based on CHFLIBOR (capped at 0%) plus a leverage-dependent margin

Renewed commercial agreement for access to FTTHand xDSL at roughly similar economic terms:
• 3.5 years duration starting in Jan 2019
• Total CHF 101m upfront investment split over 2019 (CHF 61m) and 2020/21 (CHF 20m each)
• Upfront investment higher than in 2014 (CHF 74m) due to >40% higher volumes than 2014
• Annual low single digit GP accretion (CHFm)
• Access via local utilities and Swisscom
• Expected increasing share, with Sunrise diversifying in urban areas to utility fibre
FTTH
Renewed landline access agreement with Swisscom
14
Sunrise with diversified landline access
• Access via Swisscom; Sunrise LLU providing low speeds
• Expected decreasing share as customers migrate to FTTH or mobile broadband
• Mid to long-term: Increasingly apply own mobile broadband (MBB) in rural/suburban areas, as speeds will increase (5G)
MBB
Copper/xDSL
Swisscom access renewal
2017 Long-term
Customers per technology

15
O. SwanteeCEO
Conclusion

Customer interface
392374
396
Swisscom SaltSunrise
Investing into 3 strategic growth priorities
16
• Q2 with solid demand for mobile tariffs, which were refreshed in Q1
• Internet tariffs with ‘more for more’ in mid 2018; further TV content improvement (e.g. Sky Show)
• B2B with launch of ‘Cloud Mobile Device Management’ (MDM); developed and further strengthened indirect sales organization in addition to own sales force; Q2 customer wins include McDonald’s, BERNMOBIL and Sympany
• Outstanding mobile network with leading dropped call ratios, 30Mbit/s average experienced download speed, and 99.9%/95.4% LTE population/geographic coverage covering 68% YoY data growth
• First 5G antenna started live operations in mid 2018; spectrum auction in Jan 2019
• Landline access via FTTH, xDSL, and MBB; improved MBB proposition in Q2
• No. 1 in ‘connect’ mobile shop test 2), supported by focus on NPS and ongoing shop refurbishment
• Targeted measures to improve propensity to call and customer onboarding journey in landline
• ‘Melectronics’ and ‘Interdiscount’ added to Yallo distribution channels; expanded Yallo in online
Networkquality
Innovative converged products
2) Source: Connect 07 2018
Leading European network quality 1)
Leading ‘connect’ shop test
Drive convergence
Sunrise
1) Source: P3 as per 24 November 2017; see FY’17 investor presentation for more details

• Equity FCF as expected; reduced leverage after tower disposal gives flexibility for strategic investments
• Adj. EBITDA (excl. tower effect) up with GP growth partly reinvested into operational momentum; Q3 will be impacted by roaming promo and tougher Opex comps
• Service Revenue growth driven by customer momentum
Q2 conclusionRaising and tightening FY’18 EBITDA guidance
17
• Continued strong subscriber growth in mobile postpaid, internet and TV; supported by B2B
Customers
Revenue
Profitability
Cash Flow
• Revenue: CHF 1,830-1,870m
• New adj. EBITDA: CHF 595-605m
• Capex 1): CHF 283-323m
• Dividend: CHF 4.15-4.25
Revised FY’18 guidance
1) Includes CHF 56m upfront investments for fibre access at SFN, IWB and SIG
New guidance
IFRS 15New guidance
excl. IFRS15
Organic impro-vement
Old guidance
excl. IFRS15
595-605
588-598
Mid
single
digit 2)
580-595Mid-high
single
digit 2)
2) Based on mid-end of guidance range
Adj. EBITDA bridge:

Q & A
18

Appendix
19

IFRS 15 update
20
IFRS 15 reporting at Sunrise
• Q2’18 in this presentation is based on numbers without IFRS 15, except where indicated differently
• IFRS report focuses primarily on IFRS 15; complementary it provides Q2’18 numbers under IAS 18 in the ‘operational and financial review’
+2.0%
462453
Q2’18 without and with IFRS 15
+2.1%
463453
Revenue
Adj. EBITDA
-3.0%
Q2’18w/o IFRS 15
148
Q2’17w/o IFRS 15
153
-1.8%
Q2’18IFRS 15
150
Q2’17w/o IFRS 15
153
+2.2%
304298
Gross Profit
Q2’18 with IFRS 15
+1.9%
303298
+0.2
+1.8
-0.8
• At Sunrise, the 2018 impact of IFRS 15 is mainly related to the capitalization of costs to obtain a contract, resulting in a positive Opex effect
• The 2018 adj. EBITDA upside from IFRS 15 is expected to be mid to high-single digit (CHFm); it will be offset by a low to mid single-digit YoY headwind in 2019 and 2020
Expected FY’18 impact

Income Statement
21
P&L (CHFm)Q2 2018
incl. IFRS 15
Q2 2018
excl. IFRS 15
Q2 2017
excl. IFRS 15
Mobile services 315 315 303
thereof mobile postpaid 203 203 192thereof mobile prepaid 25 25 32thereof hardware 65 65 60
Landline services 79 79 91
thereof landline voice 31 31 35
thereof hubbing 23 23 30
Landline internet & TV 69 69 60
Total revenue 463 462 453% YoY growth 2.1% 2.0% (3.9%)
Service revenue (total excl. hubbing & hardware) 374 375 364% YoY growth 2.8% 2.9% (3.4%)
COGS (159) (158) (156)
Gross profit 303 304 298% YoY growth 1.9% 2.2% 1.0%
% margin 65.6% 65.8% 65.7%
Opex (156) (159) (149)
EBITDA 147 145 149% YoY growth (1.4%) (2.6%) 0.7%
Adjusted EBITDA 150 148 153% YoY growth (1.8%) (3.0%) 1.7%
% margin 32.4% 32.0% 33.7%
% margin (excluding hubbing revenues) 34.1% 33.7% 36.0%
Depreciation and amortization (108) (108) (102)% YoY growth (5.5%) (5.5%) 13.3%
Operating income 39 38 47
Net financial items1 (4) (4) (12)
Income taxes (11) (11) (8)
Net income 24 22 27Thereof (before tax impact):
PPA effect (32) (32) (32)
1) To comply with the IFRS 9 requirements regarding debt modification adjustment, a financial gain of CHF 14 million was recognized in Q2 2018; the gain is equal to the difference between the present value of the cash flows under the original and modified terms discounted by the original effective interest rate

Cash Flow Statement
22
Cash Flow (CHFm)Q2 2018
incl. IFRS 15
Q2 2018
excl. IFRS 15
Q2 2017
excl. IFRS 15
EBITDA 147 145 149
Change in net working capital (15) (13) 32
Movement in pension and provisions 1 1 0
Interest paid (12) (12) (8)
Corporate income and withholding tax paid (5) (5) (5)
Cash flow from operating activities 115 115 169
Capex (82) (82) (86)
% Capex-to-revenue 17.6% 17.7% 19.1%
Sales of assets 0 0 0
Cash flow after investing activities 34 34 83
Repayment other financing items (0) (0) (0)
Proceeds/(repayments) from debt, net 186 186 (3)
Payment of dividend (180) (180) (150)
Total cash flow 39 39 (71)
Cash and cash equivalents as of BoP 281 281 242
Foreign currency impact on cash 0 0 0
Cash and cash equivalents as of June, 30 320 320 172
Equity Free Cash FlowQ2 2018
incl. IFRS 15
Q2 2018
excl. IFRS 15
Q2 2017
excl. IFRS 15CHF million
EBITDA 147 145 149Change in net working capital (15) (13) 32
Interest paid (12) (12) (8)
Corporate income and withholding tax paid (5) (5) (5)
Capex (82) (82) (86)
Other financing activities (0) (0) (0)
Equity free cash flow 33 33 82

Q2 leverage up due to dividend payment
23
1) Based on pro forma view, taking into account annualized network service fees related to tower disposal
Net debt (CHFm)June 30,
2018
March 31,
2018
December 31,
2017
June 30,
2017
Senior Secured Notes issued February 2015 - 500 500 500
Term loan B 1'410 910 910 1'360
Senior Secured Notes issued June 2018 200 - - -
Total cash-pay borrowings 1'610 1'410 1'410 1'860
Financial lease 7 8 9 12
Total debt 1'617 1'418 1'419 1'872
Cash & Cash Equivalents (320) (281) (272) (172)
Net debt 1'297 1'137 1'147 1'700
Net debt / pro forma adj. EBITDA 1) 2.2x 1.9x 2.0x 2.8x

Bridge adjusted to reported EBITDA
24
145
148
Reported EBITDA Q2’18
Non-recurring / non-operating events
(2)
Prior year events
Share based paymentexpenses
(1)
Adj. EBITDA Q2’18
0
• Share-based payment provisions for multi-year compensation plans
• Prior year related events mainly include adjustments of provisions/accruals based on newly available information
• Non-recurring / non-operating events mainly represent costs for one-time expenses
Q2’18 EBITDA bridge

25

Contact information
26
Uwe Schiller Stephan [email protected] [email protected]
[email protected]+41 58 777 96 86
Investor contact

Disclaimer
27
This document and any materials distributed in connection herewith (including any oral statements) (together, the “Presentation”) do not constitute or form a part of, and should not be construed as, an offer for sale or subscription of or solicitation of any offer to purchase or subscribe for any securities, and neither this Presentation nor anything contained herein shall form the basis of, or be relied upon in connection with, or act as an inducement to enter into, any contract or commitment whatsoever.
The information contained in this Presentation has not been independently verified and no representation or warranty, express or implied, is made as to, and no reliance should be placed on, the fairness, accuracy, completeness, reasonableness or correctness of the information or opinions contained herein. None of Sunrise Communications Group AG, its subsidiaries or any of their respective employees, advisers, representatives or affiliates shall have any liability whatsoever (in negligence or otherwise) for any loss howsoever arising from any use of this document or its contents or otherwise arising in connection with this Presentation. The information contained in this Presentation is provided as at the date of this Presentation and is subject to change without notice.
Statements made in this Presentation may include forward-looking statements. These statements may be identified by the fact that they use words such as “anticipate”, “estimate”, “should”, “expect”, “guidance”, “project”, “intend”, “plan”, “believe”, and/or other words and terms of similar meaning in connection with, among other things, any discussion of results of operations, financial condition, liquidity, prospects, growth, strategies or developments in the industry in which we operate. Such statements are based on management’s current intentions, expectations or beliefs and involve inherent risks, assumptions and uncertainties, including factors that could delay, divert or change any of them. Forward-looking statements contained in this Presentation regarding trends or current activities should not be taken as a representation that such trends or activities will continue in the future. Actual outcomes, results and other future events may differ materially from those expressed or implied by the statements contained herein. Such differences may adversely affect the outcome and financial effects of the plans and events described herein and may result from, among other things, changes in economic, business, competitive, technological, strategic or regulatory factors and other factors affecting the business and operations of the company. Neither Sunrise Communications Group AG nor any of its affiliates is under any obligation, and each such entity expressly disclaims any such obligation, to update, revise or amend any forward-looking statements, whether as a result of new information, future events or otherwise. You should not place undue reliance on any such forward-looking statements, which speak only as of the date of this Presentation.
It should be noted that past performance is not a guide to future performance. Please also note that interim results are not necessarily indicative of full-year results.