Sunnyvale Council District Elections Project Phase 1 ... · PHASE I PUBLIC ENGAGEMENT SUMMARY...
30
Sunnyvale Council District Elections Project Phase 1 Public Engagement Summary Report for the City of Sunnyvale June 6, 2019
Transcript of Sunnyvale Council District Elections Project Phase 1 ... · PHASE I PUBLIC ENGAGEMENT SUMMARY...

Sunnyvale Council District Elections Project Phase 1 Public Engagement Summary Report
for the City of Sunnyvale
June 6, 2019

P L A C E W O R K S i
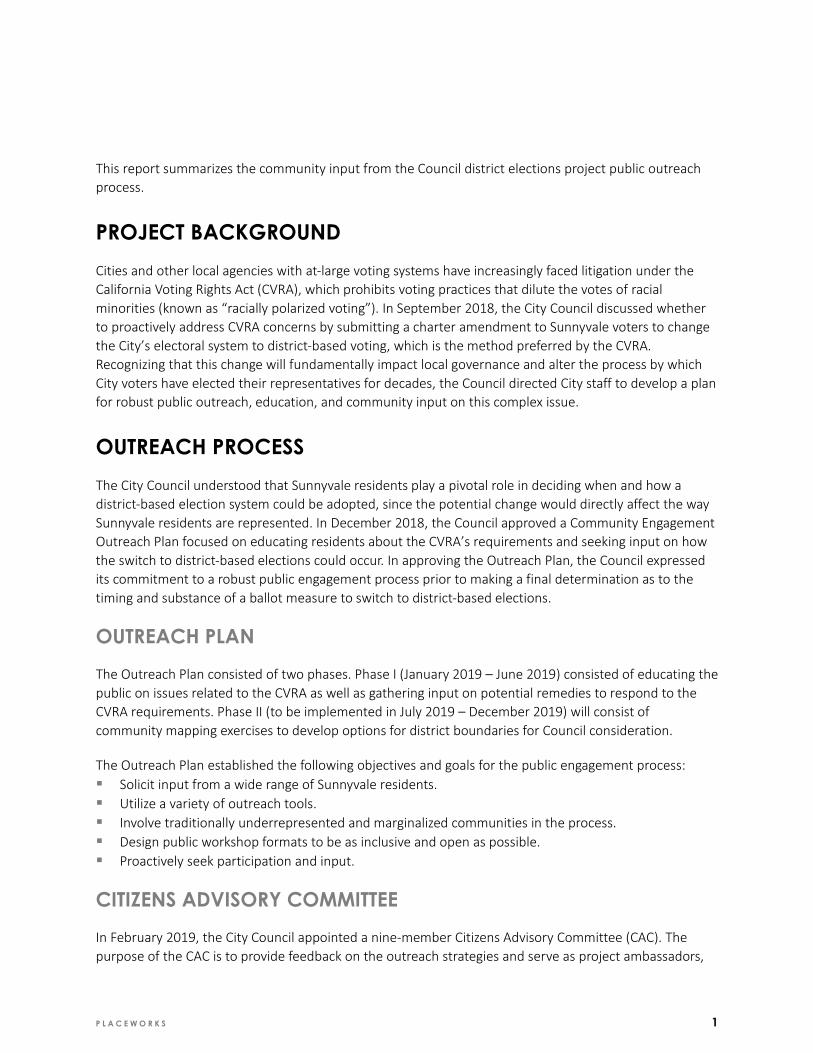
Table of Contents
PROJECT BACKGROUND ........................................................................................................................ 1
OUTREACH PROCESS ............................................................................................................................. 1
TOTAL PARTICIPATION ........................................................................................................................... 6
DEMOGRAPHICS OF PARTICIPANTS ...................................................................................................... 6
SUMMARY OF PHASE I COMMUNITY INPUT ..................................................................................... 13
APPENDICES
Appendix A: Demographic Surveys Appendix B: Comment Cards Appendix C: Community Input Surveys Appendix D: Communities of Interest Mapping Surveys

P H A S E I P U B L I C E N G A G E M E N T S U M M A R Y R E P O R T S U N N Y V A L E C O U N C I L D I S T R I C T E L E C T I O N S P R O J E C T
ii M A Y 2 4 , 2 0 1 9
LIST OF FIGURES Figure 1 Residency of Participants ..................................................................................................... 7 Figure 2 North, Central, and South Sunnyvale ................................................................................. 8 Figure 3 Outreach Participants and 2017 Sunnyvale Citizen Voting Age Population
Place of Residence ............................................................................................................... 9 Figure 4 2017 Sunnyvale Citizen Voting Age Population Age Groups ..................................... 10 Figure 5 2017 Outreach Process Age Groups ................................................................................ 10 Figure 6 Outreach and 2017 Citizen Voting Age Population Race/Ethnicity ......................... 11 Figure 7 Outreach and 2017 Sunnyvale Population Household Income ................................. 12 Figure 8 Overall Results for Question 1 ............................................................................................ 15 Figure 9 Results for Question 1 Filtered by Event Type.................................................................. 16 Figure 10 Overall Results for Question 2 - Average Ranking for Importance Level
(Highest 5 to Lowest 1) ........................................................................................................ 17 Figure 11 Overall Results for Question 3 ............................................................................................ 19 Figure 12 Common Themes from the Community Mapping Survey ........................................... 21 Figure 13 Communities of Interest in Each Subregion .................................................................... 23
LIST OF TABLES Table 1 Open House and Workshop Sign-Ins .................................................................................. 3 Table 2 Attendance at Presentations to Community Organizations ......................................... 5 Table 3 Summary of Total Number of Outreach Participants ..................................................... 6
P L A C E W O R K S 1
This report summarizes the community input from the Council district elections project public outreach process.
PROJECT BACKGROUND Cities and other local agencies with at-large voting systems have increasingly faced litigation under the California Voting Rights Act (CVRA), which prohibits voting practices that dilute the votes of racial minorities (known as “racially polarized voting”). In September 2018, the City Council discussed whether to proactively address CVRA concerns by submitting a charter amendment to Sunnyvale voters to change the City’s electoral system to district-based voting, which is the method preferred by the CVRA. Recognizing that this change will fundamentally impact local governance and alter the process by which City voters have elected their representatives for decades, the Council directed City staff to develop a plan for robust public outreach, education, and community input on this complex issue.
OUTREACH PROCESS The City Council understood that Sunnyvale residents play a pivotal role in deciding when and how a district-based election system could be adopted, since the potential change would directly affect the way Sunnyvale residents are represented. In December 2018, the Council approved a Community Engagement Outreach Plan focused on educating residents about the CVRA’s requirements and seeking input on how the switch to district-based elections could occur. In approving the Outreach Plan, the Council expressed its commitment to a robust public engagement process prior to making a final determination as to the timing and substance of a ballot measure to switch to district-based elections.
OUTREACH PLAN The Outreach Plan consisted of two phases. Phase I (January 2019 – June 2019) consisted of educating the public on issues related to the CVRA as well as gathering input on potential remedies to respond to the CVRA requirements. Phase II (to be implemented in July 2019 – December 2019) will consist of community mapping exercises to develop options for district boundaries for Council consideration.
The Outreach Plan established the following objectives and goals for the public engagement process: Solicit input from a wide range of Sunnyvale residents. Utilize a variety of outreach tools. Involve traditionally underrepresented and marginalized communities in the process. Design public workshop formats to be as inclusive and open as possible. Proactively seek participation and input.
CITIZENS ADVISORY COMMITTEE In February 2019, the City Council appointed a nine-member Citizens Advisory Committee (CAC). The purpose of the CAC is to provide feedback on the outreach strategies and serve as project ambassadors,
P H A S E I P U B L I C E N G A G E M E N T S U M M A R Y R E P O R T S U N N Y V A L E C O U N C I L D I S T R I C T E L E C T I O N S P R O J E C T
2 M A Y 2 4 , 2 0 1 9
informing the Sunnyvale community about the proposed changes. The CAC is made up of Sunnyvale community members who represent the demographic makeup of the city’s residents. To date, the CAC has met three times to review the outreach strategies, brainstorm ways to improve the outreach process, and review the Phase I Outreach Report.
GETTING THE WORD OUT To ensure the community was aware of the potential change and to spread the word about project updates, the City utilized:
Sunnyvaleelections.org Project Website. The project website provided background information, meeting dates, workshop materials, and other ways to get involved.
Social Media. City staff made regular posts on Facebook, Twitter, and Nextdoor.com to update the public about the project. In total, City staff posted 39 distinct items on social media platforms.
Horizons Newsletter. The City published an article about the project and a list of upcoming events in the Spring 2019 Horizons Newsletter, which was mailed to every residence in Sunnyvale.
Utility Bill Insert. The City inserted a flyer about the March and April outreach events into every City utility bill (i.e. water, wastewater, and garbage).
Flyers. Flyers were sent out to local Nongovernmental Organizations, neighborhood groups, and were distributed at the pop-up events. Flyers were translated into Spanish, Hindi, and Chinese. Additionally, Sunnyvale Community Services assisted the City with placing approximately 950 English/Spanish/Chinese flyers in produce bags given to families through a program that gives fresh produce to low-income households.
Earned Media. The project was featured in a January 29, 2019 Mercury News Article.
Eblasts and Emails. PlaceWorks sent out emails to 291 people subscribed to the project mailing list prior to every open house and workshop. In addition, an email was sent out to announce the availability of the online engagement tools. Emails were also sent to a list of 91 community-based organizations, both in Sunnyvale and in surrounding jurisdictions that serve Sunnyvale residents, requesting these organizations forward information about the project, including upcoming outreach events, to their network of Sunnyvale residents.
Paid Print Advertisement. The City placed paid advertisements in IndiaWest, Calitoday, and The World Journal, newspapers for Indian, Vietnamese, and Chinese populations respectively. Advertisements in Calitoday and The World Journal were translated into Vietnamese and Chinese respectively, while the advertisement placed in IndiaWest was published in English. Advertisements were published prior to the two Open Houses, and prior to the three Community Input Workshops.
Get Involved Video. The City published an informational video on their Facebook page which summarized the project and how it would impact Sunnyvale residents. The video featured two CAC members and a Sunnyvale resident who highlighted why it was important to participate and to encourage others to get involved in the outreach process. The video had 426 views as of May 10, 2019.
P H A S E I P U B L I C E N G A G E M E N T S U M M A R Y R E P O R T S U N N Y V A L E C O U N C I L D I S T R I C T E L E C T I O N S P R O J E C T
P L A C E W O R K S 3
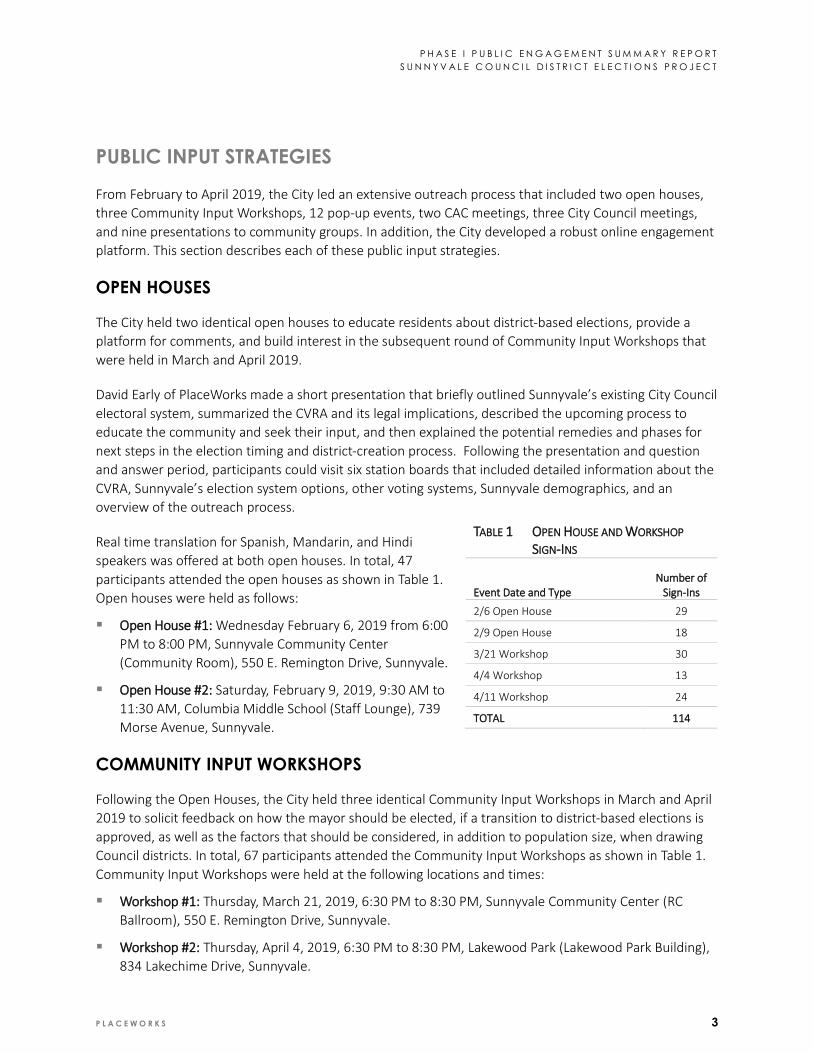
PUBLIC INPUT STRATEGIES From February to April 2019, the City led an extensive outreach process that included two open houses, three Community Input Workshops, 12 pop-up events, two CAC meetings, three City Council meetings, and nine presentations to community groups. In addition, the City developed a robust online engagement platform. This section describes each of these public input strategies.
OPEN HOUSES
The City held two identical open houses to educate residents about district-based elections, provide a platform for comments, and build interest in the subsequent round of Community Input Workshops that were held in March and April 2019.
David Early of PlaceWorks made a short presentation that briefly outlined Sunnyvale’s existing City Council electoral system, summarized the CVRA and its legal implications, described the upcoming process to educate the community and seek their input, and then explained the potential remedies and phases for next steps in the election timing and district-creation process. Following the presentation and question and answer period, participants could visit six station boards that included detailed information about the CVRA, Sunnyvale’s election system options, other voting systems, Sunnyvale demographics, and an overview of the outreach process.
Real time translation for Spanish, Mandarin, and Hindi speakers was offered at both open houses. In total, 47 participants attended the open houses as shown in Table 1. Open houses were held as follows:
Open House #1: Wednesday February 6, 2019 from 6:00 PM to 8:00 PM, Sunnyvale Community Center (Community Room), 550 E. Remington Drive, Sunnyvale.
Open House #2: Saturday, February 9, 2019, 9:30 AM to 11:30 AM, Columbia Middle School (Staff Lounge), 739 Morse Avenue, Sunnyvale.
COMMUNITY INPUT WORKSHOPS
Following the Open Houses, the City held three identical Community Input Workshops in March and April 2019 to solicit feedback on how the mayor should be elected, if a transition to district-based elections is approved, as well as the factors that should be considered, in addition to population size, when drawing Council districts. In total, 67 participants attended the Community Input Workshops as shown in Table 1. Community Input Workshops were held at the following locations and times:
Workshop #1: Thursday, March 21, 2019, 6:30 PM to 8:30 PM, Sunnyvale Community Center (RC Ballroom), 550 E. Remington Drive, Sunnyvale.
Workshop #2: Thursday, April 4, 2019, 6:30 PM to 8:30 PM, Lakewood Park (Lakewood Park Building), 834 Lakechime Drive, Sunnyvale.
TABLE 1 OPEN HOUSE AND WORKSHOP SIGN-INS
Event Date and Type Number of
Sign-Ins
2/6 Open House 29
2/9 Open House 18
3/21 Workshop 30
4/4 Workshop 13
4/11 Workshop 24
TOTAL 114

P H A S E I P U B L I C E N G A G E M E N T S U M M A R Y R E P O R T S U N N Y V A L E C O U N C I L D I S T R I C T E L E C T I O N S P R O J E C T
4 M A Y 2 4 , 2 0 1 9
Workshop #3: Thursday, April 11, 2019, 6:30 PM to 8:30 PM, Murphy Park (Murphy Park Building), 250 N. Sunnyvale Avenue, Sunnyvale.
POP-UP EVENTS
Since not everyone has time to attend a public meeting, the City went out to the community to solicit input at 12 pop-up events. While visiting the pop-up stations, participants learned background information about the CVRA and the potential change, and took surveys on: their demographic information, their preference for how the Mayor is elected, who should oversee the future redistricting process, and the factors that should be considered when drawing Council districts. Participants also completed a mapping exercise to identify their community of interest in Sunnyvale. Visitors to pop-up events also received a link to the online engagement website (described below) so they could participate online.
Pop up events occurred as follows:
3/2 Columbia Neighborhood Center 3/12 Chung Tai Zen Center 3/16 Sunnyvale Farmers Market 3/24 Shiv Durga Hindu Temple 3/27 Sunnyvale Community Center 3/28 Homestead Park Apartments 4/6 Sunnyvale Public Library 4/13 Sunnyvale Farmers Market 4/24 Mobile Home Park Alliance Meeting 4/27 Fit & Fun Fair 4/28 First Morning Light Chinese Christian Church 4/28 St Cyprian Parish
Due to the informal nature of the pop-up events, the exact numbers of participants who were reached through these pop-up events cannot be known. However, PlaceWorks estimates a total of 654 people were engaged with and exposed to the project through the pop-up events. PlaceWorks collected 243 Demographic surveys, 245 Community Input surveys, and 294 Communities of Interest mapping surveys at these events.
PRESENTATIONS TO COMMUNITY ORGANIZATIONS
City staff made several presentations to community groups about the project, which reached about 134 people. In addition, City staff collected 17 Demographic surveys. Table 2 summarizes the presentations made by City staff.

P H A S E I P U B L I C E N G A G E M E N T S U M M A R Y R E P O R T S U N N Y V A L E C O U N C I L D I S T R I C T E L E C T I O N S P R O J E C T
P L A C E W O R K S 5
TABLE 2 ATTENDANCE AT PRESENTATIONS TO COMMUNITY ORGANIZATIONS
Organization Type Organizations Attendees
Neighborhood Association Sunnyvale Neighbors of Arbor Including LaLinda (SNAIL)
10
Neighborhood Association Neighborhood Association Leaders 12
Neighborhood Association Ortega Park Neighborhood Association 3
Neighborhood Association Cherryhill Neighborhood Association 15
School-related Events Latino parents involved in the Parent Institute for Quality Education (PIQE)
25
School-related Events Los Padres Parent Group 12
Religious Organization St. Cyprian Spanish Prayer Group 20
Community Organizations Sunnyvale Rotary Club 32
Community Organizations Sunnyvale Heritage Park Museum 5
TOTAL 134 Source: PlaceWorks, 2019.
ONLINE ENGAGEMENT
In addition to live, person-to-person interactions at public workshops and pop-up events, the City published online engagement tools on the project website to allow the public to engage in the election planning process via the internet. Online engagement tools included the following:
Communities of Interest Mapping. This online tool allowed users to draw their community of interest. Users were able to create as many maps as desired to represent all communities they felt were important.
Comment and View Communities of Interest. Community members could view communities of interest submitted by others and like or comment on them.
Community Input Survey. Community members were asked questions to help inform the future ballot measure, primarily focused on the number of Council districts to be formed and the process for electing the Mayor. In addition, the City asked about the factors to consider when drawing Council districts and who should lead the future redistricting process.
Online Comments. Visitors to www.SunnyvaleElections.org could leave a general comment or question about the project.
A total of 63 Sunnyvale residents registered to use the online engagement tools. However, not every account creator participated in the online surveys and mapping exercises. The online community of interest mapping exercise generated 48 responses, with an additional 33 “votes” in favor of various responses, and a total of 16 comments left on various communities of interest maps.

P H A S E I P U B L I C E N G A G E M E N T S U M M A R Y R E P O R T S U N N Y V A L E C O U N C I L D I S T R I C T E L E C T I O N S P R O J E C T
6 M A Y 2 4 , 2 0 1 9
TOTAL PARTICIPATION The various strategies described above resulted in a total participation of approximately 952 individuals, as summarized in Table 3. Note that it is possible that some people attended more than one event, so some of the documented attendees may be double-counted.
DEMOGRAPHICS OF PARTICIPANTS One of the major goals of the outreach process was to reach all segments of the Sunnyvale community. To measure the success of this goal, the City asked participants to voluntarily report the following information:
Geographic place of residence in Sunnyvale (i.e. North, Central, South) Age Race/ethnicity Family/ household income
This section reports the demographic characteristics of the outreach participants and compares it to the overall Sunnyvale population when possible. All completed demographic surveys can be found in Appendix A. While the outreach process engaged with over 950 residents, most of these interactions occurred at pop-up events where people preferred to hear and ask questions about the project, but not complete the surveys. Therefore, the numbers of participants who reported demographic information is lower than the total of people who participated in the outreach process overall.
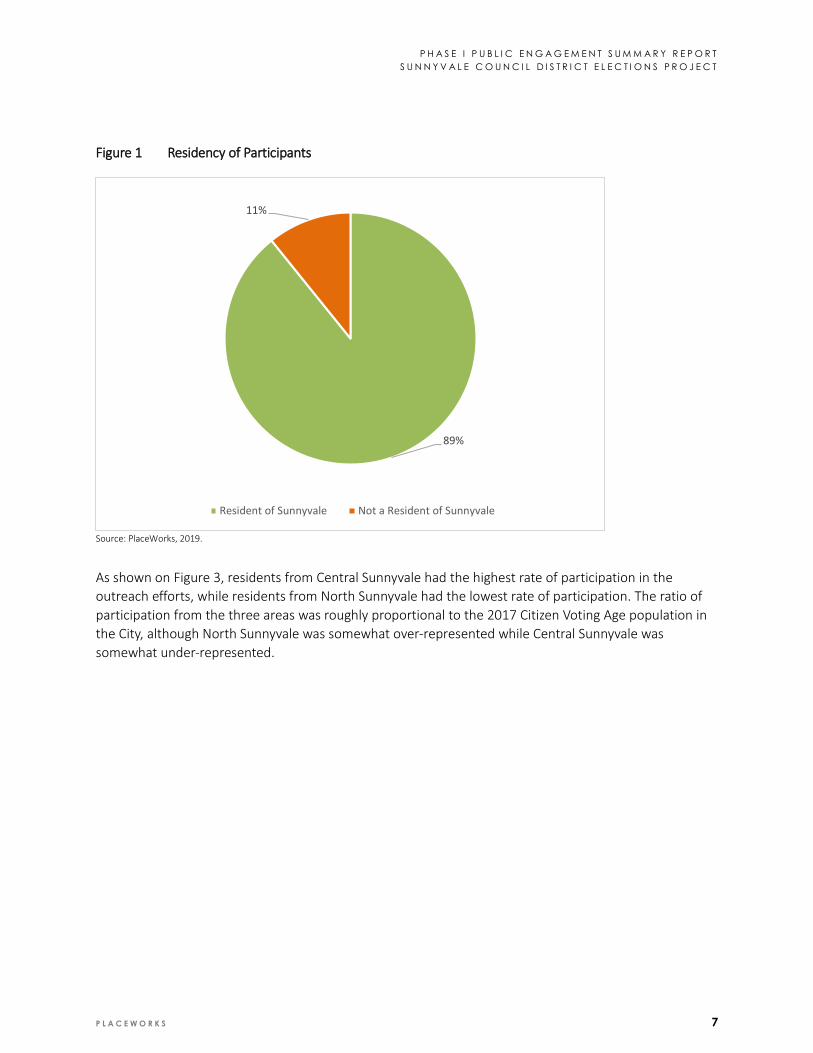
PLACE OF RESIDENCE Of the participants who completed the demographic survey, 89 percent were Sunnyvale residents while 11 percent are not, as depicted in Figure 1.
To identify the location of residence of the outreach participants, PlaceWorks split the City into three sections: North, Central, and South, as shown on Figure 2.1 Participants were asked to indicate on the map which section of Sunnyvale they reside in. This information was collected to assess how effective the outreach was in reaching Sunnyvale residents that live in all areas of the City. A total of 257 Sunnyvale residents indicated they live in Sunnyvale and also reported what part of town the lived in: North, Central, or South.
1 To create the North/Central/South boundaries, PlaceWorks amalgamated Census block group boundaries and data from the 2017
American Community Survey (ACS). Per the 2017 ACS, Central Sunnyvale includes 92,268 residents, South Sunnyvale includes 37,374 residents, and North Sunnyvale includes 21,997 residents.
TABLE 3 SUMMARY OF TOTAL NUMBER OF OUTREACH PARTICIPANTS
Public Input Channel Number of Participants
Open Houses and Community Input Workshops 117
Pop-up Events 654
Presentations to Community Organizations
134
Online Engagement Tools 48
TOTAL 953
P H A S E I P U B L I C E N G A G E M E N T S U M M A R Y R E P O R T S U N N Y V A L E C O U N C I L D I S T R I C T E L E C T I O N S P R O J E C T
P L A C E W O R K S 7
Figure 1 Residency of Participants
Source: PlaceWorks, 2019.
As shown on Figure 3, residents from Central Sunnyvale had the highest rate of participation in the outreach efforts, while residents from North Sunnyvale had the lowest rate of participation. The ratio of participation from the three areas was roughly proportional to the 2017 Citizen Voting Age population in the City, although North Sunnyvale was somewhat over-represented while Central Sunnyvale was somewhat under-represented.
89%
11%
Resident of Sunnyvale Not a Resident of Sunnyvale

P H A S E I P U B L I C E N G A G E M E N T S U M M A R Y R E P O R T S U N N Y V A L E C O U N C I L D I S T R I C T E L E C T I O N S P R O J E C T
8 M A Y 2 4 , 2 0 1 9
Figure 2 North, Central, and South Sunnyvale
Source: PlaceWorks, 2019.
North
Central
South

P H A S E I P U B L I C E N G A G E M E N T S U M M A R Y R E P O R T S U N N Y V A L E C O U N C I L D I S T R I C T E L E C T I O N S P R O J E C T
P L A C E W O R K S 9
Figure 3 Outreach Participants and 2017 Sunnyvale Citizen Voting Age Population Place of Residence
Source: U.S. Census, 2017 American Community Survey data and PlaceWorks, 2019.
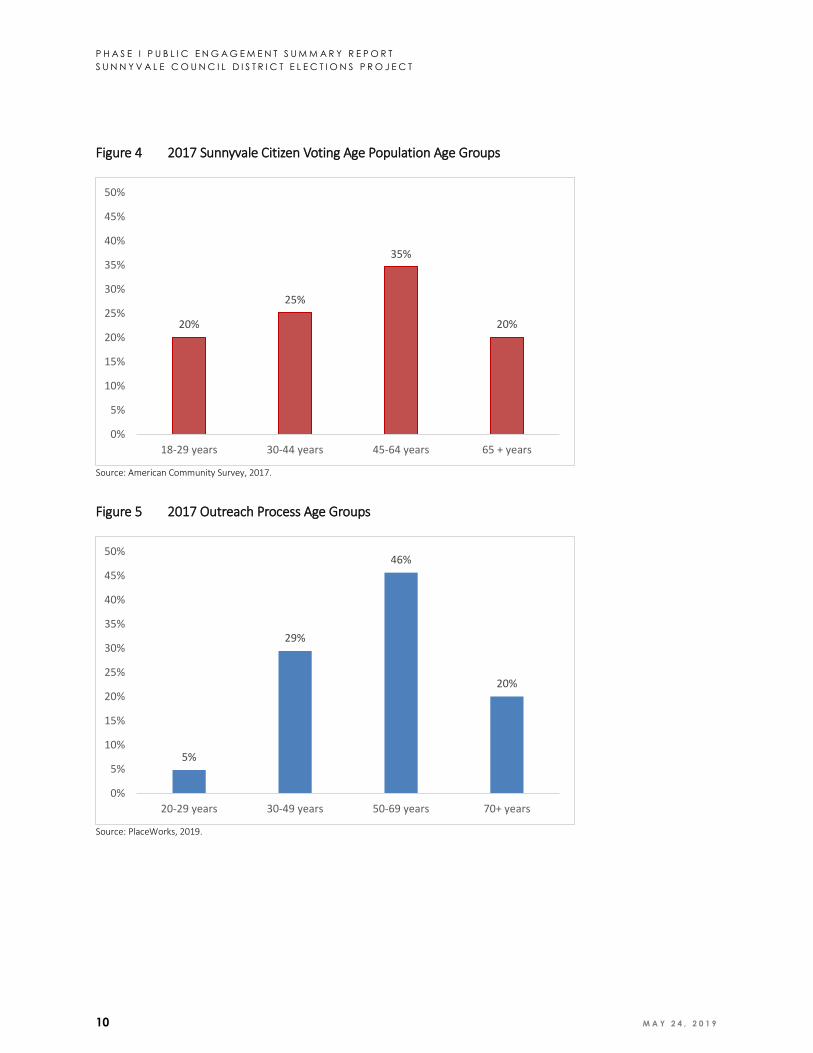
AGE A total of 417 participants reported their age. Figure 4 shows the 2017 ACS Citizen Voting Age Sunnyvale Population by age group and Figure 5 shows the age groups of the outreach participants. The 2017 ACS categorizes the age groups of the Citizen Voting Age population differently than the outreach survey groups participants’ ages. Therefore, it should be noted that the comparative age groups are roughly the same, but not identical when considering differences between outreach participants and the overall Citizen Voting Age population.
The largest age group of the 2017 Sunnyvale Voting Age Population is between 45 and 64 years old, which makes up 35 percent of the Citizen Voting Age Population.
The outreach process reached a wide range of ages, receiving feedback from people as young as 20 to over 80 years old, with the highest number of outreach participants aged between 50 and 69 years old. Outreach participants between 50 to 69 made up 46 percent of the outreach participants, the highest percentage of all the age groups. In contrast, only 5 percent of survey participants were under 29 years old.
This data means that people between 50 to 69 years old were over-represented in the process, while people under 29 years old were under-represented (comprising 5 percent of outreach participants but 20 percent of the Citizen Voting Age Population). Participants 70 years and older were represented in approximately the same proportion that they make up in Sunnyvale’s overall Citizen Voting Age population, as were people between 30 to 49 years old.
24%
45%
31%
16%
62%
22%
0%
10%
20%
30%
40%
50%
60%
70%
North Central South
Outreach Participants 2017 Citizen Voting Age PopulationPopulation
P H A S E I P U B L I C E N G A G E M E N T S U M M A R Y R E P O R T S U N N Y V A L E C O U N C I L D I S T R I C T E L E C T I O N S P R O J E C T
10 M A Y 2 4 , 2 0 1 9
Figure 4 2017 Sunnyvale Citizen Voting Age Population Age Groups
Source: American Community Survey, 2017.
Figure 5 2017 Outreach Process Age Groups
Source: PlaceWorks, 2019.
20%
25%
35%
20%
0%
5%
10%
15%
20%
25%
30%
35%
40%
45%
50%
18-29 years 30-44 years 45-64 years 65 + years
5%
29%
46%
20%
0%
5%
10%
15%
20%
25%
30%
35%
40%
45%
50%
20-29 years 30-49 years 50-69 years 70+ years

P H A S E I P U B L I C E N G A G E M E N T S U M M A R Y R E P O R T S U N N Y V A L E C O U N C I L D I S T R I C T E L E C T I O N S P R O J E C T
P L A C E W O R K S 11
RACE/ETHNICITY Approximately 391 participants reported their race and ethnicity. Figure 6 compares the race/ethnicity of participants against the 2017 ACS Citizen Voting Age Population.
The outreach process reached a broad spectrum of races and ethnicities. The City made substantial effort to hear from diverse communities by holding five pop-up events that were specifically targeted to Hispanic/Latino, Chinese, Indian, and Vietnamese populations. Additionally, approximately 950 project flyers in English, Spanish, and Chinese were placed in produce bags given to families through the Sunnyvale Community Services program that provides fresh produce to low-income households.
Figure 6 Outreach and 2017 Citizen Voting Age Population Race/Ethnicity
*Note: Due to the small number of respondents of these races/ethnicities, the “other” category includes those who identified themselves as Black or African American, American Indian or Alaska native, two or more races/ other, or Native Hawaiian and Other Pacific Islander. Source: American Community Survey, 2017 and PlaceWorks, 2019.
When compared to the 2017 ACS Voting Age Population, the race/ethnicity of the outreach participants closely mirrored the ratios of the citywide population 18 years and older.
Approximately 47 percent of participants identified as Non-Hispanic White. Sunnyvale’s Citizen Voting Age Population is 44 percent Non-Hispanic White.
Outreach participants who identified as Asian represented 30 percent of the participants who reported their race. Sunnyvale’s Citizen Voting Age Population is 36 percent Asian.
Approximately 14 percent of outreach participants identified as Hispanic or Latino, which is almost identical to the percentage of the 2017 Citizen Voting Age Population of 13 percent.
30%
14%
47%
9%
36%
13%
44%
8%
0%5%
10%15%20%25%30%35%40%45%50%
Asian Hispanic or Latino Non-Hispanic White OtherOutreach Participants 2017 Citizen Voting Age Population
P H A S E I P U B L I C E N G A G E M E N T S U M M A R Y R E P O R T S U N N Y V A L E C O U N C I L D I S T R I C T E L E C T I O N S P R O J E C T
12 M A Y 2 4 , 2 0 1 9
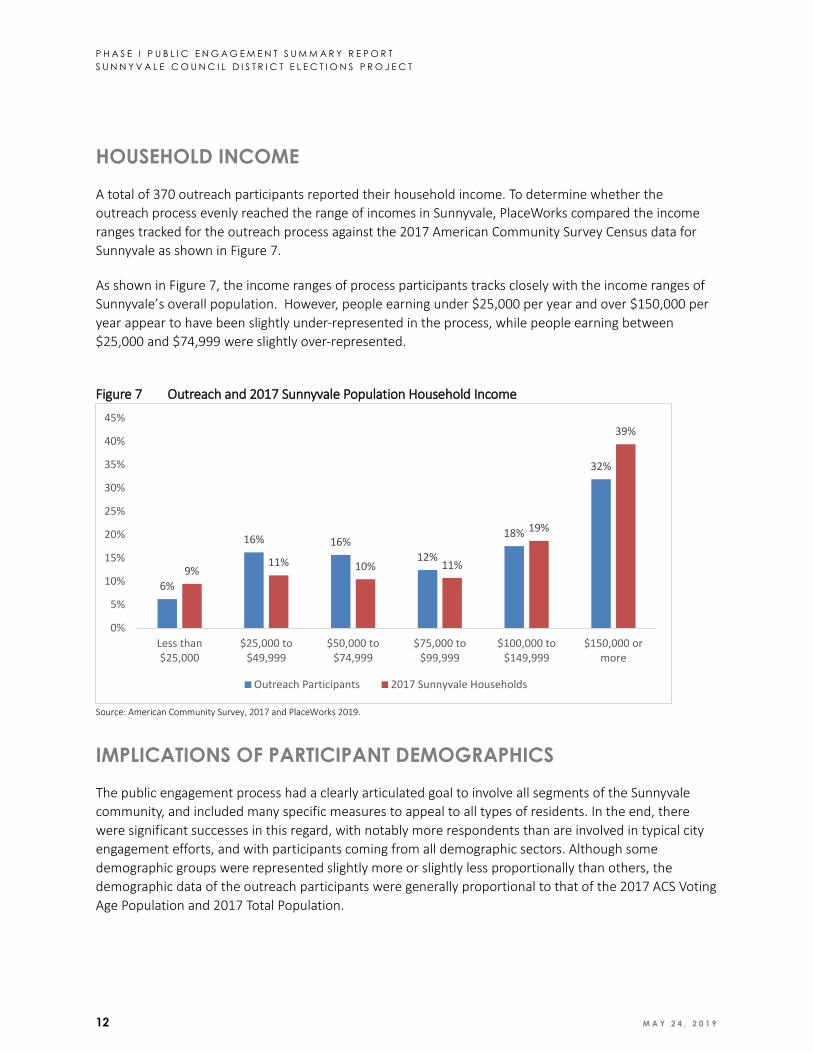
HOUSEHOLD INCOME A total of 370 outreach participants reported their household income. To determine whether the outreach process evenly reached the range of incomes in Sunnyvale, PlaceWorks compared the income ranges tracked for the outreach process against the 2017 American Community Survey Census data for Sunnyvale as shown in Figure 7.
As shown in Figure 7, the income ranges of process participants tracks closely with the income ranges of Sunnyvale’s overall population. However, people earning under $25,000 per year and over $150,000 per year appear to have been slightly under-represented in the process, while people earning between $25,000 and $74,999 were slightly over-represented.
Figure 7 Outreach and 2017 Sunnyvale Population Household Income
Source: American Community Survey, 2017 and PlaceWorks 2019.
IMPLICATIONS OF PARTICIPANT DEMOGRAPHICS The public engagement process had a clearly articulated goal to involve all segments of the Sunnyvale community, and included many specific measures to appeal to all types of residents. In the end, there were significant successes in this regard, with notably more respondents than are involved in typical city engagement efforts, and with participants coming from all demographic sectors. Although some demographic groups were represented slightly more or slightly less proportionally than others, the demographic data of the outreach participants were generally proportional to that of the 2017 ACS Voting Age Population and 2017 Total Population.
6%
16% 16%12%
18%
32%
9%11% 10% 11%
19%
39%
0%
5%
10%
15%
20%
25%
30%
35%
40%
45%
Less than$25,000
$25,000 to$49,999
$50,000 to$74,999
$75,000 to$99,999
$100,000 to$149,999
$150,000 ormore
Outreach Participants 2017 Sunnyvale Households
P H A S E I P U B L I C E N G A G E M E N T S U M M A R Y R E P O R T S U N N Y V A L E C O U N C I L D I S T R I C T E L E C T I O N S P R O J E C T
P L A C E W O R K S 13
SUMMARY OF PHASE I COMMUNITY INPUT This section summarizes the major results of the outreach process and groups the community input into three sections:
General Comments. Participants submitted general comments via comment cards submitted at public workshops and pop-up events, and via the project website.
Community Input Survey Results. The City collected Community Input Surveys at all public events and online. The survey included three questions about how the mayor should be elected, what primary factors should be considered when drawing Council districts, and who should oversee the future redistricting process.
Community Mapping Survey Results. Participants were asked to define and describe their community of interest within Sunnyvale.
GENERAL COMMENTS
NUMBER OF COMMENTS
During the outreach process, PlaceWorks collected 35 comment cards and received eight emails. All of these comments and emails can be viewed in Appendix B.
The 33 comments were collected at the following events: Pop-Up at Chung Tai Zen Center Pop-Up at Sunnyvale Farmers Market Community Input Workshop #1 Pop-Up at Sunnyvale Community Center Community Input Workshop #2 Community Input Workshop #3 Comment from Community Input Survey Pop-Up at Mobile Home Park Alliance Pop-Up at Fit & Fun Fair Pop-Up at the First Morning Light Chinese Christian Church
OVERALL COMMENT THEMES
The comments collected addressed the following main themes:
Process/Other Ensure that the outreach process reaches all demographics in the City. Presentations were good, informative, and helpful. Be sure to work closely with the Santa Clara County Registrar of Voters. Current City Councilmembers’ participation in this process is a conflict of interest. Consider a ranked choice voting system to avoid future run-offs. When deciding how to change the election system, the tenure or re-election of existing
Councilmembers should not be considered.

P H A S E I P U B L I C E N G A G E M E N T S U M M A R Y R E P O R T S U N N Y V A L E C O U N C I L D I S T R I C T E L E C T I O N S P R O J E C T
14 M A Y 2 4 , 2 0 1 9
The Council district map should be part of the Charter amendment ballot measure.
Support for Existing At-Large Election System Sunnyvale’s current Council election system is functioning fine and doesn’t need to be changed. An odd number of Council members helps reduce conflict. District elections are not proven to increase minority representation. This project sounds like gerrymandering. The State law should be changed.
Support for a Shift to District-Based Elections District elections can increase minority representation. Residents will have an easier time running for Council. Residents will have an easier platform to discuss issues important to them. Use a four plus three district system instead of a seven-district system.
Selection of the Mayor No direct election of Mayor should occur. Mayor should be selected from within the Council. Mayor should serve a one-year term and be chosen within the Council.
District Mapping Ensure residents can see and comment on all maps proposed. Disclose criteria used when evaluating district maps.
COMMUNITY INPUT SURVEY RESULTS As mentioned above, community input surveys were collected at the three Community Input Workshops, 12 Pop-Up Events, and online. Questions covered how the mayor should be elected, what factors should be considered when drawing Council districts, and who should oversee the redistricting process. A total of 342 Community Input Surveys were submitted, 307 of which were submitted in person and 35 of which were submitted online. All questions were optional, so the number of responses to each of the three questions varies and is identified in their respective section below. All completed Community Input Surveys can be found in Appendix C.
QUESTION 1 – PREFERENCE FOR SELECTION OF MAYOR Q1: The City of Sunnyvale’s mayor serves a two-year term and is collectively selected by the seven Councilmembers. If the City moves to a district-based election system, the mayor could be elected in one of two ways (please check your preferred options):
Select the mayor from within the Council. This would be the status quo. Assuming the City moves to district-based elections, under this scenario Councilmembers would represent one of seven districts. Each of the seven districts’ population would be approximately 21,951 (+/-) based on the US Census 2017 population estimate of 153,656.

P H A S E I P U B L I C E N G A G E M E N T S U M M A R Y R E P O R T S U N N Y V A L E C O U N C I L D I S T R I C T E L E C T I O N S P R O J E C T
P L A C E W O R K S 15
Hold a separate city-wide election for mayor. This would be separate from the district-based elections for the six other Councilmembers. Under this scenario, each of the six Council districts would have a population of approximately 25,609 (+/-) based on the US Census 2017 total population estimate of 153,656. The at-large mayor would serve a four-year term and would be the only at-large seat in a district-based system.
Other (please describe).
OVERALL RESULTS FOR QUESTION 1
There were 311 responses to Question 1. As shown below on Figure 8, 49 percent of respondents prefer the Mayor be selected from within the Council, which is how the Mayor is currently elected under the at-large Council election system. Common reasons that participants gave for preferring the Mayor be selected from within the Council include:
Figure 8 Overall Results for Question 1
Source: PlaceWorks, 2019.
This is how the mayor is currently chosen, and it seems to work.
The City Councilmembers are the most qualified to make a decision for who is the best fit for this position.
An at-large election for mayor would be costly and would therefore exclude potential candidates without personal or other financial backing.
Sunnyvale residents have twice voted down ballot measures that would change Sunnyvale’s voting system to have the mayor be elected at-large.
49%
44%
7%
0%
10%
20%
30%
40%
50%
60%
Select the mayor from within the Council Hold a separate citywide election for mayor Other

P H A S E I P U B L I C E N G A G E M E N T S U M M A R Y R E P O R T S U N N Y V A L E C O U N C I L D I S T R I C T E L E C T I O N S P R O J E C T
16 M A Y 2 4 , 2 0 1 9
44 percent of respondents preferred the Mayor be selected through a citywide election. Reasons given for a separate citywide election for the following reasons:
A citywide election for Mayor would allow Sunnyvale residents to have a direct say in who represents them.
Having a citywide election for Mayor would provide two officials to represent the individual – the Councilmember elected by-district and the Mayor elected at-large.
7 percent of respondents chose “other.” Common responses submitted by participants who chose “other” include:
Do not know enough information on the topic.
Undecided.
In addition to district elections, Sunnyvale should adopt ranked choice voting.
Prefer six districts with citywide Mayor, but Mayor term is four years and Council terms are two years.
Mayor terms should be one- year.
People who discussed this issue with fellow residents (for example, in small groups at workshops) were more likely to prefer election of the Mayor from within the City Council, while people who did not have a chance to discuss the issue (for example in filling out a survey at a pop up event) were more likely to prefer an at-large election of the Mayor. As shown on Figure 9, 67 percent of workshop participants preferred the Mayor be selected from within the City Council compared to 45 percent of pop-up and online participants. Alternatively, 17 percent of workshop participants preferred the Mayor be elected through a citywide election compared to 51 percent of pop-up and online participants.
Figure 9 Results for Question 1 Filtered by Event Type
Source: PlaceWorks, 2019.
67%
17% 17%
45%51%
4%
0%
10%
20%
30%
40%
50%
60%
70%
80%
Select the mayor fromwithin the Council
Hold a separate citywideelection
Other
Community Input Workhsops Pop-ups & Online Submittals

P H A S E I P U B L I C E N G A G E M E N T S U M M A R Y R E P O R T S U N N Y V A L E C O U N C I L D I S T R I C T E L E C T I O N S P R O J E C T
P L A C E W O R K S 17
QUESTION 2 – FACTORS TO CONSIDER WHEN DRAWING DISTRICT BOUNDARIES Q2: Although population size is the primary criteria when drawing Council districts, other factors are also taken into account. Please rank the factors that should be considered when drawing district boundaries in order of importance:
Visible (natural and man-made) boundaries, including topography and geography (e.g., streams or neighborhood boundaries).
Compactness, contiguity, integrity, and cohesiveness of a geographic area.
Communities of interest (i.e., “a contiguous population which shares common social and economic interests”).
Similar voting choices for past elections.
Future population growth.
OVERALL RESULTS FOR QUESTION 2
There were 304 responses to Question 2. Since Question 2 was a ranking exercise, the results were tabulated by calculating the average of each response. As shown in Figure 10, the majority of participants indicated that communities of interest are the most important factor to consider when drawing district boundaries, while the least important factor was similar voting choices in past elections.
Figure 10 Overall Results for Question 2 - Average Ranking for Importance Level (Highest 5 to Lowest 1)
Source: PlaceWorks, 2019.
4.2
3.8
3.4
2.3
1.8
Communities ofInterest
CohesiveGeographic Areas
Visible Boundaries Future PopulationGrowth
Similar VotingChoices

P H A S E I P U B L I C E N G A G E M E N T S U M M A R Y R E P O R T S U N N Y V A L E C O U N C I L D I S T R I C T E L E C T I O N S P R O J E C T
18 M A Y 2 4 , 2 0 1 9
Participants at the Community Input Workshops and the Pop-Up Events made several points regarding what the most important factors should be to consider when drawing district boundaries. Comments included:
Communities of interest should be the most important factor because the point of district-based elections is to group minority populations together to help them get Council representation, and not considering communities of interest would mean neighborhoods of minority populations could get broken up.
Communities of interest, such as school districts and neighborhood associations, are existing communities that are closely knit and should be maintained.
Cohesive geographic areas were pointed out as being important for creating districts that have a visual sense of identity.
Visible boundaries are essential to consider, such as wide roadways that effectively serve as barriers between neighborhoods.
Some respondents thought that future population growth should be a key consideration because, by CVRA law, the districts have to have roughly the same population of Sunnyvale residents in each, and if Council district boundaries consider future population growth, redistricting every 10 years will be quicker.
Similar voting choices were considered important to some respondents because people who vote a certain way might have the same needs and interests.
QUESTION 3 – WHO SHOULD OVERSEE THE REDISTRICTING PROCESS Q3: Local redistricting is legally required by the State of California every ten years to assure that Council districts retain the integrity of their shape, content, and population size. Therefore, if Sunnyvale residents choose to switch to district-based elections in 2020, district boundaries will be drawn based on the 2010 Census. Following the release of the 2020 US Census data, the City of Sunnyvale would need to re-draw district boundaries to reflect updated conditions in advance of the 2022 Council election. Assuming the City moves to district-based elections, would you prefer the redistricting process be overseen by:
City Council. Under this scenario, the City Council would take the lead on the redistricting process. Over a series of public hearings, the City Council would create a revised Council district map in coordination with the demographer to reflect updated conditions. The public would be encouraged to attend and provide input at these hearings.
Advisory Commission. Under this scenario, the City Council would appoint an Advisory Commission to oversee the redistricting process. The Advisory Commission would work with a demographer to create a preferred redistrict map through a series of public meetings. The preferred redistrict map would be presented to the City Council for final approval. The public would be encouraged to attend and provide input at these meetings. The Advisory Council would make a recommendation on district boundaries to Council, but Council would make the final decision.
Independent Commission. Under this scenario, the City Council would appoint an Independent Commission to oversee the redistricting process. Members of the Independent Commission would work with a demographer and have authority to determine the updated district maps with little to no participation of the City Council. Typically, members of an Independent Commission are not public
P H A S E I P U B L I C E N G A G E M E N T S U M M A R Y R E P O R T S U N N Y V A L E C O U N C I L D I S T R I C T E L E C T I O N S P R O J E C T
P L A C E W O R K S 19
officials and must abstain from public office for a few years after the districts are finalized. The public would be encouraged to attend and provide input during meetings of the Independent Commission. The independent Commission would have the authority to make the final decision on the revised district boundaries.
Other (please describe).
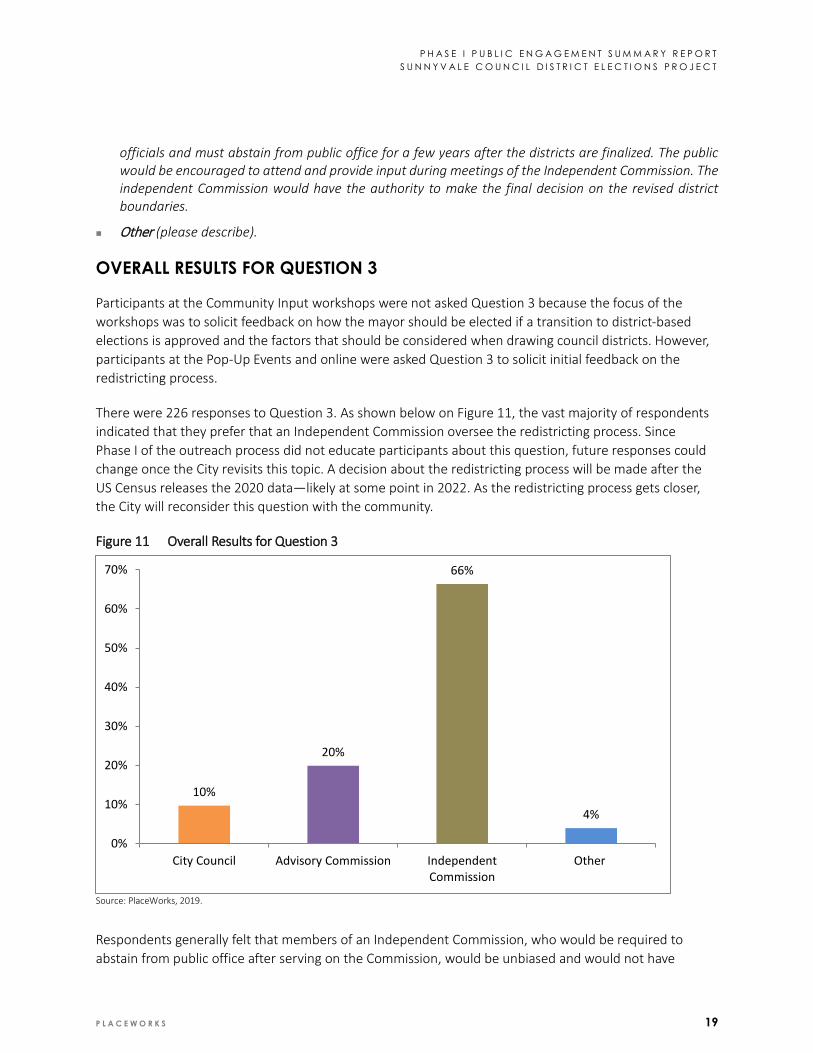
OVERALL RESULTS FOR QUESTION 3
Participants at the Community Input workshops were not asked Question 3 because the focus of the workshops was to solicit feedback on how the mayor should be elected if a transition to district-based elections is approved and the factors that should be considered when drawing council districts. However, participants at the Pop-Up Events and online were asked Question 3 to solicit initial feedback on the redistricting process.
There were 226 responses to Question 3. As shown below on Figure 11, the vast majority of respondents indicated that they prefer that an Independent Commission oversee the redistricting process. Since Phase I of the outreach process did not educate participants about this question, future responses could change once the City revisits this topic. A decision about the redistricting process will be made after the US Census releases the 2020 data—likely at some point in 2022. As the redistricting process gets closer, the City will reconsider this question with the community.
Figure 11 Overall Results for Question 3
Source: PlaceWorks, 2019.
Respondents generally felt that members of an Independent Commission, who would be required to abstain from public office after serving on the Commission, would be unbiased and would not have
10%
20%
66%
4%
City Council Advisory Commission IndependentCommission
Other0%
10%
20%
30%
40%
50%
60%
70%

P H A S E I P U B L I C E N G A G E M E N T S U M M A R Y R E P O R T S U N N Y V A L E C O U N C I L D I S T R I C T E L E C T I O N S P R O J E C T
20 M A Y 2 4 , 2 0 1 9
conflicts of interest. One commenter stated that an Advisory Committee overseeing the redistricting process would include members who are already civically engaged and would, therefore, be more qualified to make these informed decisions compared to an Independent Commission.
A total of 4 percent of participants indicated “other” as their answer. Common responses for “other” included:
Independent non-Sunnyvale resident commission should be formed.
An independent commission should be used, but one that is not appointed by the City Council.
An independent commission with a stipulation that these members will never be able to be a public official.
Have both an advisory and an independent commission that work together to make a recommendation to the City Council.
COMMUNITY MAPPING SURVEY RESULTS Community Mapping Surveys asked residents to identify their community by name, describe the defining characteristics of their Sunnyvale community, and draw their community on a map of Sunnyvale. Participants were encouraged to give multiple submissions to indicate all of their identifiable communities. PlaceWorks collected the Community Mapping Survey at the three Community Input Workshops, 12 pop-up events, and online. All completed Community Mapping Surveys can be found in Appendix D.
OVERALL RESULTS FOR COMMUNITY MAPPING SURVEY
There was a total of 294 responses to the Community Mapping Survey.
Overall, the most common communities of interest were either a Homeowners Association (HOA), mobile home park (MHP), or other type of neighborhood, which represented about 35 percent of the responses, as shown on Figure 12.
The second most common community of interest was defined by physical boundaries including major highways, roadways, and the Caltrain right-of-way, comprising approximately 19 percent of responses. Examples of physical boundaries defined by participants included Highway 101, Highway 237, Highway 82, Fair Oaks Avenue, and Sunnyvale Saratoga Road.
Another prevalent community of interest focused on school boundaries, and other indicated communities included park service areas, racial or ethnic communities, and communities made up primarily of homeowners or renters.
The “Other” category, as shown on Figure 12, includes shopping centers and areas of similar socioeconomics and demographics.
To determine the geographic spread of the communities of interest, PlaceWorks categorized the results as follows: North: The region of Sunnyvale north of Highway 101 Central: The region of Sunnyvale between Highway 101 and Highway 82

P H A S E I P U B L I C E N G A G E M E N T S U M M A R Y R E P O R T S U N N Y V A L E C O U N C I L D I S T R I C T E L E C T I O N S P R O J E C T
P L A C E W O R K S 21
South: The region of Sunnyvale below Highway 82
Communities of interest were generally well-distributed throughout the City. Figure 13 illustrates the most common communities of interest submitted including:
Communities of interest in the North subregion were generally drawn between Highway 237 and Highway 101. The majority of these communities of interest included mobile home parks such as Plaza Del Rey, Casa De Amigos, and Adobe Wells.
Communities of interest in the Central subregion primarily included HOAs, neighborhoods, Downtown, and school boundaries, including Cherry Chase Elementary School and Cumberland Elementary School.
Figure 12 Common Themes from the Community Mapping Survey
Source: PlaceWorks, 2019.
The South subregion communities of interest primarily consisted of neighborhoods, including Birdland, Cumberland South, and the Cherryhill Neighborhood Association. School boundaries were another common community of interest in the South subregion such as Stocklmeir Elementary School, West Valley Elementary School, the Santa Clara Unified School District, and the Cupertino Union School District.
From within the three subregions, trends for subregional preferences emerged as well:
In the North Sunnyvale region, almost half ( percent) of all responses drew a community of interest between Highway 237 and Highway 101, and an additional 23 percent of the respondents mapped the entire North Sunnyvale region as one community.
35%
18%13%
10%8% 7% 6%
3%
0%5%
10%15%20%25%30%35%40%

P H A S E I P U B L I C E N G A G E M E N T S U M M A R Y R E P O R T S U N N Y V A L E C O U N C I L D I S T R I C T E L E C T I O N S P R O J E C T
22 M A Y 2 4 , 2 0 1 9
In the Central Sunnyvale region, the two most popular communities were drawn to keep both the north/central portion and the center portion of the region cohesive, comprising 17 percent and 18 percent of responses respectively.
Responses drawn in the South Sunnyvale region indicated interest in keeping the southwest portion of this region together.
Figure 13 also illustrates the three subregions.

P H A S E I P U B L I C E N G A G E M E N T S U M M A R Y R E P O R T S U N N Y V A L E C O U N C I L D I S T R I C T E L E C T I O N S P R O J E C T
P L A C E W O R K S 23
Figure 13 Communities of Interest in Each Subregion
Source: PlaceWorks, 2019.

P H A S E I P U B L I C E N G A G E M E N T S U M M A R Y R E P O R T S U N N Y V A L E C O U N C I L D I S T R I C T E L E C T I O N S P R O J E C T
24 M A Y 2 4 , 2 0 1 9


1625 Shattuck Avenue, Suite 300Berkeley, California 94709510.848.3815www.placeworks.com