Sunny Optical Technology Group Co Ltd -...
20
August 30, 2013 ACTION Buy Sunny Optical Technology Group Co Ltd Return Potential: 15% Equity Research Initiate at Buy; key beneficiary of China optical upgrades Source of opportunity We initiate Sunny Optical at Buy, as we believe it is one of the best positioned companies in China’s smartphone supply chain despite various industry headwinds: 1) The handset camera module sector continues to be in a technology/spec upgrade cycle, which could lift BOM (bill of materials) value and stabilize gross margins; 2) Sunny holds a solid, leading industry position, with c.30% share in smartphone camera modules of China branded OEMs – still one of the fastest growing markets globally; 3) we believe the penetration into the supply chain of more international clients, and the adoption of new optical technology solutions could present upside risks to our estimates. Catalyst We see several potential stock catalysts in the continuing optical upcycle: 1) Strong monthly camera module/lens set shipment numbers, heading into the industry peak season of August-October; 2) More flagship smartphone models, which are equipped with Sunny’s products, launched by China OEMs in 2H13; 3) Successful penetration into the supply chain of more international clients, following collaborations with Samsung Electronics and Leap Motion. Valuation We use average NTM P/E from 4Q12 to value Sunny, as we believe this period/methodology aptly reflect changes in its business nature and stock liquidity. Our 12-month price target of HK$9.8 is based on 11.6X P/E, implying 15% upside, the highest among our offshore technology coverage. Key risks Slower-than-expected camera upgrade; intensifying competition in the module segment; ASP and margin pressure; laggard in disruptive technology; strong growth of low-cost iPhones in China. INVESTMENT LIST MEMBERSHIP Asia Pacific Buy List Coverage View: Neutral Sam Li +86(10)6627-3326 [email protected] Beijing Gao Hua Securities Company Limited Goldman Sachs does and seeks to do business with companies covered in its research reports. As a result, investors should be aware that the firm may have a conflict of interest that could affect the objectivity of this report. Investors should consider this report as only a single factor in making their investment decision. For Reg AC certification and other important disclosures, see the Disclosure Appendix, or go to www.gs.com/research/hedge.html. Analysts employed by non- US affiliates are not registered/qualified as research analysts with FINRA in the U.S. Robert Yen +886(2)2730-4196 [email protected] Goldman Sachs (Asia) L.L.C., Taipei Branch The Goldman Sachs Group, Inc. Global Investment Research Growth Returns * Multiple Volatility Volatility Multiple Returns * Growth Investment Profile Low High Percentile 20th 40th 60th 80th 100th * Returns = Return on Capital For a complete description of the investment profile measures please refer to the disclosure section of this document. Sunny Optical Technology Group Co Ltd (2382.HK) Asia Pacific Technology Peer Group Average Key data Current Price (HK$) 8.50 12 month price target (HK$) 9.80 Market cap (HK$ mn / US$ mn) 8,281.7 / 1,067.9 Foreign ownership (%) -- 12/12 12/13E 12/14E 12/15E EPS (Rmb) 0.35 0.48 0.66 0.82 EPS growth (%) 69.0 35.3 39.3 23.7 EPS (diluted) (Rmb) 0.35 0.48 0.66 0.82 EPS (basic pre-ex) (Rmb) 0.35 0.48 0.66 0.82 P/E (X) 7.7 14.1 10.1 8.2 P/B (X) 1.4 2.9 2.3 1.9 EV/EBITDA (X) 5.2 9.8 7.1 5.6 Dividend yield (%) 2.7 1.5 2.1 2.6 ROE (%) 18.9 22.0 25.4 25.7 CROCI (%) 29.7 29.9 29.4 28.6 Price performance chart 3 4 5 6 7 8 9 10 11 12 Aug-12 Dec-12 Mar-13 Jun-13 19,000 20,000 21,000 22,000 23,000 24,000 25,000 26,000 27,000 28,000 Sunny Optical Technology Group Co Ltd (L) Hang Seng Index (R) Share price performance (%) 3 month 6 month 12 month Absolute (23.0) 18.7 108.8 Rel. to Hang Seng Index (20.0) 25.9 90.4 Source: Company data, Goldman Sachs Research estimates, FactSet. Price as of 8/29/2013 close.
Transcript of Sunny Optical Technology Group Co Ltd -...

August 30, 2013
ACTION
Buy Sunny Optical Technology Group Co Ltd
Return Potential: 15% Equity Research
Initiate at Buy; key beneficiary of China optical upgrades
Source of opportunity
We initiate Sunny Optical at Buy, as we believe it is one of the best positioned
companies in China’s smartphone supply chain despite various industry
headwinds: 1) The handset camera module sector continues to be in a
technology/spec upgrade cycle, which could lift BOM (bill of materials) value
and stabilize gross margins; 2) Sunny holds a solid, leading industry position,
with c.30% share in smartphone camera modules of China branded OEMs –
still one of the fastest growing markets globally; 3) we believe the penetration
into the supply chain of more international clients, and the adoption of new
optical technology solutions could present upside risks to our estimates.
Catalyst
We see several potential stock catalysts in the continuing optical upcycle:
1) Strong monthly camera module/lens set shipment numbers, heading into
the industry peak season of August-October;
2) More flagship smartphone models, which are equipped with Sunny’s
products, launched by China OEMs in 2H13;
3) Successful penetration into the supply chain of more international clients,
following collaborations with Samsung Electronics and Leap Motion.
Valuation
We use average NTM P/E from 4Q12 to value Sunny, as we believe this
period/methodology aptly reflect changes in its business nature and stock
liquidity. Our 12-month price target of HK$9.8 is based on 11.6X P/E, implying
15% upside, the highest among our offshore technology coverage.
Key risks
Slower-than-expected camera upgrade; intensifying competition in the
module segment; ASP and margin pressure; laggard in disruptive technology;
strong growth of low-cost iPhones in China.
INVESTMENT LIST MEMBERSHIP
Asia Pacific Buy List
Coverage View: Neutral
Sam Li +86(10)6627-3326 [email protected] Beijing Gao Hua Securities Company Limited Goldman Sachs does and seeks to do business with companies
covered in its research reports. As a result, investors should be aware that the firm may have a conflict of interest that could affect the objectivity of this report. Investors should consider this report as only a single factor in making their investment decision. For Reg AC certification and other important disclosures, see the Disclosure Appendix, or go to www.gs.com/research/hedge.html. Analysts employed by non-US affiliates are not registered/qualified as research analysts with FINRA in the U.S.
Robert Yen +886(2)2730-4196 [email protected] Goldman Sachs (Asia) L.L.C., Taipei Branch
The Goldman Sachs Group, Inc. Global Investment Research
Growth
Returns *
Multiple
Volatility Volatility
Multiple
Returns *
Growth
Investment Profile
Low High
Percentile 20th 40th 60th 80th 100th
* Returns = Return on Capital For a complete description of the
investment profile measures please refer to
the disclosure section of this document.
Sunny Optical Technology Group Co Ltd (2382.HK)
Asia Pacific Technology Peer Group Average
Key data Current
Price (HK$) 8.50
12 month price target (HK$) 9.80
Market cap (HK$ mn / US$ mn) 8,281.7 / 1,067.9
Foreign ownership (%) --
12/12 12/13E 12/14E 12/15E
EPS (Rmb) 0.35 0.48 0.66 0.82
EPS growth (%) 69.0 35.3 39.3 23.7
EPS (diluted) (Rmb) 0.35 0.48 0.66 0.82
EPS (basic pre-ex) (Rmb) 0.35 0.48 0.66 0.82
P/E (X) 7.7 14.1 10.1 8.2
P/B (X) 1.4 2.9 2.3 1.9
EV/EBITDA (X) 5.2 9.8 7.1 5.6
Dividend yield (%) 2.7 1.5 2.1 2.6
ROE (%) 18.9 22.0 25.4 25.7
CROCI (%) 29.7 29.9 29.4 28.6
Price performance chart
3
4
5
6
7
8
9
10
11
12
Aug-12 Dec-12 Mar-13 Jun-13
19,000
20,000
21,000
22,000
23,000
24,000
25,000
26,000
27,000
28,000
Sunny Optical Technology Group Co Ltd (L) Hang Seng Index (R)
Share price performance (%) 3 month 6 month 12 monthAbsolute (23.0) 18.7 108.8
Rel. to Hang Seng Index (20.0) 25.9 90.4
Source: Company data, Goldman Sachs Research estimates, FactSet. Price as of 8/29/2013 close.
August 30, 2013 Sunny Optical Technology Group Co Ltd (2382.HK)
Goldman Sachs Global Investment Research 2
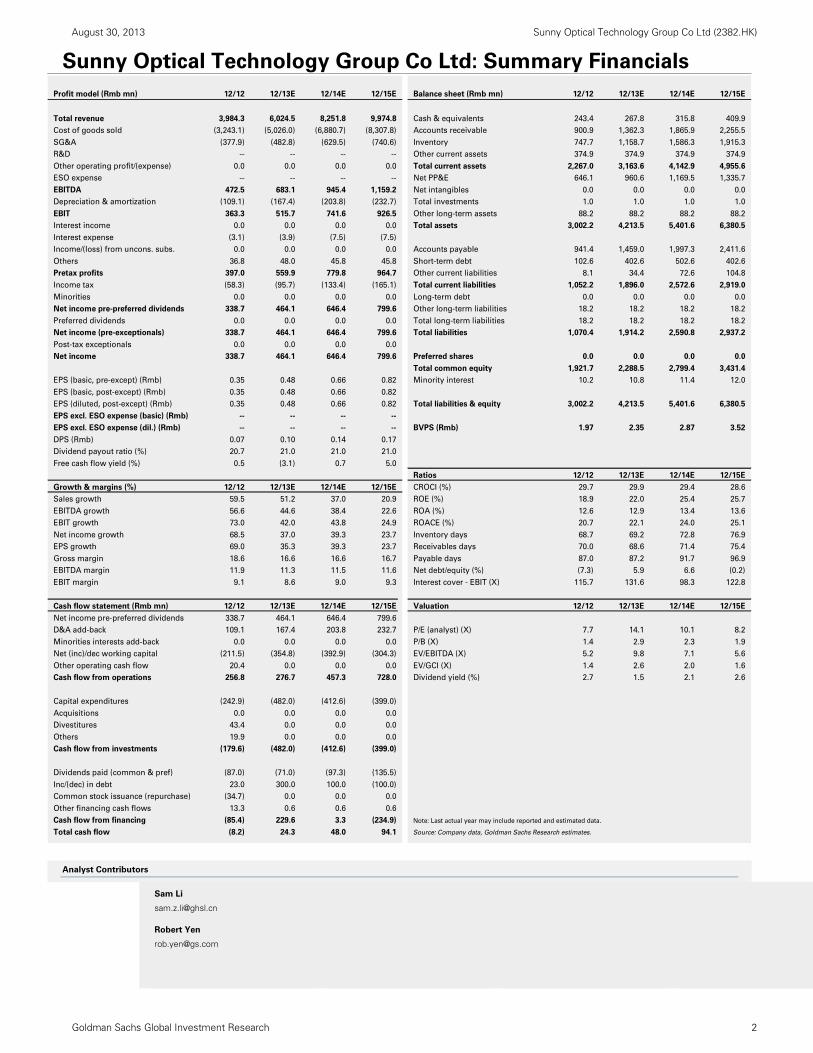
Sunny Optical Technology Group Co Ltd: Summary Financials
Analyst Contributors
Sam Li
Robert Yen
Profit model (Rmb mn) 12/12 12/13E 12/14E 12/15E Balance sheet (Rmb mn) 12/12 12/13E 12/14E 12/15E
Total revenue 3,984.3 6,024.5 8,251.8 9,974.8 Cash & equivalents 243.4 267.8 315.8 409.9
Cost of goods sold (3,243.1) (5,026.0) (6,880.7) (8,307.8) Accounts receivable 900.9 1,362.3 1,865.9 2,255.5
SG&A (377.9) (482.8) (629.5) (740.6) Inventory 747.7 1,158.7 1,586.3 1,915.3
R&D -- -- -- -- Other current assets 374.9 374.9 374.9 374.9
Other operating profit/(expense) 0.0 0.0 0.0 0.0 Total current assets 2,267.0 3,163.6 4,142.9 4,955.6
ESO expense -- -- -- -- Net PP&E 646.1 960.6 1,169.5 1,335.7
EBITDA 472.5 683.1 945.4 1,159.2 Net intangibles 0.0 0.0 0.0 0.0
Depreciation & amortization (109.1) (167.4) (203.8) (232.7) Total investments 1.0 1.0 1.0 1.0
EBIT 363.3 515.7 741.6 926.5 Other long-term assets 88.2 88.2 88.2 88.2
Interest income 0.0 0.0 0.0 0.0 Total assets 3,002.2 4,213.5 5,401.6 6,380.5
Interest expense (3.1) (3.9) (7.5) (7.5)
Income/(loss) from uncons. subs. 0.0 0.0 0.0 0.0 Accounts payable 941.4 1,459.0 1,997.3 2,411.6
Others 36.8 48.0 45.8 45.8 Short-term debt 102.6 402.6 502.6 402.6
Pretax profits 397.0 559.9 779.8 964.7 Other current liabilities 8.1 34.4 72.6 104.8
Income tax (58.3) (95.7) (133.4) (165.1) Total current liabilities 1,052.2 1,896.0 2,572.6 2,919.0
Minorities 0.0 0.0 0.0 0.0 Long-term debt 0.0 0.0 0.0 0.0
Net income pre-preferred dividends 338.7 464.1 646.4 799.6 Other long-term liabilities 18.2 18.2 18.2 18.2
Preferred dividends 0.0 0.0 0.0 0.0 Total long-term liabilities 18.2 18.2 18.2 18.2
Net income (pre-exceptionals) 338.7 464.1 646.4 799.6 Total liabilities 1,070.4 1,914.2 2,590.8 2,937.2
Post-tax exceptionals 0.0 0.0 0.0 0.0
Net income 338.7 464.1 646.4 799.6 Preferred shares 0.0 0.0 0.0 0.0
Total common equity 1,921.7 2,288.5 2,799.4 3,431.4
EPS (basic, pre-except) (Rmb) 0.35 0.48 0.66 0.82 Minority interest 10.2 10.8 11.4 12.0
EPS (basic, post-except) (Rmb) 0.35 0.48 0.66 0.82
EPS (diluted, post-except) (Rmb) 0.35 0.48 0.66 0.82 Total liabilities & equity 3,002.2 4,213.5 5,401.6 6,380.5
EPS excl. ESO expense (basic) (Rmb) -- -- -- --
EPS excl. ESO expense (dil.) (Rmb) -- -- -- -- BVPS (Rmb) 1.97 2.35 2.87 3.52
DPS (Rmb) 0.07 0.10 0.14 0.17
Dividend payout ratio (%) 20.7 21.0 21.0 21.0
Free cash flow yield (%) 0.5 (3.1) 0.7 5.0
Ratios 12/12 12/13E 12/14E 12/15E
Growth & margins (%) 12/12 12/13E 12/14E 12/15E CROCI (%) 29.7 29.9 29.4 28.6
Sales growth 59.5 51.2 37.0 20.9 ROE (%) 18.9 22.0 25.4 25.7
EBITDA growth 56.6 44.6 38.4 22.6 ROA (%) 12.6 12.9 13.4 13.6
EBIT growth 73.0 42.0 43.8 24.9 ROACE (%) 20.7 22.1 24.0 25.1
Net income growth 68.5 37.0 39.3 23.7 Inventory days 68.7 69.2 72.8 76.9
EPS growth 69.0 35.3 39.3 23.7 Receivables days 70.0 68.6 71.4 75.4
Gross margin 18.6 16.6 16.6 16.7 Payable days 87.0 87.2 91.7 96.9
EBITDA margin 11.9 11.3 11.5 11.6 Net debt/equity (%) (7.3) 5.9 6.6 (0.2)
EBIT margin 9.1 8.6 9.0 9.3 Interest cover - EBIT (X) 115.7 131.6 98.3 122.8
Cash flow statement (Rmb mn) 12/12 12/13E 12/14E 12/15E Valuation 12/12 12/13E 12/14E 12/15E
Net income pre-preferred dividends 338.7 464.1 646.4 799.6
D&A add-back 109.1 167.4 203.8 232.7 P/E (analyst) (X) 7.7 14.1 10.1 8.2
Minorities interests add-back 0.0 0.0 0.0 0.0 P/B (X) 1.4 2.9 2.3 1.9
Net (inc)/dec working capital (211.5) (354.8) (392.9) (304.3) EV/EBITDA (X) 5.2 9.8 7.1 5.6
Other operating cash flow 20.4 0.0 0.0 0.0 EV/GCI (X) 1.4 2.6 2.0 1.6
Cash flow from operations 256.8 276.7 457.3 728.0 Dividend yield (%) 2.7 1.5 2.1 2.6
Capital expenditures (242.9) (482.0) (412.6) (399.0)
Acquisitions 0.0 0.0 0.0 0.0
Divestitures 43.4 0.0 0.0 0.0
Others 19.9 0.0 0.0 0.0
Cash flow from investments (179.6) (482.0) (412.6) (399.0)
Dividends paid (common & pref) (87.0) (71.0) (97.3) (135.5)
Inc/(dec) in debt 23.0 300.0 100.0 (100.0)
Common stock issuance (repurchase) (34.7) 0.0 0.0 0.0
Other financing cash flows 13.3 0.6 0.6 0.6
Cash flow from financing (85.4) 229.6 3.3 (234.9) Note: Last actual year may include reported and estimated data.
Total cash flow (8.2) 24.3 48.0 94.1 Source: Company data, Goldman Sachs Research estimates.

August 30, 2013 Sunny Optical Technology Group Co Ltd (2382.HK)
Goldman Sachs Global Investment Research 3
Table of contents
Investment summary: Key beneficiary of China optical upgrades 4
Initiate at Buy; NTM P/E aptly values current fundamentals 5
Key business drivers: Camera module upgrade, strong China demand, further overseas opportunities 7
Cost/quality performance, supply chain, expertise in optical are competitive advantages 12
Key financials: Stabilizing gross margin, high earnings growth 14
We see risks of price/margin pressure, threat from low-cost iPhone 16
Company snapshot 16
Appendix: Sensitivity analysis of impact from low-cost iPhone 17
Disclosure Appendix 18
Prices in this report are based on the market close of August 29, 2013, unless otherwise stated.
The authors would like to thank Hemeng Dong for his contribution to the report.
Exhibit 1: Sunny is trading at similar multiples vs. peers, but has higher growth prospects Global comp sheet
Source: Bloomberg, Gao Hua Securities Research estimates, Goldman Sachs Global Investment Research.
Valuation comparison table
Ticker Name Rating Currency
Price
target Price
Market cap
$ mn
NI growth
2013E
NI growth
2014E
PE
2013E
PE
2014E
PB
2013E
PB
2014E
Gross margin
2013E
Gross margin
2014E
ROE
2013E
ROE
2014E
Sunny
2382 HK Sunny Buy HKD 9.8 8.50 1,068 37% 39% 14.1X 10.1X 2.9X 2.3X 17% 17% 20% 23%
A share component
002241 CH GoerTek Buy CNY 43.3 42.40 10,575 57% 35% 45.2X 33.4X 10.2X 8.1X 27% 26% 22% 24%
002273 CH Crystal Neutral CNY 18.8 19.64 1,202 13% 37% 44.0X 32.2X 6.3X 5.5X 42% 42% 14% 17%
Median 35% 36% 44.6X 32.8X 8.2X 6.8X 34% 34% 18% 20%
Overseas smartphone value chain
2369 HK China Wireless Buy* HKD 4.2 3.17 836 59% 58% 12.9X 8.1X 2.3X 1.9X 13% 13% 18% 23%
2018 HK AAC Buy HKD 44.0 34.9 5,526 31% 29% 14.6X 11.3X 4.6X 3.7X 43% 43% 31% 33%
3008 TT Largan Buy TWD 1350 1020 4,535 59% 18% 15.4X 13.1X 4.8X 3.7X 48% 47% 31% 28%
3673 TT TPK Neutral TWD 300 314 3,427 ‐19% ‐38% 9.2X 15.0X 2.1X 2.0X 14% 11% 23% 13%
2474 TT Catcher Buy TWD 176 141 3,531 20% ‐10% 8.1X 9.0X 1.5X 1.4X 43% 43% 18% 15%
2301 TT Lite‐On Neutral TWD 50 48.85 3,625 23% 11% 12.1X 10.9X 1.7X 1.6X 15% 15% 14% 15%
2454 TT MediaTek NR TWD NM 363.5 12,945 65% 26% 18.9X 15.0X 2.5X 2.4X 43% 44% 13% 16%
011070 KS LG Innotek Sell KRW 57000 89400 1,373 ‐305% 106% 36.1X 17.5X 1.4X 1.3X 12% 12% 4% 7%
732 HK Truly NC HKD NM 4.78 1,742 82% 18% 11.3X 9.7X 1.8X 1.8X 14% 14% 22% 22%
Median 31% 18% 12.9X 11.3X 2.1X 1.9X 15% 15% 18% 16%
Notes:
* Denotes stock is on GS regional Conviction List. All target prices are based on a 12‐month timeframe.
NC=Not Covered; NR=Not Rated

August 30, 2013 Sunny Optical Technology Group Co Ltd (2382.HK)
Goldman Sachs Global Investment Research 4
Investment summary: Key beneficiary of China optical upgrades
We initiate coverage on Sunny Optical (Sunny), a leading optical lens/camera maker in
China, at Buy, with a 12-month price target of HK$9.8, implying 15% upside. In our view,
the company is well positioned in its core smartphone camera module business, as China
branded smartphones are continuing to gain market share, especially the mid-high end
models, for which Sunny garners the highest market share. We believe Sunny’s
price/technology advantage over overseas/domestic competitors should enable the
company to maintain its leadership position in this segment, and enjoy around 34%
revenue CAGR for 2013E-2015E. For the lens segment, Sunny’s mobile camera lens has just
started to penetrate into the supply chain of global tier-1 clients, and the company is also
exploring opportunities in the fast growing vehicle lens and video surveillance lens
segments. Furthermore, Sunny has a strong track record in new optical technologies;
therefore, we believe it should benefit from opportunities like the 3D sensor and the array
camera. We also believe the 29% share price correction from May 2013 (vs. HSI’s 5%
decline) may be overdone, and provides an attractive entry point.
Business drivers
We believe Sunny should achieve sustainable growth in the next 2-3 years, as it is well placed
to meaningfully benefit from the technology/spec upgrade cycle of handset cameras, strong
growth of the China market, and continued penetration into global clients’ supply chain:
Optical upgrade cycle: Camera spec is currently one of the most important
differentiating factors for smartphones, in our view. We see continuous
technology/spec upgrades and new features like large aperture, super thin module and
fast AF, all of which are driving up the content value per box for optical components.
New optical solutions/applications, such as 3D and camera array, could also drive
potential long-term earnings upside, in our view.
Strong China market: On the demand side, we estimate China’s smartphone market
to grow at a 25% CAGR for 2013E-2015E, outpacing the 20% for the rest of world. On
the supply side, we believe China OEMs could seize opportunities in emerging markets
and strong demand for mid-range smartphones. Notably, Sunny has the highest
market share in these China branded OEMs.
More global tie-up opportunities: Sunny has become a lens supplier for Samsung’s
handset cameras, and an assembler of Leap Motion’s 3D sensors this year. In recent
years, the company has set up overseas branches, and has been proactively approaching
global clients. We believe the substantial room for further development at Samsung/Leap
Motion, and the potential penetration into other global clients could be the long-term
trend for Sunny due to: 1) The migration of the smartphone supply chain to greater
China, and 2) Sunny’s attractive price/quality performance vs. overseas competitors.
Competitive advantages
Sunny’s smartphone camera module business in China has grown rapidly since 2011, with
gross margins remaining at the high end of the sector, predominantly due to its attractive
cost/performance and rapid catch-up in manufacturing yield. Sunny’s competencies also lie
in its localized supply chain (vs. overseas competitors) and its expertise in the optical
industry and the supply of in-house lenses (vs. domestic competitors). On the other hand,
Sunny remains a laggard in the camera lens business, but we expect the company to
August 30, 2013 Sunny Optical Technology Group Co Ltd (2382.HK)
Goldman Sachs Global Investment Research 5
gradually improve its lens quality and yield, thus providing more buffer for camera module
gross margins, and stimulating overall revenue and gross profit growth.
Valuation: 12-month price target of HK$9.8, initiate at Buy
We value Sunny using its average NTM P/E from 4Q12, as we believe this period and
methodology best illustrate market expectations on the company, after having proven its
ability to succeed in the smartphone camera module business. Our 12-month price target
of HK$9.8 is based on 11.6X NTM P/E and 2014E EPS of HK$0.84. This is supported by the
improving ROE and CROCI performance of the company.
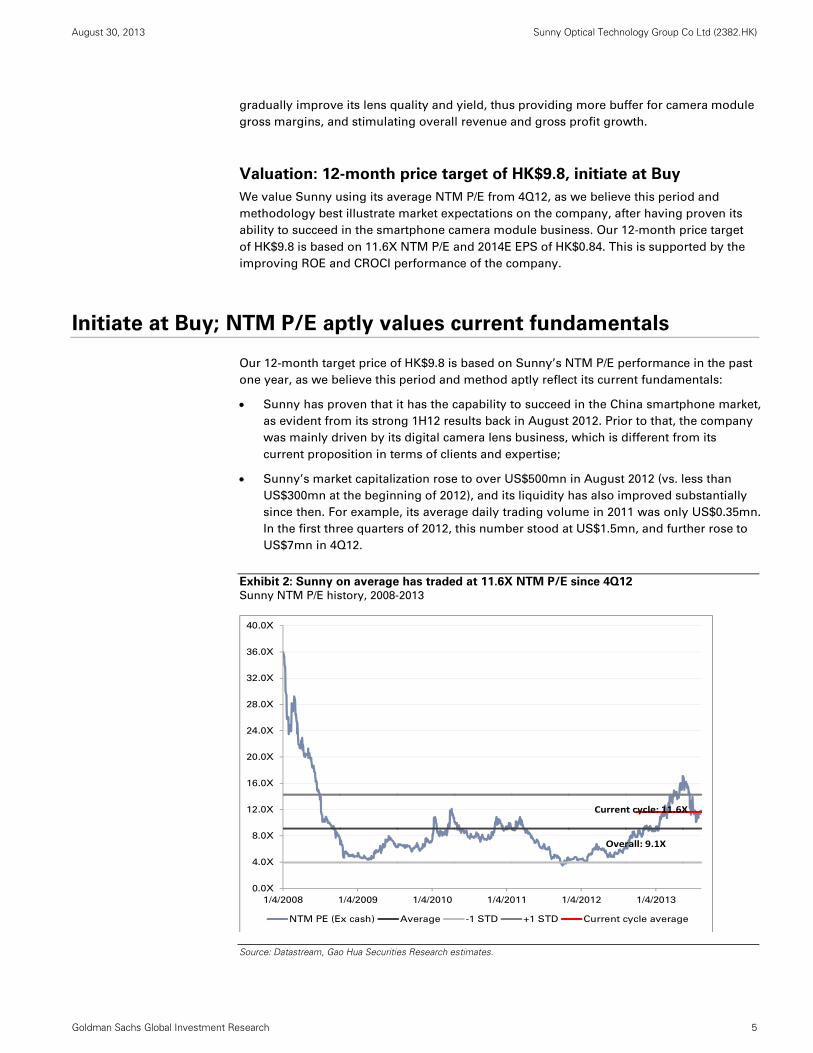
Initiate at Buy; NTM P/E aptly values current fundamentals
Our 12-month target price of HK$9.8 is based on Sunny’s NTM P/E performance in the past
one year, as we believe this period and method aptly reflect its current fundamentals:
Sunny has proven that it has the capability to succeed in the China smartphone market,
as evident from its strong 1H12 results back in August 2012. Prior to that, the company
was mainly driven by its digital camera lens business, which is different from its
current proposition in terms of clients and expertise;
Sunny’s market capitalization rose to over US$500mn in August 2012 (vs. less than
US$300mn at the beginning of 2012), and its liquidity has also improved substantially
since then. For example, its average daily trading volume in 2011 was only US$0.35mn.
In the first three quarters of 2012, this number stood at US$1.5mn, and further rose to
US$7mn in 4Q12.
Exhibit 2: Sunny on average has traded at 11.6X NTM P/E since 4Q12 Sunny NTM P/E history, 2008-2013
Source: Datastream, Gao Hua Securities Research estimates.
0.0X
4.0X
8.0X
12.0X
16.0X
20.0X
24.0X
28.0X
32.0X
36.0X
40.0X
1/4/2008 1/4/2009 1/4/2010 1/4/2011 1/4/2012 1/4/2013
NTM PE (Ex cash) Average -1 STD +1 STD Current cycle average
Current cycle: 11.6X
Overall: 9.1X

August 30, 2013 Sunny Optical Technology Group Co Ltd (2382.HK)
Goldman Sachs Global Investment Research 6
We also run a sector relative valuation analysis with a select group of camera module
makers, smartphone OEMs, and component vendors. Our findings indicate Sunny appears
undervalued in both the P/B-ROE and Director’s Cut model, and we estimate the company
could remain in the first and second CROCI quartile from 2013E-2015E.
Exhibit 3: Sunny appears undervalued in both our sector
P/B-ROE model… Sector P/B vs. ROE
Exhibit 4: …and our Director’s Cut model Sector EV/GCI vs. CROCI/WACC
Source: Datastream, Gao Hua Securities Research estimates, Goldman Sachs Global Investment Research.
Source: Datastream, Gao Hua Securities Research estimates, Goldman Sachs Global Investment Research.
Exhibit 5: Sunny’s CROCI rose to Q2 in 2012, and we expect it to remain at Q1-2
Sector CROCI comparison
Source: Company data, Gao Hua Securities Research estimates, Goldman Sachs Global Investment Research.
0
0.5
1
1.5
2
2.5
3
3.5
4
4.5
0 0.05 0.1 0.15 0.2 0.25 0.3 0.35 0.4
20
14E
PB
2014E ROE
LG InnotekSEMCO
Largan
Compal comm
AAC
Lite-On
Sunny
HTC
0
1
2
3
4
5
6
7
- 1.00 2.00 3.00 4.00 5.00 6.00 7.00 8.00 9.00 10.002014E E
V/G
CI
2014E CROCI/WACC
LG InnotekSEMCO
Largan
Compal comm
AAC
Lite-On
Sunny
HTC
Company
2008 2009 2010 2011 2012 2013 2014 2015
Largan 50% 40% 49% 55% 51% 79% 85% 87% 1st quartile
NavInfo 132% 180% 199% 166% 34% 45% 45% 42% 2nd quartile
AAC 30% 37% 38% 34% 38% 36% 39% 39% 3rd quartile
AutoNavi 21% 38% 64% 72% 68% 34% 48% 53% 4th quartile
Crystal 46% 48% 49% 45% 37% 32% 33% 32%
Sunny 17% 20% 22% 21% 30% 30% 29% 29%
China Wireless 33% 85% 66% 34% 28% 30% 32% 30%
MediaTek 138% 273% 150% 64% 19% 29% 33% 31%
Ultrapower 182% 237% 64% 26% 24% 28% 31% 33%
GoerTek 34% 17% 24% 33% 30% 28% 28% 28%
Catcher 39% 21% 6% 24% 26% 27% 22% 20%
iFLYTEK 50% 40% 23% 44% 34% 25% 22% 24%
Fiberhome 9% 21% 18% 19% 15% 25% 24% 24%
TPK 14% 58% 48% 43% 43% 25% 17% 13%
Accelink 64% 39% 29% 18% 41% 23% 23% 23%
AsiaInfo 104% 189% 36% 30% 19% 21% 19% 17%
Talkweb 89% 70% 123% 35% 12% 21% 23% 23%
Sunsea 30% 54% 38% 33% 32% 17% 17% 17%
Lite‐On 26% 26% 29% 25% 16% 17% 19% 19%
Comba 19% 45% 40% 28% ‐3% 14% 14% 14%
LG Innotek 14% 18% 8% 12% 11% 10% 10%
Tat Fook 17% 101% 71% 15% ‐18% 10% 14% 16%
Nationz 102% 290% 112% 26% ‐1% 9% 12% 13%
CROCI

August 30, 2013 Sunny Optical Technology Group Co Ltd (2382.HK)
Goldman Sachs Global Investment Research 7
Exhibit 6: Sunny’s share price has gone up four folds since it reported strong 1H12 results Price performance since IPO
Source: Datastream, Gao Hua Securities Research.
Key business drivers: Camera module upgrade, strong China
demand, further overseas opportunities
Although we see signals of a potential slowdown in the global smartphone market,
especially toward the high end, we believe Sunny is relatively better positioned in the
smartphone component supply chain vs. peers mainly due to three reasons:
Firstly, we believe the optical upgrade cycle in the smartphone industry is still ongoing,
with not only pixel upgrades, but new technologies/solutions, which could continue to
improve product ASPs and margins.
The global smartphone supply chain has entered a slower growth stage (our China
technology team forecasts 21% volume CAGR for 2013E-2015E vs. 50% for 2011-2013E), and
we believe investors have concerns over margin pressure for component manufacturers as
the current market driver has shifted to mid-low end smartphones. However, we believe
optical component, just like acoustic, is one of the few key parts that could improve the form
factor and value proposition of smartphones. Thus, together with the adoption of more
optical features, and the accelerated upgrade to 8M+ cameras in 2H13, we expect Sunny’s
camera module business to grow strongly at 82%/46% yoy for 2013E/2014E, while its gross
margin could mildly recover to 12.9% in 2014E (vs. 12.1% in 1H13).
In addition, besides the regular optical feature of smartphone cameras, we see several new
technology solutions that have the potential to change the optical industry dynamic and
benefit Sunny to different extents. The array camera uses an assortment of low-resolution
lenses (instead of one plastic lens unit); it provides superior performance with reduced
thickness of the module, and may take some market share if cost issues were to be
0
2
4
6
8
10
12
14
Ju
n-0
7
Sep
-07
De
c-0
7
Ma
r-0
8
Ju
n-0
8
Sep
-08
De
c-0
8
Ma
r-0
9
Ju
n-0
9
Sep
-09
De
c-0
9
Ma
r-1
0
Ju
n-1
0
Sep
-10
De
c-1
0
Ma
r-1
1
Ju
n-1
1
Sep
-11
De
c-1
1
Ma
r-1
2
Ju
n-1
2
Sep
-12
De
c-1
2
Ma
r-1
3
Ju
n-1
3
Success in China OEM
camera module and
vehicle lens biz, strong rev
& earnings growth, and
valuation re-rating
Earnings recovery from
digital camera lens biz, as
Sunny entered into Sony,
Canon value chain
Captial outflow from some
China hedge funds, on
speculation of the
company's ability to
success in smartphone biz
Earnings collapsed
during financial
crisis and
deterioration of
feature phone
IPO in 2007 where feature
phone was peaking, valued
at 2007 PE of 18X
Weak May 2013 results
caused concern on GM,
and triggered profit taking
Started smartphone
module biz
Profit recovered to pre-
crisis level
August 30, 2013 Sunny Optical Technology Group Co Ltd (2382.HK)
Goldman Sachs Global Investment Research 8
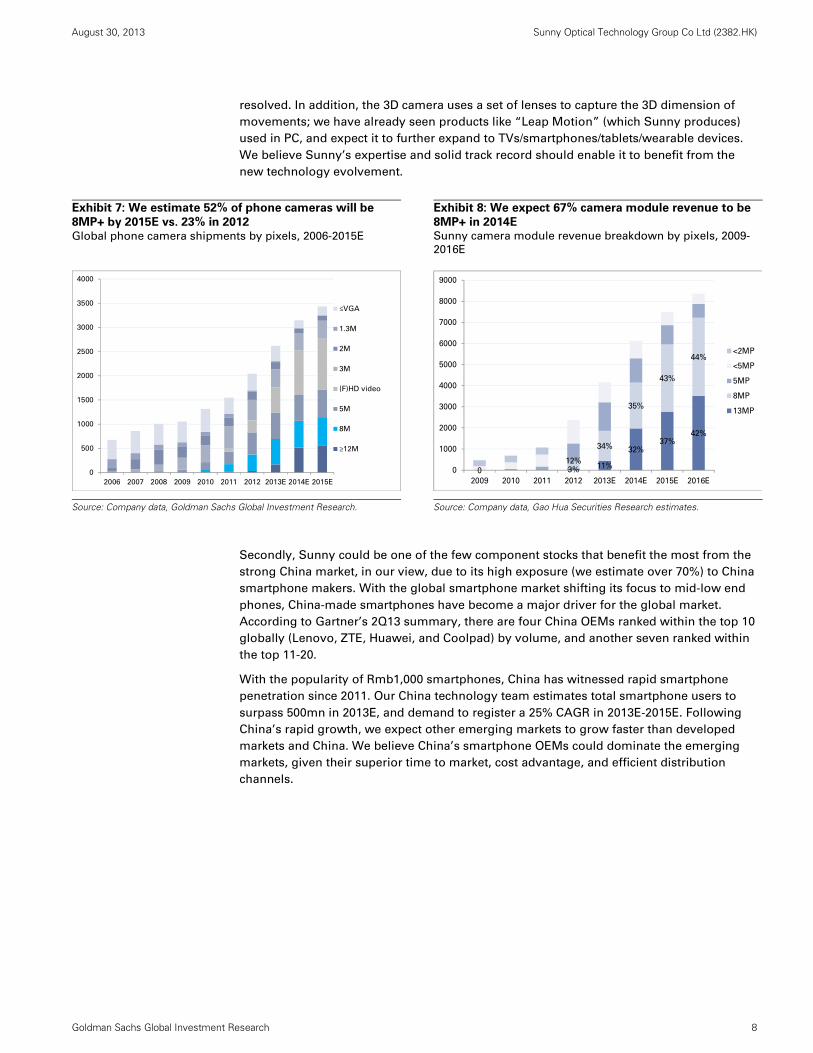
resolved. In addition, the 3D camera uses a set of lenses to capture the 3D dimension of
movements; we have already seen products like “Leap Motion” (which Sunny produces)
used in PC, and expect it to further expand to TVs/smartphones/tablets/wearable devices.
We believe Sunny’s expertise and solid track record should enable it to benefit from the
new technology evolvement.
Exhibit 7: We estimate 52% of phone cameras will be
8MP+ by 2015E vs. 23% in 2012
Global phone camera shipments by pixels, 2006-2015E
Exhibit 8: We expect 67% camera module revenue to be
8MP+ in 2014E Sunny camera module revenue breakdown by pixels, 2009-
2016E
Source: Company data, Goldman Sachs Global Investment Research.
Source: Company data, Gao Hua Securities Research estimates.
Secondly, Sunny could be one of the few component stocks that benefit the most from the
strong China market, in our view, due to its high exposure (we estimate over 70%) to China
smartphone makers. With the global smartphone market shifting its focus to mid-low end
phones, China-made smartphones have become a major driver for the global market.
According to Gartner’s 2Q13 summary, there are four China OEMs ranked within the top 10
globally (Lenovo, ZTE, Huawei, and Coolpad) by volume, and another seven ranked within
the top 11-20.
With the popularity of Rmb1,000 smartphones, China has witnessed rapid smartphone
penetration since 2011. Our China technology team estimates total smartphone users to
surpass 500mn in 2013E, and demand to register a 25% CAGR in 2013E-2015E. Following
China’s rapid growth, we expect other emerging markets to grow faster than developed
markets and China. We believe China’s smartphone OEMs could dominate the emerging
markets, given their superior time to market, cost advantage, and efficient distribution
channels.
0
500
1000
1500
2000
2500
3000
3500
4000
2006 2007 2008 2009 2010 2011 2012 2013E 2014E 2015E
≤VGA
1.3M
2M
3M
(F)HD video
5M
8M
≥12M
0 3% 11%
32%37%
42%
12%
34%
35%
43%
44%
0
1000
2000
3000
4000
5000
6000
7000
8000
9000
2009 2010 2011 2012 2013E 2014E 2015E 2016E
<2MP
<5MP
5MP
8MP
13MP
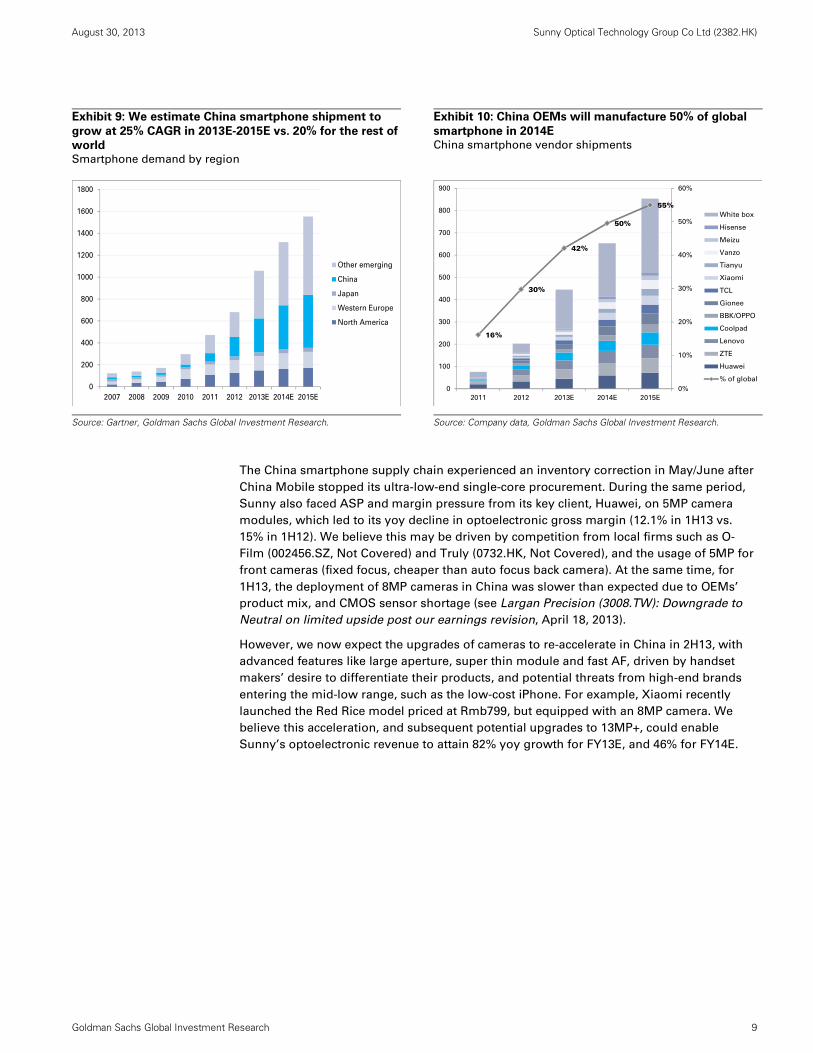
August 30, 2013 Sunny Optical Technology Group Co Ltd (2382.HK)
Goldman Sachs Global Investment Research 9
Exhibit 9: We estimate China smartphone shipment to
grow at 25% CAGR in 2013E-2015E vs. 20% for the rest of
world Smartphone demand by region
Exhibit 10: China OEMs will manufacture 50% of global
smartphone in 2014E China smartphone vendor shipments
Source: Gartner, Goldman Sachs Global Investment Research.
Source: Company data, Goldman Sachs Global Investment Research.
The China smartphone supply chain experienced an inventory correction in May/June after
China Mobile stopped its ultra-low-end single-core procurement. During the same period,
Sunny also faced ASP and margin pressure from its key client, Huawei, on 5MP camera
modules, which led to its yoy decline in optoelectronic gross margin (12.1% in 1H13 vs.
15% in 1H12). We believe this may be driven by competition from local firms such as O-
Film (002456.SZ, Not Covered) and Truly (0732.HK, Not Covered), and the usage of 5MP for
front cameras (fixed focus, cheaper than auto focus back camera). At the same time, for
1H13, the deployment of 8MP cameras in China was slower than expected due to OEMs’
product mix, and CMOS sensor shortage (see Largan Precision (3008.TW): Downgrade to
Neutral on limited upside post our earnings revision, April 18, 2013).
However, we now expect the upgrades of cameras to re-accelerate in China in 2H13, with
advanced features like large aperture, super thin module and fast AF, driven by handset
makers’ desire to differentiate their products, and potential threats from high-end brands
entering the mid-low range, such as the low-cost iPhone. For example, Xiaomi recently
launched the Red Rice model priced at Rmb799, but equipped with an 8MP camera. We
believe this acceleration, and subsequent potential upgrades to 13MP+, could enable
Sunny’s optoelectronic revenue to attain 82% yoy growth for FY13E, and 46% for FY14E.
0
200
400
600
800
1000
1200
1400
1600
1800
2007 2008 2009 2010 2011 2012 2013E 2014E 2015E
Other emerging
China
Japan
Western Europe
North America
16%
30%
42%
50%
55%
0%
10%
20%
30%
40%
50%
60%
0
100
200
300
400
500
600
700
800
900
2011 2012 2013E 2014E 2015E
White box
Hisense
Meizu
Vanzo
Tianyu
Xiaomi
TCL
Gionee
BBK/OPPO
Coolpad
Lenovo
ZTE
Huawei
% of global

August 30, 2013 Sunny Optical Technology Group Co Ltd (2382.HK)
Goldman Sachs Global Investment Research 10
Exhibit 11: We expect over 40% of total camera modules
to be 8MP+ from 2014E… Sunny camera module breakdown by pixel
Exhibit 12: ...and camera lens to accelerate from 2H13E
Sunny camera lens shipment by pixel
Source: Company data, Gao Hua Securities Research estimates.
Source: Company data, Gao Hua Securities Research estimates.
Last but not least, we believe the penetration into the supply chain of more international
clients, and the adoption of a few new optical technology solutions could present upside
risks to our estimates.
In June, Sunny started its lens shipment to Samsung Electronics, which we believe is its
first global tier-1 client in the smartphone market. Management expects 20mn shipment to
Samsung, mainly for 8MP lens, in 2013. On the ‘other lens’ market, Sunny has the highest
share in the fast growing vehicle lens market. The company guided over 40% 2013-2015
revenue CAGR from this market, and we expect it to uplift the overall gross margin of the
lens business. Optical instrument is a niche market. While Sunny has relative strength in
this field, the Chinese government has implemented import substitution strategy for high-
end optical analytical instrument and R&D subsidies. We believe Sunny could benefit from
this trend, and harvest potential opportunities in the areas of environment protection and
safety inspection.
The company has also been supplying Leap Motion’s 3D sensor since March, and expects
1mn shipment in 2013. Sunny set up a US subsidiary in 2012, and is in contact with other
North American clients on potential projects. Although the timing of clinching new
international clients is highly uncertain, we believe this could be the long-term trend for
Sunny due to: 1) The migration of the smartphone supply chain to greater China, and 2)
Sunny’s attractive price/quality performance vs. overseas competitors.
0% 1%5%
18%
25%
35%
40%
0% 4%15% 20% 25%
0%
10%
20%
30%
40%
50%
60%
70%
80%
90%
100%
2010 2011 2012 2013E 2014E 2015E 2016E
<2MP <5MP 5MP 8MP 13MP
0% 2% 6%
25%
30%35%
40%
0% 0%8%
18% 20% 25%
0%
10%
20%
30%
40%
50%
60%
70%
80%
90%
100%
2010 2011 2012 2013E 2014E 2015E 2016E
8MP+
5MP
3.0M
2.0M
1.3M
0.3M

August 30, 2013 Sunny Optical Technology Group Co Ltd (2382.HK)
Goldman Sachs Global Investment Research 11
Exhibit 13: Array camera technology
Camera array
Exhibit 14: Sunny is main ODM of Leap Motion
Leap Motion 3D sensor
Source: Goldman Sachs Global Investment Research.
Source: Company data.
Array cameras may be the wild card for Sunny to extend global
footprints
The array camera is an emerging technology with a camera module consisting of
one CMOS sensor and an array of WLO-based lenses. The key advantages of an
array camera are: 1) Less thickness with around 50% height reduction as
compared to the conventional camera module; 2) no need for an actuator inside
the module as the array camera can create much larger depth of field; 3) capability
for a better image and video performance in a backlit or low light environment.
Currently, there is not yet a commercial product in the market. In our view, the key
hurdle for the array camera becoming mainstream is its high cost structure. We
believe the high cost is caused by the manufacturing yield loss, which remains
high due to the difficulty to put multiple lenses together with high precision in
optical alignment. In addition, the immature supply chain and hefty capex in
special machines and equipment result in high depreciation cost. We currently
forecast the global penetration rate of array cameras in mobile devices to remain
low at 3%/6% in 2015E/2016E.
We believe Sunny is also aggressive in developing the array camera business as a
module maker, and the company hopes to leverage this technology to expand its
customer base to non-Chinese OEMs. We see the possibility of Sunny delivering
commercially-ready array camera module products in 2014E, but so far
the visibility has been low as to which OEMs might support this technology and
the cost structure.
For more details on the array camera technology and industry implications, please
refer to our report titled “Array cameras a disruptive force? A deep dive; Buy
Largan/AAC” dated July 31, 2013.
5-6 mm
2.5-3.5 mm

August 30, 2013 Sunny Optical Technology Group Co Ltd (2382.HK)
Goldman Sachs Global Investment Research 12
Cost/quality performance, supply chain, expertise in optical are
competitive advantages
Sunny’s business is divided into two major categories: Optical and optoelectronic. Overall,
we believe Sunny is more solidly positioned on the optoelectronic front in the China
market, while it remains a laggard in the optical lens market.
The optoelectronic segment’s gross margin relies heavily on yield and economy of scale,
mainly due to the electronic nature of its products. Sunny was able to catch the high
growth phase of China smartphone OEMs from 2009, and their component localization
strategy. The fast growing revenue scale in return enables Sunny to gradually improve its
gross margin to the high end of the sector. At the same time, though Sunny is a latecomer
in the industry, we believe its yield has improved swiftly mainly due to its expertise in
optical and earlier experience in the feature phone camera module.
Exhibit 15: Sunny quickly caught up in the camera
module business… Camera module revenue, 2009-2015E
Exhibit 16: …and managed to maintain its gross margin
at the high end of the sector Gross margin comparison, 2009-2015E
Source: Bloomberg, Company data, Gao Hua Securities Research estimates, Goldman Sachs Global Investment Research.
Source: Bloomberg, Company data, Gao Hua Securities Research estimates, Goldman Sachs Global Investment Research.
On the optical front, Sunny’s expertise lies mainly on the DSC lens; it remains a laggard as
compared to smartphone camera lens leaders like Largan, especially in high resolution
products. As such, we see a significant gross margin gap between Sunny and Largan. On
the other hand, Sunny is gradually catching up in the area of phone camera lens, and
expanding its product lines to the fast growing vehicle lens, thermal lens and surveillance
lens, which helped boost its gross margin to be substantially higher than peers only
focusing on the DSC lens like Asia Optical.
We also see the increase of internal lens supply as a key factor for Sunny to maintain or
improve its gross margin. Currently, Sunny relies heavily on external suppliers such as
Largan, particularly for high resolution parts. Although the internal supply would not help
camera module gross margins directly (settled at market price between business units),
contribution from the lens side (gross margin over 30%) could support overall gross
margins, in our view.
0
500
1,000
1,500
2,000
2,500
Sunny Lite-On LG-Innotek Primax Partron SEMCO
US
$,
mn
2009 2010 2011 2012 2013E 2014E 2015E
0%
2%
4%
6%
8%
10%
12%
14%
16%
18%
2009 2010 2011 2012 2013E 2014E 2015E
Sunny Lite-On LG-Innotek
Primax Partron SEMCO

August 30, 2013 Sunny Optical Technology Group Co Ltd (2382.HK)
Goldman Sachs Global Investment Research 13
Exhibit 17: Sunny remains a laggard in camera lens
Camera lens revenue, 2009-2015E
Exhibit 18: GM in the middle range for focusing on phone
lens (vs. Asia Optical) but with low spec (vs. Largan) Gross margin comparison, 2009-2015E
Source: Bloomberg, Company data, Gao Hua Securities Research estimates, Goldman Sachs Global Investment Research.
Source: Bloomberg, Company data, Gao Hua Securities Research estimates, Goldman Sachs Global Investment Research.
Besides these, we believe Sunny’s competencies also lie in its localized supply chain and
its expertise in the optical industry and in-house lens supply.
Supply chain advantage: The camera lens business is labor intensive. Sunny
possesses an advantage over Japan/Korea/Taiwan competitors in terms of labor
cost, especially after it moved its DSC lens business to the Henan province. Also,
its close proximity to domestic clients and flexible manufacturing/pricing enable it
to gain some advantage in time to market; we believe this is important for China
OEMs since they tend to have a faster pace in new product launches.
Optical expertise and in-house lens supply: As opposed to domestic
competitors such as Truly/O-Film/GoerTek, we believe Sunny’s expertise and
experience in optical make it easier to adapt to new camera features like large
aperture, fast AF and super thin module. Moreover, the in-house lens
manufacturing capability could provide adequate material supply for the module
business, and act as a buffer when there are strong headwinds on gross margins.
Besides, Sunny has a broader range of products; it is currently a leader in the
vehicle lens market, and exploring opportunities in thermal and surveillance lenses,
which could also act as buffers and potentially drive future growth.
Competition against lens maker Largan and module maker Lite-On
Largan (3008.TW, Buy): Largan is the world’s largest camera lens maker for
mobile devices, with an estimated market share of 30%-35% (in value terms). We
see Sunny and Largan as more of partners rather than competitors for the
foreseeable future, as both companies (Largan as a supplier to Sunny) work
together closely to facilitate the optical upgrade cycle in China, as the camera lens
segment carries much higher barriers to entry than the module products. We
believe Largan’s superior capability in optical design, manufacturing know-how,
and execution track record would warrant the company with sustainable
leadership as the optical upgrade cycle continues. While Sunny is also ramping up
its in-house lens capability (which is mostly for the mid-low end segment), we
believe Largan should maintain its leadership at the mid-high end segment.
0
200
400
600
800
1000
1200
Sunny Largan Genius Asia optical
US
$,
mn
2009 2010 2011 2012 2013E 2014E 2015E
0%
10%
20%
30%
40%
50%
60%
70%
2009 2010 2011 2012 2013E 2014E 2015E
Sunny Largan Genius Asia optical

August 30, 2013 Sunny Optical Technology Group Co Ltd (2382.HK)
Goldman Sachs Global Investment Research 14
Lite-On Tech (2301.TW, Neutral): Lite-On is one of the top-tier camera module
makers globally, with an estimated global market share of 6%-7% (in value terms)
in mobile devices. We believe Lite-On enjoys technological advantage and strong
execution capability on mid-high end camera modules (mostly 8MP or above), and
has a higher market share than Sunny in this segment. While we have seen Sunny
actively increasing its shipment mix in 8MP+ camera modules, we believe the
competition between Lite-On and Sunny remains reasonable at this time, as we
expect a solid TAM growth in smart devices with higher optical spec in next few
years, potentially making both Sunny and Lite-On, two distinct module leaders in
the China market, the major beneficiaries in this space.
Key financials: Stabilizing gross margin, high earnings growth
Mainly driven by the strong revenue growth in camera modules (26% CAGR for 2013E-
2016E), we expect Sunny’s top line to grow at a 23% CAGR for the same period. We expect
Sunny to maintain around 28%-30% market share in the China branded OEMs market,
while maintaining its leading position in the high pixel (8MP+) segment vs. local
competitors. As a result, we believe the handset camera module could contribute as high
as 74%-75% of total revenue in 2014E-2016E. We also expect other optoelectronic
(including TV camera module and 3D sensor), handset lens (driven by Samsung and self-
supply), and vehicle lens to achieve relatively high growth (30%-40%), although
contributions should continue to be limited (15% of 2013E revenue).
Meanwhile, we forecast the overall gross margin to remain stable around 16.5%-17% for
2013E-2016E, driven by: 1) Margin stabilization of the handset camera module business
from 2H13, when the pixel upgrade in China re-accelerates; 2) we estimate optical
component segment gross margin would rise to 29% in FY16E from 23.8% in FY13E, driven
by the outperformance of vehicle lens (over 40% gross margin).
Exhibit 19: We expect over 70% revenue from handset
modules from 2014E
Revenue breakdown by product lines
Exhibit 20: We expect module gross margin to be stable
and component gross margin to improve
GM forecasts by segments
Source: Company data, Gao Hua Securities Research estimates.
Source: Company data, Gao Hua Securities Research estimates.
With our stabilized gross margin assumption and the operating leverage that Sunny has
shown over the past two years, we expect the company’s operating profit margin to rise
from 8.6% in 2013E to 9.6% in 2016E. For 1H13, Sunny’s opex ratio dropped to 8.1% vs.
9.9% for 1H12, as administration and selling expenses benefitted from scalability.
38% 43%60%
69%
74%
75%74%
0
2,000
4,000
6,000
8,000
10,000
12,000
2010 2011 2012 2013E 2014E 2015E 2016E
Other lens & module
Optical instruments
Vehicle lens
DSC lens
Handset lens
Handset module
0%
5%
10%
15%
20%
25%
30%
35%
40%
2007 2008 2009 2010 2011 2012 2013E 2014E 2015E 2016E
Optical components Optoelectronic products
Optical instruments Overall GM

August 30, 2013 Sunny Optical Technology Group Co Ltd (2382.HK)
Goldman Sachs Global Investment Research 15
Therefore, we estimate 31% CAGR bottom line growth for 2013E-2015E, which is a strong
level of growth as compared to Asian peers’ average of 16% for the same period.
Exhibit 21: OPM rises on the back of GM improvement &
operating leverage Margin forecasts
Exhibit 22: Thus, we see strong bottom line growth
EPS forecasts
Source: Company data, Gao Hua Securities Research estimates.
Source: Company data, Gao Hua Securities Research estimates.
Sunny’s legacy DSC lens business has been a cash cow; the company used to have very
little debt and was in a net cash position until 2012. We expect the company to be in a net
debt position from 2013E, given its fast growing capacity expansion in the smartphone
camera lens and module segments (our capex assumption of Rmb482mn is slightly lower
than the company’s guidance of Rmb500mn); however, considering the company’s high
interest coverage ratio, we believe this level of debt should have limited impact on its
financial stability. We believe the debt financing could offer meaningful earnings leverage
for Sunny, thus benefiting its bottom line growth; we also expect the company to return to
a net cash position by 2015E.
We also believe Sunny will maintain a healthy cash flow. Though there will be significant
capex from 2H13, we believe strong growth in operating cash flows and a moderate level
of short-term debt financing will be sufficient to fulfill the capital requirement.
Exhibit 23: P&L summary and our key assumptions
Source: Company data, Gao Hua Securities Research estimates.
0%
5%
10%
15%
20%
25%
30%
2007 2008 2009 2010 2011 2012 2013E 2014E 2015E 2016E
GM OPM NM
0.00
0.20
0.40
0.60
0.80
1.00
1.20
2007 2008 2009 2010 2011 2012 2013E 2014E 2015E 2016E
EPS - Rmb
13-16E CAGR: 26%
P&L (Rmb mn) 1H2013 2H2013E 1H2014E 2H2014E 1H2015E 2H2015E 1H2016E 2H2016E 2012 2013E 2014E 2015E 2016ERevenues 2786 3239 3797 4454 4586 5389 5186 6091 3984 6024 8252 9975 11277Gross profits 440 558 635 737 771 896 881 1022 741 998 1371 1667 1904Operating profits 216 300 345 397 431 496 505 579 363 516 742 926 1084Pretax earnings 235 325 360 420 446 519 521 604 397 560 780 965 1125Net earnings 194 270 298 349 369 431 431 501 339 464 646 800 933EPS (fully diluted, RMB) 0.20 0.28 0.31 0.36 0.38 0.44 0.44 0.51 0.35 0.48 0.66 0.82 0.96Ratio analysisGross margin (%) 15.8% 17.2% 16.7% 16.5% 16.8% 16.6% 17.0% 16.8% 18.6% 16.6% 16.6% 16.7% 16.9%EBIT margin (%) 7.8% 9.3% 9.1% 8.9% 9.4% 9.2% 9.7% 9.5% 9.1% 8.6% 9.0% 9.3% 9.6%Net margin (%) 7.0% 8.3% 7.8% 7.8% 8.0% 8.0% 8.3% 8.2% 8.5% 7.7% 7.8% 8.0% 8.3%
Key assumptions 1H2013 2H2013E 1H2014E 2H2014E 1H2015E 2H2015E 1H2016E 2H2016E 2012 2013E 2014E 2015E 2016ERevenues (RMB mn)Optical components 633 849 816 859 938 988 1079 1136 1426 1483 1675 1927 2216
Gross margin 22.8% 24.6% 25.4% 26.3% 27.1% 28.1% 28.5% 29.5% 22.8% 23.8% 25.9% 27.6% 29.0%Optoelectronic products 2144 2405 2998 3644 3687 4482 4166 5065 2500 4549 6642 8169 9231
Gross margin 12.1% 13.0% 12.9% 12.9% 12.8% 12.8% 12.6% 12.6% 14.1% 12.6% 12.9% 12.8% 12.6%Optical instruments 102 102 113 113 124 124 136 136 186 205 225 248 273
Gross margin 36.7% 36.0% 36.0% 36.0% 36.0% 36.0% 36.0% 36.0% 34.1% 36.3% 36.0% 36.0% 36.0%Eliminations -94 -118 -129 -162 -164 -205 -196 -246 -127 -212 -291 -369 -443Total 2786 3239 3797 4454 4586 5389 5186 6091 3984 6024 8252 9975 11277
Gross margin 15.8% 17.2% 16.7% 16.5% 16.8% 16.6% 17.0% 16.8% 18.6% 16.6% 16.6% 16.7% 16.9%

August 30, 2013 Sunny Optical Technology Group Co Ltd (2382.HK)
Goldman Sachs Global Investment Research 16
We see risks of price/margin pressure, threat from low-cost iPhone
Although we are optimistic on Sunny’s position in the China market and the optical supply
chain, we do see the following factors as potential risks to our investment thesis:
ASP and margin pressures: Sunny mainly supplies China OEMs competing in the
mid-end smartphone segment; these China OEMs are price sensitive, as evident from
the aggressive price cut in 5MP products we saw in 1H13. The camera module
business commands a relatively low margin (10%-15%) and Sunny’s earnings are
rather sensitive to gross margins. Hence, the company’s earnings growth would be
challenging if we were to see further large ASP/margin cuts.
Competition on camera modules: Taiwan vendors like Lite-on/Primax are
penetrating into flagship models of China smartphone OEMs, while domestic players
like Truly and O-Film are competing in the low-end (mostly under 5MP) segment.
There could be potential risks to Sunny’s market share if Taiwan vendors were to bring
down prices or Truly/O-Film were to catch up in technology.
Slower-than-expected camera upgrades: Sunny’s robust growth is very much
dependent on swift upgrade of cameras. As such, there could be downside risks if the
pace is slower than expected, or the migration mainly happens in low value front
cameras.
Disruptive technology changes: Although we believe new technologies like array
cameras and 3D sensors could be positive to camera module makers like Sunny, other
disruptive technologies in the optical industry could also have a negative impact on
Sunny if the company is not well prepared or competitive enough in these areas.
Threat from low-cost iPhones: Mid-high end smartphones priced between
Rmb1,800-3,000 is one of the fastest growing market for China OEMs, and it is Sunny’s
main gross profit driver since most of its high pixel cameras (8MP+) are supplied to
these models. Although the final retail price has not been disclosed yet, we believe the
low-price iPhone could impose certain threats on China OEMs if it were to be priced at
US$400 or below. Also, if it were to grab significant market share, Sunny’s total
shipment and product mix (with less 8MP+ product) could be negatively impacted (see
Appendix).
Company snapshot
Sunny Optical is a leading manufacturer of optical components in China. Since its
establishment in 1984, Sunny has emerged from a township enterprise producing
microscopes to a leading consolidated optical vendor, engaging in optical-related product
development and the manufacturing of optical lens, optoelectronics and optical instrument.
We estimate it commands around 30% market share (industry leader) in the branded China
smartphone camera module market, and also holds a leading position in the fast growing
vehicle lens and analytical instrument market. The company is headquartered in the
Zhejiang province (Yuyao city), and has production centers in the Yangtze delta and Pearl
delta (Guangdong Zhongshan). The company has recently moved its legacy DSC lens
business to the Henan province (mid-China) to leverage the more abundant and cheap
labor force. Sunny was listed on the mainboard of the Hong Kong Exchange on June 15,
2007, and was included in the MSCI China small index in 2011.
With a solid track record in its major business lines, Sunny supplies Samsung, Nikon and
Sony in the legacy DSC segment, and is the main camera module supplier for leading
China smartphone OEMs like Huawei, Coolpad, Lenovo, and Xiaomi. For the camera lens
August 30, 2013 Sunny Optical Technology Group Co Ltd (2382.HK)
Goldman Sachs Global Investment Research 17
segment, the company used to supply low-end models for Nokia (through Sharp); it
penetrated into Samsung’s supply chain this year supplying 5MP and 8MP camera lenses.
Apart from the maturing camera lens and module business, Sunny is also a pioneer in new
optical applications. It is now the main ODM for 3D gesture sensor device Leap Motion. We
believe Sunny can utilize its expertise in optical processing and capture future
opportunities in new optical fields, including 3D sensor, array camera and optical zooming.
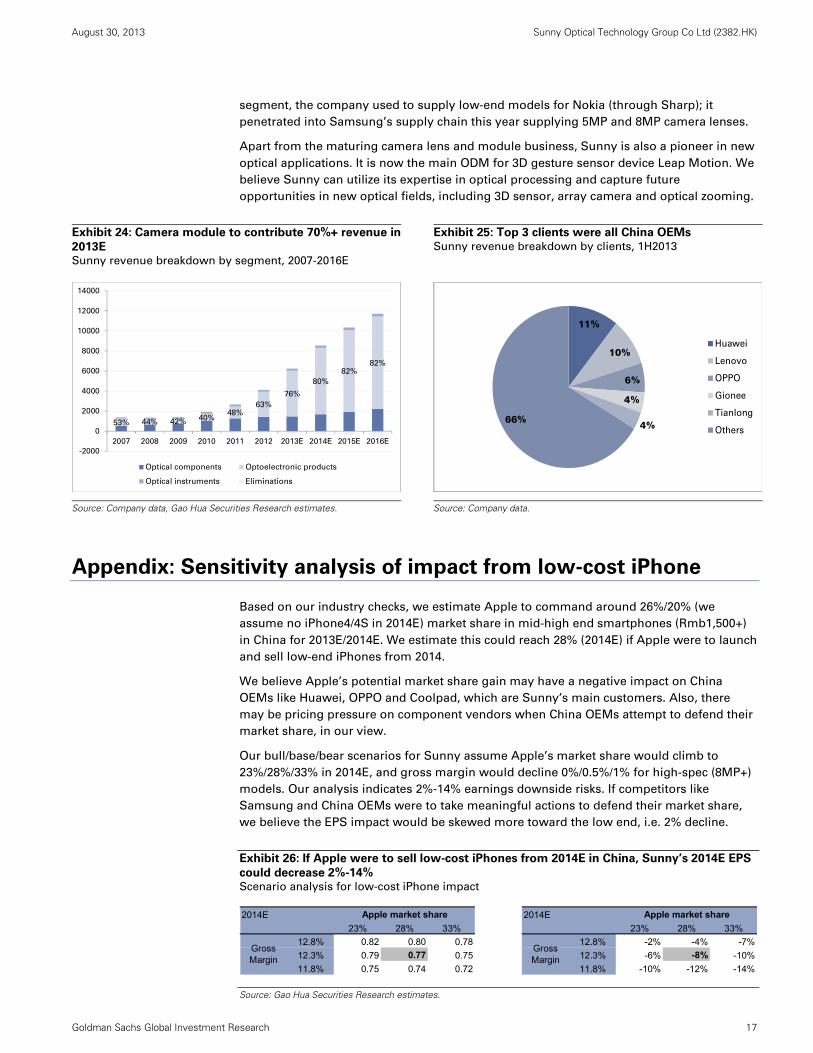
Exhibit 24: Camera module to contribute 70%+ revenue in
2013E Sunny revenue breakdown by segment, 2007-2016E
Exhibit 25: Top 3 clients were all China OEMs
Sunny revenue breakdown by clients, 1H2013
Source: Company data, Gao Hua Securities Research estimates.
Source: Company data.
Appendix: Sensitivity analysis of impact from low-cost iPhone
Based on our industry checks, we estimate Apple to command around 26%/20% (we
assume no iPhone4/4S in 2014E) market share in mid-high end smartphones (Rmb1,500+)
in China for 2013E/2014E. We estimate this could reach 28% (2014E) if Apple were to launch
and sell low-end iPhones from 2014.
We believe Apple’s potential market share gain may have a negative impact on China
OEMs like Huawei, OPPO and Coolpad, which are Sunny’s main customers. Also, there
may be pricing pressure on component vendors when China OEMs attempt to defend their
market share, in our view.
Our bull/base/bear scenarios for Sunny assume Apple’s market share would climb to
23%/28%/33% in 2014E, and gross margin would decline 0%/0.5%/1% for high-spec (8MP+)
models. Our analysis indicates 2%-14% earnings downside risks. If competitors like
Samsung and China OEMs were to take meaningful actions to defend their market share,
we believe the EPS impact would be skewed more toward the low end, i.e. 2% decline.
Exhibit 26: If Apple were to sell low-cost iPhones from 2014E in China, Sunny’s 2014E EPS
could decrease 2%-14% Scenario analysis for low-cost iPhone impact
Source: Gao Hua Securities Research estimates.
53% 44% 42% 40%48%
63%
76%
80%
82%82%
-2000
0
2000
4000
6000
8000
10000
12000
14000
2007 2008 2009 2010 2011 2012 2013E 2014E 2015E 2016E
Optical components Optoelectronic products
Optical instruments Eliminations
11%
10%
6%
4%
4%66%
Huawei
Lenovo
OPPO
Gionee
Tianlong
Others
2014E 2014E
0.84 23% 28% 33% 23% 28% 33%
12.8% 0.82 0.80 0.78 12.8% -2% -4% -7%
12.3% 0.79 0.77 0.75 12.3% -6% -8% -10%
11.8% 0.75 0.74 0.72 11.8% -10% -12% -14%
Apple market share Apple market share
GrossMargin
GrossMargin

August 30, 2013 Sunny Optical Technology Group Co Ltd (2382.HK)
Goldman Sachs Global Investment Research 18
Disclosure Appendix
Reg AC
We, Sam Li and Robert Yen, hereby certify that all of the views expressed in this report accurately reflect our personal views about the subject
company or companies and its or their securities. We also certify that no part of our compensation was, is or will be, directly or indirectly, related to
the specific recommendations or views expressed in this report.
Investment Profile
The Goldman Sachs Investment Profile provides investment context for a security by comparing key attributes of that security to its peer group and
market. The four key attributes depicted are: growth, returns, multiple and volatility. Growth, returns and multiple are indexed based on composites
of several methodologies to determine the stocks percentile ranking within the region's coverage universe.
The precise calculation of each metric may vary depending on the fiscal year, industry and region but the standard approach is as follows:
Growth is a composite of next year's estimate over current year's estimate, e.g. EPS, EBITDA, Revenue. Return is a year one prospective aggregate
of various return on capital measures, e.g. CROCI, ROACE, and ROE. Multiple is a composite of one-year forward valuation ratios, e.g. P/E, dividend
yield, EV/FCF, EV/EBITDA, EV/DACF, Price/Book. Volatility is measured as trailing twelve-month volatility adjusted for dividends.
Quantum
Quantum is Goldman Sachs' proprietary database providing access to detailed financial statement histories, forecasts and ratios. It can be used for
in-depth analysis of a single company, or to make comparisons between companies in different sectors and markets.
GS SUSTAIN
GS SUSTAIN is a global investment strategy aimed at long-term, long-only performance with a low turnover of ideas. The GS SUSTAIN focus list
includes leaders our analysis shows to be well positioned to deliver long term outperformance through sustained competitive advantage and
superior returns on capital relative to their global industry peers. Leaders are identified based on quantifiable analysis of three aspects of corporate
performance: cash return on cash invested, industry positioning and management quality (the effectiveness of companies' management of the
environmental, social and governance issues facing their industry).
Disclosures
Coverage group(s) of stocks by primary analyst(s)
Sam Li: China Technology. Robert Yen: Asia Pacific Technology.
Asia Pacific Technology: AAC Technologies, ASUSTeK Computer, AU Optronics, Acer, Advanced Semiconductor, Career Technology, Casetek
Holdings Limited, Catcher Technology, China Wireless Technologies, Compal Communications, Compal Electronics, Coretronic, Delta Electronics, E
Ink Holdings Inc, Epistar, Flexium Interconnect, Foxconn Technology, HTC Corp., Hon Hai Precision, Innolux, Kinsus Interconnect Technology, Largan
Precision, Lenovo Group, Lite-On Technology, Novatek Microelectronics, Pegatron, Quanta Computer, Radiant Opto-Electronics, Siliconware
Precision, Synnex Technology International, TPK Holding, Unimicron Technology, Wintek, Wistron, Zhen Ding Technology Holding.
China Technology: Accelink Technologies, Anhui USTC iFLYTEK, AsiaInfo-Linkage, AutoNavi Holdings Ltd., Beijing Ultrapower Software, Comba
Telecom Systems, Fiberhome Telecom Tech, GoerTek Inc., Hunan Talkweb Information System, MStar Semiconductor, Mediatek, Nationz
Technologies, NavInfo Co, Parade Technologies Ltd, Shenzhen Tat Fook Technology, Sunny Optical Technology Group Co Ltd, Sunsea
Telecommunications, TSMC, TSMC (ADR), United Microelectronics (ADR), United Microelectronics Corp., ZTE Corporation (A), ZTE Corporation (H),
Zhejiang Crystal-Optech Co..
Company-specific regulatory disclosures
The following disclosures relate to relationships between The Goldman Sachs Group, Inc. (with its affiliates, "Goldman Sachs") and companies
covered by the Global Investment Research Division of Goldman Sachs and referred to in this research.
Goldman Sachs expects to receive or intends to seek compensation for investment banking services in the next 3 months: Sunny Optical Technology
Group Co Ltd (HK$8.50)
Distribution of ratings/investment banking relationships
Goldman Sachs Investment Research global coverage universe
Rating Distribution Investment Banking Relationships
Buy Hold Sell Buy Hold Sell
Global 31% 54% 15% 49% 41% 38%
As of July 1, 2013, Goldman Sachs Global Investment Research had investment ratings on 3,535 equity securities. Goldman Sachs assigns stocks as
Buys and Sells on various regional Investment Lists; stocks not so assigned are deemed Neutral. Such assignments equate to Buy, Hold and Sell for
the purposes of the above disclosure required by NASD/NYSE rules. See 'Ratings, Coverage groups and views and related definitions' below.
Regulatory disclosures
Disclosures required by United States laws and regulations
See company-specific regulatory disclosures above for any of the following disclosures required as to companies referred to in this report: manager
or co-manager in a pending transaction; 1% or other ownership; compensation for certain services; types of client relationships; managed/co-
managed public offerings in prior periods; directorships; for equity securities, market making and/or specialist role. Goldman Sachs usually makes a
market in fixed income securities of issuers discussed in this report and usually deals as a principal in these securities.
The following are additional required disclosures: Ownership and material conflicts of interest: Goldman Sachs policy prohibits its analysts,
professionals reporting to analysts and members of their households from owning securities of any company in the analyst's area of
coverage. Analyst compensation: Analysts are paid in part based on the profitability of Goldman Sachs, which includes investment banking

August 30, 2013 Sunny Optical Technology Group Co Ltd (2382.HK)
Goldman Sachs Global Investment Research 19
revenues. Analyst as officer or director: Goldman Sachs policy prohibits its analysts, persons reporting to analysts or members of their
households from serving as an officer, director, advisory board member or employee of any company in the analyst's area of coverage. Non-U.S. Analysts: Non-U.S. analysts may not be associated persons of Goldman, Sachs & Co. and therefore may not be subject to NASD Rule 2711/NYSE
Rules 472 restrictions on communications with subject company, public appearances and trading securities held by the analysts.
Distribution of ratings: See the distribution of ratings disclosure above. Price chart: See the price chart, with changes of ratings and price targets in
prior periods, above, or, if electronic format or if with respect to multiple companies which are the subject of this report, on the Goldman Sachs
website at http://www.gs.com/research/hedge.html.
Additional disclosures required under the laws and regulations of jurisdictions other than the United States
The following disclosures are those required by the jurisdiction indicated, except to the extent already made above pursuant to United States laws
and regulations. Australia: Goldman Sachs Australia Pty Ltd and its affiliates are not authorised deposit-taking institutions (as that term is defined in
the Banking Act 1959 (Cth)) in Australia and do not provide banking services, nor carry on a banking business, in Australia. This research, and any
access to it, is intended only for "wholesale clients" within the meaning of the Australian Corporations Act, unless otherwise agreed by Goldman
Sachs. Brazil: Disclosure information in relation to CVM Instruction 483 is available at http://www.gs.com/worldwide/brazil/area/gir/index.html.
Where applicable, the Brazil-registered analyst primarily responsible for the content of this research report, as defined in Article 16 of CVM Instruction
483, is the first author named at the beginning of this report, unless indicated otherwise at the end of the text. Canada: Goldman, Sachs & Co. has
approved of, and agreed to take responsibility for, this research in Canada if and to the extent it relates to equity securities of Canadian issuers.
Analysts may conduct site visits but are prohibited from accepting payment or reimbursement by the company of travel expenses for such
visits. Hong Kong: Further information on the securities of covered companies referred to in this research may be obtained on request from
Goldman Sachs (Asia) L.L.C. India: Further information on the subject company or companies referred to in this research may be obtained from
Goldman Sachs (India) Securities Private Limited; Japan: See below. Korea: Further information on the subject company or companies referred to
in this research may be obtained from Goldman Sachs (Asia) L.L.C., Seoul Branch. New Zealand: Goldman Sachs New Zealand Limited and its
affiliates are neither "registered banks" nor "deposit takers" (as defined in the Reserve Bank of New Zealand Act 1989) in New Zealand. This research,
and any access to it, is intended for "wholesale clients" (as defined in the Financial Advisers Act 2008) unless otherwise agreed by Goldman
Sachs. Russia: Research reports distributed in the Russian Federation are not advertising as defined in the Russian legislation, but are information
and analysis not having product promotion as their main purpose and do not provide appraisal within the meaning of the Russian legislation on
appraisal activity. Singapore: Further information on the covered companies referred to in this research may be obtained from Goldman Sachs
(Singapore) Pte. (Company Number: 198602165W). Taiwan: This material is for reference only and must not be reprinted without permission.
Investors should carefully consider their own investment risk. Investment results are the responsibility of the individual investor. United Kingdom: Persons who would be categorized as retail clients in the United Kingdom, as such term is defined in the rules of the Financial Conduct
Authority, should read this research in conjunction with prior Goldman Sachs research on the covered companies referred to herein and should refer
to the risk warnings that have been sent to them by Goldman Sachs International. A copy of these risks warnings, and a glossary of certain financial
terms used in this report, are available from Goldman Sachs International on request.
European Union: Disclosure information in relation to Article 4 (1) (d) and Article 6 (2) of the European Commission Directive 2003/126/EC is available
at http://www.gs.com/disclosures/europeanpolicy.html which states the European Policy for Managing Conflicts of Interest in Connection with
Investment Research.
Japan: Goldman Sachs Japan Co., Ltd. is a Financial Instrument Dealer registered with the Kanto Financial Bureau under registration number Kinsho
69, and a member of Japan Securities Dealers Association, Financial Futures Association of Japan and Type II Financial Instruments Firms
Association. Sales and purchase of equities are subject to commission pre-determined with clients plus consumption tax. See company-specific
disclosures as to any applicable disclosures required by Japanese stock exchanges, the Japanese Securities Dealers Association or the Japanese
Securities Finance Company.
Ratings, coverage groups and views and related definitions
Buy (B), Neutral (N), Sell (S) -Analysts recommend stocks as Buys or Sells for inclusion on various regional Investment Lists. Being assigned a Buy
or Sell on an Investment List is determined by a stock's return potential relative to its coverage group as described below. Any stock not assigned as
a Buy or a Sell on an Investment List is deemed Neutral. Each regional Investment Review Committee manages various regional Investment Lists to a
global guideline of 25%-35% of stocks as Buy and 10%-15% of stocks as Sell; however, the distribution of Buys and Sells in any particular coverage
group may vary as determined by the regional Investment Review Committee. Regional Conviction Buy and Sell lists represent investment
recommendations focused on either the size of the potential return or the likelihood of the realization of the return.
Return potential represents the price differential between the current share price and the price target expected during the time horizon associated
with the price target. Price targets are required for all covered stocks. The return potential, price target and associated time horizon are stated in each
report adding or reiterating an Investment List membership.
Coverage groups and views: A list of all stocks in each coverage group is available by primary analyst, stock and coverage group at
http://www.gs.com/research/hedge.html. The analyst assigns one of the following coverage views which represents the analyst's investment outlook
on the coverage group relative to the group's historical fundamentals and/or valuation. Attractive (A). The investment outlook over the following 12
months is favorable relative to the coverage group's historical fundamentals and/or valuation. Neutral (N). The investment outlook over the
following 12 months is neutral relative to the coverage group's historical fundamentals and/or valuation. Cautious (C). The investment outlook over
the following 12 months is unfavorable relative to the coverage group's historical fundamentals and/or valuation.
Not Rated (NR). The investment rating and target price have been removed pursuant to Goldman Sachs policy when Goldman Sachs is acting in an
advisory capacity in a merger or strategic transaction involving this company and in certain other circumstances. Rating Suspended (RS). Goldman
Sachs Research has suspended the investment rating and price target for this stock, because there is not a sufficient fundamental basis for
determining, or there are legal, regulatory or policy constraints around publishing, an investment rating or target. The previous investment rating and
price target, if any, are no longer in effect for this stock and should not be relied upon. Coverage Suspended (CS). Goldman Sachs has suspended
coverage of this company. Not Covered (NC). Goldman Sachs does not cover this company. Not Available or Not Applicable (NA). The
information is not available for display or is not applicable. Not Meaningful (NM). The information is not meaningful and is therefore excluded.
Global product; distributing entities
The Global Investment Research Division of Goldman Sachs produces and distributes research products for clients of Goldman Sachs on a global
basis. Analysts based in Goldman Sachs offices around the world produce equity research on industries and companies, and research on
macroeconomics, currencies, commodities and portfolio strategy. This research is disseminated in Australia by Goldman Sachs Australia Pty Ltd
(ABN 21 006 797 897); in Brazil by Goldman Sachs do Brasil Corretora de Títulos e Valores Mobiliários S.A.; in Canada by Goldman, Sachs & Co.
regarding Canadian equities and by Goldman, Sachs & Co. (all other research); in Hong Kong by Goldman Sachs (Asia) L.L.C.; in India by Goldman
Sachs (India) Securities Private Ltd.; in Japan by Goldman Sachs Japan Co., Ltd.; in the Republic of Korea by Goldman Sachs (Asia) L.L.C., Seoul

August 30, 2013 Sunny Optical Technology Group Co Ltd (2382.HK)
Goldman Sachs Global Investment Research 20
Branch; in New Zealand by Goldman Sachs New Zealand Limited; in Russia by OOO Goldman Sachs; in Singapore by Goldman Sachs (Singapore)
Pte. (Company Number: 198602165W); and in the United States of America by Goldman, Sachs & Co. Goldman Sachs International has approved this
research in connection with its distribution in the United Kingdom and European Union.
European Union: Goldman Sachs International authorised by the Prudential Regulation Authority and regulated by the Financial Conduct Authority
and the Prudential Regulation Authority, has approved this research in connection with its distribution in the European Union and United Kingdom;
Goldman Sachs AG and Goldman Sachs International Zweigniederlassung Frankfurt, regulated by the Bundesanstalt für
Finanzdienstleistungsaufsicht, may also distribute research in Germany.
General disclosures
This research is for our clients only. Other than disclosures relating to Goldman Sachs, this research is based on current public information that we
consider reliable, but we do not represent it is accurate or complete, and it should not be relied on as such. We seek to update our research as
appropriate, but various regulations may prevent us from doing so. Other than certain industry reports published on a periodic basis, the large
majority of reports are published at irregular intervals as appropriate in the analyst's judgment.
Goldman Sachs conducts a global full-service, integrated investment banking, investment management, and brokerage business. We have
investment banking and other business relationships with a substantial percentage of the companies covered by our Global Investment Research
Division. Goldman, Sachs & Co., the United States broker dealer, is a member of SIPC (http://www.sipc.org).
Our salespeople, traders, and other professionals may provide oral or written market commentary or trading strategies to our clients and our
proprietary trading desks that reflect opinions that are contrary to the opinions expressed in this research. Our asset management area, our
proprietary trading desks and investing businesses may make investment decisions that are inconsistent with the recommendations or views
expressed in this research.
The analysts named in this report may have from time to time discussed with our clients, including Goldman Sachs salespersons and traders, or may
discuss in this report, trading strategies that reference catalysts or events that may have a near-term impact on the market price of the equity
securities discussed in this report, which impact may be directionally counter to the analysts' published price target expectations for such stocks. Any
such trading strategies are distinct from and do not affect the analysts' fundamental equity rating for such stocks, which rating reflects a stock's
return potential relative to its coverage group as described herein.
We and our affiliates, officers, directors, and employees, excluding equity and credit analysts, will from time to time have long or short positions in,
act as principal in, and buy or sell, the securities or derivatives, if any, referred to in this research.
This research is not an offer to sell or the solicitation of an offer to buy any security in any jurisdiction where such an offer or solicitation would be
illegal. It does not constitute a personal recommendation or take into account the particular investment objectives, financial situations, or needs of
individual clients. Clients should consider whether any advice or recommendation in this research is suitable for their particular circumstances and, if
appropriate, seek professional advice, including tax advice. The price and value of investments referred to in this research and the income from them
may fluctuate. Past performance is not a guide to future performance, future returns are not guaranteed, and a loss of original capital may occur.
Fluctuations in exchange rates could have adverse effects on the value or price of, or income derived from, certain investments.
Certain transactions, including those involving futures, options, and other derivatives, give rise to substantial risk and are not suitable for all investors.
Investors should review current options disclosure documents which are available from Goldman Sachs sales representatives or at
http://www.theocc.com/about/publications/character-risks.jsp. Transaction costs may be significant in option strategies calling for multiple purchase
and sales of options such as spreads. Supporting documentation will be supplied upon request.
In producing research reports, members of the Global Investment Research Division of Goldman Sachs Australia may attend site visits and other
meetings hosted by the issuers the subject of its research reports. In some instances the costs of such site visits or meetings may be met in part or in
whole by the issuers concerned if Goldman Sachs Australia considers it is appropriate and reasonable in the specific circumstances relating to the
site visit or meeting.
All research reports are disseminated and available to all clients simultaneously through electronic publication to our internal client websites. Not all
research content is redistributed to our clients or available to third-party aggregators, nor is Goldman Sachs responsible for the redistribution of our
research by third party aggregators. For all research available on a particular stock, please contact your sales representative or go to
http://360.gs.com.
Disclosure information is also available at http://www.gs.com/research/hedge.html or from Research Compliance, 200 West Street, New York, NY
10282.
© 2013 Goldman Sachs.
No part of this material may be (i) copied, photocopied or duplicated in any form by any means or (ii) redistributed without the prior written consent of The Goldman Sachs Group, Inc.