Summitville, Colorado - U.S. Geological Survey ... · Summitville, Colorado. ... John E. Gray Paul...
43
U.S. GEOLOGICAL SURVEY BULLETIN 2220 Environmental Considerations of Active and Abandoned Mine Lands Lessons from Summitville, Colorado
Transcript of Summitville, Colorado - U.S. Geological Survey ... · Summitville, Colorado. ... John E. Gray Paul...

U . S . G E O L O G I C A L S U RV E Y BU L L E T I N 2 2 2 0
EnvironmentalConsiderations ofActive andAbandonedMine Lands
Lessons fromSummitville, Colorado
README
THERE ARE TWO METHODS OF BROWSING THROUGH THIS DOCUMENT. BOOKMARKS: Click the Bookmarks and Page button from the menu bar, or choose Bookmarks and Page from the view menu, to display bookmarks for the document . Click the page icon to the left of a bookmark name to move to the page view specified by that bookmark. Click the triangle to the left of a bookmark name to show or hide any subordinate bookmarks. CONTENTS PAGE (Hypertext links): Go to the Contents page (page 4) to use the hypertext links. Click on a subject to move to the page view of the specified link.
Environmental Considerations of Active and Abandoned Mine Lands
Lessons from Summitville, Colorado
U.S. GEOLOGICAL SURVEY BULLETIN 2220
Edited by
Trude V.V. King
With contributions from
Cathy M. AgerWilliam W. AtkinsonLaurie S. BalistrieriRobert J. BisdorfDana BoveRoger N. ClarkMark F. CoolbaughJames A. Erdman
Larry P. GoughJohn E. GrayPaul von GuerardTrude V.V. KingFredrick E. LichteWilliam R. MillerRoderick F. OrtizGeoffrey S. Plumlee
W. Ian RidleyKathleen S. SmithGregg A. SwayzeRonald R. TidballKatherine Walton-DayThomas M. Yanosky
M A R C H 3, 1849
U.S
.D
EPA
RTMENT OF THEINTE
RIO
R
U.S. DEPARTMENT OF THE INTERIORBRUCE BABBITT, Secretary
U.S. GEOLOGICAL SURVEYGordon P. Eaton, Director
Any use of trade, product, or firm names in this publication is for descriptive purposesonly and does not imply endorsement by the U. S. Government.
UNITED STATES GOVERNMENT PRINTING OFFICE: 1995
For sale byU.S. Geological SurveyInformation ServicesBox 25286, Federal CenterDenver, CO 80225
Library of Congress Cataloging-in-Publication Data
Environmental considerations of active and abandoned mine lands : lessons from Summitville,Colorado / compiled by Trude V.V. King with contributions from Cathy M. Ager . . . [et al.].
p. cm.—(U.S. Geological Survey bulletin : 2220)Includes bibliographical references (p. ).1. Gold mines and mining—Environmental aspects—Colorado—Summitville. 2. Acid mine
drainage—Environmental aspects—Colorado—Summitville. 3. Heap leaching—Environmentalaspects—Colorado—Summitville. 4. Reclamation of land—Colorado—Summitville.I. King, Trude V.V. II. Series.QE75.B9 no. 2220[TD195.G64]363.73′84—dc20 94–23895
CIP

CONTENTS
Introduction 2
Acid Mine Drainage 4
Lessons from Summitville 6
Active Volcanoes Once Covered Southwestern Colorado 6
Gold in an Ancient Volcano 8
Mining of Gold and Formation of Acid Mine Drainageat Summitville 10
Geophysics Plays a Role in UnderstandingAcid Mine Drainage 14
Summitville from the Air 16
Water Transport—A Powerful Way to Move Metals 20
Revealing Groundwater Quality by ExaminingTree Rings 24
Pathways of Sediment and Water to the San Luis Valley 28
Imaging Spectroscopy—A Method for MappingCrop Distribution 30
Uptake of Elements by Alfalfa and Barley—AnotherWay to Study Metal Dispersion 32
Biogeochemical Examination of the AlamosaNational Wildlife Refuge 34
Summary 35
Further Reading 36
Photo Credits 37

Frontispiece

2
EnvironmentalConsiderations of
Active andAbandonedMine Lands
Lessons fromSummitville,
Colorado
Superfund
The Comprehensive Environmental Response, Com-pensation, and Liability Act (CERCLA), commonlycalled Superfund, was passed into law in December1980. It established a program to identify sites fromwhich releases of hazardous substances into the envi-ronment have or might occur, to provide for cleanupby responsible parties or the government, to evaluatenatural resource damage, and to create proceduresfor cost recovery related to cleanup activities.
etals and minerals are essential components of a highly industrial society.In the United States part of this demand has been met through domestic
mining of metals and minerals in almost every State of the Nation. Historically,when mines were no longer economic, individual mines or whole mining districtswere abandoned with little or no consideration for future environmental impacts.Current awareness has made the public more concerned about the effects of min-ing. The deleterious effect of historic mining activity is a national problem. Thereare between 100,000 and 500,000 abandoned or inactive mine sites in the UnitedStates; a total of 26 States, predominantly in the West, have more than 50 U.S.Environmental Protection Agency (EPA) Superfund restoration sites related tonon-fuel mining activity. The Summitville mine site in Colorado is an example ofwhat can go wrong.
From 1985 through 1992, the Summitville open-pit mine produced gold fromlow-grade ore using cyanide heap-leach techniques, a method to extract goldwhereby the ore pile is sprayed with water containing cyanide, which dissolves theminute gold grains. Environmental problems at Summitville include significantincreases in acidic and metal-rich drainage from the site, leakage of cyanide-bear-ing solutions from the heap-leach pad into an underdrain system (designed to catchsolutions containing gold and cyanide that leaked through the liner under the heap),and several surface leaks of cyanide-bearing solutions into the Wightman Fork ofthe Alamosa River. The mine’s operator had ceased active mining and had begunenvironmental remediation, including treatment of the heap-leach pile and instal-lation of a water-treatment facility, when it declared bankruptcy in December 1992and abandoned the mine site. The EPA immediately took over the Summitville siteunder EPA Superfund Emergency Response authority. Summitville was added tothe EPA National Priorities List in late May 1994. The total cost of the cleanup hasbeen estimated at $100 to $120 million. EPA’s remediation efforts include treat-ment of cyanide solutions remaining in the heap-leach pad, detoxification of theheap, plugging of the Reynolds adit (a major source of acid- and metal-rich drain-age from the site), backfilling of the open pit with acid- and metal-generating wastedump material, and capping of the backfilled pit to prevent water inflow.
Summitville has focused nationwide attention on the environmental effects ofmodern mineral-resource development. Soon after the mine was abandoned,Federal, State, and local agencies, along with Alamosa River water users and
M

3
San Luis Valley
Summitvillemine
Approximate easternboundary of the
San Juan Mountains
Bitter Creek
Platoro
Monte Vista NationalWildlife Refuge
37˚30'
37˚00'
107˚00' 106˚30' 106˚00'
.Iron Creek Alum Creek
Wightman Fork
JasperALAMOSA RIVERTerrace
Reservoir
Monte VistaRIO GRANDE
Alamosa
Alamosa NationalWildlife Refuge
Farmlands irrigated withAlamosa River water
Capulin
La
Jara Creek
COLORADO
0 10 20 KILOMETERS
Summitville mine area in the San Luis Valley of Colorado.
3
private companies, began extensivestudies at the mine site and surround-ing areas. These studies includedanalysis of water, soil, livestock andvegetation. The role of the U.S. Geo-logical Survey (USGS) was to providegeologic and hydrologic informationabout the mine and surrounding areaand to describe and evaluate the envi-ronmental condition of the Sum-mitville mine and the downstreameffects of the mine on the San LuisValley. The environmental conditionof the Summitville area is both a resultof the geologic evolution of this areathat culminated in the formation ofprecious-metal mineral deposits and aresult of the mining activity. Under-standing the geologic and hydrologichistory of this area is a critical part ofunderstanding the environmentalpuzzle at Summitville.

4
ACID MINE DRAINAGE
pH
All natural waters contain free hydronium (H
3
O
+
)and hydroxyl (OH
–
) ions. Acidity is measured by theconcentration of hydrogen ions, called pH, which isthe negative logarithm of the hydrogen ion activity.Neutral solutions have pH values of 7. If the pH isgreater than 7 the water is basic, and if the pH is lessthan 7 the water is acid. Acids have a sour taste. Forexample, vinegar (a strong acid) has a pH of about4.6, whereas the pH of rainwater is about 6 (a weakacid). The pH of acid mine drainage may be less than2 but commonly is between 2 and 5.
Elements in Solution
Sulfuric acid in liquid form breaks down into hydro-nium ions (H
3
O
+
) and sulfate ions (SO
2–4
) and cancarry many metals in solution, as both simple andcomplex ions. For example, copper can be transport-ed in solution as simple copper ions (Cu
2+
) and depos-ited as copper sulfate (CuSO
4
); iron can betransported as ferrous or ferric ions (Fe
2+
or Fe
3+
)and deposited as ferric hydroxide (Fe(OH)
3
). The va-riety of simple and complex ions in solution dependsin part on the pH of the solution, the amount of oxy-gen dissolved in the solution, and the concentrationsof the cations (positively charged ions) and anions(negatively charged ions) in the solution.
ining activity occurs in areasthat have high concentrations of
economically important materials,such as gold, silver, copper, cobalt,iron, lead, and zinc. These areas mayalso contain high concentrations ofnoneconomic elements such as arsenic,selenium, mercury, and sulfur, whosepresence is closely tied to the forma-tion of the heavy metals. Many ofthese economic and noneconomic ele-ments can be hazardous if released intothe environment. Even without min-ing, mineralized areas can naturallyadversely affect the environment.
A common process that results indispersion of elements from a mineral-ized site is acid drainage. When aciddrainage results from mining activity,it is more specifically called acid minedrainage. As the name implies, acidmine drainage is the formation andmovement of highly acidic water richin heavy metals. This acidic waterforms principally through chemicalreaction of surface water (rainwater,snowmelt, pond water) and shallowsubsurface water with rocks that con-tain sulfur-bearing minerals (mainly
pyrite), resulting in sulfuric acid.Heavy metals can be leached fromrocks that come in contact with theacid, a process that may be substan-tially enhanced by bacterial action. Theresulting fluids may be highly toxicand when mixed with groundwater,surface water, and soil may have harm-ful effects on humans, animals andplants.
Mining accentuates and acceler-ates natural processes. The develop-ment of underground workings, openpits, ore piles, mill tailings, and spoilheaps and the extractive processing ofores enhance the likelihood of releas-ing chemical elements to the surround-ing area in large amounts and atincreased rates relative to unminedareas. Studies describing both theextent and effect of acid drainage bothin unmined mineralized areas and inareas containing inactive and aban-doned mines are required if the envi-ronmental impact of heavy metals is tobe understood. Studies in unminedmineralized areas describe the natural,baseline chemical characteristics andvariations of the mineralized areas. By
M

6
LESSONS FROMSUMMITVILLE
ACTIVE VOLCANOESONCE COVERED
SOUTHWESTERNCOLORADO
Formation of Volcanoes
Heating in the Earth's interior results in melting ofpreviously formed rocks to produce magma. Magmais less heavy than the surrounding rocks and movesupward, pushing aside surrounding colder rocks ormoving through regions of pre-existing weakness. Ifmagma reaches the surface, it spills out and flowsacross the land as lava flows or congeals near theeruption site as a dome; if magma below the surfaceis under enormous pressure, it can be violently blowninto the atmosphere as volcanic ash. Continued erup-tion in one area eventually builds a volcano fed fromunderground stores of magma. Sudden eruption orsideways movement of underground magma canproduce a subsurface void causing the volcano sum-mit to collapse around a roughly circular depressioncalled a caldera. Some calderas are tens of kilometersin diameter. During the building of such a volcano,the magma can cool and solidify before reaching thesurface to form dikes (near-vertical, narrow sheets),sills (near-horizontal, narrow sheets), or irregularshaped masses beneath the volcano. As the magmacools it discharges fluids (primarily water containingvarious dissolved metals and salts) and gases andalso heats local groundwater, which begins to movethrough the volcano. These fluids and gases can bevery corrosive and attack the surrounding rocks,producing areas of hydrothermal alteration. Coolingof the fluids and gases can precipitate new minerals,including gold, silver, and sulfides, in sufficientamounts to form a mineral deposit.
he Summitville gold mine is in the San Juan Mountains of Colorado in an areathat was once covered with steep-sided volcanoes. These volcanoes formed
about 30 million years ago but have been partly destroyed by natural erosion, leav-ing behind remnants of volcanic debris. Summitville is part of a volcano whosesummit collapsed, forming a caldera. After the caldera formed, lava eruptions con-tinued at the surface and intrusions formed beneath the surface. At the same time,rocks inside the volcano were exposed to hot, corrosive water produced by the vol-canic system, a process called hydrothermal alteration.
The region around the Summitville mine is covered with creeks of smalland intermediate size that drain into the Alamosa River and form the upper Ala-mosa River basin. The downward-cutting action of these creeks has exposed thehydrothermally altered rocks and allowed geologists to examine these rocks indetail. Two main episodes of hydrothermal alteration occurred in the upper Ala-mosa River basin. The older period of alteration affected about 11 square kilome-ters of rock in the Iron, Alum, and Bitter Creek basins and a roughly equivalentarea at Jasper. A younger period of alteration, corresponding to renewed hydro-thermal activity almost 8 million years later, affected about 3 square kilometerssurrounding the Summitville mine area and led to the formation of precious-metal mineral deposits.
The Summitville mine, Iron, Alum, and Bitter Creek basins, and Jasper areaare all located on a zone of weakness in the Earth’s crust. During the past 65 mil-lion years, this zone was the focus of many cycles of magma intrusion, hydrother-mal alteration, and mineral formation. The magma intrusions in the Iron, Alum,and Bitter Creek basins and in the Jasper area have been exposed by erosion, andgeologists have shown that the origins of the intrusions and the rock alteration areclosely connected. At Summitville, however, the intrusive body is not exposed atthe surface because it is covered by almost 600 meters of younger lava. By usingthe geologic situation of the Iron, Alum, and Bitter Creek basins and the Jasperarea as an analogy, geologists assume that the buried intrusion at Summitville isalso closely tied to the rock alteration and mineral deposits observed at the surface.
One of the strong similarities between the Summitville mining district and theIron, Alum, and Bitter Creek basins is the presence of altered rocks that have beenextremely corroded by sulfuric acid during hydrothermal alteration. This type ofrock disintegration is known as acid-sulfate alteration. The hot fluids in the Iron,Alum, and Bitter Creek basins did not carry silver or gold in solution and thus didnot produce an economic mineral deposit. In contrast, the fluids at Summitvillecarried gold, silver, and copper. When these elements were deposited from the flu-ids, a precious-metal and base-metal mineral deposit formed. The contrast betweenthe Iron, Alum, and Bitter Creek basins and Jasper area and the Summitville min-ing area is very important. The former areas, as shown in the photograph, areundisturbed by mining or extensive exploration and can be used to characterize andcompare background sites adjacent to the Summitville mining area.
T
5
combining these baseline studies withinformation from areas containinginactive and abandoned mines, it ispossible to provide:
An assessment of the intensity andextent of environmental impact due toacid mine drainage
An understanding of natural pro-cesses to detect and predict where andwhen acid mine drainage might occur
The production and consequencesof acid drainage involve the movementof various chemical elements throughthe environment as a result of physical,chemical, and biological processes.Collectively, these processes form thebiogeochemical cycle.
Geology (the physical, structural,and historical relations between rocks),geochemistry (the chemistry of rocksand their constituents), geophysics (thephysics of rocks and their constituents),biochemistry (the chemistry of biologi-
cal substances), and hydrology (theproperties, distribution, and effects ofwater at the Earth’s surface and in thesubsurface) are the major scientific dis-ciplines used to investigate thebiogeochemical cycle and, conse-quently, are used in a multidisciplinaryfashion to study acid mine drainage.
USGS studies at the Summitvillemine in Colorado and adjacent parts ofthe San Luis Valley used this inte-grated approach. Many of the environ-mental problems associated withSummitville are the result of acidmine drainage, and in this documentwe describe studies that allow aciddrainage to be understood in moredetail. USGS activities at Summitvillewere undertaken in part to provideother Federal and State agencies withdata and interpretations and to developprototypes for future studies involvinginactive and abandoned mines.
The Biogeochemical Cycle
Three principal ingredients make up the bio-geochemical cycle. (1) Source of chemical elements(where do they come from?). The source determineshow elements are physically and chemically distrib-uted and to what extent they are available withinthe cycle. (2) Transport mechanisms (how do ele-ments move through the environment?). Commonly,these mechanisms include water, wind, gravity, andliving organisms and are heavily influenced byclimate. (3) Sites (fate) of deposition (where and whydoes transport stop?). For example, the elementsmay be deposited as a part of the sediment in a res-ervoir or they may be taken up by a plant and per-haps become part of the food chain. Not alldeposition sites are permanent, and chemicalelements can be remobilized if physical or chemicalconditions change.

7
Background Sites
An assessment of the environmental impacts of min-ing at Summitville (or any mining facility) should berelated to areas that are undisturbed. Scientists ask,“How does the environment of a mined area com-pare to what we might reasonably expect in the areaif there had been no human interference?” Ideally,information about an area prior to human interfer-ence would serve this purpose; however, this type ofinformation is rarely available. In most cases, com-parison areas are chosen that are geologically simi-lar but have not experienced human interference.The effect of human interference is commonly eval-uated by simple statistical techniques using the com-parison, or background, site to provide a baseline.

8
GOLD IN ANANCIENT VOLCANO
old mining at Summitville andthe minerals that produce acid
mine drainage are closely related toeach other. How did such a close rela-tion develop? One way to answer thisquestion is to study modern volcanoesthat appear to be similar to ancientvolcanoes in the Summitville region.For example, the unaltered rocks inthe Summitville region are very simi-lar to rocks at Mount St. Helens inWashington. The violent eruption ofMount St. Helens in 1980 was accom-panied by the growth of a volcanicdome within the summit crater. Thisdome represented the surface eruptionof very viscous (thick and sticky)magma that had slowly risen throughthe bowels of the volcano. During andafter the growth of the bulbous domeat Mount St. Helens, large volumes ofacidic gas and water vapor pouredfrom the volcano summit as a result ofmagma cooling within the volcano.
G
Magm
Hydrothermalfluids richin metals
Fault
Gold deposit
Cross section of a volcano. Magma is belowseparating from the liquid magma.
Based on drilling information, it isknown that a similar dome lies beneaththe Summitville mine site, and, byanalogy to Mount St. Helens, we candescribe the geologic evolution at Sum-mitville in the following way. Moltenmagma beneath Summitville containedmany dissolved gases, mainly sulfurdioxide (SO2) and hydrogen sulfide(H2S), water, and metals. As themagma cooled, the gases and waterseparated, each taking many metalswith them. The gases, being very light,ascended quickly along faults and frac-tures that cut through the volcano. Dur-ing their rise, the magmatic gases andwater vapor combined to form sulfuricacid (H2SO4), which is highly corro-sive. The sulfuric acid dissolved miner-als in the surrounding rocks, makingthe rock porous, a process called acidleaching. The metal-bearing waters,being heavier than the gases, movedupward at a slower pace but still along
a
Faults
Volcanicdome Lava
flows
Magma gasesH2S + SO2
the volcanic dome, and magma gases are
99
the same complex of faults and frac-tures. Normally rocks are able to with-stand severe attack by acid solutionsbecause they quickly neutralize thewaters, a process called acid buffering.The quantity of acidic gases andwaters that attacked the rocks at Sum-mitville must have been great becausethe intensity of acid alteration isextreme. These altered rocks no longerhave a natural acid-buffering capacityand can no longer neutralize the fluids.The ascending gases caused the rockporosity (the volume of open space ina rock relative to its total volume) andpermeability (the ability of a rock totransmit fluid) to increase (by acidleaching) and hence eased the upwardmovement of the later fluids.
The most important metals in thefluids were gold, silver, copper, iron,lead, and arsenic, but the fluids alsocontained abundant sulfur and salt.The volcano probably had a well-developed groundwater table, andmixing of rising hot, magmatic fluids
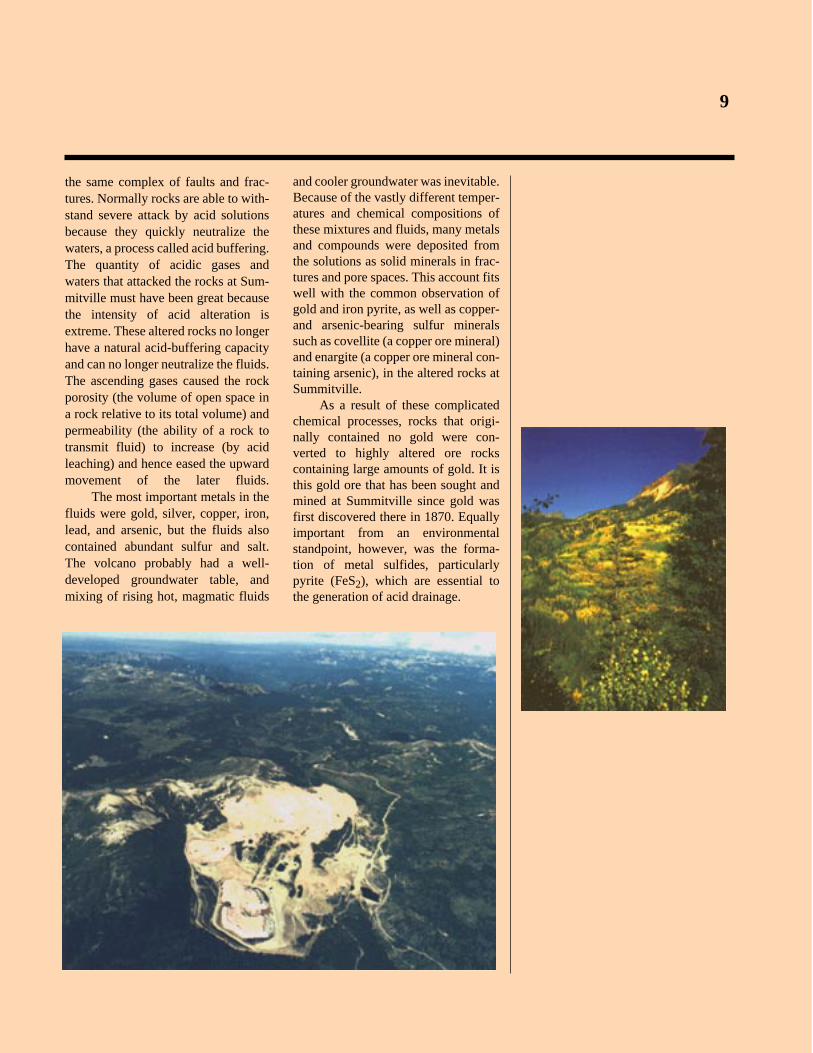
and cooler groundwater was inevitable.Because of the vastly different temper-atures and chemical compositions ofthese mixtures and fluids, many metalsand compounds were deposited fromthe solutions as solid minerals in frac-tures and pore spaces. This account fitswell with the common observation ofgold and iron pyrite, as well as copper-and arsenic-bearing sulfur mineralssuch as covellite (a copper ore mineral)and enargite (a copper ore mineral con-taining arsenic), in the altered rocks atSummitville.
As a result of these complicatedchemical processes, rocks that origi-nally contained no gold were con-verted to highly altered ore rockscontaining large amounts of gold. It isthis gold ore that has been sought andmined at Summitville since gold wasfirst discovered there in 1870. Equallyimportant from an environmentalstandpoint, however, was the forma-tion of metal sulfides, particularlypyrite (FeS2), which are essential tothe generation of acid drainage.

10
efore 1960, miners at Summitville dug many underground tunnels to removethe high-grade gold ore concentrated along fractures and faults; however,
much of the gold was scattered in small amounts and in minute grains over largeareas of altered rock. Modern gold extraction technology made it possible to minerocks carrying this finely distributed gold. Within the last 10 years, large volumesof ground were excavated to remove gold ore, forming a large open pit as shownin the photograph to the left. Gold ore was placed in one pile, and rock that did notcontain gold was put into waste piles. To remove the gold, the ore pile was sprayedwith a mixture of water and cyanide, which dissolved the minute gold grains. Fur-ther chemical treatment of the cyanide solutions caused the gold to separate. Thegold was then collected, formed into bars, and sold. In 1992, mining ended at Sum-mitville because most of the gold ore had been removed and the ore remaining wasunprofitable to mine. The large open pit was abandoned, and rocks in the ore pileand waste piles remained in place.
Many of the rocks remaining in the rock piles, open pit, and underground tun-nels contain sulfides, especially pyrite, that undergo chemical reactions when theycome into contact with air and rainwater at or below the ground surface. This pro-cess is called chemical weathering. During chemical weathering, air and rainwaterreact with sulfide minerals such as pyrite, enargite, chalcopyrite, covellite, andchalcocite and generate large amounts of sulfuric acid. The altered rocks, whichformed by an earlier episode of corrosion by sulfuric acid, as described previously,cannot neutralize the acid formed by chemical weathering. The acid dissolvesmany heavy metals present in ore and non-ore minerals to produce a fluid-acidmine drainage. The Summitville mine drainage waters are among the most acidicand metal bearing in Colorado; the drainage waters have a pH generally below 3and contain high to extreme concentrations of iron, aluminum, copper, zinc,arsenic, lead, and other metals.
MINING OF GOLD ANDFORMATION OF
ACID MINE DRAINAGE ATSUMMITVILLE
B

11
10,000
HE
AV
Y M
ET
ALS
, IN
PA
RT
S P
ER
MIL
LIO
N
9
1,000
100
10
1
0.1
0.0187654321
pH
Summitville minedrainage compositions
Other Colorado minedrainage compositions
Production of sulfuric acid by the reaction of pyrite with air.
pH and heavy-metal composition (zinc, copper, cadmium, lead, cobalt, and nickel) atthe Summitville mine site and other mine areas in Colorado.
11
Mine entrance
Reaction A
Tunnel
Reaction B
Pyrite (FeS2)
Oxygen (O2)
Water (H2O)
Pyrite + Water + (Fe3+ or oxygen)
Reaction A
Fe2+ + Sulfate + Acid
Reaction B
Fe3+ + Water Iron hydroxides + Acid

12
12
As a result of mining activity, the content of copper and other metals in watersdraining the Summitville pit via underground workings and the Reynolds adit sig-nificantly increased from 1984 through 1993. During dry periods, acid mine watersevaporate from the underground mine workings, mine waste dumps, and fracturedrock around the open pit. As the waters evaporate, they leave behind abundantmetal-bearing salts such as chalcanthite, a copper sulfate mineral. These salts storeacid and metals in the solid form, and they are highly soluble and redissolve whenthe next pulse of rainwater or snowmelt flows through the mine.
The resulting flush of these salts can lead to sharp, short-term increases inacid and metals draining the site, such as the seasonal spike in dissolved copperconcentration in Reynolds adit outflow that coincides with spring snowmelt (asshown in the photograph on this page). Deep red puddles that are highly acidic andmetal rich form soon after summer thundershowers (as shown in the photographson the facing page). These puddles also reflect the dissolution of soluble metalsalts in the pit rocks. Extensive remedial efforts will be required to isolate bothunweathered sulfides and soluble metal salts in the open-pit area and in minewaste piles from weathering and dissolution.
Amount of copper in the Reynolds Tunnel outflow over time. Modified from GolderAssociates (1992).
Spring flush
1994
CO
PP
ER
, IN
MIL
LIG
RA
MS
PE
R L
ITE
R
400
300
200
100
019921990198819861984
END OF YEAR
13

14
GEOPHYSICS PLAYSA ROLE IN
UNDERSTANDINGACID MINE DRAINAGE
ot all water in the Summitvillearea moves along the ground sur-
face. Some water flows beneath thesurface and may re-emerge in springs,creeks, and rivers. How can we see thegeologic structures and movement offluids that are hidden from our directview? One important aid is the geo-physical technique called electricalresistivity. Rocks do not conduct elec-tricity very well; they resist the flow ofelectricity. The most resistive rocksare dense (low-porosity) materialssuch as granite, limestone, or somecrystalline volcanic rocks. Moderatelyresistive material includes porous sandand gravel that is saturated with pota-ble water. Low resistivity commonlyindicates highly altered or fracturedrocks, rocks filled with nonpotablewater, or clay-rich rocks.
N
How can we make these resistiv-ity measurements and interpret theresults? The basic technique is to“shock” the underground rocks byintroducing an electric current ofknown voltage at a specific point. Thecurrent flows through the rocks, butnot very efficiently, and sensitive elec-trodes placed at several other locations
measure the change in voltage. Thisvoltage decrease is a reflection of theresistivity of the rocks and fluid in thesubsurface and can be interpreted interms of rock mineralogy, water con-tent, and water quality. In a homoge-neous rock the current flows equally inall directions; however, if the rock isnot homogeneous the flow of the cur-rent is modified, and differences inresistivity can be mapped. Complica-tions can arise, however, if manmade(cultural) materials are present that canaffect the measurement of undergroundresistivity. For example, at Sum-mitville, power lines, metal structuresand debris, cables, and pipe lines are alldetrimental to accurate measurements.The Schlumberger sounding methodhas been developed to lessen both thesetypes of cultural problems and lateralvariations in resistivity. In this method,computer models are developed using aseries of horizontal rock layers ofknown resistivity and are compared tothe measured resistivities in order todetermine the closest fit to the data.This method was used to map the sub-surface in the Summitville mine area.

15
Geoelectrical cross section through the heap-leach pile at the Summitville mine. Triangles represent the surface locations of thesoundings.
15
18 12
7
1517
14
NORTH
ELE
VA
TIO
N, I
N M
ET
ER
S
3600
3500
3400
3300
3200
11
SOUTHHeap
1,00
0
700
300
200
150
100
70 30 20
0 100 200 300 METERS
OH
M-M
ET
ER
S
A number of individual soundings can be combined to create a resistivitycross section. Cross sections, which can be thought of as vertical slices throughthe ground similar to road cuts, are more easily interpreted than individual sound-ings and illustrate lateral as well as vertical variations of resistivity. For illustra-tive purposes in the figure showing a cross section through the heap-leach pile(sounding 11), warm colors (orange-red) represent high resistivities, and coolcolors (blue-green) represent low resistivities. The cross section demonstratesthat the heap-leach pile (indicated by yellow and green) is located on the volcanicandesite (an extrusive rock that formed when the magma from the volcanoflowed on the surface), which in turn lies upon some of the oldest rocks in thearea (commonly dense and nonporous rocks known as basement rocks) repre-sented by the higher resistivities (pink and red colors). At soundings 15 and 17,high resistivities indicate that the basement rocks are only 40 meters below thesurface and extend under the heap-leach pile to near sounding 14.
Downward movement of mine drainage through the subsurface is probablyhindered wherever the fluids encounter basement rocks; the mine drainage thenflows along the basement surface downhill to the Wightman Fork. The basementrocks probably dip to the north, mimicking the topographic surface, and theymay represent an erosional surface that is buried beneath the younger volcanicrocks. To the north (under sounding 12), in the suggested direction of fluid flow,low-resistivity rocks are 20–30 meters below the surface and probably representclay-rich or water-saturated sediments.
When evaluating the movement of acid mine drainage in the Summitvillemine area, we must understand the flow of fluids through both the surface andsubsurface because both types of flow influence the amount, direction, and qual-ity of the discharge.
16
SUMMITVILLEFROM THE AIR
Remote Sensing
Most naturally occurring and manmade materials ab-sorb sunlight at specific wavelengths. For example, itis the absorption and scattering of the sunlight byplants that produces the green color observed by thehuman eye. Just as every human has a characteristicthumb print, each mineral and manufactured materialhas a unique spectral signature related to its chemicalcomposition, grain size, degree of crystallinity, andtemperature of formation. The spectral signature is ameasure of how reflected sunlight interacts with a sur-face. Spectral information can be gathered from labo-ratory measurements, or it can be remotely acquiredby aircraft or satellite systems, therefore providing apowerful mapping tool.
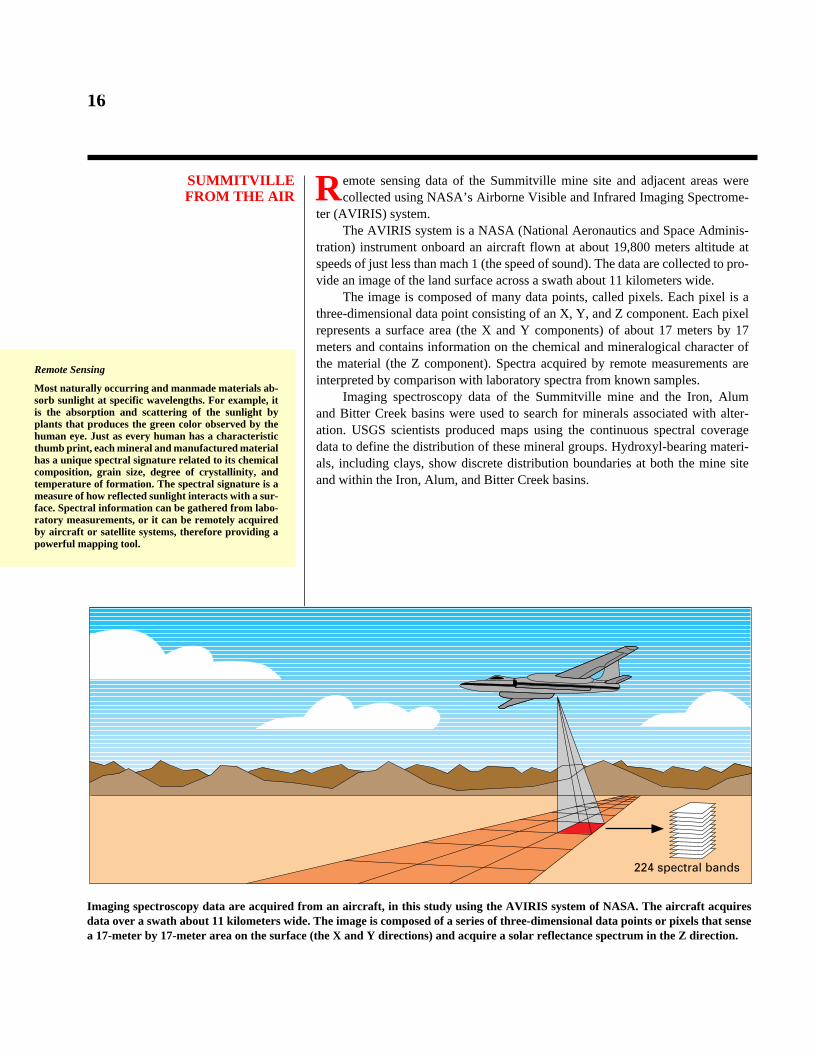
Imaging spectroscopy data are acquired frdata over a swath about 11 kilometers widea 17-meter by 17-meter area on the surface
emote sensing data of the Summitville mine site and adjacent areas werecollected using NASA’s Airborne Visible and Infrared Imaging Spectrome-
ter (AVIRIS) system. The AVIRIS system is a NASA (National Aeronautics and Space Adminis-
tration) instrument onboard an aircraft flown at about 19,800 meters altitude atspeeds of just less than mach 1 (the speed of sound). The data are collected to pro-vide an image of the land surface across a swath about 11 kilometers wide.
The image is composed of many data points, called pixels. Each pixel is athree-dimensional data point consisting of an X, Y, and Z component. Each pixelrepresents a surface area (the X and Y components) of about 17 meters by 17meters and contains information on the chemical and mineralogical character ofthe material (the Z component). Spectra acquired by remote measurements areinterpreted by comparison with laboratory spectra from known samples.
Imaging spectroscopy data of the Summitville mine and the Iron, Alumand Bitter Creek basins were used to search for minerals associated with alter-ation. USGS scientists produced maps using the continuous spectral coveragedata to define the distribution of these mineral groups. Hydroxyl-bearing materi-als, including clays, show discrete distribution boundaries at both the mine siteand within the Iron, Alum, and Bitter Creek basins.
R
224 spectral bands
om an aircraft, in this study using the AVIRIS system of NASA. The aircraft acquires. The image is composed of a series of three-dimensional data points or pixels that sense (the X and Y directions) and acquire a solar reflectance spectrum in the Z direction.

17
Halloysite or kaolinite-smectite mixture
Potassium-rich alunite
Sodium-rich alunite
Poorly crystalline kaolinite
Highly crystalline kaolinite
Sodium-rich montmorillonite
Not mapped
AVIRIS image of the Summitville mine and adjacent area showing the distribution ofhydroxyl-bearing minerals. Image made September 3, 1993.

18
18
Perhaps the most interesting observation from the spectral data is that theSummitville mine apparently does not contribute hydroxyl-bearing minerals viathe Wightman Fork to the Alamosa River, in contrast to the mineralized areas inIron, Alum, and Bitter Creek basins, which do. This observation is based on thespectral characteristics of the exposed fluvial sediments along Alum Creek andBitter Creek and the lack of hydroxyl-bearing fluvial sediment along the Wight-man Fork. The unmined mineralized areas are believed to contribute hydroxyl-bearing materials to the Alamosa River because of the porous character of thewell-exposed rock, which allows altered materials to be eroded easily anddeposited along the streambanks as sediment. If hydroxyl-bearing materials, andassociated contaminants, are being supplied to the Wightman Fork by the Sum-mitville mine, the material must be carried as a very fine grained aqueous sus-pension in the water, which cannot settle on the creek banks.
Images show that both the Summitville mine and the Iron, Alum, and BitterCreek basins are sources of iron-bearing sediments to the Alamosa River. Thesesediments give a reddish-brown color to streambanks, a characteristic typicallyassociated with acid drainage, and are potential carriers of heavy metals to loca-tions downstream. Consequently, in assessing the environmental impact of miningat Summitville, it is an important observation that both the Summitville mine siteand the Iron, Alum, and Bitter Creek basins contribute this type of sediment to theAlamosa River.
Downstream from the Summitville mine, other creek drainages, including theJasper area, contribute hydroxyl-bearing and iron-bearing minerals to the AlamosaRiver. These river sediments are then carried into the Terrace Reservoir (shownbelow), the source of irrigation water for some parts of the San Luis Valley.

19
Reynolds tunnel sludge
Iron hydroxide
Potassium-rich jarosite
Goethite
Sodium-rich jarosite
Ferrihydrite
Hematite
Not mapped
AVIRIS image of the Summitville mine and adjacent area showing the distribution ofiron-bearing minerals. Image made September 3, 1993.
20
WATER TRANSPORT—A POWERFUL WAY TO
MOVE METALS
Water Quality
Water quality is determined by the amounts of sus-pended solid particles and dissolved substances. Fed-eral and State agencies provide standards for waterquality based on whether the water will be used for (1)recreation, (2) aquatic life, (3) agriculture, or (4) do-mestic supply. The standards are in the form of tablesof maximum allowable concentrations for a wide vari-ety of elements and organic compounds.
Summitville
1
Backgroundsite 50:15
10
100
1000
10,000
DIS
SO
LVE
D A
LUM
INU
M IN
WA
TE
RS
,IN
PA
RT
S P
ER
BIL
LIO
N
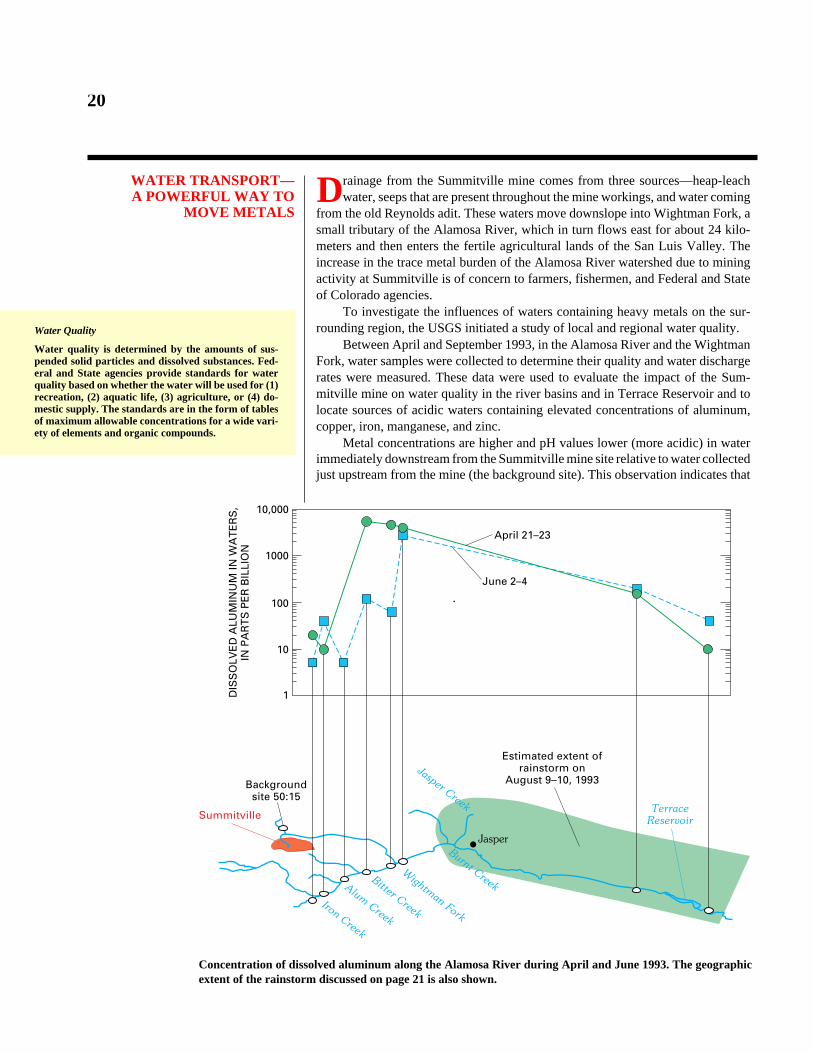
Concentration of dissextent of the rainstor
rainage from the Summitville mine comes from three sources—heap-leachwater, seeps that are present throughout the mine workings, and water coming
from the old Reynolds adit. These waters move downslope into Wightman Fork, asmall tributary of the Alamosa River, which in turn flows east for about 24 kilo-meters and then enters the fertile agricultural lands of the San Luis Valley. Theincrease in the trace metal burden of the Alamosa River watershed due to miningactivity at Summitville is of concern to farmers, fishermen, and Federal and Stateof Colorado agencies.
To investigate the influences of waters containing heavy metals on the sur-rounding region, the USGS initiated a study of local and regional water quality.
Between April and September 1993, in the Alamosa River and the WightmanFork, water samples were collected to determine their quality and water dischargerates were measured. These data were used to evaluate the impact of the Sum-mitville mine on water quality in the river basins and in Terrace Reservoir and tolocate sources of acidic waters containing elevated concentrations of aluminum,copper, iron, manganese, and zinc.
Metal concentrations are higher and pH values lower (more acidic) in waterimmediately downstream from the Summitville mine site relative to water collectedjust upstream from the mine (the background site). This observation indicates that
D
Jasper
April 21–23
June 2–4
Iron Creek
Alum Creek
Bitter Creek
Wightman Fork
Burnt Creek
Jasper Creek
Estimated extent ofrainstorm on
August 9–10, 1993
TerraceReservoir
olved aluminum along the Alamosa River during April and June 1993. The geographicm discussed on page 21 is also shown.
21
1
pH
IronCreek
KILOMETERS UPSTREAM FROM RIO GRANDE(not to scale)
83
3
5
7
9
80 79 77 72 68 56
AlumCreek
BitterCreek
WightmanFork
JasperCreek
BurntCreek
Alamosa Riverupstream from
Terrace Reservoir
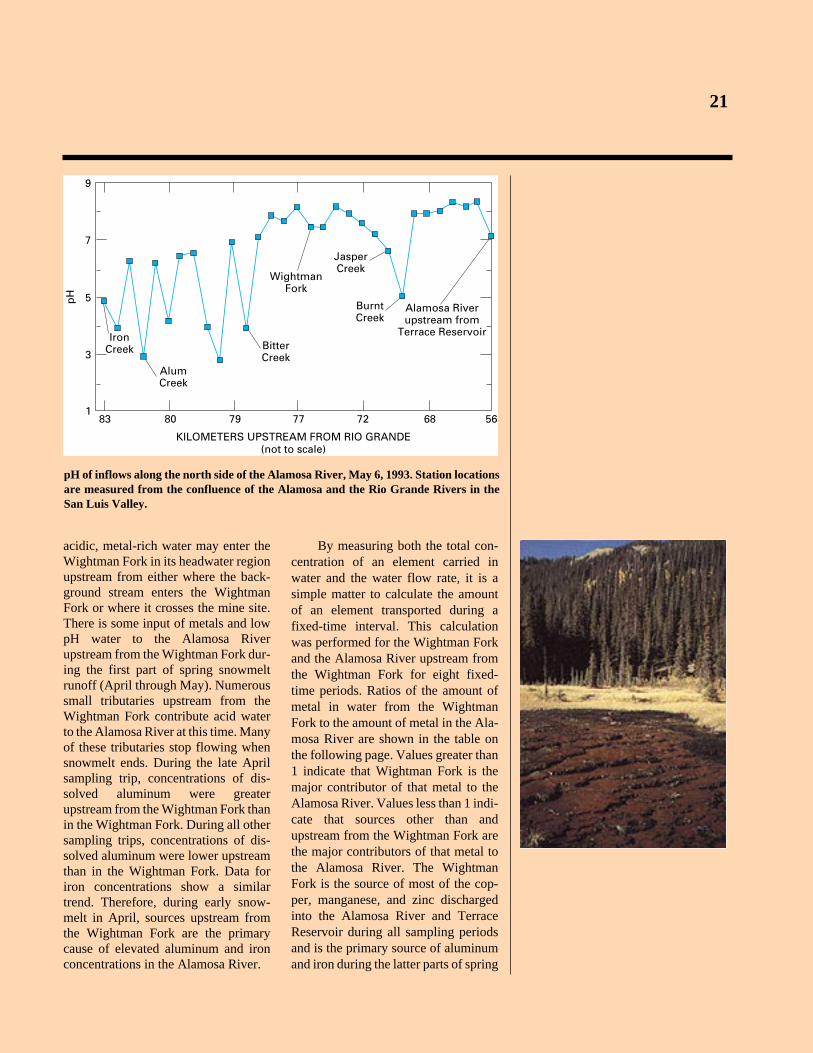
pH of inflows along the north side of the Alamosa River, May 6, 1993. Station locationsare measured from the confluence of the Alamosa and the Rio Grande Rivers in theSan Luis Valley.
21
acidic, metal-rich water may enter theWightman Fork in its headwater regionupstream from either where the back-ground stream enters the WightmanFork or where it crosses the mine site.There is some input of metals and lowpH water to the Alamosa Riverupstream from the Wightman Fork dur-ing the first part of spring snowmeltrunoff (April through May). Numeroussmall tributaries upstream from theWightman Fork contribute acid waterto the Alamosa River at this time. Manyof these tributaries stop flowing whensnowmelt ends. During the late Aprilsampling trip, concentrations of dis-solved aluminum were greaterupstream from the Wightman Fork thanin the Wightman Fork. During all othersampling trips, concentrations of dis-solved aluminum were lower upstreamthan in the Wightman Fork. Data foriron concentrations show a similartrend. Therefore, during early snow-melt in April, sources upstream fromthe Wightman Fork are the primarycause of elevated aluminum and ironconcentrations in the Alamosa River.
By measuring both the total con-centration of an element carried inwater and the water flow rate, it is asimple matter to calculate the amountof an element transported during afixed-time interval. This calculationwas performed for the Wightman Forkand the Alamosa River upstream fromthe Wightman Fork for eight fixed-time periods. Ratios of the amount ofmetal in water from the WightmanFork to the amount of metal in the Ala-mosa River are shown in the table onthe following page. Values greater than1 indicate that Wightman Fork is themajor contributor of that metal to theAlamosa River. Values less than 1 indi-cate that sources other than andupstream from the Wightman Fork arethe major contributors of that metal tothe Alamosa River. The WightmanFork is the source of most of the cop-per, manganese, and zinc dischargedinto the Alamosa River and TerraceReservoir during all sampling periodsand is the primary source of aluminumand iron during the latter parts of spring

22
Ratio of total amount of metal in the Wightman Fork at its mouth to total amount of metal in the Alamosa River above Wightman Fork
[A ratio of more than 1 indicates that the Wightman Fork supplies most of the metal to the AlamosaRiver, and a ratio of less than 1 indicates that areas upstream from the Wightman Fork supply mostof the metal to the Alamosa River]
Date Aluminum Iron Copper Manganese Zinc
April 21–23, 1993 0.24 0.10 16 1.1 1.8May 4–6, 1993 0.27 0.15 7 1.3 1.5May 18–20, 1993 1.3 0.85 47 4.1 11June 2–4, 1993 3.0 2.8 230 6.4 15June 21–23, 1993 1.7 2.4 340 4.6 >26
1
July 12–14, 1993 2.0 1.9 330 4.6 16August 8–10, 1993 1.1 0.39 62 3.6 9.6
September 7–8, 1993 0.71 0.36 53 3.2 5.9
1
The amount of total recoverable zinc in the Alamosa River above Wightman Fork is below thedetection limit of 10 micrograms per liter.
ALUMINUM COPPER IRON MOLYBDENUM ZINC
CO
NC
EN
TR
AT
ION
OF
DIS
SO
LVE
D M
ET
ALS
,IN
MIL
LIG
RA
MS
PE
R L
ITE
R
0.001
0.01
0.1
1
10Before storm
After storm
Concentrations of dissolved metals in the Alamosa River upstream from Terrace Res-ervoir before and after a rainstorm, August 10, 1993. The geographic extent of therainstorm is shown on page 20.
22
?

23
?
?
runoff and into July and August.Sources upstream from the WightmanFork supplied most of the iron and alu-minum to the Alamosa River in April,early May, and September.
A few tributaries downstreamfrom the Wightman Fork, includingBurnt Creek, contribute acidic, metal-bearing water to the Alamosa Riverduring the early part of snowmelt run-off. This observation was confirmed inan unusual manner during August1993. Samples were collected in theAlamosa River directly upstream fromTerrace Reservoir before and after arainstorm that soaked an area down-stream from, but not including, theWightman Fork drainage basin. Run-off from the storm had two importanteffects. First, water flow rate in theAlamosa River increased by a factor ofthree. Second, concentrations of somemetals in the Alamosa River upstreamfrom Terrace Reservoir increased asmany as 400 times.
Sources of acidic, metal-richwater to the Alamosa River include (1)areas that have been disturbed by min-ing, such as Summitville, and (2) areasthat have had minimal mining activitybut where the rocks are hydrother-mally altered, such as Iron, Alum, andBitter Creeks, upstream from theWightman Fork and Burnt Creek, anddownstream from the Wightman Fork.Many natural sources of acidic waterwere identified in these altered areas.

24
REVEALINGGROUNDWATER
QUALITY BYEXAMININGTREE RINGS
ree rings are used by geologists toexamine past environments. They
are particularly useful because eachring represents one year of growth, pre-serving evidence of past conditions.Counting rings from the outside towardthe tree center allows the researcher tomove precisely backward in time.Nutrients provided by the root systemare required by a tree in order to pro-mote ring growth. The roots excreteacids that then dissolve metals in thesoil, making them available for uptakeby the tree. These metals eventually aredeposited within the growing tree. Con-sequently, small changes in soil chem-istry can be seen by examining themetal concentrations in tree rings, andthese changes can be precisely dated.
The use of plants in assessingenvironmental metal contamination hasa long history. In the middle of the 19thcentury, the association was madebetween overall air quality in heavilyindustrialized European cities and thepresence or absence of specific speciesof tree lichens and mosses. Both treelichen and mosses are capable ofabsorbing large quantities of metals,and recently the USGS has used them toestablish baseline levels for metals inplant tissues. These plants have alsobeen used to map regions of greatermetal concentrations associated withcontaminants emitted into the atmo-sphere from specific point sources suchas smokestacks of power-generatingstations or mine sites.
T
Metals in solutionin ground water
Metals in solutionin surface water
Tree core showing annual rings
1986Summitville mining
began
1992Summitville mining
ended
Bark
Metal levels in individual annual rings of cottonwood can be examined for differencesbetween years (pre-mining versus post-mining) or between the same year but at vari-ous distances from the Summitville mine. The latter is an indirect measure of the effi-ciency of metal transport in the Alamosa River system.

25
Tree-ring sampling sites along the Alamosa River.
25
CD
BE
F
G
H
IJ K
Summitvillemine
Platoro
37˚30'
37˚00'
107˚00' 106˚30' 106˚00'
. Jasper
ALAMOSA RIVERTerraceReservoir
Monte Vista
RIO
GR
AN
DE
Alamosa
Capulin
La
Jara Creek0 10 20 KILOMETERS
SAN JUAN
MOUNTAINS
COLORADO
SAN
LUISVALLEY
Tree-ring studies are useful, butthe chemistry of tree rings can be dif-ficult to interpret. First, there may bedifferences in metal concentrationsaround the perimeter of a single treering. Second, metals may movebetween rings, particularly if there areinitially large differences in concen-trations between adjacent rings. Third,narrow tree rings, representing a slowgrowth rate, make ring-counting moredifficult and add errors to the dating.Fourth, distinguishing between localand distant metal sources is difficult.Despite these problems, tree ringshave been used successfully to docu-ment changes in groundwater chemis-try down gradient from point sourcesof metal contamination.
Near Summitville, in the Alam-osa River basin, the USGS analyzedindividual tree rings from narrow-leaf

26
1960
Site J
Site I
Site G
Site F
Site E
CO
NC
EN
TR
AT
ION
, IN
MIC
RO
GR
AM
S P
ER
GR
AM
0
Site K
10
20
30
40
50
60
1970 1980 1986 1990
YEAR
Zinc concentrations in cottonwood tree rings downstream from the Summitville mine along the Alamosa River. Scientists canexamine differences within a single tree over time, as well as differences between sites for specific years.
26
cottonwood (Populus angustifolia) and aspen (Populus tremuloides). Both typesof trees produce annual growth rings that can be precisely dated. Small coreswere drilled from the outside toward the center of each tree and extracted foranalysis. Individual tree rings were analyzed using a new analytical instrument, alaser-ablation inductively coupled plasma mass spectrometer (LA-ICP-MS).
Both copper and zinc, heavy metals that are environmentally hazardous,were detected in the rings of the tree samples. Both metals are most abundant inolder tree-ring tissue formed prior to mining activity at Summitville. Thus, theamount of copper and zinc available to the tree roots has decreased in recentyears. This distribution may be due to an absolute decrease in levels of copperand zinc in the soils; however, high concentrations of copper in groundwater pro-duce toxicity in tree roots, retarding metal uptake. Consequently, the decrease ofcopper and zinc in the tree rings may reflect toxicity as a result of increased cop-per and zinc levels in the soil. More study is required to distinguish betweenthese competing interpretations.
27
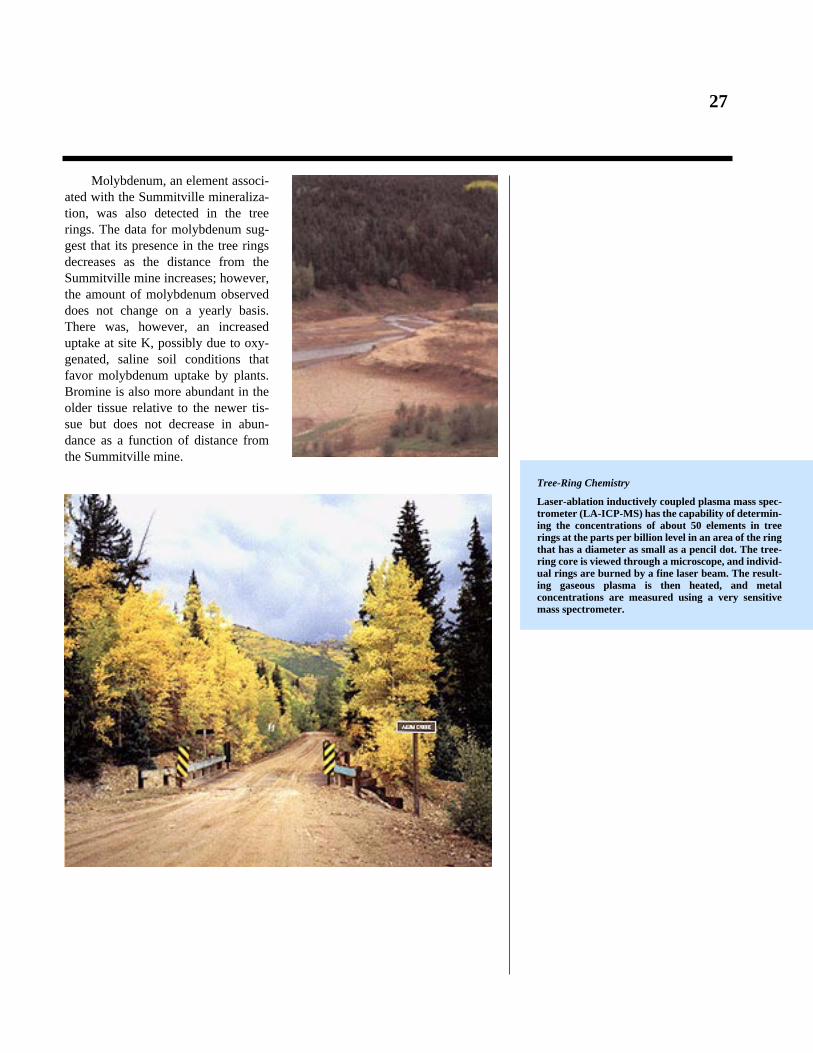
Molybdenum, an element associ-ated with the Summitville mineraliza-tion, was also detected in the treerings. The data for molybdenum sug-gest that its presence in the tree ringsdecreases as the distance from theSummitville mine increases; however,the amount of molybdenum observeddoes not change on a yearly basis.There was, however, an increaseduptake at site K, possibly due to oxy-genated, saline soil conditions thatfavor molybdenum uptake by plants.Bromine is also more abundant in theolder tissue relative to the newer tis-sue but does not decrease in abun-dance as a function of distance fromthe Summitville mine.
Tree-Ring Chemistry
Laser-ablation inductively coupled plasma mass spec-trometer (LA-ICP-MS) has the capability of determin-ing the concentrations of about 50 elements in treerings at the parts per billion level in an area of the ringthat has a diameter as small as a pencil dot. The tree-ring core is viewed through a microscope, and individ-ual rings are burned by a fine laser beam. The result-ing gaseous plasma is then heated, and metalconcentrations are measured using a very sensitivemass spectrometer.

28
PATHWAYS OF SEDIMENTAND WATER TO THE
SAN LUIS VALLEY
Rock Weathering
How long does a rock last? The primary mechanismof erosion is weathering. The severity of weatheringdepends on climate, original rock composition, andtime. Given sufficient time, climate is the dominantfactor. Weathering is a twofold process. Mechanicalweathering, the shattering of rocks, results from thephysical action of water, ice, wind, and gravity, whichcauses rocks to fragment. Chemical weathering, thechemical decomposition of rocks, results from thecorrosive action of water, which causes parts of therock to be dissolved.
cidic, metal-bearing surfacewater and sediment carried down
the Alamosa River enters Terrace Res-ervoir. From Terrace Reservoir, theAlamosa River runs east through theAlamosa National Wildlife Refuge.Because the San Luis Valley is a majoragricultural center for Colorado, ana-lyzing the effects of these waters andsediments on crops and livestock is ofparticular concern to local farmers andagricultural industries. Similar con-cerns are also relevant to the AlamosaWildlife Refuge, a sanctuary formigrating birds including sandhill andwhooping cranes.
Weathering breaks rocks into par-ticles and dissolved forms that arereadily transported. Streams, the mostcommon mode of transport, are themost effective way to move sediment,especially near their headwaters wherethey move fastest. Material is trans-ported downstream until the carryingcapacity of the stream diminishes, thewater slows down, and solid particlesare deposited to form sediments. Somesediments form directly in the stre-ambed, whereas others are depositedover the streambank as a result offlooding. After floodwaters recede,these overbank sediments are furtherweathered to form soils. Thus, the par-ticular mixture of minerals in the soilreflects the mineralogy of the sourcerocks and imparts a geochemical fin-gerprint to the soil. Where the source
A
The Sawatch Range and the Bonanza minto the northern part of the San Luis Vallecarry sediments to the southern part of the
rocks have a geochemically unusualsignature, such as in an area where oredeposits are present, the signature ofthe soil commonly is similar to that ofthe ore deposits.
Examination of the rivers andstreams that flow into the San LuisValley indicates that the major sourcesof sediment are the Sangre De CristoRange, the Sawatch Range, and the SanJuan Mountains. Most of the sedimentresults from the weathering and erosionof volcanic rocks. These source areasalso include a number of ore deposits,some of which have been mined, andtherefore it might be expected that sed-iments enriched in heavy metals arealso carried into the San Luis Valleyand become part of the soil. Chemicalanalysis of soils collected by the USGSin this region in 1993 indicates that twomajor mining districts, Summitvilleand Bonanza, contribute metal-bearingsediment to the San Luis Valley floor.The Bonanza mining district introducessediment into the northern part of thevalley. Sediment is carried to thesouthern part of the San Luis Valleyfloor via numerous streams, includingthe Wightman Fork, the AlamosaRiver, and the Rio Grande River. TheRio Grande River does not carry sedi-ment derived from the Summitvillemine or directly adjacent areas,whereas the Wightman Fork and theAlamosa River do.
e contribute sediments containing coppery, and the Rio Grande and Alamosa River valley.

29

30
pectral imaging of minerals fromaircraft was described previ-
ously, and this technique is alsoextremely useful in examining cropdistribution. Just as minerals haveunique spectral signatures, so doplants, trees, and soils. Laboratoryspectral investigations of plants haveshown that species can be identifiedusing their visible and near-infraredspectra. The primary spectral featuresused for identification result from thepresence of chlorophyll in plants, theorganic material that gives plants agreen color.
Details of the relation betweenchlorophyll in plants and their indi-vidual spectra are still poorly under-stood. Although the spectra of plantsare sufficiently different to allowspecies identification, the spectra foran individual species can vary. Varia-tions in plant spectra probably resultfrom the amount of chlorophyll in theplant, a complex relation between thestages of the growing cycle and thehealth of the plant. The health of aplant can be affected by many factorsincluding the amount of water it hasavailable (too much or too little) ormetal toxicity. Using AVIRIS data,maps were made of the distribution of
IMAGINGSPECTROSCOPY—
A METHOD FOR MAPPINGCROP DISTRIBUTION
S
crops, relative amounts of dry versusgreen vegetation, and relative healthof specific crops in the lower SanLuis Valley
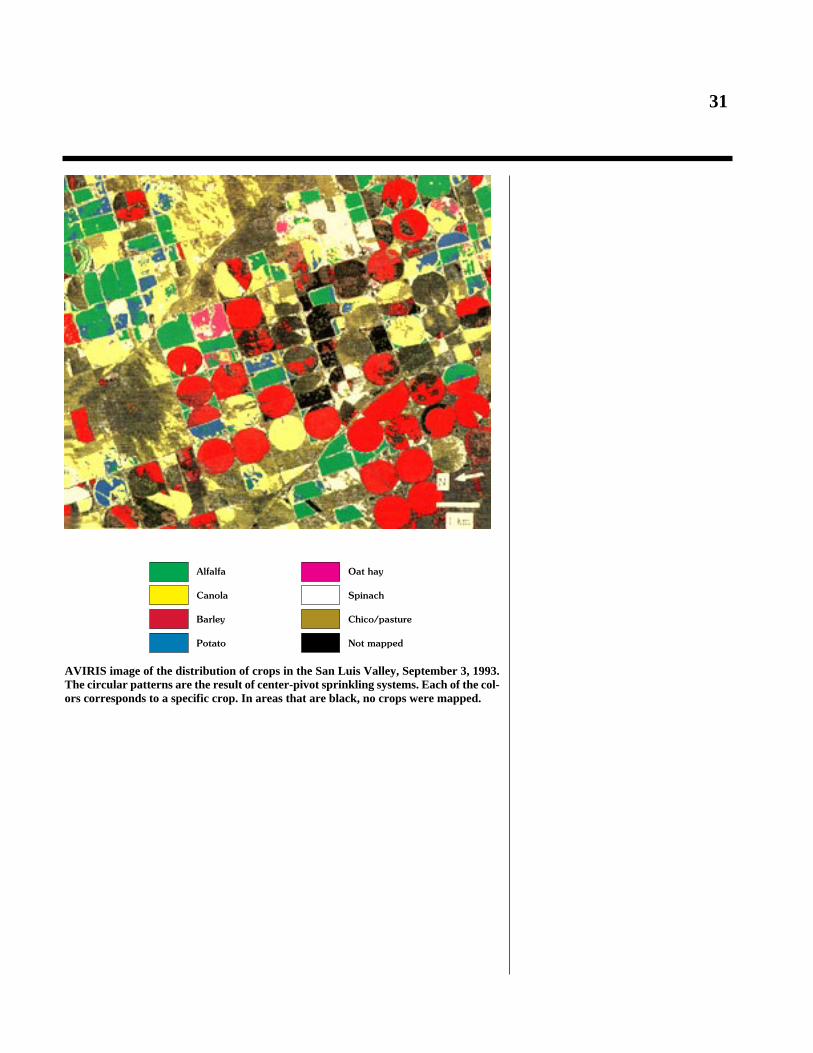
Farmers in the San Luis Valleyrely heavily on irrigation watersapplied by center-pivot irrigation sys-tems; thus, most farmed lands appearas circular areas in the remotelysensed data. Pasture land, fallowfields, and public lands not being usedfor agricultural purposes are usuallynot irrigated and do not appear as cir-cular areas in the images. A number ofcrops, including alfalfa, canola, bar-ley, hay, oats, potatoes, and spinach,were successfully mapped. Subtle butsignificant differences in the reflec-tance spectra of potatoes allowed themapping of three different species.Pasture lands and areas of mixedgreen and dried vegetation were alsomapped, providing a method to ana-lyze crop distribution over large areas.Such methods are useful to land man-agement agencies to inventory andassess land usage; however, more rig-orous and thorough testing is requiredto determine the full capabilities andapplication of airborne imaging spec-troscopy to agricultural problems.
31
Alfalfa
Canola
Barley
Potato
Oat hay
Spinach
Chico/pasture
Not mapped
AVIRIS image of the distribution of crops in the San Luis Valley, September 3, 1993.The circular patterns are the result of center-pivot sprinkling systems. Each of the col-ors corresponds to a specific crop. In areas that are black, no crops were mapped.

32
UPTAKE OF ELEMENTS BYALFALFA AND BARLEY—
ANOTHER WAY TO STUDYMETAL DISPERSION
errace Reservoir receives water from the Summitville mine and surroundingareas and provides irrigation water to the southwestern part of the San Luis
Valley. The composition of water and stream sediment from the Wightman Forkand the Alamosa River suggests that arsenic, chromium, copper, lead, nickel, man-ganese, and zinc are likely components of water being drawn from Terrace Reser-voir. USGS scientists undertook two studies to determine the effects of thisirrigation water on metal concentrations in alfalfa (a perennial crop) and barley (anannual crop) and their associated soils.
Two sources of irrigation water were examined and compared for severalfields of similar soil types in center-pivot irrigated alfalfa and barley fields. Thesources for the irrigation water were the Alamosa River (terrace fields) and the RioGrande River and confined groundwater (control fields). The Alamosa Riverreceives acidic metal-rich drainage, whereas the Rio Grande River and confinedgroundwater are uncontaminated.
A comparison of copper, manganese, and zinc concentrations from thetwo water sources indicates that water from the Alamosa River is more acidic(pH 5.6–6.8) than irrigation waters from the Rio Grande River or confinedgroundwater (pH 7.6–9.2) and contains much higher concentrations of thesemetals. Because the two sources of irrigation water have such different compo-sitions, the question that needs to be addressed is are these differences alsopresent in the crops and soils? Our studies suggest that the answer is no.
Comparison of the metal-concentration ranges for the soils irrigated by dif-ferent water sources shows that copper, manganese, and zinc concentrations inthe soils are generally similar. Comparison of these concentration ranges withthose for soils collected throughout the Western United States indicates that theconcentration ranges of the soils, regardless of the source of irrigation water, arewithin expected ranges.
Comparison of the copper concentrations in alfalfa and barley irrigated bydifferent sources shows that copper concentrations of the crop in the fields irri-gated with Alamosa River water are higher than those for fields irrigated with RioGrande River water or confined groundwater. Concentration ranges are compara-ble, however, to those reported in other studies for different locations. Similarresults were obtained for nickel.
T

33
1
n = 24
Mean
n = 24
10 +/-
n = 49
n = 112
n = 129
San Luis Valley, Colo.Terrace fields*
Control fields*
San Joaquin Valley, Calif.
Casper, Wyo.
Uncompahgre River Valley, Colo.
Dietary requirement for cattle
Possible toxic level in cattle115
10 100 200
CONCENTRATION IN DRY MATTER,IN PARTS PER MILLION
*Differences significant at the95 percent confidence level
San Luis Valley, Colo.Terrace fields*
Control fields*
Reported in literature
Mean
2 4 6 8 10 12CONCENTRATION IN DRY MATTER,
IN PARTS PER MILLION*Differences significant at the
99 percent confidence level
COPPER IN ALFALFA
COPPER IN BARLEY
Copper concentrations in alfalfa and barley for the different irrigation sources in the study area compared to copper concentrationsin alfalfa and barley determined during other studies reported in the literature. For both alfalfa and barley, the copper concentra-tions of the crops in the fields irrigated with Alamosa River water (terrace fields) are greater than those for fields irrigated with RioGrande River water or confined groundwater (control fields); however, the ranges of concentrations are comparable to those re-ported in the literature for other locations in the Western United States.
If nutritional requirements for cattle are considered, alfalfa irrigated with both sources of water meets published nutritiverequirements and contains amounts of metals far below concentrations reported to be toxic to cattle. Interestingly, the highercopper concentrations in alfalfa grown in fields irrigated with Alamosa River water are commonly in the sufficient range ofnutrient status, whereas alfalfa grown in fields irrigated with Rio Grande River water or confined groundwater extends intothe low range of nutrient status. Similar results were obtained for manganese and zinc.
Thus, although concentrations of many metals in irrigation water affected by the Summitville mine are higher than inother local irrigation-water sources, these metal-rich irrigation waters have only a slight effect on the bulk soil compositionand a minimal effect on the metal content of the crops. None of the metal values in alfalfa is near toxic levels, and some metallevels can be considered somewhat beneficial to the nutritional value for alfalfa.

34
BIOGEOCHEMICALEXAMINATION OF THE
ALAMOSA NATIONALWILDLIFE REFUGE
o examine the nature and extentof the effects of acid drainage on
the biogeochemistry of wetlands in theSan Luis Valley, the USGS initiated astudy of the Alamosa National Wild-life Refuge (shown below). Water andstream sediments were collected inJune 1993 from the Wightman Forkand from 10 sites along the AlamosaRiver. In addition, water, sedimentcores, and aquatic plants (Polegonumamphibia) were collected from ninewetlands just west of and within theAlamosa National Wildlife Refuge.The sources of water entering the wet-lands include the Alamosa River, or amixture of La Jara Creek and AlamosaRiver water, and the Rio Grande River.
T
Data for sediment and watersamples collected in the AlamosaRiver suggest that both theSummitville mine and the unminedmineralized areas are sources ofcopper. Using data collectedupstream from the confluence of theWightman Fork and the AlamosaRiver as baseline level, the study sug-gests that dissolved copper was intro-duced into the Alamosa River by theWightman Fork waters during June
1993. The concentration of copperdecreases as the waters flow towardand along the valley floor. There issome indication that the level of cop-per remains above the baseline valuein the wildlife refuge.
Analysis of sediments collectedabove and below the confluence of theWightman Fork and the Alamosa Riversuggests that copper levels are influ-enced by drainage from the WightmanFork and the tributaries draining the Jas-per area. The presence of amorphous,iron-enriched particles in the river, thedownstream dilution of dissolved metalconcentrations, and the downstreamenrichment of metals in sediment areconsistent with the deposition of toxicelements from the water, their transportin the solid phase, and settling out as thewater velocity decreases.
The waters in the wetlands havehigh pH values, in contrast to the lowpH values for acid drainage, and gen-erally contain low concentrations ofheavy metals. A comparison of sedi-ment samples from the Alamosa Riverand Rio Grande River shows, how-ever, that the accumulation rate forcobalt, chromium, copper, nickel,vanadium, and zinc is greater in thatpart of the wetland that receives waterfrom the Alamosa River. Other ele-ments, such as arsenic, cesium andlead, show no significant enrichmentsthat can be attributed to differences inthe source of water and sediment.Studies of aquatic plants in the wet-lands show that plants receiving Ala-mosa River water contain more copperand zinc than plants that receive waterfrom other sources. Thus, certain ele-ments associated with acid drainagefrom both mined and unmined areasare being introduced into the wetlands.Further, the chemical composition ofthe wetlands near and within the Ala-mosa National Wildlife Refuge isdependent in large part on the sourceof the water.

35
SUMMARY
esults of USGS research at the Summitville mine site in Colorado underscorethe crucial need for sound scientific information in predicting, assessing, and
remediating the environmental effects of mining. Although final scientific judg-ments about Summitville and its downstream environmental effects await the out-come of all of the research, some preliminary conclusions can be drawn.
Extreme acid-rock drainage is the dominant long-term environmental concernat the Summitville mine and could have been predicted given the geologic charac-teristics of the deposit. Extensive remedial efforts are required to isolate bothunweathered sulfides and soluble metal salts in the open-pit area and mine-wastepiles from weathering and dissolution.
It is likely that natural contamination adversely affected water quality andfish habitat in the Alamosa River long before mining and will continue to haveadverse effects even when acid drainage from Summitville is remediated. Thus,reasonable natural conditions for the Alamosa River basin must be established inorder to set realistic remediation standards for the Summitville site.
Results of studies as of late 1993 indicate that mining at Summitville has hadno discernible short-term adverse effects on barley or alfalfa crops irrigated withAlamosa River water. Remediation of the site will help to ensure that no adverseeffects occur over the longer term.
R

36
Bove, D.J., Preliminary report on the geol-ogy of hydrothermally altered areaswithin the upper Alamosa River Basin,Colorado: U.S. Geological SurveyOpen-File Report 94–224, 12 p.
Clark, R.N., Swayze, G.A., Gallagher, A.J.,King, T.V.V., and Calvin, W.M., 1993,The U.S. Geological Survey DigitalSpectral Library, version 1—0.2 to 3.0mm: U.S. Geological Survey Open-File Report 93–592, 1,326 p.
Erdman, J.E., and Smith, K.S., 1993,Impact of the Summitville Mine onirrigation water, agricultural soils, andalfalfa in the southwestern San LuisValley, Colorado: U.S. GeologicalSurvey Open-File Report 93–616, 4 p.
Golder Associates, 1992, Summitville minereclamation plan: Four volumes.
Gough, L.P., ed., 1993, Understanding ourfragile environment—Lessons fromgeochemical studies: U.S. GeologicalSurvey Circular 1105, 34 p.
Gough, L.P., Schacklette, H.Y., and Case,A.A., 1979, Element concentrationstoxic to plants, animals, and man: U.S.Geological Survey Bulletin 1466, 80 p.
Gray, J.E., and Coolbaugh, M.F., 1994,Summitville, Colorado—Geologicframework and geochemistry of anepithermal acid-sulfate deposit formedin a volcanic dome: Economic Geolo-gy, v. 89.
Gray, J.E., Coolbaugh, M.F., and PlumleeG.S., 1993, Geologic framework andenvironmental geology of the Sum-mitville Colorado, acid-sulfate mineraldeposit: U.S. Geological Survey Open-File Report 93–677, 20 p.
Gray, J.E., Coolbaugh, M.F., Plumlee,G.S., and Atkinson, W.W., 1994, Envi-ronmental geology of the Summitvillemine: Economic Geology, v. 89.
Green, R.O., 1993, Summaries of theFourth Annual JPL Airborne Geo-science Workshop, October 25–29,1993: Jet Propulsion Laboratory, JPLPublication 93–26.
King, T.V.V., Ager, C., Clark, R.N.,Swayze, G.A., and Gallagher, A.J.,1994, Application of field and labora-tory spectroscopic analysis to investi-gate the environmental impact ofmining in the southeastern San Juanmountains and adjacent San Luis Val-ley, Colorado: U.S. Geological SurveyCircular 1103–A, p. 53–54.
Lipman, P.W., 1975, Evolution of the Pla-toro caldera complex and related vol-canic rocks, southeastern San JuanMountains, Colorado: U.S. GeologicalSurvey Professional Paper 852, 128 p.
Miller, W.R., and McHugh, J.B., 1994,Natural acid drainage from alteredareas within and adjacent to the UpperAlamosa River Basin, Colorado: U. S.Geological Survey Open-File Report94–144, 47 p.
Plumlee, G.S., Ficklin, W.H., Montour, M.,Smith, K.S., Meier, A., and Briggs,P.H., 1994, The geochemistry andenvironmental degradation of cyanideat the Summitville mine, Colorado:U.S. Geological Survey Circular1103–A, p. 77–78.
Plumlee, G.S., Smith, K.S., and Ficklin,W.H., 1994, Geoenvironmental mod-els of mineral deposits, and geology-based mineral-environmental assess-ments of public lands: U.S. GeologicalSurvey Open-File Report 94–203, 7 p.
Tidball, R.R., Smith, S.M., and Stewart,K.C., 1994, Geochemical mapping inthe San Luis Valley, Colorado hydro-geochemical and stream sediment data:U.S. Geological Survey Circular1103–A, p. 105–106.
Schlumberger, Marcel, 1939, The applica-tion of telluric currents to surface pros-pecting: American Geophysical Union,Transactions, pt. 3, p. 271–277.
Stefanesco, S.S., Schlumberger, C., andSchlumberger, M., 1930, Sur la distri-bution electrique potentielle autord'une prix de terrre ponctuelle daus unterrain a couche horizontales, homoge-nes et isotrope: Journal de Physique etle Radium, v. 11, p. 132–140.
Walton-Day, K., Ortiz, R. F., and von Guer-ard, P., 1994, Preliminary results of asynoptic water-quality study of theupper Alamosa River to the outlet ofTerrace Reservoir: U.S. GeologicalSurvey Circular 1103–A, p. 107.
Watson, K., and Knepper, D.H., 1994, Air-borne remote sensing for geology andthe environment: U.S. Geological Sur-vey Bulletin 1926, 43 p.
Yanosky, T.M., and Vroblesky, D.A., 1992,Relation of nickel concentrations intree rings to groundwater contamina-tion: Water Resources Research, v. 28,p. 2077–2083.
FURTHER READING

37
PHOTO CREDITS
Edited by Judith Stoeser and Carole A. BalesGraphics by Carol Quesenberry,
Mari Kauffmann, Shawn T. Smith,and Richard P. Walker
Photocomposition by Carol QuesenberryBook design by Carol QuesenberryOn-line version by Joan Nadeau
Cover: Alamosa River near the Summitville mine, July 1994. Photograph by Geoff PlumleePage iii: Alum Creek basin near the Summitville mine, September 1994. Photograph by
Larry Gough.Page iv: Ore chute at the old Summitville mine, 1975. Photograph by Chuck Beverly,
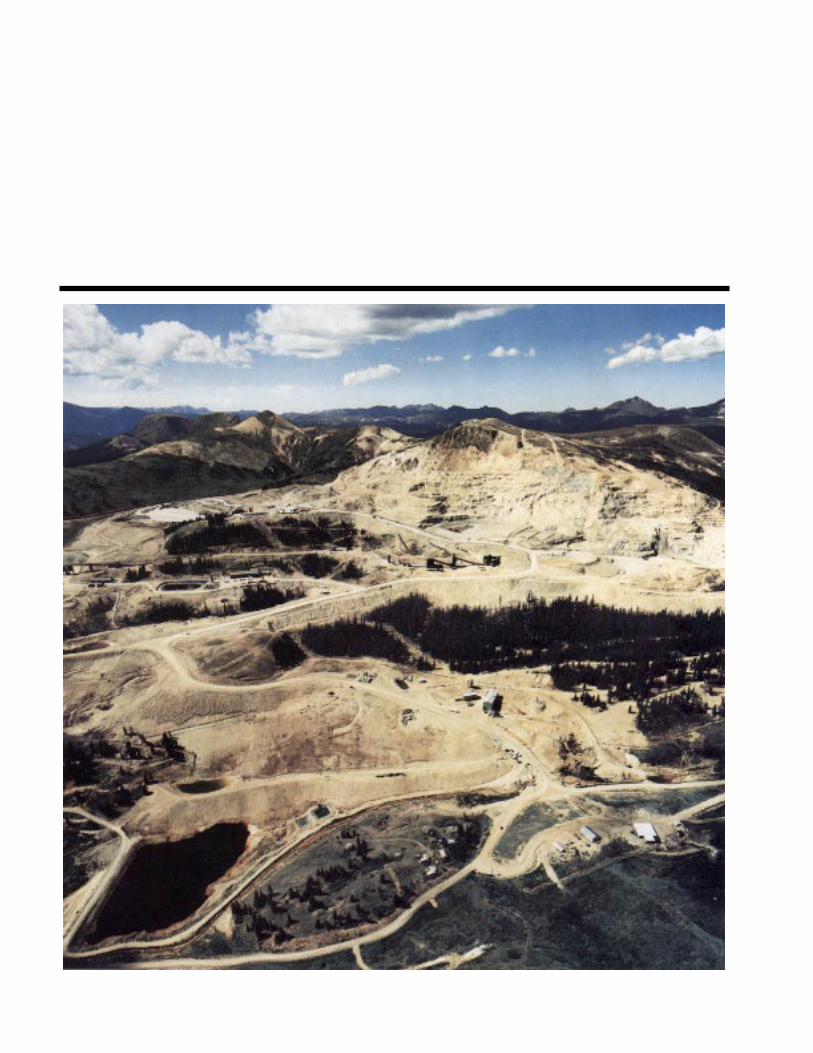
ASARCO; reproduced with permission from the Denver Museum of Natural History.Page 1: Aerial view of the Summitville mine, August 1994. Photograph by IntraSearch;
reproduced with permissionPage 2: Old Summitville mine site, October 1975. Reproduced with permission from the
Denver Museum of Natural History Page 3: Terrace Reservoir on the Alamosa River downstream from the Wightman Fork, Sep-
tember 1994. Photograph by Larry Gough.Page 4: Monte Vista National Wildlife Refuge in the San Luis Valley, April 1993.
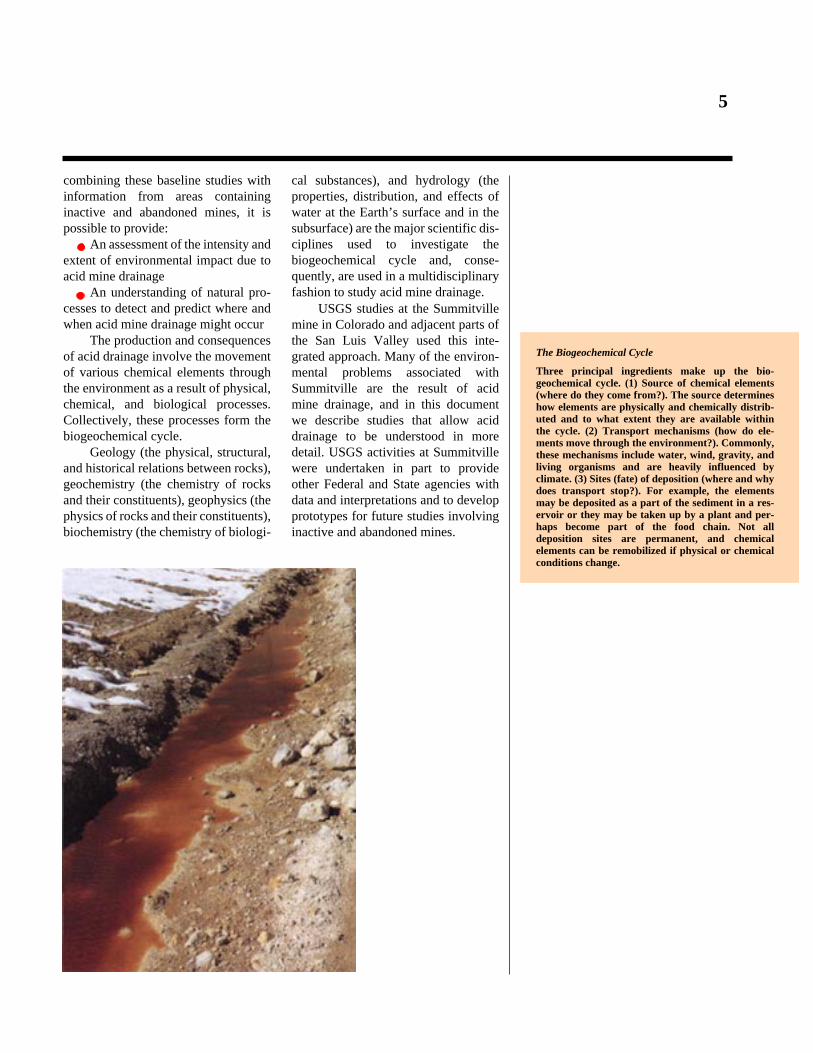
Photograph by Larry Gough.Page 5: Drainage water coming from the Cropsy dump at the Summitville mine, October
1990. Photograph by Geoff Plumlee.Page 7 (top): South Mountain and Little Annie mining camp, Summitville area, circa 1873.
From “Statistics of mines and mining in the States and Territories west of the RockyMountains,” U.S. Treasury Department, 1877.
Page 7 (bottom): Unmined, mineralized area, Alum Creek basin, September 1994.Photograph by Larry Gough.
Page 8: Unmined, mineralized area, Alum Creek basin, September 1994. Photograph byLarry Gough.
Page 9 (top): Unmined, mineralized area, Alum Creek basin, September 1994. Photographby Larry Gough.
Page 9 (bottom): Aerial view of the Summitville mine, August 1994. Photograph byIntraSearch; reproduced with permission.
Page 10 (top): Miners in underground mine, circa 1900. Photograph by Mark Coolbaugh.Page 10 (bottom): Aerial view of the Summitville mine, 1991. Photograph by IntraSearch;
reproduced with permission.Page 12: Heavy metals coloring the water draining from the Reynolds tunnel at the
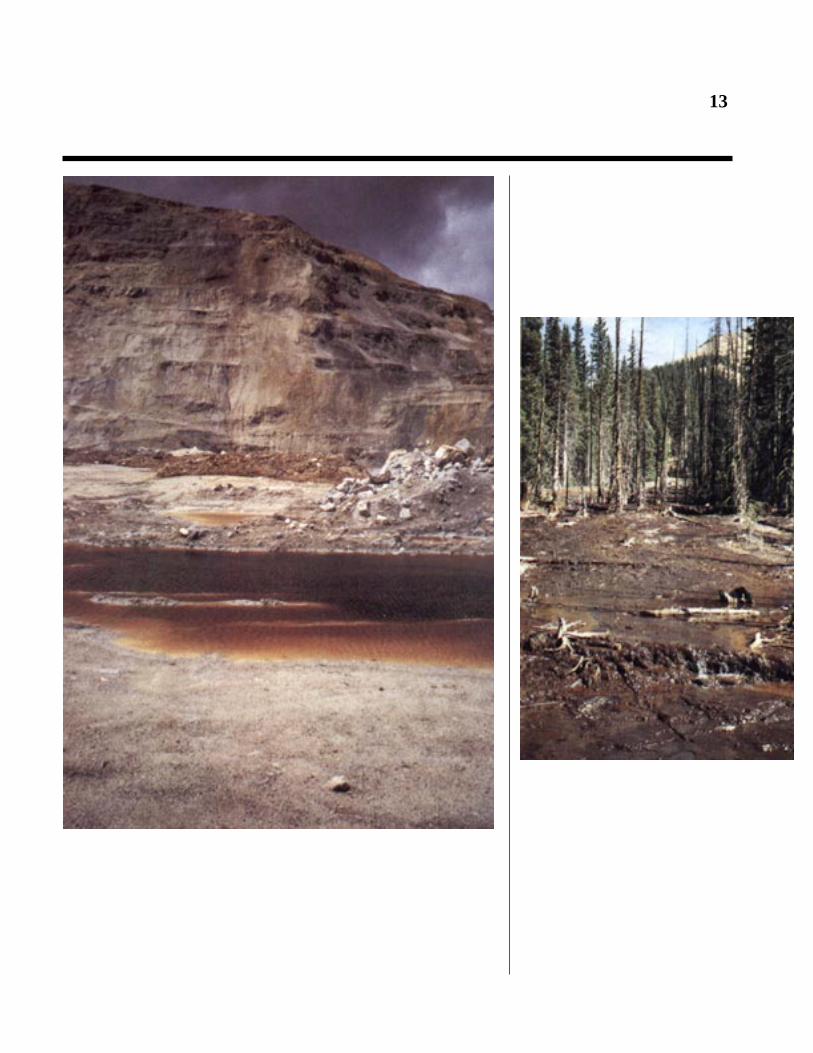
Summitville mine, June 1993. Photograph by Walt Ficklin.Page 13 (left): Dark-red metal-rich puddles at the Summitville mine, August 1993.
Photograph by Geoff Plumlee.Page 13 (right): Drainage from the Pass-Me-By mine, Iron Creek, south of the Summitville
mine, October 1991. Photograph by Geoff Plumlee.Page 14 (top): Unmined, mineralized area, Alum Creek basin, September 1994. Photograph
by Larry Gough.Page 14 (bottom): Geologist working in the Alum Creek area, September 1994. Photograph
by Larry Gough.Page 17: Summitville mine, October 1990. Photograph by Geoff Plumlee.Page 18 (top): Summitville mine, June 1993. Photograph by Geoff Plumlee.Page 18 (bottom): Terrace Reservoir on the Alamosa River downstream from the
Wightman Fork, June 1993. Photograph by Geoff Plumlee.Page 19 (top): Part of the gold boulder of Summitville; weight 132 troy pounds, estimated
to contain 26.4 troy pounds of gold. On display at the Denver Museum of NaturalHistory; reproduced with permission.
Page 19 (bottom): The gold boulder of Summitville, found October 3, 1975, by BobEllithorpe of Del Norte, Colorado. Donated to the Denver Museum of Natural History.Photograph by Ron Pochon, ASARCO; reproduced with permission from the DenverMuseum of Natural History.
Page 21: Natural iron bog in unmined, mineralized area on the Alamosa River above theconfluence with the Wightman Fork, 1991. Photograph by Geoff Plumlee.
Page 22: Unmined, mineralized area, Alum Creek basin, September 1994. Photograph byLarry Gough.

3838
Page 23 (top): Alamosa River below the confluence with the Wightman Fork, just aboveTerrace Reservoir, September 1994. Photograph by Larry Gough.
Page 23 (bottom left): Terrace Reservoir on the Alamosa River downstream from theWightman Fork, September 1994. Photograph by Larry Gough.
Page 23 (bottom right): Sign along the bank of Alum Creek, June 1993. Photograph byLarry Gough.
Page 24: Collecting samples in the Alamosa National Wildlife Refuge in the San LuisValley, June 1993. Photograph by Larry Gough.
Page 25: Unmined, mineralized area, Alum Creek basin, September 1994. Photograph byLarry Gough.
Page 27 (top): Alamosa River below the confluence with the Wightman Fork, just aboveTerrace Reservoir, September 1994. Photograph by Larry Gough.
Page 27 (bottom): Alum Creek basin, September 1994. Photograph by Larry Gough.Page 30: Old Terrace Main Canal in the San Luis Valley, August 1993. Photograph by
Geoff Plumlee.Page 32 (left): Collecting alfalfa samples in the San Luis Valley, June 1993. Photograph by
Kathy Smith.Page 32 (right): Data acquisition in an alfalfa field in the San Luis Valley, June 1993.
Photograph by Jim Erdman.Page 34: Alamosa National Wildlife Refuge in the San Luis Valley, June 1993. Photograph
by Larry Gough.Page 35: Open pit at the Summitville mine, August 1993. Photograph by Geoff Plumlee.Page 36: Ore chute at the old Summitville mine site, October 1975. Reproduced with
permission from the Denver Museum of Natural History.Page 38: Aerial view of the Summitville mine, August 1994. Photograph by IntraSearch;
reproduced with permission.