Summer Inst. Of Epidemiology and Biostatistics, 2010: Gene Expression Data Analysis 1:30pm –...
78
Summer Inst. Of Epidemiology and Biostatistics, 2010: Gene Expression Data Analysis 1:30pm – 5:00pm in Room W2015 Carlo Colantuoni [email protected] http://www.illuminatobiotech.com/GEA2010/GEA2010.htm
-
Upload
mitchell-davis -
Category
Documents
-
view
218 -
download
0
Transcript of Summer Inst. Of Epidemiology and Biostatistics, 2010: Gene Expression Data Analysis 1:30pm –...
Summer Inst. Of Epidemiology and Biostatistics, 2010:
Gene Expression Data Analysis
1:30pm – 5:00pm in Room W2015
Carlo [email protected]
http://www.illuminatobiotech.com/GEA2010/GEA2010.htm
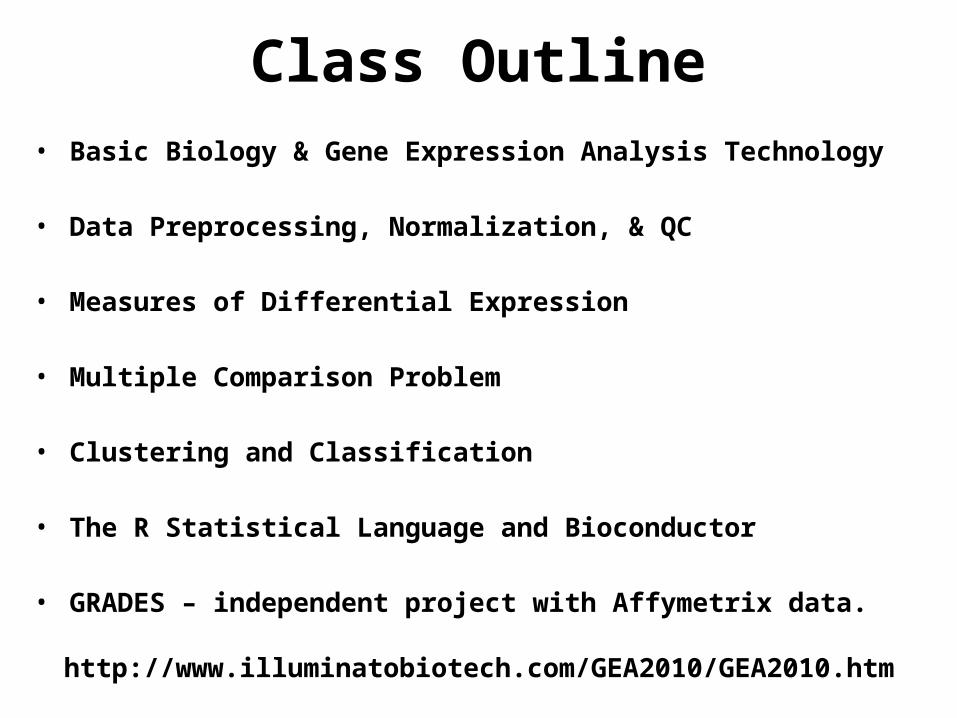
Class Outline• Basic Biology & Gene Expression Analysis Technology
• Data Preprocessing, Normalization, & QC
• Measures of Differential Expression
• Multiple Comparison Problem
• Clustering and Classification
• The R Statistical Language and Bioconductor
• GRADES – independent project with Affymetrix data.
http://www.illuminatobiotech.com/GEA2010/GEA2010.htm
Cla
ss O
utl
ine
- D
etai
led
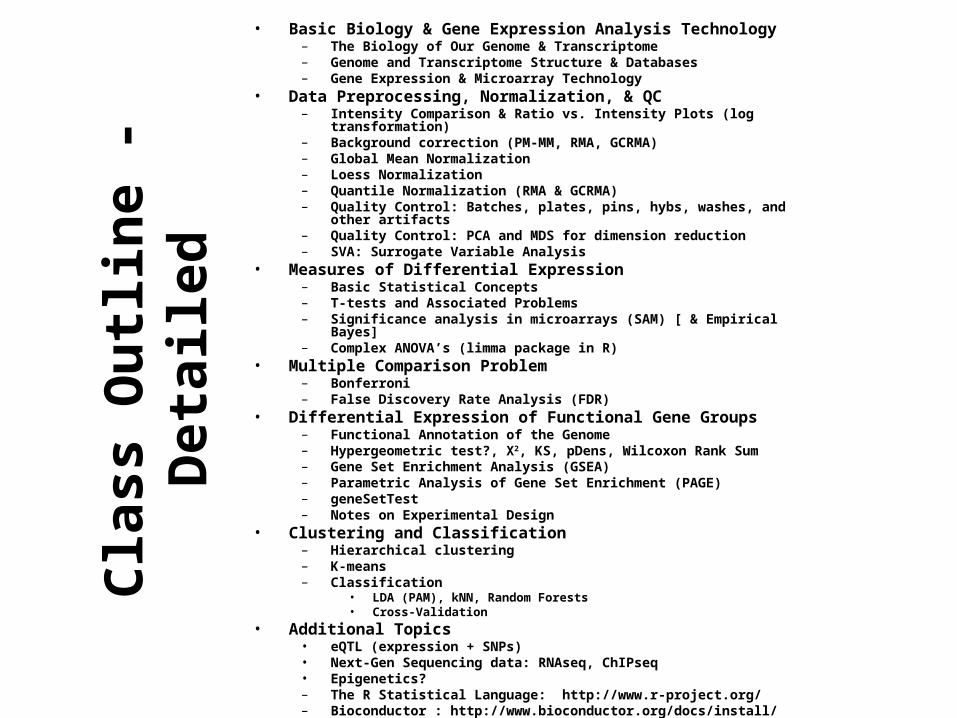
• Basic Biology & Gene Expression Analysis Technology– The Biology of Our Genome & Transcriptome– Genome and Transcriptome Structure & Databases– Gene Expression & Microarray Technology
• Data Preprocessing, Normalization, & QC– Intensity Comparison & Ratio vs. Intensity Plots (log transformation)– Background correction (PM-MM, RMA, GCRMA)– Global Mean Normalization– Loess Normalization– Quantile Normalization (RMA & GCRMA)– Quality Control: Batches, plates, pins, hybs, washes, and other artifacts– Quality Control: PCA and MDS for dimension reduction– SVA: Surrogate Variable Analysis
• Measures of Differential Expression– Basic Statistical Concepts– T-tests and Associated Problems– Significance analysis in microarrays (SAM) [ & Empirical Bayes]– Complex ANOVA’s (limma package in R)
• Multiple Comparison Problem– Bonferroni– False Discovery Rate Analysis (FDR)
• Differential Expression of Functional Gene Groups– Functional Annotation of the Genome– Hypergeometric test?, Χ2, KS, pDens, Wilcoxon Rank Sum– Gene Set Enrichment Analysis (GSEA)– Parametric Analysis of Gene Set Enrichment (PAGE)– geneSetTest– Notes on Experimental Design
• Clustering and Classification– Hierarchical clustering– K-means– Classification
• LDA (PAM), kNN, Random Forests• Cross-Validation
• Additional Topics• eQTL (expression + SNPs)• Next-Gen Sequencing data: RNAseq, ChIPseq• Epigenetics?– The R Statistical Language: http://www.r-project.org/– Bioconductor : http://www.bioconductor.org/docs/install/– Affymetrix data processing example
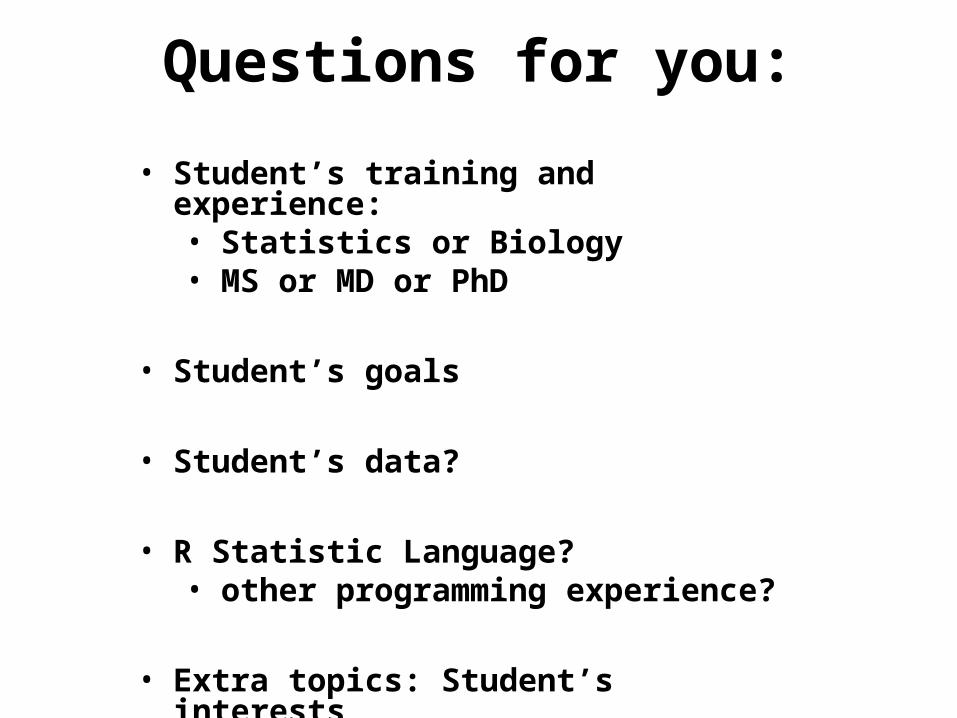
Questions for you:
• Student’s training and experience:• Statistics or Biology• MS or MD or PhD
• Student’s goals
• Student’s data?
• R Statistic Language?• other programming experience?
• Extra topics: Student’s interests
DAY #1:DAY #1:
Genome BiologyGenome Biology
The TranscriptomeThe Transcriptome
Microarray TechnologyMicroarray Technology
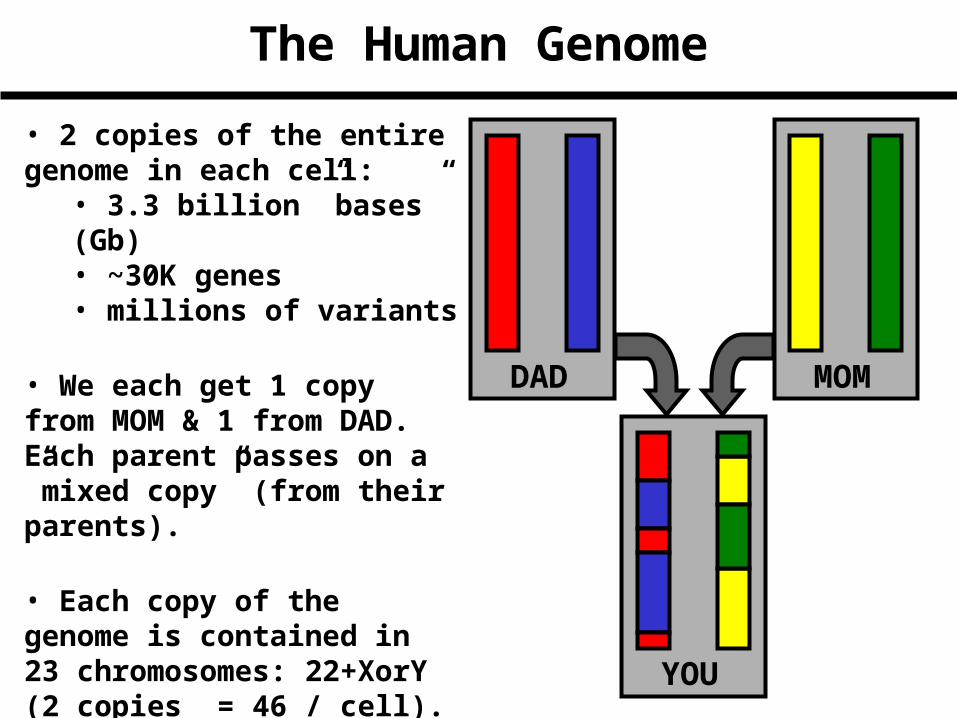
The Human Genome
DAD MOM
YOU
• 2 copies of the entire genome in each cell:
• 3.3 billion ”bases” (Gb)• ~30K genes• millions of variants
• We each get 1 copy from MOM & 1 from DAD. Each parent passes on a ”mixed copy” (from their parents).
• Each copy of the genome is contained in 23 chromosomes: 22+XorY (2 copies = 46 / cell).
• All in DNA!
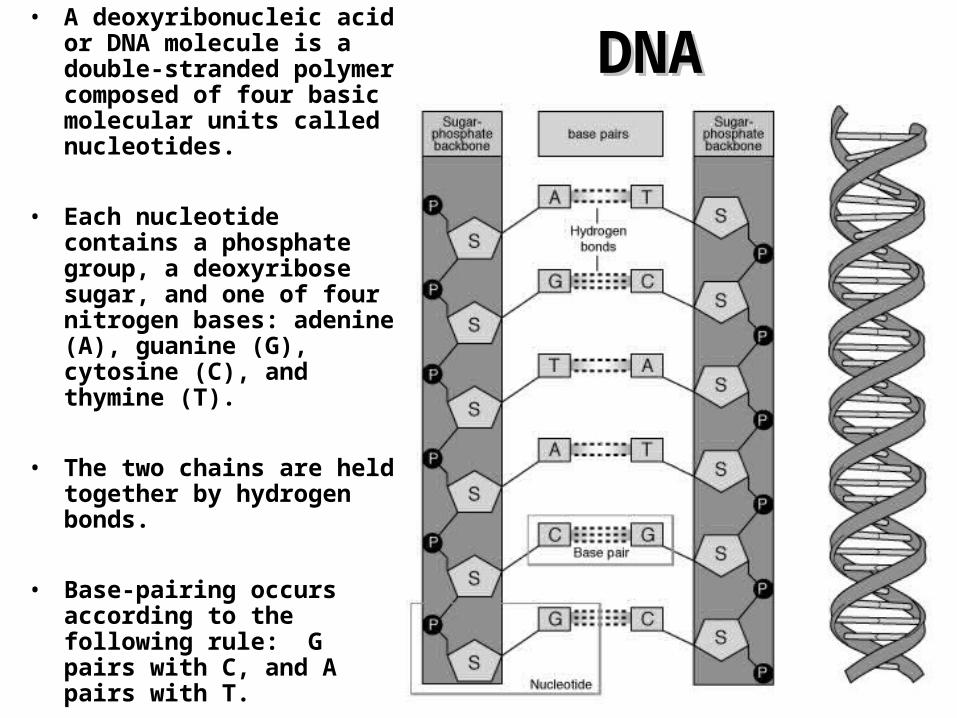
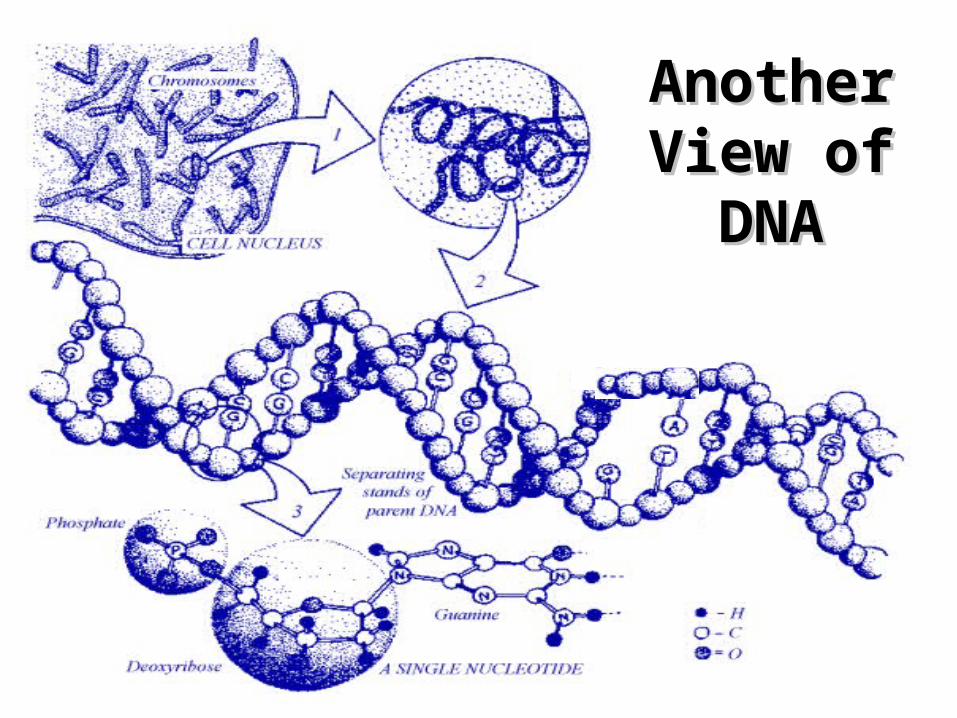
DNADNA• A deoxyribonucleic acid or
DNA molecule is a double-stranded polymer composed of four basic molecular units called nucleotides.
• Each nucleotide contains a phosphate group, a deoxyribose sugar, and one of four nitrogen bases: adenine (A), guanine (G), cytosine (C), and thymine (T).
• The two chains are held together by hydrogen bonds.
• Base-pairing occurs according to the following rule: G pairs with C, and A pairs with T.
• Directionality & Complementarity: Reverse Complements hybridize.
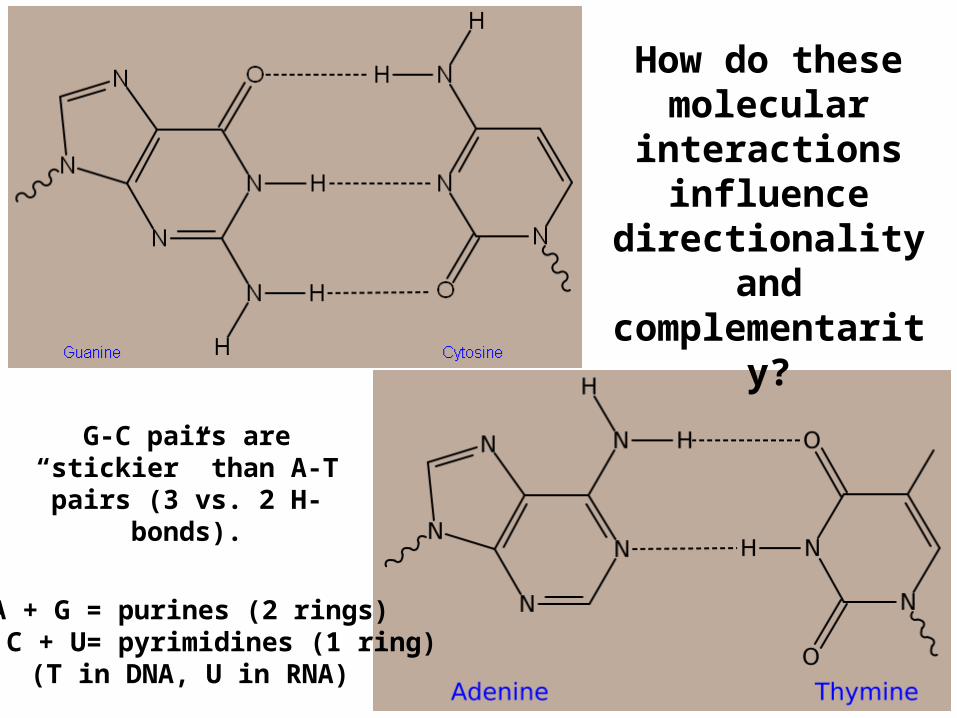
How do these molecular
interactions influence
directionality and complementarity?
G-C pairs are “stickier” than A-T pairs (3 vs. 2 H-
bonds).
A + G = purines (2 rings)T + C + U= pyrimidines (1 ring)
(T in DNA, U in RNA)
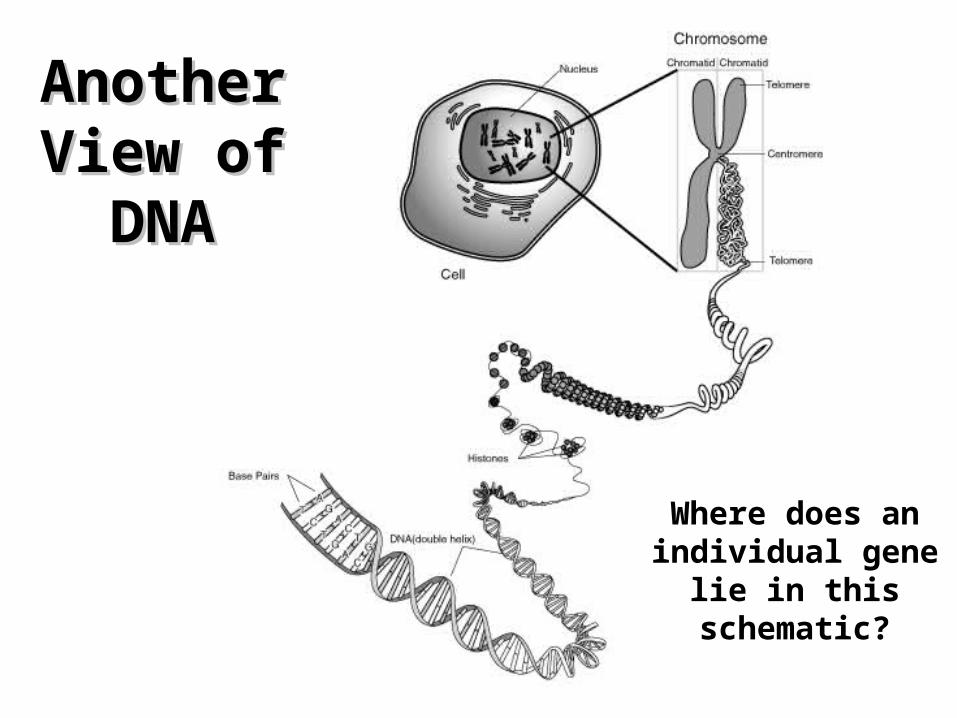
Another Another View of View of
DNADNA
Where does an individual gene lie in this schematic?
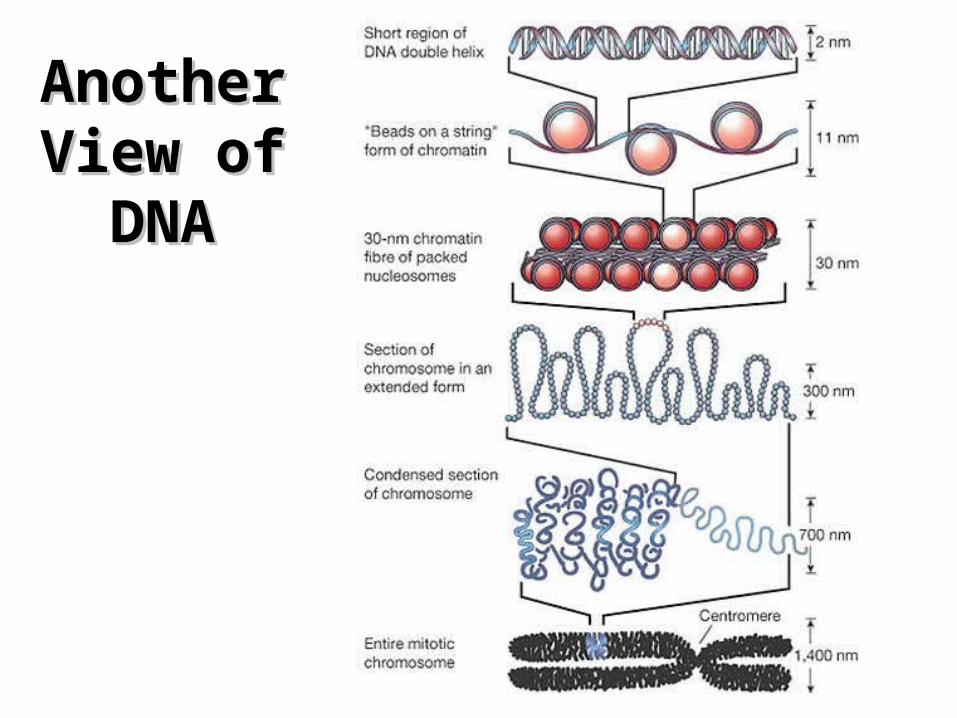
Another Another View of View of
DNADNA
Another Another View of View of
DNADNA
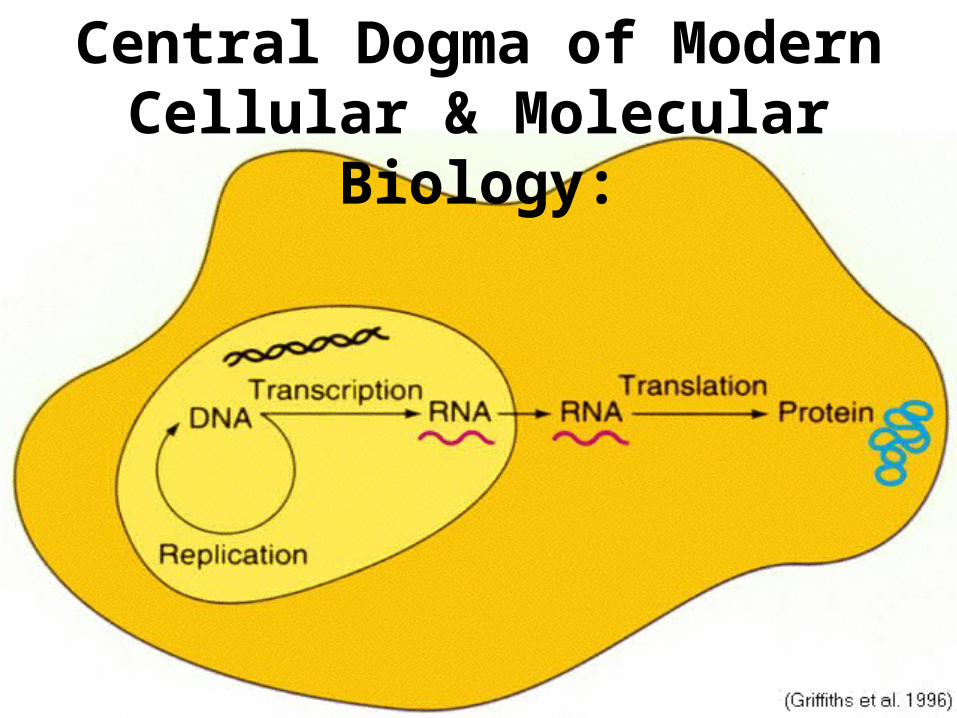
Central Dogma of Modern Cellular & Molecular Biology:
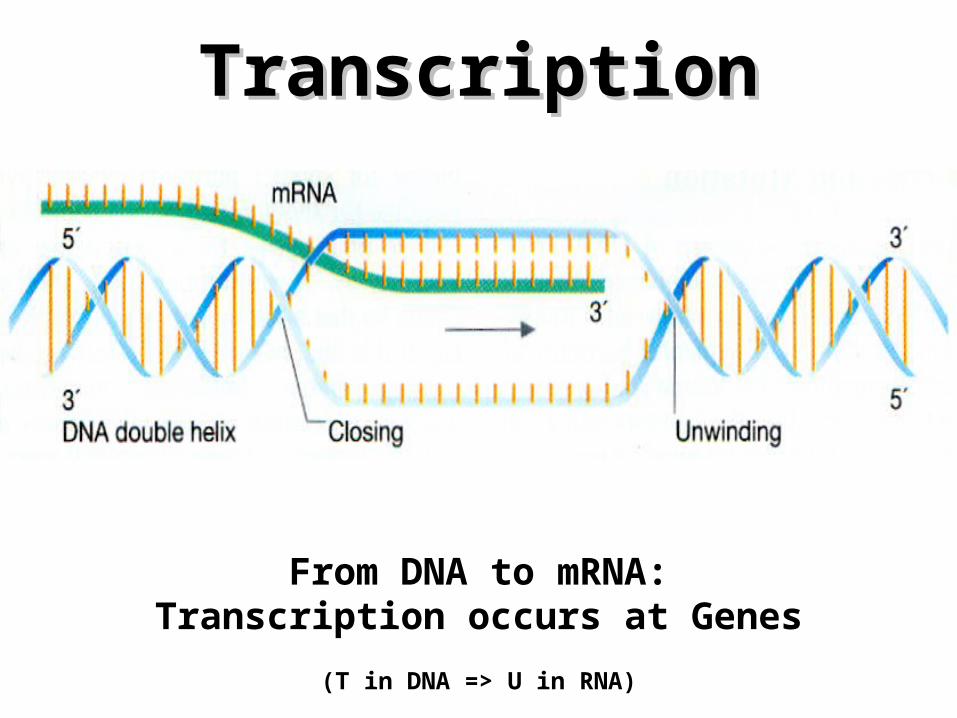
TranscriptionTranscription
From DNA to mRNA:Transcription occurs at Genes
(T in DNA => U in RNA)
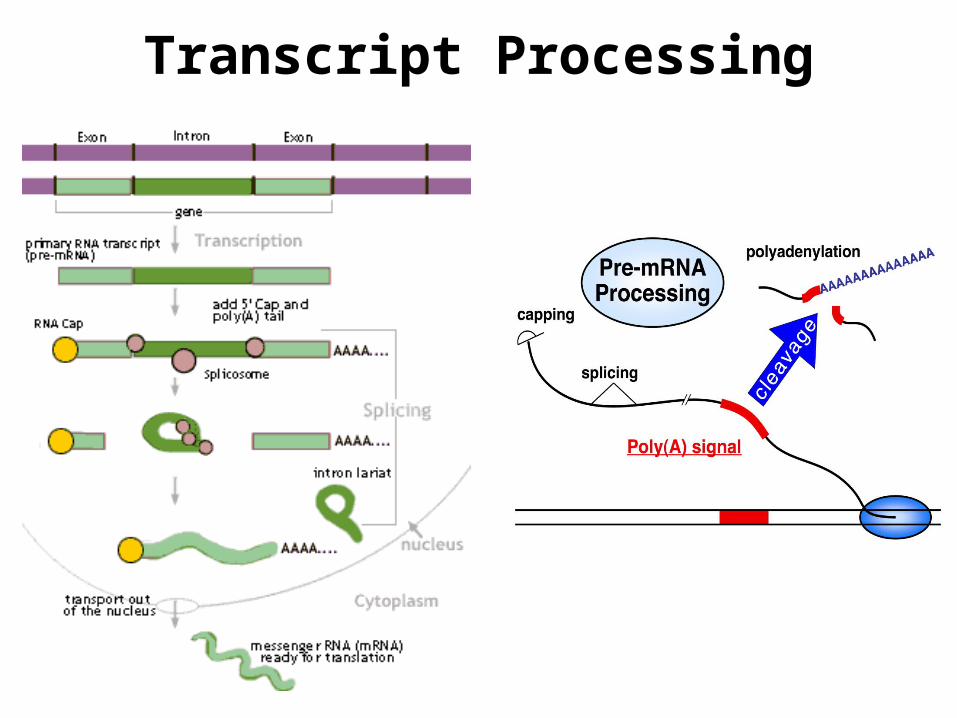
Transcript Processing
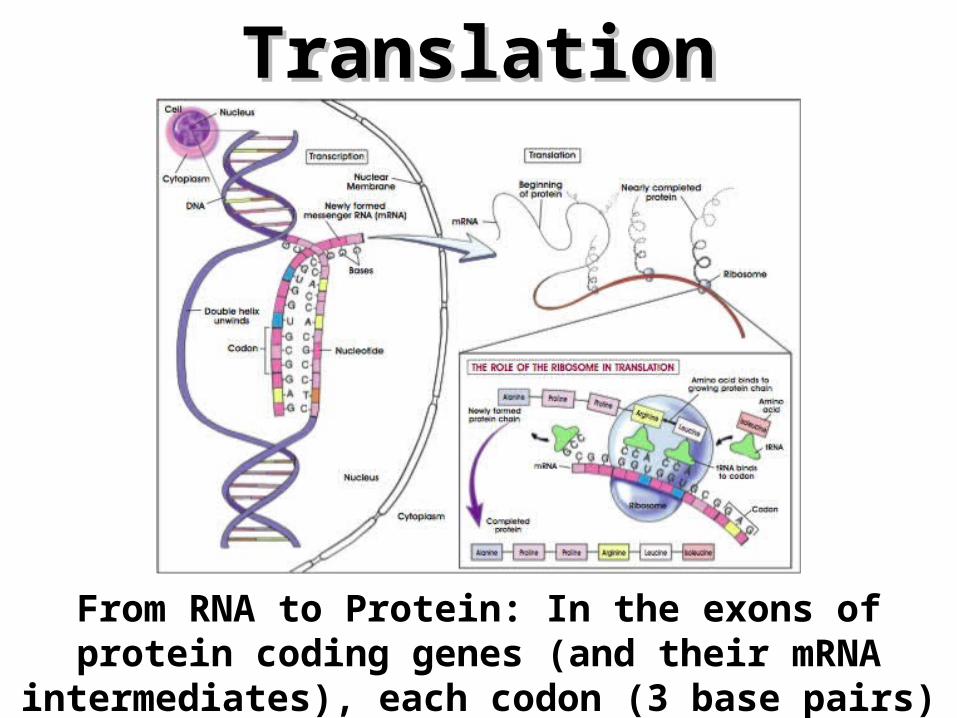
TranslationTranslation
From RNA to Protein: In the exons of protein coding genes (and their mRNA intermediates), each codon (3 base pairs) encodes 1 amino acid in the protein.
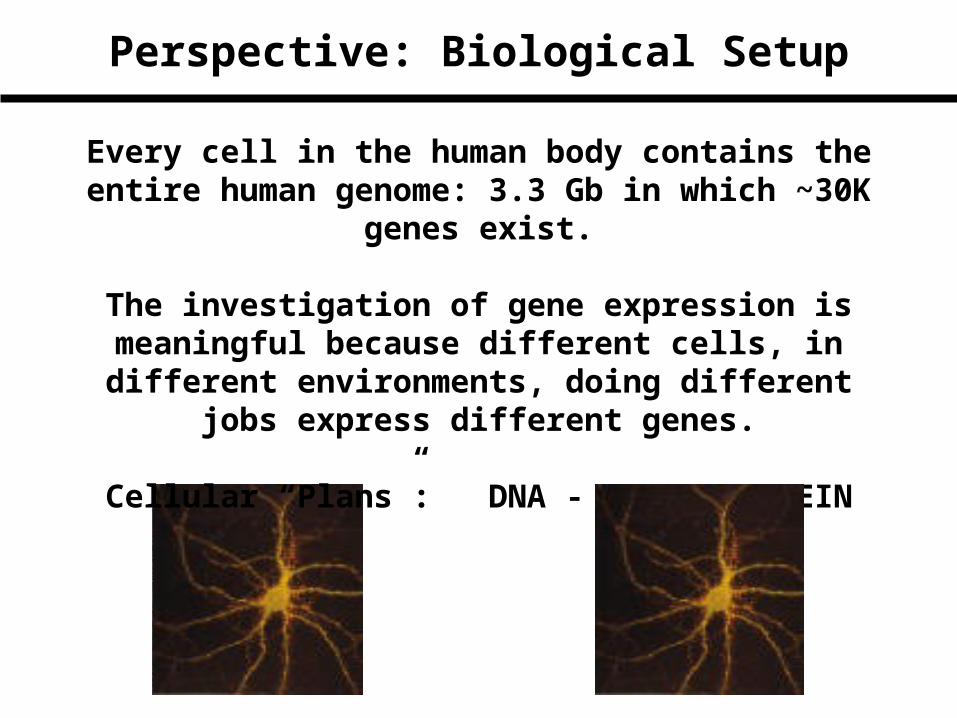
Perspective: Biological Setup
Every cell in the human body contains the entire human genome: 3.3 Gb in which ~30K genes exist.
The investigation of gene expression is meaningful because different cells, in different environments,
doing different jobs express different genes.
Cellular “Plans”: DNA - RNA - PROTEIN
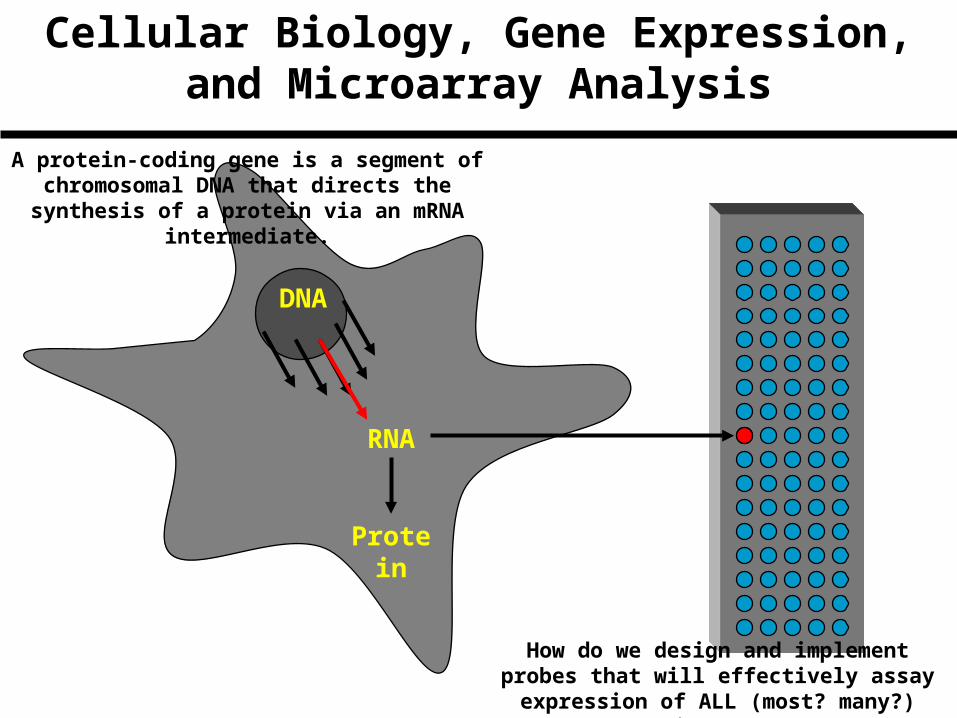
Cellular Biology, Gene Expression, and Microarray Analysis
DNA
RNA
Protein
A protein-coding gene is a segment of chromosomal DNA that directs the synthesis
of a protein via an mRNA intermediate.
How do we design and implement probes that will effectively assay expression of ALL
(most? many?) genes simultaneously.
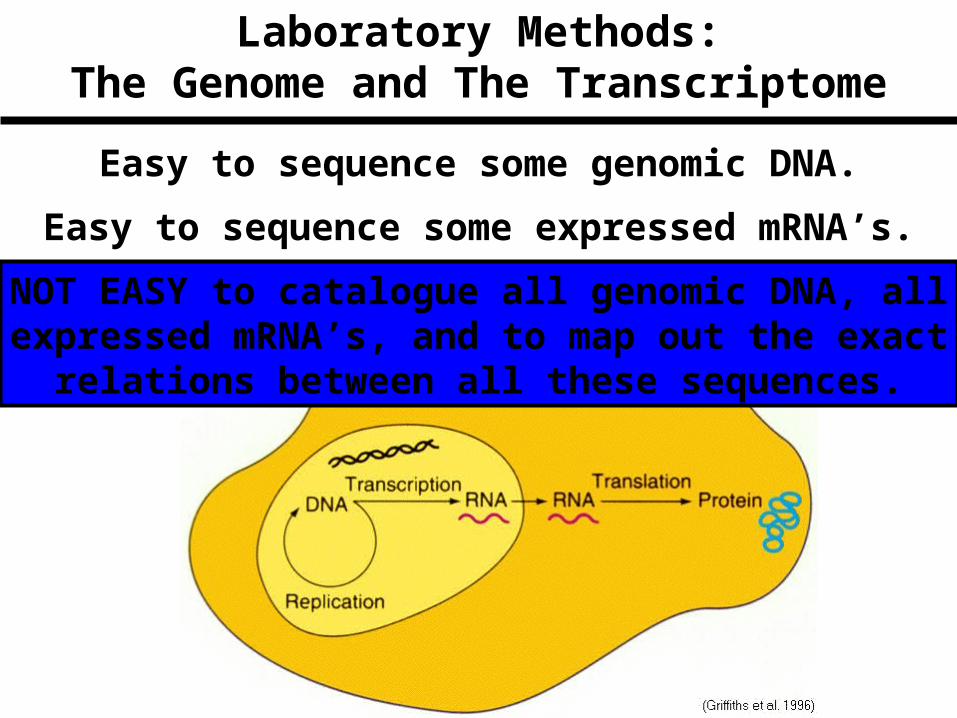
Easy to sequence some genomic DNA.
Laboratory Methods:The Genome and The Transcriptome
Easy to sequence some expressed mRNA’s.
NOT EASY to catalogue all genomic DNA, all expressed mRNA’s, and to map out the exact
relations between all these sequences.
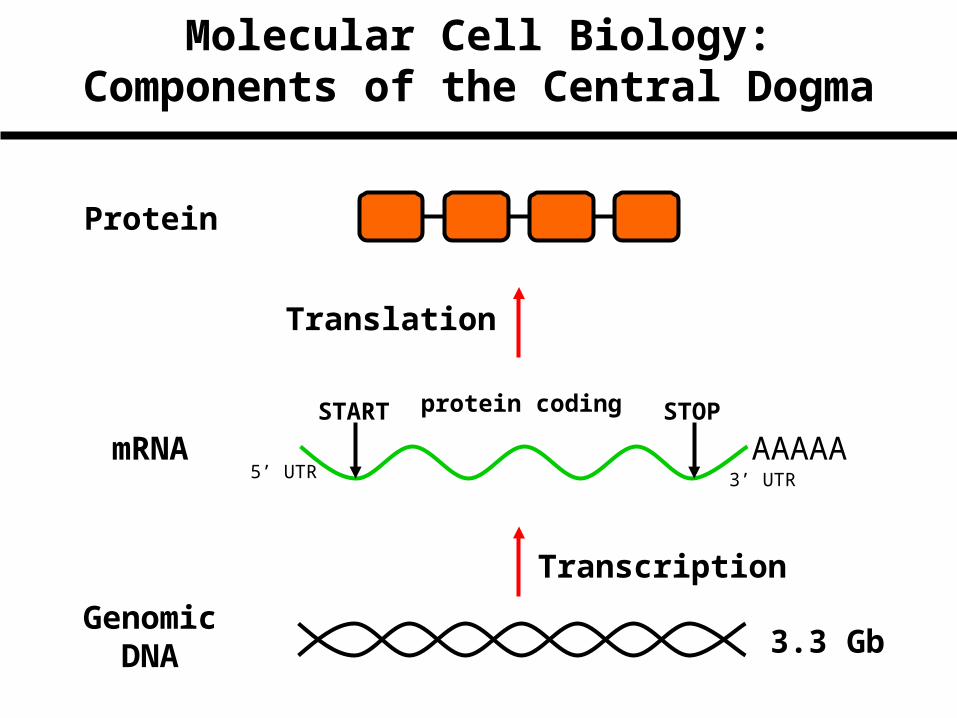
AAAAASTART STOPprotein coding
5’ UTR 3’ UTR
mRNA
GenomicDNA 3.3 Gb
Protein
Molecular Cell Biology:Components of the Central Dogma
Transcription
Translation

AAAAA
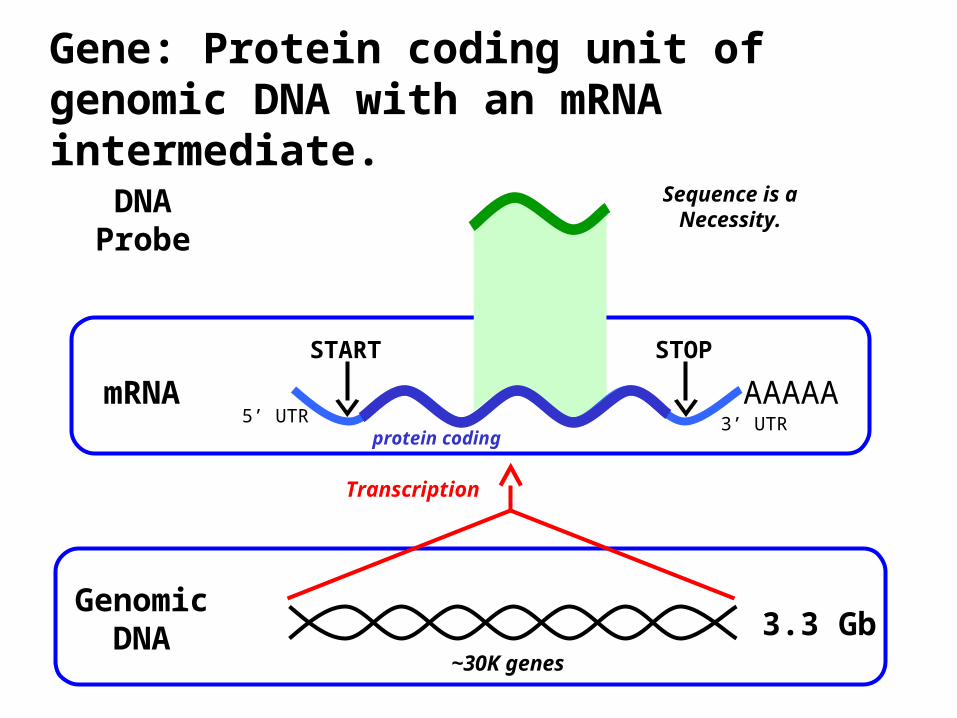
Gene: Protein coding unit of genomic DNA with an mRNA intermediate.
START STOP
protein coding5’ UTR 3’ UTR
mRNA
GenomicDNA 3.3 Gb
DNAProbe
~30K genes
Sequence is a Necessity.
Transcription
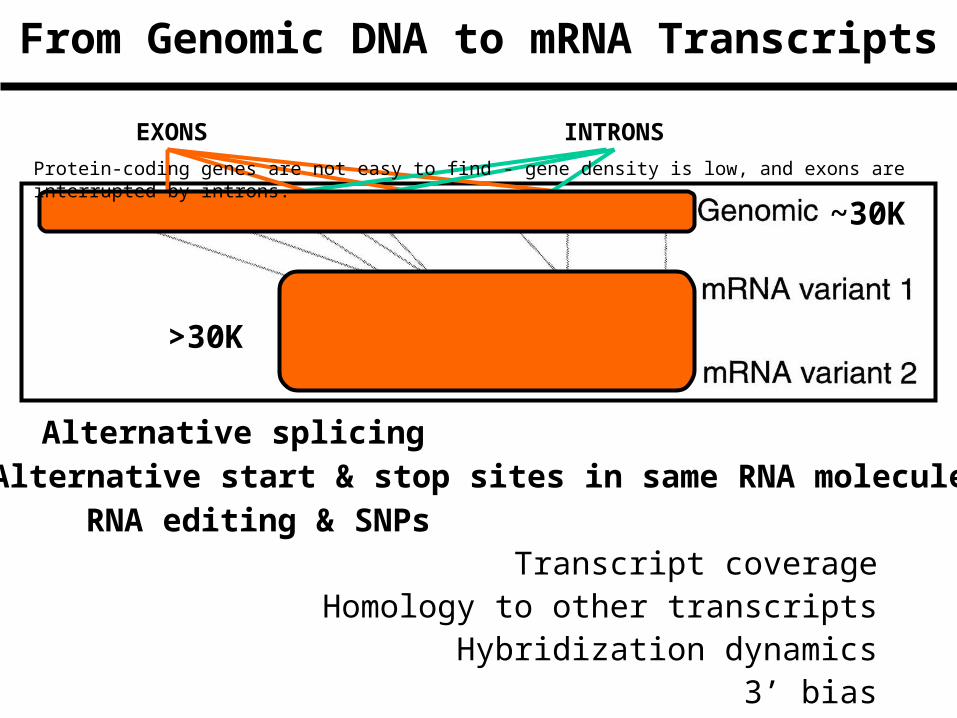
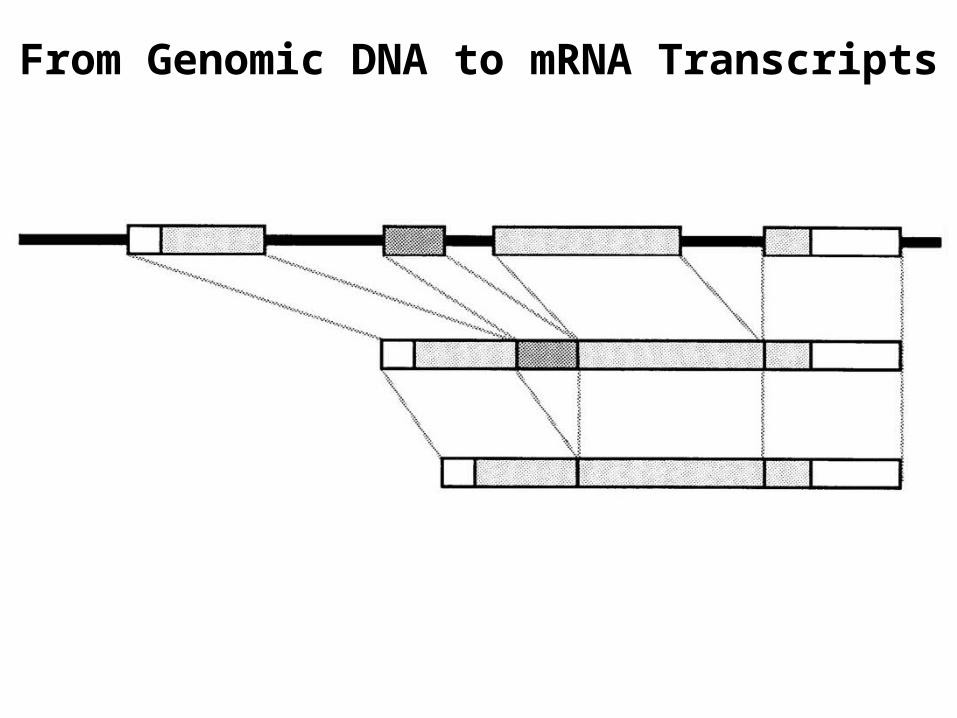
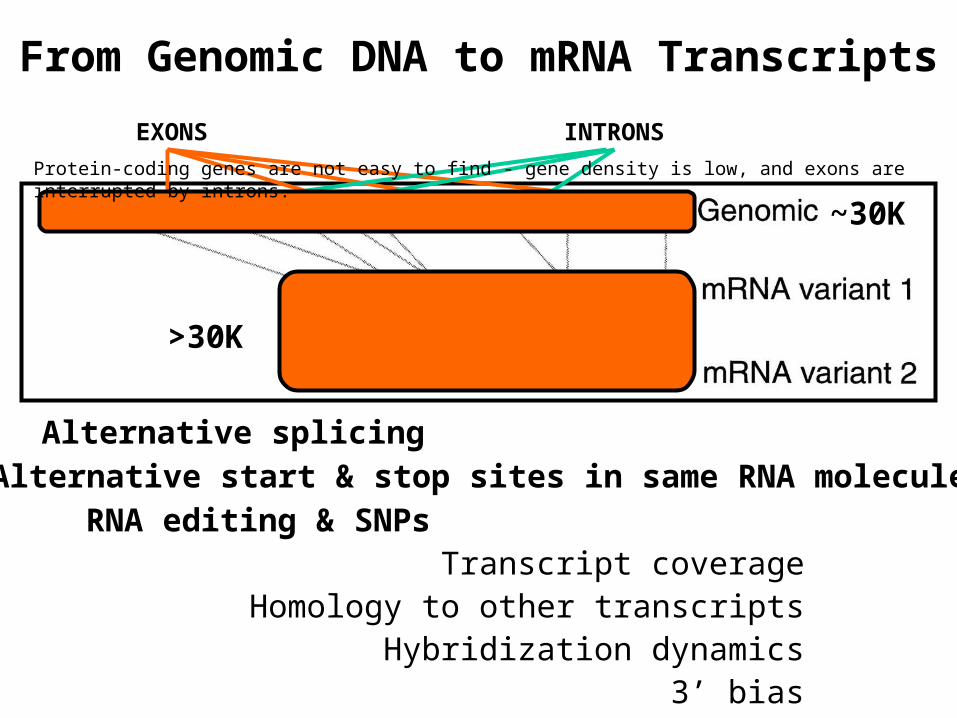
From Genomic DNA to mRNA Transcripts
EXONS INTRONS
RNA editing & SNPs
Alternative splicingAlternative start & stop sites in same RNA molecule
~30K
>30K
Transcript coverage Homology to other transcripts
Hybridization dynamics 3’ bias
Protein-coding genes are not easy to find - gene density is low, and exons are interrupted by introns.
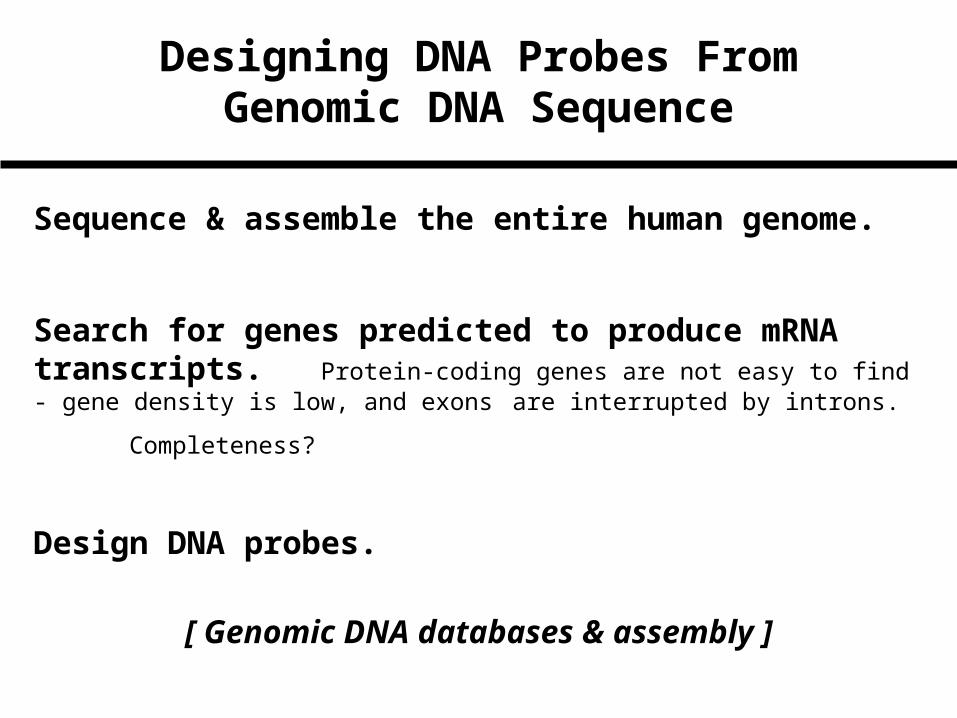
Designing DNA Probes From Genomic DNA Sequence
Sequence & assemble the entire human genome.
Search for genes predicted to produce mRNA transcripts. Protein-coding genes are not easy to find - gene density is low, and exons are interrupted by introns.
Completeness?
Design DNA probes.
[ Genomic DNA databases & assembly ]
Designing DNA Probes From mRNA Sequences
Sequence ALL expressed mRNA molecules.
Completeness?
Design DNA probes.
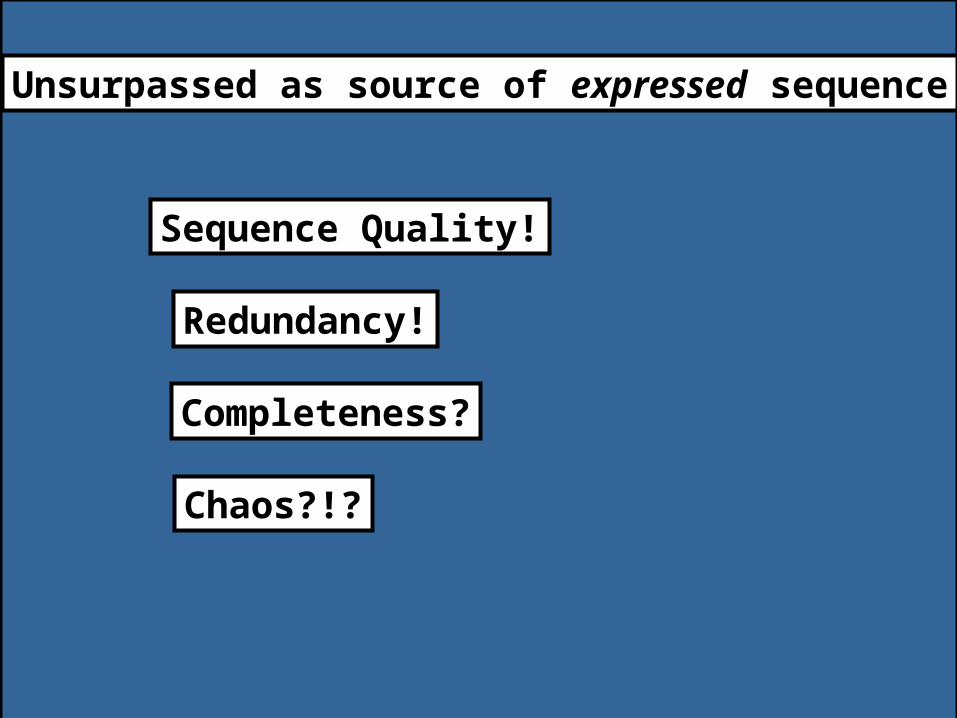
Sequence Quality!
Redundancy!
Completeness?
Unsurpassed as source of expressed sequence
Chaos?!?
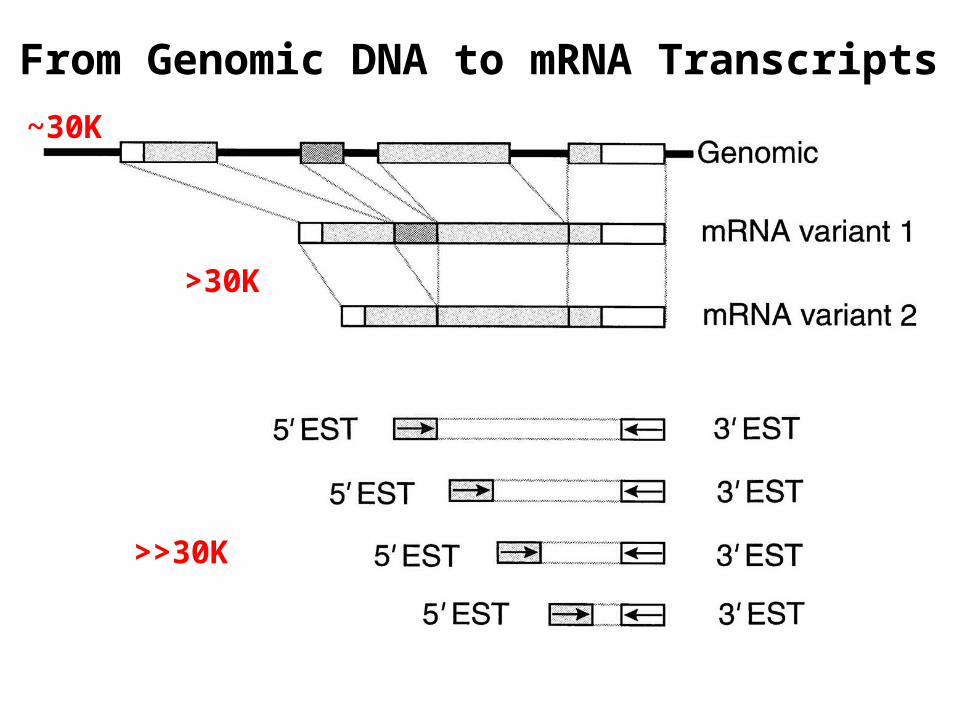
From Genomic DNA to mRNA Transcripts
~30K
>30K
>>30K
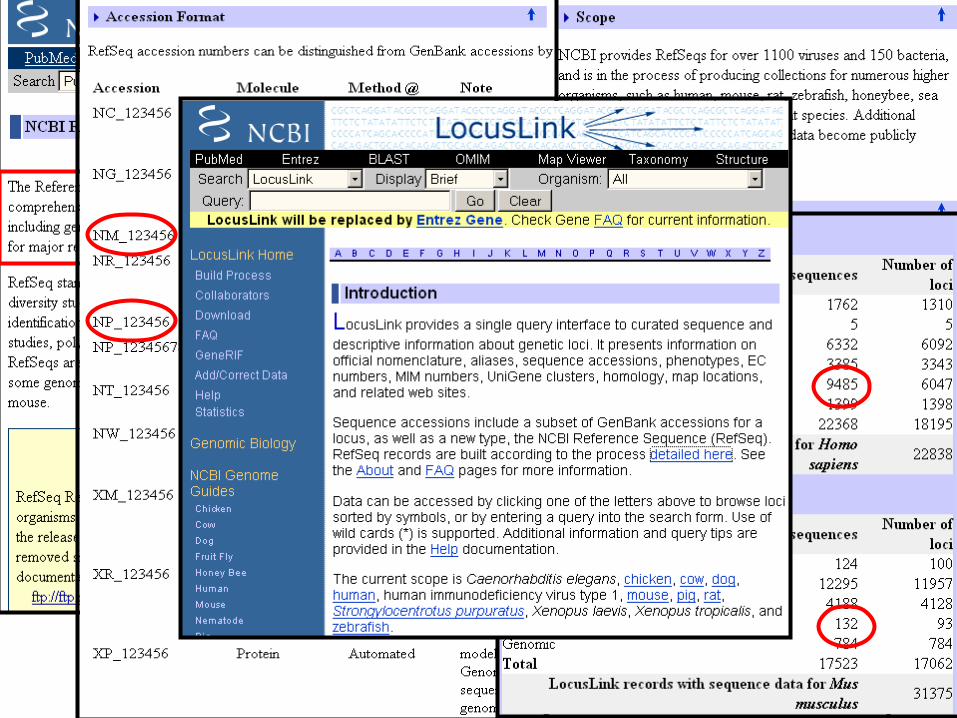
Transcript-BasedGene-Centered Information
From Genomic DNA to mRNA Transcripts

From Genomic DNA to mRNA Transcripts

DAY #1:DAY #1:
Genome BiologyGenome Biology
The TranscriptomeThe Transcriptome
Microarray TechnologyMicroarray Technology
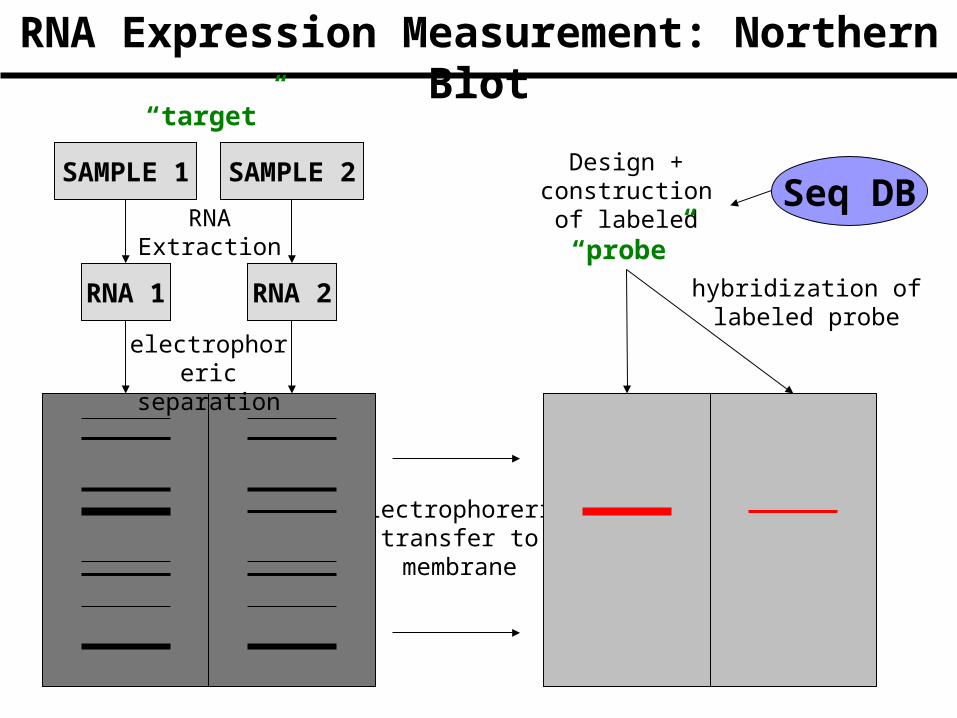
RNA Expression Measurement: Northern Blot
SAMPLE 1 SAMPLE 2
RNA 1 RNA 2
RNAExtraction
electrophoreric transfer to membrane
hybridization of labeled probe
electrophoreric separation
Design + construction of
labeled “probe”Seq DB
“target”
SEQUENCE knowledge is REQUIRED for BOTH!
MicroarrayNorthern
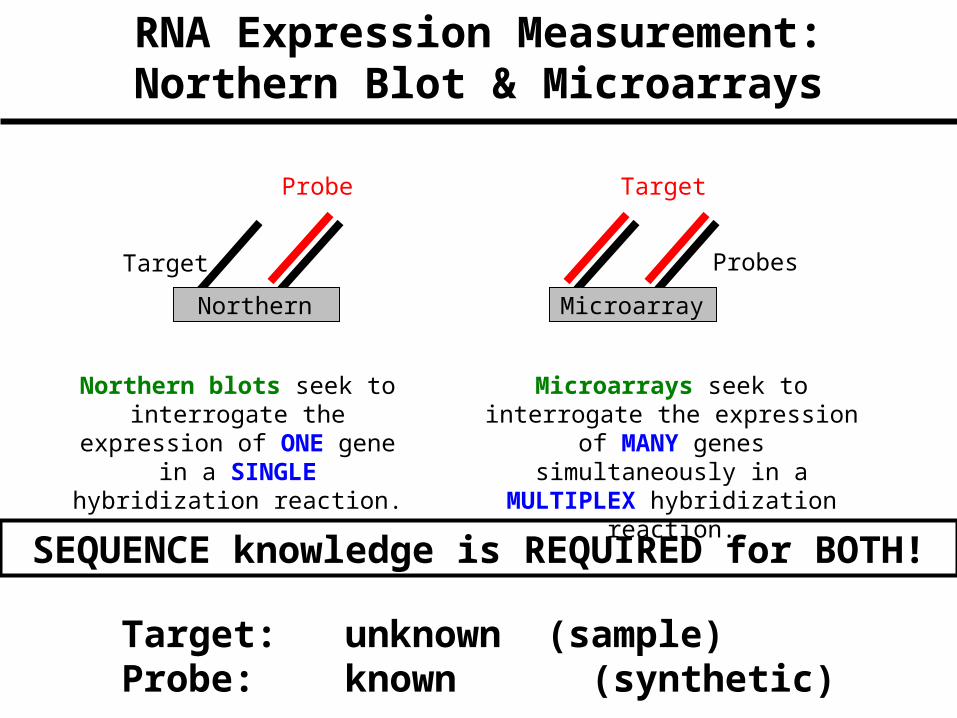
Target: unknown (sample)Probe: known (synthetic)
Target
Probe
Northern blots seek to interrogate the expression of
ONE gene in a SINGLE hybridization reaction.
Target
Probes
RNA Expression Measurement:Northern Blot & Microarrays
Microarrays seek to interrogate the expression of MANY genes
simultaneously in a MULTIPLEX hybridization reaction.
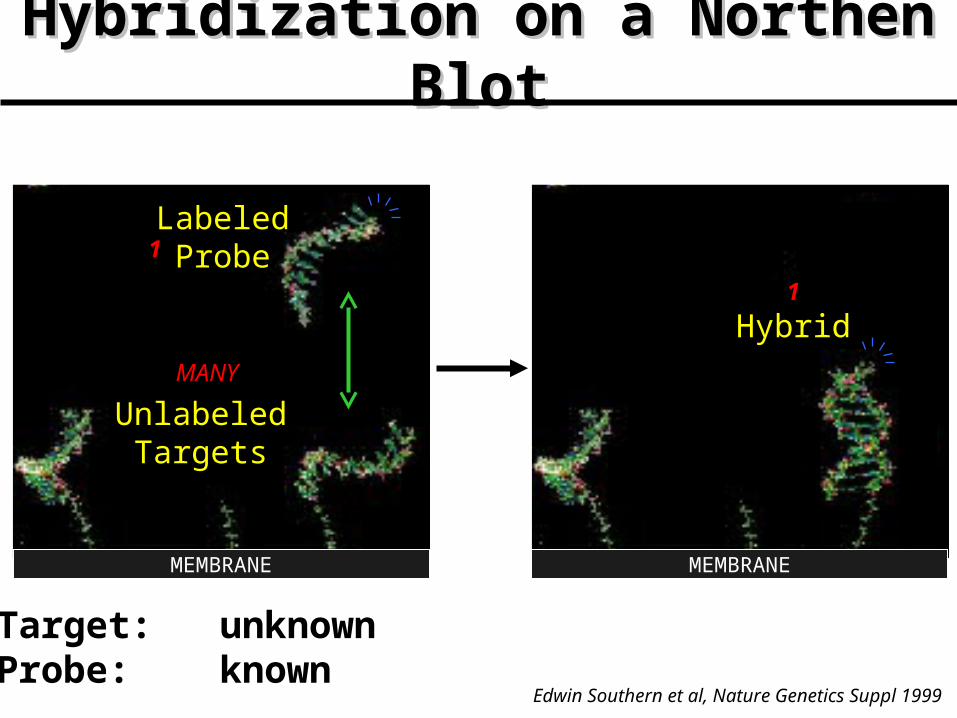
Hybridization on a Northen BlotHybridization on a Northen Blot
Labeled Probe
Unlabeled Targets
1
MANY
Hybrid
MEMBRANE MEMBRANE
1
Target: unknownProbe: known
Edwin Southern et al, Nature Genetics Suppl 1999
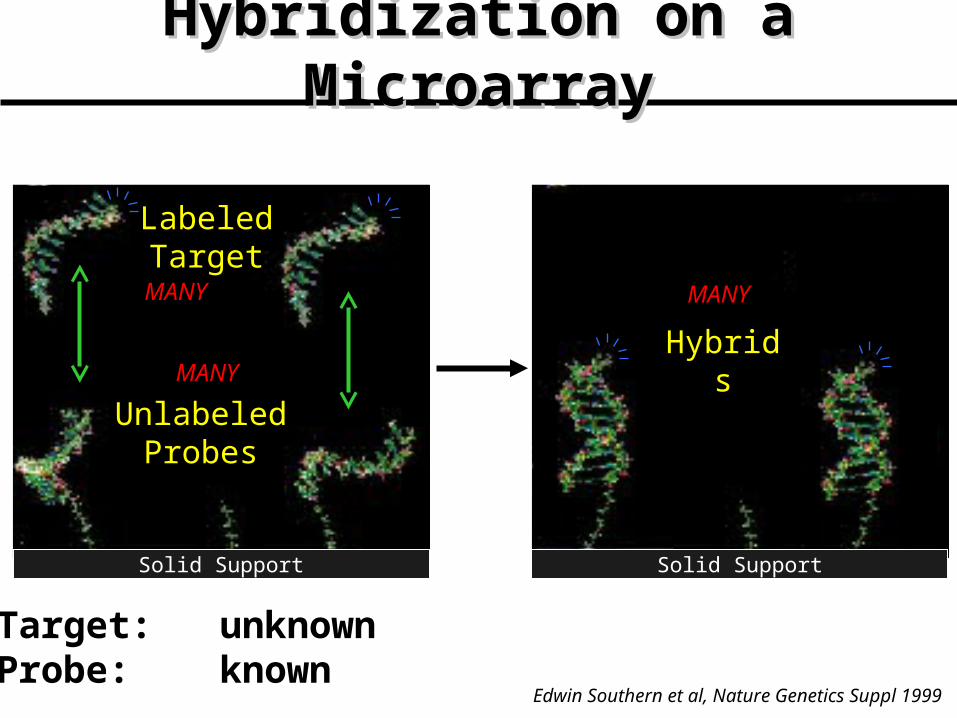
Labeled Target
Unlabeled Probes
MANY
Solid Support Solid Support
Hybridization on a MicroarrayHybridization on a Microarray
MANY MANY
Hybrids
Target: unknownProbe: known
Edwin Southern et al, Nature Genetics Suppl 1999
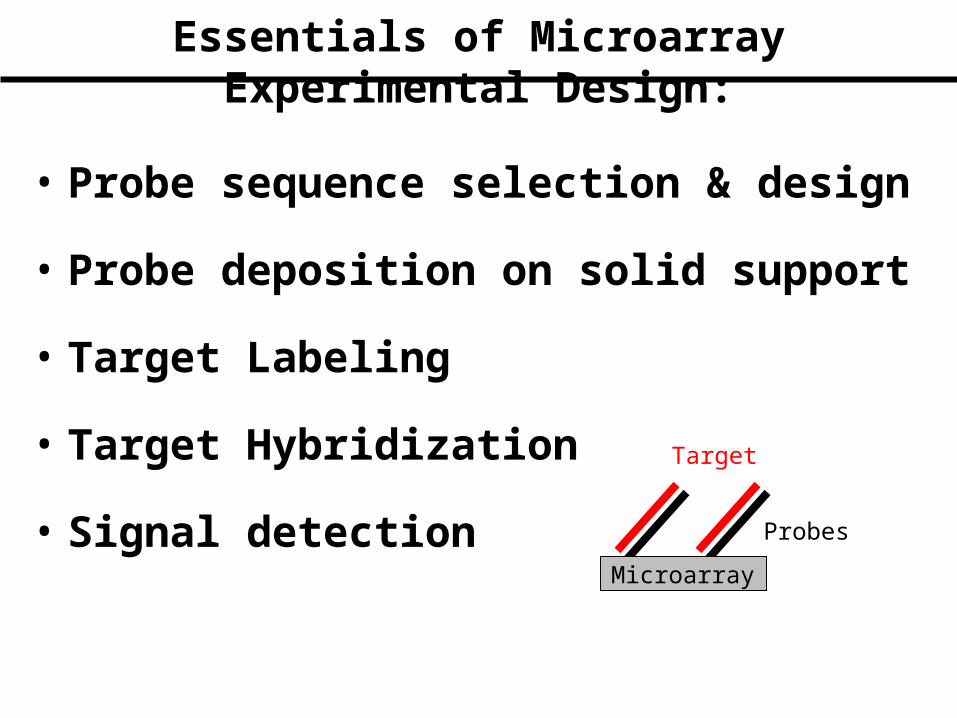
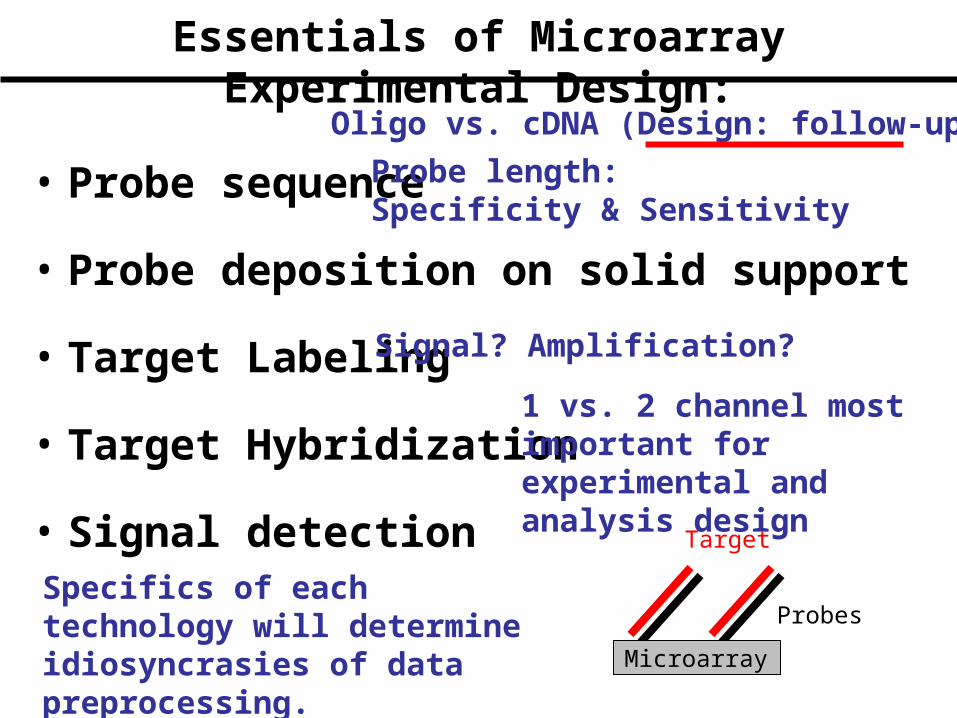
Essentials of Microarray Experimental Design:
• Probe sequence selection & design
• Probe deposition on solid support
• Target Labeling
• Target Hybridization
• Signal detectionMicroarray
Target
Probes
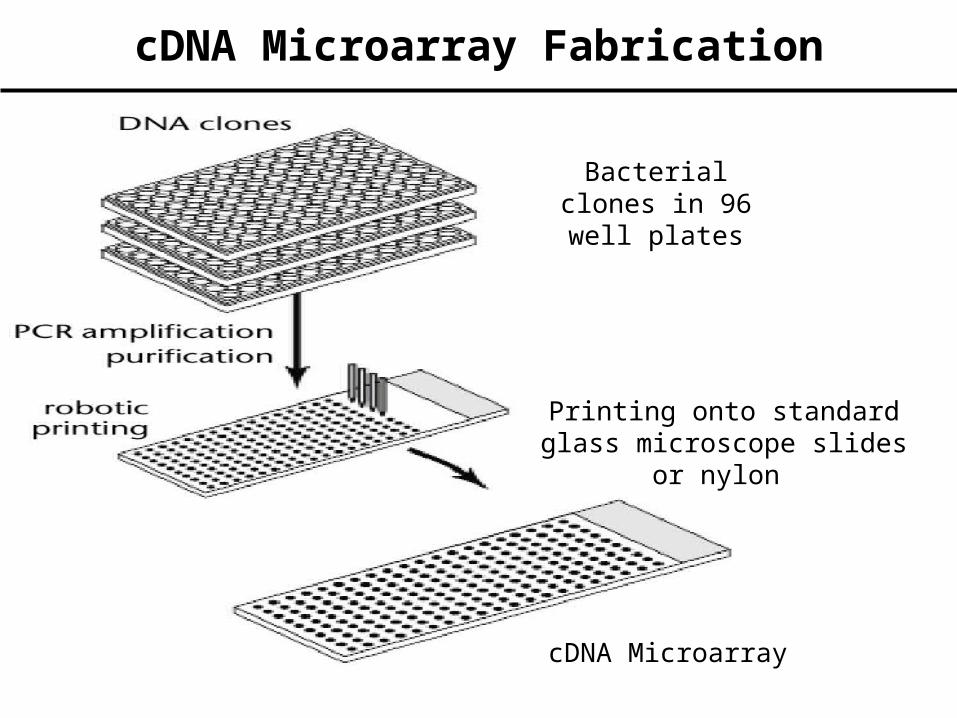
cDNA Microarray Fabrication
cDNA Microarray
Printing onto standard glass microscope slides or nylon
Bacterial clones in 96 well plates
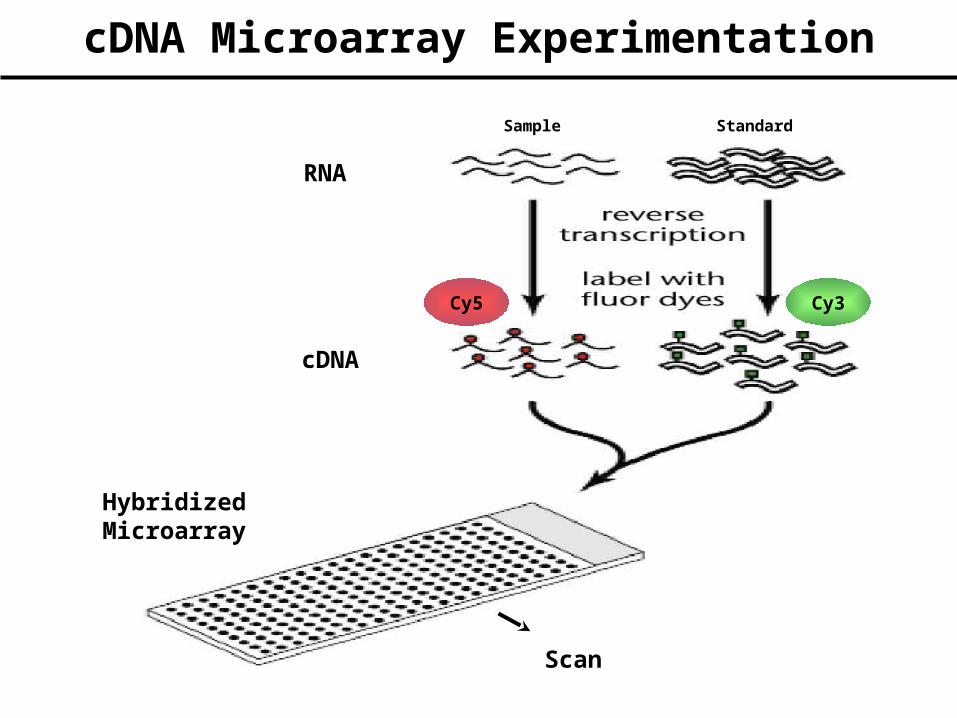
cDNA Microarray Experimentation
Sample Standard
RNA
cDNA
HybridizedMicroarray
Scan
Cy5 Cy3
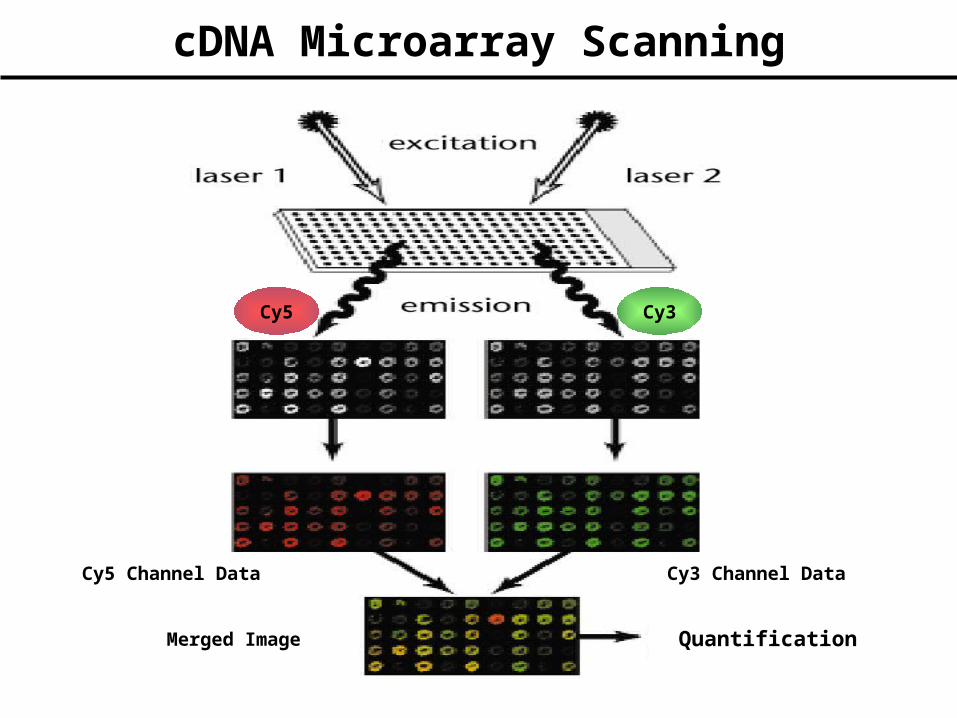
cDNA Microarray Scanning
Cy5 Cy3
Merged Image
Cy3 Channel DataCy5 Channel Data
Quantification
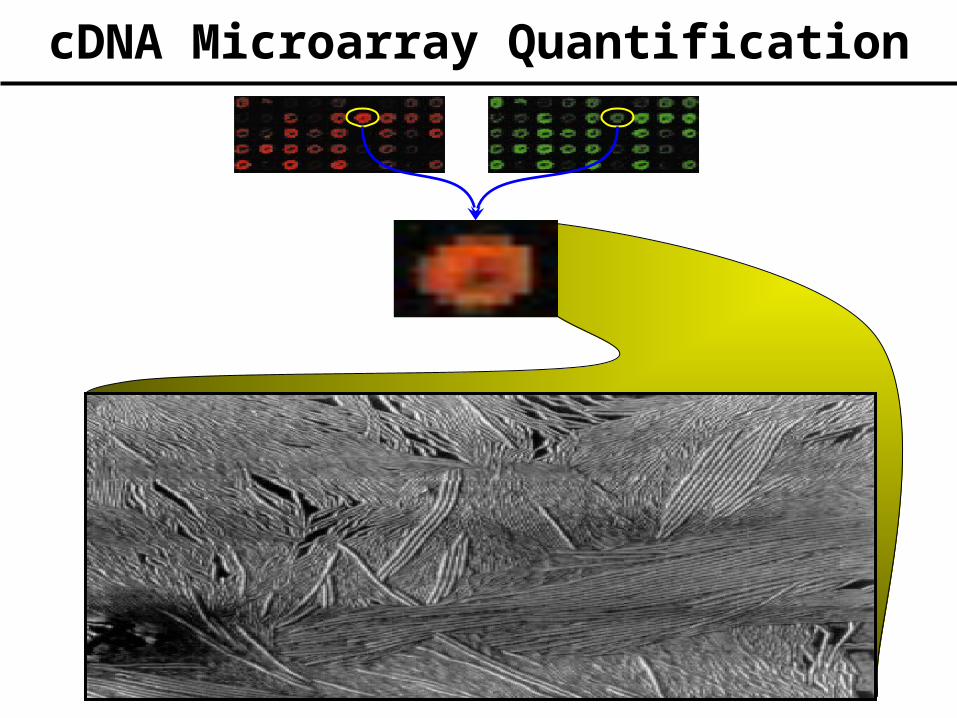
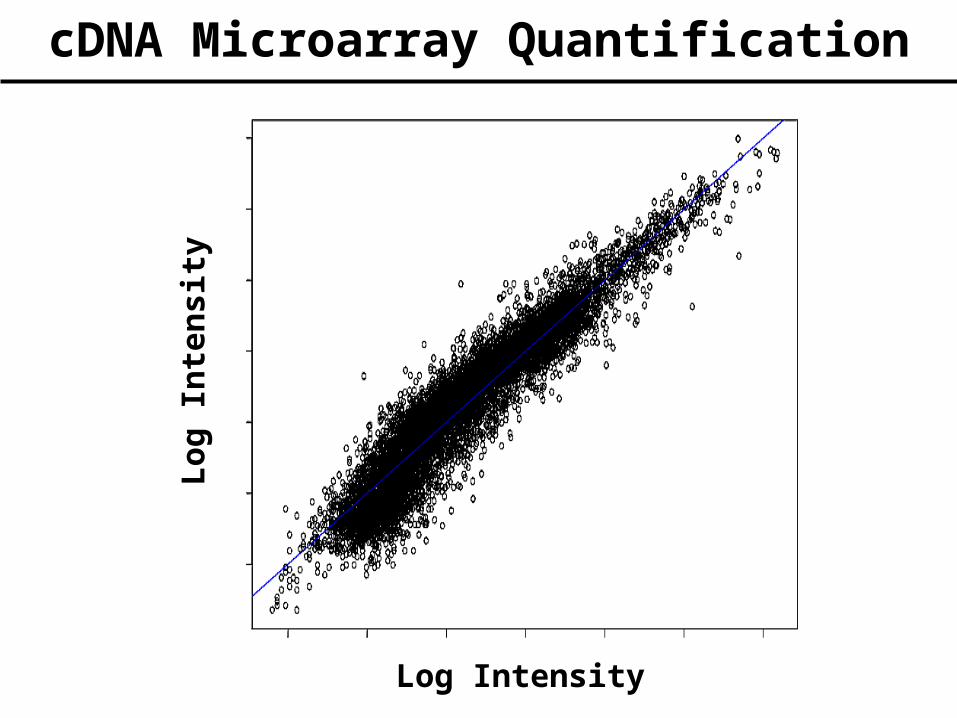
cDNA Microarray Quantification
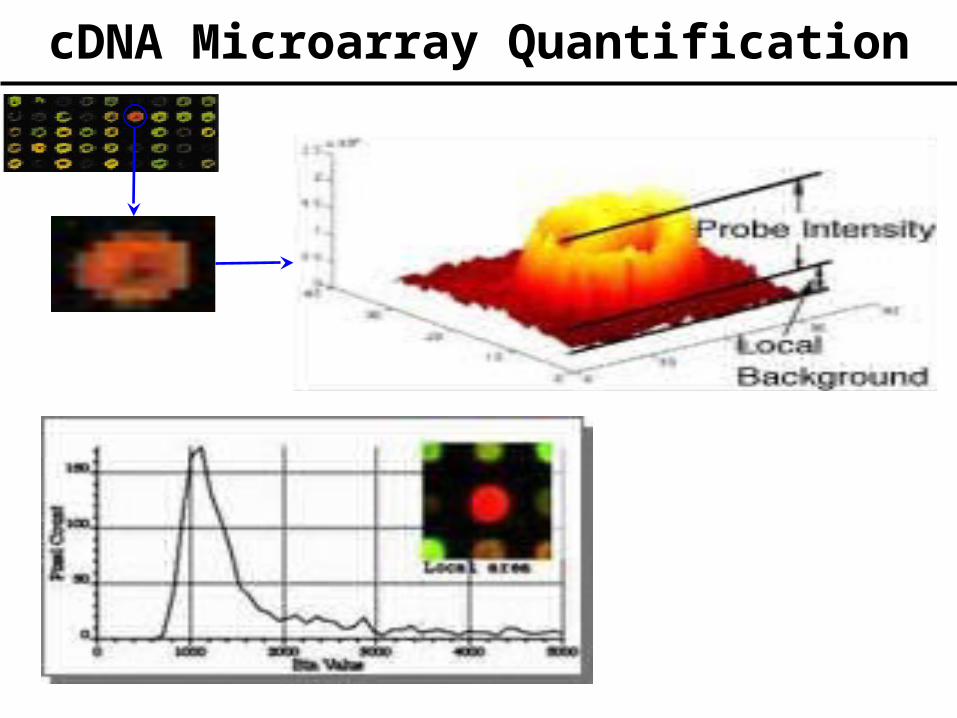
cDNA Microarray Quantification
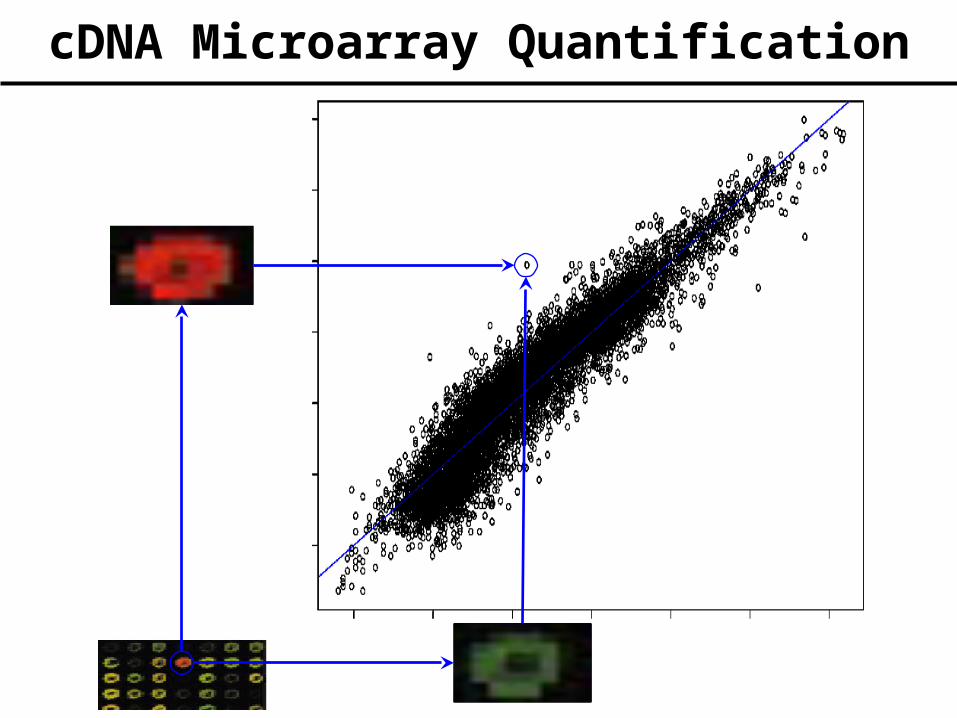
cDNA Microarray Quantification
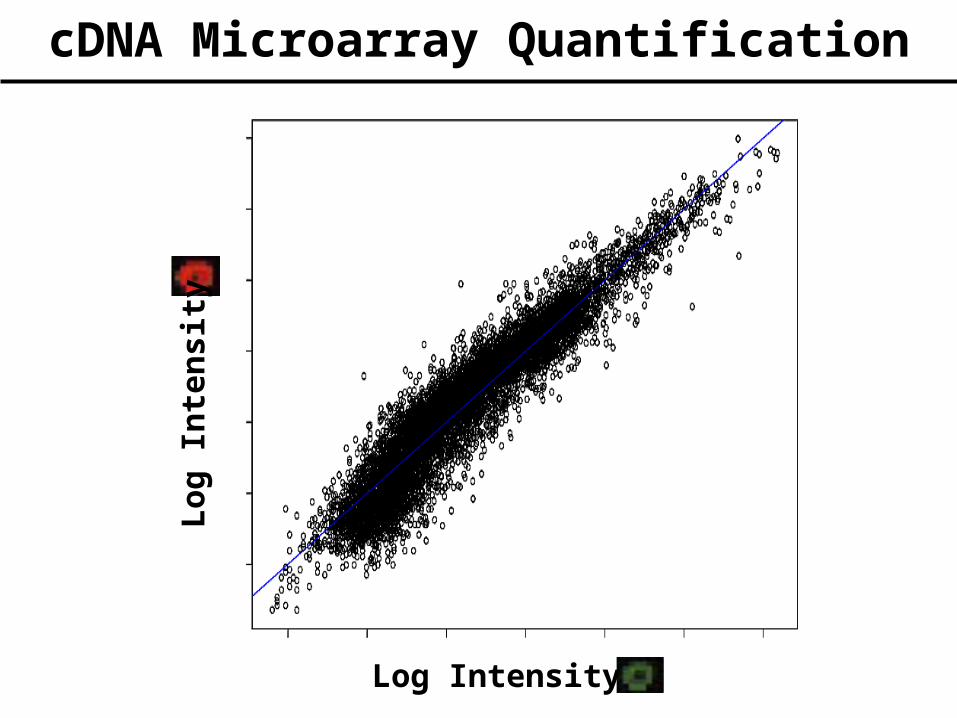
Log Intensity
Lo
g I
nte
nsi
ty
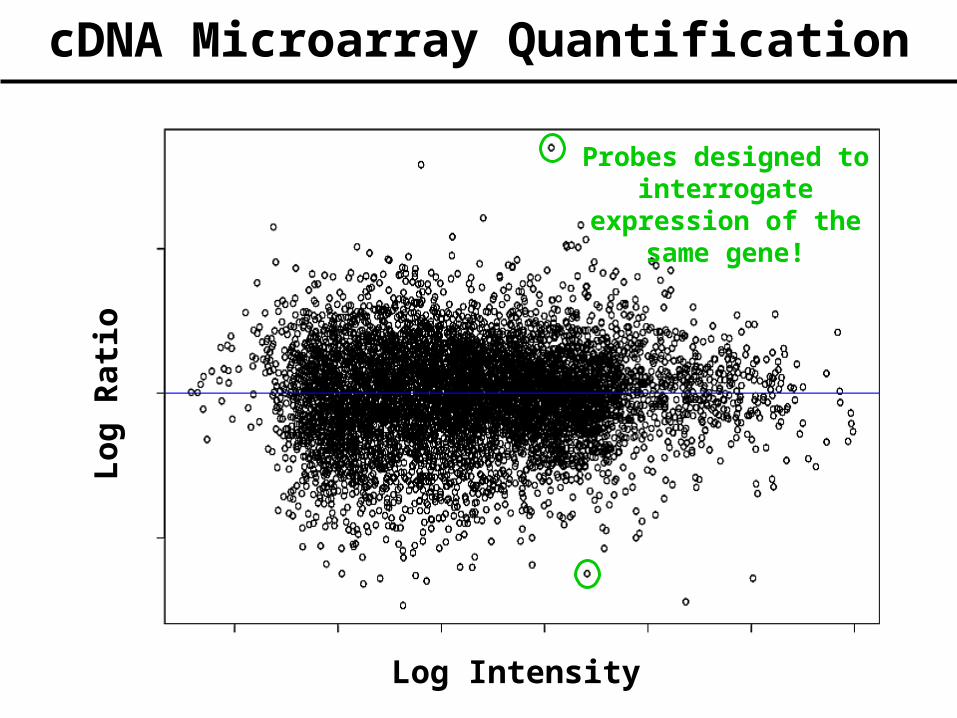
cDNA Microarray Quantification
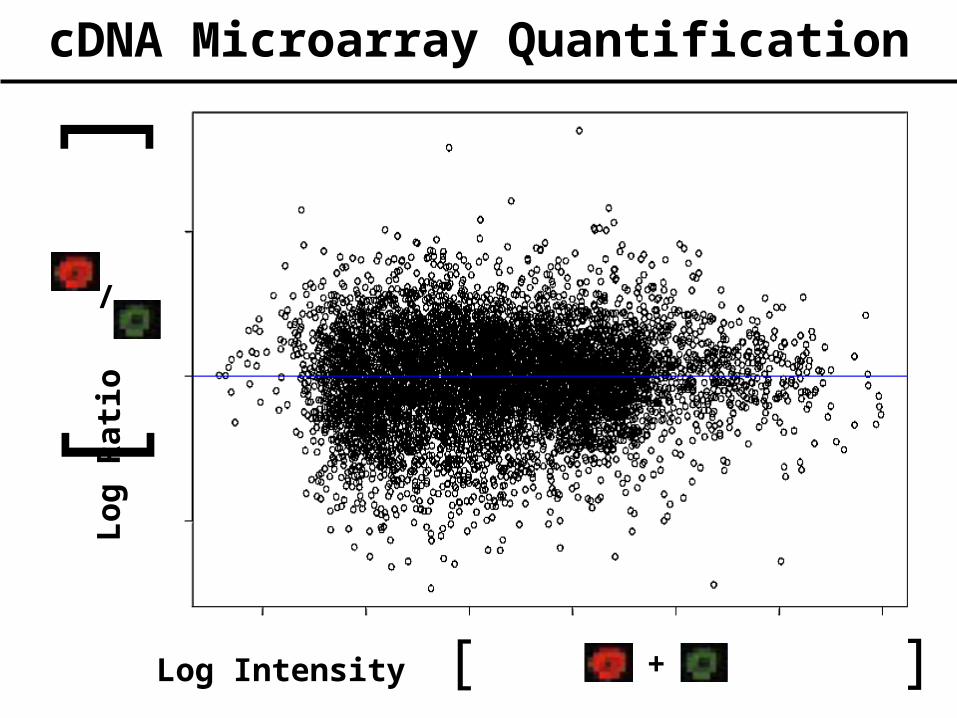
Log Intensity [ ]+
Lo
g R
atio
/
cDNA Microarray Quantification
[ ]
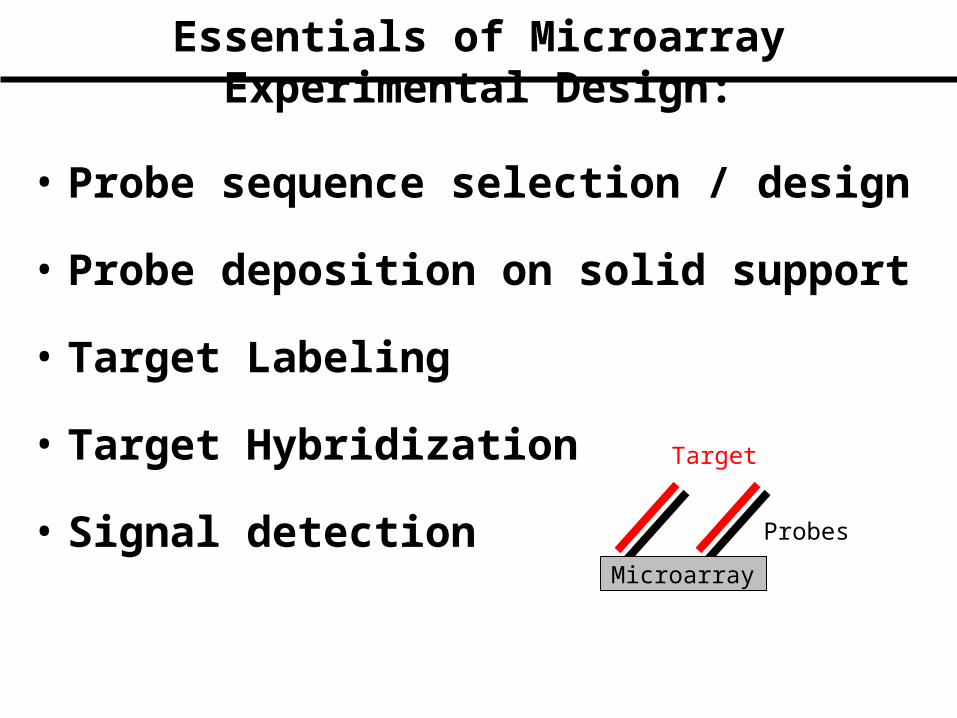
Essentials of Microarray Experimental Design:
• Probe sequence selection / design
• Probe deposition on solid support
• Target Labeling
• Target Hybridization
• Signal detectionMicroarray
Target
Probes
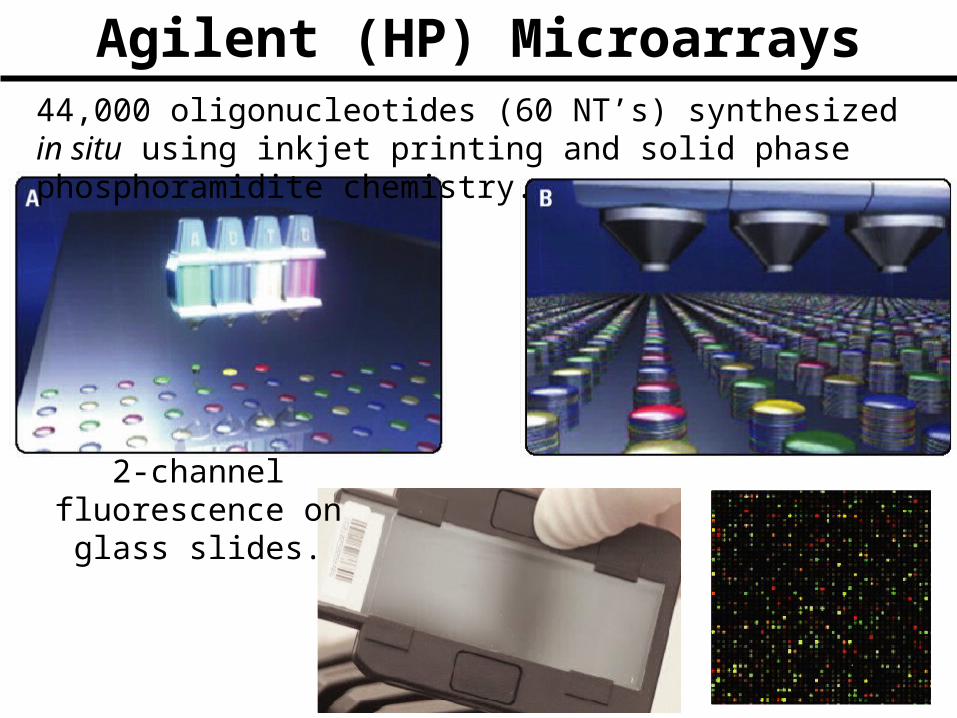
Agilent (HP) Microarrays
2-channel fluorescence on glass slides.
44,000 oligonucleotides (60 NT’s) synthesized in situ using inkjet printing and solid phase phosphoramidite chemistry.
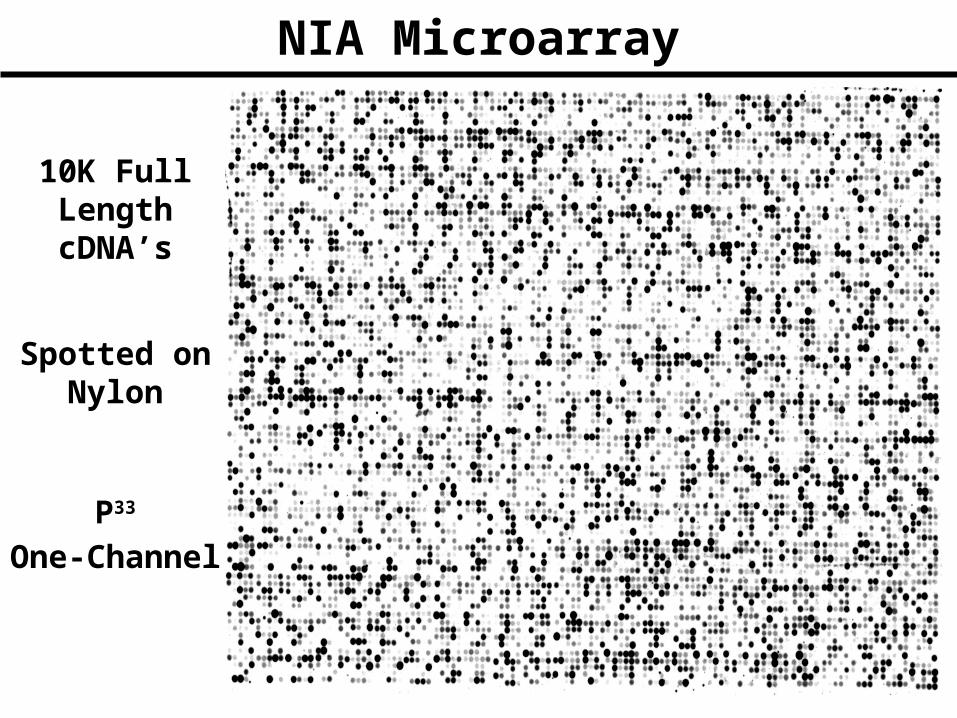
NIA Microarray
10K Full Length cDNA’s
P33
One-Channel
Spotted on Nylon
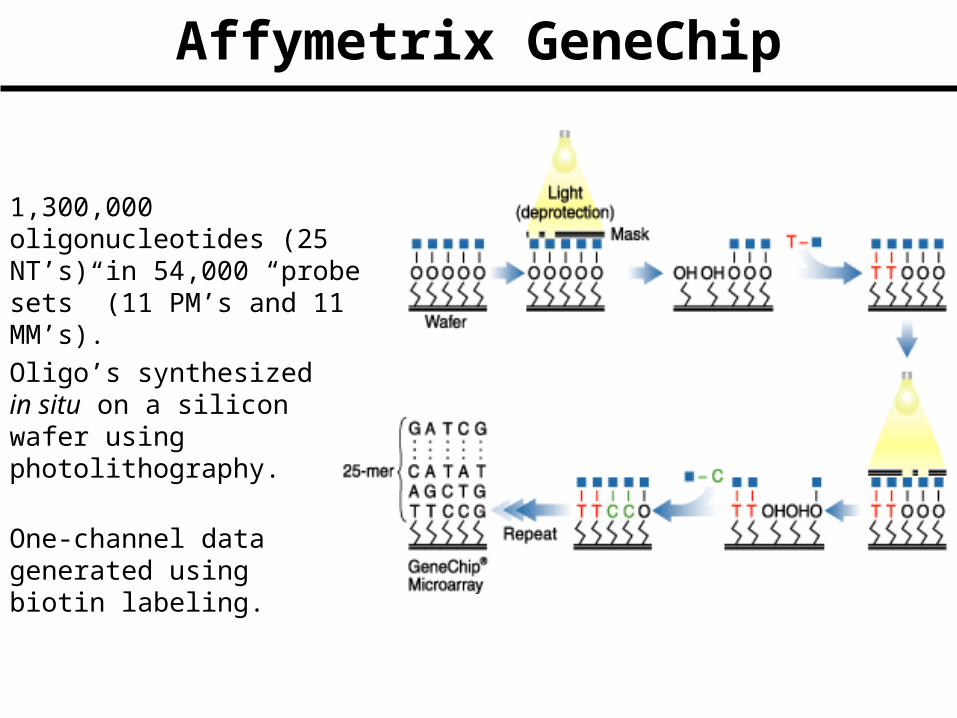
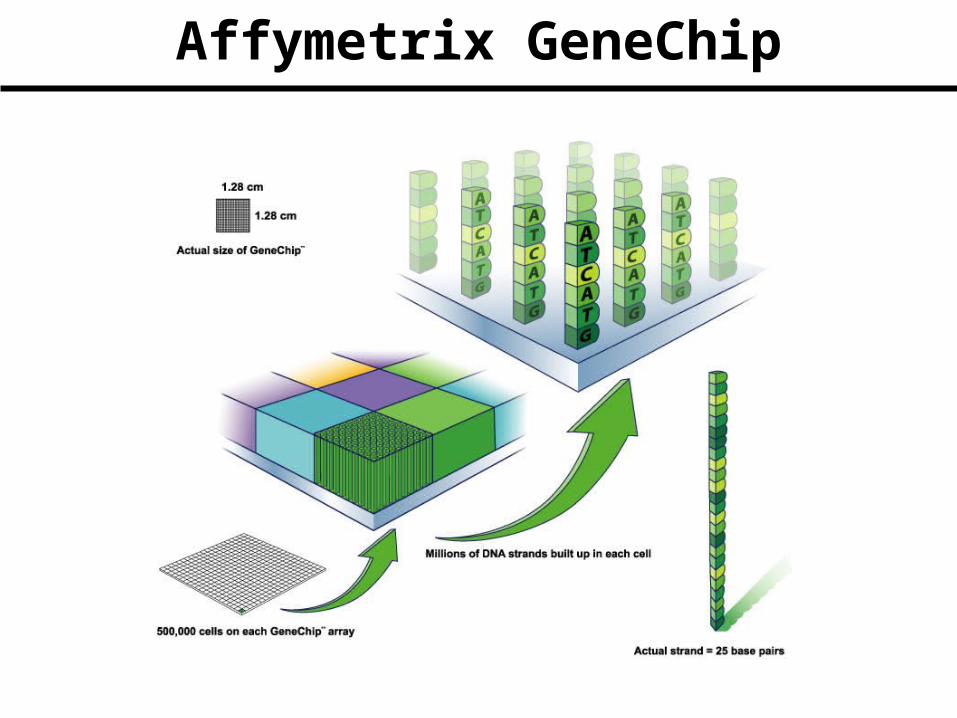
Affymetrix GeneChip
One-channel data generated using biotin labeling.
1,300,000 oligonucleotides (25 NT’s) in 54,000 “probe sets” (11 PM’s and 11 MM’s).
Oligo’s synthesized in situ on a silicon wafer using photolithography.
Affymetrix GeneChip
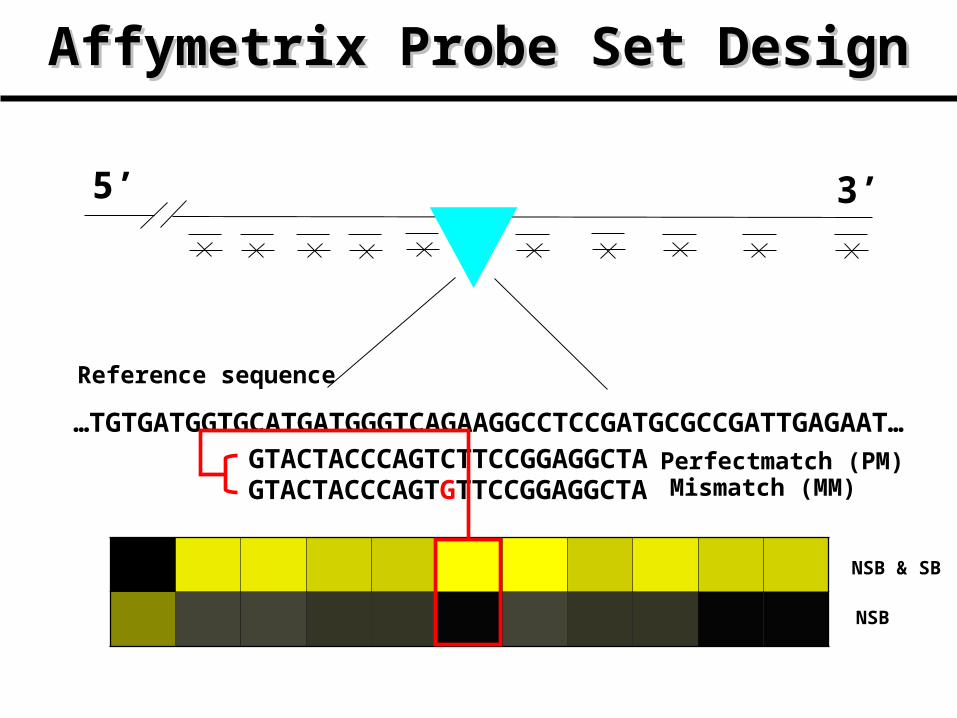
Affymetrix Probe Set DesignAffymetrix Probe Set Design
5’ 3’
Reference sequence
…TGTGATGGTGCATGATGGGTCAGAAGGCCTCCGATGCGCCGATTGAGAAT…GTACTACCCAGTCTTCCGGAGGCTAGTACTACCCAGTGTTCCGGAGGCTA
Perfectmatch (PM)Mismatch (MM)
NSB & SB
NSB
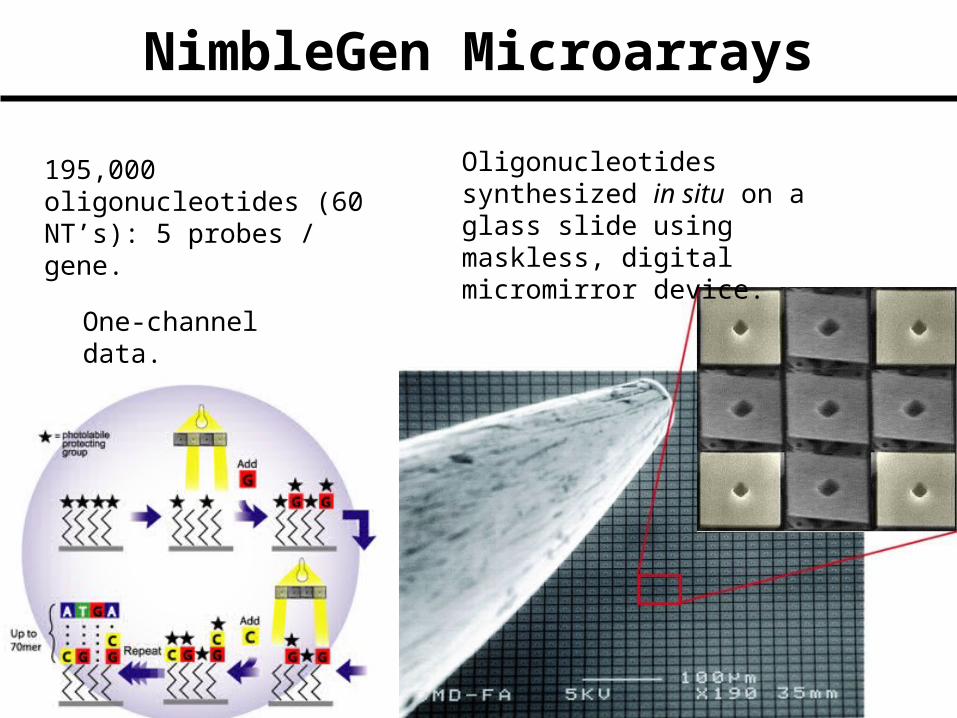
NimbleGen Microarrays
Oligonucleotides synthesized in situ on a glass slide using maskless, digital micromirror device.
195,000 oligonucleotides (60 NT’s): 5 probes / gene.
One-channel data.
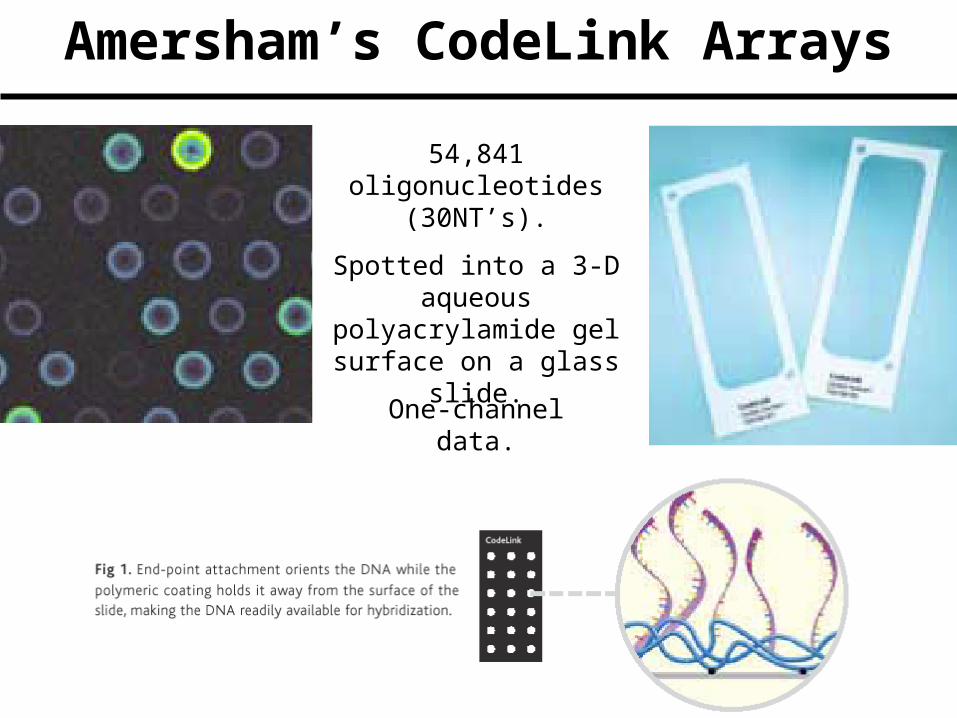
Amersham’s CodeLink Arrays
One-channel data.
54,841 oligonucleotides (30NT’s).
Spotted into a 3-D aqueous polyacrylamide gel surface
on a glass slide.
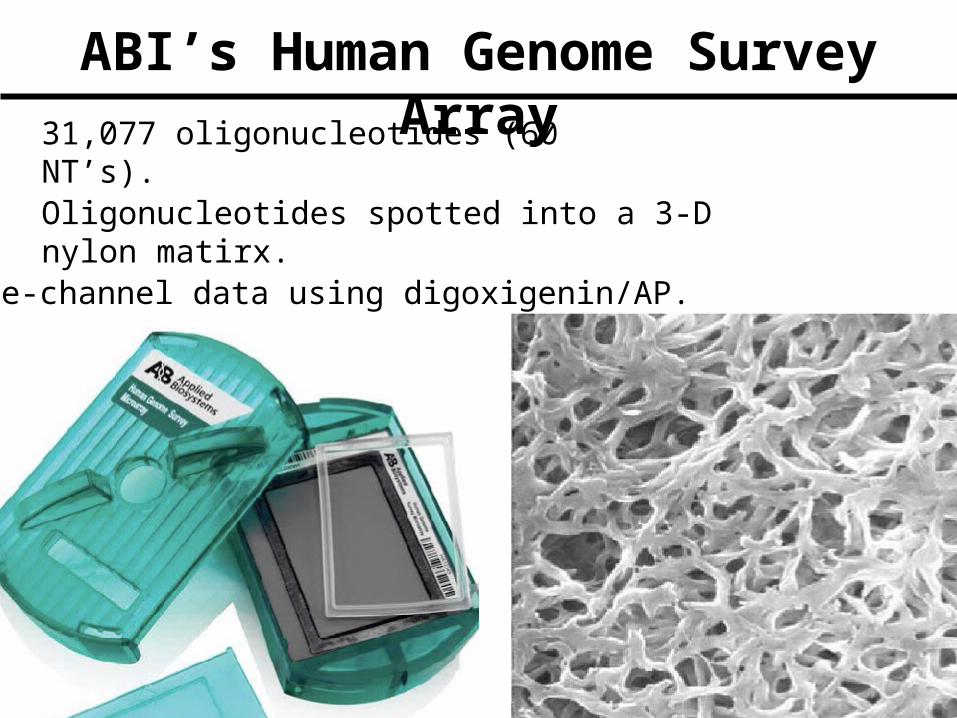
ABI’s Human Genome Survey Array
One-channel data using digoxigenin/AP.
Oligonucleotides spotted into a 3-D nylon matirx.
31,077 oligonucleotides (60 NT’s).
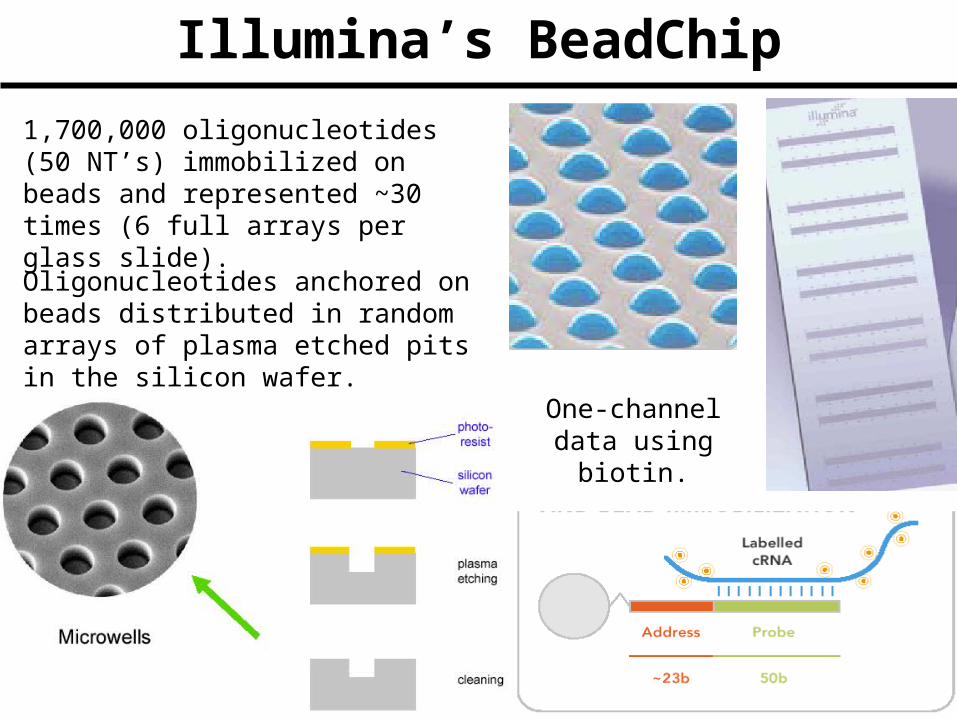
Illumina’s BeadChip
One-channel data using biotin.
Oligonucleotides anchored on beads distributed in random arrays of plasma etched pits in the silicon wafer.
1,700,000 oligonucleotides (50 NT’s) immobilized on beads and represented ~30 times (6 full arrays per glass slide).
Essentials of Microarray Experimental Design:
• Probe sequence
• Probe deposition on solid support
• Target Labeling
• Target Hybridization
• Signal detection
Microarray
Target
Probes
Oligo vs. cDNA (Design: follow-up)
1 vs. 2 channel most important for experimental and analysis design
Specifics of each technology will determine idiosyncrasies of data preprocessing.
Probe length:Specificity & Sensitivity
Signal? Amplification?
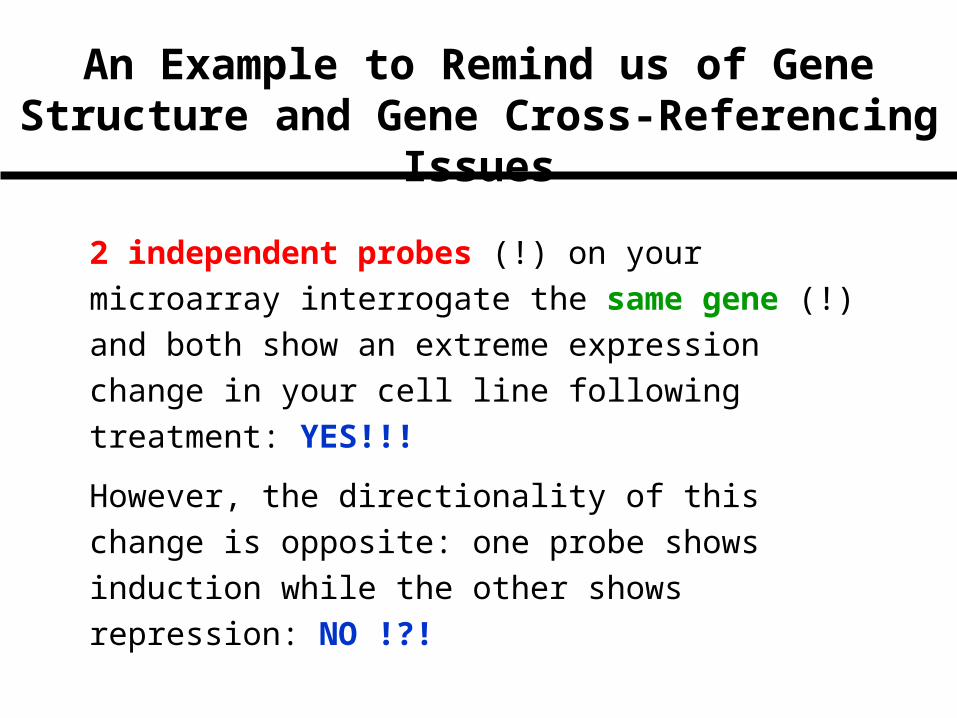
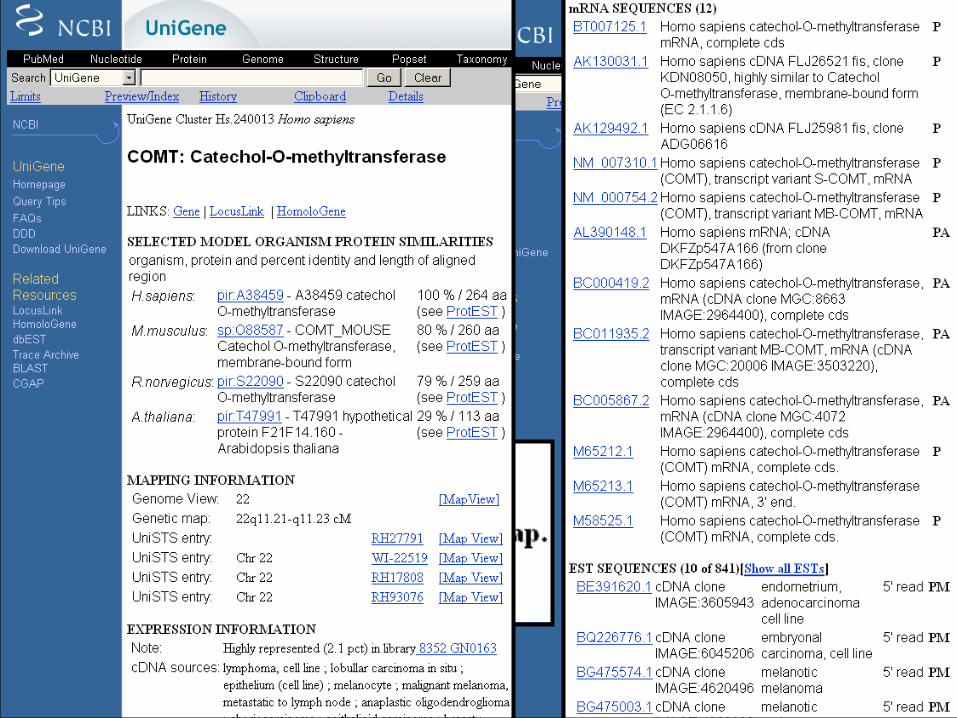
An Example to Remind us of Gene Structure and Gene Cross-Referencing Issues
2 independent probes (!) on your microarray
interrogate the same gene (!) and both show an
extreme expression change in your cell line following
treatment: YES!!!
However, the directionality of this change is opposite:
one probe shows induction while the other shows
repression: NO !?!
Log Intensity
Lo
g I
nte
nsi
ty
cDNA Microarray Quantification
Log Intensity
Lo
g R
atio
cDNA Microarray Quantification
Probes designed to interrogate expression
of the same gene!
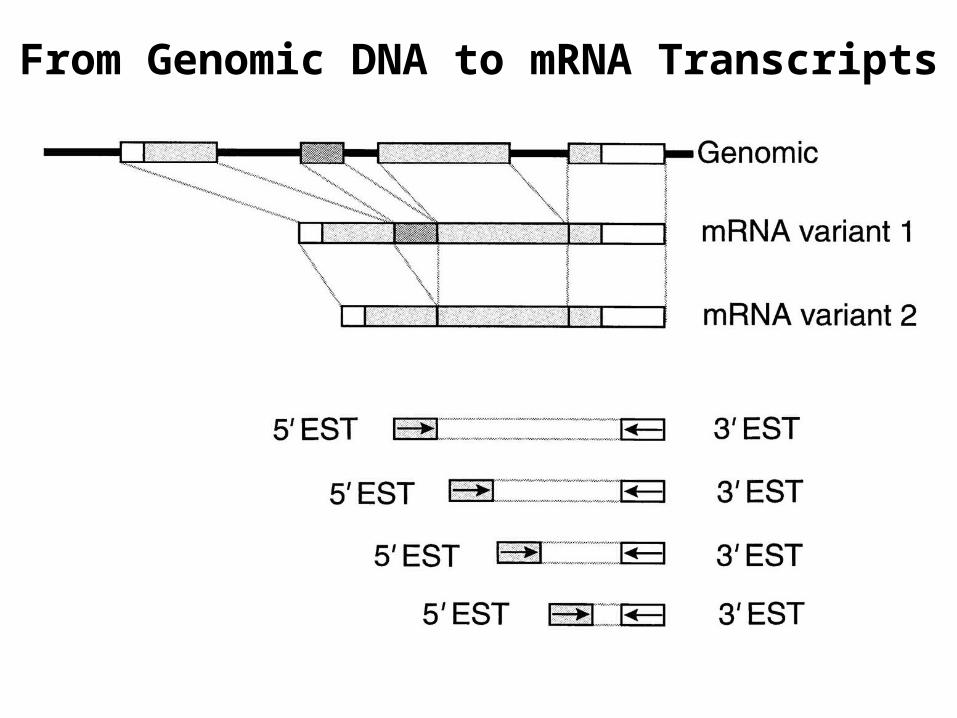
From Genomic DNA to mRNA Transcripts
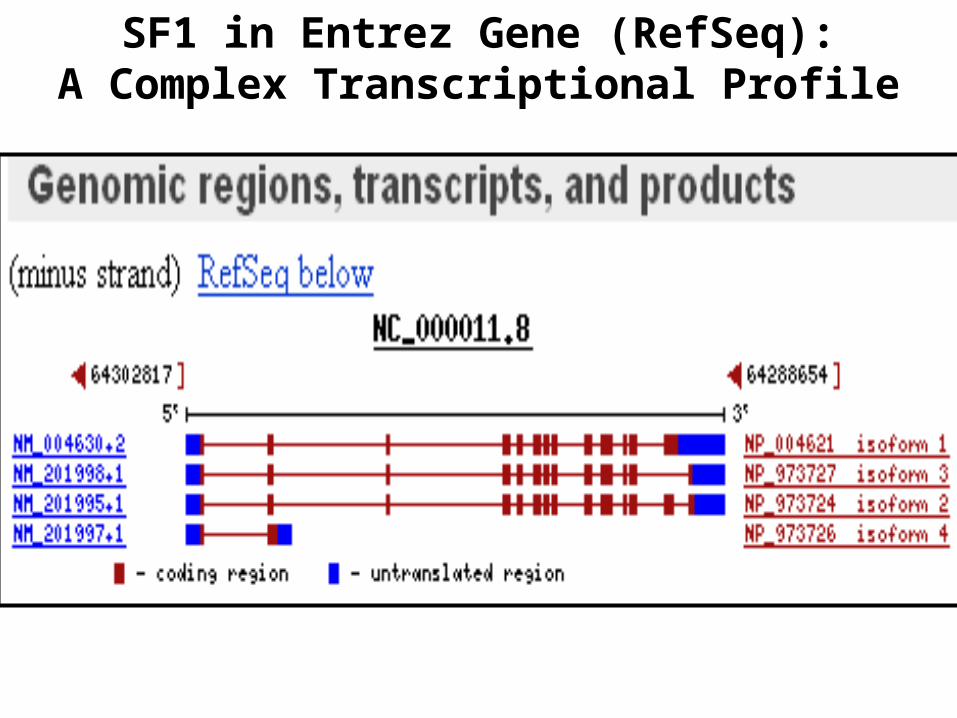
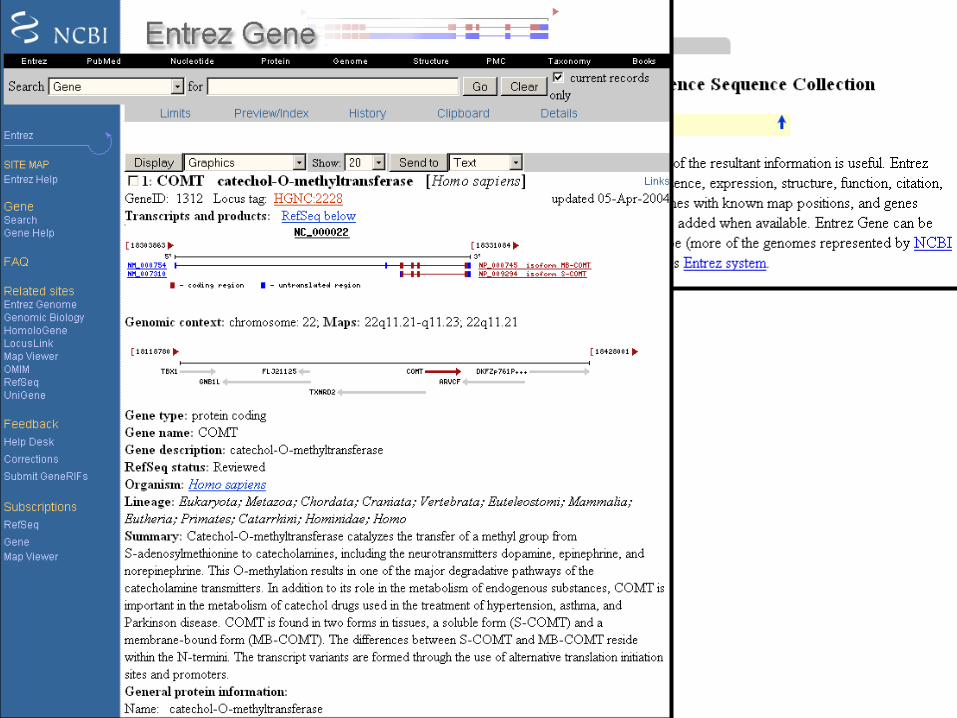
SF1 in Entrez Gene (RefSeq):A Complex Transcriptional Profile
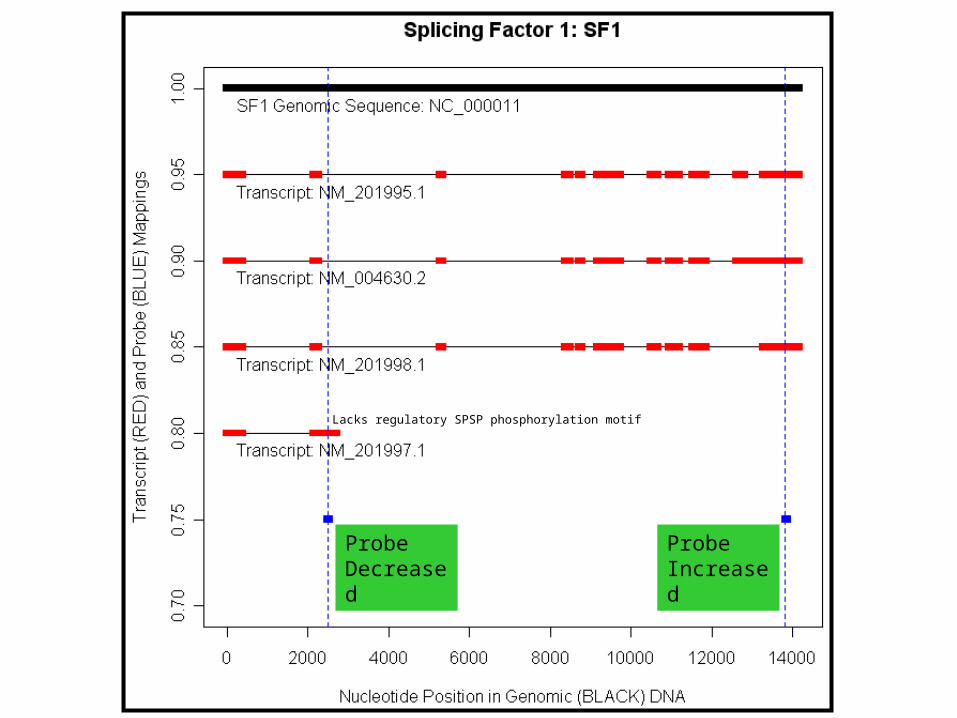
Lacks regulatory SPSP phosphorylation motif
Probe Decreased
Probe Increased
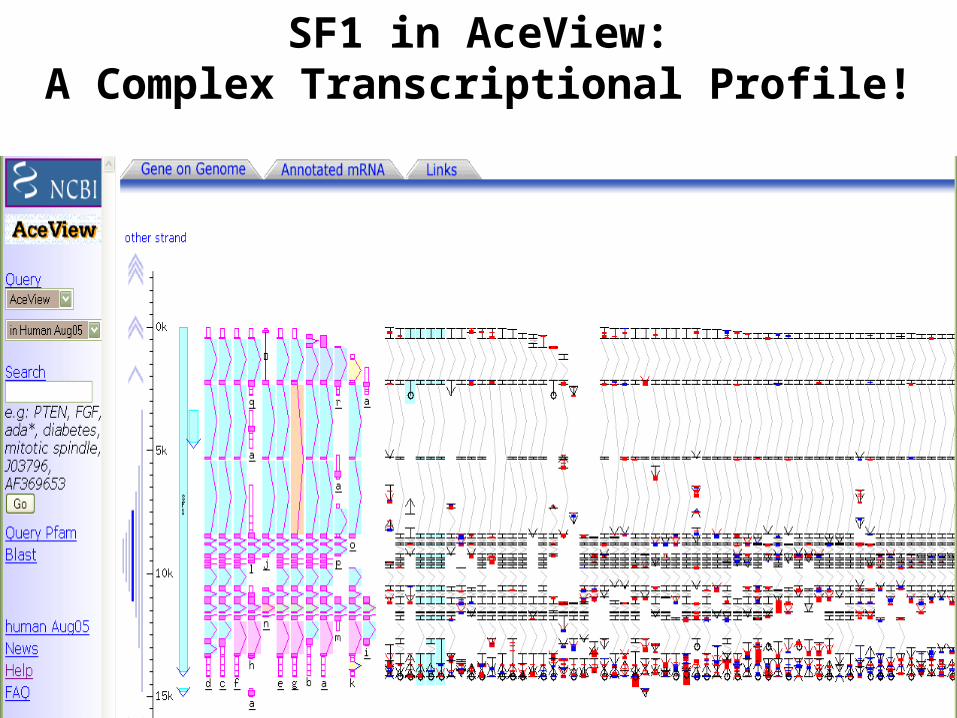
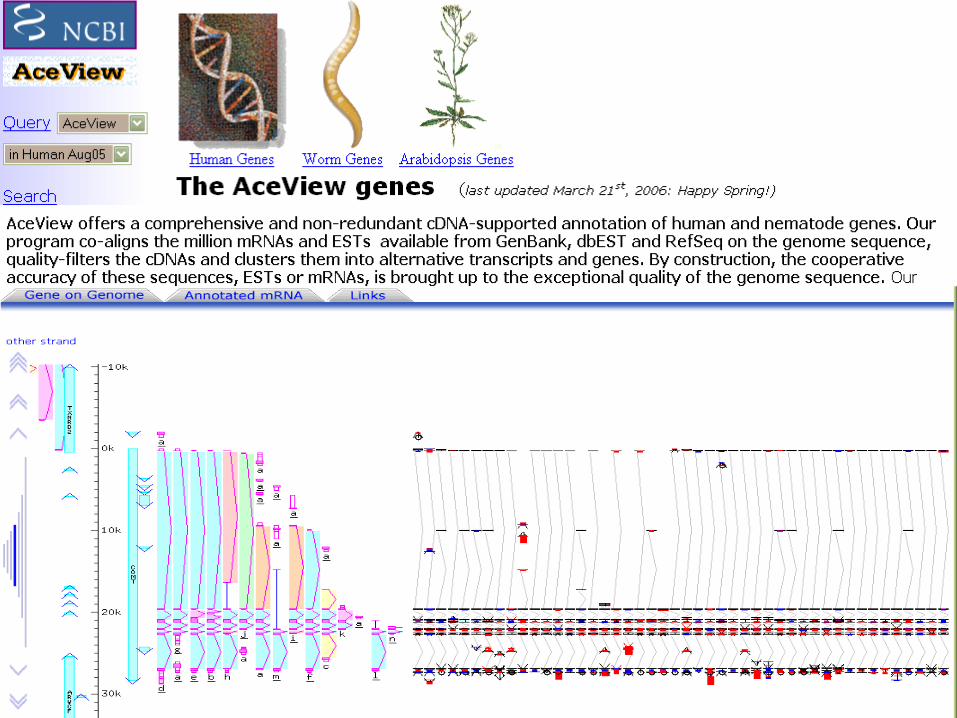
SF1 in AceView:A Complex Transcriptional Profile!
AAAAA
Gene: Protein coding unit of genomic DNA with an mRNA intermediate.
START STOP
protein coding5’ UTR 3’ UTR
mRNA
GenomicDNA 3.3 Gb
DNAProbe
~30K genes
Sequence is a Necessity.
Transcription
From Genomic DNA to mRNA Transcripts
EXONS INTRONS
RNA editing & SNPs
Alternative splicingAlternative start & stop sites in same RNA molecule
~30K
>30K
Transcript coverage Homology to other transcripts
Hybridization dynamics 3’ bias
Protein-coding genes are not easy to find - gene density is low, and exons are interrupted by introns.
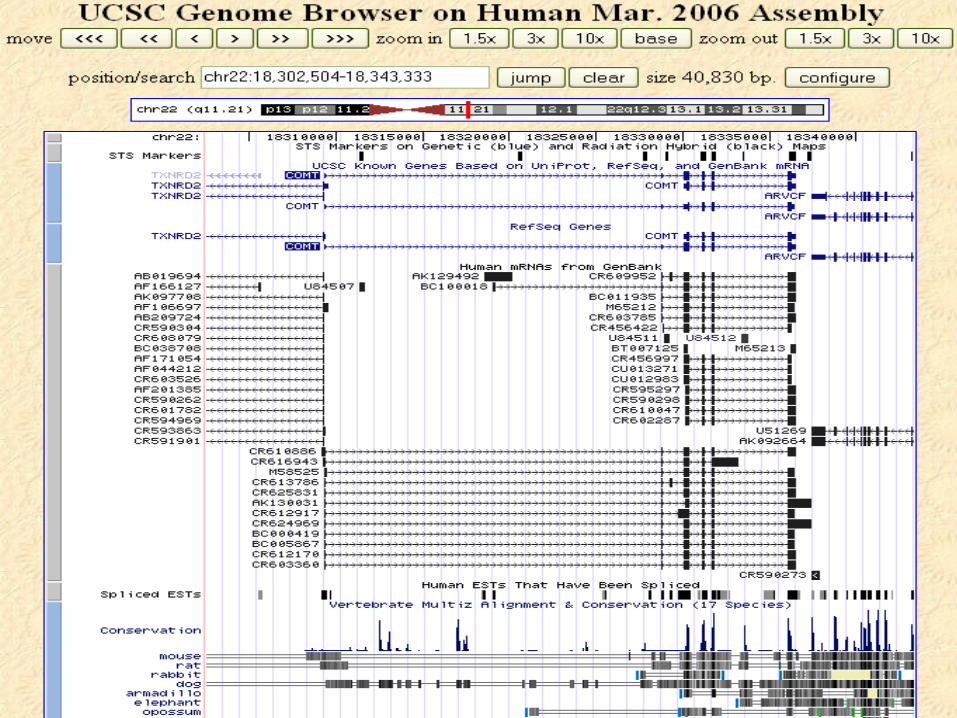
USCS Genome Browser:
Genes
Transcripts
Probes
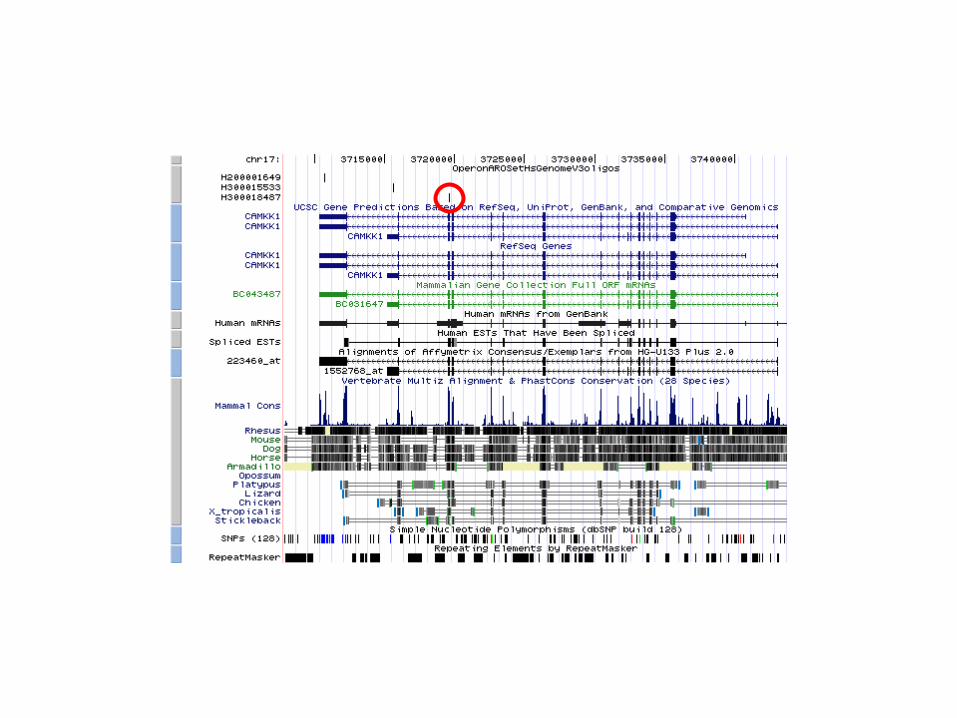
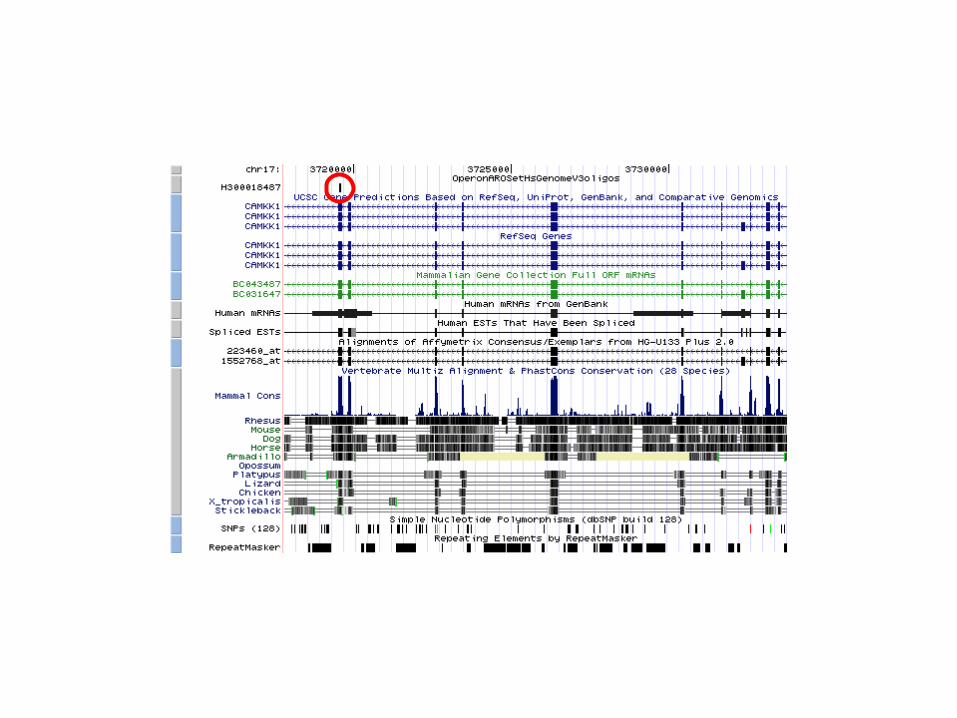
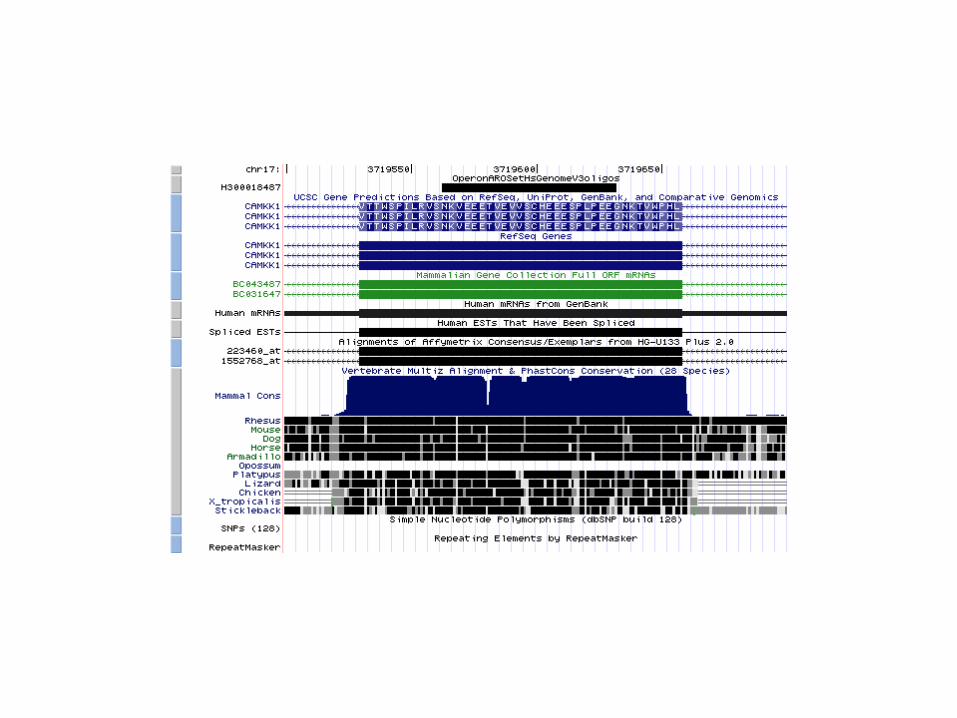
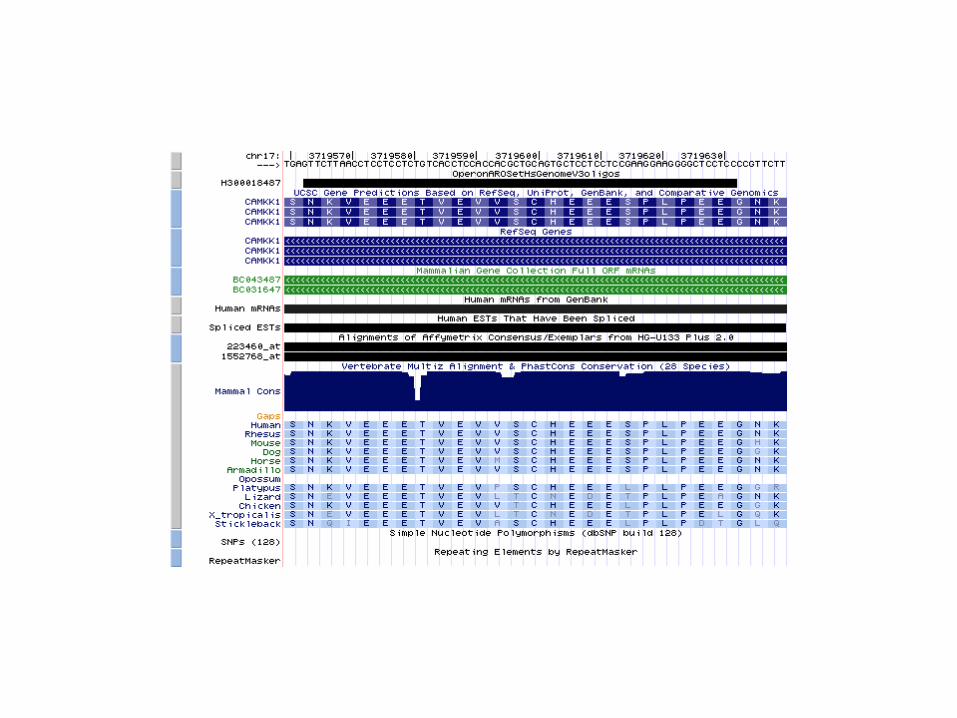
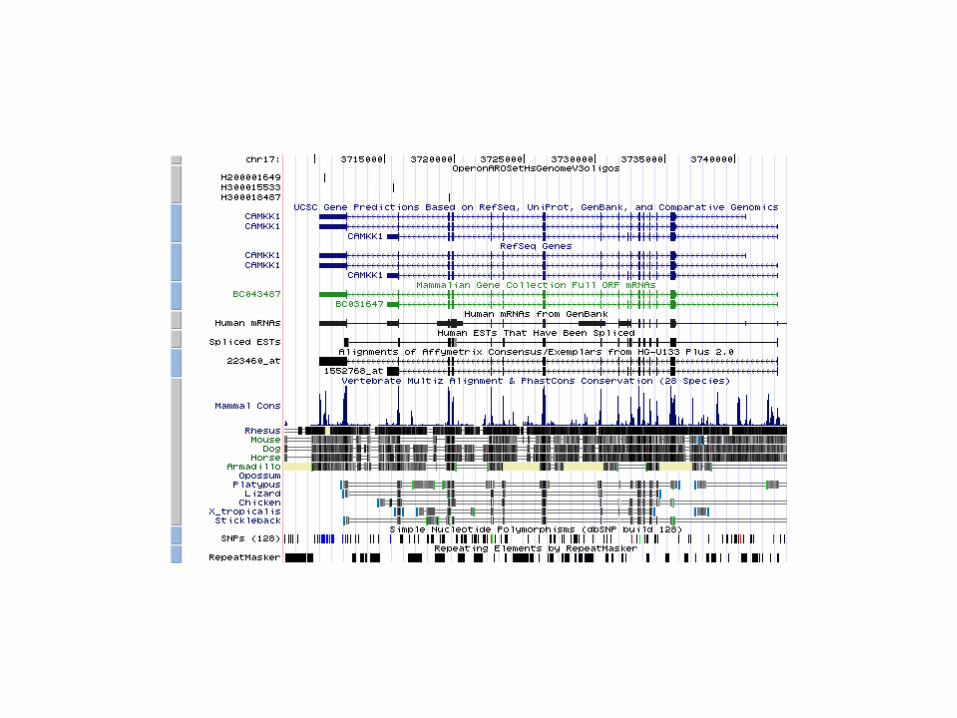
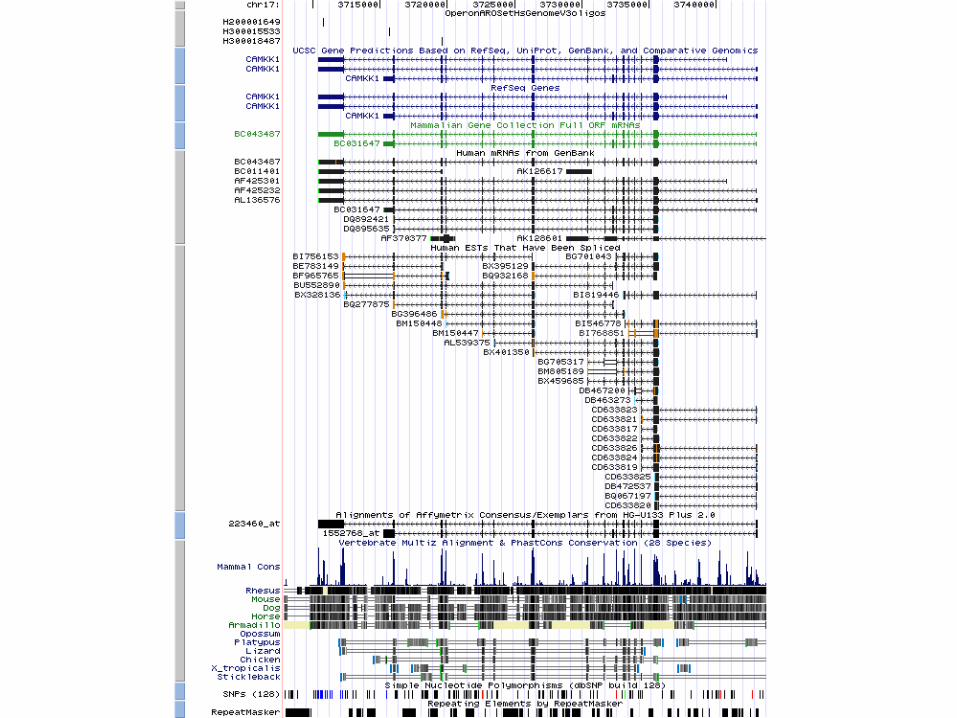

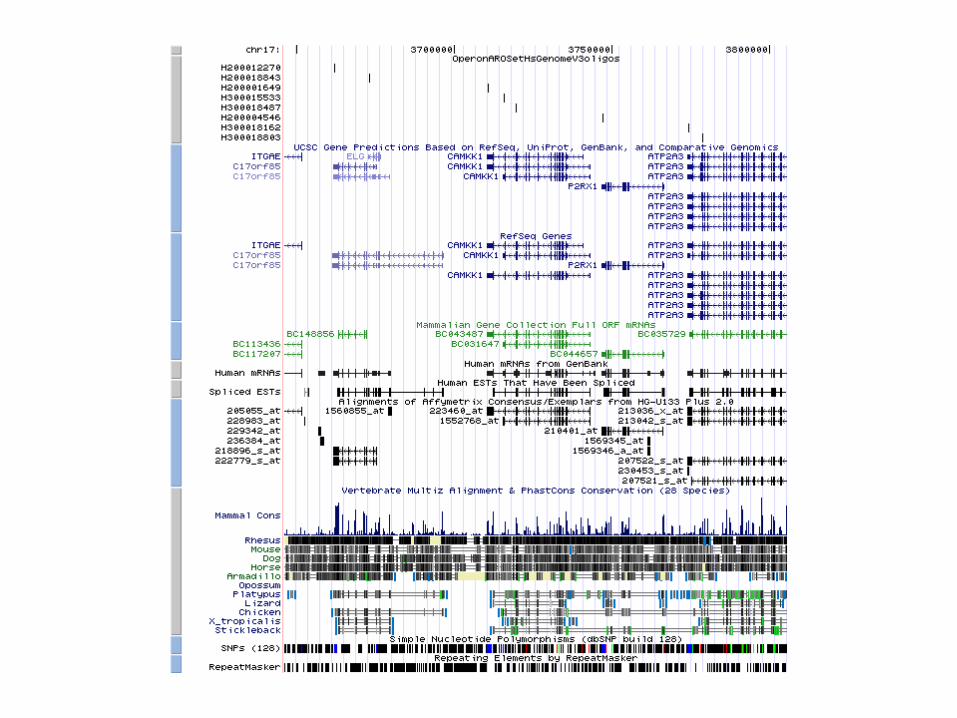
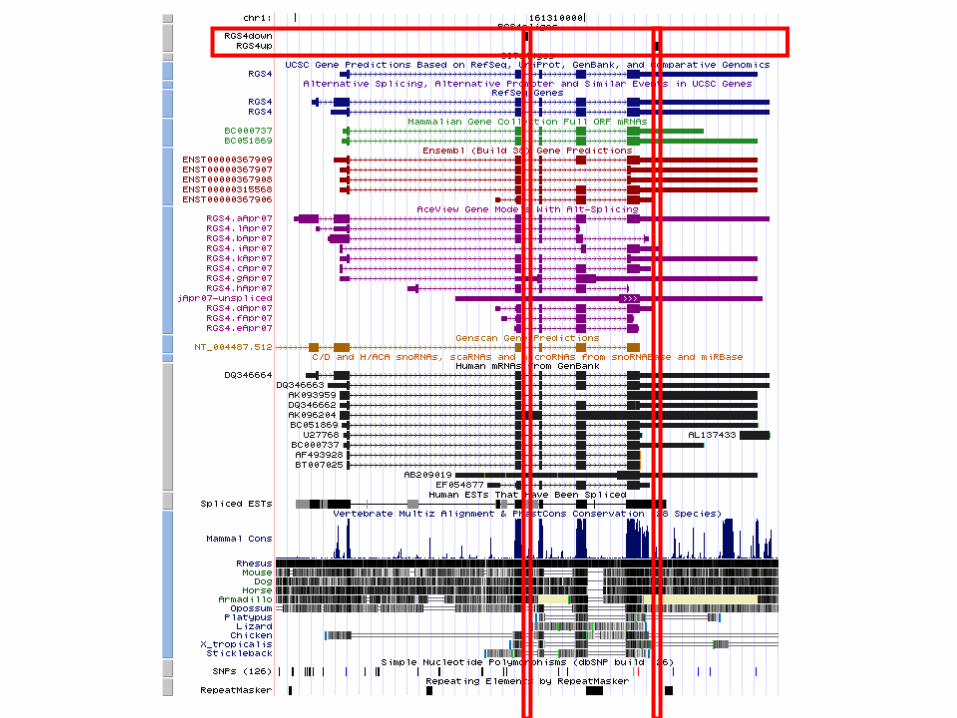
(Live Web Demo)(Live Web Demo)
USCS example with genes, transcripts, and probe USCS example with genes, transcripts, and probe mapping – custom tracks.mapping – custom tracks.