Summer crop production - Australian Natural...
41
Australian crop report Prepared by the Australian Bureau of Agricultural and Resource Economics and Sciences December 2013 No. 168
Transcript of Summer crop production - Australian Natural...
Australian crop reportPrepared by the Australian Bureau of Agricultural
and Resource Economics and Sciences
December 2013No. 168
© Commonwealth of Australia 2013
Ownership of intellectual property rightsUnless otherwise noted, copyright (and any other intellectual property rights, if any) in this publication is owned by the Commonwealth of Australia (referred to as the Commonwealth).
Creative Commons licenceAll material in this publication is licensed under a Creative Commons Attribution 3.0 Australia Licence, save for content supplied by third parties, logos and the Commonwealth Coat of Arms.
Creative Commons Attribution 3.0 Australia Licence is a standard form licence agreement that allows you to copy, distribute, transmit and adapt this publication provided you attribute the work. A summary of the licence terms is available from creativecommons.org/licenses/by/3.0/au/deed.en. The full licence terms are available from creativecommons.org/licenses/by/3.0/au/legalcode.
This publication (and any material sourced from it) should be attributed as ABARES 2013, Australian crop report, Australian Bureau of Agricultural and Resource Economics and Sciences, Canberra, December, CC BY 3.0.
Cataloguing dataABARES 2013, Australian crop report, Australian Bureau of Agricultural and Resource Economics and Sciences, Canberra, December.
ISSN 1447-8358ISBN 978-1-74323-144-9 ABARES project 42072
InternetAustralian crop report is available at daff.gov.au/abares/publications.
Australian Bureau of Agricultural and Resource Economics and Sciences (ABARES)Postal address GPO Box 1563 Canberra ACT 2601Switchboard +61 2 6272 2010Facsimile +61 2 6272 2001Email [email protected] daff.gov.au/abares
Inquiries about the licence and any use of this document should be sent to [email protected].
The Australian Government acting through the Department of Agriculture represented by the Australian Bureau of Agricultural and Resource Economics and Sciences, has exercised due care and skill in preparing and compiling the information and data in this publication. Notwithstanding, the Department of Agriculture, ABARES, its employees and advisers disclaim all liability, including liability for negligence, for any loss, damage, injury, expense or cost incurred by any person as a result of accessing, using or relying upon any of the information or data in this publication to the maximum extent permitted by law.
The next issue of Australian crop report is scheduled to be released on 11 February 2014.
In the next issue:2013–14 winter crop area and production estimates updated2013–14 summer crop area and production forecasts updated
AcknowledgementsThis report was prepared by Benjamin Agbenyegah, Guy Barrett, Amelia Brown, Beth Deards, Matthew Miller, David Mobsby, Christopher Price and Neil Thompson.
Australian crop report December 2013 ABARES
ContentsOverview................................................................................................................................................................. 2
Climatic and agronomic conditions............................................................................................................3
Winter crop production................................................................................................................................... 8
Summer crop production............................................................................................................................. 10
Crop conditions and production forecasts, by state.........................................................................11
New South Wales................................................................................................................................ 11
Queensland............................................................................................................................................ 12
Victoria.................................................................................................................................................... 13
South Australia.....................................................................................................................................14
Western Australia...............................................................................................................................15
TablesTable 1 Rainfall in major cropping districts...........................................................................................7
Table 2 Winter crop production, Australia.............................................................................................9
Table 3 Winter crop area, Australia............................................................................................................9
Table 4 Summer crop plantings and production, Australia..........................................................10
Table 5 Winter crop forecasts, 2013–14, New South Wales.........................................................12
Table 6 Summer crop forecasts, 2013–14, New South Wales......................................................12
Table 7 Winter crop forecasts, 2013–14, Queensland.....................................................................13
Table 8 Summer crop forecasts, 2013–14, Queensland..................................................................13
Table 9 Winter crop forecasts, 2013–14, Victoria.............................................................................14
Table 10 Winter crop forecasts, 2013–14, South Australia..........................................................15
Table 11 Winter crop forecasts, 2013–14, Western Australia.....................................................15
Table 12 Australian crop production......................................................................................................16
Table 13 State production, major crops.................................................................................................17
Table 14 State production, other crops..................................................................................................18
Table 15 Australian supply and disposal of wheat, oilseeds and pulses.................................19
Table 16 Australian supply and disposal of coarse grains.............................................................20
Table 17 Grains and oilseeds prices........................................................................................................21
iii
Australian crop report December 2013 ABARES
MapsMap 1 Australian wheat growing regions................................................................................................1
Map 2 Australian rainfall districts...............................................................................................................1
Map 3 Australian rainfall percentiles, 1 August to 31 October 2013...........................................3
Map 4 Rainfall outlook, December 2013 to February 2014.............................................................4
Map 5 Upper layer soil moisture, October 2013...................................................................................5
Map 6 Lower layer soil moisture, October 2013..................................................................................5
Map 7 Probability of exceeding long-term median grain sorghum yield...................................6
iv
Australian crop report December 2013 ABARES
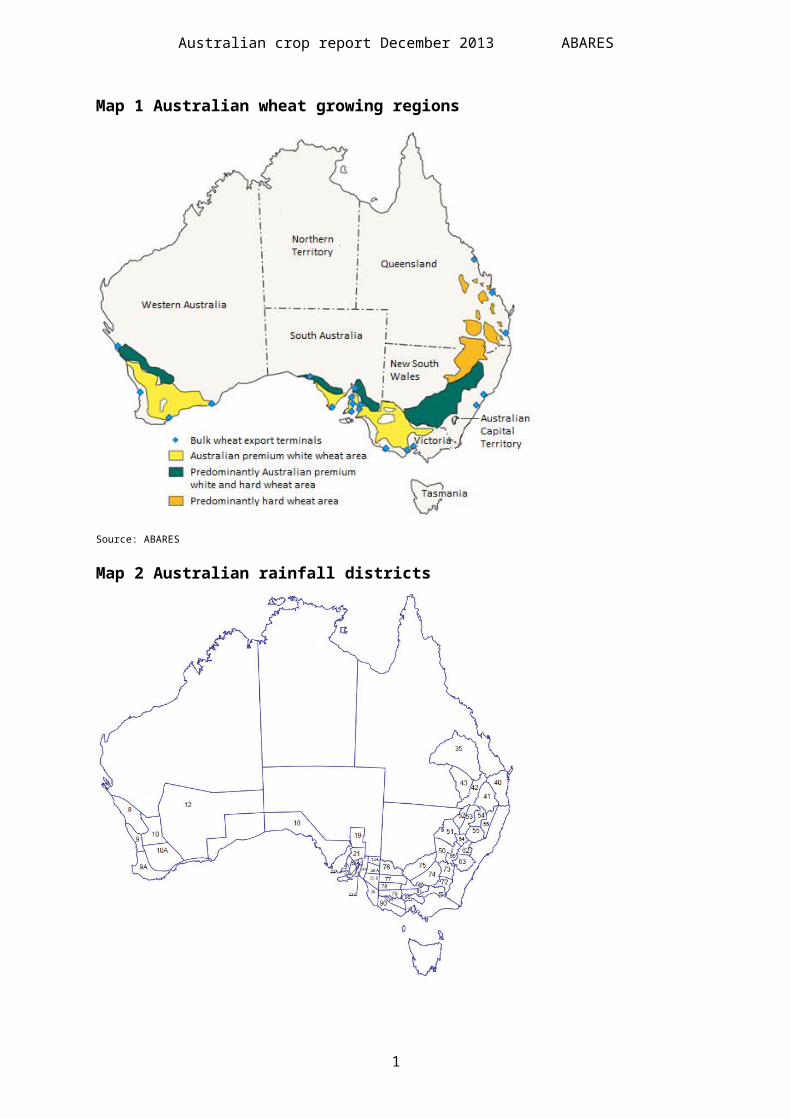
Map 1 Australian wheat growing regions
Source: ABARES
Map 2 Australian rainfall districts
Note: Displayed for major cropping districts only. See Table 1 for district names and observed district rainfall.Source: Bureau of Meteorology
1
Australian crop report December 2013 ABARES
OverviewProspects for total Australian winter crop production in 2013–14 have improved. The variable seasonal conditions during winter and spring mean regional outcomes are expected to vary significantly.
While production is forecast to increase in Western Australia, Victoria and South Australia, it is expected to fall in New South Wales and Queensland. In Western Australia and Victoria, generally favourable conditions and timely rainfall during spring increased prospective yields, particularly in southern and central Western Australia. In South Australia, rainfall during spring was below average and temperatures were above average. However, seasonal conditions were favourable over winter, which put crops in good condition at the start of spring. As a result, crop yields are forecast to be above average in that state. By contrast, hot and dry seasonal conditions in New South Wales and Queensland during spring followed unfavourable seasonal conditions during winter. Crops in southern Queensland and many parts of New South Wales were adversely affected by frost events. As a result, yields in both states are expected to be lower than last year.
Harvesting of winter crops is largely complete in Queensland and northern New South Wales. Harvesting is underway in Western Australia, South Australia, southern New South Wales and Victoria. Indications so far are that wheat protein levels are below average in Western Australia and South Australia, but above average in northern New South Wales and Queensland.
Total Australian winter crop production is forecast to rise by 12 per cent in 2013–14 to around 42.1 million tonnes. This is an upward revision of around 3 million tonnes from ABARES September forecast. For the major winter crops, wheat production is forecast to increase by 17 per cent to around 26.2 million tonnes and barley production is forecast to rise by 15 per cent to around 8.6 million tonnes. By contrast, canola production is forecast to fall by 15 per cent to around 3.4 million tonnes. However, if realised this would still be the third largest canola crop on record.
Hot and dry seasonal conditions over winter and spring in northern New South Wales and Queensland have depleted soil moisture levels and created unfavourable conditions for the planting of summer crops. Recent rainfall has encouraged planting but the area planted to summer crops is forecast to fall by 9 per cent in 2013–14 to around 1.2 million hectares. Further rainfall may result in additional planting. Given the presently low levels of soil moisture in summer cropping regions, sufficient and timely rainfall will be vital for the development of crops.
The seasonal outlook for December 2013 to February 2014, issued by the Bureau of Meteorology on 27 November 2013, points to a below average chance of exceeding the median rainfall across major summer cropping regions in Queensland and an equal chance of receiving more or less than median rainfall in northern New South Wales. The outlook also points to an above average chance of exceeding the median maximum temperatures in these regions.
Total summer crop production is forecast to fall by 17 per cent in 2013–14 to 4.4 million tonnes. For the major summer crops, grain sorghum production is forecast to fall by 20 per cent to around 1.6 million tonnes; rice production is forecast to decline by 22 per cent to 907 000 tonnes; and cotton production is forecast to fall by around 3 per cent to around 975 000 tonnes of cotton lint and around 1.4 million tonnes of cottonseed.
2
Australian crop report December 2013 ABARES
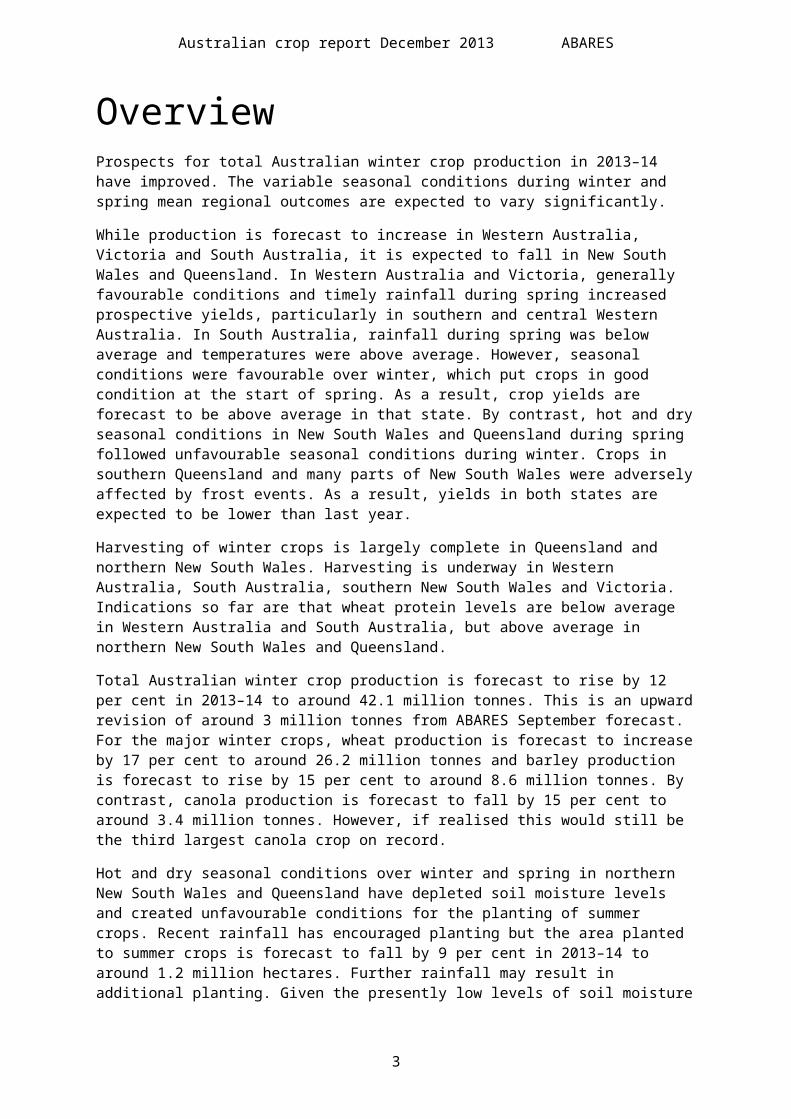
Climatic and agronomic conditionsDuring August to October 2013, rainfall in the cropping zones across eastern Australia was variable, being predominantly average for most of Victoria, central New South Wales and parts of South Australia. Queensland, the remainder of New South Wales and large parts of the cropping zone in South Australia received below to well below average rainfall (Map 3). Rainfall in the cropping zone in Western Australia ranged from average to extremely high.
During August 2013, average rainfall was recorded in most cropping regions in Victoria, South Australia and Western Australia, while cropping regions in New South Wales and Queensland generally recorded below average to severely deficient falls. September 2013 rainfall was generally average for most cropping regions, with Western Australia receiving extremely high falls and central Queensland cropping areas receiving well below average falls. In October 2013 rainfall for winter cropping regions across Australia was highly variable, ranging from severely deficient in the east to average in the south and west.
Map 3 Australian rainfall percentiles, 1 August to 31 October 2013
Note: Rainfall percentiles displayed for wheat–sheep zone only.Source: Bureau of Meteorology
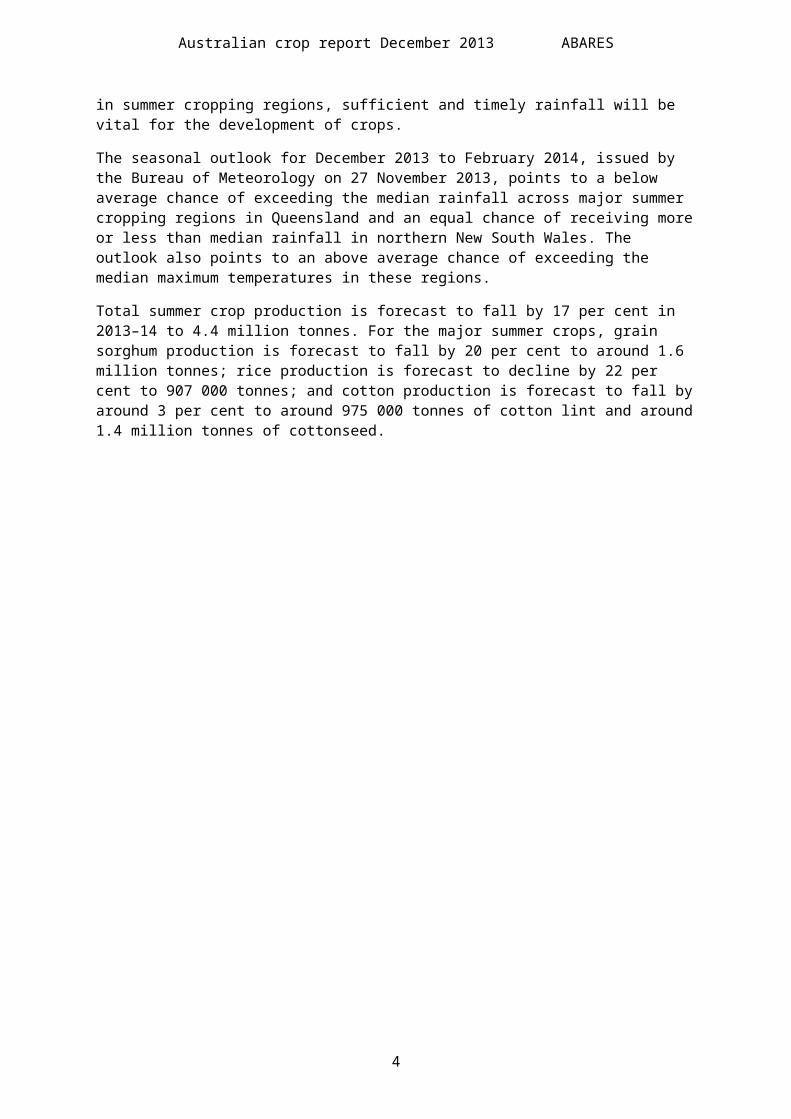
The Bureau of Meteorology’s latest seasonal rainfall outlook for summer (December 2013 to February 2014) indicates an increased chance of drier than normal conditions across cropping areas in Queensland, with chances (between 35 and 45 per cent) of exceeding the median rainfall. The chances of a wetter or drier than normal season are roughly equal over the cropping zones of New South Wales, Victoria, South Australia and Western Australia (Map 4).
The outlook for maximum and minimum temperatures over summer (December 2013 to February 2014) indicates an increased chance of warmer than average daytime and night-time temperatures over much of eastern Australia, while cooler daytime and night-time temperatures are more likely in south-west Western Australia.
3
Australian crop report December 2013 ABARES
Map 4 Rainfall outlook, December 2013 to February 2014
Note: Outlook displayed for wheat–sheep zone only.Source: Bureau of Meteorology
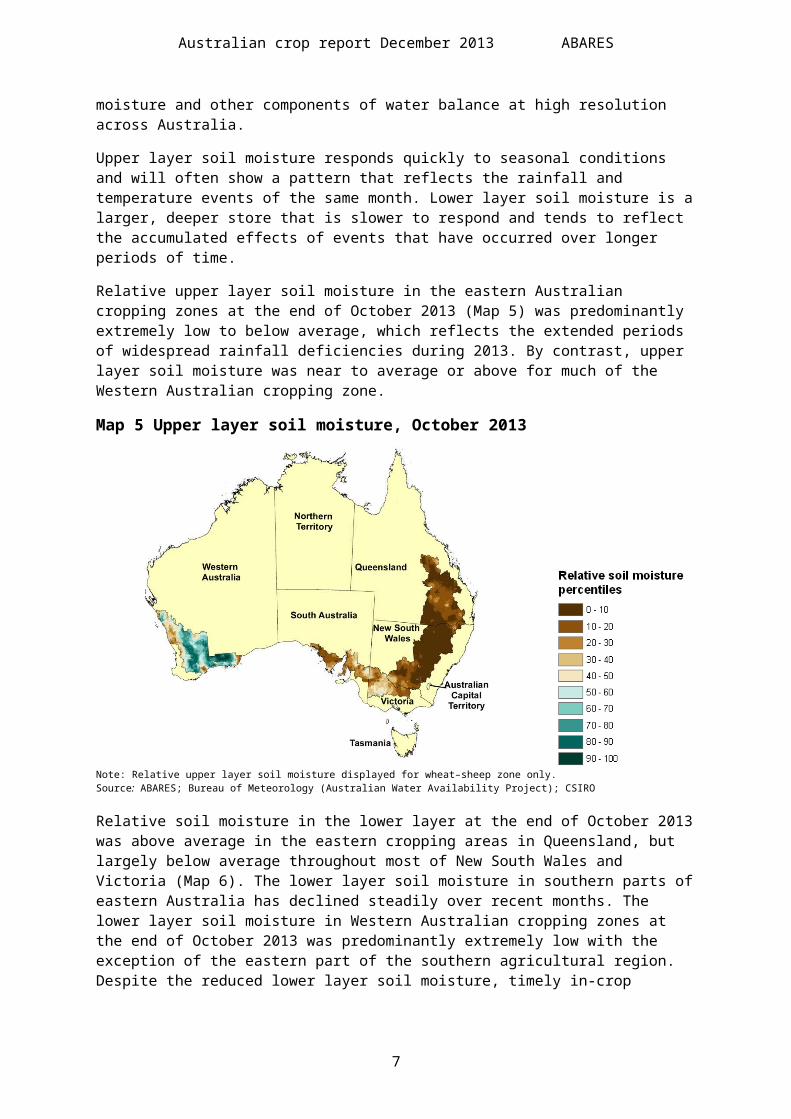
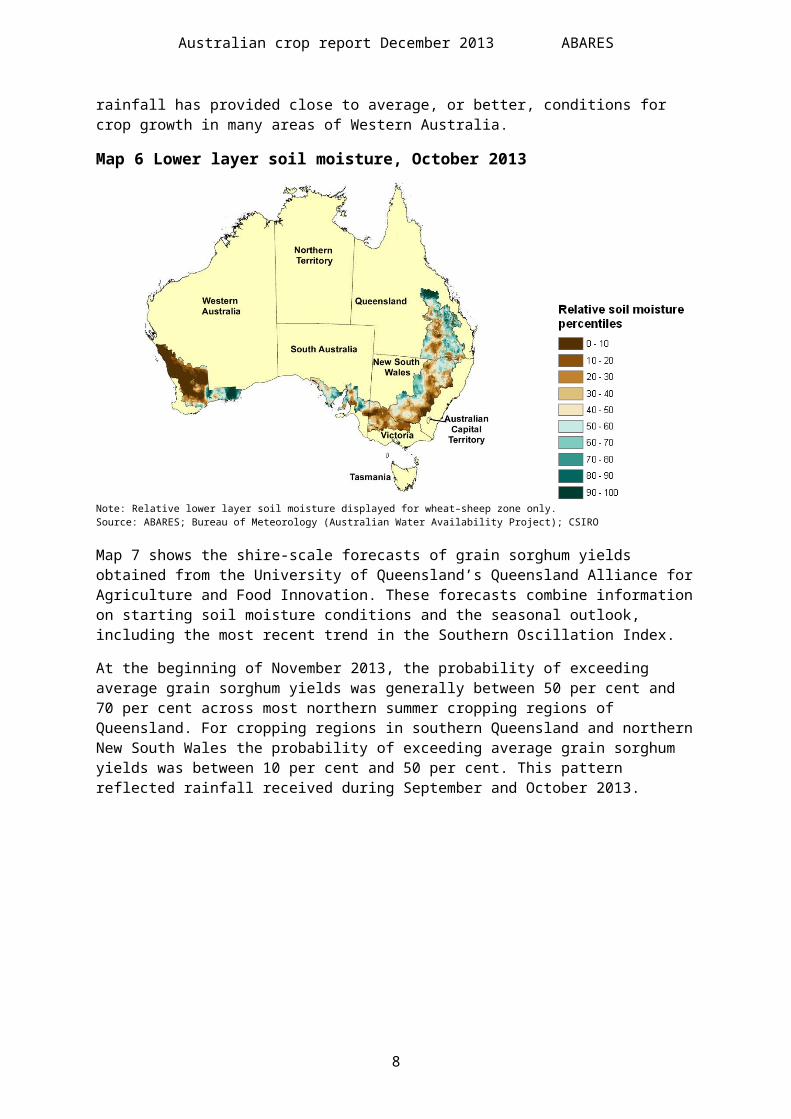
Maps 5 and 6 show the relative levels of modelled upper layer soil moisture (~0.2 metres) and lower layer soil moisture (~0.2 to ~1.5 metres) at the end of October 2013 for cropping zones across Australia.
Soil moisture estimates are relative to the long-term record and ranked in percentiles. The 90th to 100th percentiles indicate where the estimated soil moisture level for October 2013 falls into the 10 wettest months, relative to estimated soil moisture levels for that month averaged over a 100-year period. The zero to 10th percentiles indicate where the estimated soil moisture levels for October 2013 fell into the 10 driest months, relative to estimated soil moisture levels for that month averaged over a 100-year period. These data are sourced from a collaborative project between the Bureau of Meteorology, the Commonwealth Scientific and Industrial Research Organisation (CSIRO) and ABARES to develop estimates of soil moisture and other components of water balance at high resolution across Australia.
Upper layer soil moisture responds quickly to seasonal conditions and will often show a pattern that reflects the rainfall and temperature events of the same month. Lower layer soil moisture is a larger, deeper store that is slower to respond and tends to reflect the accumulated effects of events that have occurred over longer periods of time.
Relative upper layer soil moisture in the eastern Australian cropping zones at the end of October 2013 (Map 5) was predominantly extremely low to below average, which reflects the extended periods of widespread rainfall deficiencies during 2013. By contrast, upper layer soil moisture was near to average or above for much of the Western Australian cropping zone.
4
Australian crop report December 2013 ABARES
Map 5 Upper layer soil moisture, October 2013
Note: Relative upper layer soil moisture displayed for wheat–sheep zone only.Source: ABARES; Bureau of Meteorology (Australian Water Availability Project); CSIRO
Relative soil moisture in the lower layer at the end of October 2013 was above average in the eastern cropping areas in Queensland, but largely below average throughout most of New South Wales and Victoria (Map 6). The lower layer soil moisture in southern parts of eastern Australia has declined steadily over recent months. The lower layer soil moisture in Western Australian cropping zones at the end of October 2013 was predominantly extremely low with the exception of the eastern part of the southern agricultural region. Despite the reduced lower layer soil moisture, timely in-crop rainfall has provided close to average, or better, conditions for crop growth in many areas of Western Australia.
Map 6 Lower layer soil moisture, October 2013
Note: Relative lower layer soil moisture displayed for wheat–sheep zone only.Source: ABARES; Bureau of Meteorology (Australian Water Availability Project); CSIRO
5
Australian crop report December 2013 ABARES
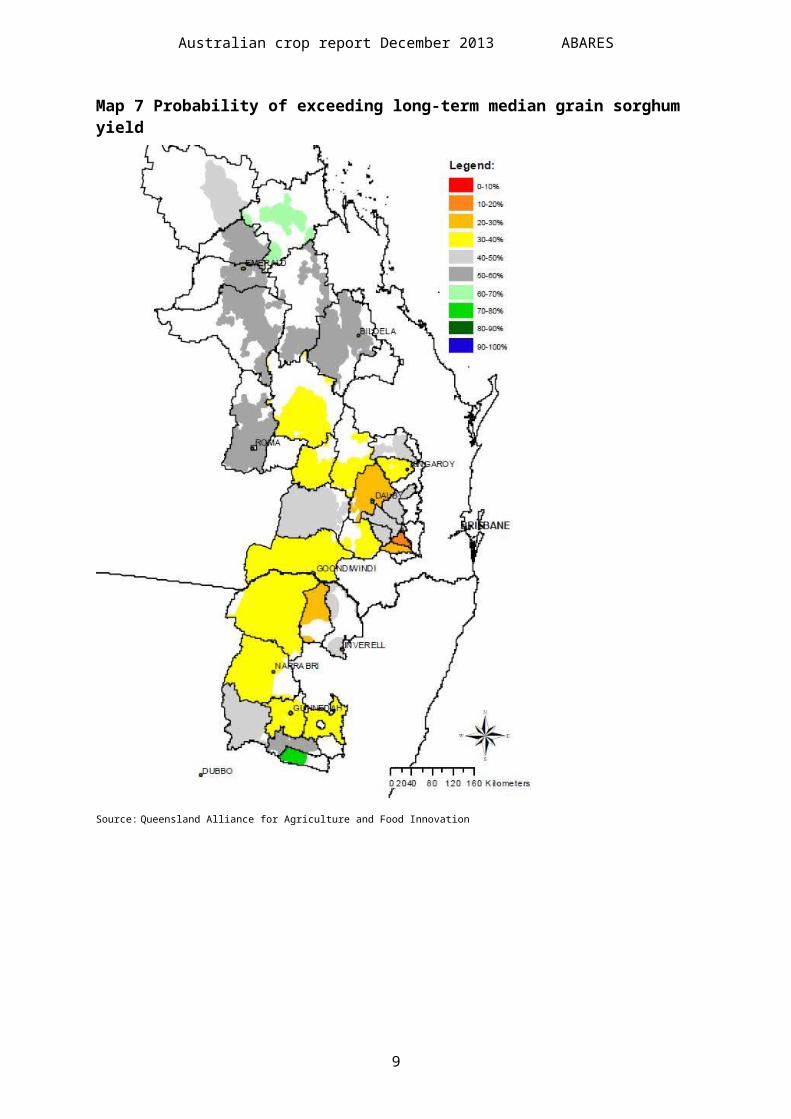
Map 7 shows the shire-scale forecasts of grain sorghum yields obtained from the University of Queensland’s Queensland Alliance for Agriculture and Food Innovation. These forecasts combine information on starting soil moisture conditions and the seasonal outlook, including the most recent trend in the Southern Oscillation Index.
At the beginning of November 2013, the probability of exceeding average grain sorghum yields was generally between 50 per cent and 70 per cent across most northern summer cropping regions of Queensland. For cropping regions in southern Queensland and northern New South Wales the probability of exceeding average grain sorghum yields was between 10 per cent and 50 per cent. This pattern reflected rainfall received during September and October 2013.
Map 7 Probability of exceeding long-term median grain sorghum yield
Source: Queensland Alliance for Agriculture and Food Innovation
6
Australian crop report December 2013 ABARES
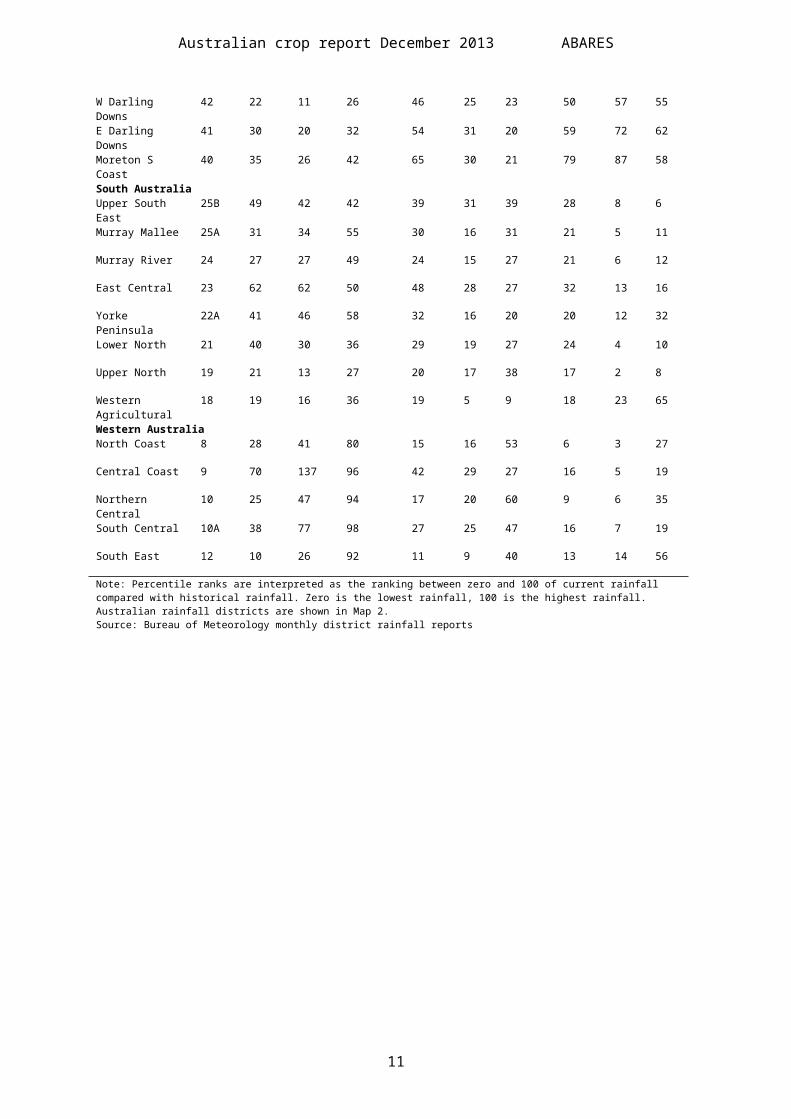
Table 1 Rainfall in major cropping districtsDistrictnumber
Sepmedian
Sep2013
Sep2013
Octmedian
Oct2013
Oct2013
Novmedian
Nov2013
Nov2013
mm mm rank mm mm rank mm mm rankNew South WalesN W Plains (W) 52 22 23 53 32 6 4 38 24 30
N W Plains (E) 53 30 24 42 40 11 5 50 50 49
N W Slopes (N) 54 36 29 36 53 22 13 64 76 60
N W Slopes (S) 55 41 28 32 54 15 12 66 93 75
N Tablelands (N) 56 46 32 28 69 29 8 83 107 68
C W Plains (S) 50 28 45 77 29 8 7 30 10 17
C W Plains (N) 51 21 34 70 28 4 5 33 8 11
C W Slopes (N) 64 35 39 57 43 9 9 52 29 31
C W Slopes (S) 65 40 47 62 42 12 8 41 33 41
C Tablelands (N) 62 42 50 61 49 10 5 61 47 42
C Tablelands (S) 63 56 41 27 65 20 9 62 69 55
Riverina (W) 75 26 29 54 26 9 12 22 10 22
Riverina (E) 74 35 37 55 38 15 13 29 20 33
S W Slopes (N) 73 52 43 37 49 21 12 48 31 33
S W Slopes (S) 72 96 95 50 96 60 27 74 45 23
VictoriaN Mallee 76 25 25 51 26 16 35 19 6 15
S Mallee 77 34 38 59 29 23 41 25 6 11
N Wimmera 78 41 50 60 34 34 50 27 9 12
S Wimmera 79 57 56 49 47 58 64 33 15 19
Lower North 80 34 42 62 34 18 23 24 12 23
Upper North 81 48 50 53 44 31 33 33 23 33
Lower North East 82 95 76 32 95 55 22 66 32 13
North Central 88 73 84 58 73 62 42 55 42 34
Western Plains 89 64 56 39 59 83 81 48 31 28
West Coast 90 81 78 46 69 116 91 54 59 56
QueenslandCentral Highlands 35 13 3 21 38 14 19 54 78 71
Maranoa 43 17 5 22 37 23 27 54 57 53
W Darling Downs 42 22 11 26 46 25 23 50 57 55
E Darling Downs 41 30 20 32 54 31 20 59 72 62
Moreton S Coast 40 35 26 42 65 30 21 79 87 58
7
Australian crop report December 2013 ABARES
South AustraliaUpper South East 25B 49 42 42 39 31 39 28 8 6
Murray Mallee 25A 31 34 55 30 16 31 21 5 11
Murray River 24 27 27 49 24 15 27 21 6 12
East Central 23 62 62 50 48 28 27 32 13 16
Yorke Peninsula 22A 41 46 58 32 16 20 20 12 32
Lower North 21 40 30 36 29 19 27 24 4 10
Upper North 19 21 13 27 20 17 38 17 2 8
Western Agricultural 18 19 16 36 19 5 9 18 23 65
Western AustraliaNorth Coast 8 28 41 80 15 16 53 6 3 27
Central Coast 9 70 137 96 42 29 27 16 5 19
Northern Central 10 25 47 94 17 20 60 9 6 35
South Central 10A 38 77 98 27 25 47 16 7 19
South East 12 10 26 92 11 9 40 13 14 56
Note: Percentile ranks are interpreted as the ranking between zero and 100 of current rainfall compared with historical rainfall. Zero is the lowest rainfall, 100 is the highest rainfall. Australian rainfall districts are shown in Map 2.Source: Bureau of Meteorology monthly district rainfall reports
8
Australian crop report December 2013 ABARES
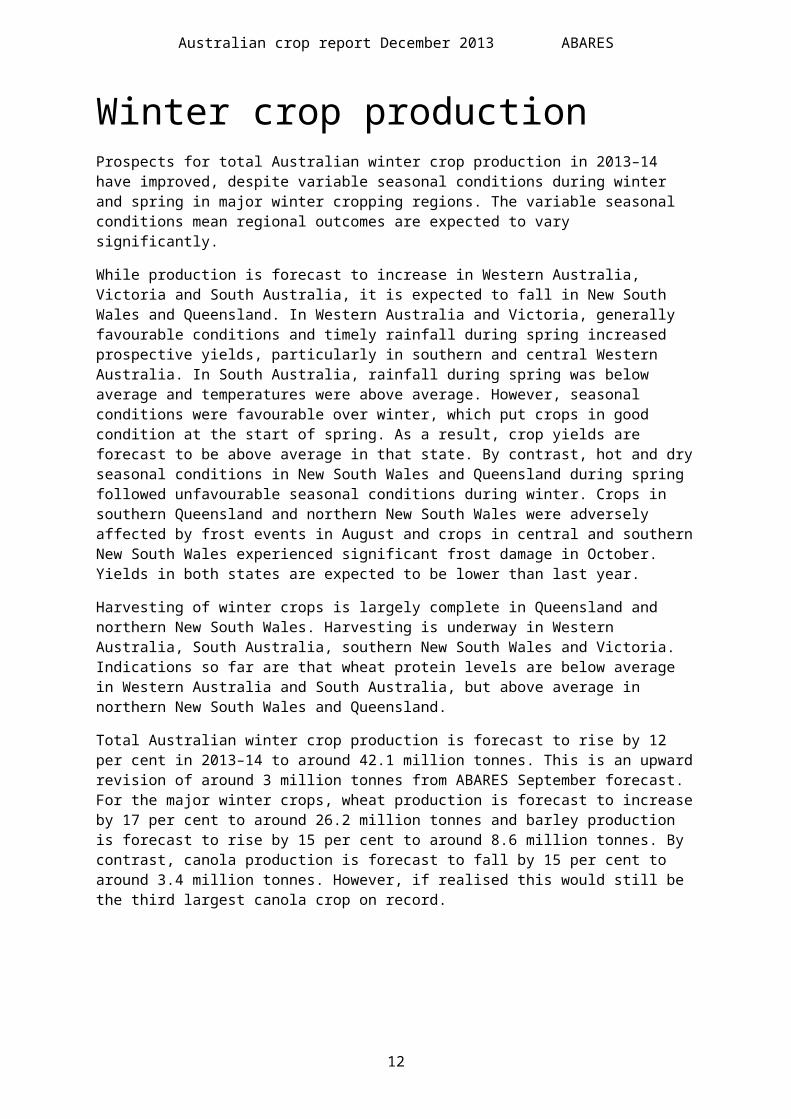
Winter crop productionProspects for total Australian winter crop production in 2013–14 have improved, despite variable seasonal conditions during winter and spring in major winter cropping regions. The variable seasonal conditions mean regional outcomes are expected to vary significantly.
While production is forecast to increase in Western Australia, Victoria and South Australia, it is expected to fall in New South Wales and Queensland. In Western Australia and Victoria, generally favourable conditions and timely rainfall during spring increased prospective yields, particularly in southern and central Western Australia. In South Australia, rainfall during spring was below average and temperatures were above average. However, seasonal conditions were favourable over winter, which put crops in good condition at the start of spring. As a result, crop yields are forecast to be above average in that state. By contrast, hot and dry seasonal conditions in New South Wales and Queensland during spring followed unfavourable seasonal conditions during winter. Crops in southern Queensland and northern New South Wales were adversely affected by frost events in August and crops in central and southern New South Wales experienced significant frost damage in October. Yields in both states are expected to be lower than last year.
Harvesting of winter crops is largely complete in Queensland and northern New South Wales. Harvesting is underway in Western Australia, South Australia, southern New South Wales and Victoria. Indications so far are that wheat protein levels are below average in Western Australia and South Australia, but above average in northern New South Wales and Queensland.
Total Australian winter crop production is forecast to rise by 12 per cent in 2013–14 to around 42.1 million tonnes. This is an upward revision of around 3 million tonnes from ABARES September forecast. For the major winter crops, wheat production is forecast to increase by 17 per cent to around 26.2 million tonnes and barley production is forecast to rise by 15 per cent to around 8.6 million tonnes. By contrast, canola production is forecast to fall by 15 per cent to around 3.4 million tonnes. However, if realised this would still be the third largest canola crop on record.
9
Australian crop report December 2013 ABARES
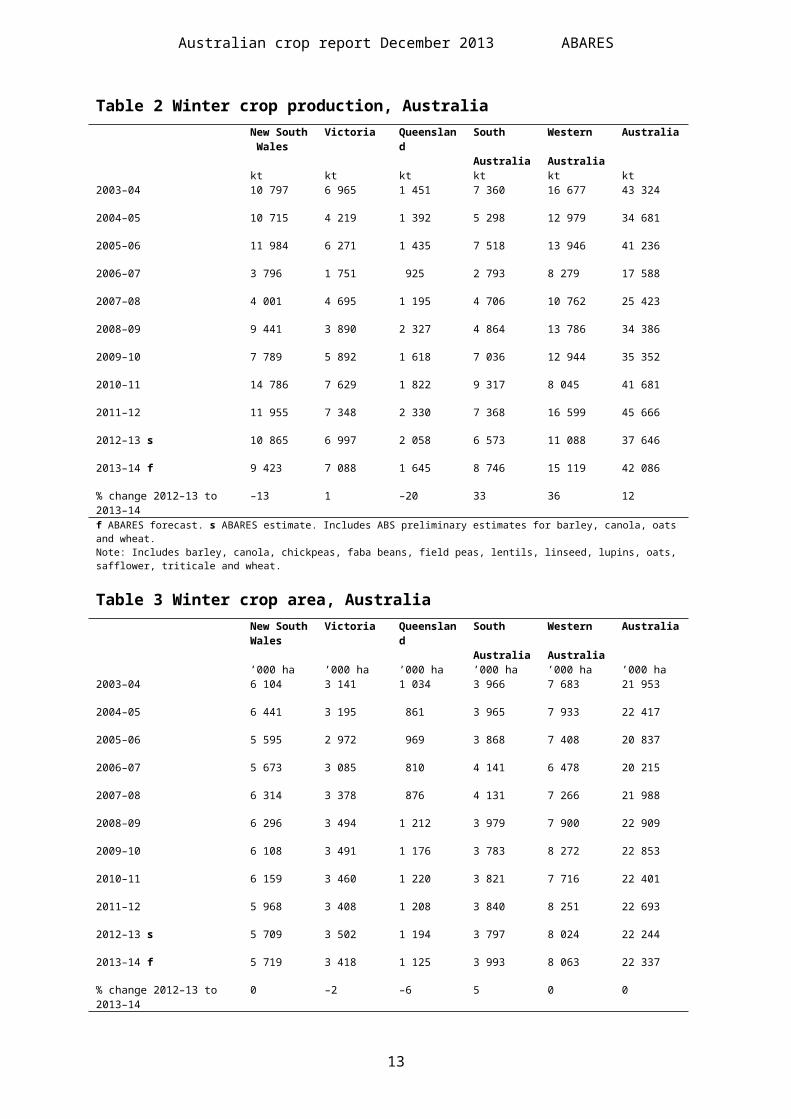
Table 2 Winter crop production, AustraliaNew South Wales
Victoria Queensland South Australia
Western Australia
Australia
kt kt kt kt kt kt2003–04 10 797 6 965 1 451 7 360 16 677 43 324
2004–05 10 715 4 219 1 392 5 298 12 979 34 681
2005–06 11 984 6 271 1 435 7 518 13 946 41 236
2006–07 3 796 1 751 925 2 793 8 279 17 588
2007–08 4 001 4 695 1 195 4 706 10 762 25 423
2008–09 9 441 3 890 2 327 4 864 13 786 34 386
2009–10 7 789 5 892 1 618 7 036 12 944 35 352
2010–11 14 786 7 629 1 822 9 317 8 045 41 681
2011–12 11 955 7 348 2 330 7 368 16 599 45 666
2012–13 s 10 865 6 997 2 058 6 573 11 088 37 646
2013–14 f 9 423 7 088 1 645 8 746 15 119 42 086
% change 2012–13 to 2013–14 –13 1 –20 33 36 12
f ABARES forecast. s ABARES estimate. Includes ABS preliminary estimates for barley, canola, oats and wheat.Note: Includes barley, canola, chickpeas, faba beans, field peas, lentils, linseed, lupins, oats, safflower, triticale and wheat.
Table 3 Winter crop area, AustraliaNew SouthWales
Victoria Queensland South Australia
Western Australia
Australia
’000 ha ’000 ha ’000 ha ’000 ha ’000 ha ’000 ha2003–04 6 104 3 141 1 034 3 966 7 683 21 953
2004–05 6 441 3 195 861 3 965 7 933 22 417
2005–06 5 595 2 972 969 3 868 7 408 20 837
2006–07 5 673 3 085 810 4 141 6 478 20 215
2007–08 6 314 3 378 876 4 131 7 266 21 988
2008–09 6 296 3 494 1 212 3 979 7 900 22 909
2009–10 6 108 3 491 1 176 3 783 8 272 22 853
2010–11 6 159 3 460 1 220 3 821 7 716 22 401
2011–12 5 968 3 408 1 208 3 840 8 251 22 693
2012–13 s 5 709 3 502 1 194 3 797 8 024 22 244
2013–14 f 5 719 3 418 1 125 3 993 8 063 22 337
% change 2012–13 to 2013–14 0 –2 –6 5 0 0
f ABARES forecast. s ABARES estimate. Includes ABS preliminary estimates for barley, canola, oats and wheat.Note: Includes barley, canola, chickpeas, faba beans, field peas, lentils, linseed, lupins, oats, safflower, triticale and wheat.
10
Australian crop report December 2013 ABARES
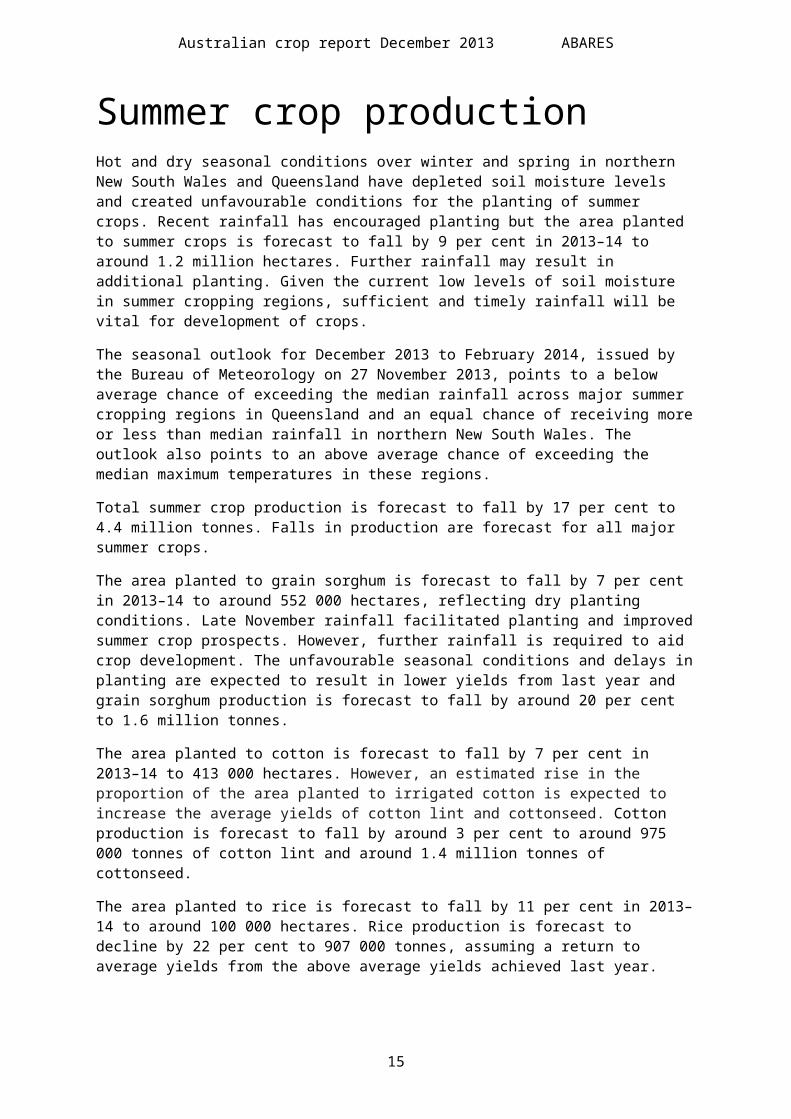
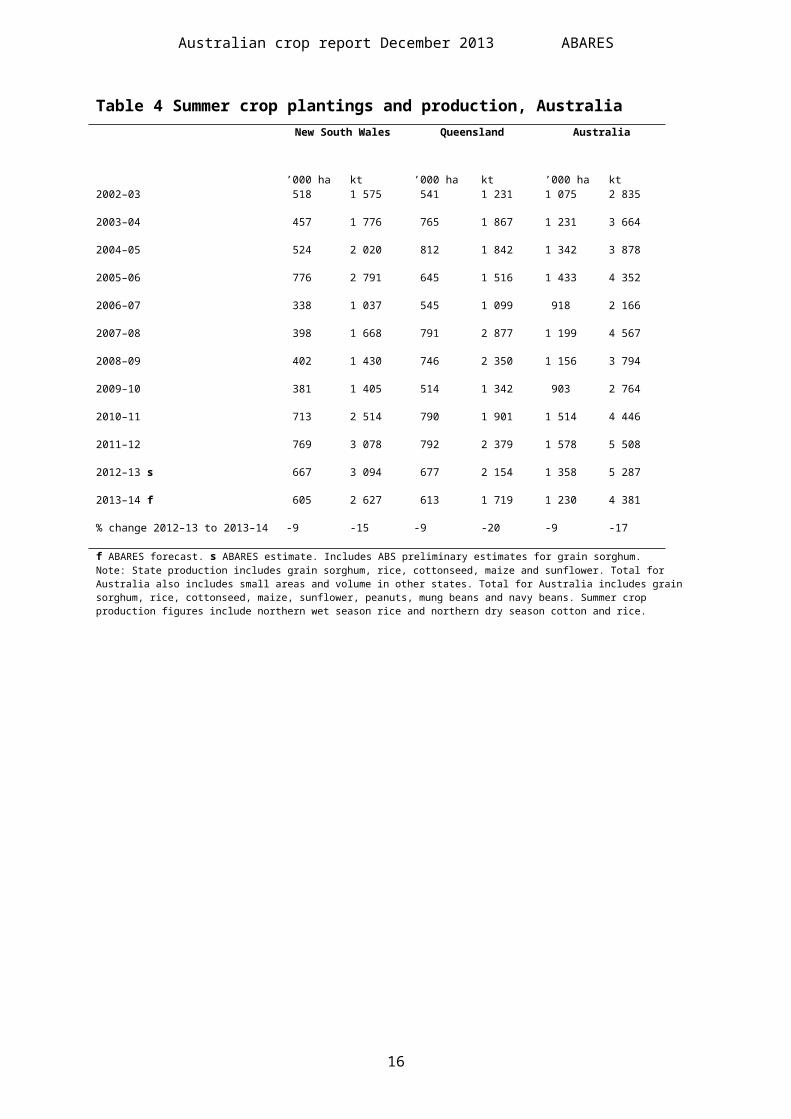
Summer crop productionHot and dry seasonal conditions over winter and spring in northern New South Wales and Queensland have depleted soil moisture levels and created unfavourable conditions for the planting of summer crops. Recent rainfall has encouraged planting but the area planted to summer crops is forecast to fall by 9 per cent in 2013–14 to around 1.2 million hectares. Further rainfall may result in additional planting. Given the current low levels of soil moisture in summer cropping regions, sufficient and timely rainfall will be vital for development of crops.
The seasonal outlook for December 2013 to February 2014, issued by the Bureau of Meteorology on 27 November 2013, points to a below average chance of exceeding the median rainfall across major summer cropping regions in Queensland and an equal chance of receiving more or less than median rainfall in northern New South Wales. The outlook also points to an above average chance of exceeding the median maximum temperatures in these regions.
Total summer crop production is forecast to fall by 17 per cent to 4.4 million tonnes. Falls in production are forecast for all major summer crops.
The area planted to grain sorghum is forecast to fall by 7 per cent in 2013–14 to around 552 000 hectares, reflecting dry planting conditions. Late November rainfall facilitated planting and improved summer crop prospects. However, further rainfall is required to aid crop development. The unfavourable seasonal conditions and delays in planting are expected to result in lower yields from last year and grain sorghum production is forecast to fall by around 20 per cent to 1.6 million tonnes.
The area planted to cotton is forecast to fall by 7 per cent in 2013–14 to 413 000 hectares. However, an estimated rise in the proportion of the area planted to irrigated cotton is expected to increase the average yields of cotton lint and cottonseed. Cotton production is forecast to fall by around 3 per cent to around 975 000 tonnes of cotton lint and around 1.4 million tonnes of cottonseed.
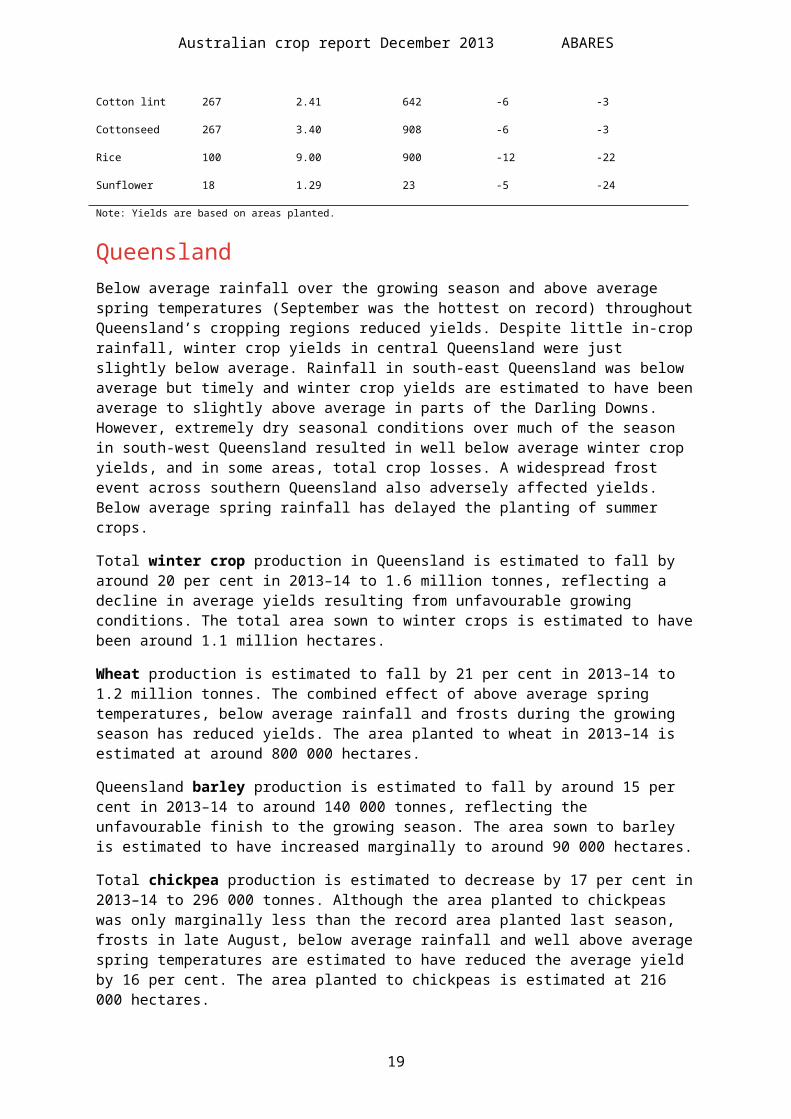
The area planted to rice is forecast to fall by 11 per cent in 2013–14 to around 100 000 hectares. Rice production is forecast to decline by 22 per cent to 907 000 tonnes, assuming a return to average yields from the above average yields achieved last year.
Table 4 Summer crop plantings and production, Australia
New South Wales Queensland Australia
’000 ha kt ’000 ha kt ’000 ha kt2002–03 518 1 575 541 1 231 1 075 2 835
2003–04 457 1 776 765 1 867 1 231 3 664
2004–05 524 2 020 812 1 842 1 342 3 878
2005–06 776 2 791 645 1 516 1 433 4 352
2006–07 338 1 037 545 1 099 918 2 166
2007–08 398 1 668 791 2 877 1 199 4 567
2008–09 402 1 430 746 2 350 1 156 3 794
2009–10 381 1 405 514 1 342 903 2 764
2010–11 713 2 514 790 1 901 1 514 4 446
11
Australian crop report December 2013 ABARES
2011–12 769 3 078 792 2 379 1 578 5 508
2012–13 s 667 3 094 677 2 154 1 358 5 287
2013–14 f 605 2 627 613 1 719 1 230 4 381
% change 2012–13 to 2013–14 -9 -15 -9 -20 -9 -17
f ABARES forecast. s ABARES estimate. Includes ABS preliminary estimates for grain sorghum.Note: State production includes grain sorghum, rice, cottonseed, maize and sunflower. Total for Australia also includes small areas and volume in other states. Total for Australia includes grain sorghum, rice, cottonseed, maize, sunflower, peanuts, mung beans and navy beans. Summer crop production figures include northern wet season rice and northern dry season cotton and rice.
12

Australian crop report December 2013 ABARES
Crop conditions and production forecasts, by stateNew South WalesSeasonal conditions in New South Wales have not been favourable during the latter part of the 2013–14 winter cropping season. Although average to above average September rainfall was received across central and southern New South Wales, hot conditions and gusty winds reduced the prospective yields of many crops. October rainfall was below to very much below average across most cropping regions and strong gusty winds and high temperatures further reduced prospective yields. Additionally, several significant frost events during October adversely affected moisture stressed crops, particularly canola in southern New South Wales. Dry conditions in north-west New South Wales for much of the season resulted in well below average yields.
Total winter crop production in New South Wales is estimated to fall by 13 per cent in 2013–14 to around 9.4 million tonnes. Winter crop yields are estimated to be below average, reflecting unfavourable seasonal conditions and significant frost damage.
Wheat production is forecast to decrease by 6 per cent in 2013–14 to around 6.7 million tonnes. The area planted to wheat in New South Wales in 2013–14 is estimated to be 3.8 million hectares.
Barley production is forecast to fall by around 10 per cent in 2013–14 to just under 1.2 million tonnes, which reflects a reduction in yields. The area planted to barley is estimated at 670 000 hectares.
Canola production is forecast to fall by 46 per cent in 2013–14 to around 715 000 tonnes, reflecting the combined effects of a decline in the planted area and lower yields. A combination of record high temperatures, below average spring rainfall, gusty winds and severe frosts greatly reduced yields across many canola growing regions. The area planted to canola is estimated to have fallen by 41 per cent to around 550 000 hectares.
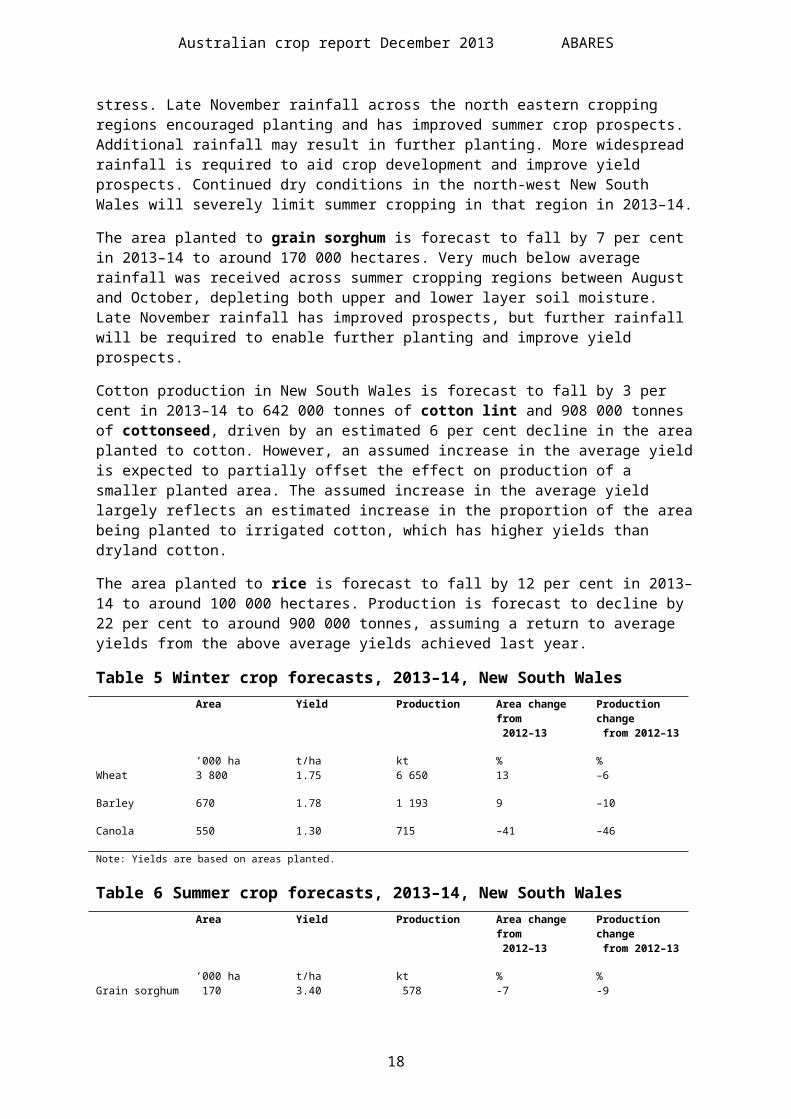
The area planted to summer crops in New South Wales is forecast to fall by 9 per cent in 2013–14 to around 605 000 hectares. Significant spring rainfall deficiencies throughout the summer cropping regions of northern New South Wales delayed planting of summer crops and caused early planted crops to suffer moisture stress. Late November rainfall across the north eastern cropping regions encouraged planting and has improved summer crop prospects. Additional rainfall may result in further planting. More widespread rainfall is required to aid crop development and improve yield prospects. Continued dry conditions in the north-west New South Wales will severely limit summer cropping in that region in 2013–14.
The area planted to grain sorghum is forecast to fall by 7 per cent in 2013–14 to around 170 000 hectares. Very much below average rainfall was received across summer cropping regions between August and October, depleting both upper and lower layer soil moisture. Late November rainfall has improved prospects, but further rainfall will be required to enable further planting and improve yield prospects.
Cotton production in New South Wales is forecast to fall by 3 per cent in 2013–14 to 642 000 tonnes of cotton lint and 908 000 tonnes of cottonseed, driven by an estimated 6 per cent decline in the area planted to cotton. However, an assumed increase in the average yield is expected to partially offset the effect on production of a smaller planted area. The assumed
13
Australian crop report December 2013 ABARES
increase in the average yield largely reflects an estimated increase in the proportion of the area being planted to irrigated cotton, which has higher yields than dryland cotton.
The area planted to rice is forecast to fall by 12 per cent in 2013–14 to around 100 000 hectares. Production is forecast to decline by 22 per cent to around 900 000 tonnes, assuming a return to average yields from the above average yields achieved last year.
Table 5 Winter crop forecasts, 2013–14, New South WalesArea Yield Production Area change from
2012–13Production change from 2012–13
’000 ha t/ha kt % %Wheat 3 800 1.75 6 650 13 –6
Barley 670 1.78 1 193 9 –10
Canola 550 1.30 715 –41 –46
Note: Yields are based on areas planted.
Table 6 Summer crop forecasts, 2013–14, New South WalesArea Yield Production Area change from
2012–13Production change from 2012–13
’000 ha t/ha kt % %Grain sorghum 170 3.40 578 -7 -9
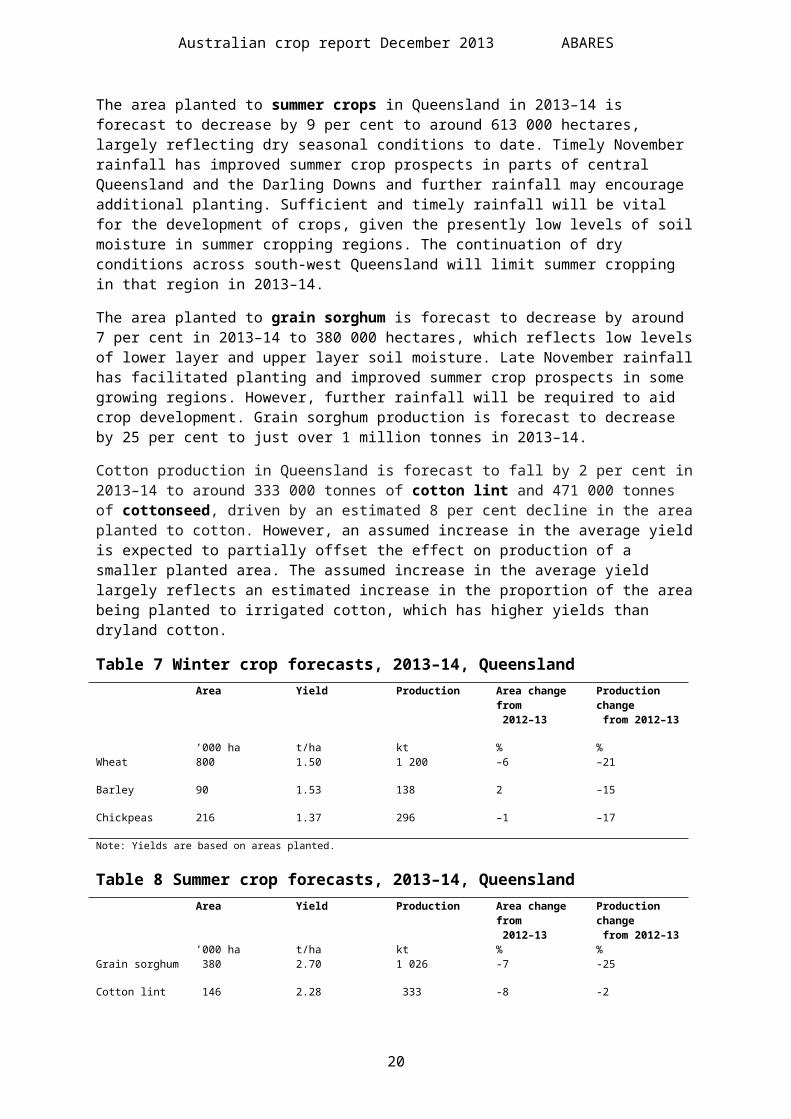
Cotton lint 267 2.41 642 -6 -3
Cottonseed 267 3.40 908 -6 -3
Rice 100 9.00 900 -12 -22
Sunflower 18 1.29 23 -5 -24
Note: Yields are based on areas planted.
QueenslandBelow average rainfall over the growing season and above average spring temperatures (September was the hottest on record) throughout Queensland’s cropping regions reduced yields. Despite little in-crop rainfall, winter crop yields in central Queensland were just slightly below average. Rainfall in south-east Queensland was below average but timely and winter crop yields are estimated to have been average to slightly above average in parts of the Darling Downs. However, extremely dry seasonal conditions over much of the season in south-west Queensland resulted in well below average winter crop yields, and in some areas, total crop losses. A widespread frost event across southern Queensland also adversely affected yields. Below average spring rainfall has delayed the planting of summer crops.
Total winter crop production in Queensland is estimated to fall by around 20 per cent in 2013–14 to 1.6 million tonnes, reflecting a decline in average yields resulting from unfavourable growing conditions. The total area sown to winter crops is estimated to have been around 1.1 million hectares.
Wheat production is estimated to fall by 21 per cent in 2013–14 to 1.2 million tonnes. The combined effect of above average spring temperatures, below average rainfall and frosts during the growing season has reduced yields. The area planted to wheat in 2013–14 is estimated at around 800 000 hectares.
14
Australian crop report December 2013 ABARES
Queensland barley production is estimated to fall by around 15 per cent in 2013–14 to around 140 000 tonnes, reflecting the unfavourable finish to the growing season. The area sown to barley is estimated to have increased marginally to around 90 000 hectares.
Total chickpea production is estimated to decrease by 17 per cent in 2013–14 to 296 000 tonnes. Although the area planted to chickpeas was only marginally less than the record area planted last season, frosts in late August, below average rainfall and well above average spring temperatures are estimated to have reduced the average yield by 16 per cent. The area planted to chickpeas is estimated at 216 000 hectares.
The area planted to summer crops in Queensland in 2013–14 is forecast to decrease by 9 per cent to around 613 000 hectares, largely reflecting dry seasonal conditions to date. Timely November rainfall has improved summer crop prospects in parts of central Queensland and the Darling Downs and further rainfall may encourage additional planting. Sufficient and timely rainfall will be vital for the development of crops, given the presently low levels of soil moisture in summer cropping regions. The continuation of dry conditions across south-west Queensland will limit summer cropping in that region in 2013–14.
The area planted to grain sorghum is forecast to decrease by around 7 per cent in 2013–14 to 380 000 hectares, which reflects low levels of lower layer and upper layer soil moisture. Late November rainfall has facilitated planting and improved summer crop prospects in some growing regions. However, further rainfall will be required to aid crop development. Grain sorghum production is forecast to decrease by 25 per cent to just over 1 million tonnes in 2013–14.
Cotton production in Queensland is forecast to fall by 2 per cent in 2013–14 to around 333 000 tonnes of cotton lint and 471 000 tonnes of cottonseed, driven by an estimated 8 per cent decline in the area planted to cotton. However, an assumed increase in the average yield is expected to partially offset the effect on production of a smaller planted area. The assumed increase in the average yield largely reflects an estimated increase in the proportion of the area being planted to irrigated cotton, which has higher yields than dryland cotton.
Table 7 Winter crop forecasts, 2013–14, QueenslandArea Yield Production Area change from
2012–13Production change from 2012–13
’000 ha t/ha kt % %Wheat 800 1.50 1 200 –6 –21
Barley 90 1.53 138 2 –15
Chickpeas 216 1.37 296 –1 –17
Note: Yields are based on areas planted.
Table 8 Summer crop forecasts, 2013–14, QueenslandArea Yield Production Area change from
2012–13Production change from 2012–13
’000 ha t/ha kt % %Grain sorghum 380 2.70 1 026 -7 -25
Cotton lint 146 2.28 333 -8 -2
Cottonseed 146 3.22 471 -8 -2
Sunflower 8 1.00 8 -20 -33
Note: Yields are based on areas planted.
15
Australian crop report December 2013 ABARES
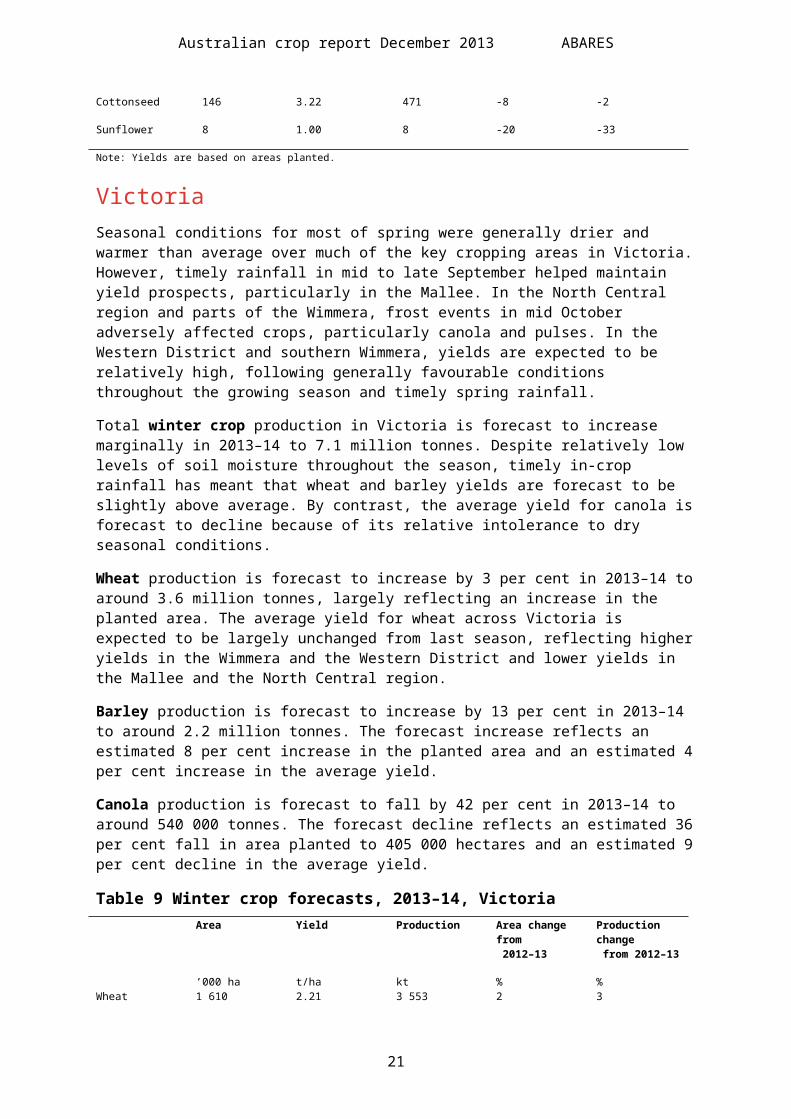
VictoriaSeasonal conditions for most of spring were generally drier and warmer than average over much of the key cropping areas in Victoria. However, timely rainfall in mid to late September helped maintain yield prospects, particularly in the Mallee. In the North Central region and parts of the Wimmera, frost events in mid October adversely affected crops, particularly canola and pulses. In the Western District and southern Wimmera, yields are expected to be relatively high, following generally favourable conditions throughout the growing season and timely spring rainfall.
Total winter crop production in Victoria is forecast to increase marginally in 2013–14 to 7.1 million tonnes. Despite relatively low levels of soil moisture throughout the season, timely in-crop rainfall has meant that wheat and barley yields are forecast to be slightly above average. By contrast, the average yield for canola is forecast to decline because of its relative intolerance to dry seasonal conditions.
Wheat production is forecast to increase by 3 per cent in 2013–14 to around 3.6 million tonnes, largely reflecting an increase in the planted area. The average yield for wheat across Victoria is expected to be largely unchanged from last season, reflecting higher yields in the Wimmera and the Western District and lower yields in the Mallee and the North Central region.
Barley production is forecast to increase by 13 per cent in 2013–14 to around 2.2 million tonnes. The forecast increase reflects an estimated 8 per cent increase in the planted area and an estimated 4 per cent increase in the average yield.
Canola production is forecast to fall by 42 per cent in 2013–14 to around 540 000 tonnes. The forecast decline reflects an estimated 36 per cent fall in area planted to 405 000 hectares and an estimated 9 per cent decline in the average yield.
Table 9 Winter crop forecasts, 2013–14, VictoriaArea Yield Production Area change from
2012–13Production change from 2012–13
’000 ha t/ha kt % %Wheat 1 610 2.21 3 553 2 3
Barley 915 2.41 2 204 8 13
Canola 405 1.33 539 –36 –42
Note: Yields are based on areas planted.
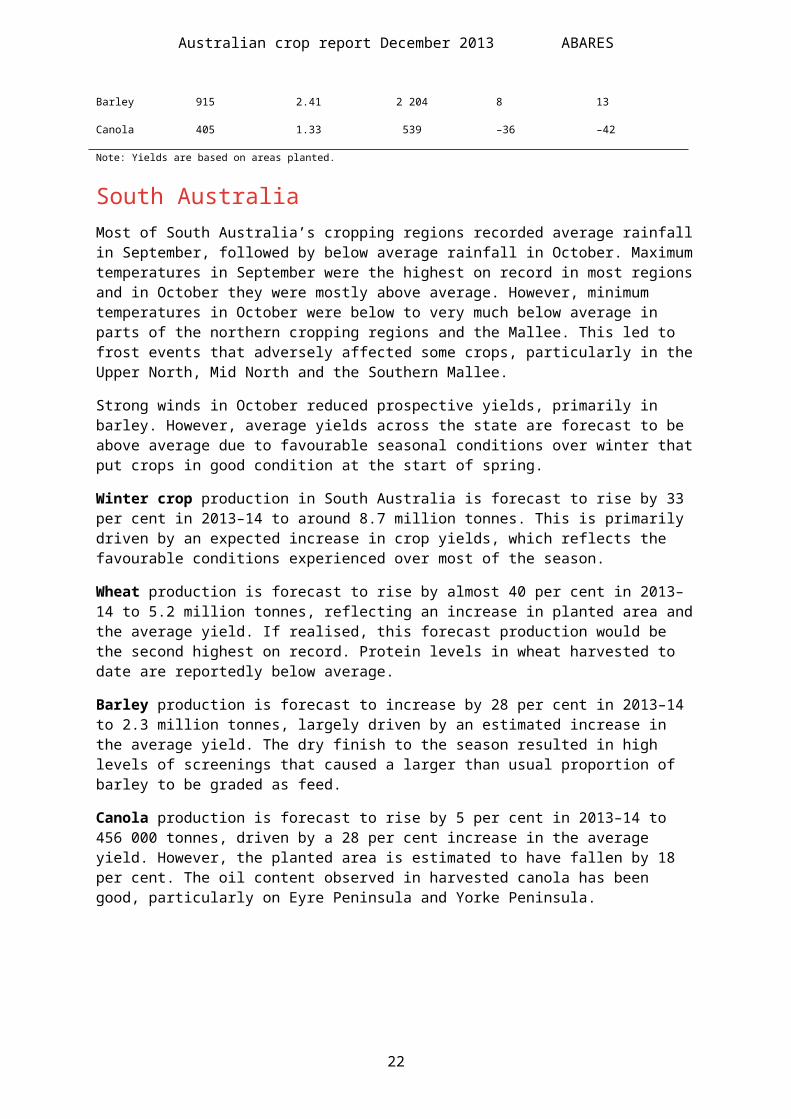
South AustraliaMost of South Australia’s cropping regions recorded average rainfall in September, followed by below average rainfall in October. Maximum temperatures in September were the highest on record in most regions and in October they were mostly above average. However, minimum temperatures in October were below to very much below average in parts of the northern cropping regions and the Mallee. This led to frost events that adversely affected some crops, particularly in the Upper North, Mid North and the Southern Mallee.
Strong winds in October reduced prospective yields, primarily in barley. However, average yields across the state are forecast to be above average due to favourable seasonal conditions over winter that put crops in good condition at the start of spring.
16
Australian crop report December 2013 ABARES
Winter crop production in South Australia is forecast to rise by 33 per cent in 2013–14 to around 8.7 million tonnes. This is primarily driven by an expected increase in crop yields, which reflects the favourable conditions experienced over most of the season.
Wheat production is forecast to rise by almost 40 per cent in 2013–14 to 5.2 million tonnes, reflecting an increase in planted area and the average yield. If realised, this forecast production would be the second highest on record. Protein levels in wheat harvested to date are reportedly below average.
Barley production is forecast to increase by 28 per cent in 2013–14 to 2.3 million tonnes, largely driven by an estimated increase in the average yield. The dry finish to the season resulted in high levels of screenings that caused a larger than usual proportion of barley to be graded as feed.
Canola production is forecast to rise by 5 per cent in 2013–14 to 456 000 tonnes, driven by a 28 per cent increase in the average yield. However, the planted area is estimated to have fallen by 18 per cent. The oil content observed in harvested canola has been good, particularly on Eyre Peninsula and Yorke Peninsula.
17
Australian crop report December 2013 ABARES
Table 10 Winter crop forecasts, 2013–14, South AustraliaArea Yield Production Area change from
2012–13Production change from 2012–13
’000 ha t/ha kt % %Wheat 2 279 2.27 5 173 9 39
Barley 925 2.47 2 285 8 28
Canola 285 1.60 456 –18 5
Note: Yields are based on areas planted.
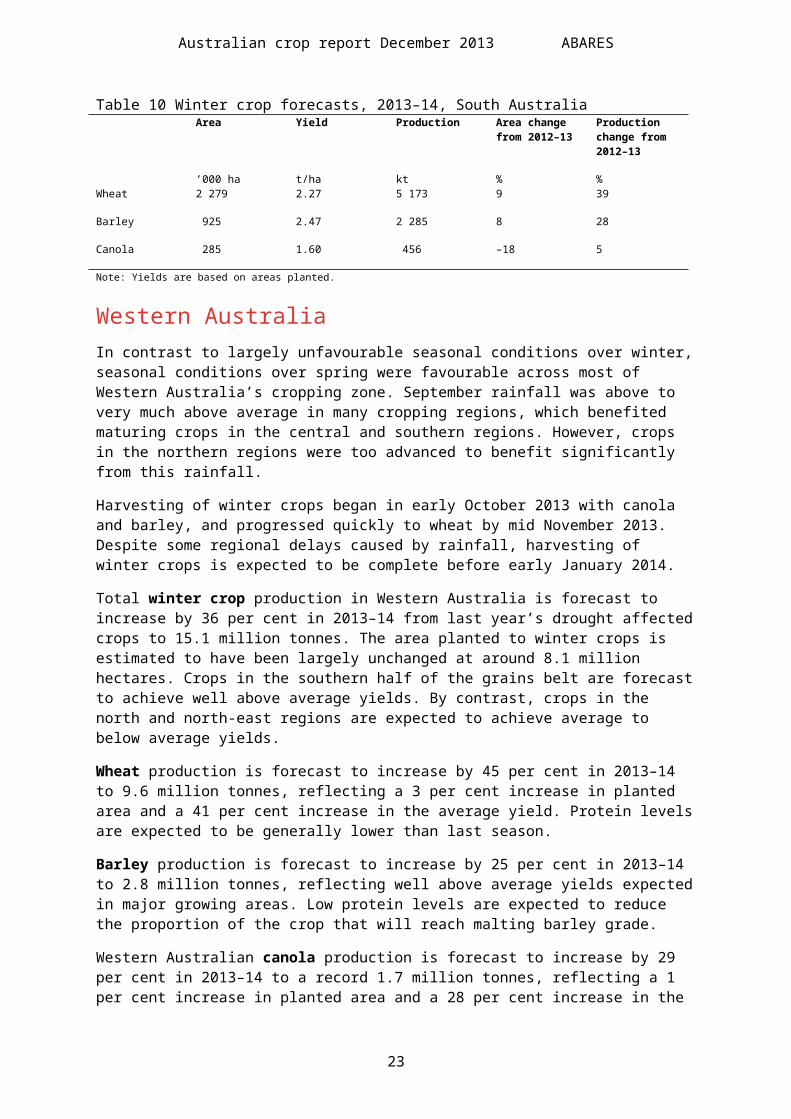
Western AustraliaIn contrast to largely unfavourable seasonal conditions over winter, seasonal conditions over spring were favourable across most of Western Australia’s cropping zone. September rainfall was above to very much above average in many cropping regions, which benefited maturing crops in the central and southern regions. However, crops in the northern regions were too advanced to benefit significantly from this rainfall.
Harvesting of winter crops began in early October 2013 with canola and barley, and progressed quickly to wheat by mid November 2013. Despite some regional delays caused by rainfall, harvesting of winter crops is expected to be complete before early January 2014.
Total winter crop production in Western Australia is forecast to increase by 36 per cent in 2013–14 from last year’s drought affected crops to 15.1 million tonnes. The area planted to winter crops is estimated to have been largely unchanged at around 8.1 million hectares. Crops in the southern half of the grains belt are forecast to achieve well above average yields. By contrast, crops in the north and north-east regions are expected to achieve average to below average yields.
Wheat production is forecast to increase by 45 per cent in 2013–14 to 9.6 million tonnes, reflecting a 3 per cent increase in planted area and a 41 per cent increase in the average yield. Protein levels are expected to be generally lower than last season.
Barley production is forecast to increase by 25 per cent in 2013–14 to 2.8 million tonnes, reflecting well above average yields expected in major growing areas. Low protein levels are expected to reduce the proportion of the crop that will reach malting barley grade.
Western Australian canola production is forecast to increase by 29 per cent in 2013–14 to a record 1.7 million tonnes, reflecting a 1 per cent increase in planted area and a 28 per cent increase in the average yield. The general quality of the canola crop is reported to be excellent.
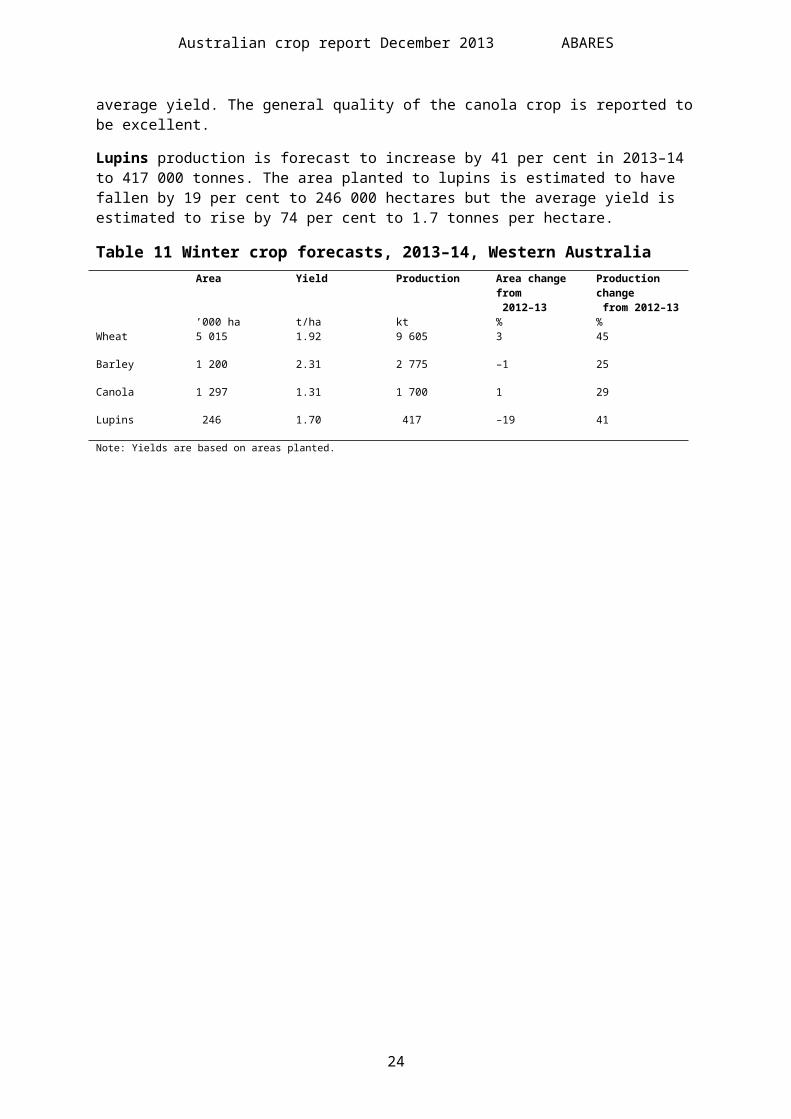
Lupins production is forecast to increase by 41 per cent in 2013–14 to 417 000 tonnes. The area planted to lupins is estimated to have fallen by 19 per cent to 246 000 hectares but the average yield is estimated to rise by 74 per cent to 1.7 tonnes per hectare.
Table 11 Winter crop forecasts, 2013–14, Western AustraliaArea Yield Production Area change from
2012–13Production change from 2012–13
’000 ha t/ha kt % %Wheat 5 015 1.92 9 605 3 45
Barley 1 200 2.31 2 775 –1 25
Canola 1 297 1.31 1 700 1 29
Lupins 246 1.70 417 –19 41
18
Australian crop report December 2013 ABARES
Note: Yields are based on areas planted.
19

20 Australian crop report December 2013 ABARES
Table 12 Australian crop productionArea planted Yield Productionaverage a 2011–12 2012–13 s 2013–14 f average a 2011–12 2012–13 s 2013–14 f average a 2011–12 2012–13 s 2013–14 f’000 ha ’000 ha ’000 ha ’000 ha t/ha t/ha t/ha t/ha kt kt kt kt
Winter cropsWheat 13 518 13 902 12 773 13 512 1.82 2.15 1.76 1.94 24 606 29 905 22 461 26 213
Barley 4 092 3 718 3 622 3 807 1.96 2.21 2.06 2.26 7 909 8 221 7 466 8 620
Canola 2 226 2 461 3 203 2 538 1.20 1.39 1.25 1.34 2 709 3 427 4 010 3 410
Chickpeas 490 456 574 507 1.22 1.48 1.42 1.24 586 673 813 629
Faba beans 154 151 203 178 1.68 1.77 1.86 2.05 264 268 377 365
Field peas 286 249 281 249 1.16 1.38 1.14 1.46 330 342 320 363
Lentils 155 173 164 168 1.29 1.67 1.12 1.43 212 288 184 241
Lupins 633 689 450 387 1.19 1.42 1.02 1.50 756 982 459 581
Oats b 795 731 699 744 1.48 1.73 1.60 1.68 1 165 1 262 1 115 1 249
Triticale 253 145 258 230 1.64 1.97 1.66 1.74 395 285 429 400
Summer cropsGrain sorghum 630 659 595 552 3.27 3.40 3.37 2.91 2 076 2 239 2 005 1 608
Cottonseed c 401 600 442 413 2.73 2.82 3.21 3.34 1 078 1 694 1 417 1 379
Cotton lint c 401 600 442 413 1.94 2.00 2.27 2.36 768 1 198 1 002 975
Rice (paddy) 64 103 114 101 9.51 8.91 10.24 8.98 613 919 1 166 907
Corn (maize) 67 70 81 58 5.94 6.47 6.13 5.78 401 451 496 335
Sunflower 37 40 30 27 1.28 1.17 1.46 1.18 46 47 44 32
a Five-year average to 2012–13. b Area harvested for grain. c Cotton area is estimated harvested area. f ABARES forecast. s ABARES estimate. Includes ABS preliminary estimates for barley, canola, grain sorghum, oats and wheat.Note: The crop year refers to crops planted during the 12 months to 31 March. Slight discrepancies may appear between tables as a result of including of the Australian Capital Territory and Northern Territory in the Australian totals. Rice, cottonseed and cotton lint include northern dry and wet season cropsSources: ABARES; Australian Bureau of Statistics; Pulse Australia
21 Australian crop report December 2013 ABARES
Table 13 State production, major cropsNew South Wales Victoria Queensland South Australia Western Australia Tasmania
area prod. area prod. area prod. area prod. area prod. area prod.’000 ha kt ’000 ha kt ’000 ha kt ’000 ha kt ’000 ha kt ’000 ha kt
Winter cropsWheat2013–14 f 3 800 6 650 1 610 3 553 800 1 200 2 279 5 173 5 015 9 605 8 32
2012–13 s 3 367 7 081 1 577 3 460 851 1 528 2 096 3 715 4 875 6 645 6 31
2011–12 3 868 8 473 1 669 3 943 953 1 886 2 249 4 525 5 156 11 045 7 32
Five-year average to 2012–13 3 871 7 671 1 675 3 313 938 1 660 2 182 4 113 4 844 7 817 7 31
Barley2013–14 f 670 1 193 915 2 204 90 138 925 2 285 1 200 2 775 7 25
2012–13 s 616 1 331 844 1 951 88 162 860 1 791 1 210 2 214 5 16
2011–12 673 1 425 831 2 005 80 191 881 1 816 1 246 2 761 6 23
Five-year average to 2012–13 819 1 527 918 1 845 84 157 955 1 935 1 307 2 417 8 27
Canola2013–14 f 550 715 405 539 1 0 285 456 1 297 1 700 0 0
2012–13 s 937 1 335 628 922 1 1 349 435 1 287 1 316 1 1
2011–12 729 1 092 477 689 1 1 283 413 969 1 232 1 1
Five-year average to 2012–13 548 748 389 530 2 2 243 334 1 043 1 094 1 1
Lupins2013–14 f 57 57 28 29 0 0 56 78 246 417 0 0
2012–13 s 58 63 29 26 0 0 61 74 303 295 0 0
2011–12 79 84 46 42 1 1 63 73 501 782 0 0
Five-year average to 2012–13 82 104 38 37 0 0 59 73 454 541 0 0
Oats aFive-year average to 2012–13 274 291 154 248 17 11 76 103 272 506 4 7
22 Australian crop report December 2013 ABARES
Summer cropsGrain sorghum2013–14 f 170 578 1 2 380 1 026 0 0 1 2 0 0
2012–13 s 183 632 1 3 409 1 366 0 1 1 2 0 0
2011–12 221 814 1 3 436 1 416 0 0 1 2 0 0
Five-year average to 2012–13 198 739 1 2 430 1 332 0 0 1 1 0 0
Cottonseed b2013–14 f 267 908 0 0 146 471 0 0 0 0 0 0
2012–13 s 284 936 0 0 159 481 0 0 0 0 0 0
2011–12 358 1 041 0 0 241 650 0 0 1 2 0 0
Five-year average to 2012–13 240 679 0 0 161 399 0 0 0 0 0 0
a Area harvested for grain; current season estimates, by state, are no longer produced because of difficulties in obtaining consistent data at the state level. b Cottonseed area is estimated harvested area. Includes northern dry season crop. f ABARES forecast. s ABARES estimate. Includes ABS preliminary estimates for barley, canola, grain sorghum, oats and wheat.Note: Zero area or production estimates may appear as a result of rounding to the nearest whole number, if production or area estimates are less than 500 tonnes or 500 hectares.Source: Australian Bureau of Statistics
23 Australian crop report December 2013 ABARES
Table 14 State production, other cropsNew South Wales Victoria Queensland South Australia Western Australia Other a
area prod. area prod. area prod. area prod. area prod. area prod.’000 ha kt ’000 ha kt ’000 ha kt ’000 ha kt ’000 ha kt ’000 ha kt
Winter cropsChickpeas2013–14 f 220 251 48 49 216 296 19 27 5 6 0 0
2012–13 s 280 379 49 52 218 357 20 22 6 4 0 0
2011–12 244 361 48 72 149 221 11 14 5 6 0 0
Five-year average to 2012–13 276 329 43 43 155 198 11 13 5 4 0 0
Faba beans2013–14 f 29 71 66 129 0 0 80 156 4 9 0 0
2012–13 s 54 123 67 126 0 0 78 122 4 6 0 0
2011–12 43 67 49 99 2 3 55 95 3 4 0 0
Five-year average to 2012–13 41 71 47 78 1 1 62 109 3 4 0 0
Field peas2013–14 f 50 53 51 68 0 0 112 184 36 58 0 0
2012–13 s 53 66 52 65 0 0 114 130 62 59 0 0
2011–12 41 62 38 60 0 0 110 150 60 71 0 0
Five-year average to 2012–13 39 41 58 66 0 0 117 155 73 69 0 0
Lentils2013–14 f 1 1 79 99 0 0 89 141 0 0 0 0
2012–13 s 1 1 77 80 0 0 87 103 0 0 0 0
2011–12 1 1 77 125 0 0 95 162 0 0 0 0
Five-year average to 2012–13 0 0 78 87 0 0 77 124 0 0 0 0
Summer cropsCorn (maize)2013–14 f 20 166 2 12 35 151 0 0 1 7 0 0
24 Australian crop report December 2013 ABARES
2012–13 s 30 261 2 15 48 216 0 0 1 4 0 0
2011–12 21 207 4 21 43 217 1 2 0 2 0 0
Five-year average to 2012–13 22 185 2 11 43 201 0 1 1 3 0 0
Sunflower2013–14 f 18 23 1 1 8 8 0 0 0 0 0 0
2012–13 s 19 30 1 2 10 12 0 0 0 0 0 0
2011–12 20 25 0 0 20 22 0 0 0 0 0 0
Five-year average to 2012–13 23 31 0 0 13 15 0 0 0 0 0 0
Rice b2013–14 f 100 900 0 2 1 4 0 0 0 0 0 0
2012–13 s 113 1 160 0 3 0 3 0 0 0 0 0 0
2011–12 102 912 1 6 0 0 0 0 0 0 0 0
Five-year average to 2012–13 63 609 0 2 0 1 0 0 0 0 0 0
a Refers to Northern Territory for rice. For all other crops, refers to Tasmania. b Paddy. Includes northern dry season and wet season crops. f ABARES forecast. s ABARES estimates.Note: Zero area or production estimates may appear as a result of rounding to the nearest whole number, if production or area estimates are less than 500 tonnes or 500 hectares.Sources: Australian Bureau of Statistics; Pulse Australia
Australian crop report December 2013 ABARES
Table 15 Australian supply and disposal of wheat, oilseeds and pulses2007–08 2008–09 2009–10 2010–11 2011–12 2012–13 skt kt kt kt kt kt
WheatProduction 13 569 21 420 21 834 27 410 29 905 22 461
Apparent domestic use 6 517 7 306 4 999 5 663 6 334 6 331
– seed 677 694 675 695 662 681
– other a 5 841 6 612 4 324 4 968 5 672 5 650
Exports b 7 444 14 707 14 791 18 584 24 656 18 653
Imports b 6 12 15 12 14 17
CanolaProduction 1 214 1 844 1 907 2 359 3 427 4 010
Apparent domestic use a 743 778 721 810 871 562
Exports 472 1 067 1 187 1 549 2 557 3 450
PulsesProduction– lupins 662 708 823 808 982 459
– field peas 268 238 356 395 342 320
– chickpeas 313 443 487 513 673 813
Apparent domestic use a– lupins 585 404 470 621 416 284
– field peas 129 104 196 95 130 129
– chickpeas 87 1 1 39 93 1
Exports– lupins 77 304 353 186 565 175
– field peas 141 137 162 302 215 193
– chickpeas 222 506 492 461 598 817
a In principal, calculated as a residual: production plus imports less exports less any observed or assumed change in stocks less seed use. b Includes grain and grain equivalent of wheat flour. s ABARES estimate. Includes ABS preliminary production estimates for canola and wheat.Note: Production, use, trade and stock data are on a marketing year basis: October–September for wheat; November–October for canola, peas and lupins. Production may not equal the sum of apparent domestic use and exports in any one year because of reductions or increases in stocks. The export data refer to marketing year export periods, so are not comparable with financial year export figures published elsewhere.Sources: ABARES; Australian Bureau of Statistics; Pulse Australia
25
Australian crop report December 2013 ABARES
Table 16 Australian supply and disposal of coarse grains2007–08 2008–09 2009–10 2010–11 2011–12 2012–13 skt kt kt kt kt kt
BarleyProduction 7 160 7 997 7 865 7 995 8 221 7 466
Apparent domestic use 3 107 4 105 3 231 2 632 2 075 2 183
– seed 188 221 226 199 166 167
– other a 2 919 3 885 3 005 2 433 1 909 2 016
Export 4 053 3 891 4 634 5 363 6 146 5 283
– feed barley 2 303 2 254 2 668 3 601 3 758 2 969
– malting barley 1 083 980 1 248 1 062 1 619 1 537
– malt (grain equivalent) 668 657 719 700 769 777
OatsProduction 1 502 1 160 1 162 1 128 1 262 1 115
Apparent domestic use 1 321 999 954 1 009 1 058 988
– seed 48 59 42 41 40 35
– other a 1 273 940 912 969 1 019 953
Export 181 161 208 118 204 127
TriticaleProduction 450 363 545 355 285 429
Apparent domestic use 450 363 545 355 285 429
– seed 16 18 9 7 13 12
– other a 434 345 536 348 272 417
Grain sorghumProduction 3 790 2 692 1 508 1 935 2 239 2 005
Apparent domestic use 2 833 1 694 1 167 984 1 060 767
– seed 4 2 3 3 3 3
– other a 2 829 1 691 1 164 981 1 057 764
Export b 110 957 998 341 950 1 179
Corn (maize)Production 387 376 328 357 451 496
Apparent domestic use 320 363 321 312 346 381
– seed 1 1 1 1 1 1
– other a 319 362 320 311 345 380
Export b 1 67 13 9 46 106
Total coarse grainsProduction 13 289 12 587 11 407 11 769 12 457 11 511
Apparent domestic use 8 031 7 524 6 217 5 292 4 823 4 747
– seed 257 301 281 251 222 218
26
Australian crop report December 2013 ABARES
– other a 7 774 7 223 5 936 5 041 4 601 4 530
Export 4 346 5 077 5 853 5 831 7 346 6 695
a In principle, calculated as a residual: production plus imports less exports less any observed or assumed change in stocks less seed use. For grain sorghum and corn (maize), previous year’s production is used as harvest occurs at the end of the marketing year. b Presentation of export volumes for grain sorghum and corn (maize) in this table was changed in December 2011. Export volumes are now shown in the year of actual export, which is typically one year after production. s ABARES estimate. Includes ABS preliminary production estimates for barley, grain sorghum and oats.Note: Production, use and export data are on a marketing year basis: marketing years are November–October for barley, oats and triticale; March–February for grain sorghum and corn (maize). The sum of domestic use and exports may differ from production as a result of changes in grain stock levels.Sources: ABARES; Australian Bureau of Statistics; Pulse Australia; United Nations Comtrade database
27

Australian crop report December 2013 ABARES
Table 17 Grains and oilseeds prices2012Jan–Mar
2012Apr–Jun
2012Jul–Sep
2012Oct–Dec
2013Jan–Mar
2013Apr–Jun
2013Jul–Sep
A$/t A$/t A$/t A$/t A$/t A$/t A$/tWheatDomestic: feed del. Sydney 212 228 299 306 314 307 293
International: US no.2 hard red winter, fob Gulf a
282 281 353 357 321 327 341
BarleyDomestic: 2 row feed, del. Sydney 195 202 262 305 301 293 265
Export: feed b 242 251 258 275 294 300 314
Export: malting b 255 275 262 301 319 319 329
International: feed, fob Rouen a 260 270 292 304 288 272 260
Grain sorghumDomestic: feed del. Sydney 203 197 254 289 289 305 312
Export b 264 248 249 286 267 313 354
OatsDomestic: feed, del. Sydney 196 204 222 234 232 260 252
Export b 292 264 307 311 349 394 325
International: CME oats nearby contract 207 221 252 249 250 269 269
Corn (maize)Domestic: feed, del. Sydney 296 292 301 330 341 356 370
International: US no.2 yellow corn, fob Gulf a 266 270 320 309 295 296 270
OilseedsDomestic: canola, del. Melbourne 492 536 557 566 550 565 550
Domestic: sunflowers, del. Melbourne 520 520 520 520 520 520 520
International: soybeans, US, fob Gulf a 471 548 631 566 545 588 595
PulsesDomestic: lupins, del. Kwinana 194 247 305 336 331 299 288
Domestic: chickpeas, del. Melbourne 491 612 640 514 518 532 439
Domestic: field peas, del. Melbourne 298 345 369 343 370 396 403
Export: chickpeas b 569 634 710 623 595 611 619
Export: field peas b 367 409 418 411 431 443 489
a Average of daily offer prices made in US$, converted to A$ using quarterly average of daily exchange rates. b Export unit values reflect the average price received for grain exported over the quarter, not current market prices. These prices are the average unit value (free on board) of Australian exports recorded by the Australian Bureau of Statistics. A long lag time can exist between when exporters negotiate prices and when the product is exported.Note: Prices used in these calculations exclude GST.
28