
Summative Evaluation of GPE’s Country-level Support to ...
160
Batch 1, Country 2: Sierra Leone FINAL REPORT | MAY 2018 Summative Evaluation of GPE’s Country-level Support to Education
Transcript of Summative Evaluation of GPE’s Country-level Support to ...

Batch 1, Country 2: Sierra Leone
FINAL REPORT | MAY 2018
Summative Evaluation of GPE’s Country-level Support to Education

Copyright © Universalia 2018, all rights reserved Universalia Management Group 245 Victoria Avenue, Suite 200 Westmount, Montreal, Quebec
Canada H3Z 2M6
www.universalia.com
Copyright © Universalia 2018, all rights reserved Universalia Management Group 245 Victoria Avenue, Suite 200 Westmount, Montreal, Quebec
Canada H3Z 2M6
www.universalia.com

FINAL REPORT - SIERRA LEONE i
© UNIVERSALIA
Executive Summary
Evaluation purpose and approach
This evaluation is part of a larger study of the Global Partnership for Education (GPE) that comprises 30 country level evaluations (CLE). The overall study runs from 2017 until 2020. It aims to assess (i) GPE contributions to strengthening national education systems and, ultimately, education results related to learning, equity, equality and inclusion; and hence (ii) the relevance, efficiency and effectiveness of GPE’s theory of change (ToC) and country-level operational model. The assessment is based on a theory-based, mixed social science research methodology known as contribution analysis.
The CLE of Sierra Leone was conducted between December 2017 and April 2018, and covered GPE support during the period 2014-2018. It draws on document, database and literature review, as well as on consultations with a total of 33 governmental, multilateral, bilateral, academic, school-level, and non-governmental stakeholders in Freetown, Sierra Leone and Washington, DC.
Education in Sierra Leone
Sierra Leone is categorized as a fragile and low-income country with a population of 7.4 million (UNESCO, 2016). The country has high youth unemployment, high levels of corruption, and currently ranks 179 out of 188 countries on the United Nations Development Programme Human Development Index. In 2014-2016, an outbreak of the Ebola Virus Disease (EVD) created a humanitarian crisis and negatively impacted economic growth. The economic crisis was further fueled by a downturn in global
prices for iron ore, a commodity that the country had strongly relied on for revenues.
Responsibility for all levels of the education sector is held by the Ministry of Education, Science and Technology (MEST). In 2017, the school-aged population consisted of 670,000 children at the pre-primary level, and 1.78 million children at primary and lower secondary levels (ages 6-14). Many teachers at government-approved schools are not on the payroll, reflecting weaknesses in MEST data management and school supervision capacities. In 2016, 54 percent of schools (4,777 out of 8,907) were not government-approved or -supported.
To date, Sierra Leone has developed three education sector plans (ESPs) covering the periods 2007-2015, 2014-2018, and 2018-2020 respectively. This evaluation focuses on the 2014-2018 ESP, as it is the period covered by the last completed cycle of GPE grant support (2014-2017). The evaluation also refers to the previous and the most recent plans where relevant. Key challenges in the education sector that the 2014-2018 ESP aimed to address were high rates of out-of-school children ages 6-11 (around 23 percent in 2011), poor learning outcomes, and issues of teacher training and distribution.
GPE in Sierra Leone
Sierra Leone joined the Global Partnership for Education in 2007 and is represented on the Board through the Africa 3 constituency group. To date, Sierra Leone has received two education sector plan implementation grants (ESPIGs) of increasing size, two education sector plan development grants (ESPDGs) of increasing size, and one program development grant (PDG). In February 2018, the country applied for a third ESPIG to support the new 2018-2020 ESP.

ii FINAL REPORT - SIERRA LEONE
© UNIVERSALIA
This evaluation focuses on the period of the US$17.9 million, 2014-2017 ESPIG, which co-funded activities of the World Bank-managed Revitalizing Education Development in Sierra Leone (REDiSL) project.
GPE contributions to sector planning
State of sector planning in Sierra Leone, 2014-2018
The development of the 2014-2018 ESP was country-led and participatory. The process fostered government ownership, created shared priorities to foster alignment, and strengthened in-country capacities for sector planning. The ESP covers all education sub-sectors and describes 23 strategic objectives under three overarching priority areas of (i) access, equity and completion; (ii) quality and relevance; and (iii) system strengthening, as well as systems for ESP monitoring, financing, and implementation. Shortcomings included some limitations in stakeholder consultations during ESP development, the absence of comprehensive risk and emergency preparedness analyses, and inadequate focus on out-of-school children, on learners with special needs as well as on strengthening Technical and Vocational Education and Training. In addition, the ESP funding gap and MEST capacity limitations were not adequately addressed.
During the Ebola outbreak, the ESP remained in place but was superseded by the Presidential Recovery Plan (PRP). Nevertheless, the MEST indicated continued commitment to the ESP by structuring both the 2015 joint sector review and the 2017 mid-term review around ESP objectives.
GPE contributions
GPE has made transformative contributions to sector planning in the following ways:
GPE implementation grant requirements have provided important incentives for the development of all three ESPs.
GPE guidelines provided valuable process and content-related direction both to the teams preparing the 2014-2018 and subsequent ESP, and to the education sector partners reviewing and appraising the document.
GPE resources in the form of two ESPDGs (US$250,000 in 2012 and US$497,502 allocated in 2017) covered most of the costs of developing the last two ESPs, including by paying for processes related to ESP appraisal and stakeholder consultations.
Technical assistance and facilitation provided by the grant agent (the World Bank) and the coordinating agency (UNICEF) supported the MEST in economic forecasting and budgeting and facilitated sector dialogue during sector planning.
GPE contributions to sector dialogue and monitoring
State of sector dialogue and monitoring in Sierra Leone
Sector dialogue in Sierra Leone revolve around the Education Development Partners Group (EDP) established in 2007, which constitutes the country’s Local Education Group and includes the MEST, donor agencies as well as civil society representatives.

FINAL REPORT - SIERRA LEONE iii
© UNIVERSALIA
Since 2007, education sector dialogue in Sierra Leone has become more systematic and inclusive. However, it remains focused on information exchange, with limited efforts to seek collaboration and synergies among actors. This temporarily changed during the EVD crisis, when issue-specific working groups were formed that allowed for closer technical collaboration and coordination. The MEST plans to reinstate similar groups under the 2018-2020 ESP.
Since the EVD crisis, the MEST’s engagement with CSOs, including teacher organizations, has improved, but the voice of international organizations tends to carry more weight than that of domestic CSOs. A key shortcoming in the EDP is the absence of representatives from non-government approved schools (which constituted 54 percent of schools in 2016), as well as from the private sector and from parent organizations.
Sector monitoring was strengthened through the conduct of two Joint Sector Reviews (JSRs) in 2015 and 2017 respectively. A third JSR planned for 2014 had to be cancelled due to the Ebola crisis. Both JSRs were participatory, inclusive, evidence-based despite data gaps, yet were found to have had only limited influence on policy and decision making. This was because their timing was not suited to inform the governments’ budget process, and because they did not produce limited numbers of actionable, clear and realistic recommendations.
GPE contributions
Providing an incentive: ESPIG funding requirements provided a key incentive for the creation of the EDP in 2007 as well as for the regular conduct of JSRs. The collaborative nature of ESP development and ESPIG application processes encouraged stakeholder exchanges.
Providing resources for monitoring: GPE (co-) funded JSRs as well as a partner coordination desk and a monitoring and evaluation unit in the MEST. GPE grants to a CSO coalition facilitated monitoring of government commitments and sector dialogue.
Sustained advocacy through the GPE Secretariat and the coordinating agency likely contributed to a positive shift in the MEST’s willingness to engage with CSO representatives.
The GPE Secretariat shared best practices from other GPE partner countries with the MEST and education sector partners and advised CSOs/NGOs on how to improve their contributions to sector dialogue.
GPE contributions to sector financing
State of sector financing in Sierra Leone, 2014-2018
The twin crises of Ebola and the collapse of the iron ore price caused a depreciation of the Leone, resulting in a domestic spending drop by eight percent in inflation-adjusted American dollar terms between 2014 and 2016 (from US$142 million to US$132 million), despite growth in the school-age population. Similarly, education’s share of total public expenditures decreased between 2014 and 2016 from 18 to 17.3 percent and was projected to stay stable around 15 percent (excluding debt service) between 2018-2020 (below the 20 percent GPE target). Still, domestic financing of the ESP met its original target of US$342 million, disbursing a total of US$345 million during the 2014-2016 period. Recurrent education spending remains upwards of 95 percent of total education expenditures.

iv FINAL REPORT - SIERRA LEONE
© UNIVERSALIA
While ODA for education was stable between 2007-2013 (on average US$18.3 million/year), it recorded a significant fall during the Ebola crisis as donors redirected education funding to humanitarian assistance. As a result, the originally anticipated funding gap for the 2014-2018 ESP of 15 percent (US$87 million) for 2014-2016 had more than doubled to 33 percent (US$190 million) by 2016, given a 75 percent (US$105 million) shortfall in planned donor spending. REDiSL project funding was also affected as DFID revised its co-funding contribution to the GPE grant from US$5.5 million to US$2.46 million following the EVD crisis. Since 2016, education ODA has recovered and is exceeding pre-crisis levels, reaching close to US$35 million per year in 2018/2019.
GPE contributions
While GPE funding requirements and advocacy through the Secretariat likely contributed to keeping the 20 percent target on the agenda, there is no evidence that this affected actual allocations towards the target. The evaluation also found no detectable GPE influence on the quality of international education sector funding.
GPE modestly contributed to increasing the quantity of external sector financing, both directly by closing 5 percent of the 2014-2018 ESP funding gap through its US$17.9 million ESPIG grant, and indirectly by attracting a total of US$15.5 million in additional funding commitments to support selected ESPIG activities: (a) US$5.5 million co-funding from DFID (later revised to US$2.46 million), and (b) US$10 million from the World Bank to continue and extend performance-based school grants introduced under the REDiSL project after 2017. The total funds provided and leveraged by GPE amounted to almost half of education ODA during the EVD crisis (2014-2016).
GPE contributions to sector plan implementation
State of sector plan implementation in Sierra Leone, 2014-2018
Implementation of the 2014-2018 ESP was found to be partial, indirect, and unsystematic. Key factors negatively affecting sector plan implementation were the EVD crisis; the substantial ESP financing gap; and the fact that the ESP was superseded by the 2016/2017 Presidential Recovery Plan (PRP). The PRP’s short-term targets only partly aligned with the ESP’s objectives, and only 20 percent of PRP priorities fully reached their targets. Additional inhibiting factors included: human resource constraints in the MEST, and weaknesses in sector planning and dialogue that led to a lack of prioritization of ESP objectives.
GPE contributions
GPE contributed modestly to overall ESP implementation, and significantly to progress in some sub-sectors, such as Early Childhood Education (ECE). The REDiSL project supported by GPE was initially delayed due to the EVD crisis and subsequently underwent two rounds of restructuring to respond to the crisis and to DFID’s early withdrawal from the project. Despite these challenges, by January 2018 the project had completed most of its planned activities, albeit with a slightly modified and reduced scope. The first two of REDiSL’s four thematic components were particularly relevant to the priority areas of the ESP, supporting 11 of the ESP’s 23 specific objectives. The first thematic component received 85 percent of the total ESPIG (US$15.24 million out of US$17.9 million). Illustrative REDiSL achievements include:

FINAL REPORT - SIERRA LEONE v
© UNIVERSALIA
Improving the learning environment in targeted areas:
US$2.2 million in performance-based school grants disbursed to 1,284 schools in the four most disadvantaged local councils and related training to School Management Committees. However, there were concerns related to a lack of scale, given that grants covered only four out of 14 districts, and unclear sustainability of school grants past GPE support;
Comprehensive support to strengthen ECE, including through the construction of 50 furnished ECE classrooms and latrines; the development of an ECE curriculum and minimum standards, of an ECE policy and new ECE teaching and learning materials; training of 500 teachers, head-teachers, inspectors, as well as support to teacher training colleges to incorporate new materials;
Design and distribution of early grade readers and related materials to all primary schools (>6,000 schools) and a nationwide media campaign to increase awareness of early grade reading;
Set-up and support of activities of the new Teaching Service Commission (TSC).
Strengthening education service delivery:
Development and piloting of a National Learning Assessment framework and instruments;
Conduct of a Final Learning Assessment for grades 4 & 5 in English, Math and Science, albeit with concerns over its continuation;
Implementation of three annual school censuses (2015, 2016, 2017);
Establishment of a change unit and a monitoring and evaluation unit at the MEST (albeit with sustainability concerns given the MEST’s financial constraints and the absence of dedicated donor funding post ESPIG), as well as the appointment of a donor coordination focal person within the MEST.
REDiSL’s support to the government’s Ebola strategic response plan included financing 600 hours of educational radio programming, providing 5,970 schools with hand-washing stations and supplies, and conducting a house-to-house assessment to encourage re-enrollment.
Factors other than GPE contributions affecting change
Factors that positively influenced change in the above described areas were (i) existing local capacities and commitment to evidence-based and participatory sector planning within the MEST and among education stakeholders; (ii) the EVD crisis response generating more dialogue and coordination among key actors; (iii) increased financial and technical support from other development partners since 2016.
The main factors that negatively affected change were (i) the twin crises of the EVD outbreak and the decline of iron ore prices; (ii) gaps in the MEST’s implementation and sector monitoring capacity; (iii) insufficient sector and ESP financing; (iv) absence of a pooled funding mechanism; and (v) limited synergies between actors and evolving donor priorities.

vi FINAL REPORT - SIERRA LEONE
© UNIVERSALIA
Unintended results of GPE support
The evaluation did not find evidence of any unintended, positive or negative, effects of GPE financial and non-financial support during the period under review.
System level change
System level change
Despite challenges posed by the Ebola outbreak, some system-level improvements have been achieved. While some of these hold the potential to foster future change, overall system-level change has been limited and fragmented. Key achievements, challenges and gaps in the three priority areas of the 2014-2018 ESP include:
Priority area 1 - Access, equity and completion:
Limited effect of both performance-based school grants supported by REDiSL and MEST school grants on increasing school access or completion, as the cost of schooling remains a key factor influencing school completion and drop-out rates to date;
Unclear effect of the school feeding program aimed at supporting the school reopening plan and foster access, as it faced logistical challenges and was limited in scope;
Development of an Inclusive Education Policy, which is expected to improve access to learning for children with disabilities or special learning needs;
Increase in the number of schools by 940 since 2012/2013 (pre-school to senior secondary school), including a 42 percent increase in pre-school facilities from 774 to 1,000 in 2016;
Improved school infrastructure with new Water, Sanitation and Hygiene (WASH) facilities in 95 schools, and hand-washing stations and supplies provided to 5,970 schools. However, by 2016, only 45 percent of schools and other institutions met minimum physical structure standards (an improvement from 30 percent in 2011, yet below the target value of 85 percent).
Priority area 2 - Education quality and relevance:
Worsened pupil/teacher ratio at primary level from 33/1 in 2012 to 38/1 in 2016;
Increase in qualified primary teachers from 50 percent in 2011 to 61 percent in 2016, yet worsened pupil/qualified teacher ratio from 60/1 in 2012 to 62.7/1 in 2016 due to demographic growth;
Gaps in the development and distribution of teaching and learning materials, despite some progress. This task is not centrally managed by the MEST but has been driven by individual development partners who established their own project-based targets. No data was available on the extent to which these respective targets were reached;
Development of new or revised curricula, e.g. an accelerated post-Ebola curriculum, a draft ECE curriculum, and a revised but not yet implemented Basic Education Curriculum.

FINAL REPORT - SIERRA LEONE vii
© UNIVERSALIA
Priority area 3 - System strengthening:
Limited progress in strengthening the MEST’s capacities for improved communication and for planning and managing its own human resources. Initiatives for related ESP targets, e.g. the development of an external communications strategy, a staff competency framework and a staff development program, had begun but it was unclear how much progress had been made;
Development of several new policy documents, guidelines, and standards, which have the potential for positively influencing education access and quality (e.g. policies on Early Childhood Development, School Feeding, Inclusive Education). However, not all policies envisaged under the 2014-2018 ESP have been developed or implemented;
Some progress in developing effective, functioning systems for teacher management, through the establishment and (partial) staffing of the TSC;
Improved MEST capacity for collecting and managing sector data and evidence, resulting in annual school censuses conducted since 2015 and data on all key indicators submitted to the UNESCO Institute for Statistics;
Little progress on the decentralization of decision making from the MEST to District Education Offices and local councils;
Some progress in strengthening the capacity to monitor performance and supervise quality improvements at all levels, although a lack of data and systems to assess learning and education quality persists;
Slow progress in approving non-government-approved schools, thereby limiting quality control through the MEST.
Likely links between sector plan implementation and system level change
Sector plan implementation likely contributed to several of the noted system level changes. Achievements such as the establishment of the TSC and improvements in ECE infrastructure, can be traced back to specific interventions put in place during 2014-2018 and outlined in the ESP for that period (and in particular to the support of the REDiSL project). The only noted system-level improvements clearly not linked to the ESP, but, instead, deriving from the Ebola crisis and the related PRP, are the drafting of a School Feeding Policy and the (limited) implementation of a government-led school feeding program.
Learning outcomes and equity
Changes in learning outcomes, equity and gender equality
Despite scarce data, there is evidence of some positive trends in learning outcomes and gender parity, along with some stagnation and deterioration.
Evidence shows year-on-year rises in pass rates for national examinations at all education levels between 2013 and 2017, yet this may not reflect actual levels of learning.
Enrollment numbers increased for primary education by 18 percent between 2011 and 2016.

viii FINAL REPORT - SIERRA LEONE
© UNIVERSALIA
Gross Enrollment Rates (GER) deteriorated at the junior secondary (from 67 to 61 percent) and senior secondary levels (from 35 to 28 percent) between 2011 and 2016. While GER increased at the primary level from 124 to 130 percent (indicating challenge due to over-age registration), positive progress was made at the pre-primary level from 8.4 to 11 percent during the same period. Although pre-primary enrollment figures in Sierra Leone remain low, they are above those of some other countries in the region (e.g., Côte d’Ivoire, Mauritania, and Burkina Faso).
The share of out-of-school children ages 6-11 increased from 23 percent in 2011 to 27 percent in 2015 (latest year for which data is available), likely due to the EVD crisis.
Modest improvements in gender parity were recorded for junior and senior secondary school enrollment since 2012/2013. In 2016, the GER for male students (67.5 percent) was slightly higher than for females (63.8 percent) at the junior secondary level. Parity in primary school enrollment had been achieved by 2011/12. A 2016 school census recorded a student body of 49.8 percent females and 50.2 percent males.
Likely links to observed system level changes
System-level changes observed during the review period are either too recent or not yet sufficiently wide in scope to have plausibly contributed to changes in learning outcomes, gender equality or equity. One possible exception is the increase of ECE classrooms, which may have contributed to the noted rise in pre-primary enrollment during the review period.
There is no strong evidence yet to link other improvements such as those in learning outcomes to teacher training, school infrastructure upgrades or curriculum reforms put in place during the review period.
Conclusions/ Overall observations
Emerging good practice
Consulted stakeholders noted that the World Bank fulfilled the grant agent role effectively and highlighted the ‘mainstreamed’ approach chosen for REDiSL, under which project implementation was coordinated by a Ministry-internal unit funded by the project (the REDiSL Secretariat) but implemented by all relevant Ministry Directorates on an activity-by-activity basis. This was an improvement from the previous ESPIG-funded project’s stronger reliance on technical assistance external to the Ministry.
The World Bank’s role as grant agent was aided by the fact that the Bank also provides general budget support to Sierra Leone. In at least one case, this allowed the Bank to make the release of budget support funds contingent on progress towards an important education sector (and REDiSL) milestone, which then occurred.
GPE contributions
GPE support made positive contributions to sector planning; to sector dialogue and monitoring; to the quantity of (foreign) sector financing; and to (parts of) sector plan implementation in Sierra Leone.
As the coordinating agency during the period under review, UNICEF co-facilitated effective sector dialogue among development partners by providing support to MEST’s leadership. The World Bank effectively fulfilled the role of the GPE grant agent for the 2014-2017 ESPIG by implementing most elements of the REDiSL project despite the challenging context.

FINAL REPORT - SIERRA LEONE ix
© UNIVERSALIA
In-country stakeholders valued the quality assurance and ongoing advice provided by the GPE Secretariat.
Perceived relevance of GPE support
Among national and international stakeholders in Sierra Leone, GPE is primarily perceived as a donor, albeit one who has no permanent country presence but works through development partners on the ground.
The evaluation found no major issues in relation to the clarity of GPE funding and reporting requirements, which most stakeholders described as demanding but reasonable overall. Stakeholders appreciated the collaborative nature of the ESPIG application and program development processes and GPE’s flexibility towards missed deadlines. Still, some concerns were raised in terms of the burdensome nature of GPE’s quality-assurance and review processes, in particular the number of required review rounds, and turnovers in both the country lead and coordinating agency/grant agent staff, which occasionally affected the quality of interactions.
System level change
During the 2014-2017 period, Sierra Leone made some, albeit limited and fragmented progress towards strengthening its education system in line with the priorities and targets outlined in the 2014-2018 ESP. Available evidence partly supports the assumed link between ESP implementation and education system strengthening.
Impact level change
There is currently insufficient data available to prove or disprove the validity of GPE’s theory of change in relation to the assumed links between system level changes achieved during the review period and impact-level changes in learning outcomes, equity and gender equality. This is largely due to the relatively short and recent timeframe of the focus of the evaluation. The main exception is the plausible link between the construction of ECE classrooms and the rising ECE gross enrollment rate.


FINAL REPORT - SIERRA LEONE xi
© UNIVERSALIA
Acronyms ASC Annual School Census
BEC Basic Education Commission
BECE Basic Education Certificate Examination
CA Coordinating Agency
CEQ Country Evaluation Question
CLE Country Level Evaluation
CRS Catholic Relief Services
CSEF Civil Society Education Fund
CSO Civil Society Organization
CSR Country Status Report
DCP Developing Country Partner
DFID Department for International Development (United Kingdom)
ECD Early Childhood Development
ECE Early Child Education
EDG Education Donor Group
EDP Education Development Partner
EFA Education for All
EGMA Early Grades Math Assessment
EGRA Early Grades Reading Assessment
EMIS Education Management Information System
ERRTF Ebola Recovery and Reconstruction Trust Fund
ESP Education Sector Plan
ESPDG Education Sector Plan Development Grant
ESPIG Education Sector Plan Implementation Grant

xii FINAL REPORT - SIERRA LEONE
© UNIVERSALIA
ESR Education Sector Review
ESRP Ebola Strategic Response Plan
EU European Union
EVD Ebola Virus Disease
FTI Fast Track Initiative
GA Grant Agent
GATE Girls Access to Education
GDP Gross Domestic Product
GER Gross Enrollment Rate
GNI Gross National Income
GPE Global Partnership for Education
GRA Global and Regional Activities
HDI Human Development Index
IBRD International Bank for Reconstruction and Development
ICT Information Communication Technology
IIEP International Institute for Educational Planning
IMF International Monetary Fund
ITRP Independent Technical Review Panel
JSR Joint Education Sector Review
JSS Junior Secondary School
KPI Key Performance Indicator
KQ Key Question
LAS Learning Assessment System
LEG Local Education Group
M&E Monitoring and Evaluation
MEST Ministry of Education, Science and Technology
MOFED Ministry of Finance and Economic Development

FINAL REPORT - SIERRA LEONE xiii
© UNIVERSALIA
MTR Mid Term Review
NCTVE National Commission for Technical and Vocational Examination
NGO Nongovernmental Organization
NPSE National Primary School Examination
ODA Official Development Assistance
OECD Organisation for Economic Co-Operation and Development
PDG Program Development Grant
PQTR Pupil Qualified Teacher Ratio
PRP Presidential Recovery Plan
PRSP Poverty Reduction Strategy Paper
PTR Pupil Teacher Ratio
REDiSL Revitalizing Education Development in Sierra Leone
SDG Sustainable Development Goal
SLTU Sierra Leone Teachers Union
SMC School Management Committee
SSS Senior Secondary School
ToC Theory of change
ToR Terms of Reference
TSC Teaching Service Commission
TVET Technical and Vocational Education and Training
UIS UNESCO Institute for Statistics
U.K. United Kingdom
UNDP United Nations Development Programme
UNESCO United Nations Educational, Scientific and Cultural Organization
UNICEF United Nations Children's Fund
USD United States Dollar
WASH Water, Sanitation and Hygiene

xiv FINAL REPORT - SIERRA LEONE
© UNIVERSALIA
WASSCE West African Senior School Certificate Examination
WB World Bank

FINAL REPORT - SIERRA LEONE xv
© UNIVERSALIA
Terminology Alignment Basing support on partner countries’ national development strategies, institutions and
procedures.1
Basic education
Pre-primary (i.e., education before Grade 1), primary (Grades 1-6), lower secondary (Grades 7-9), and adult literacy education, in formal and non-formal settings. This corresponds to International Standard Classification of Education (ISCED) 2011 levels 0-2.
Capacity In the context of this evaluation we understand capacity as the foundation for behavior change in individuals, groups or institutions. Capacity encompasses the three interrelated dimensions of motivation (political will, social norms, habitual processes), opportunity (factors outside of individuals e.g., resources, enabling environment) and capabilities (knowledge, skills).2
Education systems
Collections of institutions, actions and processes that affect the educational status of citizens in the short and long run.3 Education systems are made up of a large number of actors (teachers, parents, politicians, bureaucrats, civil society organizations) interacting with each other in different institutions (schools, ministry departments) for different reasons (developing curriculums, monitoring school performance, managing teachers). All these interactions are governed by rules, beliefs and behavioral norms that affect how actors react and adapt to changes in the system.4
Equity In the context of education, equity refers to securing all children’s rights to education, and their rights within and through education to realize their potential and aspirations. It requires implementing and institutionalizing arrangements that help ensure all children can achieve these aims.5
Financial additionality
This incorporates two not mutually exclusive components: (a) an increase in the total amount of funds available for a given educational purpose, without the substitution or redistribution of existing resources; and (b) positive change in the quality of funding (e.g., predictability of aid, use of pooled funding mechanisms, co-financing, non-traditional financing sources, alignment with national priorities).
1 OECD, Glossary of Aid Effectiveness Terms. http://www.oecd.org/dac/effectiveness/aideffectivenessglossary.htm. GPE understands ‘country systems’ to relate to a set of seven dimensions: Plan, Budget, Treasury, Procurement, Accounting, Audit and Report. Source: Methodology Sheet for Global Partnership for Education (GPE) Indicators. Indicator (29) Proportion of GPE grants aligned to national systems. 2 Mayne, John. The COM-B Theory of Change Model. Working paper. February 2017 3 Moore, Mark. 2015. Creating Efficient, Effective, and Just Educational Systems through Multi-Sector Strategies of Reform. RISE Working Paper 15/004, Research on Improving Systems of Education, Blavatnik School of Government, Oxford University, Oxford, U.K. 4 World Bank. 2003. World Development Report 2004: Making Services Work for Poor People. Washington, DC: World Bank; New York: Oxford University Press. 5 Equity and Inclusion in Education. A guide to support education sector plan preparation, revision and appraisal. GPE 2010; p.3. Available at: file:///C:/Users/anett/AppData/Local/Packages/Microsoft.MicrosoftEdge_8wekyb3d8bbwe/TempState/Downloads/2010-04-GPE-Equity-and-Inclusion-Guide.pdf

xvi FINAL REPORT - SIERRA LEONE
© UNIVERSALIA
Gender equality
The equal rights, responsibilities, and opportunities of women, men, girls, and boys, and equal power to shape their own lives and contribute to society. It encompasses the narrower concept of gender equity, which primarily concerns fairness and justice regarding benefits and needs.6
GPE support The notion of “GPE support” encompasses financial inputs deriving from GPE grants and related funding requirements, as well as non-financial inputs deriving from the work of the Secretariat, the grant agent, the coordinating agency, and from GPE’s global, regional, and national level engagement through technical assistance, advocacy, knowledge exchange, quality standards and funding requirements.
Harmonization The degree of coordination between technical and financial partners in how they structure their external assistance (e.g., pooled funds, shared financial or procurement processes), to present a common and simplified interface for developing country partners. The aim of harmonization is to reduce transaction costs and increase the effectiveness of the assistance provided by reducing demands on recipient countries to meet with different donors’ reporting processes and procedures, along with uncoordinated country analytic work and missions.7
Inclusion Adequately responding to the diversity of needs among all learners, through increasing participation in learning, cultures, and communities, and reducing exclusion from and within education.8
6 GPE Gender Equality Policy and Strategy 2016-2020. GPE 2016, p. 5f. Available at: http://www.globalpartnership.org/sites/default/files/2016-06-gpe-gender-equality-policy-strategy.pdf 7 Adapted from OECD, Glossary of Aid Effectiveness Terms http://www.oecd.org/dac/effectiveness/aideffectivenessglossary.htm, and from Methodology Sheet for Global Partnership for Education (GPE) Indicators. Indicator (30) Proportion of GPE grants using: (a) co-financed project or (b) sector pooled funding mechanisms. 8 GPE 2010, p.3.

FINAL REPORT - SIERRA LEONE xvii
© UNIVERSALIA
Contents EXECUTIVE SUMMARY ................................................................................................... I
1 INTRODUCTION ...................................................................................................... 1
1.1 Background and purpose of the summative evaluation ................................................................ 1 1.2 Methodology overview ................................................................................................................... 2 1.3 Structure of the report ................................................................................................................... 3
2 CONTEXT ................................................................................................................ 4
2.1 Overview of Sierra Leone................................................................................................................ 4 2.2 The education sector in Sierra Leone ............................................................................................. 4 2.3 GPE in Sierra Leone ......................................................................................................................... 9
3 GPE CONTRIBUTIONS TO SECTOR PLANNING, IMPLEMENTATION, DIALOGUE/MONITORING AND FINANCING ........................................................... 11
3.1 Introduction .................................................................................................................................. 11 3.2 Sector planning ............................................................................................................................. 12 3.3 Mutual accountability through sector dialogue and monitoring ................................................. 17 3.4 Education sector financing .......................................................................................................... 26 3.5 Sector plan implementation ......................................................................................................... 37
4 PROGRESS TOWARDS A STRONGER EDUCATION SYSTEM ...................................... 47
5 PROGRESS TOWARDS STRONGER LEARNING OUTCOMES AND EQUITY ................. 59
6 CONCLUSIONS ...................................................................................................... 68

xviii FINAL REPORT - SIERRA LEONE
© UNIVERSALIA
Figures Figure 1.1 The evaluation presents findings on key evaluation questions and contribution claims ......... 2
Figure 3.1 The 2014-2018 ESP funding gap was larger than expected as donors gave less than planned28
Figure 3.2 Total Education Budget, in trillion Leones (nominal) .............................................................. 29
Figure 3.3 MoFED budget projections predict broad stability – but no increase - in education’s share of various government expenditure categories for 2018-2020. ................................................. 30
Figure 3.4 During the Ebola crisis (2014-2016), REDiSL funds were 3 percent of planned ESP spending but almost 50 percent of actual ESP ODA ............................................................................... 34
Figure 4.1 Gradual increase in the number of schools in Sierra Leone .................................................... 50
Figure 4.2 No improvement in the primary Pupil-to-Trained-Teacher ratio ............................................ 51
Figure 4.3 Most schools in Sierra Leone are not approved ..................................................................... 57
Figure 5.1 Pass rates (%) for Examinations at all levels rose from 2013 to 2017. .................................... 61
Figure 5.2 Gross Enrollment Rates 2011-2016 compared to 2018 target, both sexes, % ....................... 63
Figure 6.1 Assessment of contribution claims in the country-level theory of change for Sierra Leone .. 68
Figure viii.1 GPE contributions to strengthening sector planning ............................................................ 108
Figure viii.2 GPE contributions to strengthening sector dialogue and monitoring .................................. 109
Figure viii.3 GPE contributions to more and better sector financing ....................................................... 110
Figure viii.4 GPE contributions to ESP implementation ............................................................................ 111

FINAL REPORT - SIERRA LEONE xix
© UNIVERSALIA
Tables Table 2.1 Official school age in Sierra Leone by level ............................................................................... 5
Table 2.2 The 2014-2018 ESP addressed key sector gaps identified in the 2010 CSR .............................. 7
Table 2.3 Timeline of events in the Sierra Leonean education sector, 2014-2018................................... 9
Table 2.4 GPE grants to Sierra Leone since becoming a GPE partner country in 2007 .......................... 10
Table 3.1 Strengths and weaknesses of the 2014-2018 ESP ................................................................... 13
Table 3.2 Additional factors positively or negatively affecting sector dialogue and monitoring ........... 25
Table 3.3 Overview of major donor projects supporting education in Sierra Leone, 2016-2021 .......... 31
Table 3.4 Funding modalities used by key education sector donors in Sierra Leone (2016-2018) ........ 35
Table 3.5 REDiSL contributions to ESP implementation (components 1 and 2) ..................................... 41
Table 3.6 Stakeholder perceptions of the ESPIG application and program development process ........ 45
Table 5.1 Link between system-level improvements and impact-level change (or lack thereof) .......... 65
Table ii.1 Key explanatory mechanisms and underlying assumptions in the adapted country ToC for Sierra Leone ............................................................................................................................. 87
Table iii.1 Methodological limitations of the evaluation, and corresponding mitigation strategies ...... 92
Table iv.1 Stakeholder mapping within the Sierra Leone context ........................................................... 94
Table v.1 Consulted stakeholders ........................................................................................................... 97
Table vii.1 Definition of color-coded ratings for contribution claims ..................................................... 103
Table vii.2 Definition of color-coded ratings for likelihood of underlying assumptions holding true in the country context ..................................................................................................................... 104
Table vii.3 Contribution claims and underlying assumptions ................................................................. 104
Table x.1 Progress on PRP targets relative to initial objectives and to the original ESP. ..................... 117
Table xi.1 Overview of the REDiSL project components and their relevance in relation to priorities described in the ESP 2014-2018. ........................................................................................... 119
Table xi.2 Fourth REDiSL component, which focused on supporting early recovery under the Ebola Strategic Response Plan. ....................................................................................................... 124
Table xii.1 Progress on key indicators related to Access, Equity and Completion ................................. 125
Table xii.2 Progress on key indicators related to Quality and Relevance ............................................... 126
Table xii.3 Progress on key indicators related to systems strengthening .............................................. 126

xx FINAL REPORT - SIERRA LEONE
© UNIVERSALIA
Table xiii.1 ESPIG Performance ................................................................................................................ 129
Table xiii.2 System-Level .......................................................................................................................... 131
Table xiii.3 Impact-Level .......................................................................................................................... 133

FINAL REPORT - SIERRA LEONE xxi
© UNIVERSALIA
Appendices Appendix I Evaluation Matrix .......................................................................................................... 73
Appendix II GPE country-level theory of change for Sierra Leone for the review period .............. 85
Appendix III Evaluation methodology ............................................................................................. 91
Appendix IV Stakeholder mapping .................................................................................................. 94
Appendix V List of consulted individuals ......................................................................................... 97
Appendix VI List of reviewed documents ........................................................................................ 99
Appendix VII Ratings of contribution claims and assumptions .....................................................103
Appendix VIII Visual summary of contribution claim analyses .....................................................108
Appendix IX ESP 2014-2018 priorities in light of CSR recommendations .....................................112
Appendix X PRP implementation and alignment with the ESP .....................................................117
Appendix XI Contributions of the GPE-funded REDiSL project to ESP implementation ...............119
Appendix XII Progress towards ESP 2014-2018 objectives ...........................................................125
Appendix XIII Data on GPE results framework ..............................................................................129


FINAL REPORT - SIERRA LEONE xxiii
© UNIVERSALIA
Acknowledgement The evaluation team hereby wishes to express its gratitude to all stakeholders who have been involved in and supported this evaluation, including the Ministry of Education, Science and Technology (MEST) of Sierra Leone, UNICEF Sierra Leone as coordinating agency and facilitator of the in-country mission, the GPE Secretariat and the Sierra Leone country lead, and all other individuals consulted during the process.


FINAL REPORT - SIERRA LEONE 1
© UNIVERSALIA
1 Introduction
1.1 Background and purpose of the summative evaluation
1. The Global Partnership for Education (GPE) is a multilateral global partnership and funding platform established in 2002 as the Education for All Fast Track Initiative (EFA/FTI) and renamed GPE in 2011. GPE aims to strengthen education systems in developing countries in order to ensure improved and more equitable student learning outcomes, as well as improved equity, gender equality and inclusion in education.9 GPE brings together developing country partners (DCPs), donors, international organizations, civil society, teacher organizations, the private sector and foundations.
2. This evaluation is part of a larger GPE study that comprises a total of 22 summative and eight formative country level evaluations (CLE). The overall study is part of GPE’s monitoring and evaluation (M&E) strategy 2016-2020, which calls for a linked set of evaluation studies to explore how well GPE outputs and activities contribute to outcomes and impact10 at the country level. The objective of each summative CLE is to assess (i) GPE contributions to strengthening education systems and, ultimately, the achievement of education results within a partner developing country in the areas of learning, equity, equality and inclusion; and hence (ii) the relevance, efficiency and effectiveness of GPE’s theory of change (ToC) and of its country-level operational model.11 See Box 1.1.
3. The primary intended users of the country level evaluations are members of the Global Partnership for Education, including DCP governments and members of local education groups (LEGs) in the sampled countries, and the Board. The secondary user is the Secretariat. Tertiary intended users include the wider education community at global and country levels.
9 Global Partnership for Education (2016): GPE 2020. Improving learning and equity through stronger education systems. 10 In the context of this assignment, the term ‘impact’ is aligned with the terminology used by GPE to refer to sector level changes in the areas of learning, equity, gender equality and inclusion (reflected in GPE Strategic Goals 1 and 2 described in the GPE 2016-2020 Strategic Plan). While the country evaluations examine progress towards impact in this sense, they do not constitute formal impact evaluations, which usually entail counterfactual analysis based on randomized control trials. 11 Assignment Inception Report (based on the evaluation ToR), p.1.
Box 1.1. Scope of this summative evaluation
This summative country evaluation is focused on eliciting insights that can help GPE assess and, if needed, improve its overall approach to supporting developing country partners. It does not set out to evaluate the performance of the government of Sierra Leone, the grant agent and coordinating agency, other in-country stakeholders, or specific GPE grants.

2 FINAL REPORT - SIERRA LEONE
© UNIVERSALIA
1.2 Methodology overview
4. The guiding frameworks for the evaluation are the evaluation matrix (Appendix I) and the country-level theory of change for Sierra Leone (Appendix II).12 A brief summary of the country evaluation methodology is provided in Appendix III of this report. For further details, please refer to the Inception Report for the overall assignment (January 2018).
5. For the Sierra Leone CLE, the evaluation team consulted a total of 33 stakeholders from the Ministry of Education, Science and Technology (MEST), development partners, civil society and the Secretariat (see Appendix IV for a stakeholder analysis and Appendix V for a list of consulted stakeholders), and reviewed a wide range of relevant documents, databases, websites as well as selected literature (see Appendix VI for a list of reviewed sources).
6. The report presents findings related to the three ‘Key Questions’ (KQs) from the evaluation matrix, which trace the contribution of GPE support to country-level objectives (KQ I); of country-level objectives to better systems (KQ II); and of better systems to progress towards impact (KQ III). The findings are presented in three sections that correspond to the three KQs. In turn, each section is divided into sub-sections of findings that address the contribution claims under each KQ. The three KQs and the six contribution claims (A, B, C, D, E, F) are presented in Figure 1.1.
Figure 1.1 The evaluation presents findings on key evaluation questions and contribution claims
12 This country-specific ToC was adapted from the generic country-level ToC that was developed in the assignment Inception Report.

FINAL REPORT - SIERRA LEONE 3
© UNIVERSALIA
1.3 Structure of the report
7. Following this introduction, Section 2 gives an overview of the national context of Sierra Leone, with a focus on the education sector (section 2.1) and the history of the country’s involvement with GPE support (section 2.2).
8. Section 3 presents evaluation findings related to GPE’s claimed contributions to country-level objectives related to changes in sector planning; fostering mutual accountability through inclusive policy dialogue and sector monitoring; sector plan implementation; and sector financing.
9. Section 4 discusses education system-level changes in Sierra Leone with a focus on the period 2014-2017 as the period covered by the most recent GPE ESPIG, and reflects on likely links between these changes and progress made towards the country-level objectives discussed in section 3.
10. Section 5 presents an overview of the impact-level changes13 observable in Sierra Leone and possible links to the noted changes in the national education system. Finally, Section 6 presents the overall conclusions of the evaluation.
13 In the context of this assignment, the term ‘impact’ is aligned with the terminology used by GPE to refer changes in the areas of learning, equity, gender equality and inclusion (reflected in GPE Strategic Goals 1 and 2 described in the 2020 Strategic Plan). While examining progress towards impact in this sense, the country evaluations do not constitute formal impact evaluations, which usually entail counterfactual analysis based on randomized controlled trials.

4 FINAL REPORT - SIERRA LEONE
© UNIVERSALIA
2 Context
2.1 Overview of Sierra Leone
11. The Republic of Sierra Leone gained independence from Britain in 1961. While it initially had a parliamentary government, the country became a presidential republic in 1971. The country has a population of 7.4 million (2016) of which 3.1 million (42 percent) are 14 years and younger.14 Administratively, the country is divided into four provinces, 16 districts, and 149 chiefdoms.
12. From 1991 to 2002, Sierra Leone was devastated by a civil war that left more than 50,000 people dead, much of the country’s infrastructure destroyed and over two million citizens displaced in neighboring countries. In 2014, an outbreak of the Ebola Virus Disease (EVD) in neighboring Guinea, which spread to Sierra Leone, created a humanitarian crisis and negatively impacted economic growth. The economic crisis was further fueled by a downturn in global prices for iron ore, a commodity that the country had strongly relied on for revenues.15
13. Until the EVD outbreak in May 2014, Sierra Leone was seeking to become a nation with middle-income status, but the country still has high youth unemployment, corruption, and weak national cohesion. It has a per-capita Gross National Income of US$1,529 (2016) and currently ranks 179 out of 188 countries on the United Nations Development Programme (UNDP) Human Development Index.16 Average life expectancy is low at 51 years. The World Bank currently categorizes Sierra Leone as a fragile country.17
14. The overall development vision of Sierra Leone is captured in its current Poverty Reduction Strategy Paper (PRSP) for 2013-2018, titled “The Agenda for Prosperity”. The agenda outlines eight pillars and aims to place the country on the “Road to Middle Income Status.”
2.2 The education sector in Sierra Leone
15. The Education Act 2004 gives the Ministry of Education, Science and Technology (MEST) the authority to manage the provision of education at all levels (pre-primary to tertiary), and to improve literacy among citizens through adult and non-formal education. The ministry is organized into six directorates:
14 World Bank World Development Indicators database, Sierra Leone country profile, and UIS data. Note that the UNDP Human Development Index (HDI) report for 2016 states the total population at 6.5 million. 15 Government of Sierra Leone, Ministry of Education, Science and Technology (2017): Education Sector Plan 2018-2020. 16 Gross national income (GNI) per capita is in 2011 United States Dollars at Purchasing Power Parity. Source: UNDP World Development Report 2016. Sierra Leone country profile. http://www.hdr.undp.org/en/countries/profiles/SLE 17 World Bank Group (2018): Harmonized List of Fragile Situations FY 2018. http://www.worldbank.org/en/topic/fragilityconflictviolence/brief/harmonized-list-of-fragile-situations

FINAL REPORT - SIERRA LEONE 5
© UNIVERSALIA
Educational Programmes and Services; Higher Education, Science and Technology; Non-Formal and Adult Education; Inspectorate Division; Research and Curriculum Development; and Planning and Policy. The current minister of education has been in office since 2007.
16. Operated under MEST are several semi-autonomous government agencies, including the Basic Education Commission (BEC), the National Commission for Technical and Vocational Examination (NCTVE) and the Teaching Service Commission (TSC).18
17. The education system is organized into pre-primary (three years), primary (six years), junior secondary (three years), senior secondary (three years), higher education, and Technical and Vocational Education and Training (TVET). The system also supports adult and non-formal education. Together, primary and junior secondary constitute the basic education cycle, which is compulsory for all children. The official age groups for each schooling level are shown in Table 2.1.
Table 2.1 Official school age in Sierra Leone by level
LEVEL AGE GROUP (YEARS)
Preschool / Pre-primary 3-5
Primary 6-11
Junior Secondary 12-14
Senior Secondary 15-17
Source: Sierra Leone Education Sector Plan 2014-2018, p. 8.
18. In 2017, the total population of school-aged children in Sierra Leone was 0.67 million for the pre-primary level, 1.23 million for primary, and 0.55 million for the lower secondary level.19 The expected average annual growth of the school-aged population is 1.3 percent for pre-primary, 3.0 percent for primary, and 5.3 percent for lower secondary.20
19. According to the 2016 school census,21 there were, in 2016:
Close to 2 million children enrolled from pre-primary to senior secondary levels,22 of which 70 percent (1.4 million) were in primary schools, 16 percent (0.31 million) in junior secondary schools (JSS), and 4 percent (0.08 million) at the pre-school level.
Of the 63,535 teachers nationwide, 60 percent (37,828) worked in primary schools, 23.8 percent (15,122) at the JSS level, and 5.6 percent (3,569) in pre-primary classrooms.
18 Government of Sierra Leone, Ministry of Education, Science and Technology (2007 and 2014): Sierra Leone Education Sector Plans 2007-2015 and 2014-2018. Information also derived from interviews with MEST representatives. 19 Source: UIS. Data for pre-primary population is for 2016 20 Sierra Leone Education Country Status Report 2013, p.2. Actual population numbers derived from UIS and the 2014-2018 ESP imply similar estimates. 21 Government of Sierra Leone, Ministry of Education, Science and Technology (2017): 2016 Annual School Census. Draft Statistical Year Book. (Not available online). 22 GPE support focuses on Basic Education, which does not include the senior secondary level.

6 FINAL REPORT - SIERRA LEONE
© UNIVERSALIA
Of the existing 8,907 schools, 70 percent (6,321) are primary schools, 13 percent (341) JSS and 12 percent pre-schools. More than half (4,553 or 51.1 percent) are owned by missions/religious bodies, and 1,882 (21.1 percent) are community-owned, while only 1,252 (14.1) percent are government-owned, and 1,168 or 13.1 percent are private.23
Only 40 percent (3,615) of the existing schools captured in the latest school census are government-approved, while 4,777 (54 percent) are unapproved.27 See Box 2.1.
20. In Sierra Leone, the role of the Local Education Group (LEG) is played by the Education Development Partner (EDP) Group, which brings together the MEST with representatives from the Ministry of Finance, donor and multilateral agencies, international NGOs and domestic CSOs, and the Sierra Leone Teachers’ Union. Main development partners supporting the education sector who are also represented on the EDP are the World Bank (WB), the U.K. Department for International Development (DFID), the European Union (EU) and UNICEF. These donors also meet on a regular basis within the donor-only Education Donor Group (EDG). In addition, several international NGOs are delivering education projects, including Action
23 The remaining 52 schools are, in the 2016 school census, classified as ‘other’, but this category is not further explained. All government-approved schools, including mission, private and community schools, receive financial government support e.g., for teacher salaries. This implies that school approval has fiscal implications, which is one reason why school approval is progressing slowly in Sierra Leone. 24 ESP 2018-2020, p.59. 25 The Annual School Census provides information on the proportion of unapproved schools, and disaggregates data on pupils by type of school (government, private, mission, community schools), but the division of approved versus unapproved schools cuts across these categories. 26 As further discussed in section 4 of this report, the minimum standards were only drafted towards the end of the period under review. 27 For the remaining 515 schools their status as either approved or not approved was unknown at the time of the census. This may be the case, for example, for schools that have applied for approval by the MEST but have not yet received a decision.
Box 2.1 Unapproved schools in Sierra Leone
Unapproved schools combine a mix of mission run/faith-based, and community schools. While unapproved schools are reflected in the annual school census and thus feed into national education statistics, they do not receive most of the inputs provided by MEST, including payment of teachers, basic materials and school feeding. As such, they are less accountable to MEST than approved schools, and do not always follow the official curriculum.24 No data are available on the proportion of children enrolled in unapproved schools.25
Interviews with LEG members (both domestic and international) indicated that unapproved schools do not form a homogenous group and that they vary considerably in the learning environments they provide, infrastructure, teaching staff, curricula followed, and learning materials used. Although in some cases unapproved schools exist where no approved schools exist, in other cases they coexist, as parents prefer to send their children to unapproved schools of particular religious denominations rather than to an adjoining, free government-approved school.
The new Education Sector Plan (ESP) 2018-2020 aims to approve all schools that meet the MEST’s minimum standards within an agreed length of time and close those not able to meet the standards after ensuring schools with available spaces are accessible for students of these schools.26

FINAL REPORT - SIERRA LEONE 7
© UNIVERSALIA
Aid and the Catholic Relief Services (CRS). Domestic CSOs tend to focus on education advocacy rather than service delivery.28
21. To date, Sierra Leone has developed three education sector plans (ESPs) covering the periods 2007-2015, 2014-2018, and 2018-2020 respectively. The 2018-2020 ESP constitutes an interim sector plan that updates the previous ESP and aims to bridge the time needed for developing a full new plan covering a longer period.29 This evaluation focuses on the 2014-2018 ESP as the period covered by the most recent GPE ESPIG but also refers to the previous and the most recent plans where relevant.
22. The 2014-2018 ESP is built around three pillars: Access, Equity and Completion (seven strategic objectives), Quality and Relevance (five strategic objectives), and System Strengthening (11 strategic objectives). It also outlines systems for monitoring, financing, and implementing the plan. As shown in Table 2.2, the ESP aims to address key areas for improvement in the education system as noted in an education Country Status Report (CSR) conducted by UNESCO/Pole de Dakar et al in 2013.30
Table 2.2 The 2014-2018 ESP addressed key sector gaps identified in the 2010 CSR31
CHALLENGES IDENTIFIED IN 2010 COUNTRY STATUS REPORT
PRIORITIES OF THE 2014-2018 ESP TO ADDRESS THESE CHALLENGES
Access, Equity and Completion
24% of the 6-11 year age group were out of school in 2010, most of which never attended school Late entry –40% of Grade 1 new entrants are aged seven years and above Household wealth remains a major factor of disparities in children’s enrollment Gender disparities in access to education are slight but tend to deepen at higher levels
Ensure that all children enter school and complete primary education Increase access to pre-school for children aged 3-5 years old Increase the completion level and equitable access to junior secondary schools Increase equitable access to senior secondary schools Increase equitable access to technical and vocational schools Increase equitable access to higher education institutions Improve the literacy rate for youth and adults
Quality and Relevance
Demographic pressure on the education system is set to increase in the near future Pupils’ learning outcomes are generally very poor at all levels
Improve learning environments Revise the curricula and student assessment
28 Sources: Government of Sierra Leone, Ministry of Education, Science and Technology (2015): Final Report of Proceedings and Outcomes of the Joint Education Sector Review 2015. World Bank (2016): World Bank Education Mid Term Review August 2016. Aide Memoire; and consultations with EDG members and MEST representatives. 29 The use of an interim plan reflected the assumption (at the time of developing the new ESP) that the general elections held in March 2018 might result in changes in government and MEST priorities. As of April 2018, the opposition candidate had been declared the winner of the presidential election, and sworn in as the new president. 30 Ministry of Education, Science and Technology. Sierra Leone Education Country Status Report. Dakar: Pôle de Dakar, UNESCO-Dakar Office, September, 2013. 31 See also Appendix IX, which maps CSR recommendations against ESP priorities and related interventions, as well as against PRP priorities and against GPE strategic goals for 2012-2015.

8 FINAL REPORT - SIERRA LEONE
© UNIVERSALIA
CHALLENGES IDENTIFIED IN 2010 COUNTRY STATUS REPORT
PRIORITIES OF THE 2014-2018 ESP TO ADDRESS THESE CHALLENGES
Repetition is particularly high for primary at 16 percent, well above the SSA average of 12 percent Inequitable deployment of teachers; many untrained/unqualified teachers
Improve students’ acquisition of basic skills of reading and numeracy Improve the quality of teachers Equitably deploy teachers nationwide
Systems strengthening
Inefficient teacher management; existing staff not optimally used Weak supervision and accountability mechanisms at the local level Absence of an adequate and effective decentralized information and monitoring system Absence of decentralized financial and human resource management system
11 objectives, including:32 Improve communication and coordination within the sector
Develop consistent, coherent, enabling policies and legislation and put frameworks in place to influence all levels33
Establish effective, functioning systems for teacher recruitment, deployment, performance appraisal, promotion and development
Ensure that the MEST has the capacity and capability to collect, manage and use current data and evidence
23. The 2014-2018 Education Sector Plan was accompanied by a detailed Implementation Plan (IP) for 2014-2016. However, the EVD outbreak in 2014 interrupted the ESP’s implementation. In the education sector, the EVD crisis led to school closure for nine months, the loss of students and teachers, and high numbers of teenage girl pregnancies due to increased rates of sexual violence during the epidemic.34
24. The government responded to EVD, first, with an Early Recovery Plan 2014-2015, which in relation to education focused on three priorities: (i) reopening of educational institutions in a safe and healthy environment with supportive psychosocial services for students and teachers; (ii) encouraging re-enrollment; and (iii) improving the quality of teaching and learning, including through ongoing TV and radio lessons. MEST translated these priorities into its own Ebola Strategic Response Plan (ESRP). Schools across the country re-opened in April 2015.
25. In 2016, a cross-sectoral Presidential Recovery Plan (PRP) was put in place for 2016-2017 that outlined education as one of seven priority sectors to be addressed during recovery. The PRP included two priority objectives for the education sector to be achieved by June 2017, the first of which reflected
32 For a full list of ESP 2014-2018 strategic objectives see Appendix IX. 33 Specifically, the ESP aimed to either develop or finalize a TVET policy, a higher education strategy, a policy on where and how teachers are posted to schools, a non-formal education policy, minimum standards for schools and other institutions, and policy on textbooks/teaching and learning materials. Source: 2014-2018 ESP. 34 Amnesty International (2016) Sierra Leone: Continued pregnancy ban in schools and failure to project rights is threatening teenage girls’ futures. Available at: https://www.amnesty.org/en/latest/news/2016/11/sierra-leone-continued-pregnancy-ban-in-schools-and-failure-to-protect-rights-is-threatening-teenage-girls-futures See also UNICEF (2016): The long-term impacts and costs of Ebola on the Sierra Leonean education sector.

FINAL REPORT - SIERRA LEONE 9
© UNIVERSALIA
priorities also outlined under the ESP: (i) improve key learning outcomes by training at least 40,000 teachers and reducing overcrowding in severely affected schools; and (ii) institute nationwide school feeding. 35 While implementing the PRP became a priority for MEST and some development partners, the 2014-2018 ESP was not officially replaced but co-existed with the PRP. It was the ESP, rather than the PRP, for example, that was used to structure the 2015 education sector review and the 2017 Mid-Term Review (see section 3.3). Table 2.3 provides an overview of the sequence of events in the education sector in 2014-2018, over the course of what should have been the implementation period of the ESP.36
Table 2.3 Timeline of events in the Sierra Leonean education sector, 2014-2018
2014 2015 2016 2017 2018
ESP 2014-2018 ESP 2018-2020
Period covered by the GPE ESPIG-funded REDiSL project37 2014-2017
Ebola outbreak 2014-2016
Early Recovery Plan (MEST Ebola Strategic Response Plan) 2014-2015
Presidential Recovery Plan (PRP) 2016-2017
Education Sector Review 2015 •
ESP 2014-2018 Mid-Term Review 2017 •
2.3 GPE in Sierra Leone
26. Sierra Leone joined the Global Partnership for Education in 2007 and is represented on the Board through the Africa 3 constituency group.
27. To date, Sierra Leone has received two education sector plan implementation grants (ESPIGs), two education sector plan development grants (EDPDGs), and one program development grant (PDG) as summarized in Table 2.4. The 2014-2017 education sector plan implementation grant was used to fund the World Bank-led Revitalizing Education Development in Sierra Leone (REDiSL) project.
35 Website of the Government of Sierra Leone: The President’s Recovery Priorities. “Ebola don go, leh we make Salone grow!”. Available at: http://www.presidentsrecoverypriorities.gov.sl/the-early-recovery . See also: Government of Sierra Leone (2015): National Ebola Recovery Strategy for Sierra Leone. Available at: https://ebolaresponse.un.org/sites/default/files/sierra_leone_recovery_strategy_en.pdf . 36 Government of Sierra Leone, Ministry of Education, Science and Technology (2017): Education Sector Plan 2018-2020. Government of Sierra Leone (2015): National Ebola Recovery Strategy for Sierra Leone. Government of Sierra Leone website on the President’s Recovery Priorities – Priority sector Education: www.presidentsrecoverypriorities.gov.sl/education . 37 The ESPIG was approved on July 31, 2014 and was planned to last until Feb 28, 2017. An extension until December 31, 2017 was subsequently approved.

10 FINAL REPORT - SIERRA LEONE
© UNIVERSALIA
Table 2.4 GPE grants to Sierra Leone since becoming a GPE partner country in 200738
GRANT TYPE YEARS ALLOCATIONS (USD) DISBURSEMENTS (USD)
GRANT AGENT
Program Implementation (ESPIG)
2014-2017 17,900,000 17,899,794 IBRD
2008-2012 11,691,405 11,691,406 IBRD
Sector Plan Development (ESPDG)
2012 250,000 249,961 IBRD
2017 497,502 n/a39 UNICEF
Program Development (PDG) 2012 207,567 203,908 IBRD
28. In February 2018, the MEST submitted an application for another ESPIG to support roll-out of the new Education Sector Plan 2018-2020. While the World Bank had acted as grant agent (GA) for the two previous ESPIGs, the government selected UNICEF as GA for the envisaged new grant. DFID, the World Bank and the EU have proposed to take annual turns in filling the role of coordinating agency (CA) previously held by UNICEF for 2018-2020. Both ESPIGs received to date have been implemented using a project mode, and this is also proposed for the third grant currently under preparation.
29. In addition, the Education For All Sierra Leone coalition (EFA-SL), an umbrella organization for domestic CSOs engaged in education advocacy, has received Civil Society Education Fund (CSEF) grants of up to US$100,000 under all three CSEF cycles implemented to date.40
30. Moreover, the original design of two GPE Global and Regional Activities (GRA) grants had initially included plans to carry out activities involving Sierra Leone (GRA 10 on Delivering strategic objectives on teachers, and GRA 11 on Addressing the out-of-school children data and policy gaps). For GRA 10, activities in Sierra Leone were cancelled due to the EVD crisis. For GRA 11, the final project report provides no indication of any activities having been carried out in Sierra Leone.
38 Sources: GPE website (https://www.globalpartnership.org/country/sierra-leone) and grant proposal and approval documents provided by the Secretariat. 39 Interviews indicate that the ESPDG has been disbursed but precise disbursement data is not yet available. 40 CSEF I (2009-2012), CSEF II (2013-2015) and CSEF III (2016-2018).
FINAL REPORT - SIERRA LEONE 11
© UNIVERSALIA
3 GPE contributions to sector planning, implementation, dialogue/monitoring and financing41
3.1 Introduction
31. This section summarizes findings related to Key Question I of the evaluation matrix: “Has GPE-support to Sierra Leone contributed to achieving country-level objectives related to sector planning, to sector dialogue and monitoring, to more/better financing for education, and to sector plan implementation? If so, then how?”42
32. The GPE country-level theory of change, developed in the inception report and adapted to the Sierra Leone context (Appendix II), outlines four contribution claims for GPE’s contributions to these dimensions. Each contribution claim is based on several underlying assumptions (Appendix VII).
33. This section is structured around the four country-level objectives and their corresponding contribution claims. It tests each of the four contribution claims by answering two sub-questions for each phase of the policy cycle. First, what has changed in the country, during the period under review?43 And second, has GPE contributed to these changes and, if so, how?44 Answers to these questions are presented in the form of findings and a summary assessment of the contribution claim is presented at the beginning of each sub-section. The summary assessments are colored to indicate whether evaluation evidence supports (green), partly supports (amber), or does not support (red) the respective contribution claim, or if there is insufficient data to assess the respective claim (grey). Appendix VII explains the underlying rating criteria and provides an overview of the evaluation’s assessment regarding the likely application of each of the underlying assumptions related to each of the contribution claims.
41 In the generic country-level ToC developed during the inception phase, envisaged improvements in the areas of education sector planning, mutual accountability for sector progress, education sector financing, and ESP implementation constitute the key country-level objectives that GPE is aiming to contribute to. This largely mirrors how country-level objectives are defined in the GPE 2016-2020 strategic plan, except for mobilizing more and better education sector financing, which in the GPE 2020 is framed as a global level objective. The summative evaluations approach the issue of sector financing as a country-level objective to reflect that the focus is on changes in sector financing for the specific country under review. 42 Improved planning, dialogue/monitoring, financing, and plan implementation correspond to Country-Level Objectives (CLOs) 1, 2, 3 and 4 of GPE’s 2016-2020 Strategic Plan. 43 This question corresponds to Country Evaluation Questions (CEQ) 1.1, 1.2, 1.4, 2.1, 2.2 in the evaluation matrix. 44 This corresponds to CEQ 1.3, 1.4, 1.5, 2.3, 3.1, and 3.2.

12 FINAL REPORT - SIERRA LEONE
© UNIVERSALIA
3.2 Sector planning45
Strengths and weaknesses of sector planning during the period under review 47
Finding 1: The 2014-2018 Education Sector Plan constituted an improvement over the previous plan, whilst retaining several weaknesses. The process of its development was participatory, fostered government ownership, and thereby contributed to strengthening in-country capacities for sector planning.
34. The 2014-2018 ESP described 23 strategic objectives (see Appendix IX) under the three overarching priority areas of (i) Access, Equity and Completion; (ii) Quality and Relevance; and (iii) System Strengthening.48 The specific objectives and related interventions outlined under these priority areas were, overall, relevant considering the main gaps and related recommendations identified in the 2013 education Country Status Report (see Table 2.2 in section 2.2). The priority areas were also relevant to the GPE Strategic Goals at the time (see Appendix IX).
35. The Education Sector Plan 2014-2018 was endorsed by the Education Development Partners Group (EDP) in August 2013. The EDP’s appraisal report acknowledged a variety of strengths of the
45 This section addresses evaluation questions CEQ 1.1 (What have been strengths and weaknesses of education sector planning during the period under review?), 1.3 (Has GPE contributed to the observed characteristics of sector planning? How?) and CEQ 3 (What factors other than GPE support can explain observed changes (or lack thereof) in sector plan development, plan implementation, sector dialogue and monitoring?). 46Please see sub-section on ‘validity of assumptions’ below as well as Appendix VII. 47 Evaluation question CEQ 1.1. 48 The area of system strengthening in the ESP addresses issues of sector management and MEST capacity.
Box 3.1: Assessment of Contribution Claim A.
Claim: “GPE (financial and non-financial) support and influence contribute to the development of government-owned, credible and evidence-based sector plans focused on equity, efficiency and learning.”
Assessment: The evaluation found that available evidence supports the GPE contribution claim related to strengthening education sector planning.
Assessment is based on: (a) The envisaged result was achieved, i.e., during the review period the government of Sierra Leone did develop sector plans that, despite some areas for improvement, are government owned, credible and evidence-based; (b) Available evidence indicates that the likelihood of the assumptions underlying the GPE contribution claim holding true in the Sierra Leone context are ‘strong’ for four, and ‘moderate’ for one out of five assumptions;46 (c) The evaluation found no additional external factors beyond GPE support that would, on their own, suffice to explain the noted progress in sector planning. This overall assessment is elaborated on in the following paragraphs.
Please see Appendix VIII for a visual representation of evaluation findings on GPE contributions to sector planning.

FINAL REPORT - SIERRA LEONE 13
© UNIVERSALIA
document, some of which illustrated an improvement compared with the country’s previous (first) sector plan for the period 2007-2015. At the same time, while meeting the basic requirements for EDP endorsement, the 2014-2018 ESP still had several weaknesses.
36. According to the Secretariat’s internal ESP quality rating, the 2014-2018 ESP met four of the seven quality standards under RF indicator 16a (overall vision, evidence-based, sensitive to context, and attentive to disparities) but had gaps in three areas (strategic, holistic, and achievable).49 This rating mirrors shortcomings noted in the EDP’s appraisal report (August 2013) and the 2017 Mid-term review (MTR) of the ESP. Table 3.1 summarizes the strengths and weaknesses of the 2014-2018 ESP based on the evaluation team’s analysis of available data.
Table 3.1 Strengths and weaknesses of the 2014-2018 ESP50
DIMENSION51 STRENGTHS GAPS/WEAKNESSES
Country-led, participatory and transparent process of ESP development
Overall, the process was country-led and participatory, including extensive consultations with government and non-government actors at central, district and local council levels.52 Supporting this, the timeframe for 2014-2018 ESP development was more generous than those for either the preceding (2007-2015) or subsequent (2018-2020) plan.
During the development of the ESP, communication with stakeholders was not sustained during all stages, and it was not fully transparent if and how suggestions deriving from consultations were used and prioritized. No extensive consultation of stakeholders from schools that were not government approved.
Addressing key challenges of the education sector in relation to equity,
The 2014-2018 ESP was informed by and responded to the numerous sector gaps identified in the 2013 CSR.53
The Country Status Report, the ESP’s main evidence base, faced several data limitations that prevented the analysis of trends (e.g., in enrollment data). Also, the CSR was not able to
49 No data is available in relation to the 2014-2018 ESP on GPE RF indicators 16 b, c and d. 50 Sources: EDP Appraisal Report of the 2014-2018 ESP (2013); Global Partnership for Education. ESP Ratings Calculations. Washington, D.C., September 2017; Mid-term review of the ESP (2017); Education Country Status Report Sierra Leone (2013); 2014-2018 ESP; GPE/UNESCO IIEP: Guidelines for Education Sector Plan Appraisal. Washington and Paris. 2015. (file:///C:/Users/anett/AppData/Local/Packages/Microsoft.MicrosoftEdge_8wekyb3d8bbwe/TempState/Downloads/2015-06-gpe-iiep-guidelines-education-sector-plan-appraisal.pdf. 51 The dimensions used in this table to structure observations constitute a blend of the GPE/UNESCO IIEP ESP appraisal criteria as described in the 2015 Guidelines for Education Sector Plan Appraisal and the GPE ESP quality criteria. As such, they address both process as well as content related characteristics of the sector plan. 52 “All 19 Local Councils were visited and discussions held with a broad cross-section of stakeholders that included students, teachers, petty traders, the disabled, traditional leaders, unemployed youths, etc.” (ESP 2014-2018, p. 16). Stakeholders from MEST consulted for this evaluation indicated that this constituted an improvement over the process of developing the first education sector plan for 2007-2015 which had not involved development partners from the beginning. The process for the ESP 2014-2018 drew on these lessons. 53 While the 2007 ESP had also been based on a CSR, it made less extensive reference to available data and, for example, did not include any information disaggregated by gender or geographic location. This improved in the 2014-2018 ESP.

14 FINAL REPORT - SIERRA LEONE
© UNIVERSALIA
DIMENSION51 STRENGTHS GAPS/WEAKNESSES
efficiency and learning
The 2014-2018 ESP was more closely aligned with the Sierra Leone Poverty Reduction Strategy III (Agenda for Prosperity) than the previous plan. Also, it gave more equal attention to different sub-sectors than the previous ESP, which had more strongly focused on basic education.
draw upon systematic data on TVET, higher education and teacher education. Absence of a comprehensive risk analysis or discussion of emergency preparedness, despite Sierra Leone’s status as a fragile country. Issues such as services for learners with special needs and reducing the number of out-of-school children were either not mentioned in the ESP or not adequately costed to reflect the level of prioritization assigned to them in the discussion. While the ESP formulates objectives related to more equitable access to education, it does not put forward a clear vision for inclusive education. The ESP did not adequately reflect the Agenda for Prosperity’s emphasis on strengthening TVET.
Realistic financing, implementation and monitoring arrangements. Achievability.
The ESP identified existing gaps in MEST capacity, and outlined (albeit broad) strategies to address them.
Limited prioritization among the various objectives Lack of discussion of how the government intended to bridge the identified funding gap if the predicted growth rate was not realized Weaknesses in MEST human resource capacities, and lack of clarity on accountability for plan implementation and monitoring.
37. Despite the noted gaps, all consulted stakeholders agreed that the 2014-2018 ESP had provided them with a relevant common framework for assessing sector progress against agreed upon targets, and that it defined a common set of priorities that individual partner-supported projects could strive to align themselves with. See Box 3.2.
38. While the ESP was replaced by the Presidential Recovery Plan (PRP) during the Ebola outbreak, MEST indicated its commitment to the ESP by structuring both the 2015 joint sector review and the 2017 mid-term review around ESP objectives, as opposed to the more narrowly defined objectives of the PRP. As shown in Appendix X, five out of ten PRP key performance indicators were aligned with ESP priorities. Four were partially aligned (i.e., they addressed
54 In its 2017 data collection, GPE rated the ESP 2018-2020 as meeting all 7 criteria under GPE RF indicator 16a, as well as all criteria under indicators 16b-d. 55 Source: ESP 2018-2020 and consultations with donors.
Box 3.2: The most recent ESP 2018-2020 addresses some of the shortcomings of the previous sector plan, most prominently by including a section on emergency preparedness and response, and by providing more data on, and more attention to, out-of-school children and children with disabilities.54
It is not yet clear how the government is intending to bridge the estimated funding gap for implementing the ESP. Some donors suggested that the projected funding gap may rise and highlighted ‘costing’ as one of the ESP’s weaknesses. For instance, the ESP is not explicit about how it hopes to fund strategic objective 2.2 (0 unapproved schools by 2020), when the ASC 2016 shows that 54 percent of the country’s schools are currently unapproved. School approval has financial implications (school subsidies, teacher salaries, etc.) that are likely to vastly outstrip the US$75,000 allocated to this objective.55

FINAL REPORT - SIERRA LEONE 15
© UNIVERSALIA
the same issue but varied in terms of related targets or initiatives), and one (introduction of a school feeding program) was not aligned.
39. Consulted MEST staff noted that having now led three cycles of developing education sector plans based on internationally agreed standards has contributed to strengthening domestic capacities for evidence-based sector planning. Both the 2014-2018 and the 2018-2020 ESPs were prepared by largely the same team of national consultants and MEST staff, with some technical support from development partners related to economic forecasting, sector analysis, and ESP costing.56
Did GPE contribute to the observed characteristics of sector planning? 57
Finding 2: GPE has made transformative contributions to sector planning by providing incentives, guidelines, and resources for sector plan development.
40. Evidence deriving from document review and stakeholder interviews shows that GPE has significantly contributed to strengthening education sector planning in Sierra Leone in at least four ways as described below:
Providing an incentive: The prospect of obtaining a substantial implementation grant from the (then) Education For All – Fast Track Initiative (EFA-FTI) was a key driver for developing Sierra Leone’s first comprehensive education sector plan for 2007-2015.58 While national actors have since recognized the value of sector plans, all consulted stakeholders acknowledged that GPE implementation grant requirements have continued to be an important incentive for the development of subsequent sector plans (2014-18 and 2018-20).59 See also Box 3.3.
Providing guidelines: The Secretariat shared information with in-country actors on what the process of developing and appraising a good ESP should look like. According to consulted MEST and EDP stakeholders, and as reflected in ESP appraisal documents, GPE guidelines provided valuable process and content-related direction both to the team(s) preparing the 2014-2018 and 2018-2020 ESPs, and to the education sector partners reviewing and appraising the document.60 Stakeholders did not identify any particular elements of the existing guidelines that would have been more or less helpful than others.
56 Stakeholders varied in their views on whether this level of sector planning was unique in Sierra Leone. Whilst government stakeholders indicated that other sectors also follow clear work plans, some donors and NGOs felt that sector planning in education was more advanced than in other sectors in Sierra Leone (e.g., agriculture). 57 Evaluation question CEQ 1.1. 58 Sources: 2007-2015 Education Sector Plan, and consultations with MEST representatives and LEG members. 59 In the 2018-2020 ESP, the decision to develop an interim sector plan before having conducted another comprehensive sector analysis (planned for 2019) was strongly influenced by the government’s desire to apply for and obtain another ESPIG as soon as possible after the end of the previous grant that ended in late 2017. 60 The 2014-2018 ESP was developed and appraised based on the 2012 Global Partnership for Education/International Institute for Educational Planning ‘Guidelines for Education Sector Plan Preparation and Appraisal’. The most recent ESP 2018-2020 is based on the updated (2015) ‘Guidelines on sector plan preparation’
Box 3.3: GPE’s funding requirement of having an ESP to get an ESPIG is crucial. Additionally, the ESPDG is very helpful. The experts it provides are invaluable. (Donor representative)

16 FINAL REPORT - SIERRA LEONE
© UNIVERSALIA
Providing resources: Sierra Leone obtained education sector plan development grants (ESPDGs) for both the 2014-2018 and the 2018-2020 ESPs, which covered most of the costs of developing the plans.61 For the 2014-2018 ESP this allowed the MEST to hire a local consultant who put together several teams comprising a cross section of stakeholders (national experts, civil society representatives) and representatives of relevant ministries. These groups developed a first draft of the sector plan, which was then elaborated on by the local consultant. GPE ESPDG funding also paid for processes related to ESP appraisal and related stakeholder consultations. The most recent ESPDG (2017) supported the Mid-Term Review of the 2014-2018 ESP, which informed the development of the 2018-2020 ESP.62
Technical assistance and facilitation: The World Bank - as the grant agent (GA) for both the 2008-2012 and the 2014-2017 GPE implementation grants - provided technical assistance to MEST and its consultants, especially in the economic forecasting and budgeting required for ESP development. For both the 2014-2018 and the 2018-2020 ESPs, UNICEF as the coordinating agency facilitated the compilation of the Education Development Partners group’s ESP appraisal reports. For the 2014-2018 plan, UNICEF proposed creating a steering committee to drive ESP development more efficiently. The committee brought together MEST representatives and six donor organizations and INGOs to provide guidance and oversight to ESP finalization. The Sierra Leone country lead reviewed and provided detailed comments on the draft sector plan, which informed the EDP’s appraisal report.63 (See Box 3.4).
Validity of assumptions 41. Available evidence suggests that the combination of GPE financial and non-financial support positively contributed to sector planning by strengthening country-level stakeholder capabilities, motivation, and opportunities (i.e., financial resources) for participatory and evidence-based ESP development. The existence of capabilities, opportunities and motivation had constituted three of the
and ‘Guidelines on sector plan appraisal’. Interviews conducted for this evaluation provided no indication that stakeholders considered either set of guidelines as more or less relevant or helpful. 61 The most recent ESPDG (2017) covered US$497,502 out of the total US$678,840 (i.e., 73.3 percent) calculated for the overall process of sector review and ESP update. 62 The 2014-2018 ESP had been able to draw upon the sector analysis compiled in the 2013 CSR. 63 Education Sector Plan 2014-2018, p.15.
Box 3.4: Effect of appraisal reports on ESP quality
The EDP appraisal report on the 2014-2018 ESP outlined several areas in which the ESP required strengthening. Nevertheless, the EDP endorsed the sector plan around the same time as publishing its appraisal report, based on the assumption that noted shortcomings would be addressed during ESP implementation. There is no record, however, to indicate that this was indeed the case.
In contrast, for the 2018-2020 ESP, the appraisal report explicitly states that EDP endorsement of the sector plan will be conditional on MEST addressing the recommendations raised during the appraisal process.
This reflects the approach suggested in the 2015 GPE country level process guide (p. 21). In contrast, the earlier 2012 Guidelines for Education Sector Plan Preparation and Appraisal had not elaborated on when and how the appraisal process was to be completed relative to the act of ESP endorsement.

FINAL REPORT - SIERRA LEONE 17
© UNIVERSALIA
five underlying assumptions related to sector planning outlined in the GPE country-level theory of change (see Appendix VII). Available evidence also supports the fourth assumption that GPE had sufficient leverage in Sierra Leone to influence sector planning. The fifth underlying assumption, namely that EMIS and learning assessment and reporting systems would produce relevant and reliable data to inform sector planning, was found to hold only partially in the context of developing the 2014-2018 sector plan. This is due to the fact that the Country Status Report, on which the ESP was based, was able to draw upon only limited and sometimes inaccurate EMIS enrollment and examination data.
Additional factors and unintended effects 42. Positive factors beyond GPE support that have influenced the observed characteristics of sector planning processes are existing local capacities and commitment to evidence-based and participatory sector planning in MEST and among education stakeholders. Negative factors are data gaps in the education sector and contextual factors, in particular the 2014-2016 EVD crisis, which contributed to noted weaknesses in the 2014-2018 ESP and the parallel existence of the ESP and the PRP. However, none of the factors on their own contributed significantly to observed characteristics of sector planning.
43. The evaluation did not find evidence of any unintended, positive or negative, effects of GPE financial and non-financial support to sector planning.
3.3 Mutual accountability through sector dialogue and monitoring64
64 This section addresses evaluation questions CEQ 2.1 (Has sector dialogue changed during the period under review?), 2.2 (Has sector monitoring changed?), 2.3 (Has GPE contributed to observed changes in sector dialogue and monitoring? How?) and CEQ 3 (What factors other than GPE support can explain observed changes (or lack thereof) in sector plan development, plan implementation, sector dialogue and monitoring?).

18 FINAL REPORT - SIERRA LEONE
© UNIVERSALIA
Has sector dialogue changed during the 2014-2017 period? 66
Finding 3: Since 2007, education sector dialogue in Sierra Leone has become more systematic and inclusive. At present, however, dialogue is largely focused on information exchange and has had limited effect on achieving synergies and efficiencies among partners.
44. The Education Development Partners Group (EDP) was established in 2007 and initially included MEST, donor agencies, and civil society representation, albeit with a focus on international CSOs. Its membership was expanded in 2013 to include the domestic CSO coalition ‘Education for All Sierra Leone’ (EFA-SL),67 an umbrella organization that brings together domestic organizations advocating for progress in education, including the Sierra Leone Teachers’ Union (SLTU).
45. The EDP meets – on average – every two months and is chaired by the minister of education and co-chaired by the Coordinating Agency (until now UNICEF).68 Membership in the EDP requires a formal application to the Ministry, which has also developed a formal memorandum of understanding between MEST and donor partners, as well as a partnership principles document regulating which organizations are eligible to partake in the EDP. In addition, donor agencies meet separately in the Education Donor Group (EDG).
65 See sub-section on ‘validity of assumptions’ for a discussion of these assumptions. 66 Evaluation question CEQ 2.1. 67 Global Campaign for Education (2013): CSEF 2013 – 2015 Progress Report to UNESCO for the period 01 July to 31 December 2013. Available at: https://www.globalpartnership.org/content/csef-2013-2015-progress-report-unesco-juin-2014, p.3. 68 The structure and pace of sector dialogue changed significantly during the Ebola crisis, as described in Box 3.7.
Box 3.5: Assessment of Contribution Claim B.
Claim: “GPE (financial and non-financial) support for inclusive sector planning and joint monitoring contribute to mutual accountability for education sector progress.”
Assessment: The evaluation found that available evidence partially supports the GPE contribution claim related to strengthening mutual accountability in the education sector.
Assessment is based on: (a) There has been progress towards the envisaged results of strengthening sector dialogue and monitoring, but important areas for improvement remain regarding the composition of the EDP and the quality and of education sector reviews; (b) The extent to which the four assumptions underlying the contribution claim held true in the Sierra Leone context was rated ‘moderate’ for two, and ‘strong’ for two;65 (c) The Ebola crisis constituted an additional factor beyond GPE support that – despite the severe challenges it posed - positively affected sector dialogue in Sierra Leone.
This overall assessment is discussed in the following paragraphs.
Please see Appendix VIII for a visual representation of evaluation findings on the contribution claim related to sector dialogue and monitoring.

FINAL REPORT - SIERRA LEONE 19
© UNIVERSALIA
46. Most consulted EDP members from nongovernmental organizations stated that during the period under review, and notably since the EVD crisis, the quality of MEST engagement with civil society organizations has improved. See Box 3.6. Both CSO and donor representatives noted, however, that this primarily applies to international CSOs, while the voice of domestic organizations has, until now, tended to carry less weight in the EDP than that of donors or international CSOs.
47. Until now, the EDP has not included representatives from the private sector, parent organizations or from non-government approved schools (e.g., representatives of faith-based schools). This constitutes a missed opportunity given that the large number of unapproved schools in Sierra Leone is a challenge that MEST had set out to address under the 2014-2018 ESP, and that remains a priority in the new 2018-2020 ESP.
48. While initially, under the 2007-2015 ESP, EDP meetings tended to focus on issues related to implementing the (then) GPE grant, the focus of the group has shifted to the ESP and sector as a whole. Stakeholders value EDP meetings as a forum for keeping each other informed on what is going on in the sector. However, one CSO and two donor representatives noted that EDP meetings tend to be short, especially relative to the large number of participants, and are taken up by participants (most prominently, MEST) making announcements about their own latest activities. This limits opportunities for in-depth discussions or joint planning. See Box 3.7.
49. Overall, most consulted stakeholders described the current nature of education sector dialogue (inside and outside the structures of the EDP and EDG) as being focused on partners working alongside each other and avoiding duplication of efforts. While this is positive, to date there have been limited efforts to seek active collaboration and synergies among development partners. As a result, under the 2014-2018 ESP, MEST partners implemented various parallel interventions that, while not necessarily duplicating each other, did not actively complement each other or use shared approaches.69
69 For example, UNICEF and GPE co-funded the REDiSL project which addressed issues of early childhood education, but without aligning their interventions with geographic coverage or approaches. Similarly, various donor and nongovernmental actors carried out teacher in-service training programs and/or developed and disseminated teaching and learning materials for basic education but did so in isolation from each other. Cf. Box 4.2, Finding 12. Sources: WB Implementation Status Reports for the REDiSL project, MTR 2017, and consultations with donors and CSO actors.
Box 3.6: Before the Ebola crisis, the Ministry did not pay much attention to NGOs and civil society organizations (CSOs). This changed because some staff joined the Ministry who had previously worked in NGOs. Also, during the Ebola crisis the Ministry recognized the importance and value of working with all kinds of development partners. (International NGO representative)
Box 3.7: Technical working groups during EVD crisis During the EVD crisis, regular meetings of the EDP were complemented by issue-specific working groups. MEST as well as EDP members expressed great satisfaction with this arrangement, which allowed for closer technical collaboration and coordination than the large group. Following a recommendation from the 2017 MTR, MEST plans to reinstate the working group structure under the 2018-2020 ESP. Also, as discussed in section 4, the creation of a partner coordination function within MEST during the period under review is hoped to increase the Ministry’s ability to push for even greater coordination and collaboration among different sector partners.

20 FINAL REPORT - SIERRA LEONE
© UNIVERSALIA
Has sector monitoring changed during the 2014-2017 period? 70
Finding 4: The two education sector reviews conducted during 2014-2017 constituted progress towards the aim of ensuring mutual accountability for sector progress. Both processes had weaknesses, however, and only the 2017 sector review visibly influenced subsequent decision-making by informing the development of the 2018-2020 ESP.
50. A 2017 GPE study71 notes that while the main responsibility for improved education outcomes lies with the government, development partners are accountable for the provision of financial and technical support, and CSOs for providing a constructive challenging function. It notes that in this context, joint education sector reviews (JSR) – if effective – can serve as vehicles that create space for key stakeholder groups to coordinate and assess their efficacy in fulfilling their respective roles. In Sierra Leone, Education Sector Reviews (ESR) carried out during the review period partially fulfilled this role.
51. During the period covered by the ESP 2014-2018, MEST organized two ESRs.72 While the Ebola virus outbreak prevented a review in 2014, MEST was able to organize one in 2015. In 2017, it conducted a combined ESR and Mid-Term Review of the Education Sector Plan 2014-2017.
52. Key strengths and weaknesses of the two reviews based on information deriving from document review and stakeholder consultations are summarized below.73
Both ESRs were participatory and inclusive, albeit with room for improvement. Both the 2015 and the 2017 review processes involved consultations with representatives from central and local education authorities, the Ministry of Finance, donors and civil society, including from organizations representing those with disabilities. The 2017 review lacked representatives of parent teacher associations and for-profit private education providers. Both reviews included initial data collection and compilation through MEST and workshops with stakeholders to present and discuss issues and emerging findings. These workshops permitted active stakeholder participation and discussion, which informed the recommendations deriving from the respective processes.
Both ESRs were evidence-based but faced challenges due to gaps in available monitorable sector data. Especially during the 2015 ESR, data shared with sector stakeholders was limited to some figures on enrollment and results of a 2014 Early Grades Reading Assessment (EGRA), which provided only a partial picture of progress and often lacked precision. The lack of available data was partly due to the timing of the sector review, which had not been well aligned with other sector activities and meant, for example, that data entry for education census had not yet been
70 Evaluation question CEQ 2.2. 71 GPE: Effective Joint Sector Reviews as (Mutual) Accountability Platforms. June 2017. Available at: https://www.globalpartnership.org/content/key-takeaways-effective-joint-sector-reviews-mutual-accountability-platforms. 72 Under the previous ESP, three reviews were held, namely in 2008, 2009 and 2011. 73 Documents reviewed include sector review reports/memoranda, and Sierra Leone country lead back-to-office reports, as well as GPE Secretariat data on GPE results framework indicator 18 (only available for the 2015 ESR). The dimensions used to describe strengths and weaknesses are the same used by the Secretariat (2016) to assess JSR quality (Participatory and inclusive, evidence-based, comprehensive, monitorable, policymaking instrument).

FINAL REPORT - SIERRA LEONE 21
© UNIVERSALIA
completed at the time. The 2017 ESR could draw upon somewhat more complete evidence provided by the comprehensive Mid-Term Review report on the ESP, including some data on education expenditures and international aid commitments and actual funding for education.
While both ESRs covered all education sub-sectors, they were not fully comprehensive. The stakeholder workshops organized by MEST for both the 2015 and the 2017 sector reviews were structured based on the objectives of the 2014-2018 ESP, which meant that issues such as school feeding, which had been introduced under the Presidential Recovery Plan (PRP) but were not included in the ESP, were not subject to a transparent and evidence-based review. Also, neither process included a detailed analysis of, or comparisons between, internally and externally funded activities or programs, and/or of relevant initiatives that were off the ESP budget, off sector plan, or both.
The 2015 ESR had no detectable influence on decision making. Findings and recommendations from the 2017 sector review informed the development of the 2018-2020 ESP, but it is difficult to say to what extent. The 2015 ESR resulted in 30 recommendations developed and agreed upon by stakeholders during the workshop. These did not, however, include reflections on the continued relevance of ESP objectives in light of the 2016-2017 Presidential Recovery Plan. See Box 3.8. It remained unclear if, how, when, and by whom the large number of recommendations would be implemented.74
The potential influence of both the 2015 and the 2017 ESRs on policy/decision making was limited by the fact that their timing was not suited to inform the governments’ budget process.75 In 2017, the final MTR report, reflecting input from the ESR stakeholder workshop, formulated more than 40 new recommendations, which were structured into different thematic areas, but were not prioritized and varied in the extent to which they constituted specific remedial actions. The new ESP for 2018-2020 (p.11) notes that findings from the review together with key recommendations from the national workshop were among the factors guiding the drafting of the ESP. However, the ESP refers to specific recommendations deriving from the MTR/ESR only in relation to education sector resource mobilization, while it remains implicit which other recommendations have been
74 As a consequence, the 2017 ESR did not assess, and did not comment on the extent to which recommendations from the 2015 ESR had been addressed. 75 For example, for the 2017 ESR, the related stakeholder workshop was conducted in April, while the government’s fiscal year ends in December. As such, recommendations deriving from the review could not inform budgeting for the ongoing fiscal year and were already somewhat outdated when planning for the following year took place.
Box 3.8. School Feeding – an example of inconsistent sector planning
School feeding was mentioned in the 2007-2015 ESP, although without commitment to introduce it nationwide. It was not included in the ESP 2014-2018, without a clear (evidence-driven) explanation for its absence. However, school feeding re-emerged on the agenda in November 2015, when a series of MEST Director workshops identified it as an education priority for the 2016-2017 PRP. Although the summary of these workshops was presented one month later at the ESR 2015, there are no records of extensive ESR discussions about the issue. The intervention subsequently faced significant challenges, missing its overall PRP targets and having since been terminated for lack of funding, including from donors. School feeding has since been integrated into the ESP 2018-2020, despite not having been reviewed in depth in the ESR 2017.

22 FINAL REPORT - SIERRA LEONE
© UNIVERSALIA
incorporated and how. This will make it difficult in future sector reviews to systematically track whether past recommendations have been addressed.76
Did GPE contribute to observed changes in sector dialogue and monitoring? How? 77
Finding 5: GPE funding requirements have provided the main incentive for establishing systematic and increasingly inclusive and evidence-based sector dialogue and joint monitoring in Sierra Leone.
53. Evidence deriving from document review and stakeholder consultations indicates that GPE has given a constructive ‘push’ to establishing, maintaining and - although areas for improvement remain - strengthening education sector dialogue and monitoring in Sierra Leone during the period under review. In particular, GPE has:
Provided an incentive for dialogue: The creation of the Education Development Partners group in 2007 derived from the need to have the country’s first ESP (2007-2015) endorsed by education stakeholders to be eligible for GPE (then FTI) funding. Similarly, GPE grant requirements ask the government to conduct and share the results of regular sector reviews with key stakeholders on a regular basis. Also, most donor stakeholders as well as MEST representatives noted that the collaborative nature of the ESPIG application process (led by MEST, the GA and the CA) has provided further opportunities for collaboration and exchange between actors.78
76 ESP 2018-2020, p.113. 77 Evaluation question CEQ 2.3. 78 GPE ESPIGs are unique in that they are the only donor grant designed in a semi-collaborative way by Local Education Group stakeholders (principally, the grant agent, the Ministry, and major donor partners, with comments and quality-assurance from the Secretariat). Although stakeholders expressed mixed views of the application process and of GPE’s role in it (see box 3.14 in section 3.4), most agreed that the collaborative design was a positive feature that fostered dialogue and alignment.

FINAL REPORT - SIERRA LEONE 23
© UNIVERSALIA
Provided resources for monitoring: Both the 2015 and the 2017 education sector reviews were co-funded with resources out of the ESPIG 2014-2017. Similarly, ESPIG funds (through the REDiSL project) were used to fund a partner coordination desk within MEST, as well as an M&E unit (both discussed in section 4).80 Furthermore, for the past six years the Education For All Sierra Leone coalition has obtained annual grants through GPE’s CSEF. This has allowed the coalition to monitor government commitments related to domestic financing for education (see section 3.4 on sector financing), and actively contribute to dialogue around reopening schools after the Ebola crisis.81
Advocated for civil society: Consulted CSO representatives credited ongoing advocacy from the Secretariat at board meetings, from the Sierra Leone country lead during country visits, and from UNICEF as the coordinating agency for contributing to a positive shift in the Ministry’s willingness to engage with them. This was also confirmed by MEST itself (see Box 3.9). For some time, an EFA-SL representative served as an alternate on the Board, providing the coalition with opportunities to learn and network and to promote its positions.
Provided technical assistance and shared knowledge from other GPE partner countries: The Sierra Leone country lead has advised MEST and education sector partners on the implications of GPE grant application timelines for the content and timing of
79 Two national stakeholders (from MEST and one CSO) mentioned the value of GPE Board meetings and/or global conferences, both as a forum to be seen and heard, and as a place to learn about GPE’s operating model and key messages, including for example the target of 20% for domestic education funding. One consulted donor noted GPE’s value as the only global forum to discuss, and fundraise for, education. 80 MEST stakeholders and REDiSL documents attribute M&E unit funding to REDiSL funding, but the MTR 2017 cites DFID support. It is likely that there were elements of co-funding, as DFID supported the related ‘Situation Room’. 81 EFA-SL tabled four written submissions to the School Reopening Committee: i) National Consultative proposal on school reopening, ii) Guideline on school reopening protocol, iii) a Joint Education Sector Assessment Key informant interview tool, and; iv) a Proposal for the national assessment of schools. The guideline on school reopening was accepted by the task force on school reopening. Submissions ii and iv were accepted. Source: Global Campaign for Education (2015): CSEF 2013 – 2015 Progress Report to UNESCO for the period 01 July to 31 December 2014, p.22. 82 The exception to this were some NGO stakeholders (especially national civil society), who saw GPE as a strong advocate of their sector involvement and expressed a preference for more GPE presence in country.
Box 3.9. GPE advocacy for the inclusion of Civil Society
The biggest support they [GPE] have given us is that CSOs are represented in bigger structures, like the EDP or GPE board meetings. (Civil society representative)79
We later realized that two key partners were missing that GPE told us we needed: the [teachers] union and the civil society. (MEST representative)
Box 3.10. Perceptions of the nature of GPE’s in-country ‘presence’
All consulted in-country stakeholders referred to GPE as a donor, albeit as one that, different from other bilateral and multilateral agencies, does not have permanent country presence but operates through the grant agent and coordinating agency. In general, stakeholders broadly supported this model and did not express a desire for a permanent/increased GPE country presence.82

24 FINAL REPORT - SIERRA LEONE
© UNIVERSALIA
education sector reviews.83 Several non-government organizations that are members of the EDP credited the country lead for the suggestion to organize separate CSO/NGO coordination meetings to align inputs prior to larger EDP meetings. To date, three such meetings have taken place, and it is too early to assess if and how they are strengthening CSO/NGO voice or contributions to the EDP. See also Box 3.10.
54. There was no evidence that the quality of GPE’s support evolved significantly over time (positively or negatively), although one donor noted that different Secretariat country leads had different personal styles in their communications.
Validity of assumptions 55. Available evidence suggests that, in Sierra Leone, GPE had sufficient leverage to positively influence LEG existence and functioning, and that country-level stakeholders (including due to GPE financial support) had the opportunities, including resources, to work together to solve education sector issues. These issues constituted two underlying assumptions in the GPE country-level ToC related to sector dialogue and monitoring (see Appendix VII). Two other assumptions that held true to a more limited extent in Sierra Leone are related to country-level stakeholders’ knowledge and skills for sector dialogue and monitoring (given noted weaknesses in Joint Sector Reviews) and to country-level stakeholders’ motivation, including political will, to work together (given the limited extent to which sector dialogue has led development partners to actively pursue synergies between their respective efforts).
Additional factors and unintended effects 56. While the evaluation found positive evidence of GPE contributions, information deriving from stakeholder consultations and document review also indicates that the capacity of in-country stakeholders for engaging in effective sector dialogue and joint sector monitoring has also been influenced by several other factors beyond GPE’s direct influence. These are shown in Table 3.2.
83 One donor stakeholder and MEST representatives noted that the decision to combine the ESR and the MTR of the 2014-2017 ESP into one exercise had been inspired by the Secretariat country lead sharing positive lessons learned from using a similar approach in Cambodia.

FINAL REPORT - SIERRA LEONE 25
© UNIVERSALIA
Table 3.2 Additional factors positively or negatively affecting sector dialogue and monitoring
SUPPORTIVE/POSITIVE FACTORS CHALLENGING/NEGATIVE FACTORS
• The Ebola crisis rallied partners around a common cause and led to the establishment of weekly meetings between PRP working groups under the Ministry’s Inclusive Management Team. These measures intensified dialogue and coordination among key actors.84
• Sustainable Development Goal Four (on education) was cited by one donor as contributing to generally increased alignment between all partners. However, no concrete examples were available with regard to how this has influenced work in Sierra Leone to date.85
• The Ebola outbreak diverted attention away from implementing the 2014-2018 ESP and from jointly supporting and monitoring related progress.86
• Political considerations affect the behavior of governments (bilateral donors and host country alike) and sometimes reduce their ability to find common ground and/or base decisions on actual evidence.87
• The absence of a pooled funding mechanism in Sierra Leone was cited by two donors as a barrier to increasing coordination.
57. The evaluation found no evidence of unintended, positive or negative, effects of GPE support to sector dialogue and monitoring during the period under review.
84 The 2018-2020 ESP promises to carry some of these practices forward, which had lost momentum after the end of the Ebola crisis. 85 The SDGs are, however, mentioned as an important reference point in the new ESP 2018-2020. 86 Donors differed in their assessment of whether the existence of the Presidential Recovery Plan meant that the 2014-2018 ESP remained relevant (view supported by most consulted donors) or not (view expressed by one donor agency). 87 Some stakeholders suggested as an example of this the introduction of school feeding as a government priority under the PRP, and its inclusion in the 2018-2020 ESP, even though the existing school feeding program had not been subject to a transparent and evidence-based sector review or other country- and program-specific research (see Box 3.9 above). MEST, however, justifies the selection of school feeding as a priority based on a rigorous prioritization process (led by MEST Directors) and local consultations with chiefs.

26 FINAL REPORT - SIERRA LEONE
© UNIVERSALIA
3.4 Education sector financing 88
How has education sector financing changed during the review period (2014-2017)?
Finding 6: The twin Ebola and iron ore crises negatively weighed on sector financing in the first half of the review period, relative to both historical trends and sector plan funding expectations. Donor funding and absolute levels of domestic funding recovered after 2016, as both donors and the government committed to investing more in the education sector.
88 This section addresses evaluation question CEQ 1.4 (How has GPE contributed to leveraging additional education sector financing and improving the quality of financing?) and CEQ 3 (What factors other than GPE support can explain observed changes (or lack thereof) in sector plan development, plan implementation, sector dialogue and monitoring?).
Box 3.11: Assessment of Contribution Claim C.
Claim: “GPE advocacy and funding requirements contribute to more and better financing for education in the country.”
Assessment: The evaluation found that available evidence partly supports the GPE contribution claim related to strengthening more and better domestic financing, and partly supports the GPE contribution claim to more and better international financing.
Assessment is based on: (a) Overall financing trends for the education sector in Sierra Leone worsened during the Ebola crisis (2014-2016) and recovered starting in 2016 to levels higher than before the review period; (b) available evidence indicates that the likelihood of the two assumptions underlying the contribution claim hold true in the Sierra Leone context is weak for one, and moderate for the other (see Appendix VII); (c) the Ebola crisis as well as Sierra Leone’s overall economic situation constituted significant (external) factors that are likely to have affected the amounts and quality of international and domestic sector financing.
This overall assessment is discussed in the following findings.
Please see Appendix VIII for a visual representation of evaluation findings on GPE contributions to sector financing.

FINAL REPORT - SIERRA LEONE 27
© UNIVERSALIA
58. The education sector in Sierra Leone has historically faced severe financing constraints, starting with low overall funding. Although total domestic education financing almost doubled in real terms between 2008 and 2014 (from US$77.27 million to US$142.41 million89), the total budget per primary student at the beginning of the review period remained equivalent to only roughly US$45/year.90 Stakeholders emphasized that the issue of low total funding is accentuated by late disbursements (schools receive funds with substantial delays),91 and low coverage (many teachers at government schools are not on the payroll,92 and 54 percent of schools (4,777 out of 8,907) are not government-approved or -supported).93
59. Data from the UNESCO Institute for Statistics (UIS) show that in the run-up to the beginning of the review period in 2014, education sector financing in Sierra Leone had been (a) on a rising trend in terms of domestic financing in total and per student, buoyed by strong double-digit economic growth (see paragraph above); and (b) on a stable trend in terms of the share of public sector spending allocated to education, fluctuating around a share of 15 percent. OECD data further shows that Sierra Leone had been (c) on a stable trend in terms of donor education financing: between 2007 and 2013 (inclusive), ODA for education was, on average, US$18.3 million/year (constant 2016 US$), with modest fluctuations of, on average, no more than US$2.1 million difference to the previous year. In 2014-15, the country was hit by the twin crises of Ebola and a collapse in the price of iron ore (a key export commodity), which led to significant drops in its GDP, and a reversal or worsening of all three education financing trends mentioned above. The next paragraphs elaborate on the details.
60. At its design, the ESP 2014-2018 anticipated a funding gap of approximately 15 percent (US$87 million) for 2014-2016, relative to its overall budget for that period (US$571 million). However, the 2017 MTR shows that by 2016, the gap had more than doubled to 33 percent (US$190 million). Figure 3.1 illustrates that this additional shortfall is due to a 75 percent (US$105 million) shortfall in planned donor spending.94 In contrast, domestic education finance was ring-fenced during Ebola: by 2016, government spending slightly exceeded its planned ESP spending for the period in nominal terms.
89 UIS data, government expenditure on education in constant US$. 90 UIS data, 2013 data (2014 not available), constant 2016 dollars. This can be compared to two benchmarks: • Relative to need: GPE estimates that the annual cost per child per year is US$457 in a developing country in
2012 dollars. See https://www.globalpartnership.org/funding/education-costs-per-child, retrieved March 28, 2017. This equals 478 US$ in 2016 dollars, or over 10 times the amount available in Sierra Leone.
• Relative to neighbours: adjusted for purchasing power parity, Sierra Leone had a 2013 primary budget per student of US$106. This is lower than any of the following other countries to be reviewed for this evaluation: Burkina Faso, $272 (2015); Côte d’Ivoire, $464 (2015 estimate); Liberia, no data; Gambia, $166 (2013).
91 ESP 2018-2020, p.83, “quality assurance” section under theme 3. The document repeatedly mentions delays but does not specify their duration. One donor noted that school fees were occasionally paid to schools as much as a year after the corresponding school year started. 92 This was highlighted by MEST stakeholders, who explained that due to the government-wide hiring moratorium some teachers in government schools could not be put on the payroll and depended on community stipends or on unofficial fees. The magnitude of this phenomenon was not precisely quantified by stakeholders or documents. 93 Annual School Census 2016, section 1.1.2., “approval status of schools.” 94 There are several limitations with MTR data on donor funding. First, the data are not disaggregated by source and it is therefore not very clear what is/what is not counted. Secondly, many donors re-allocated funds to humanitarian activities and ODA reached historical highs in Sierra Leone in 2014-2016 (source: OECD); but the MTR does not account for humanitarian/Ebola-related funds that supported education-related recovery activities, because disaggregated data on Ebola funding was not available and because these funds were not channeled

28 FINAL REPORT - SIERRA LEONE
© UNIVERSALIA
Figure 3.1 The 2014-2018 ESP funding gap was larger than expected as donors gave less than planned
61. Despite the government’s nominal ring-fencing of education spending under Ebola, the significant depreciation of the Leone (cf. MTR 2017) resulted in a spending drop in real terms between 2014 and 2016. Domestic funding fell by eight percent in absolute terms (from US$142 million in 2014 to US$132 in 2016), and by 23 percent per primary student, to as little as US$33.95 Data past 2016 were not available as of writing, but the ESP 2018-2020 (p.125) forecasts an almost 50 percent increase in total education budget between 2016 and 2018 (from 0.67 trillion Leone to 0.97 trillion Leone, nominal terms), supported principally by the expected recovery in economic growth. Similarly, the country’s 2018-2020 budget profile forecasts another 32 percent increase in the absolute amounts of total education expenditures (from 0.97 trillion to 1.28 trillion Leone, nominal terms). See Figure 3.2.
through the Ministry of Education. Third, the MTR overestimates the 2014-2016 donor shortfall because it compares actual donor support for 2014-2016 to expected support for the whole 2014-2018 period – i.e., the denominator is too large. Nonetheless, the MTR is right in its overall observation that direct donor support to the ESP in 2014-2016 fell far short of initial plans. Of note, this is a distinct observation from saying that it was either appropriate or inappropriate for donors to reallocate money in this manner (a matter of judgement not adjudicated here). 95 All UIS data, 2016 constant dollars. The larger fall in per student than in total funding is likely due to the falling budget share of primary education (UIS data, 2012-2016), as well as the increasing school population over the period, as population continued to grow, and as school closure prevented existing primary students from completing the cycle. It is also worth noting that the ESP 2018-2020 (figure 6.3, p.125) notes an eight percent increase in total public education expenditures in Leone over the same period (2014-2016). Given inflation and the severe depreciation of the Leone in those two years (noted in the MTR 2017), this corresponds to a declining budget in constant US$ terms, like in the UIS data.
0
100
200
300
400
500
600
Planned for 2014-2016 Disbursed in 2014-2016
$US
mill
ioni
s
Funding gap
Donor funding
Government funding
Source: Calculations based on MTR 2017. Million USD, nominal.

FINAL REPORT - SIERRA LEONE 29
© UNIVERSALIA
0.670.77
0.97
1.15
1.28
0
0.2
0.4
0.6
0.8
1
1.2
1.4
2016 2017 2018 2019 2020Source: ESP 2018-2020, p.125 and MoFED 2016-2020 budget profile.
Figure 3.2 Total Education Budget, in trillion Leones (nominal)
62. Like the total education budget, the share of total public expenditures allocated to the education sector fell between 2014 and 2016 from 18 to 17.3 percent.96 Beyond 2016, the Ministry of Finance and Economic Development (MoFED)’s budget profile projects education’s share of total expenditures (excluding debt service) to remain stable between 2018 and 2020, at around 15 percent of total expenditures,97 and 25 percent of recurrent expenditures.98,99 This results from the facts that,
based on these same MoFED projections, (a) education’s share of total salary expenditures will remain stable (at around 29 percent); (b) education’s share of total non-salary non-interest recurrent expenditures will remain stable, at around 20 percent; and (c) education’s share of the domestic capital
96 GPE indicator 10 data. Both UIS and ESP 2018-2020 data (figure 6.2) also register a decrease in education’s share of total public expenditures between 2014 and 2016 (UIS: from 15 to 12.47 percent, ESP data?). Differences in point estimates for this indicator between UIS, ESP and GPE data are due to the fact that UIS and ESP data include debt service in its calculation of total public expenditure, and GPE data does not. 97 Thes15 percent for 2018-2020 cannot be directly compared to the 17.3 percent for 2016, as these two figures are based on different sources and methodologies. Neither MoFED nor GPE data provide information on 2017. 98 In seeming contrast to this paragraph, the ESP 2018-2020 (figure 6.4, p.126) projects that education’s share of the total domestic budget will decline, from 15 percent in 2016 to as low as 12 percent by 2020. The ESP’s projected trend is parallel for education’s share of recurrent expenditures, from 24 percent in 2016 to 20 percent in 2020. The explanation for this projected decline is that the ESP’s figures include debt service, particularly interest payments, in the calculation of total public expenditures. The MoFED’s budget profile shows that nominal interest payments are projected to rise six-fold from 2016 to 2020 (from 0.2 trillion Leone to 1.3 trillion Leone), and to amount to three percent of GDP by 2020. This rapid increase in interest payments, which partly drives the growth in total public expenditures, depresses education’s share of total spending (including debt service). Because interest payments are, in MoFED data, coded as recurrent payments, their growth also depresses education’s share of total recurrent spending. 99 Of note, both this MoFED data and the ESP 2018-2020 figure 6.4 indicate that Sierra Leone throughout the period continued to meet the GPE target of allocating at least 20 percent of recurrent government expenditures to recurrent education spending. This target was in place when GPE provided ESPIG funds to Sierra Leone in 2014. In contrast, Sierra Leone does not meet the current GPE target of allocating 20 percent of total government expenditures to total education spending, or of increasing allocations towards the 20 percent mark. Whilst this target had not so far formally applied to the country, it will become relevant if the 2018 application for a new ESPIG is approved.

30 FINAL REPORT - SIERRA LEONE
© UNIVERSALIA
development budget remains small and will shrink further between 2018 and 2020, from 0.5 percent to 0.35 percent. These trends are illustrated in Figure 3.3.100
Figure 3.3 MoFED budget projections predict broad stability – but no increase - in education’s share of various government expenditure categories for 2018-2020.
Source: Calculations based on MoFED 2016-2020 budget profile (projections), annexes 1, 3a, 4, and 5a.101
63. Growth in the education budget in the period under review (2014-2017) was constrained by a freezing of the government-wide nominal wage bill for 2017 (and caps on the wage bill’s growth in subsequent years). This freeze was introduced following negotiations between the government and the International Monetary Fund (IMF) in 2016, in response to Sierra Leone’s deteriorating fiscal situation.102 MEST and civil society stakeholders noted that this freeze, which resulted in a government-wide hiring moratorium, limits the hiring of additional teachers even in the face of growing enrollment. Since teacher wages take up over 75 percent of recurrent education spending (primary, JSS and SSS, cf. ESP
100 The ESP 2018-2020 does not report budget data by sub-sector. UIS data up to 2016 show that primary school’s share of the education budget has been falling since 2016. However, primary education was substantially ring-fenced under Ebola. Whereas only 42 percent of the 2014-2018 ESP budget for 2014-2016 (US$244 million) was allocated to primary education, 60 percent of actual ESP expenditures (US$231.3 million) went to the sub-sector, as 95 percent of planned primary education spending (i.e., US$231.30 million out of US$243.95 million) was disbursed. Only higher education had a comparable execution rate, at 93 percent of planned funds (US$81.084 million out of US$86.833 million). The biggest shortfall was in secondary education, where less than nine percent of planned funds (US$13.069 million relative to US$146.339 million planned) were available (data are not disaggregated between junior and senior secondary). The trend of basic education funding for 2014-2016 is thus mixed, with higher-than-expected support to primary, and less for junior secondary (source for this footnote: MTR 2017, section 1.5). 101 Available at http://mofed.gov.sl/ 102 See the IMF’s Country Report No. 16/236, at https://www.imf.org/external/pubs/ft/scr/2016/cr16236.pdf.
28.6%
20.6%
25.5%
0.5%
15.5%
28.6%
20.0%
24.6%
0.3%
14.8%
0.0%
5.0%
10.0%
15.0%
20.0%
25.0%
30.0%
35.0%
Share of SalarySpending
Share of Non-SalaryNon-Interest
Recurrent Spending
Share of TotalRecurrent Spending
(excluding debt)
Share of DomesticInvestmentProgramme
Spending
Share of TotalSpending (excluding
debt)
2018 2019 2020

FINAL REPORT - SIERRA LEONE 31
© UNIVERSALIA
2018-2020, p.126), and since recurrent education expenditure is upwards of 95 percent of total education expenditures, the freeze in the wage bill limited the scope for growth in overall education expenditures at the end of the review period.103 Moreover, the moratorium prevents the Ministry from filling its own vacancies, which has affected its human resources capacities and thus its ability to use available resources effectively: two stakeholders (one MEST, one donor) noted that the Ministry has had to return donor or domestic funding because it has not had the capacity to manage and disburse it.
64. As noted in this evaluation’s review of the ESP funding gap and as confirmed by OECD data, education-specific ODA, and with it, ODA specific to primary education, fell dramatically between 2014 and 2016 as donors redirected education funding to humanitarian assistance. ODA for education recovered and exceeded pre-crisis levels after 2016, as donors transitioned back from humanitarian to development assistance, and several donors made education in general, and basic education in particular, one of their strategic priorities in Sierra Leone (e.g., DFID, EU).104 Based on the largest projects alone, listed in Table 3.3, support for basic education is projected to reach close to US$35 million/year in 2018/2019, compared to around US$20 million/year on average in 2011-2015. Nonetheless, the next ESP 2018-2020 is projected to face a 17 percent funding gap (US$90 million), counting existing government and donor commitments.
Table 3.3 Overview of major donor projects supporting education in Sierra Leone, 2016-2021105
DONOR PER YEAR (US$) FOCUS 2015 2016 2017 2018 2019 2020 2021 2022
DFID $14.8 million (2016-21)
Junior Secondary
$88.6m
EU $6 million (2016-21) Primary
$36.0m
GPE $5.7 million (2018-20)
Primary & ECD
(ESPIG 2014-17) $17.2m (to be approved)
CRS $4.5 million (2016-19)
School Feeding
$18.2m
World Bank Group
$3.3 million (2017-19)
Primary & ECD
$10.0m
65. Looking ahead, the short-term education finance situation is expected to be stable until 2020. Donor funding to this date is assured, and domestic funding for education will continue to grow in
103 Starting in 2018, the wage bill in all sectors – including education – is projected to moderately grow again in nominal terms, and to remain broadly stable as a share of the overall wage bill, at around 29% (cf. MoFED budget profile, Annex 5a; see also Figure 3.3 in this report). 104 However, the Japanese International Cooperation Agency did not resume its pre-Ebola support to the education sector after the epidemic, and had effectively exited the education sector in Sierra Leone by 2018. 105 Source: DFID, "Sierra Leone Business Case", 2016. EU: https://eeas.europa.eu/headquarters/headquarters-homepage/22784/government-and-european-union-launch-eu29-million-education-sector-programme_en; the program has been extended until 2021; GPE: “Grant agreement”, 2014 and “Application form for ESPIG”, 2017; CRS: http://allafrica.com/stories/201605200774.html; World Bank, http://projects.worldbank.org/P163161?lang=en. All websites accessed March 31, 2018. All currencies converted to $US at March 31, 2018 exchange rates.

32 FINAL REPORT - SIERRA LEONE
© UNIVERSALIA
absolute amounts – albeit not as a share of public expenditures – with the country’s return to economic growth.
66. Despite this recovery since Ebola, the ODA outlook remains uncertain over the medium-term. There is at this stage no confirmed funding after 2021 and stakeholders did not identify new, non-traditional or innovative donors on the horizon. Existing donors were not able to say whether their current levels of investment to education would be maintained, and some may shift their attention. One donor also recently re-allocated some funds initially allocated to education to another sector given performance issues in education. 106
How has GPE contributed to leveraging additional education sector financing and improving the quality of financing?
Finding 7: GPE has contributed to advocacy for increased domestic education financing but has had no detectable impact during the review period on the amount of domestic education financing, positive or negative, total or by sub-sector.
67. One of GPE’s objectives is for countries to invest 20 percent of domestic resources into education, or show progress toward that threshold. In Sierra Leone, GPE works to support the achievement of this objective through three mechanisms, briefly reviewed below.
ESPIG funding requirement: To apply for an ESPIG, countries must submit a letter of commitment to education finance. A copy of said letter, signed by the ministers of education and of finance and supporting the application for a next ESPIG grant, was available to the evaluation team. It indicates a general intention to try to increase the allocation for education without presenting concrete steps, amounts, or timelines to do so, and does not mention the 20 percent goal.107
GPE Secretariat advocacy: Almost all stakeholders interviewed were aware of the 20 percent target and its connection to GPE. Many mentioned that they had witnessed GPE advocacy for the target, either during Country Lead visits or at Board meetings. Although there is no evidence that this has influenced action in Sierra Leone, GPE has succeeded in disseminating the message.
CSEF grant to the EFA-SL coalition for sector monitoring: The Education for All-Sierra Leone civil society coalition monitors and reports on the government’s implementation of its GPE and education commitments. It has been supported in recent years by an annual CSEF grant funded by GPE (CSEF II in 2013-2015 and CSEF III in 2016-2018). In this time, it produced financial analyses of the education budget and worked with the parliamentary committee on education to strengthen
106 Some donors suggested that the gap may rise and highlighted ‘costing’ as one of the ESP’s weaknesses. For instance, the ESP is not explicit about how it hopes to fund strategic objective 2.2 (0 unapproved schools by 2020), when roughly half of the country’s schools are currently unapproved. School approval has financial implications (school subsidies, teacher salaries, etc.) that are likely to vastly outstrip the US$75,000 allocated to this objective. 107 Excerpts from the letters that regard finance read: “The Government of Sierra Leone gives very high priority to education. This is reflected in the percentage of the budget allocated to education annually which is amongst the highest for the different sectors. Even so, we are constantly searching for new ways to increase the allocation for education […] The cost of implementing the ESP is a little above what is currently available, and this means that there is a financing gap which we will try to fill as implementation proceeds.”

FINAL REPORT - SIERRA LEONE 33
© UNIVERSALIA
its capacities.108 However, the evaluation team was not able to find documented evidence of the degree to which EFA-SL’s monitoring and campaigning during the review period have influenced public awareness, decision-maker preferences, and intended or actual public funding for education.109
68. There is evidence that GPE’s multi-pronged approach – funding requirement, informal advocacy, and support to civil society – has contributed to keeping the 20 percent target and the issue of domestic financing on the agenda.110 However, there is no evidence that this has had a direct impact on allocations to education in Sierra Leone (to or towards the 20 percent target).111 One reason may be that the education budget is controlled by actors outside the education sector (e.g., Ministry of Finance, presidential priorities), who may be aware of the GPE target but also face competing priorities, including short-term crises (e.g., Ebola), and long-term budgetary pledges to other sectors (e.g., 15 percent to health and 10 percent to agricultural development, as per the Abuja Declaration and the Maputo Declaration respectively).
69. Conversely, there is also no evidence that GPE funding (two ESPIGs totaling US$30 million since 2008) has displaced domestic funding. Domestic education funding (constant 2016 US$, UIS data) grew more than twice as fast in the GPE period (by 70 percent from US$76.81 million in 2008 to US$142.41 million in 2014) than in the pre-GPE period (by 28 percent from US$59.89 million in 2001 to US$77.27million in 2007), and the government lived up to its education financing commitments in 2014-2016, including with regard to primary education (see finding 6).112
108 With regards to campaigning on domestic finance, EFA-SL has for instance written a submission to the LEG to call on the government to increase resources for education (cf. Global Campaign for Education, “The civil society education fund 2013 – 2015 progress report to UNESCO covering the period January-June”, 2014); advocated for an increase in the education budget line (cf. Global Campaign for Education, “The Success of the Civil Society Education Fund so far (2013-2015)”, 2016); and produced a 2015 report on “National Research Gaps on Education and Domestic Financing in Sierra Leone” calling for increased financing of education (cf. Global Campaign for Education “CSEF III 2016 Annual Report. ANNEX E”, 2016; this was not directly CSEF-funded but produced in the period of CSEF-funding). 109 Influencing funding amounts is not a stated CSEF objective (cf. goals of CSEF III, 2016-2018, http://www.campaignforeducation.org/en/csef). However, whereas in the years preceding the review period an evaluation concluded that EFA-SL had been successful in getting an increase in the education budget (García-Alba, A., “Sierra Leone CSEF Evaluation Report.”, 2012), no documented evidence for the review period at the outcome-level was found, be in terms of changed awareness or budgets (for reporting on outputs, see preceding footnote). 110 All stakeholders who mentioned the 20 percent target (including government, civil society, and donors) linked it explicitly to GPE. Awareness of the target pre-dated the review period but appears to have been strengthened during the period through visits by the Sierra Leone country lead, and GPE global events and board meetings. 111 Whilst it may be argued that strong awareness of the need to increase education funding may have contributed to ‘ring-fencing’ the education budget (in nominal Leone terms) during the EVD crisis, the inertia of funding during that period is likely due, in large part, to the high share of recurrent costs in the education budget (e.g., salaries), which continued to be paid despite school closure. Looking to the future, the 2016-2020 national budget profile indicates an intention to increase education’s share of recurrent (non-interest) expenditures. This may be linked to the government’s pledges to GPE that it aims to increase education financing, but the counterfactual is not known, and no stakeholder mentioned GPE as having directly influenced future domestic financing. 112 GPE support is directed at basic education and there were signs in 2012-2016 (UIS data) that the share of the education budget allocated to primary education was declining year-on-year (to the benefit of tertiary education). It is nonetheless unlikely that this is due to GPE. One donor suggested that GPE funds were too small to significantly displace domestic or other international funds (only US$3 million/year, i.e., 3 percent of the annual national

34 FINAL REPORT - SIERRA LEONE
© UNIVERSALIA
Government funds60%
REDiSL funds3%
Other ODA4%
Funding gap33%
Source: MTR 2017; GPE grant data.
Finding 8: During the period under review, GPE has modestly contributed to an increase in the amount of external sector financing.
70. During the period under review, GPE contributed modestly to increasing external sector financing, both directly and indirectly. In direct terms, GPE’s US$17.9 million ESPIG grant closed 5 percent of the ESP 2014-2018 funding gap once government funding has been considered. In indirect terms, the ESPIG attracted US$15.5 million in additional funding commitments from two other donors to support selected ESPIG activities: (a) US$5.5 million from DFID to co-fund the ESPIG at its inception,113 and (b) US$10 million from the World Bank to continue and extend the performance-based school grant of the ESPIG after 2017. This equates to almost 90 percent in additional funds, relative to the GPE commitment itself.114 In total, direct and indirect GPE funding amounted to 3 percent of the total 2014-2018 ESP budget (as originally planned), and 8 percent of the funding gap once government funding has been considered.
71. Although the total funds provided and leveraged by GPE are small relative to the overall ESP 2014-2018 budget, they were nonetheless significant during the Ebola crisis. As noted previously, there was little dedicated donor funding for the ESP during the crisis. As Figure 3.4 shows, REDiSL funds (GPE + DFID) constituted almost half of education ODA and the only significant source of donor funding for ESP-related activities in 2014-2016.
Figure 3.4 During the Ebola crisis (2014-2016), REDiSL funds were 3 percent of planned ESP spending but almost 50 percent of actual ESP ODA
72. In 2016, the EU and DFID started large education projects in primary and junior secondary education, respectively (see Table 3.2, Finding 6). Both projects are significantly larger than GPE’s last or next ESPIG. Since both projects support basic education, there is no evidence that GPE funds have displaced donor funding to basic education.115
education budget). More generally, as noted in finding 6, the government exceeded its targets for primary education funding in 2014-2016, at the same time as it was receiving its largest ESPIG to date. Government and civil society stakeholders explained the rising allocations to tertiary education with the need to subsidize tuition fees, with some disagreement between government stakeholders as to whether the amounts allocated to tertiary were too high or not. 113 DFID subsequently cancelled its co-funding, meaning only US$2.46 million were disbursed from their side. 114 Interviews further indicated that this funding was likely to be genuinely ‘additional’, i.e., it would not have been allocated to education if there had been no ESPIG grant. Unfortunately, the initial DFID co-funding commitment was not entirely realized. Due to negative ratings of the ESPIG’s early performance and to DFID-internal strategic shifts in response to the Ebola crisis, DFID only disbursed US$2.46 million of the promised US$5.5 million and re-purposed the rest. 115 One consulted donor agency whose priorities for providing education sector funding changed during the period under review indicated that their decision had not been influenced by the existence of GPE funding for basic

FINAL REPORT - SIERRA LEONE 35
© UNIVERSALIA
Finding 9: The evaluation found no detectable GPE influence on the quality of external education sector funding.
73. The quality of education ODA in Sierra Leone, measured both by the degree of donor harmonization between themselves, and by the degree of donor alignment with Government of Sierra Leone systems, remained low throughout the review period, 2014-2017.116
74. In terms of harmonization, GPE, DFID and later the World Bank co-financed REDiSL activities, which were managed by one grant agent, the World Bank. This contributed to some harmonization of donor activities at the beginning of the review period, and GPE Results Framework indicator 30 rates the 2014-2017 ESPIG as “co-financed” (as opposed to a single-donor project – i.e., the least harmonized modality – or a pooled fund model, i.e., the most harmonized modality under this indicator). However, DFID pulled out of REDiSL in the wake of the EVD crisis (see section 3.5), and initiated its own large education project, whose procedures were not harmonized with those of other donors. Further, there are no signs of improvements in harmonization, as the upcoming ESPIG grant, if approved, will not be co-financed by other actors. Similarly, throughout the period, there was no sector-wide pooled funding mechanism, nor did interviews reveal any plans to set one up.
75. The main barrier to increased harmonization is that the main donors use modalities with different degrees of alignment with country systems, as illustrated in Table 3.4. DFID as the largest education donor does not implement its education projects through government systems, which is a barrier to a pooled fund. Similarly, although some funds for REDiSL activities are channeled through the MEST, the ESPIG 2014-2017 met only one of GPE’s ten ‘alignment’ criteria for ESPIGs (GPE results framework 2017, indicator 29).117 In both DFID’s and GPE’s cases (the latter via the World Bank as its grant agent during the review period), the main reasons mentioned for non- (or very partial-) alignment with national systems are internal policies of donors/grant agents which prevent direct disbursements to governments facing capacity constraints in financial management.118
Table 3.4 Funding modalities used by key education sector donors in Sierra Leone (2016-2018)
KEY DONORS BUDGET SUPPORT
SECTOR SUPPORT
PROJECT SUPPORT
EU (primary) v v v
DFID (junior secondary) v
education and ECE, but by needs-based considerations. In this context one donor representative noted that GPE funding to Sierra Leone was “too small” to affect other donors’ investments. 116 See the “Terminology” section at the beginning of this report for definitions of harmonization and alignment. 117 The ESPIG was deemed to be aligned with the national ESP, but not aligned with standard budgetary, treasury, procurement, accounting, audit, or reporting modalities of the Government of Sierra Leone. 118 It is worth mentioning that at least one donor stakeholder questioned whether ‘more aligned’ modalities were always preferable in contexts such as Sierra Leone’s. The individual noted that in a context where the Ministry is only responsible for half of all schools, providing a GPE grant as budget support would also mean (or could mean) that it would only support those schools. Similarly, in a context where a high percentage of the education budget is spent on teacher salaries, budget support could mean that GPE funds would end up being used for that. However, most donor stakeholders also recognized the benefits of moving towards a more aligned system in the medium term.

36 FINAL REPORT - SIERRA LEONE
© UNIVERSALIA
KEY DONORS BUDGET SUPPORT
SECTOR SUPPORT
PROJECT SUPPORT
World Bank (general budget support, and basic education performance-based school grants) v v
GPE (via grant agent) v
Source: Same sources per donor as Table 3.3 (finding 6), complemented by clarifications obtained in interviews with the EU and the World Bank.
Validity of assumptions 76. The evaluation found that there is only moderate support for the underlying assumption that GPE had sufficient leverage to influence the amount of and the quality of domestic and international education sector financing. GPE had some leverage on the domestic funding agenda (but not directly on the level of domestic funding), some leverage to influence the amount of international funding by attracting co-financing (including from its grant agent), but not enough leverage to influence the quality of international funding. Further, there is weak support for the underlying assumption that external (contextual) factors were favorable and permitted national and international actors to increase/improve the quality of education sector financing.
Additional factors and unintended effects 77. Positive factors beyond GPE support that have influenced the observed characteristics of sector financing are the decision of other donors to invest substantially into Sierra Leone’s basic education sector starting in 2016, most prominently DFID and the EU.119
78. Negative factors beyond GPE support that have influenced the observed characteristics of sector financing are, first, the domestic economic downturn caused by the Ebola crisis and the decline of iron ore prices. This resulted in the government of Sierra Leone having to address many competing priorities in the face of limited overall funds, rising debt, an IMF-negotiated freezing of the nominal wage bill, and limited capacities to administer existing funds. Evolving donor priorities are a second negative factor. During the Ebola crisis donors’ support was redirected to emergency assistance. Even after the Ebola crisis, at least one donor indicated that increasing attention to issues such as the environment compete with allocations to education.
79. The evaluation did not find evidence of any unintended, positive or negative, effects of GPE financial and non-financial support to sector planning. In particular, the evaluation found no evidence that GPE crowded out either domestic or international financing from basic education. Key donor projects started in 2016 focused substantially on basic education (DFID and EU), and there are no signs that the government has reduced its spending on basic education in response to GPE funding.
119 The World Bank’s additional funding for REDiSL was also an ‘additional factor’, not directly related to GPE actions, but building on GPE-funded activities, and linked to the GPE operational model with the WB as GA in Sierra Leone.

FINAL REPORT - SIERRA LEONE 37
© UNIVERSALIA
3.5 Sector plan implementation120
Strengths and weaknesses of ESP 2014-2018 implementation
Finding 10: The implementation of the 2014-2018 Education Sector plan was severely affected by the 2014-2015 Ebola crisis.
80. Implementation of the 2014-2018 ESP was partial, indirect, and unsystematic, and most ESP strategic objectives were missed, either partially or entirely.122 Sections 4 and 5 of this report provide details on key achievements and gaps under the ESP’s three overarching objectives of Access, Equity and Completion; Quality and Relevance, and Systems Strengthening.
81. The following factors negatively affected ESP implementation:
120 This section addresses evaluation questions CEQ 1.2 (What have been strengths and weaknesses of sector plan implementation during the period under review?), 1.3 (How has GPE contributed to the observed characteristics of sector planning and sector plan implementation?) and CEQ 3 (What factors other than GPE support can explain observed changes (or lack thereof) in sector plan development, plan implementation, sector dialogue and monitoring?). 121 See sub-section on ‘validity of assumptions’ for a discussion of these assumptions. 122 Please see Appendix XII, which provides an overview of the extent to which progress towards key indicators for the ESP’s strategic objectives were on or off track. These indicators largely measure outcome/impact level results, however. Information on progress made in implementing each of the specific interventions described in the 2014-2018 ESP, which were intended to help achieve the strategic objectives, is scarce and incomplete. This is due to the fact that the ESP implementation plan only covered three out of the five years covered by the plan (2014-2016), and that the two ESRs conducted during the review period did not provide a summary of implementation at the level of specific initiatives/activities and related outputs.
Box 3.12: Assessment of Contribution Claim D.
Claim: “GPE (financial and non-financial) support and influence contribute to the effective and efficient implementation of sector plans.”
Assessment: The evaluation found that available evidence partially supports the GPE contribution claim related to strengthening education sector plan implementation.
Assessment is based on: (a) The 2014-2018 ESP has not been fully implemented, and for most of the review period the ESP did not function as the main guiding framework for the education sector; (b) Available evidence indicates that the likelihood of the assumptions underlying the contribution claim hold true in the Sierra Leone context is moderate for five and weak for one assumptions;121 (c) The Ebola crisis constituted a significant additional (external) factor that negatively influenced ESP implementation. An additional positive beyond GPE support was financial and technical assistance provided by other development partners. This overall assessment is discussed in the following paragraphs.
Please see Appendix VIII for a visual representation of evaluation findings on the contribution claim related to sector plan implementation.

38 FINAL REPORT - SIERRA LEONE
© UNIVERSALIA
The Ebola crisis in 2014-2015, which led to the closure of all schools124 for nine months (July 2014-April 2015), significantly affected the government’s and its partners’ ability to deliver on plans and by and large prevented the country from making any progress for most of the period.
During and following the Ebola crisis, the ESP was superseded by the 2016/2017 Presidential Recovery Plan (see Box 3.13). While nine out of the PRP’s ten short-term targets125 for education were the same or similar to initiatives planned under the ESP, this left 39 ESP initiatives (81%) that were not reflected in the PRP.126 Only two of the ten PRP priorities fully reached their targets.127
The shortfall in dedicated ESP and general education sector ODA, on top of ongoing overall constraints in education sector funding (see finding 6).128
123 Teachers “off the payroll” refers to the fact that in Sierra Leone many teachers work in government-approved schools, but are not actually paid by the government 124 Government-approved and -supported schools as well as non-approved schools. 125 With the exception of school feeding. 126 As is shown in Appendix IX, the ESP 2014-2018 had described a total of 48 initiatives detailing how each of its strategic objectives was to be achieved. 127 Namely those on developing lesson plans and on establishing a situation room. See the Table in Appendix X for an assessment of PRP alignment with the ESP, and of the level of achievement of various PRP objectives. 128 The MTR 2017 names several instances where targets were not met because of the lack of funds. E.g., p. 34: “Terms of Reference were drawn up for the National Assessment Policy Framework. However, on reassessment of funding for other priority needs by the authorities the activity was dropped.” p.41, “A competency framework for MEST staff is yet to be developed. Support for the work was planned using funding from a donor that was discontinued”; p.46, “Training on education budgetary processes was scheduled to take place using funds from a donor which failed to materialise”.
Box 3.13. The Presidential Recovery Priorities in Education
The Presidential Recovery Plan was a post-Ebola action plan for 2016/2017 to get the country back on the track of its “Agenda for Prosperity” (PRSP). Education was one of the plan’s seven “priority sectors”. The two “key result areas” for education were: (1) Improve learning outcomes by ensuring that 70 percent of schools have the right ratio of capable teachers to pupils (<1:49) (there were five priority initiatives under this key result area); and (2) Institute nationwide school feeding for 1.2 million children in all government and government-assisted primary schools (there was one priority initiative under this key result area.
The PRP identified 10 Key Performance Indicators (KPI) and related targets for education to be achieved by June 2017:
1 - Lesson plans for all core subjects and grades developed 2- 37,200 primary and 21,000 secondary teachers trained to use lesson plans 70 percent of all schools have a PQTR under 49:1 3 - 70 percent of all schools have a PQTR under 49:1 4 - Zero teachers in MEST schools off the payroll123 5 - 500 new schools approved 6 - Situation room strengthened and real-time monitoring capacity in all 14 districts 7 - 500 new classrooms built 8 - WASH facilities in 360 schools (754 wells and 1,340 latrines) 9 - Nationwide school feeding for 1.2 million children introduced 10 - All young mothers from Ebola period back to school

FINAL REPORT - SIERRA LEONE 39
© UNIVERSALIA
Severe human resource constraints at the Ministry of Education, both in terms of numbers of staff at the central ministry, as well as, in some cases, limitations in management capabilities.129
Macro-level, pan-governmental constraints such as the slow progress of the decentralization agenda in Sierra Leone, and a government-wide public sector hiring moratorium in 2017.
Weaknesses in sector planning and dialogue affected implementation. For the ESP, the lack of prioritization meant that the main deciding factor for whether progress would be made on an activity was not its strategic importance to the Ministry, country, or sector, but whether donor funding and technical support were available for it (see next finding). The PRP, while focusing on a smaller number of key priorities, was not designed in a participatory manner and not consistently grounded in evidence, as illustrated by the newly introduced emphasis on school feeding.130
82. Overall, these factors meant both that (a) ESP implementation was stalled as soon as it begun, and that (b) those priorities and activities that remained were, for the most part, realized only in part and with delays. Despite these considerable constraints, the sector did make progress during the 2014-2018 period. This is further described in finding 11 and in sections 4 and 5.
Has GPE contributed to ESP 2014-2018 implementation? How?
Finding 11: GPE’s financial and technical support contributed modestly to overall ESP implementation, and significantly to the progress made in some sub-sector areas, such as Early Childhood Education.
Contributions through GPE-funded grants 83. During the period under review, GPE financially supported Sierra Leone with an ESPIG of US$17.9 million, which was 100 percent of the Maximal Country Allocation (MCA) set by the Board (cf. BOD/2012/01, table 1). These funds – together with additional resources from DFID, the World Bank and the International Development Association (IDA) - supported the activities of the World Bank-managed Revitalizing Education Development in Sierra Leone (REDiSL) project.131 Although the ESPIG represented a high share of ODA during the Ebola crisis (2014-2016),132 it constituted only four percent of ESP-related
129 For example, at the time of the evaluation site visit (January 2018), the MEST desk for Early Childhood Education (ECE) was still unfilled after the death of the previous focal point, who had also been the Director for Higher Education. 130 Therefore, the school feeding program has, until now, received no considerable support from donor partners. 131 The total cost of the Revitalizing Education Development in Sierra Leone (REDiSL) was USD 31.31M. Related financing derived from the GPE ESPIG (USD 17.9M), a Multi-Donor Trust Fund (MTDF) funded through DFID, which had originally intended to contribute USD 5.5M, but revised this to USD 2.46M in the context of the Ebola crisis; a World Bank Ebola Recovery and Reconstruction Trust Fund (ERRTF with USD 0.05M, and additional financing of USD 10M from IDA. Source: World Bank (2018): Revitalizing Education Development in Sierra Leone (REDiSL) Project. Progress Update. Slide presentation. 132 As noted in finding 8, given the collapse of (officially recorded) donor ODA in 2014/15, the ESPIG represented almost 50 percent of education ODA, and 4 percent of total sector funding during Ebola (cf. MTR). Pre-Ebola, ESPIG funds had constituted closer to 15 percent of education ODA, a trend that recovered in 2016 as other donors returned to the education sector.

40 FINAL REPORT - SIERRA LEONE
© UNIVERSALIA
disbursements during 2014-2016, and only three percent of the total planned ESP budget 2014-2018 (see finding 8).133134
84. Implementation of the REDiSL project was initially delayed due to the Ebola crisis. The project underwent two rounds of restructuring: the first in January 2015 included adding a new component focusing on supporting the government’s Ebola response and re-allocating resources to this component; the second restructuring in February 2017 included extending the closing date for GPE and WB Ebola Recovery and Reconstruction Trust Fund (ERRTF) resources from February 2017 to December 2017, as well as cancellation of DFID funds of US$3.1 million which meant that several originally planned initiatives were stalled and then dropped;135 others were partly addressed by reallocating GPE funds. Despite the noted initial challenges, by January 2018 the project had completed most of its planned activities, albeit in some cases with a slightly modified (reduced) scope.136 GPE funds were utilized in line with the revised project schedule and on budget.137
85. The REDiSL project had the following four components. The majority of overall project funds (US$15.24 million out of US$21.3 million or 71 percent) were allocated to the first component, which was solely financed by GPE funds. This also meant that the vast majority of GPE ESPIG funds (US$15.24 million out of 17.9 million, or 85 percent), were allocated to this component.138
Improving the Learning Environment and Opportunities in Targeted Areas. This included four sub-components: (i) school grants; (ii) pre-primary education; (iii) strengthening reading outcomes at early grades; and (iv) improvements in teacher management (TSC).
133 The three percent includes DFID co-financing and the additional funding of $US10 million from IDA to continue select activities beyond the end of REDiSL. The four percent of contributions during 2014-2016 do not count the additional US$10 million of IDA financing since it had not been approved by then. 134 GPE’s results framework tracks the share of ESP textbooks provided, teachers trained, and classrooms built that were funded by the ESPIG. These were 0% of (planned/actual) textbooks, 20% of (planned/actual) teachers trained, 3% of classrooms planned, and 10% of classrooms built. See Appendix XIII. However, these numbers do not reflect REDiSL contributions related to producing and distributing teaching and learning materials described above. 135 For example, planned initiatives related to training of key MEST staff, expanding the EMIS to include TVET and non-formal education, and updating the MEST website. Source: World Bank (2018): Revitalizing Education Development in Sierra Leone (REDiSL) Project. Progress Update. Slide presentation. One of the reasons why DFID pulled out of the MDTF was that the agency did not perceive REDiSL to be sufficiently aligned with early recovery priorities. 136 The World Bank rated REDiSL “Progress towards achievement of the Project Development Objectives” as “Moderately Satisfactory” in 2017 and 2018, and similarly rated REDiSL “Overall Implementation Progress” as “Moderately Satisfactory” in 2017 and 2018. See Appendix XI, RF25. 137 World Bank: REDiSL Implementation Status and Results Report. January 2018. 138 The original ESPIG Grant Agreement had foreseen that 89% of GPE funds ($16m out of 17.9 m) would be allocated to this component. Actual amounts were changed in the 2017 project restructuring though. Sources: ESPIG grant agreement. World Bank. "Revitalizing Education Development in Sierra Leone (REDiSL) Project. Progress Update.: Slide presentation. Washington, D.C., March 2018. And summary of ESPIG restructuring January 2017.

FINAL REPORT - SIERRA LEONE 41
© UNIVERSALIA
Strengthen Education Service Delivery,139 including sub-components (i) building the foundation for better measurement of learning outcomes (learning assessment); (ii) robust consistent school data collection (school census); and (iii) develop a mechanism for better delivery on the ESP/ System for effective delivery on the Education Sector Strategy.
Project Management and Supervision
Ebola Strategic Response Plan, including the four sub-components (i) emergency radio and television program (ensuring learning is maintained; (ii) establishing safe and secure learning environment (providing safe and secure learning environments in preparation for children returning to schools; (iii) social mobilization; and (iv) monitoring of the ESRP.
86. The REDiSL project’s thematic objectives were not explicitly aligned with the three priority areas of the 2014-2018 ESPIG. (Access, Equity and Completion; Quality and Relevance; and System Strengthening). Nevertheless, the project’s first two objectives were relevant to all three priority areas and supported 11 of the specific objectives of these priorities as outlined in the ESP 2014-2018.140. Table 3.5 summarizes key REDiSL achievements under project components 1 and 2141 and indicates which ESP 2014-2018 priorities and specific initiatives the respective project achievements supported. Appendix XI provides REDiSL achievements under all four project components.
Table 3.5 REDiSL contributions to ESP implementation (components 1 and 2)
REDISL 2014-2018 (SUB-)
COMPONENT REDISL 2014-2018 ACHIEVEMENTS142
ESP 2014-2018 PRIORITY AREA AND SPECIFIC INITIATIVE ITEMS
FULLY OR PARTIALLY SUPPORTED THROUGH THE GPE
ESPIG CO-FUNDED REDISL PROJECT
1. Improving the Learning Environment in Targeted Areas
1.1 School Grants
Paid US$2.2 million in performance-based school grants to 1,284 schools (1,144 Primary + 140 JSS) in the four most disadvantaged local councils and provided training to these schools’ School Management Committees (SMCs) on issues
Access, Equity and Completion 1.1.3: Ensure that all children enter school and complete primary education through:
139 As per the 2017 project restructuring, a total of US$2,729,000 (or 12.8%) of total project resources were allocated to component 2. Component 3 was funded with US$943,000 (4%), and component 4 with US$2,403,000 (11.3%) of total project resources. 140 Under its three priority areas, the ESP defined 23 specific objectives, as well as 48 related initiatives through which these objectives were intended to be achieved. As shown in Appendices VIII and X, the REDiSL project was relevant in relation to 11 of these objectives and at least 15 of the specific initiatives under these objectives. 141 Component 3 was focused on project management and supervision. Component 4 is discussed separately below the table as it did not support implementation of the ESP 2014-2018 but MEST’s Ebola Strategic Response Plan. 142 The ESP 2014-2018, and the related Implementation Plan 2014-2016, did not outline targets at the level of initiatives. Instead, targets are formulated for strategic objectives (i.e., one level ‘up’), and then again at the level of specific activities (i.e., one level ‘down’ from initiatives). The specific activities described in the Implementation Plan, however, are, in most cases, not identical with specific REDiSL interventions. The evaluation was therefore not able to make a quantitative assessment of the extent to which REDiSL achievements contributed to meeting ESP targets at the level of different initiatives.

42 FINAL REPORT - SIERRA LEONE
© UNIVERSALIA
REDISL 2014-2018 (SUB-)
COMPONENT REDISL 2014-2018 ACHIEVEMENTS142
ESP 2014-2018 PRIORITY AREA AND SPECIFIC INITIATIVE ITEMS
FULLY OR PARTIALLY SUPPORTED THROUGH THE GPE
ESPIG CO-FUNDED REDISL PROJECT
such as school grant use, financial management, human resources management, and other school-improvement related issues. Although the scheme faced several initial challenges and delays, it was welcomed by stakeholders as a relevant model to support cash-strapped, low-capacity schools.
Reducing the cost of schooling to parents and households
1.2 Pre-primary education/Early Childhood Development
Funded a comprehensive package of activities in the ECE sub-sector. These include the construction of 50 ECE classrooms and latrines (completed, furnished and in use for classes); the development of an ECE curriculum and minimum standards (validated and to be distributed soon); the development of an early childhood Development (ECD) policy (validated and to be presented to Cabinet soon for approval); the design and delivery of a competency-based training program in four local councils (~500 teachers, head-teachers, inspectors trained); and support to teacher training colleges to incorporate new materials (ongoing).
Access, Equity and Completion 1.2.1: Increase access to pre-school for children aged 3-5 years old through: Developing and piloting a cost-effective community-based pre-school model143
1.3 Strengthening reading outcomes at early grades
Funded the design and distribution of early grade readers and related materials to all primary schools in the country (>6,000 schools), as well as a nationwide media campaign and associated training and events to increase awareness of early grade reading. At the time of writing a randomized REDiSL/World Bank assessment of teacher training in reading instruction had been conducted but the results were not yet available.
Quality and Relevance 2.3.1 Improve students’ acquisition of basic skills of reading and numeracy through: Developing a national reading program to ensure that children in grades 1 to 3 are developing essential learning skills144
1.4 Improvements in teacher management (TSC)
REDiSL funds covered most of the costs of the set-up and early activities of the new Teaching Service Commission. These included the establishment and furnishing of TSC offices in the capital and districts (completed); the production of a TSC operations manual and TSC website (completed); the development of a comprehensive situation analysis and policy review of teacher management (completed), and of policy guidelines on teacher management, registration and licensing (drafted, under review); and other activities.145
System Strengthening 3.4 Establish effective, functioning systems for teacher recruitment, deployment, performance appraisal, promotion and development
143 Also relevant in relation to ESP objectives 2.4.1, 2.4.2, 3.2 and 3.9. See Appendix IX. 144 Also relevant in relation to ESP objectives 2.3.2, 2.3.3, 2.1.5, 2.1.6, 2.1.7, 2.4.1 and 2.4.2. 145 The EU provided complementary funding and technical assistance.

FINAL REPORT - SIERRA LEONE 43
© UNIVERSALIA
REDISL 2014-2018 (SUB-)
COMPONENT REDISL 2014-2018 ACHIEVEMENTS142
ESP 2014-2018 PRIORITY AREA AND SPECIFIC INITIATIVE ITEMS
FULLY OR PARTIALLY SUPPORTED THROUGH THE GPE
ESPIG CO-FUNDED REDISL PROJECT
2. Strengthen Education Service Delivery
2.1 Building the foundation for better measurement of learning outcomes
Funded the development and piloting of a National Learning Assessment framework and instruments, as well as the conduct of a Final Learning Assessment for grades 4 & 5 in English, Math and Science. The project further supported the development of a Learning Assessment Policy Framework document and an accompanying operation manual (both not yet finalized by MEST).
Systems strengthening 3.6 Ensure that the MEST has the capacity and capability to collect, manage and use current data and evidence to inform its own work and that of other education sector stakeholders
2.2 Robust consistent school data collection
Funded the conduct and completion of three annual school censuses (2015, 2016, 2017). This included the design of a new, shortened census questionnaire (2016).
2.3 Develop a mechanism for better delivery on the ESP/ System for effective delivery on the Education Sector Strategy
Provided technical support and funding for the establishment of a change unit and an M&E unit, as well as the appointment of a donor coordination focal person within MEST. Supported MEST in establishing a website. Funded the 2015 Week of Education involving all districts and featuring a symposium, an annual Education Sector Review Workshop, Annual Education Awards, Open Day for Schools and Partners and various competitions.
Systems strengthening 3.1 Improve communication and coordination within the education sector, and with external stakeholders and the general public
87. Under component 4, the REDiSL project supported four of the 16 initiatives described in the MEST’s early Ebola Recovery strategy. Specifically, it financed the production and broadcasting of 600 hours of educational radio programming, provided 5,970 schools with hand-washing stations and supplies, conducted a house-to-house assessment report to encourage re-enrolment, and completed a radio station validation report.
88. As further discussed in section 4 of this report, some of the achievements made under the REDiSL project (especially under components 1 and 2) carry the potential to sustainably influence system-wide change if maintained, expanded and/or fully implemented. These include achievements in operationalizing the TSC and through the structured pedagogy approach applied to strengthen pre-primary education.146
146 Work on this component combined the development of a curriculum and instructional approaches with efforts to strengthen both in-service and pre-service teacher training, improving relevant infrastructure, involving supervisors and communities, and providing appropriate teaching and learning materials. According to Snistveit et al (2016), structured pedagogy programs of this kind have demonstrated the largest and most consistent positive effects on learning outcomes. Snistveit, B., Stevenson, J. et al. The impact of education programmes on learning

44 FINAL REPORT - SIERRA LEONE
© UNIVERSALIA
89. There are some concerns over the lack of scale and unclear sustainability of some REDiSL achievements. The performance-based school grants, which took up the lion’s share of REDiSL resources,147 covered only four out of 14 districts. While additional World Bank funding is securing their continuation up to 2019, fiscal constraints mean that the government will not be in a position to fully finance performance-based school grants after 2019, let alone expand the initiative country wide. There are similar concerns over the future of the M&E unit within MEST, the establishment of which strengthened the ministry’s internal capacity for sector plan implementation, and over the continued use of the grade 4 and 5 learning assessment which had been introduced under the REDiSL project’s component 2.
90. GPE’s other sector-related grants in Sierra Leone (ESPDG, PDG) contributed to ESP implementation via their contribution to sector planning (see section 3.2) and ESPIG development. The CSEF grant supports EFA-SL in advocacy, awareness-raising and capacity development activities, but there is no evidence of specific effects that these activities had on ESP implementation.
Contributions through GPE non-financial support 91. For the 2014-2017 ESPIG, the World Bank (WB) fulfilled the grant agent role effectively and in line with the (2016) GPE terms of reference for grant agents.148 Positive stakeholder feedback highlighted the ‘mainstreamed’ approach chosen for REDiSL, under which project implementation was coordinated by a Ministry-internal unit funded by the project (the REDiSL Secretariat) but implemented by all relevant Ministry Directorates on an activity-by-activity basis. This was an improvement from the previous ESPIG-funded project’s stronger reliance on technical assistance external to the Ministry.
92. In overseeing REDiSL implementation, the WB was able to leverage the fact that – outside of its role as GPE grant agent – it provides general budget support to the government of Sierra Leone. When progress towards operationalizing the Teaching Service Commission was deemed to be overly slow, the World Bank (as well as the European Union) defined progress on this issue as a condition for the release of their respective next tranche of general budget support to the Ministry of Finance. In the view of several stakeholders, this was decisive in making progress happen.
93. The coordinating agency, UNICEF, had no direct role to play in ESP implementation, beyond it already noted contributions to ongoing sector dialogue and the conduct of education sector reviews. The same applies to contributions by the Secretariat. The roles played by the CA and the Secretariat respectively are aligned with the GPE operational model, which assigns responsibility for overseeing ESPIG grant implementation to the country-based grant agent.149
and school participation on low- and middle-income countries. London: International Initiative for Impact Evaluation. September 2016. 147 Based on the restructured project budget (2017), USD 5,104,000 out of 21,314,800 (24%) of overall REDiSL resources were allocated to the performance-based school grants. No other sub-component received more. 148 At least two stakeholders noted that the World Bank’s procurement and approval processes generated temporary delays in REDiSL implementation. However, stakeholders (correctly) attributed these issues to grant agent regulations, and not to GPE itself. 149 As reflected in mission reports, the Sierra Leone country lead regularly brought up issues related to (lack of) progress towards agreed-upon milestones for ESP implementation in meetings with MEST representatives. One donor representative expressed the view that Sierra Leone country leads could use their visits to more strongly “push” for progress in case of delays. Other stakeholders however either did not comment on the matter or noted

FINAL REPORT - SIERRA LEONE 45
© UNIVERSALIA
94. As regards GPE processes, most consulted LEG members, in particular donor representatives, perceived the grant application and program development processes for ESPIG funds as demanding but reasonable overall (see Table 3.6).
Table 3.6 Stakeholder perceptions of the ESPIG application and program development process150
ISSUE POSITIVE ROOM FOR IMPROVEMENT
ESPIG application and program development processes
• Collaborative nature of the processes • Leadership provided by the grant
agent/coordinating agency (UNICEF) • GPE’s historical/ongoing flexibility with
regard to deadlines which the country missed from time to time
• Secretariat country lead sharing helpful insights and materials during grant application and program development processes
• Burdensome nature of GPE’s quality-assurance and review process, in particular the number of review rounds required, which puts a strain on already overstretched MEST staff
Collaboration between CA, GA and Secretariat during grant application and program development
• Overall satisfaction with frequency and quality of interactions (supportive, transparent, relevant).
• Quality of interactions between GA, CA and Secretariat occasionally affected by turnover in both the country lead and CA/GA staff, with some loss of information during transitions, and some variation in the quality of personal interactions
Validity of assumptions 95. The EVD crisis meant that one key underlying assumption in the country-level ToC did not apply in the Sierra Leone context, namely that relevant government actors have the opportunity (e.g., conductive environment and funding) to implement all elements of the sector plan. The evaluation found that the other five underlying assumptions only partially held true in the Sierra Leone context. The changing context, including the development of the PRP, negatively affected relevant government actors’ motivation (political will) to implement all elements of the original sector plan. In addition, MEST lacked some technical capabilities to do so. Further, not all country-level development partners demonstrated continued motivation and opportunity (e.g., directive from their respective leadership) to continue aligning their own activities with the priorities of the full sector plan but, instead, focused on supporting the priorities outlined in the PRP. While country level stakeholders took part in joint sector reviews, these were, as described in section 3.3, irregular, and did not visibly inform ESP implementation. Similarly, while the ESP included provisions for strengthening EMIS and Learning
that the Secretariat may have more leverage to facilitate progress under the new funding model with its performance-based tranches. 150 While some stakeholders were able to comment on the process of developing the application for the 2014-2017 ESPIG, most of them focused on the more recent process for the upcoming ESPIG (if approved).

46 FINAL REPORT - SIERRA LEONE
© UNIVERSALIA
Assessment Systems (LAS), related information was not visibly used during the 2014-2017 period to improve ESP implementation.151
Additional factors and unintended effects 96. Additional factors beyond GPE support that positively affected ESP implementation were funding and technical assistance provided by other donors outside of their roles as GPE members.
The EU contributed to progress in relation to ESP objectives in the area of TVET and also supported operationalizing the TSC.152
DFID contributed to progress at the level of junior and senior secondary education, as well as -through funding to UNICEF - to furthering girls’ education. Different from the REDiSL project, which remained focused on supporting ESP implementation, DFID primarily aimed to support implementation of the PRP. In doing so, however, the agency also contributed to progress towards ESP objectives around secondary education.
97. The main factor negatively affecting ESP implementation was the 2014-2016 EVD crisis, which had implications on available resources (see section 3.5), and led to the development of the PRP, which meant that from then on sector stakeholders varied in the extent to which they regarded and treated the ESP as their main point of reference.
98. The evaluation did not find evidence of any unintended, positive or negative, effects of GPE financial and non-financial support to sector plan implementation.
151 Please also see Appendix II for the country-level ToC and its underlying assumptions. 152 Source: MEST and UNICEF (2018): Proposal to the Global Partnership for Education for a contribution towards the implementation of the 2018-2020 Education Sector Plan. Programme Document, February 2018. The document (table 1) provides an overview of donor interventions in mid-2017 and illustrates that while donors support various types of interventions at different levels of education, overall coverage is partial, either in terms of geography, schools, subjects, and/or grades covered.

FINAL REPORT - SIERRA LEONE 47
© UNIVERSALIA
4 Progress towards a stronger education system153
99. This section summarizes evaluation findings in relation to Key Question II from the evaluation matrix: “Has the achievement of country-level objectives154 contributed to making the overall education system in Sierra Leone more effective and efficient?”
100. Progress in this regard is measured by drawing on evidence of achievements made in each of the three priority areas outlined in the 2014-2018 Education Sector Plan.156 In doing so, the analysis focuses on changes that go beyond specific activities or outputs, and, instead, constitute changes in the existence and functioning of relevant institutions (e.g., schools, MEST, the TSC), as well as changes in relevant rules, norms and frameworks (policies, standards, curricula, teaching and learning materials) that influence how actors in the education sector interact with each other.157
153 This section addresses evaluation questions CEQ 4 (During the period under review, how has the education system changed in relation to (a) quality of teaching/instruction, (b) evidence-based, transparent decision making, and (c) country-specific areas of system strengthening?). Following a recommendation by the Secretariat, the section is structured according to the ESP 2014-2018 Strategic Objectives. 154 In particular implementation of the ESP. 155 See sub-section on ‘validity of assumptions’ for a discussion of these assumptions. 156 Access, Equity and Completion; Quality and Relevance; and Systems Strengthening 157 See definition of ‘education systems’ in terminology table of this report. The GPE 2020 corporate results framework defines six indicators for measuring system-level change: (a) increased public expenditure on education (RF10, covered in section 4.4 of this report on education financing); (b) equitable allocation of teachers, as measured by the variance in the ratio of pupils to trained teachers across schools (RF11, covered here under Access, Equity and Completion); (c) improved ratios of pupils to trained teachers at the primary level (RF12, covered below under Quality and Relevance); (d) reduced student dropout and repetition rates (RF13, covered under Access, Equity and Completion); (e) the proportion of key education indicators the country reports to UIS (RF14, covered under Systems Strengthening), and (f) the existence of a learning assessment system for basic education that meets quality standards (RF15, covered under Quality and Relevance).
Box 4.1: Assessment of Contribution Claim E.
Claim: “The implementation of realistic evidence-based sector plans contributes to positive changes at the level of the overall education system.”
Assessment: The evaluation found that available evidence partly supports the contribution claim related to strengthening the education system.
Assessment is based on: (a) There has been some, albeit limited and fragmented progress towards the envisaged areas of systems strengthening; (b) the likelihood of the four assumptions underlying the contribution claim holding true in the Sierra Leone context was rated ‘moderate’ for three, and ‘weak’ for one;155 (c) implementation of the PRP – as a related, but separate guiding framework from the ESP -can explain some of the noted system level changes.
This overall assessment is discussed in the following paragraphs.

48 FINAL REPORT - SIERRA LEONE
© UNIVERSALIA
During the period under review, how has the education system changed?
Finding 12: During the 2014-2018 period, some system-level improvements have been made despite the challenges posed by the Ebola outbreak. While some of these achievements hold the potential to foster future change, overall system-level change has been limited and fragmented.
101. The 2017 MTR (p.38) concluded that between 2014 and 2016 some fragmented progress was made in systems strengthening, but that most of the challenges that existed at the start of ESP implementation still existed. The review also noted, however, that it was commendable that progress had been made at all, given the very challenging context created through the Ebola crisis. Additional evidence gained through document and data review and stakeholder consultations confirm this overall assessment for the period under review until early 2018.158
102. The following is a summary of key achievements and remaining challenges and gaps in three priority areas of the ESP 2014-2018. See Appendices XI and XII for details on key indicators.
System-level Changes to Improve Access, Equity and Completion
103. While the 2014-2018 ESP defined 14 indicators and related targets under the priority area of access, equity and completion, all of these relate to impact-level issues (such as enrollment and completion rates) which are discussed in section 5 of this report. The following observations therefore do not refer to progress towards specific ESP targets. 159
104. To date, basic education in Sierra Leone is, effectively, neither free nor universal. However, during the review period, MEST, with support from development partners – including the REDiSL project – put in place the following measures to remove barriers to equitable school access and completion:
The government continued to provide grants to schools based on the number of students enrolled. These grants are intended as a measure to reduce the cost of education to families and thereby reduce a key barrier to education.160 To date, however, timely payment of grants has been an ongoing challenge. Also, while there has been no systematic assessment of the effects of school grants on school access or completion, all donor and CSO stakeholders who commented on the program noted that the amount paid per student (<US$1/student/semester) is too low for schools to operate on. To make ends meet, schools continue to charge families for a variety of services, including for grading examinations. In addition, given that MEST school grants are only provided to government approved schools, they currently benefit less than half of all schools in Sierra Leone.
158 There is some, albeit very limited information available on changes that have occurred in 2017, i.e., that would cover the period not assessed under the MTR. In fact, the Sierra Leone ESP for 2018-2020 largely draws upon 2016 data as presented in the MTR as its baseline from which to formulate targets for future improvement. Where available, the evaluation has drawn upon additional data, such as the 2016 Annual School Census and reports from the REDiSL project. 159 The one exception is the issue of schools meeting minimum infrastructure standards, which is addressed in paragraph 106 below. While in the 2014-2018 ESP this target was presented under “Quality and Relevance”, we consider it more relevant in relation to access. 160 A UNICEF Out-of-School Children of Sierra Leone Report (2008) found that school fees and costs, direct and indirect, were the principal cause for children missing schools. Another major factor was distance to school.

FINAL REPORT - SIERRA LEONE 49
© UNIVERSALIA
As noted in the ESP 2018-2020, the cost of schooling remains a key factor influencing school completion and drop-out rates.
Performance-based school grants were introduced (through the REDiSL project) as an additional support program to reduce or remove education charges to parents in the Local Councils with the lowest education outcomes and the highest poverty levels.161 As noted in section 3.5, though positive, the grants covered only four out of 14 districts and concerns exist about the sustainability of the scheme, once the (for now, additional) World Bank funds expire.
A school feeding program was introduced as a key education priority under the post-Ebola PRP. It aimed to support the school reopening plan and foster access, especially for impoverished children. While there has been no systematic assessment of the effects of the program on school access or completion, most donors and CSO stakeholders questioned whether the initiative would be effective because it faced logistical challenges, did not provide enough funding per meal, and only provided meals two days a week.
During the review period, only a few efforts were made to improve access to learning for children with disabilities or special learning needs. Additional learning materials in Braille were developed, and new school buildings included provisions for wheelchair access. However, one important achievement is the development of an Inclusive Education Policy, which is envisaged to be implemented as of 2018.162
UNICEF,163 with financial support from DFID, implemented a program that re-enrolled 14,500 girls in school, including girls who had not returned to school post-Ebola due to pregnancy. Under the new ESP 2018-2020, MEST commits to formalizing the existing re-entry policy and guidelines to facilitate that girls can continue their education while pregnant and return to school after having given birth.164
105. The overall number of schools (counting both government-approved and unapproved schools) has increased since 2012/13 (see Figure 4.1), and there has been a considerable 42 percent increase in the number of preschool facilities from 774 in 2012 to 1,100 in 2016.165 However, as per ESP 2018-2020 (p.43), 85 of 149 chiefdoms still lack pre-primary schools.
161 Standard government grants per child per term for government-supported schools are 5000 Leone, i.e., less than US$1 at early 2018 conversion rates. REDiSL grants are lump sums, starting at US$1000 per school in a first round, and then of similar or greater amounts depending on school performance on a series of key indicators. 162 The new ESP 2018-2020 is more vocal about out-of-school children and disabilities than the 2014-2018 ESP, and it draws on the valuable data provided by the 2016 Government of Sierra Leone and UNICEF Assessment of the Situation of Out-Of-School Children. The assessment identified family income, family status (e.g., orphans), disabilities and, for girls, teenage pregnancy as key factors of school exclusion. 163 Independent from its role as the GPE coordinating agency. 164 ESP 2018-2020, p. 47. 165 The 2014-2018 ESP monitoring framework had not included specific targets for the number of new schools to be built during the period covered by the ESP. The 2014-2016 ESP implementation plan had included targets for the number of pre-primary and primary classrooms to be constructed during this period, but the evaluation found no recent data on progress made towards these targets.

50 FINAL REPORT - SIERRA LEONE
© UNIVERSALIA
Figure 4.1 Gradual increase in the number of schools in Sierra Leone
106. School infrastructure in Sierra Leone has improved in recent years. Following the Ebola epidemic, Water, Sanitation and Hygiene (WASH) facilities were established in 95 schools, and 5,970 schools166 at least received hand-washing stations and supplies.167. Nonetheless, 16 percent of classrooms are still makeshift, and the quality of infrastructure especially in some unapproved schools remains very low (e.g., “school shacks”, “school under a tree”). As per ESP 2018-2020 (p.20), by 2016 only 45 percent of schools and other institutions met minimum physical structure standards, far below the ESP 2014-2018 envisaged 2018 target of 85 percent.
System-level Changes to Improve Education Quality and Relevance168
107. The pupil/teacher ratio has not improved at primary level in recent years. It was higher in 2016 (38/1) than it had been in 2012 (33/1), reflecting an increase in the number of pupils (from 1,252,343 in 2012 to 1,412,542 in 2016) in parallel to a slight decrease in the number of teachers (from 37,957 in 2012 to 37,837 in 2016.169 This may reflect, at least in part, the effects of the Ebola crisis, given that in
166 Both government approved and unapproved schools. 167 MTR 2017, p.18, and World Bank (2018): Revitalizing Education Development in Sierra Leone. Implementation and Status Report. January 2, 2018, p.7. 168 The ESP 2018-2020 (p. 6-8) shows progress made on the key indicators for Quality and Relevance by comparing baseline levels from 2011 with actual data on 2016 and the target for 2018 (See Appendix XII). According to this overview, as of 2016 progress was ‘on track’ for five out of eight indicators, and ‘off track’ for only three indicators. One of these indicators (on school infrastructure) has been discussed above under ‘Access, Equity and Completion’, two others (on learning outcomes at the primary level) are addressed in section 5, while in this section we comment on progress made towards the remaining indicators related to curriculum revisions and improving the quality and distribution of teachers. 169 UIS data. The 2014-2016 ESP implementation plan had envisaged the recruitment of an additional 1,100 primary teachers.
0
2000
4000
6000
8000
Pre-primary Primary JSS SSS
Num
ber o
f sch
ools
2010/11 2012/13 2016Source: Annual School Census (ASC) 2016.

FINAL REPORT - SIERRA LEONE 51
© UNIVERSALIA
2015 the total number of primary teachers had been considerably higher at 40,303. The ratio of pupil to qualified teacher (PQTR) has worsened since 2012, as shown in Figure 4.2.170
Figure 4.2 No improvement in the primary Pupil-to-Trained-Teacher ratio
108. The stagnating pupil to qualified teacher ratio also reflects the fact that while the percentage of primary teachers with a teaching certificate (TC) or higher qualification has increased from 50 percent in 2011 to 61 percent in 2016, it was still below the ESP’s envisaged target171 of 69 percent for 2016 and thus insufficient to counter demographic growth.172 Under the ESP 2014-2018, MEST had envisaged to address the high numbers of unqualified teachers by providing structured, longer-term professional development to help teachers obtain formal qualifications. These plans were derailed by the Ebola crisis, which caused a shift in emphasis to providing short-term in-service training to help teachers implement the accelerated curriculum.173 Various additional in-service training opportunities were offered through different development partners, but these were fragmented and insufficient to address the lack of qualified primary teachers. See Box 4.2.
170 ASC 2016 data show an even higher primary PQTR of 69/1 in 2016. 171 ESP 2014-2018 Strategic Objective 2.4. See Appendix XII. 172 Sources: UIS and 2014-2018 ESP and 2018-2020 ESP. While not having met the 2016 target, the 2018-2020 ESP rated Sierra Leone to be ‘on track’ towards meeting the 2018 target of 80% of primary teachers holding a Teaching Certificate (TC). 173 As noted in the 2018-2020 ESP (p.20), by 2016 47% of primary teachers had received training in reading instruction. This figure likely includes the 4,000 teachers trained under the GPE ESPIG co-funded REDiSL project.
68 65
60 61
31.33 33 34.83
-
10
20
30
40
50
60
70
80
2010 2012
Pupi
ls p
er te
ache
r
PQTR (GPE) PTR (UIS)
Box 4.2: No consistent progress on teacher training
There is a plethora of training of teachers going on, but stakeholders complain that there is no sustainability as there is little coordination between the different agencies and bodies training and nothing written into these manuals for continued action research on the effectiveness of the training on the students, the teachers and learning outcomes. Furthermore, the Inspectorate or Quality Assurance Department is understaffed and for now, there is little interaction between these training and future inspection and monitoring. (MTR of the 2014-2018 ESP, p.35)

52 FINAL REPORT - SIERRA LEONE
© UNIVERSALIA

FINAL REPORT - SIERRA LEONE 53
© UNIVERSALIA
109. Nevertheless, according to the ESP 2018-2019, Sierra Leone is on track to meeting two other targets related to improving teacher quality described in the 2014-2018 ESP: (i) As of 2016, 47 percent of primary teachers had received training in reading instruction (the 2016 target had been 45 percent and the envisaged 2018 target is 70 percent); (ii) in 2016, 72 percent of junior secondary teachers held at least a Higher TC, compared to 43 percent in 2010, thereby meeting the 2016 target of 61 percent, and approaching the 2018 target of 85 percent).
110. Gaps remain in the development and distribution of teaching and learning materials. This task is not managed centrally by MEST but has been driven by individual development partners and their projects. During the 2014-2018 period, a variety of new materials were made available to teachers and learners in all schools country-wide.174 With the exception of materials developed in relation to early childhood education, however, MEST has not yet put measures in place to ensure consistent quality of materials developed by different partners, including their alignment with new curricula (see below) and/or with each other.175 Available data provided no information on the current pupil to textbook ratios at different educational levels, or on related MEST targets.
111. New or revised curricula were developed during the 2014-2018 period, including an accelerated post-Ebola curriculum that was implemented under the 2015-2017 PRP, a draft ECE curriculum, as well as a revised Basic Education Curriculum for core and non-core subjects in basic education. The latter was developed on the basis of extensive consultations in 2012-2014 but was finalized during the period under review. The curriculum puts strong emphasis on education rights; on issues of equity, inclusion, quality and learning; and on moving from a teacher-centered to student-centered methodology. 176 As of 2018, nationwide implementation of the new Basic Education curriculum was “still lagging”177 thus not meeting the 2014-2018 ESP’s target, which had foreseen that by now the new curriculum would be fully implemented and in the fine-tuning stage.178
System strengthening179
112. As per ESP 2018-2020 (p. 7-8), by 2016, only two of 20 ESP 2014-2018 indicators and related targets on system strengthening had been met, while progress on 11 indicators was on-going or in preliminary stages, and ‘off track’ for seven indicators. However, stakeholder consultations indicate that by early 2018 at least some progress had been made on all 20 indicators. See Appendix XII. This section discusses key achievements and remaining gaps in relation to the system strengthening priorities outlined in the ESP 2014-2018 and relevant GPE RF indicators.
174 Including early grade supplementary readers and teachers’ guides for classes 1-3 developed and distributed under the REDiSL project (see Appendix XI). 175 For example, the lesson plans developed and distributed by MEST, with DFID support, under the PRP did not refer to or integrate the new early grade readers developed and distributed under the REDiSL project. 176 Government of Sierra Leone (undated): National Curriculum Framework and Guidelines for Basic Education. A formative mid-term evaluation of its implementation and results is planned for five years after its launch. 177 ESP 2018-2020, p.20. 178 ESP 2014-2018 Strategic Objective 2.2. See Appendix XII. 179 Related objectives in the 2014-2018 ESP primarily related to issues of sector management, policy reform and MEST internal capacities for education service delivery.

54 FINAL REPORT - SIERRA LEONE
© UNIVERSALIA
113. MEST made limited progress towards its objective of improving communication. By 2016, a public relations unit was not yet developed, and MEST had neither an external communications strategy nor a comprehensive information communications technology plan.180 With REDiSL support, the ministry did, however, establish a MEST website.181
114. Several new policy documents, guidelines, and standards developed during 2014-2018 have the potential for positively influencing education access and the quality of teaching and learning,182 but not all policies envisaged under the ESP 2014-2018 were developed. See Box 4.3. As of early 2018, none of these frameworks had yet been fully implemented, some were still in the drafting stage (such as the Inclusive Education Policy), while others (such as the ECD policy) were awaiting cabinet approval. In some cases, concrete steps are under way to support implementation (e.g., work with teacher training colleges to integrate new ECD or teaching instruction materials). In other cases, implementation has not yet begun but is envisaged under the 2018-2020 ESP.
115. Limited progress was made in relation to the 2014-2018 ESP’s objectives related to strengthening MEST’s ability to plan and manage its own resources.184 The envisaged staff competency framework and staff development program are not yet in place, and objectives-based performance assessments are not yet systematically conducted. Also, as noted in section 3.5, the ministry continues to be understaffed.
116. Some progress, albeit slower than planned, was made in establishing effective, functioning systems for teacher management.185 The establishment and (partial) staffing of the Teaching Service Commission (TSC) during the period under review is an achievement with potential positive future implications for sector management, teaching and learning, as well as for equity dimensions of the education system. See Box 4.4.
180 ESP 2014-2018 Strategic Objective 3.1. See Appendix XII. 181 www.education.gov.sl/ 182 ESP 2014-2018 Strategic Objective 3.2. See Appendix XII. 183 The development of this policy was an explicit objective in the ESP 2014-2018 monitoring framework. 184 ESP 2014-2018 Strategic Objective 3.3. See Appendix XII 185 ESP 2014-2018 Strategic Objective 3.4. See Appendix XII
Box 4.3: New policies/guidelines developed during 2014-2018
• TVET policy (2014), approved by cabinet183
• Draft inclusive education policy (2017)
• Minimum standards for schools and institutions (draft developed in 2017; finalized for ECD)
• ECD policy (draft developed in 2010 but revised during review period, no data on exact date), awaiting cabinet approval
• Policy guidelines on teacher management and teacher registration (draft developed in 2017)
• Draft national assessment policy framework (no data available on exact date)
• Draft School Feeding Policy (not envisaged in ESP 2014-2018, no information available on date)
Envisaged under ESP 2014-2018 but not yet (or only partially) developed were new or revised policies on non-formal education, school fee subsidies, competency frameworks for all grades, and a policy on textbooks and teaching/learning materials.

FINAL REPORT - SIERRA LEONE 55
© UNIVERSALIA
117. A new donor coordination desk187 in MEST has allowed the Ministry to gather information on support provided by development partners more systematically. However, this has not yet had notable influence on MEST’s ability to proactively guide the foci or modalities of partner support to the education sector.
118. MEST’s capacity to collect and manage current sector data and evidence has improved,188 with the establishment in the period under review of a functioning monitoring and evaluation (M&E) unit and a ‘Situation Room’, introduced during the Ebola crisis, which supplies real-time (monthly) data on schools.189 This allows bringing urgent matters to the attention of MEST more quickly than in the past. Since 2015, the government – with support from the REDiSL project – conducted Annual School Censuses (ASCs)190 and is submitting data on all key indicators to the UIS. Nevertheless, several areas for improvement remain.
186 At present, the payroll still includes many ‘ghost teachers’, that is, teachers who are either retired, deceased, or who otherwise do not perform actual teaching duties, but who continue to get paid. In 2017, DFID supported an exercise to review teacher data and produced a clean payroll. However, at the time of the evaluation visit this updated version had not yet fully been approved by MEST. 187 ESP 2014-2018 Strategic Objective 3.5. The desk was established with REDiSL support. 188 ESP 2014-2018 Strategic Objective 3.6. See Appendix XII. 189 1,182 trained situation room monitors across the country visit schools on a monthly basis to report information on student and teacher attendance, school building quality, and a series of other rotating indicators. 190 The ASCs cover all schools, including those not yet approved by MEST.
Box 4.4: The Teaching Service Commission and the future of teacher management
The provision for a TSC had been created as far back as 2010 through an act of Parliament, which mandated the TSC with addressing all matters pertaining to the wellbeing of teachers, teacher management and the improvement of their professional status. This includes some novel responsibilities such as registration and licensing of all teachers; vetting all teachers’ qualifications and determining their equivalence based on a qualification framework; and organizing regular induction and orientation programs for newly licensed teachers. The objective of establishing the TSC was included in 2007-2015 ESP, but it was only under the ESP 2014-2018 that the TSC was established and staffed at the central level. By early 2018, however, the TSC was still not fully operational as some headquarters positions as well as all district-level positions remained to be filled.
The TSC is hoped to lead to strengthened teacher quality and integrity, support the more efficient use of resources by keeping the teacher payroll up to date,186 and contribute to a more equitable distribution of teachers. If achieved, these would constitute considerable improvements in the Sierra Leone education system. The TSC has already developed a comprehensive situation analysis and policy review of teacher management, as well as policy guidelines on teacher management and teacher registration and licensing. This strengthened policy framework, if implemented, can enable future change.
The challenges in strengthening the teaching profession in Sierra Leone are substantial, however, given the magnitude of needs and the limited resources. Consulted stakeholders widely expressed concerns that the TSC is not fully autonomous from MEST and that this may limit its ability to operate effectively and efficiently. One example supporting such concerns was the lengthy and opaque process of handing over teacher records from MEST to the TSC. The process was repeatedly delayed, and – according to all consulted donor partners – finally occurred in early 2018 only due to two donors making the release of its general budget support to Sierra Leone conditional on the handover being completed.

56 FINAL REPORT - SIERRA LEONE
© UNIVERSALIA
Most consulted donor partners noted that during the 2014-2018 period it has not been consistently clear how MEST uses available school level information to inform decision making.
The sustainability of both the M&E unit and the situation room was unclear at the time of the evaluation site visit, as both had been established with donor funds that were about to run out, with no supplements in sight.191
The Situation Room and the Annual School Census have, until now, not been connected to each other and, as noted in a recent World Bank report, “an integrated EMIS that allows the different instruments to be harmonized and operate under a unified coherent framework” is still needed.192
The 2014-2018 ESP’s target of fully decentralizing the EMIS has not been met. The target was to devolve data collection to local councils, and, in a further step, to individual institutions (ESP 2014-2018, Strategic Objective 3.6). Also, as reflected in this report (see, for example, section 5), education sector data available from the EMIS is still only partially complete and not always reliable.
119. Another challenge is that education remains highly centralized and there has been little progress in shifting responsibilities from the central MEST to District Education Offices and local councils.193 Stakeholder consultations indicated that decision making within MEST is heavily centralized and that this has occasionally led to a backlog in decision making and delays in both MEST and partners’ activities.
120. Some progress, albeit slow, has been made in strengthening the capacity to monitor performance and supervise quality improvements at all levels.194
By early 2018, Sierra Leone was still facing a lack of data and systems to assess learning and education quality.195 Efforts aimed at strengthening related systems that were put in place during the review period include: (i) The drafting of national learning assessment policy framework, which is expected to be operationalized under the 2018-2020 ESP;196 (ii) MEST and its partners conducted Early Grades Reading and Math Assessments (EGRA/EGMA) in 2014-2016; (iii) DFID supported an assessment of English and Math in JSS2 and SSS2 (Senior Secondary School) in 2016; (iv) A new national learning assessment for primary grades 4 and 5 in English, Mathematics and Science (developed under the REDiSL project) was carried out in all 19 local councils.197 In addition, the government continued to implement existing examinations (the National Primary School
191 While the Situation Room had initially been established as a temporary measure during the Ebola crisis, the 2018-2020 ESP foresees its continuation. One donor questioned the value-for-money of the Situation Room, pointing out that the pool of over thousand data-collectors was very expensive and not necessary in a non-emergency context (given that many school-level indicators are not likely to significantly change in the short term), and that it was unlikely that donors would continue to support this model in the longer term. 192 World Bank (2017): REDiSL Implementation Status Report, Annex 1. December 2017. 193 ESP 2014-2018 Strategic Objective 3.7. See Appendix XII. 194 ESP 2014-2018 Strategic Objective 3.9. See Appendix XII. 195 Ibid. GPE RF data from 2016 had classified Sierra Leone’s learning assessment system as ‘nascent’. 196 The ESP 2018-2020 (p.20) notes that ‘work is currently being done in designing a learning assessment framework and assessment instrument’. 197 At the time of evaluation, data on results of the assessments were not yet available. In this absence, it was also not possible to establish whether the assessment system reflected the revised basic education curriculum.

FINAL REPORT - SIERRA LEONE 57
© UNIVERSALIA
Examination NPSE, the Basic Education Certificate Examination BECE, and the West Africa Senior School Certificate, WASSCE).198
While the DFID-supported secondary school exams will be continued under the 2018-2020 ESP, it is not evident from the new ESP that the same applies to EGRA/EGMA and/or the primary grade 4/5 assessments introduced through the REDiSL project. As such it is not yet clear if all of the innovations put in place during the review period will lead to sustainable system-level changes.
The MTR 2017 (p.49) notes that regular monitoring and supervision of schools has improved by putting in place a cluster monitoring system that now allows ensuring that over 50 percent of approved government and government-assisted schools are visited more than once every two years. In addition, schools are visited not only by inspectors from the District Education Office, but also by monitors working with the Situation Room. However, the 2014-2018 ESP’s target of ensuring that each school is visited at least once a term has not yet been met.
121. As illustrated in Figure 4.3, more than half of schools in Sierra Leone are not government-approved and thus are not subject to quality control through MEST, or recipients of financial support from MEST. While approximately 300-350 schools were approved during the 2014-2018 period, related processes were slow and lacked transparency.199 In future, approving schools more efficiently and transparently may be facilitated by a Policy on Minimum Standards for Schools and Institutions, which – while originally foreseen to have been completed in 2014 - has been developed in 2017 but is yet to be implemented.200
Figure 4.3 Most schools in Sierra Leone are not approved
Did ESP implementation contribute to system-level changes?
Finding 13: Several of the noted system-level improvements during the period under review are likely due to implementation of the 2014-2018 ESP.
122. The GPE theory of change assumes that effective sector plan implementation contributes to stronger education systems. In Sierra Leone, assessing the likelihood of this assumption holding up in practice is complicated by the facts that (a) ESP implementation was interrupted, and largely stalled,
198 One stakeholder noted that the new basic education curriculum called for a continuum from primary school to secondary school and noted that it was not clear in what form the NPSE would be maintained in the future. 199 Under the PRP, the aim had been to approve 500 schools by 2017, while the 2014-2018 ESP aimed for approval of 1,444 community schools by 2016. The MTR (2017) noted, however, that by 2017, only 81 schools were approved, while another 371 schools had applied but were still waiting for a decision from MEST. Interviews with MEST representatives suggest that by 2018, 300-350 schools had been approved so far. The evaluation found no information to assess whether the rate of school approvals was higher or lower during 2014-2018 than before. 200 ESP 2018-2020, p. 21.
Approved
Not Approved
0 2000 4000 6000
School Status
Source: ASC 2016.

58 FINAL REPORT - SIERRA LEONE
© UNIVERSALIA
through the EVD crisis, and that for two years the ESP was superseded by the Presidential Recovery Plan; and (b) as noted in the previous finding, progress towards strengthening the overall education system has been limited and fragmented.201
123. Nevertheless, available evidence partly supports the assumed link between ESP implementation and observed system-level changes in that it appears to be the most plausible explanation for at least some of these changes. This is based on the pragmatic consideration that many of the tangible system-level improvements described above, such as the establishment of the TSC, can be traced back to specific interventions put in place during 2014-2018 and outlined in the ESP for that period.
124. While the 2015-2017 PRP introduced some new priorities that had not been covered under the ESP202 several development partners, including GPE and the World Bank as grant agent for the ESPIG co-funded REDiSL project, continued implementation of efforts originally designed to facilitate ESP implementation. Progress made, including through REDiSL support, in relation to ECE infrastructure, ECE minimum standards and curriculum, for example, were issues not covered under the (emergency-focused) PRP, but only under the original ESP.
Validity of assumptions 125. In the country-level theory of change, the contribution claim linking ESP implementation to system-level change was based on four underlying assumptions: That education sector plan implementation would lead to improvements in 1) sector management, 2) learning, 3) equity; and that 4) there is sufficient national capacity or relevant technical assistance to analyze, report on and use available data and maintain EMIS and LAS. Based on the available evidence the evaluation found that the likelihood of these holding true in Sierra Leone during the period under review was ‘moderate’ for assumptions 1, 2 and 4, and ‘weak’ for assumption 3 on equity given the high proportion of unapproved schools, which do not benefit from MEST quality control and financial support. Key factors that are likely to have affected the limited applicability of these assumptions include the interrupted and incomplete implementation of the ESP 2014-2018 due to the EVD crisis, as well as the existence of the PRP as another sector framework that was only partially aligned with the ESP.
Additional factors 126. The only noted system-level improvements clearly not linked to the ESP, but, instead, deriving from the Ebola crisis and the related PRP, are the drafting of a School Feeding Policy and the (albeit limited) implementation of a government-led school feeding program. For those issues addressed in both the ESP and the PRP, such as improvements in pupil to qualified teacher ratios (see section 4), MEST used ESP rather than PRP indicators and targets to measure progress made and to inform the new ESP 2018-2020.
127. The evaluation identified no other specific factors beyond ESP and PRP implementation that are likely to have contributed to the noted system-level changes.
201 The latter poses a challenge when trying to apply contribution analysis. I.e.: if the envisaged result (in this case: system level improvement) has not, or has only partially, been achieved, it becomes more difficult (and potentially less meaningful) to ask if and how specific interventions have contributed to this result. 202 In particular the school feeding program and the ‘situation room’

FINAL REPORT - SIERRA LEONE 59
© UNIVERSALIA
5 Progress towards stronger learning outcomes and equity
128. This section summarizes evaluation findings in relation to Key Question III from the evaluation matrix: “Have changes at education system level contributed to progress towards impact?”
How has the education sector changed during the review period in terms of learning outcomes, equity, gender equality and inclusion?
Finding 14: Currently available data on changes in learning outcomes, equity, gender equality and inclusion in education are scarce and not always reliable.
129. Impact-level data for Sierra Leone are incomplete, punctual and not always comparable across time periods, thus in many cases it is not possible to identify trends for the period under review (2014-2018). Box 5.2 highlights the nature of the existing data limitations. In addition, most available data are from 2016 and thus from the middle of the review period. Given that usually there is a time lag between system-level improvements and measurable impact-level change, the existence or absence of such change does not necessarily mean that improvements made during the review period have not been effective.
203 The two underlying assumptions related to this contribution claim as per the Theory of Change were: 1. Changes in the education system positively affect learning outcomes and equity (insufficient evidence); and 2. Country-produced data on equity, efficiency and learning allow measuring/tracking these changes (weak).
Box 5.1: Assessment of Contribution Claim F.
Claim: “Education system-level improvements result in improved learning outcomes and in improved equity, gender equality, and inclusion in education.”
Assessment: The evaluation found that available evidence was not sufficient to assess the likely validity of the contribution claim related to progress towards impact. This does not mean that available data would put the assumed link between the two in question. Instead, it largely reflects the fact that the evaluation focused on a relatively limited time period, and that resulting data did not suffice to assess the contribution claim based on evidence. This is elaborated on below.203

60 FINAL REPORT - SIERRA LEONE
© UNIVERSALIA
Finding 15: Available data indicate some positive trends in learning outcomes and gender parity, but static or worsening conditions in completion rates, equity and inclusion.
204 The ESP 2018-2020 (p. 75) merely notes that ‘many children with disabilities do not go to school’.
Box 5.2: Limitations of impact-level data in Sierra Leone
Incomplete time series data: For most indicators, UIS data for Sierra Leone starts in 2011 and ends in 2015. The ASC 2016 and MTR 2017 similarly only provide data for certain years.
Non-comparable data: UIS data, ASC 2016 data, MTR 2017 data and ESP 2018-2020 data frequently offer different figures for the same indicators, suggesting the use of different methodologies or different sources which are not always explicitly cited.
One-off studies: Several of the studies conducted during the period under review were one-off and therefore not directly comparable to previous assessments (if any). This was the case with the 2016 MEST/UNICEF Assessment of the Situation of Out-of-School Children, and with the 2017 DFID ‘Leh Wi Learn’ project assessments in English and Maths conducted in the second grades of lower secondary and senior secondary school
Absence of data: No data are available that would allow identifying specific trends in terms of inclusive education for children with disabilities and/or other special needs.204
No access to data: Despite repeated efforts and reaching out to different stakeholders, the evaluation team was unable to obtain the 2014-2016 EGMA/EGRA results.

FINAL REPORT - SIERRA LEONE 61
© UNIVERSALIA
Learning outcomes 130. Since 2013/14, there have been tentative improvements in learning outcomes, as evidenced by year-on-year rises in pass rates for national examinations at all levels (primary, JSS, SSS).205 See Figure 5.1. These improvements are from very low levels though, and related evidence is incomplete.206
Figure 5.1 Pass rates (%) for Examinations at all levels rose from 2013 to 2017.207
131. The 2018-2020 ESP notes that, based on data available at the time of its development in 2017, Sierra Leone was ‘off track’ to meeting its objectives related to improving literacy and numeracy skills at primary level. 208 No detailed information was available, however, to verify and illustrate the basis for this assessment (e.g., most recent EGRA/EGMA results).
Equity, gender equality and inclusion 132. On the positive side, available data indicate a speedy recovery in enrollment after the Ebola crisis. Enrollment temporarily deteriorated during Ebola, but when schools re-opened after eight months
205 ESP 2018-2020, Annex VIII. The pass rate is the number of students passing the exam divided by the number of students sitting the exam. Based on the same data source, the number of test takers grew at the NPSE and BECE level throughout the period (if more slowly between 2014 and 2015, resuming growth thereafter), but dropped significantly for WASSCE, from almost 60,000 in 2012 to less than 30,000 in 2016. 206 Other learning assessments conducted in the period under review (e.g., EGRA 2014, 2017 DFID JSS/SSS assessments in English and Mathematics) confirm that the main and ongoing context is one of very low learning outcomes. Due to data accessibility issues, the evaluation could not compare the latest EGMA/EGRA results to those conducted in the past (full results not available, differences in reporting format). It is also worth noting that, even with recent improvements, WASSCE pass rates remain far below those of other West African countries, such as Nigeria or Ghana (DfID Leh Wi Learn Business Case, May 2016, p.11). 207 For the NPSE, the proportion of students enrolled in the last grade of primary school who took the exam increased from 93,767 out of 110,494 (84.8%) in 2013 to 115,556 out of 128,994 (89.5%) in 2016. Equivalent data are not available for BECE and WASSCE. 208 ESP 2014-2018 Strategic Objective 2.3. See Appendix XII.
0
10
20
30
40
50
60
70
80
90
2013 2014 2015 2016 2017
% o
f tho
se ta
king
exam
who
pass
ed
National PrimarySchool Examination(NPSE)
Basic EducationCertificateExamination (BECE)
West African SeniorSchool CertificateExamination(WASSCE)
Source: ESP 2018-2020, Appendix VIII.

62 FINAL REPORT - SIERRA LEONE
© UNIVERSALIA
of closure,209 90 percent of the students enrolled pre-Ebola returned to school in the first academic year after the crisis. 210
133. Absolute numbers of students enrolled in primary education increased by 18 percent between 2011 and 2016, from 1,194,503 to 1,412,542. The primary Gross Enrollment Rate (GER) increased from 124 percent in 2011 to 130 percent in 2016.211 This meant that the 2014-2018 ESP’s target of lowering the primary GER to 119 percent by 2018 to ensure that children enroll at the right age was not achieved.212
134. Since 2011 GERs have deteriorated at junior secondary and senior secondary levels.213 Enrollment rates at JSS and SSS levels decreased from 67 percent in 2011 to 61 percent in 2016 for JSS, and from 35 percent to 28 for SSS, thereby not meeting the ESP’s target of increasing enrollment at these levels.214 This is illustrated in Figure 5.2, which shows the progress towards the 2014-2018 ESP’s target for 2018.
135. As also shown in Figure 5.2, the pre-primary gross enrollment rate increased between 2011 (8.4 percent) and 2016 (11 percent).215 While meeting the envisaged target of 11 percent for 2016, the ESP 2018-2020 notes that the pre-primary GER is still ‘off track’ to meeting the envisaged 2018 target of 22 percent.216 Although pre-primary enrollment figures in Sierra Leone remain low, they are above those of some other countries in the region.217
209 For comparison, schools were closed for six months in Guinea and seven months in Liberia. Given that Sierra Leone was the country hardest-hit by the disease, the slightly longer period of school closure is understandable. 210 Post-Ebola Recovery Delivery Program Overview, MEST slide deck, 10-24 months recovery plan, slide 19. 211 2016 ASC. According to the ASC, in 2016 the primary GER was marginally higher for female (130.6%) than for male pupils (129.8%). While UIS data also show an increase in GER between 2011 and 2016, they calculate the respective GERs at 111% and 115% respectively. Both ASC and UIS data base their calculations on the same number of pupils enrolled in primary education, indicating that differences in GERs are based on different calculations of the total number of children within the official age groups. In the text above we quote ASC rather than UIS data given that the 2018-2020 uses the ASC as its reference point and rates the objective of lowering the primary GER to 119% by 2018 as being ‘off-track’. 212 ESP 2014-2018 Strategic Objective 1.1. See Appendix XII. 213 ESP 2018-2020, p.6. based on 2015 and 2016 school census data. See also Appendix XII. 214 In 2016, out of a total of 316,402 JSS students, 161,964 (51.2%) were male and 154,438 (48.8) female. 215 Based on ESP 2018-2020 figures. UIS data shows a lower starting point in 2011 (7 %), and a slow gradual rise to ten percent by 2015. Annual School Census data for 2016 shows a higher pre-primary GER of 13.7%. GPE Results Framework data for 2017 show a lower GER of 8.99%. According to the 2016 ASC, a total of 80,923 pupils (38,162 male and 42,761 female) were enrolled in pre-schools in 2016. No absolute numbers were available for 2011. 216 ESP 2014-2018 Strategic Objective 1.2. See Appendix XII. 217 As per the GPE Results Framework data for 2017 for other countries reviewed as part of this series of summative evaluations, pre-primary GER was 38 percent in The Gambia and 155 percent in Liberia. However, GER in some other countries are lower than those in Sierra Leone, such as 7 percent in Côte d’Ivoire, 10 percent in Mauritania, and 4 percent in Burkina Faso.

FINAL REPORT - SIERRA LEONE 63
© UNIVERSALIA
Figure 5.2 Gross Enrollment Rates 2011-2016 compared to 2018 target, both sexes, %
218
136. The percentage of 6-11-year-old children who were not in school increased from 23 percent in 2011 to 27 percent in 2015.219 This increase may have been only temporarily due to the Ebola crisis, but the evaluation did not find any more recent data on out of school children to assess whether out-of-school ratios have improved since 2015.220
137. There have been modest improvements in gender parity in JSS and SSS enrollment since 2012/13. Parity in primary school enrollment had already been achieved by 2011/12. At the JSS level, the 2016 GER for
male students (67.5 percent) was slightly higher than for females (63.8 percent).221 System-wide, the 2016 school census recorded an almost even share of female to male students across the education system excluding university (49.8 percent females out of a total of 1,981,273 students vs 50.2 percent males).222
138. ESP 2014-2018 targets for primary and JSS completion rates have not been met. Trends in completion rates are difficult to assess given contradictions in data sources. As per ESP 2018-2020,223 completion rates have improved, with the Proxy Completion Rate (PCR) for primary education slightly increasing to 75.4 percent in 2016 from 73 percent in 2011. According to the 2016 ASC, primary PCRs have been slightly higher for boys (76.4 percent) than for girls (74.4 percent). For JSS, the completion
218 The graphic includes ESP 2018-2020 GER values for primary (2011: 124%, 2015: 125.5%, 2016: 130%), JSS (2011: 67%, 2016: 61%), SSS (2011: 35%, 2015: 27.6%, 2016: 28%) and pre-primary education (2011: 8.4%, 2016: 11%). GER data for JSS and pre-primary for 2015 as well as other years are not available ESP 2018-2020. Data from other sources (MTR, ASC, UIS) were inconsistent with EPS 2018-2020. As for absolute enrolment numbers (both sexes), the ESP 2018-2020 data looks as follows: for primary school (2010/2011: 1,194,503; 2015: 1,338,210; 2016: 1,412,524), for JSS (2010/2011: 244,489, 2015: 286,457; 2016: 316,402), for SSS (2010/2011: 108,243; 2015: 156,520; 2016: 171,424), for pre-primary school (2010/2011: 37,351; 2015: 60,065; 2016: 80,923). 219 Mid-term review of the Education Sector Plan (2017), p. II, and ESP 2018-2020, p.40. Neither source provided absolute numbers of out-of-school children. 220 Please note that children who attend unapproved schools are counted in the Annual School Census and are thus not considered to be ‘out of school’. 221 ESP 2018-2020, p.19. The ESP 2014-2018 included indicators and targets related to gender parity indexes for the pre-primary and primary levels (Strategic Objectives 1.1 and 1.2). In both cases, the 2018-2020 ESP rates related targets as ‘met’. See Appendix XII. No similar targets had been formulated for JSS and SSS levels. 222 There remain gender gaps in completion, transition and survival rates at all levels. Although data is incomplete, especially for the period under review, these gaps have tended to diminish gradually over time in recent years. 223 p.6, based on Annual School Census data 2015 and 2016.
Pre-Primary Pre-Primary
PrimaryPrimary
JSS
JSS
SSS SSS
0
25
50
75
100
125
150
2011 2015 2016 2018 Target
GER
(per
cent
age)
Source: ESP 2018-2020 (p.6).

64 FINAL REPORT - SIERRA LEONE
© UNIVERSALIA
rate was 64 percent in 2016, up from 57 percent in 2011.224 The noted improvements are, however, below the ESP 2014-2018 targets for 2016 of 94 percent (primary) and 68 percent (JSS), and, in the new 2018-2020 ESP related progress is rated as ‘off track’ to meeting the 2018 targets.225 Moreover, ESP and ASC data on this indicator fluctuate unreliably.226 UIS data actually indicate a worsening trend in both primary and lower secondary PCRs between 2011 and 2015; and GPE Results Framework data for 2017 indicate PCRs of lower values than those noted in the 2018-2020 ESP.227
139. The 2014-2018 ESP did not entail any specific objectives or related indicators and targets on ensuring inclusive education, and available data sources do not provide information on the existing situation or on trends over time related to meeting the needs of learners with special needs.
Is there evidence to link changes in learning outcomes, equity, gender equality and inclusion to system-level changes identified? What other factors can explain observed changes (or lack thereof)?
Finding 16: The system-level changes achieved during the 2014-2018 period are too recent to have affected impact-level data related to learning outcomes and equity. One possible exception is changes made to the availability of pre-school education, which may have contributed to the noted increase in pre-primary enrollment during the review period.
140. Most of the system-level achievement described in section 4 of this report constitute relevant and potentially influential foundations for future change but have yet to be (fully) implemented in order to affect change in terms of learning outcomes or equity. This is the case, for example, for the noted changes in curricula, policies, teacher professional standards, and minimum standards for schools, which have yet to be operationalized and/or fully rolled out. Once these measures are implemented, it will likely take several years before related changes contribute to measurable effects on learning
224 Ibid. 225 ESP 2014-2018 Strategic Objectives 1.1 and 1.3. Targets for 2018 are 100% PCR for primary, and75% completion rate for JSS. 226 The ESP 2018-2020 indicates varying completion rates in various parts of the report. For primary: completion rate of 75.4% in 2016 (p. II); completion rate of 74% in 2016 (p.4); PCR of 74% in 2016 (p.6); PCR of 75.3% in 2015 (p.24); completion rate of 75.4% in 2015 (p.27). For lower secondary: completion rate of 61% in 2016 (p.4); completion rate of 64% in 2016 (p.6); PCR, 40.6% in 2015 (p.24). Ignoring smaller variations, most recent ESP figures are clearly drawn from the Annual School Census reports 2015 and 2016. For the lower secondary PCR, the censuses indicate widely different numbers: 40.6% in 2015 and 64.5% in 2016. Whilst these differences may be attributed to Ebola / school closure, they are not reflected in primary PCR rates (75.3% in ASC 2015, 75.4% in ASC 2016), even though primary schools were equally affected. 227 UIS data suggests that the gross intake ratio to the last grade of primary education (used by GPE as a proxy for primary completion) decreased across genders to 66 percent in 2015 from 69.5 percent and 70.9 percent in 2013 and 2012 respectively. Such a downward trend is also seen in the gross intake ratio to the last grade of lower secondary school measured across genders. This deterioration of completion rates is, however, less pronounced among lower secondary female students, as the same indicator for lower secondary female completion was 48.3 percent in 2015, compared to 48.4 percent in 2012. GPE 2017 Results Framework data (based on UIS data) indicates worse outcomes than the ESP 2018-2020, such as a gross intake ratio into the last grade of primary of 58%, and into the last grade of lower secondary education of below 50%.

FINAL REPORT - SIERRA LEONE 65
© UNIVERSALIA
outcomes.228 Furthermore, potential positive effects of noted improvements such as teacher professional standards may only fully benefit government-approved schools, and thus less than half of the existing schools in Sierra Leone.
141. The increase in pre-primary enrollment, however, may have been influenced by the fact that more pre-primary classrooms and teachers were made available during the 2014-2018 period. Given the very low numbers of pre-primary facilities at the beginning of this period, adding 50 equipped and staffed classrooms constituted a notable improvement in the local context that is likely to have contributed to the increase in enrollment rates.
142. Table 5.1 summarizes the evaluation’s reflections on the extent to which system-level changes (or the absence of such changes) achieved during the period under review (see section 4) are likely to have affected the noted impact-level trends described in this chapter. Please note that the absence of such linkages largely reflects the fact that the evaluation focused on the relatively short time period 2014-2017 and that in most cases it would be unrealistic to expect that education system improvements achieved during that period would already be reflected in learning outcomes or equity-related indicators. The table also comments on additional factors that may have influenced the observed changes or lack thereof.
Table 5.1 Link between system-level improvements and impact-level change (or lack thereof)
IMPACT-LEVEL TRENDS LIKELY RELATION TO ANY SYSTEM-LEVEL IMPROVEMENTS
Modest improvement in pre-primary enrollment
Plausible link to any system-level improvements. Improvements likely due to the dedicated push to strengthen pre-primary education systems in the country, including policies, curricula, teacher training, school availability, etc. It is too early for some of these effects to be fully reflected in access and learning outcomes, but newly built schools are already being used as classrooms.
Modest improvement in learning outcomes
No clear relationship to any system-level improvements made during 2014-2017 period. It is too early for the TSC launch or curriculum reforms to have had an impact at this level. PTR (Pupil Teacher Ratio) and Pupil Qualified Teacher Ratio (PQTR) have not improved in recent years. Monitoring visits to schools happen more frequently than in the past but still less than once yearly and only take place in government-approved schools. This makes it unlikely that visits have had a significant influence on improving the quality of teaching and, in consequence, affect learning outcomes. The interventions listed below were carried out during the 2014-2017 period. While they are relevant to improving the learning environment, they have not (yet) amounted to system-level changes, and there is so far no rigorous evidence to link them to the noted improvements in learning outcomes. • various teacher training measures conducted by various actors, often in an
uncoordinated manner • a national reading campaign and the associated distribution of early grade
readers;
228 This ‘time lag’ between system level change and likely effects on learning outcomes also applies to those parts of the education system that have not improved during the 2014-2017 period. For example, while pupil-teacher and pupil-qualified teacher ratios have worsened since 2012, student learning outcomes, as described above, modestly improved during the review period.
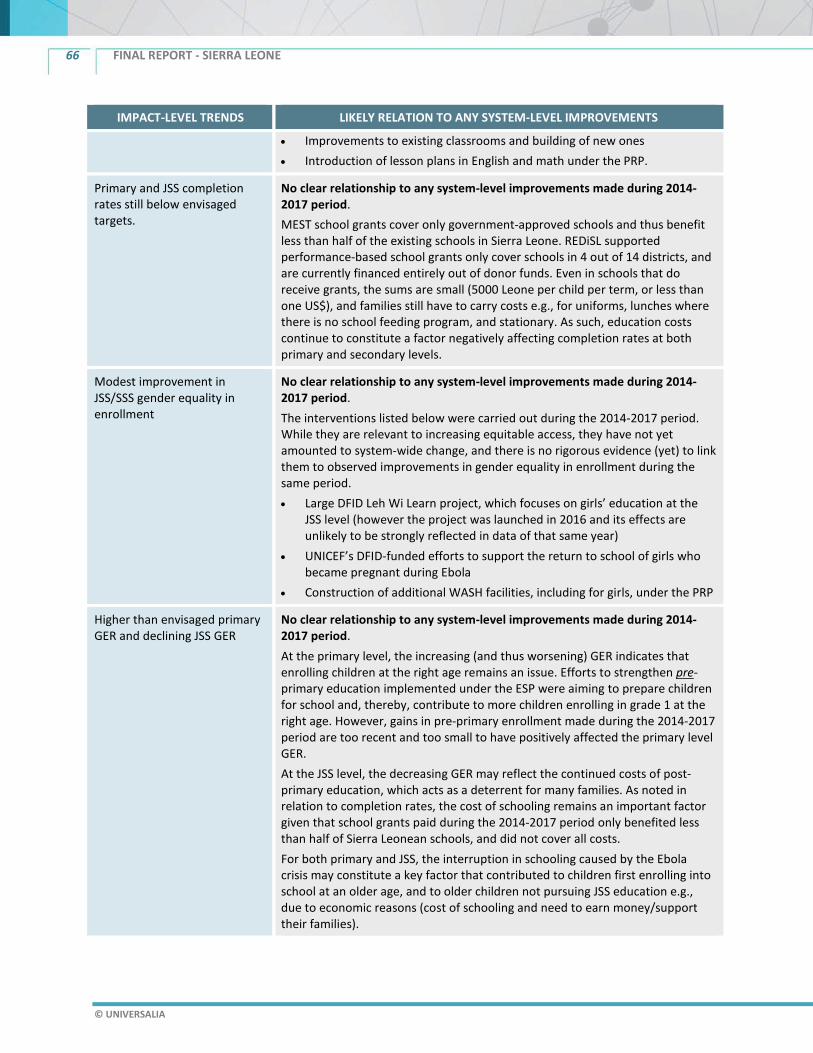
66 FINAL REPORT - SIERRA LEONE
© UNIVERSALIA
IMPACT-LEVEL TRENDS LIKELY RELATION TO ANY SYSTEM-LEVEL IMPROVEMENTS
• Improvements to existing classrooms and building of new ones • Introduction of lesson plans in English and math under the PRP.
Primary and JSS completion rates still below envisaged targets.
No clear relationship to any system-level improvements made during 2014-2017 period. MEST school grants cover only government-approved schools and thus benefit less than half of the existing schools in Sierra Leone. REDiSL supported performance-based school grants only cover schools in 4 out of 14 districts, and are currently financed entirely out of donor funds. Even in schools that do receive grants, the sums are small (5000 Leone per child per term, or less than one US$), and families still have to carry costs e.g., for uniforms, lunches where there is no school feeding program, and stationary. As such, education costs continue to constitute a factor negatively affecting completion rates at both primary and secondary levels.
Modest improvement in JSS/SSS gender equality in enrollment
No clear relationship to any system-level improvements made during 2014-2017 period. The interventions listed below were carried out during the 2014-2017 period. While they are relevant to increasing equitable access, they have not yet amounted to system-wide change, and there is no rigorous evidence (yet) to link them to observed improvements in gender equality in enrollment during the same period. • Large DFID Leh Wi Learn project, which focuses on girls’ education at the
JSS level (however the project was launched in 2016 and its effects are unlikely to be strongly reflected in data of that same year)
• UNICEF’s DFID-funded efforts to support the return to school of girls who became pregnant during Ebola
• Construction of additional WASH facilities, including for girls, under the PRP
Higher than envisaged primary GER and declining JSS GER
No clear relationship to any system-level improvements made during 2014-2017 period. At the primary level, the increasing (and thus worsening) GER indicates that enrolling children at the right age remains an issue. Efforts to strengthen pre-primary education implemented under the ESP were aiming to prepare children for school and, thereby, contribute to more children enrolling in grade 1 at the right age. However, gains in pre-primary enrollment made during the 2014-2017 period are too recent and too small to have positively affected the primary level GER. At the JSS level, the decreasing GER may reflect the continued costs of post-primary education, which acts as a deterrent for many families. As noted in relation to completion rates, the cost of schooling remains an important factor given that school grants paid during the 2014-2017 period only benefited less than half of Sierra Leonean schools, and did not cover all costs. For both primary and JSS, the interruption in schooling caused by the Ebola crisis may constitute a key factor that contributed to children first enrolling into school at an older age, and to older children not pursuing JSS education e.g., due to economic reasons (cost of schooling and need to earn money/support their families).

FINAL REPORT - SIERRA LEONE 67
© UNIVERSALIA
IMPACT-LEVEL TRENDS LIKELY RELATION TO ANY SYSTEM-LEVEL IMPROVEMENTS
Increasing percentage of out-of-school children229
No clear relationship to any system-level improvements made during 2014-2017 period. None of the system-level changes observed during the review period specifically aimed at, or was particularly suited to, reducing the number of out-of-school children. Although the DFID-funded Girls Access to Education project, implemented by MEST with UNICEF, supported the return of 17,991 children to school post-Ebola (including 14,500 pregnant teenage girls), this temporary intervention has not transformed the ability of the general education system to lastingly reduce the out-of-school rate. Similarly, the government-led school feeding program introduced during the review period was not endowed with sufficient resources to lastingly provide five meals a week to all students. Finally, though some infrastructure improvements were made to schools (e.g., WASH facilities in 95 schools), only 45 percent of schools met physical structure minimum standards in 2016 (latest data).
Unclear situation for children with special needs
No clear relationship to any system-level improvements made during 2014-2017 period. The development of a (draft) Inclusive Education Policy constitutes a promising foundation for identifying and systematically addressing the needs of learners with special needs in Sierra Leone. Implementation of the policy is due to start in 2018.
229 As noted earlier, available data only go to 2015. It is therefore not clear, if the noted increase constituted only a temporary spike due to the Ebola crisis, or an ongoing trend.

68 FINAL REPORT - SIERRA LEONE
© UNIVERSALIA
6 Conclusions 143. This final section of the report draws overall conclusions deriving from the evaluation findings.
144. The summative country-level evaluation set out to assess (i) GPE contributions to strengthening education systems and, ultimately, the achievement of education results in GPE partner developing countries in the areas of learning, equity, equality and inclusion; and hence (ii) the relevance, efficiency and effectiveness of GPE’s theory of change and country-level operational model. The following conclusions are structured accordingly.
Contributions to results and validity of the GPE country-level theory of change 145. Figure 6.1 below presents a simplified version of the country-level theory of change, which provides a visual overview of key evaluation findings in relation to GPE contributions and the validity of the GPE country-level theory of change in Sierra Leone. In the graphic, the items labeled A-F indicate the contribution claims that logically link the different elements in the TOC to each other. Color rating indicates the extent to which available evidence supports (green), partly supports (amber), or does not support (red) the respective contribution claim. Items in grey indicate insufficient data to make an assessment. Full definitions of color ratings are provided in Appendix VII. The elements depicted are further described below.
Figure 6.1 Assessment of contribution claims in the country-level theory of change for Sierra Leone
GPE contributions to sector planning, dialogue and monitoring, and sector plan implementation

FINAL REPORT - SIERRA LEONE 69
© UNIVERSALIA
146. Data deriving from the evaluation’s various lines of inquiry support contribution claim A in figure 6.1 related to GPE influence on sector planning,230 and partly support contribution claim B related to mutual accountability.231 While there has been progress towards the envisaged results of strengthening sector dialogue and monitoring, important areas for improvement remain regarding the composition of the EDP and the quality and of education sector reviews.
147. For both contribution claims A and B, GPE appears to have positively influenced government capacity232 for sector planning in all three dimensions of motivation (primarily by providing an incentive in the form of ESPIG funding requirements, and, to a lesser extent, through advocacy), opportunity (by funding sector planning and monitoring activities through the ESPDG and ESPIG) and capabilities (by sharing guidelines and providing technical assistance).
148. Additional factors such as financial and technical support from other development partners and existing planning capacity within MEST also contributed to the observed characteristics of sector planning, but do not suffice to explain them. The main additional factors that affected sector dialogue and monitoring was the Ebola crisis, which, while leading to more frequent collaboration among sector partners, also led to disagreements over the continued relevance of the originally developed ESP.
149. GPE has made limited contributions to education sector financing (contribution claim C). It has made no notable contributions to the quality of international financing, but it has made contributions to the quantity of international financing by leveraging initial (but interrupted) co-funding from DFID and follow-on funding by the World Bank. Domestically, GPE has contributed to keeping the need to increase education sector financing to or towards 20% of national expenditures on the agenda, but there is not enough evidence to link its influence directly to actual domestic education sector allocations (which are forecast to increase steadily in nominal amounts between 2016 and 2020, and to remain stable as a share of total, non-debt-related, public expenditures).
150. There is only moderate support for the underlying assumption that GPE had sufficient leverage in Sierra Leone to influence the amount of and the quality of domestic and international education sector financing. Available evidence provides weak support for the underlying assumption that external (contextual) factors were favorable and permitted national and international actors to increase/improve the quality of education sector financing.233 Additional factors beyond GPE support that positively affected sector financing are the decisions of other donors, especially DFID and the EU, to invest
230 Out of five assumptions underlying this contribution claim, the likelihood of them applying in the Sierra Leone context was rated ‘strong’ for four, and ‘moderate’ for one assumption 231 Out of four underlying assumptions, the likelihood of them applying in the Sierra Leone context was rated ‘strong’ for two and moderate for the other two. 232 In this report we understand ‘capacity’ as deriving from the combination of motivation (including incentives), opportunity (factors outside of individuals, including resources, conducive environment), and capability (individual and collective knowledge and skills). Change occurs when existing or emerging capacity affects the behaviour of the targeted actors, organizations, or institutions. 233 The other of the two underlying assumptions for this contribution claim was that external (contextual) factors permit national and international actors to increase/improve the quality of education sector financing. Based on the available evidence, the application of both assumptions was rated as ‘weak’ in the Sierra Leone context. As shown in the adapted country level theory of change (Appendix II), influencing domestic and international education sector financing was not anticipated to be solely the responsibility of GPE, but also of other actors at global and national levels. However, the agreed upon contribution claim that was tested in this evaluation focused on GPE’s influence.

70 FINAL REPORT - SIERRA LEONE
© UNIVERSALIA
substantially in Sierra Leone’s basic education sector. The main factors that negatively affected sector financing were the domestic economic downturn caused by the Ebola crisis and the decline of iron ore prices, as well as evolving donor priorities.
151. Finally, evidence deriving from the evaluation’s various lines of enquiry partially supports contribution claim D related to GPE supporting the successful implementation of the ESP.234 GPE financial and non-financial support contributed to strengthening elements of in-country capacity for sector plan implementation by enhancing related opportunity and capabilities through ESPIG funding and technical expertise provided especially through the grant agent. However, overall ESP implementation was negatively affected by a variety of additional factors beyond GPE’s influence or control, first and foremost the EVD crisis, but also remaining gaps in MEST capacity.
Cross-cutting observations 235
Roles played by country-level partners and the Secretariat
152. The government of Sierra Leone, in particular through MEST, provided leadership throughout the phases of the policy cycle, including for stakeholder participation in sector planning, dialogue and monitoring. MEST’s ability to effectively lead implementation of the 2014-2018 ESP was negatively affected by the severe challenges posed by the EVD crisis, and by internal capacity gaps, as many key positions in MEST remain unoccupied.
153. Education sector stakeholders, through their participation in the LEG, provided input to and appraised the draft education sector plans 2014-2018 and 2018-2020, and provided inputs to GPE grant applications and ESPIG program development. LEG members further participated in joint sector reviews and collaborated through various working groups to organize education activities during the EVD crisis.
154. UNICEF as the coordinating agency during the period under review played a valued role in co-facilitating sector dialogue and communication among development partners, and in supporting the MEST’s leadership. Donor partners’ decisions to rotate the role of the coordinating agency on an annual basis over the coming years (as UNICEF will now be grant agent) represents an innovation for Sierra Leone which remains to be tested.
155. The World Bank successfully fulfilled the role of GPE grant agent for the 2014-2017 ESPIG and was able to implement most elements of the REDiSL project despite the significant challenges posed by the EVD crisis. In at least one case, its role as grant agent was aided by the fact that the World Bank also provides general budget support to Sierra Leone, as it allowed the WB to make release of these funds contingent on progress towards an important ESP milestone.
156. All in-country stakeholders valued the technical assistance and quality assurance provided by the Secretariat primarily in relation to navigating GPE grant application processes and related timelines and requirements. This included ongoing advocacy by the Sierra Leone country lead to remind in-country stakeholders of GPE requirements related to inclusive and participatory sector planning and monitoring.
234 For this contribution claims, application was found to be ‘moderate’ for five out of six underlying assumptions, with the remaining one assumption rated ‘weak’. See Annex I. 235 I.e., observations relevant to all of sector planning, dialogue and monitoring, sector financing and ESP implementation.

FINAL REPORT - SIERRA LEONE 71
© UNIVERSALIA
Other observations on the (perceived) relevance and quality of GPE support to Sierra Leone
157. Among national and international stakeholders in Sierra Leone, GPE is primarily perceived as a donor, albeit one who has no permanent country presence but works through development partners on the ground. 236 When referring to GPE, stakeholders usually mean the Secretariat in its role as a grant-making entity. ESPIG funding requirements have provided important incentives that are likely to have furthered progress towards country-level objectives related to sector planning and mutual accountability through the LEG.
158. In Sierra Leone, the evaluation found no major issues in relation to the clarity of GPE funding and reporting requirements, which most national and international stakeholders described as demanding but reasonable overall. It has, however, been difficult for MEST staff to facilitate the various rounds of detailed revisions required for GPE ESPIG proposals given existing staff shortages and the fact that key MEST staff is already overstretched.
159. Other than the recipient civil society coalition, stakeholders did not mention CSEF or GRA grants, and in most cases, did not seem aware of them. It was noticeable that country-specific information on these grants was difficult to find, as available GRA grant documentation in particular was not specific about country-level activities.
Education system level change 160. During the period under review, Sierra Leone made some limited and fragmented progress towards strengthening various elements of its education system. In several cases, observed improvements have not yet been widely implemented (e.g., development of new curricula for basic education and ECE; development/drafting of policies such as for inclusive education) or are not yet fully functioning (Teaching Service Commission). Nevertheless, they constitute promising foundations of systems change with the potential to enable broader improvements in future. Whether these achievements will positively affect student learning and equity in the longer term will depend on when and how comprehensively they are implemented, and the extent to which MEST is able to pull individual improvements together into coherent reform.
161. The evaluation found that available evidence partly supports the assumed link between ESP implementation and education system strengthening.237 This is based on the pragmatic observation that most of the tangible system-level improvements achieved during the review period had been put on the agenda under the 2014-2018 ESP and had been addressed through specific, targeted interventions as part of ESP implementation, including efforts of the GPE co-funded REDiSL project.
236 One indication of this is the fact that in 2017 all major development partners in Sierra Leone applied for the role of GPE grant agent. Representatives from two organizations frankly stated that being the grant agent means funding that allows the respective agency to work. 237 Out of the four assumptions underlying this contribution claim, three were rated to apply to a ‘moderate’ and one to a ‘weak’ extent.

72 FINAL REPORT - SIERRA LEONE
© UNIVERSALIA
Impact level change 162. There is at this time insufficient evidence to prove or disprove the validity of the GPE’s theory of change in relation to the assumed links between a stronger education system and impact-level changes in learning outcomes, equity, gender equality and inclusion. This is largely due to the relatively short and recent timeframe that the evaluation was able to focus on in detail, and the fact that system-level improvements require considerable time to effect change at the level of learning outcomes, equity, equality or inclusion. 238
238 One assumption related to this contribution claim (availability of data) was rated as weak, whilst the other (system changes affect learning/equity outcomes) were not rated for lack of evidence. This lack of evidence for validating this step in the GPE theory of change is not the same as disproving the ToC. It merely illustrates the difficulty of establishing clear cause and effect relationships when reviewing a relatively short period of time, given that impact-level change likely derives from longer-term processes.

FINAL REPORT - SIERRA LEONE 73
© UNIVERSALIA
Appendix I Evaluation Matrix
MAIN EVALUATION QUESTIONS AND SUB- QUESTIONS
INDICATORS MAIN SOURCES OF INFORMATION
ANALYSIS
Key question I: Has GPE support to [country] contributed to achieving country-level objectives related to sector planning, sector plan implementation, sector dialogue and monitoring, and more/better financing for education?239 If so, then how?
CEQ 1: Has GPE contributed to education sector planning and sector plan implementation in [country] during the period under review? 240 How?
CEQ 1.1 What have been strengths and weaknesses of education sector planning during the period under review?
• Extent to which the country’s most recent sector plan meets GPE/UNESCO IIEP appraisal criteria.241
− Plan preparation process has been country-led, participatory, and transparent
− Plan constitutes a solid corpus of strategies and actions addressing the key challenges of the education sector
− Issues of equity, efficiency, and learning are soundly addressed to increase sector performance
− There is consistency between different components of the sector plan
− Financing, implementation and monitoring arrangements offer a good perspective for achievement
• Current and past sector plans (including from period prior to country joining GPE if available)
• GPE ESP/TSP quality assurance documents
• JSR reports • Other relevant reports or
reviews that comment on the quality of previous sector plans
• Interviews
• Pre-post analysis (where data on previous policy cycles is available)
• Triangulation of data deriving from document review and interviews
239 OECD DAC evaluation criteria of relevance, effectiveness, and efficiency. 240 The core period under review varies for summative and prospective evaluations. Prospective evaluations will primarily focus on the period early 2018 to early 2020 and will relate observations of change back to the baseline established at this point. The summative evaluations will focus on the period covered by the most recent ESPIG implemented in the respective country. However, for selected indicators (and subject to data availability) the summative evaluations will look back up to five years prior to the country becoming a GPE member to conduct a trend analysis of relevant data. 241 Global Partnership for education, UNESCO International Institute for Educational Planning. Guidelines for Education Sector Plan Appraisal. Washington and Paris. 2015. Available at: file:///C:/Users/anett/AppData/Local/Packages/Microsoft.MicrosoftEdge_8wekyb3d8bbwe/TempState/Downloads/2015-06-gpe-iiep-guidelines-education-sector-plan-appraisal.pdf

74 FINAL REPORT - SIERRA LEONE
© UNIVERSALIA
MAIN EVALUATION QUESTIONS AND SUB- QUESTIONS
INDICATORS MAIN SOURCES OF INFORMATION
ANALYSIS
• Extent to which previous sector plans met current GPE or other (e.g., country specific) quality standards (if and where data is available)
• Stakeholder views on strengths and weaknesses of (most recent and previous) sector planning processes in terms of:
− Leadership for and inclusiveness of sector plan preparation
− Relevance and coherence of the sector plan − Adequacy of sector plan in addressing equity, efficiency
and learning issues − Timeliness of plan preparation processes
CEQ 1.2 What have been strengths and weaknesses of sector plan implementation during the period under review?
• Progress made towards implementing sector plan objectives/meeting implementation targets of current/most recent sector plan. (If data is available: compared to progress made on implementing previous sector plan)
• Extent to which sector plan implementation is fully funded (current/most recent plan compared to earlier sector plan if data is available)
• Stakeholder views on timeliness, effectiveness and efficiency of sector plan implementation, and on changes therein compared to earlier policy cycles, due to:
− Extent to which plans are coherent and realistic − Implementation capacity and management − Funding − Other (context-specific)
• Current and past sector plans (including from period prior to country joining GPE if available)
• DCP government ESP/TSP implementation documents including mid-term or final reviews
• Relevant program or sector evaluations, including reviews preceding the period of GPE support under review
• JSR reports • Reports or studies on
ESP/TSP commissioned by other development partners and/or the DCP government
• CSO reports • Interviews
• Pre-post analysis (where data on previous policy cycles is available)
• Triangulation of data deriving from document review and interviews

FINAL REPORT - SIERRA LEONE 75
© UNIVERSALIA
MAIN EVALUATION QUESTIONS AND SUB- QUESTIONS
INDICATORS MAIN SOURCES OF INFORMATION
ANALYSIS
CEQ 1.3 Has GPE contributed to the observed characteristics of sector planning? How? a) Through the GPE ESPDG
grant- (funding, funding requirements)
b) Through other support (technical assistance, advocacy, standards, quality assurance procedures, guidelines, capacity building, facilitation, CSEF and ASA grants, and cross-national sharing of evidence/good practice )242
a) Contributions through GPE ESPDG grant and related funding requirements:
• ESPDG amount as a share of total resources invested into sector plan preparation. Evidence of GPE ESPDG grant addressing gaps/needs or priorities identified by the DCP government and/or LEG
b) Contributions through other (non ESPDG-related) support:
• Support directed at priority needs/gaps identified by the DCP government and/or LEG
• Support adapted to meet the technical and cultural requirements of the specific context in [country]
• Support aimed at strengthening sustainable local/national capacities for sector planning or plan implementation
• Stakeholder views on relevance and appropriateness of GPE technical assistance, advocacy, standards, guidelines, capacity building, facilitation, CSEF and ASA grants, and knowledge exchange in relation to:
− Addressing existing needs/priorities − Respecting characteristics of the national context − Adding value to country-driven processes (e.g., quality
assurance provided by Secretariat)
• ESP implementation data including joint sector reviews
• GPE grant agent reports and other grant performance data
• Secretariat reports, e.g., country lead back to office/mission reports
• GPE ESP/TSP quality assurance documents
• Other documents on technical assistance/advocacy
• Country-specific grant applications
• Interviews • Education sector analyses • Country’s poverty reduction
strategy paper
• Triangulation of data deriving from document review and interviews
• Where applicable: Comparison of progress made towards ESPIG grant objectives linked to specific performance targets with those without targets (variable tranche)
CEQ 1.4 Has GPE contributed to the observed characteristics of sector plan implementation?
a) Contributions through GPE EPDG and ESPIG grants, related funding requirements and variable tranche (where applicable)
• ESP implementation data including joint sector reviews
• Triangulation of data deriving from document review
242 Technical assistance and facilitation provided primarily through the Secretariat, the grant agent and coordinating agency. Advocacy can include inputs from Secretariat, grant agent, coordinating agency, LEG, and GPE at global level (e.g., Board meetings, agreed upon standards). Knowledge exchange includes cross-national/global activities related to the diffusion of evidence and best practice to improve sector planning and implementation.

76 FINAL REPORT - SIERRA LEONE
© UNIVERSALIA
MAIN EVALUATION QUESTIONS AND SUB- QUESTIONS
INDICATORS MAIN SOURCES OF INFORMATION
ANALYSIS
How? a) Through GPE EPDG, ESPIG
grants-related funding requirements and the variable tranche243
b) Through non-financial support (technical assistance, advocacy, standards, quality assurance procedures, guidelines, capacity building, and facilitation, and cross-national sharing of evidence/good practice)244
• Absolute amount of GPE disbursement and GPE disbursement as a share of total aid to education
• Maximum allocation amounts and actual amount a country received from GPE through the fixed and/or the variable tranche and reasons for not receiving the total MCA;
• Evidence of GPE grants addressing gaps/needs or priorities identified by the DCP government and/or LEG.
• Progress made towards targets outlined in GPE grant agreements as triggers for variable tranche, compared to progress made in areas without specific targets (where applicable)
• Proportion of overall sector plan funded through GPE ESPIG
• Proportion of textbook purchases planned under current/most recent sector plan funded through GPE grant
• Proportion of teachers trained under current/most recent sector plan funded through GPE grant
• Proportion of classrooms built under current/most recent sector plan funded through GPE grant
• Progress made towards objectives/targets outlined in GPE grant agreement (where applicable: compare progress made in areas with specific targets as triggers for release of variable tranche compared to progress made in areas without specific targets)
• GPE grant agent reports and other grant performance data
• Secretariat reports, e.g., country lead back to office/mission reports
• GPE ESP/TSP quality assurance documents
• Other documents on technical assistance/advocacy
• Country-specific grant applications
• Interviews • Education sector analyses • Country’s poverty reduction
strategy paper
and interviews • Where applicable:
Comparison of progress made towards ESPIG grant objectives linked to specific performance targets with those without targets (variable tranche)
243 Where applicable. 244 Technical assistance and facilitation provided primarily through the Secretariat, the grant agent and coordinating agency. Advocacy – including inputs from Secretariat, grant agent, coordinating agency, LEG, and GPE at global level (e.g., Board meetings, agreed upon standards). Knowledge exchange - including cross-national/global activities related to the diffusion of evidence and best practice to improve sector planning and implementation.

FINAL REPORT - SIERRA LEONE 77
© UNIVERSALIA
MAIN EVALUATION QUESTIONS AND SUB- QUESTIONS
INDICATORS MAIN SOURCES OF INFORMATION
ANALYSIS
• Timeliness of implementation of GPE grants (Education
Sector Plan Development Grant, Program Development Grant, Education Sector Plan Implementation Grant)
• Grant implementation is on budget b) Contributions through non-financial support • GPE support aimed at strengthening sustainable
local/national capacities for plan implementation • Stakeholder views on relevance and appropriateness of
GPE non-financial support in relation to: − Addressing existing needs/priorities − Respecting characteristics of the national context − Adding value to country-driven processes (e.g., quality
assurance provided by Secretariat)
CEQ 1.5 Has GPE contributed to leveraging additional education sector financing and improving the quality of financing? a) Leveraging of additional
finance from the government?
b) Leveraging of additional finance from other partners through the GPE multiplier funding mechanisms (where applicable)?
c) Leveraging of additional finance from other partners through means other than the multiplier funding mechanism?
a) Leveraging additional finance from government • Changes in country’s public expenditures on education
during period under review (by sub-sector if available) b) Leveraging additional finance through multiplier funding • Extent to which country has achieved, maintained or
exceeded 20% of public expenditures on education during period under review
• Amount received through the GPE multiplier fund (if applicable).
c) Leveraging additional finance through other means • Amounts and sources of domestic resources mobilized
through GPE advocacy efforts (b and c): • Changes in relative size of GPE financial contribution in
relation to other donor’ contributions
• Interviews with national actors (e.g., Ministry of Finance, Ministry of Education, Local Education Groups/ Development partner groups)
• GPE data (e.g., grant documents, country commitments and disbursements, donor pledges and contributions)
• Creditor Reporting System (CRS) by OECD-DAC
• UIS data by UNESCO • National data (e.g.,
Education Management Information
• Trend analysis for period under review
• Comparative analysis (GPE versus other donor contributions)
• Triangulation of quantitative analysis with interview data

78 FINAL REPORT - SIERRA LEONE
© UNIVERSALIA
MAIN EVALUATION QUESTIONS AND SUB- QUESTIONS
INDICATORS MAIN SOURCES OF INFORMATION
ANALYSIS
d) Improvements in the quality of education finance (e.g., short, medium and long-term predictability, alignment with government systems)?
• Trends in external and domestic financing channeled through and outside of GPE, and for basic and total education, to account for any substitution by donors or the country government
• Changes in donor aid to country; Extent to which GPE Program Implementation Grant-supported programs have been co-financed by other actors or are part of pooled funding mechanisms; Amounts and sources of non-traditional financing (e.g., private or innovative finance) that can be linked to GPE leveraging
d) Quality of education finance • Alignment of GPE education sector program
implementation grants with GPE’s system alignment criteria (including the 10 elements of alignment and the elements of harmonization captured by RF indicators 29, 30 respectively)
• Possible reasons for non-alignment or non-harmonization (if applicable)
• Systems, school censuses and surveys, National Education Accounts, Joint Sector Reviews, public expenditure reviews)
CEQ 2 Has GPE contributed to strengthening mutual accountability for the education sector during the period under review? If so, then how?
CEQ 2.1 Has sector dialogue changed during the period under review?
• Composition of the country’s LEG (in particular civil society and teacher association representation), and changes in this composition during period under review
• Frequency of LEG meetings, and changes in frequency during period under review
• Stakeholder views on changes in sector dialogue in terms of:
− Inclusiveness − Frequency, consistency, clarity of roles and
responsibilities − Relevance (i.e., perceptions on whether stakeholder
input is taken into account for decision making) − Quality (evidence-based, transparent)
• LEG meeting notes • Joint sector reviews or
equivalents from before and during most recent ESPIG period
• GPE sector review assessments
• ESP/TSP, and documents illustrating process of their development
• Back to office reports/memos from Secretariat
• Pre-post comparison
• Triangulate results of document review and interviews
• Stakeholder analysis and mapping

FINAL REPORT - SIERRA LEONE 79
© UNIVERSALIA
MAIN EVALUATION QUESTIONS AND SUB- QUESTIONS
INDICATORS MAIN SOURCES OF INFORMATION
ANALYSIS
• Interviews
CEQ 2.2 Has sector monitoring changed?
• Frequency of joint sector reviews conducted, and changes in frequency during period under review
• Extent to which joint sector reviews conducted during period of most recent ESPIG met GPE quality standards (if data is available: compared to JRSs conducted prior to this period)
• Evidence deriving from JSRs is reflected in DCP government decisions (e.g., adjustments to sector plan implementation) and sector planning
• Measures in the current sector plan to strengthen sector monitoring (especially monitoring the quality of teaching and learning, equity, equality and inclusion) are implemented
• Stakeholder views on changes in JSRs in terms of them being:
− Inclusive and participatory − Aligned to existing sector plan and/or policy framework − Evidence based − Used for learning/informing decision-making − Embedded in the policy cycle (timing of JSR appropriate
to inform decision making; processes in place to follow up on JRS recommendations)245
• Stakeholder views on extent to which current practices of sector dialogue and monitoring amount to ‘mutual accountability’ for the education sector.
• LEG meeting notes • Joint sector reviews or
equivalents from before and during most recent ESPIG period
• GPE sector review assessments
• Grant agent reports • Back to office
reports/memos from Secretariat
• Interviews
• Pre-post comparison
• Triangulate the results of document review and interviews
245 Criteria adapted from: Global Partnership for Education. Effective Joint Sector Reviews as (Mutual) Accountability Platforms. GPE Working Paper #1. Washington. June 2017. Available at: https://www.globalpartnership.org/blog/helping-partners-make-best-use-joint-sector-reviews

80 FINAL REPORT - SIERRA LEONE
© UNIVERSALIA
MAIN EVALUATION QUESTIONS AND SUB- QUESTIONS
INDICATORS MAIN SOURCES OF INFORMATION
ANALYSIS
CEQ 2.3 Has GPE contributed to observed changes in sector dialogue and monitoring? How? a) Through GPE grants and
funding requirements
b) Through other support246
a) Grants and funding requirements • Proportion of EMIS-related improvements outlined
current/most recent sector plan funded through GPE grant
b) Non-grant related support • Support is targeted at issues identified as priorities by
DCP government and/or LEG • Support is adapted to meet the technical and cultural
requirements of the specific context in [country] • Support is aimed at strengthening local/national
capacities for conducting inclusive and evidence-based sector dialogue and monitoring
a) and b) • Stakeholder view on relevance and appropriateness of
GPE grants and related funding requirements, and of technical assistance in relation to:
− Addressing existing needs/priorities − Respecting characteristics of the national context − Adding value to country-driven processes (e.g., around
JSRs)
• LEG meeting notes • Joint sector reviews or
equivalents from before and during most recent ESPIG period
• GPE sector review assessments
• Grant agent reports • Back to office
reports/memos from Secretariat
• Interviews
• Triangulate the results of document review and interviews
CEQ 3: Has GPE support had unintended/unplanned effects? What factors other than GPE support have contributed to observed changes in sector planning, sector plan implementation, sector financing and monitoring?
CEQ 3.1 What factors other than GPE support are likely to have contributed to the observed changes (or lack thereof) in sector
• Changes in nature and extent of financial/non-financial support to the education sector provided by development partners/donors (traditional/non-traditional donors including foundations)
• Documents illustrating changes in priorities pursued by (traditional/non-traditional) donors related implications
• Triangulate the results of document review and interviews
246 Technical assistance, advocacy, standards, quality assurance, guidelines, capacity building, facilitation, and cross-national sharing of evidence/good practice

FINAL REPORT - SIERRA LEONE 81
© UNIVERSALIA
MAIN EVALUATION QUESTIONS AND SUB- QUESTIONS
INDICATORS MAIN SOURCES OF INFORMATION
ANALYSIS
for [country]
plan development, sector financing and plan implementation, and in sector dialogue and monitoring?
• Contributions to sector planning, plan implementation, sector dialogue or monitoring made by actors other than GPE
• Changes/events in national or regional context(s) − Political context (e.g., changes in
government/leadership) − Economic context − Social/environmental contexts (e.g., natural disasters,
conflict, health crises) − Other (context-specific)
• Relevant studies/reports commissioned by other education sector actors (e.g., donors, multilateral agencies) regarding nature/changes in their contributions and related results
• Government and other (e.g., media) reports on changes in relevant national contexts and implications for the education sector
• Interviews
CEQ 3.2 During the period under review, have there been unintended, positive or negative, consequences of GPE financial and non-financial support?
• Types of unintended, positive and negative, effects on sector planning, sector financing, sector plan implementation, sector dialogue and monitoring deriving from GPE funding (grants)
• Types of unintended, positive and negative, effects deriving from other GPE support.
• All data sources outlined for CEQs 1 and 2 above
• Interviews
• Triangulate the results of document review and interviews
Key question II: Has the achievement of country-level objectives247 contributed to making the overall education system in [country] more effective and efficient?
CEQ 4 During the period under review, how has the education
a) Quality of teaching/instruction • Changes in pupil/trained teacher ratio during period
• Education Management Information System (EMIS)
• Pre-post comparison of
247 GPE country-level objectives related to sector planning, plan implementation, and mutual accountability through sector dialogue and monitoring

82 FINAL REPORT - SIERRA LEONE
© UNIVERSALIA
MAIN EVALUATION QUESTIONS AND SUB- QUESTIONS
INDICATORS MAIN SOURCES OF INFORMATION
ANALYSIS
system changed in relation to: a) Quality of
teaching/instruction b) Evidence-based, transparent
decision making248 c) Country-specific areas of
system strengthening for furthering equity and/or learning, and for ensuring effective and efficient use of resources.
under review • Changes in equitable allocation of teachers (measured
by relationship between number of teachers and number of pupils per school)
b) Evidence-based, transparent decision making • Changes in number of education indicators that country
reports to UIS during period under review • Changes in whether country has quality learning
assessment system within the basic education cycle during period under review
• Other, country-specific indicators illustrating changes in evidence-based, transparent data collection, reporting and decision making
c) Indicators for specific areas of education systems strengthening as outlined in the country’s current sector plan related to:
• Sector management (e.g., changes in ministerial, district and/or school level management structures, guidelines, staffing, financing, approaches to ensuring effective and efficient use of resources)
• Learning (appropriate and available education inputs, additional country-specific efforts to enhance the quality of teaching/instruction, e.g., through new/improved incentives for schools/teachers)
• Equity (removal of barriers to school participation for all learners; creating inclusive learning environments)
(a-c): Stakeholder perceptions of areas within the education system that have/have not changed during period under
• UIS data • World Bank data • Household survey data • ASER/UWEZO other citizen-
led surveys • Grant agent progress
reports • Implementing partner
progress reports • Mid-term Evaluation
reports • GPE annual Results Report • Appraisal Reports • Public expenditure reports • CSO reports • SABER database • Education financing studies • Literature on good practices
in education system domains addressed in country’s sector plan
• Interviews
statistical data for periods under review
• Triangulate the results of document review with statistical data, interviews and literature on ‘good practice’ in specific areas of systems strengthening
248 Sub-questions a) and b) reflect indicators under Strategic Goal #3 as outlined in the GPE results framework. Sub-questions c) explores additional, country-specific indicators for system-level change.

FINAL REPORT - SIERRA LEONE 83
© UNIVERSALIA
MAIN EVALUATION QUESTIONS AND SUB- QUESTIONS
INDICATORS MAIN SOURCES OF INFORMATION
ANALYSIS
review
CEQ 5 How have changes in sector planning, plan implementation, and mutual accountability contributed to observed changes at education system level?
• The specific measures put in place as part of sector plan implementation address previously identified bottlenecks at system level
• Alternative explanations for observed changes at system level (e.g., changes due to external factors, continuation of trend that was already present before current/most recent policy cycle, targeted efforts outside of the education sector plan)
• Stakeholder perceptions of reasons for observed changes
• Sources as shown for CEQ 4 • Literature on good practices
in education system domains addressed in country’s sector plan
• Education sector analyses • Country’s poverty reduction
strategy paper
Key question III: Have changes at education system level contributed to progress towards impact?
CEQ 6: During the period under review, what changes have occurred in relation to: a) Learning outcomes (basic
education)? b) Equity, gender equality and
inclusion in education?
a) Learning outcomes: • Changes in learning outcomes (basic education) during
period under review. • Changes in percentage of children under five (5) years of
age in COUNTRY who have been developmentally on track in terms of health, learning and psychosocial well-being. Or changes in other early childhood care and education measures from country-level surveys
b) Equity, gender equality, and inclusion: • Changes in proportion of children who complete (i)
primary, (ii) lower-secondary education • Changes in out of school rate for (i) primary, (ii) lower-
secondary education • Changes in the distribution of out of school children
(girls/boys; children with/without disability; ethnic, geographic and/or economic backgrounds)
• Education sector plan sets gender parity index/targets for (i) primary, (ii) lower-secondary education
• Extent to which these targets have been achieved • Stakeholder perceptions on extent of, and reasons for,
• Sector performance data available from GPE, UIS, DCP government and other reliable sources
• Teacher Development Information System (TDIS)
• Education Management Information System (EMIS)
• National examination data • International and regional
learning assessment data • EGRA/EGMA data • ASER/UWEZO other citizen-
led surveys • Grant agent and
Implementing partner progress reports
• Mid-term Evaluation reports
• Pre-post comparison of available education sector data during period under review
• Triangulation of statistical data with qualitative document analysis and interviews

84 FINAL REPORT - SIERRA LEONE
© UNIVERSALIA
MAIN EVALUATION QUESTIONS AND SUB- QUESTIONS
INDICATORS MAIN SOURCES OF INFORMATION
ANALYSIS
impact-level changes during period under review (a and b): Additional country-specific indicators as outlined in current sector plan and/or related monitoring framework
• GPE annual Results Report • Appraisal Reports • Interviews
CEQ 7 Is there evidence to link changes in learning outcomes, equity, gender equality, and inclusion to system-level changes identified under CEQ 4? What other factors can explain changes in learning outcomes, equity, etc.?
• Changes in country’s change trajectory related to learning outcomes, equity, gender equality, and inclusion during period under review
• Additional explanations for observed changes in learning outcomes, equity, gender equality, and inclusion other than system-level changes noted under CEQ 4 and 5
• Stakeholder perceptions on extent of, and reasons for, impact-level changes during period under review
• Studies/evaluation reports on education (sub)sector(s) in country commissioned by the DCP government or other development partners (where available)
• Literature on key factors affecting learning outcomes, equity, equality, and inclusion in comparable settings
• Interviews
• Pre-post comparison of available education sector data during period under review
• Triangulation of statistical data with qualitative document analysis and interviews
• Weigh supporting and refuting evidence of GPE contributions to sector outcomes during period of review

FINAL REPORT - SIERRA LEONE 85
© UNIVERSALIA
Appendix II GPE country-level theory of change for Sierra Leone for the review period
Knowledge and information exchange:
GPE promotes and facilitates cross-national sharing of evidence and good practice including through GRA 10 and GRA 11
Partnership strengthening:
GPE fosters clear roles, responsibilities, and accountabilities among stakeholders in policy dialogue and their collaboration in a coordinated, harmonized way to solve sector issues
Removal of barriers to 1.
Access, Equity and
Completion, 2. Quality and
Relevance of Education, 3.
Education System
Management
Improved and more equitable student learning
outcomes
Government produces and owns credible and evidence-based sector plan that addresses: Education access, equity and completion, quality and relevance of education, and systems strengthening.
Country implements and inclusively monitors credible evidence-based, nationally-owned sector plan and thereby ensures: 1. Improved access, equity and completion (1.1 all children enter school and complete primary education, 1.2 children aged 3-5 have increased access to pre-school; 1.3 increased completion level and
equitable access to junior secondary schools; 1.4 – 1.6 increased equitable access to senior secondary schools, technical and vocational schools, and higher education institutions; 1.7 improved adult and youth literacy.) 2.
Improved education quality and relevance (2.1 Improved learning environments; 2.2 revised curricula and student assessments; 2.3 improved student’ acquitsition of basic skills of reading and numeracy; 2.4 improved
quality of teachers, 2.5 equitable deployment of teachers nationwide), 3. Stronger and better managed education system (11 objectives including related to teacher recruitment, deployment, performance appraisal,
promotion and development)
Country produces and shares disaggregated data on equity, efficiency, and learning through quality EMIS and LAS
ESPDG (2012, US$ 250,000) and requirements
Improved equity, and
gender equality in education
GPE ESP standards and processes, quality assurance procedures, guidelines, capacity building and technical guidance
Country-specific contextual factors (negative: Ebola crisis, decline in iron ore prices negatively affecting economic context. Positive: political stability, support provided by other donors)
S.O. # 3
More and better international financing is mobilized for education (GPE RF Ind. 29, 30)
GPE promotes evidence-based and inclusive national sector monitoring and adaptive planning
S.O. # 4
GPE advocates and establishes mechanisms for increased, harmonized, and better aligned international financing for education
ESPIG funding and requirements (2014-2017: US$ 17.9 million)
PDG funding (2012: US$ 250K) and requirements
GPE quality assurance processes, guidelines, capacity building and technical guidance for ESPIG development/ implementation
Mutual accountability for education sector progress through inclusive sector policy dialogue and monitoring (Education Development Partner Group - EDP) & Education Donor Group (EDG)
S.O. # 2
1.1
2.1
2.3
S.O. # 1
1.2
3.2
3.1
4
2.8
2.4
CSEF I, II, III grants to EFA-SL coalition
2.2
2.5
2.6
Direction of change
1.3
1.4
2.7
S.O. # 5 S.O. # 5
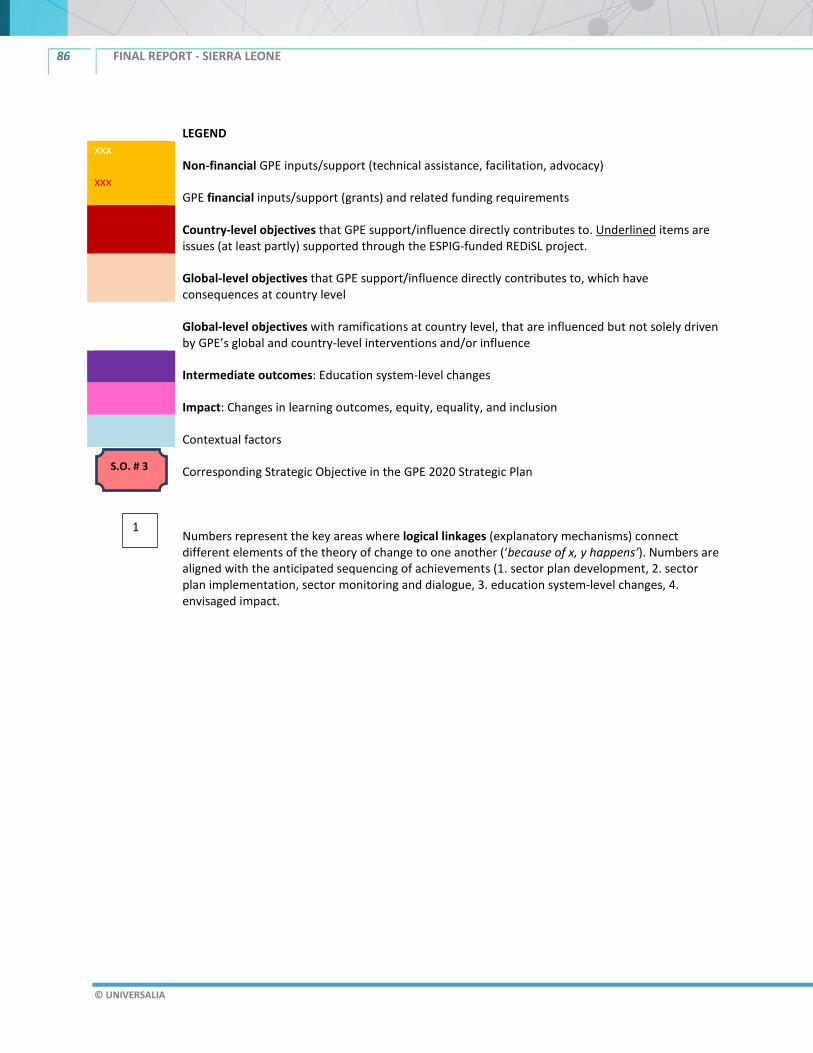
86 FINAL REPORT - SIERRA LEONE
© UNIVERSALIA
LEGEND xxx
Non-financial GPE inputs/support (technical assistance, facilitation, advocacy) xxx
GPE financial inputs/support (grants) and related funding requirements
Country-level objectives that GPE support/influence directly contributes to. Underlined items are issues (at least partly) supported through the ESPIG-funded REDiSL project.
Global-level objectives that GPE support/influence directly contributes to, which have consequences at country level
Global-level objectives with ramifications at country level, that are influenced but not solely driven by GPE’s global and country-level interventions and/or influence
Intermediate outcomes: Education system-level changes
Impact: Changes in learning outcomes, equity, equality, and inclusion
Contextual factors
Corresponding Strategic Objective in the GPE 2020 Strategic Plan
Numbers represent the key areas where logical linkages (explanatory mechanisms) connect different elements of the theory of change to one another (‘because of x, y happens’). Numbers are aligned with the anticipated sequencing of achievements (1. sector plan development, 2. sector plan implementation, sector monitoring and dialogue, 3. education system-level changes, 4. envisaged impact.
S.O. # 3
1

FINAL REPORT - SIERRA LEONE 87
© UNIVERSALIA
Table ii.1 Key explanatory mechanisms and underlying assumptions in the adapted country ToC for Sierra Leone
# EXPLANATORY MECHANISM CRITICAL UNDERLYING ASSUMPTIONS249 (IMPLICIT) CONTRIBUTION CLAIM
1 – GPE contributions to sector planning
1.1, 1.2, 1.3 and 1.4
BECAUSE (1) GPE provides Education Sector Plan Development Grants and guidance, quality assurance, capacity development and technical guidance, and (2) GPE promotes (at global and country levels) evidence-based and adaptive planning (3) promotes and facilitates cross-national sharing of evidence and good practice (4) Data on systems, equity, and learning generated through quality EMIS and LAS are fed back and used to inform sector planning – Sierra Leone government produces and owns credible and evidence-based sector plans focused on equity, efficiency, and learning.
Country level stakeholders (MEST, LEG members) have the capabilities (knowledge and skills), opportunities (resources, conductive external environment), and motivation (political will, incentives) to jointly and collaboratively improve sector analysis and planning.250 GPE has sufficient leverage within the country for GPE financial and non-financial support to influence sector planning, including LEG existence and functioning. EMIS and learning assessment and reporting systems (LAS) produce relevant and reliable data.
Contribution claim A: GPE (financial and non-financial) support and influence contribute to the development of government owned, credible and evidence-based sector plans focused on equity, efficiency and learning.
2 - GPE contributions to sector plan implementation, sector monitoring, and dialogue
2.1 BECAUSE (1) GPE provides CSEF grants, (2) GPE supports and promotes evidence-
GPE has sufficient leverage at global and country levels to positively influence LEG existence and functioning. Country level stakeholders (MEST, LEG members) have the
Contribution claim B: GPE (financial and non-financial) support for inclusive sector planning and joint
249 Critical assumptions are events and conditions necessary for the respective logical link (mechanism) to work. 250 Mayne (2017) suggests analyzing changes in individual or organizational ‘capacity’, as the foundation of behavioral and practice change, by exploring the three interrelated dimensions of capabilities, motivation, and opportunity. See: Mayne, John. The COM-B Theory of Change Model. Working paper. February 2017.

88 FINAL REPORT - SIERRA LEONE
© UNIVERSALIA
# EXPLANATORY MECHANISM CRITICAL UNDERLYING ASSUMPTIONS249 (IMPLICIT) CONTRIBUTION CLAIM
based and inclusive national sector monitoring and adaptive planning at global and country levels, and (3) GPE promotes and facilitates cross-national sharing of evidence and good practice, – there is mutual accountability for sector progress through inclusive sector policy dialogue and monitoring.
capabilities (knowledge and skills), opportunities (including resources), and motivation (including political will and incentives) to work together to solve education sector issues.
monitoring contribute to mutual accountability for education sector progress.
2.2 BECAUSE (1) GPE advocates for and establishes mechanisms for increased, harmonized, and better aligned international financing for education, and (2) GPE funding requirements include the promotion of improvements in domestic financing for education promotes – there is more and better financing for education is mobilized in the country.
GPE has sufficient leverage to influence the amount of and the quality of domestic and international education sector financing. External (contextual) factors permit national and international actors to increase/improve the quality of education sector financing.
Contribution claim C: GPE advocacy and funding requirements contribute to more and better financing for education in the country.
2.3, 2.4, 2.5, 2.6 2.7 and 2.8
BECAUSE – (1) GPE provides funding through PDGs and ESPIGS, (2) GPE provides quality assurance, processes, guidelines, capacity building and technical guidance for ESPIG development and implementation, (3) there is mutual accountability for education sector progress, (4) the country has developed a credible and evidence-based sector plan, (5) more and better domestic and
Relevant country-level actors have the technical capabilities, motivation (political will, incentives) and opportunity (funding, conducive environment) to implement all elements of the sector plan. Available domestic and international funding is sufficient in quantity and adequate in quality to implement all elements of the sector plan. Country-level development partners have the motivation and opportunity (e.g., directive from respective donor government) to align their own activities with the priorities of the sector plan and to work through the LEG as a consultative and advisory forum. Country-level stakeholders (MEST, LEG members) take part in regular, evidence-based joint sector reviews and apply
Contribution claim D: GPE (financial and non-financial) support and influence contribute to the effective and efficient implementation of sector plans.

FINAL REPORT - SIERRA LEONE 89
© UNIVERSALIA
# EXPLANATORY MECHANISM CRITICAL UNDERLYING ASSUMPTIONS249 (IMPLICIT) CONTRIBUTION CLAIM
international financing for education is available, (6) GPE promotes and facilitates cross-national sharing of evidence and good practice (including through GRA-supported projects) (7) Data on systems, equity, and learning generated through quality EMIS and LAS are fed back and used to inform sector plan implementation – Sierra Leone implements and monitors credible, evidence-based sector plans based on equity, efficiency and learning.
recommendations deriving from these reviews to enhance equitable and evidence-based sector plan implementation. The sector plan includes provisions for strengthening EMIS and LAS to produce timely, relevant and reliable data.
3. From country-level objectives to system-level change (intermediary outcome)
3.1 BECAUSE Sierra Leone implements and monitors realistic, evidence-based education sector plans based on equity, efficiency and learning – the education system becomes more effective and efficient towards delivering equitable quality educational services for all.
Education sector plan implementation leads to improvements of previous shortcomings in the education system including related to each of, as well as to the interaction between elements such as: Sector management • Effective and efficient use of available resources • Effective sector management at national, sub-national and
local/school levels • Evidence-based, transparent decision making – e.g.,
regularly conducted quality learning assessments, regularly collected data on EMIS, transparency and reporting of data, integrated and effective data systems to facilitate use
Learning: • Appropriate and available education inputs – e.g.,
curricula, textbooks and other teaching/learning materials, school infrastructure, lesson plans/teacher training tools, numbers and allocations of trained teachers, teachers
Contribution claim E: The implementation of realistic evidence based sector plans contributes to positive changes at the level of the overall education system.

90 FINAL REPORT - SIERRA LEONE
© UNIVERSALIA
# EXPLANATORY MECHANISM CRITICAL UNDERLYING ASSUMPTIONS249 (IMPLICIT) CONTRIBUTION CLAIM
trained in using existing curricula and related materials, incentives for teachers, teacher supervision
• Quality of teaching/instruction – e.g., instructional time, language of instruction, appropriate pedagogy (teaching at right level), teacher-learner relationship, effective school management
Equity: • Removal of barriers to school participation for all learners • Inclusive learning environment
3.2 BECAUSE (1) sector plan implementation includes provisions for strengthened EMIS and LAS, and (2) because GPE promotes and facilitates sharing of evidence and mutual accountability for education sector progress – country produces and shares disaggregated data on equity, efficiency, and learning.
There is sufficient national capacity (technical capabilities, political will, resources) or relevant technical assistance to analyze and report on available data and maintain EMIS and LAS. There are clearly delineated roles and responsibilities to produce data, report against data, and use data to monitor implementation.
4. From system-level change (intermediate outcomes) to impact
4 BECAUSE of improvements at the level of the overall education system, there are improved learning outcomes and improved equity, equality, and inclusion in education.
Changes in the education system positively affect learning outcomes and equity. Country-produced data on equity, efficiency and learning allow measuring/tracking these changes.
Contribution claim F: Education system-level improvements result in improved learning outcomes and in improved equity, gender equality, and inclusion in education.

FINAL REPORT - SIERRA LEONE 91
© UNIVERSALIA
Appendix III Evaluation methodology 163. The evaluation aims to assess the relevance, efficiency and effectiveness of GPE’s inputs at the country level and the validity of GPE’s theory of change to establish if and how GPE outputs and activities contribute to outcomes and impact.251 The guiding frameworks for the evaluation are the evaluation matrix (Appendix I) and the country-level theory of change for Sierra Leone (Appendix II).252
164. The overall approach to this evaluation is theory-based and uses contribution analysis (CA). CA is a theory-based approach to evaluation designed to identify the contribution a program or (series of) interventions is making to observed results through an increased understanding of why observed changes have occurred (or not occurred) and the roles played by the intervention and by other internal and external factors respectively.253.
165. The evaluation team chose contribution analysis as the main approach to this assignment as it is particularly useful in situations (i) where a program is not experimental, but has been implemented on the basis of a relatively clearly articulated theory of change; (ii) where the change processes in questions are complex rather than one-dimensional, i.e., where change is influenced due to a variety of inter-related factors as opposed to single policy interventions that could be isolated; (iii) where the change processes in question are highly context-specific. A report deriving from applying contribution analysis does not provide definite proof, but rather provides an evidence-based line of reasoning from which plausible conclusions can be drawn on the types and reasons for contributions made by the program/intervention in question. CA draws upon both quantitative and qualitative evidence to build the ‘contribution story’ for the program or intervention(s) under review
166. The process for this country evaluation involved four stages: (i) assessing the availability and quality of data, adapting the country-level theory of change and conducting a country-specific stakeholder mapping to determine priorities for consultations during the in-country site visit (see Appendix IV); (ii) in-country data collection during an eight-working day mission to Sierra Leone from January 10-19, 2018; (iii) assembling and assessing the GPE contribution story; and (iv) writing the evaluation report.
251 In the context of this assignment, the term ‘impact’ is aligned with the terminology used by GPE to refer changes in the areas of learning, equity, gender equality and inclusion (reflected in GPE Strategic Goals 1 and 2 described in the 2020 Strategic Plan). While examining progress towards impact in this sense, the country evaluations do not constitute formal impact evaluations, which usually entail counterfactual analysis based on randomized controlled trials. 252 This country-specific ToC was adapted from the generic country-level ToC that had been developed in the assignment Inception Report. 253 See, for example: Mayne, J. “Addressing Cause and Effect in Simple and Complex Settings through Contribution Analysis”. In Evaluating the Complex, R. Schwartz, K. Forss, and M. Marra (Eds.), Transaction Publishers, (2011).

92 FINAL REPORT - SIERRA LEONE
© UNIVERSALIA
167. Data collection and analysis were conducted by a team of two international and one national consultant. Methods of data collection included:
a. Document and literature review (see Appendix VI for a bibliography)
b. Stakeholder consultations through individual and group interviews in Sierra Leone. In addition, telephone interviews were conducted with the GPE Secretariat country focal point, and World Bank staff members currently based in Washington. Appendix V provides a list of consulted stakeholders. In total, the evaluation team interviewed 33 individuals (see Box iii.1), of which 10 were women.
c. Education sector performance data analysis, drawing upon publicly accessible information on learning outcomes, equity, gender equality and inclusion, and education financing.254
168. The evaluation team analyzed the available data using qualitative (descriptive, content, comparative) and quantitative techniques, thereby triangulating different data sources and methods of data collection.
169. The main limitations for the evaluation are outlined in Table iii.1, along with mitigation strategies.
Table iii.1 Methodological limitations of the evaluation, and corresponding mitigation strategies
LIMITATIONS MITIGATION STRATEGIES SUCCESS OF MITIGATION
Limited quality and availability of data. The evaluation team was not always able to find data on relevant questions, either because it did not exist, or because it was not accessible in a timely manner despite repeated requests. This includes both quantitative sector data and documents.
The evaluation team searched for and requested additional data from various stakeholders, and sourced information across documents. Missing quantitative data was supplemented by qualitative assessments.
Weak to moderate: mitigating measures were not able to
254 The key sources of data are the UNESCO Institute for Statistics (UIS) database, data.uis.unesco.org; the Organisation for Economic Co-Operation and Development (OECD) Creditor Reporting System (CRS), https://stats.oecd.org/Index.aspx?DataSetCode=CRS1; and country-level datasets and data sources.
Box iii.1: Consulted Stakeholders
Ministry of Education, Science and Technology (MEST): 14 Other government departments (incl. Finance): 3 Grant Agent (World Bank): 3 Coordinating Agency (UNICEF): 2 Civil Society/Nongovernmental Organizations (NGOs): 7 Development partners/donors: 3 GPE Secretariat: 1

FINAL REPORT - SIERRA LEONE 93
© UNIVERSALIA
LIMITATIONS MITIGATION STRATEGIES SUCCESS OF MITIGATION
Limited availability of stakeholders. Whilst all key stakeholder groups were reached, some individuals were not available in a timely manner, despite repeated follow-ups (e.g., representatives of the Sierra Leone Teachers Union, SLTU). This issue was compounded by stakeholder turnover, as many interviewed partner representatives started working on Sierra Leone only in 2016, post-Ebola. Consequently, many stakeholders focused on issues related to the Education Sector Plan (ESP) 2018-2020, and few were willing or able to comment on the ESP 2014-2018.
In two cases, the evaluation team asked key stakeholders (development partners) for the contact information of their predecessors and followed up by phone. One national stakeholder not available during the mission in Sierra Leone was subsequently interviewed with the help of the national consultant.
Moderate: With exception of the teachers’ union, all initially identified and contacted stakeholders were reached.
Exceptional context. The assessment of GPE’s Theory of change was complicated by the significant disruption caused in Sierra Leone by the outbreak of Ebola. This presented challenges during data-collection, data-analysis, and report-writing, as the crisis in many cases overshadowed other factors and processes.
The evaluation team used documents and interviews to carefully unpack the effects of Ebola on the education sector and distinguish them from any factors inherent to GPE’s ToC. We further streamlined references to Ebola in this report to focus attention as much as possible on other explanatory mechanisms.
Good
The evaluation did not consult with representatives from not government-approved (private, community) schools. This was largely due to the fact that these schools are not represented in formal (or even informal) organizations or associations, which made it difficult to identify specific stakeholders to consult. Similarly, no representatives at the level of chiefdoms were consulted.
None. The issue of not government-approved schools is a politically sensitive one. As none of the initially consulted in-country stakeholders (including from MEST) suggested that the evaluation team meet with stakeholders from one or more of these schools, the evaluation team did not insist on doing so. Due to time constraints, the field visit focused on meeting with stakeholders in the capital, and therefore did not reach out to informants at the chiefdom level.
NA (limitation not mitigated)

94 FINAL REPORT - SIERRA LEONE
© UNIVERSALIA
Appendix IV Stakeholder mapping 170. The table below is adapted from the generic stakeholder mapping presented in the assignment inception report and tailored to the Sierra Leone context.
Table iv.1 Stakeholder mapping within the Sierra Leone context
STAKEHOLDER INTEREST IN/INFLUENCE ON GPE COUNTRY-
LEVEL PROGRAMMING IMPORTANCE FOR THE EVALUATION
ROLE IN THE COUNTRY-LEVEL EVALUATION
Global
Secretariat Interest: High. Influence: High. The Secretariat operationalizes guidance on overall direction and strategy issued by the Board. Importance: High
The main internal stakeholders and users of the evaluation; key informants; facilitated the evaluation team’s contacts with external stakeholders. Country lead was consulted both before and after the country field mission. The evaluation team shared and discussed the presentation of preliminary findings with Secretariat staff.
Board members (from developing countries included in the sample)
Interest: High. Influence: High. Board members influence the direction, strategy development and management of GPE, and they ensure resources. The extent to which DCP Board members are involved in and intimately familiar with GPE grants in their respective countries likely varies. Importance: High
Sierra Leone is represented on the Board through the constituency Africa 3. Current Board members are from Liberia (board member) and South Sudan (Alternate). These board members were not consulted during the course of this country evaluation.
Country-level
Government of Sierra Leone
Ministry of Education, Science and Technology (MEST)
Interest: High Influence: High. Responsible for shaping and implementing education sector policy and managing related financing. Importance: High. Main partner for GPE grant design and implementation.
Key informants at country level. Senior MEST staff were interviewed in person during the country visit.

FINAL REPORT - SIERRA LEONE 95
© UNIVERSALIA
STAKEHOLDER INTEREST IN/INFLUENCE ON GPE COUNTRY-
LEVEL PROGRAMMING IMPORTANCE FOR THE EVALUATION
ROLE IN THE COUNTRY-LEVEL EVALUATION
Ministry of Finance and Economic Development (MFED)
Interest: Medium-High. Education is one among various competing priorities in Sierra Leone. Influence: Medium-High. Responsible for budget allocations to the education sector. Until now, low influence on donor harmonization and use of mechanisms such as pooled funding. Importance: High.
Key informants at country level. Two senior staff members were interviewed during the country visit.
Ministry of Social Welfare, Gender and Children’s Affairs. Other Line Ministries involved in, or relevant for (basic) education, equity and equality issues
Interest: Medium-Low Influence: Low. The ministry is not a standing member of the LEG, and other actors did not mention it as a relevant player in influencing the education sector. Importance: Medium-Low
The ministry did not respond to the evaluation team’s request for a consultation during or after the field visit and was, in consequence, not consulted for this evaluation.
Key Education Sector Stakeholders (national level)
Grant Agent: World Bank
Interest: High Influence: High. Responsible for managing last two ESPIGs in Sierra Leone. Importance: High
Key informants at country level. Both current and former staff members were consulted during the country visit and by telephone respectively.
Coordinating Agency: UNICEF
Interest: High Influence: Medium-High. Through its facilitating role, the Coordinating Agency played an important role the functioning of the LEG. Importance: High
UNICEF provided invaluable logistical support to the evaluation team. Key informants at country level - interviewed during the country visit.
Development Partners (donor agencies, multilateral organizations): DFID, European Union.
Interest: High Influence: Medium-High, both through their participation in, and contributions to the LEG and to GPE grant implementation (DFID temporarily co-funded the REDiSL project, the majority of which was funded through a GPE ESPIG) and monitoring, as well as through other development partner activities in the education sector. Importance: High
Key informants at country level who were interviewed in person during the country visit.

96 FINAL REPORT - SIERRA LEONE
© UNIVERSALIA
STAKEHOLDER INTEREST IN/INFLUENCE ON GPE COUNTRY-
LEVEL PROGRAMMING IMPORTANCE FOR THE EVALUATION
ROLE IN THE COUNTRY-LEVEL EVALUATION
International nongovernmental organizations: Catholic Relief Services (CRS), ActionAid
Interest: High Influence: Medium-Low. Members of the LEG with growing, but still somewhat limited influence compared to bilateral/multilateral development partners. Importance: High
Key informants at country level. Were consulted during the country site visit.
Domestic nongovernmental organizations: EFA coalition (umbrella organization representing a variety of organizations involved in education advocacy, including the teachers union).
Interest: High Influence: Medium-Low. Are member of the LEG, and, as such, increasingly recognized as valuable partners, but have less influence than development partners who provide funding to the education sector. Domestic NGOs in Sierra Leone do not provide education services but focus on advocacy. Importance: Medium-High
Key informants at country level. Were consulted during the country site visit.
Private sector representatives
Interest: Uncertain, probably medium-high for private school representatives. Influence: Medium. Not members of the LEG and no direct influence on education policymaking. But responsible – yet not in a coordinated way – for more than half of schools in Sierra Leone. Importance: Medium
The existence of not government-approved schools is a sensitive issue in Sierra Leone. In addition, private education providers do not constitute a homogenous group and are not represented through formal bodies. As a result, the evaluation team did not consult with any private sector representatives.
Philanthropic Foundations
Interest: NA Influence: NA Importance: NA
There was no indication of philanthropic foundations playing any role in the Sierra Leone education sector. No consultations conducted.
171. Based on consultations with MEST, UNICEF and the World Bank, the evaluation team did not conduct any consultations at the local and/or school level.

FINAL REPORT - SIERRA LEONE 97
© UNIVERSALIA
Appendix V List of consulted individuals 172. 33 individuals were consulted over the course of this evaluation (of which, 10 women). All stakeholders except those marked with an asterisk (*) were consulted in person.
Table v.1 Consulted stakeholders
ORGANIZATION LAST NAME, FIRST NAME TITLE M/W
Ministry of Science, Education and Technology
THORPE, Dr. Christiana A. M. Deputy minister 1 of Education W
KAMARA, James Morlai Deputy minister 2 of Education M
CONTEH, Umaru A. Permanent Secretary M
KAMARA, Dr. Alhaji Mohamed
Chief Education Officer M
SESAY, Umaru GPE focal point @ MEST M
KING, Reginald REDiSL coordinator @ MEST M
Mrs Adama J Momoh Director, Policy and Planning W
Mrs. Salimatu Koroma Director JSS/SSS W
SESAY, Mohamed Sillah Inspectorate Director M
TURAY, Michael Brima Deputy Director School Broadcasting and Public Relations Officer
M
GREYWOODE, Emmanuel Harold
ICT Director M
PEARCE, Mansaray Milton Director, Educational Programmes M
GAMAGA, Maybelle Assistant Director, Guidance and Counselling
W
DUPIGNY, Dr. Albert C.T. Head, Temporary Change Unit M
Ministry of Finance and Economic Development
BANGURA, Dr. Shaka Head of Budgeting M
FOFANAH, Lansana Budgeting Officer M
Teaching Service Commission BECKLEY, Dr. Staneala Madie Chairperson W
GPE Secretariat KANAZAWA, Daisuke* Country Lead, SL M
UNICEF Sierra Leone RUKUNDO, Mutsinzi Heinrich Education Specialist M
TAULO, Wongani Grace* Education Chief (former) W
World Bank ALAM, Andaleeb Jahan Education Adviser W
AZZI-HUCK, Kaliope* Education Team leader W
Peter Darvas* Education Team leader M

98 FINAL REPORT - SIERRA LEONE
© UNIVERSALIA
ORGANIZATION LAST NAME, FIRST NAME TITLE M/W
DFID MARTINDALE, Jordan Basic Services Policy Adviser W
BERRY, Chris Education advisor M
EU PAGLIONE, Giuseppe Education Task Manager M
ActionAid KANNEH, Desmond Education Advisor M
CRS MUMUNI, Daniel Program Director, Food for Education Program
M
BRUGGEMAN, Leger A. Technical Advisor/Government Liaison M
JALLOH, Aminata Education Program Manager W
EFA COBINA, Joseph National coordinator M
KOMBOH, Augustine Finance & Administrative Officer M
KAMARA, Charles Desmond Project Officer M

FINAL REPORT - SIERRA LEONE 99
© UNIVERSALIA
Appendix VI List of reviewed documents Albright, Alice P. "Maximum Country Allocation for the Republic of Sierra Leone to support
implementation of the national Education Sector Plan." Alice P. Albright to Dr Kaifala Marah and Dr. Minkailu Bah, Washington, D.C., December 21, 2015.
Audit Service Sierra Leone. Audit of the Financial Statements for Revitalizing Education Development in Sierra Leone (REDiSL). Freetown: World Bank, June, 2016.
Audit Service Sierra Leone. "Final Management Letter on the audit of the Revitalizing Education Development Project (REDiSL) 2014-2015." Freetown, June, 2016.
Bah, Minkailu. "GoSL Approval of Sierra Leone's 2018-2020 Education Sector Plan and Commitment to Finance." Minkailu Bah to the Chief Executive Officer, Global Partnership for Education, Freetown, November 10, 2017.
Barrie, Mohamed Juldeh. "Audit Verification Report for 2014-2015." Mohamed Juldeh Barrie to The Project Coordinator, REDiSL, Freetown, June 30, 2016.
Begue-Aguado, Alberto. "Appraisal Report of the Education Sector Plan 2018-2020 in Sierra Leone." Freetown, July, 2017.
Begue-Aguado, Alberto. "ESP Methodology Matrix for Appraisers, Sierra Leone." Washington, D.C., July, 2017.
Day Ashley L, Mcloughlin C, Aslam M, Engel J, Wales J, Rawal S, Batley R, Kingdon G, Nicolai S, Rose P. The role and impact of private schools in developing countries: a rigorous review of the evidence. Education Rigorous Literature Review, London: Department for International Development, 2014.
Department for International Development. "Sierra Leone Secondary Education Improvement Programme (SSEIP) Business Case." London, May, 2016.
Global Partnership for Education. " ESP Ratings_Calculations." Washington, D.C., 2017.
Global Partnership for Education. "Adjusted ESPDG Budget Extension." Washington, D.C., September, 2017.
Global Partnership for Education. "Board of Direactors Audio-Conference Meeting." Meeting Minutes, Washington, D.C., January 12, 2012.
Global Partnership for Education. "Grant Agreement (Revitalizing Education Development Project) between Republic of Sierra Leone and International Development Association." Washington, D.C., August 1, 2014.
Global Partnership for Education. "Mission of the Global Partnership for Education to Sierra Leone." Mission Summary Report, Washington, D.C., December, 2015.
Global Partnership for Education. "Mission of the Global Partnership for Eduction to Sierra Leone." Mission Summary Report, Washington, D.C., August, 2015.
Global Partnership for Education. "Phase II Quality Assurance Review, Program Assessment." Consultant Report, Washington D.C., July, 2013.
Global Partnership for Education. "Progress Update for DFID Mutli-Donor Trust Fund." Washington, D.C., June, 2016.

100 FINAL REPORT - SIERRA LEONE
© UNIVERSALIA
Global Partnership for Education. "Request for Funding, Education Program Development Fund." Washington, D.C., February, 2011.
Global Partnership for Education. "Revitalizing Education Development in Sierra Leone - GPE QAR Phase II, Matrix of Comments Received and Task Team's Responses." Washington, D.C., August, 2013.
Global Partnership for Education. "Revitalizing Education Development in Sierra Leone Mid-Term Issues Paper." Washington, D.C., August, 2016.
Global Partnership for Education. "Secretariat's comments on the initial ESP draft." Washington, D.C., July, 2017.
Global Partnership for Education. "Sierra Leone Draft Education Sector Plan 2014-18: Comments from the GPE Secretariat." Washington, D.C., July, 2013.
Global Partnership for Education. "Sierra Leone Quality Assurance Review - Phase I Report, GPE Program Implementation Grant." Washington D.C., June, 2013.
Global Partnership for Education. "Sierra Leone Quality Assurance Review - Phase III, Final Readiness Review." Washington, D.C., September, 2013.
Global Partnership for Education. "Technical Support for the Education Sector Plan Development and Identification Mission for the Global Partnership for Education ." Aide Memoire, Washington, D.C., April, 2013.
Global Partnership for Education. "TOR for the Consultancy to Update the Sierra Leone Education Plan (ESP)." Washington, D.C., 2017.
Global Partnership on Education. "Secretariat Mission Team Comments on Mid-Term Review Report on the Education Sector Plan." Washington, D.C., Arpil, 2017.
Government of Sierra Leone. "Annex 1 - Budget Profile for FY 2016-2020." Freetown, 2018.
Government of Sierra Leone. "Sierra Leone Education Sector Capacity Development Strategy 2012-2016." Freetown, November, 2011.
Haas, Anna. "Evaluation of UNICEF's role as Lead partner in the Education Sector in Sierra Leone." July 27, 2012.
International Monetary Fund. "Article IV Consultation & Fifth Review under the Extended Credit Facility and Financing Assurances Review and Request for an Extension of the Extended Credit Facility - Press Release; Staff Report; and Statement by the Executive Director for Sierra Leone." Washington, D.C., July, 2016.
Kanazawa, Daisuke and Arianne Wessal. "Mission of the Global Partnership for Education Secretariat to Sierra Leone." Mission Summary Report, Washington, D.C., April, 2017.
Kanazawa, Daisuke. "Back to Office Report (BTOR) Sierra Leone." Washington, D.C., April, 2017.
Kanazawa, Daisuke. "Mission of the Global Partnership for Education Secretariat to Sierra Leone." Mission Summary Report, Washington, D.C., December, 2016.
Kanazawa, Daisuke. "Mission of the Global Partnership for Education Secretariat to Sierra Leone." Mission Summary Report, Washington, D.C., July, 2016.
Kanazawa, Daisuke. "Mission of the Global Partnership for Education Secretariat to Sierra Leone." Mission Summary Report, Washington, D.C., August, 2017.

FINAL REPORT - SIERRA LEONE 101
© UNIVERSALIA
Kanazawa, Daisuke. "Mission of the Global Partnership for Education Secretariat to Sierra Leone." Mission Summary Report, Washington, D.C., December, 2016.
Kanazawa, Daisuke. "Sierra Leone Program Implementation Grant - Country Lead Assessment on the restructuring proposal." Washington, D.C., December, 2016.
Licht, Margarita Focas. Margarita Focas Licht to Dr. Minkailu Bah, Washington, D.C., March 28, 2017.
Licht, Margarita Focas. "Notification of no objection to Education Sector Program Implementation Grant restructuring." Margarita Focas Licht to Henry Kerali, Washington, D.C., January 27, 2017.
Licht, Margarita Focas. "Notification of no objection to the request for Education Sector Plan Development Grant revision." Margarita Focas Licht to Hamid El-Bashir Ibrahim, Washington, D.C., September 29, 2017.
Licht, Margarita Focas. "Notification of no-objection to the additional financing for the project financed by the GPE Education Sector Program Implementation Grant." Margarita Focas Licht to Parminder P.S. Brar, Washington, D.C, May 4, 2017.
Licht, Margarita Focas. "Notification of the approval of GPE Education Sector Plan Development Grant." Margarita Focas Licht to Geoffrey Wiffin, Washington, D.C., April 18, 2017.
Mayne, John. "Addressing Cause and Effect in Simple and Complex Settings through Contribution Analysis." In Evaluating the Complex,, by K. Forss, and M. Marra (Eds.) R. Schwartz. Transaction Publishers, 2011.
Mayne, John. "The COM-B Theory of Change Model." Working Paper, 2017.
"Meeting of the Grant Applications Review Committee (GARC)." Meeting Minutes, Washington, D.C., April 4, 2017.
"Meeting of the Grant Applications Review Committee." Meeting Minutes, Washington, D.C., September 27, 2017.
Ministry of Education, Science and Technology. Program Implementation Grant Application Form, Washington, D.C.: Global Partnership for Education, September, 2013.
Ministry of Education, Science and Technology. "2016 Annual School Census." Freetown, June, 2017.
Ministry of Education, Science and Technology. "2018-2020 Education Sector Implementation Plan." Freetown, October, 2017.
Ministry of Education, Science and Technology and Education Development Partners. "2015 Annual Education Sector Review." Aide Memoire and Report of Proceedings & Recommendations, Freetown, December 8-9, 2015.
Ministry of Education, Science and Technology. "Concept Note: Education Sector Plan Development Grant." Freetown, March 20, 2017.
Ministry of Education, Science and Technology. "Education Sector Implementation Plan for the Years 2014-2016." Draft Report, Freetown, August, 2013.
Ministry of Education, Science and Technology. "Education Sector Plan 2014-2018." Freetown, September, 2013.

102 FINAL REPORT - SIERRA LEONE
© UNIVERSALIA
Ministry of Education, Science and Technology. "Education Sector/Mid-Term Review Workshop." Powerpoint Presentation, Freetown, April 4-5, 2017.
Ministry of Education, Science and Technology. "Mid-Term Review of the Education Sector Plan - 2017." Freetown, March, 2017.
Ministry of Education, Science and Technology. "National Curriculum Framework and Guidelines for Basic Education." Freetown, June, 2015.
Ministry of Education, Science and Technology. "Post-Ebola Recovery Delivery Programme Overview - 10-24 months recovery plan." Powerpoint Presentation, Freetown, February, 2016.
Ministry of Education, Science and Technology. "Revitalizing Education Development in Sierra Leone (REDiSL) Project, Monitoring Report - Performance Based Financing." Freetown, August, 2016.
Ministry of Education, Science and Technology. Sierra Leone Education Country Status Report. Dakar: Pôle de Dakar, UNESCO-Dakar Office, September, 2013.
Ministry of Education, Science and Technology. "Sierra Leone Education Sector Plan: A Road Map to a Better Future 2007-2015." Freetown, 2007.
Rose, Pauline. Supporting Non-state Providers in Basic Education Service Delivery. Research Monograph No 4, CREATE Pathways to Access, 2007.
"Sierra Leone Education Sector Plan (ESP) 2014-2018 Appraisal Report." Freetown, August, 2013.
Snistveit, B., Stevenson, J. et al. The impact of education programmes on learning and school participation on low- and middle-income countries. London: International Initiative for Impact Evaluation, 2016.
The President's Recovery Priorities. "Key Results, Priority Initiatives, Sub-Initiatives and Milestones." Freetown, June 27, 2016.
World Bank. "International Development Association Project Appraisal Document on a Proposed Global Partnership for Education Fund and MDTF Grant to the Republic of Sierra Leone for a REDiSL Project." Washington, D.C., July 30, 2014.
World Bank. "Restructuring Paper on a Proposed Project Restructuring of Revitalizing Education Development Project to the Government of Sierra Leone." Washington, D.C., December 16, 2014.
World Bank. "Revitalizing Education Development in Sierra Leone Implementation Status & Results Report." Washington, D.C., June, 2016.
World Bank. "Revitalizing Education Development in Sierra Leone Implementation Status & Results Report." Washington, D.C., April, 2017.
World Bank. "Revitalizing Education Development in Sierra Leone Implementation Status & Results Report." Washington, D.C., January, 2018.
World Bank. "World Bank Education Mid-Term Review." Aide Memoire, Washington, D.C., July, 2016.

FINAL REPORT - SIERRA LEONE 103
© UNIVERSALIA
Appendix VII Ratings of contribution claims and assumptions To illustrate evaluation findings on the likely validity of the different elements, and the assumed logical linkages between these element, in the GPE country-level theory of change, the evaluation team used a simple color rating approach to rate (i) the extent to which available evidence supported different contribution claims outlined in the ToC; (ii) the strength of the various assumptions that had been identified as underlying each contribution claim. Tables vii.1 and vii.2 below illustrate the criteria applied to guide these ratings.
Table vii.1 Definition of color-coded ratings for contribution claims
Evidence supports the contribution claim.255
• Envisaged objective has been fully or mostly achieved (e.g., a country owned credible ESP has been developed)
• All or most of the underlying assumptions as outlined in the theory of change apply (i.e., are rated ‘strong’)
and/or
• There are no alternative explanations that would suffice/are more likely than elements in the ToC to explain the change
Evidence partly supports contribution claim
• Envisaged objective has been partly achieved (e.g., ESP has been developed, but is not country-owned)
• Half or more of the underlying assumptions as outlined in the theory of change apply only partially (i.e., are rated ‘moderate’)
and/or
• There are some alternative explanations that are as or more likely than elements in the ToC to explain noted change
Evidence does not support contribution claim
• Envisaged objective has not or only marginally been achieved (e.g., ESP has not been developed; no positive change in quality/amounts of education sector funding)
• Half or most of the underlying assumptions as outlined in the theory of change do not apply (i.e., are rated ‘red’)
and/or
• There are alternative explanations that are more likely than the elements of the ToC to explain the noted change
Insufficient evidence to assess the likely validity of the contribution claim
• No/insufficient data on whether the envisaged objective has or has not been achieved
• For all or most of the underlying assumptions as outlined in the theory of change it is unclear if they apply or not (i.e., they are rated ‘white’, see assumptions rating
255 While it does not prove the claim, evidence suggests that contribution claim is more likely than not to be true

104 FINAL REPORT - SIERRA LEONE
© UNIVERSALIA
below)
Table vii.2 Definition of color-coded ratings for likelihood of underlying assumptions holding true in the country context
Strong Evidence deriving from all or most lines of enquiry indicates that this assumption applies in the given context. And There is no evidence that contradicts the application of this assumption
Moderate Evidence deriving from all or most lines of enquiry indicates that the assumption only partly applies in the given context And/or There is some evidence that indicates that this assumption does not apply
Weak Evidence from all or most lines of inquiry indicates that this assumption does not apply in the given context
Insufficient data Available evidence does not allow assessing the assumption, i.e., available evidence either does not address the specific assumption or is inconclusive on whether it applies or not.
Table v.3 applies this color coding to the Sierra Leone context and illustrates the relationship between the six contribution claims and the various underlying assumptions for each of them.256
Table vii.3 Contribution claims and underlying assumptions
Contribution Claim
Underlying assumptions Rating
A: GPE (financial and non-financial) support and influence contribute to the development of government owned, credible and evidence-based sector plans focused on equity, efficiency and
Country level stakeholders have the capabilities (knowledge and skills) to jointly and collaboratively improve sector analysis and planning
Country level stakeholders have the opportunities (resources, conductive external environment) to jointly and collaboratively improve sector analysis and planning
Country level stakeholders have the motivation (political will, incentives) to jointly and collaboratively improve sector analysis and planning.
GPE has sufficient leverage within the country for GPE support to influence sector planning, including LEG existence and functioning.
EMIS and learning assessment and reporting systems (LAS) produce
256 We have slightly adapted the list of underlying assumptions that had been presented in the inception report, by in one case separating one complex assumption into three separate ones (to distinguish between changes in key actors’ motivation, opportunity and capabilities), and in another case merging two assumptions that addressed the same issue (reporting and use of EMIS data).

FINAL REPORT - SIERRA LEONE 105
© UNIVERSALIA
learning. relevant and reliable data.

106 FINAL REPORT - SIERRA LEONE
© UNIVERSALIA
Contribution Claim
Underlying assumptions Rating
B: GPE (financial and non-financial) support for inclusive sector planning and joint monitoring contributes to mutual accountability for education sector progress.
GPE has sufficient leverage at global and country levels to positively influence LEG existence and functioning
Country level stakeholders have the capabilities (knowledge and skills) to work together to solve education sector issues
Country level stakeholders have the opportunities (including resources) to work together to solve education sector issues
Country level stakeholders have the motivation (including political will and incentives) to work together to solve education sector issues
Contribution Claim
Underlying assumptions Rating
C: GPE advocacy and funding requirements contribute to more and better financing for education in the country
GPE has sufficient leverage to influence the amount of and the quality of domestic and international education sector financing
External (contextual) factors permit national and international actors to increase/improve the quality of education sector financing.
Contribution Claim
Underlying assumptions Rating
D: GPE (financial and non-financial) support and influence contribute to the effective and efficient implementation of sector plans.
Relevant government actors have the motivation (political will, incentives) to implement all elements of the sector plan.
Relevant government actors have the opportunity to implement all elements of the sector plan. (Conducive environment, domestic and international funding is sufficient in quantity and adequate in quality)
Relevant government actors have the technical capabilities to implement all elements of the sector plan.
Country-level development partners have the motivation and opportunity (e.g., directive from respective donor government) to align their own activities with the priorities of the sector plan and to work through the LEG as a consultative and advisory forum
Country-level stakeholders take part in regular, evidence-based joint sector reviews and apply recommendations deriving from these reviews to enhance equitable and evidence-based sector plan implementation.
The sector plan includes provisions for strengthening EMIS and LAS to produce timely, relevant and reliable data.

FINAL REPORT - SIERRA LEONE 107
© UNIVERSALIA
Contribution Claim
Underlying assumptions Rating
E: The implementation of realistic evidence-based sector plans contributes to positive changes at the level of the overall education system.
Education sector plan implementation leads to improvements of previous shortcomings in the education system including in relation to:
Sector management (e.g., effective and efficient use of available resources)
Learning (e.g., appropriate and available education inputs – e.g., curricula, textbooks and other teaching/learning materials, school infrastructure, instructional time, school management)
Equity (e.g., removal of barriers to school participation for all learners)
There is sufficient national capacity (technical capabilities, political will, resources) or relevant technical assistance to analyze, report on and use available data and maintain EMIS and LAS
Contribution Claim
Underlying assumptions Rating
F: Education system-level improvements result in improved learning outcomes and in improved equity, gender equality, and inclusion in education.
Changes in the education system positively affect learning outcomes and equity.
(insufficient evidence given timeframe reviewed)
Country-produced data on equity, efficiency and learning allow measuring/tracking these changes.

108 FINAL REPORT - SIERRA LEONE
© UNIVERSALIA
Appendix VIII Visual summary of contribution claim analyses Figures viii.1 – 4 below provide a visual summary of evaluation findings on whether and how GPE inputs/activities as well as additional (external) factors are likely to have contributed to the different results envisaged by the country level theory of change.
The graphics use the same color coding described in Appendix VII.
Figure viii.1 GPE contributions to strengthening sector planning257
257 GPE contributions marked with a star are those that appear to have made the most distinct contribution to capacity changes.

FINAL REPORT - SIERRA LEONE 109
© UNIVERSALIA
Figure viii.2 GPE contributions to strengthening sector dialogue and monitoring

110 FINAL REPORT - SIERRA LEONE
© UNIVERSALIA
Figure viii.3 GPE contributions to more and better sector financing

FINAL REPORT - SIERRA LEONE 111
© UNIVERSALIA
Figure viii.4 GPE contributions to ESP implementation

112 FINAL REPORT - SIERRA LEONE
© UNIVERSALIA
Appendix IX ESP 2014-2018 priorities in light of CSR recommendations 173. The table below maps key recommendations of the 2013 Sierra Leone education CSR against the priorities of the 2014-2018 ESP, as well as against the priorities outlined in the Presidential Recovery Plan 2015-2017.
KEY RECOMMENDATIONS OF THE 2013 COUNTRY STATUS REPORT258
PRIORITIES OF THE 2014-2018 ESP (UNDERLINED ITEMS WERE FULLY OR PARTIALLY SUPPORTED THROUGH THE GPE ESPIG
CO-FUNDED REDISL PROJECT)
PRP KEY PERFORMANCE INDICATORS (KPI)259
1. Access, Equity and Completion260
Improving primary access and retention: Although the access rate to the first grade of primary was estimated at 120.5 percent in 2010/11, it is estimated that 14 percent of a generation of children did not have access to primary school in 2010 (against 20 percent in 2003/04). In the same vein, the primary completion rate,
1.1. Ensure that all children enter school and complete primary education through: 1.1.1. constructing additional classrooms; 1.1.2. organizing campaigns working with vulnerable groups and leaders to
encourage parents to send their children to school; 1.1.3. reducing the cost of schooling to parents and households; 1.1.4. providing targeted support for the neediest families; 1.1.5. providing support for extra-curricular activities such as sports and arts
programs; 1.1.6. providing accelerated primary education for older children and youth ages 10-
5a) 500 new classrooms built
6) Nationwide school feeding for 1.2 million children introduced
258 Ministry of Education, Science and Technology. Sierra Leone Education Country Status Report. Dakar: Pôle de Dakar, UNESCO-Dakar Office, September, 2013. Available at: http://unesdoc.unesco.org/images/0022/002260/226039e.pdf 259 To be delivered by June 2017. Numbering reflects number of KPIs in PRP. The PRP itself does not state whether and how its priorities align with specific ESP objectives or related initiatives. As such, the placement of PRP priorities in this table is based on the evaluation team’s understanding of their ‘fit’ with ESP objectives. 260 Relevant in view of GPE 2012-2015 Strategic Goals 1 (Access for all) and 3 (Reaching every child). We refer to the 2012-2015 GPE strategic plan as the document in place at the time of developing the ESP 2014-2018. The strategic plan is available at: https://www.globalpartnership.org/content/strategic-plan-2012-2015. It contained four strategic goals: 1. Access for all; 2. Learning for all; 3. Reaching every child; 4. Building for the future (national systems have capacity and integrity to deliver, support and assess quality education for all).

FINAL REPORT - SIERRA LEONE 113
© UNIVERSALIA
KEY RECOMMENDATIONS OF THE 2013 COUNTRY STATUS REPORT258
PRIORITIES OF THE 2014-2018 ESP (UNDERLINED ITEMS WERE FULLY OR PARTIALLY SUPPORTED THROUGH THE GPE ESPIG
CO-FUNDED REDISL PROJECT)
PRP KEY PERFORMANCE INDICATORS (KPI)259
while having steadily increased over the period, stood at just 76 percent in 2010.
Ensuring children enter primary school at the right age: 24 percent of the 6-11 years age group were out of school in 2010, most of which never attended school. Late entry is a pervasive phenomenon in Sierra Leone, as 40 percent of Grade 1 new entrants are aged seven years and above. This is cause for all the more concern given its detrimental effect on schooling careers.
Supporting pro-poor schooling: Household wealth remains a major factor of disparities in children’s enrollment, for all age groups, and the distribution is worsening, both over time and with each successive level. Transition and intra-cycle retention rates are also particularly unfavorable to the poorest children
Further supporting girls’ schooling: Gender disparities in access to education are slight but tend to deepen gradually as children progress through their school careers. The systematic underperformance of girls in almost every examination is a particular issue.
15
1.2. Increase access to pre-school for children aged 3-5 years old through 1.2.1. Developing and piloting a cost-effective community-based pre-school model.
1.3. Increase the completion level and equitable access to junior secondary schools through
1.3.1. Providing additional trained teachers, 1.3.2. expanding tuition support program for girls to make JSS tuition free, 1.3.3. Reducing the cost of education for the most vulnerable families (school grants,
scholarship program).
1.4. Increase equitable access to senior secondary schools through 1.4.1. Constructing additional classrooms 1.4.2. Providing additional trained and qualified teachers.
7) All young mothers from Ebola period back to school
1.5. Increase equitable access to technical and vocational schools through 1.5.1. Encouraging and supporting public-private partnerships, 1.5.2. train TVET teachers/instructors, 1.5.3. Finalizing and implementing a TVET policy.
1.6. Increase equitable access to higher education institutions through 1.6.1. Constructing new and upgrade existing facilities; 1.6.2. using new information and communication technologies to expand access; 1.6.3. better targeted financial support (grants or loans) to the neediest students
and continue grant support for females in STEM and for students with disabilities;
1.6.4. Developing a higher education strategy
1.7. Improve the literacy rate for youth and adults261 through 1.7.1. launching a sustained national campaign on the benefits/advantages of being
261 ESP baseline and target only relate to the adult literacy rate, not also to youth.
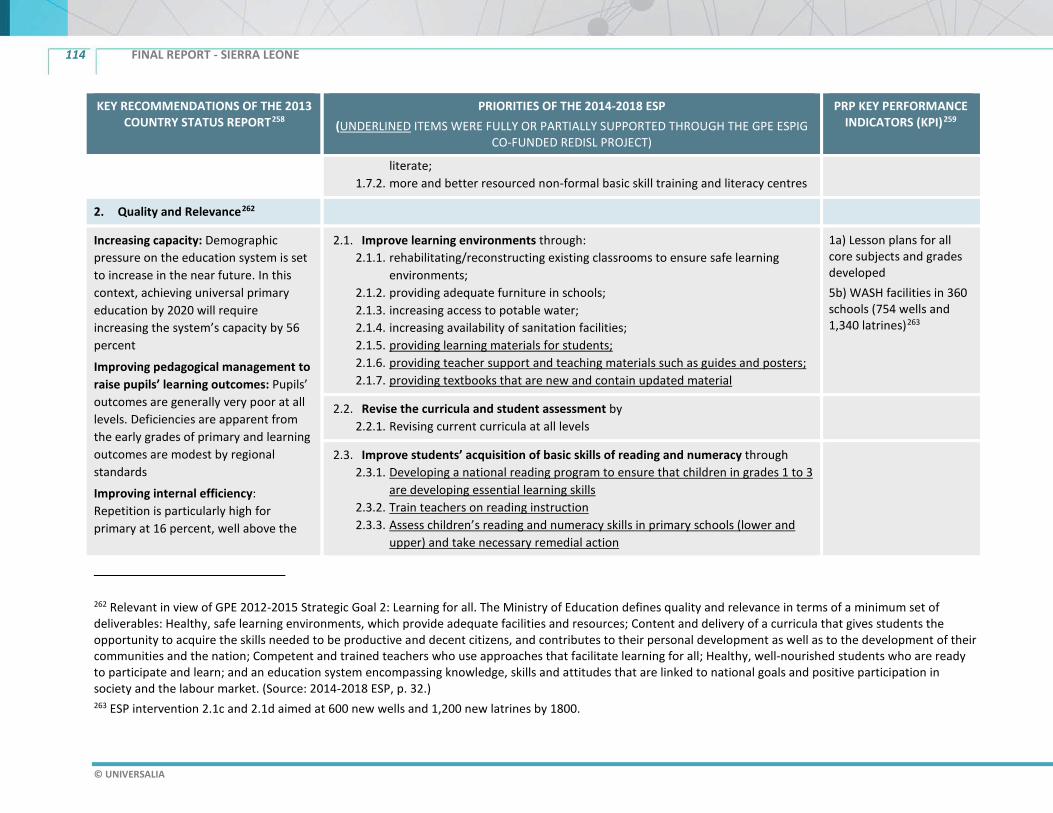
114 FINAL REPORT - SIERRA LEONE
© UNIVERSALIA
KEY RECOMMENDATIONS OF THE 2013 COUNTRY STATUS REPORT258
PRIORITIES OF THE 2014-2018 ESP (UNDERLINED ITEMS WERE FULLY OR PARTIALLY SUPPORTED THROUGH THE GPE ESPIG
CO-FUNDED REDISL PROJECT)
PRP KEY PERFORMANCE INDICATORS (KPI)259
literate; 1.7.2. more and better resourced non-formal basic skill training and literacy centres
2. Quality and Relevance262
Increasing capacity: Demographic pressure on the education system is set to increase in the near future. In this context, achieving universal primary education by 2020 will require increasing the system’s capacity by 56 percent
Improving pedagogical management to raise pupils’ learning outcomes: Pupils’ outcomes are generally very poor at all levels. Deficiencies are apparent from the early grades of primary and learning outcomes are modest by regional standards
Improving internal efficiency: Repetition is particularly high for primary at 16 percent, well above the
2.1. Improve learning environments through: 2.1.1. rehabilitating/reconstructing existing classrooms to ensure safe learning
environments; 2.1.2. providing adequate furniture in schools; 2.1.3. increasing access to potable water; 2.1.4. increasing availability of sanitation facilities; 2.1.5. providing learning materials for students; 2.1.6. providing teacher support and teaching materials such as guides and posters; 2.1.7. providing textbooks that are new and contain updated material
1a) Lesson plans for all core subjects and grades developed 5b) WASH facilities in 360 schools (754 wells and 1,340 latrines)263
2.2. Revise the curricula and student assessment by 2.2.1. Revising current curricula at all levels
2.3. Improve students’ acquisition of basic skills of reading and numeracy through 2.3.1. Developing a national reading program to ensure that children in grades 1 to 3
are developing essential learning skills 2.3.2. Train teachers on reading instruction 2.3.3. Assess children’s reading and numeracy skills in primary schools (lower and
upper) and take necessary remedial action
262 Relevant in view of GPE 2012-2015 Strategic Goal 2: Learning for all. The Ministry of Education defines quality and relevance in terms of a minimum set of deliverables: Healthy, safe learning environments, which provide adequate facilities and resources; Content and delivery of a curricula that gives students the opportunity to acquire the skills needed to be productive and decent citizens, and contributes to their personal development as well as to the development of their communities and the nation; Competent and trained teachers who use approaches that facilitate learning for all; Healthy, well-nourished students who are ready to participate and learn; and an education system encompassing knowledge, skills and attitudes that are linked to national goals and positive participation in society and the labour market. (Source: 2014-2018 ESP, p. 32.) 263 ESP intervention 2.1c and 2.1d aimed at 600 new wells and 1,200 new latrines by 1800.

FINAL REPORT - SIERRA LEONE 115
© UNIVERSALIA
KEY RECOMMENDATIONS OF THE 2013 COUNTRY STATUS REPORT258
PRIORITIES OF THE 2014-2018 ESP (UNDERLINED ITEMS WERE FULLY OR PARTIALLY SUPPORTED THROUGH THE GPE ESPIG
CO-FUNDED REDISL PROJECT)
PRP KEY PERFORMANCE INDICATORS (KPI)259
SSA average of 12 percent
Improving teacher management: There is clearly scope to rationalize the use of existing staff rather than recruit more teachers, which would involve improving the allocation of teachers to primary and secondary schools to ensure more consistent and equitable deployment. Providing untrained or unqualified teachers with the necessary training and skills and assessing the opportunity of formalizing the status of non-PIN teachers would also contribute to improving the situation
2.4. Improve the quality of teachers through 2.4.1. Providing support for pre-service and in-service education at all levels 2.4.2. Provision of in-service knowledge and teaching skills upgrading short courses
for all teachers
1b) 37,200 primary and 21,000 secondary teachers trained to use lesson plans
2.5. Equitably deploy teachers nationwide through 2.5.1. Deploying and incentivizing trained teachers to neediest communities 2.5.2. Approving community schools that meet pre-determined criteria 2.5.3. Establishing literacy centers in underserved areas
2a) 70 percent of all schools have a PQTR under 49:1 3) 500 new schools approved
3. Systems strengthening264
Improving teacher management: There is clearly scope to rationalize the use of existing staff rather than recruit more teachers, which would involve improving the allocation of teachers to primary and secondary schools to ensure more consistent and equitable deployment. Providing untrained or unqualified teachers with the necessary training and skills and assessing the opportunity of formalizing the status of non-PIN
3.1. Improve communication and coordination within the education sector, and with external stakeholders and the general public
3.2. Develop consistent, coherent, enabling policies and legislation and put frameworks in place to influence all levels
3.3. MEST plans and manages its own human resources
3.4. Establish effective, functioning systems for teacher recruitment, deployment, performance appraisal, promotion and development that serve national needs
2b) Zero teachers in MEST schools off the payroll
3.5. Improve strategic and operational planning for development and service delivery at all levels of the education sector, including the full integration of NGO and donor
264 Relevant in view of GPE 2012-2015 Strategic Goal 4: Building for the future.

116 FINAL REPORT - SIERRA LEONE
© UNIVERSALIA
KEY RECOMMENDATIONS OF THE 2013 COUNTRY STATUS REPORT258
PRIORITIES OF THE 2014-2018 ESP (UNDERLINED ITEMS WERE FULLY OR PARTIALLY SUPPORTED THROUGH THE GPE ESPIG
CO-FUNDED REDISL PROJECT)
PRP KEY PERFORMANCE INDICATORS (KPI)259
teachers would also contribute to improving the situation.
Reducing disparities among regions, districts and schools that persist despite decentralization: Improving supervision and accountability mechanisms at the local level may be effective interventions to ensure more efficient use of education inputs and resources at the school level. To move this forward, the need for an adequate and effective decentralized information and monitoring system is urgent. Decentralized financial and human resource management systems would also improve fiscal management and accountability systems.
contributions in accordance with sector priorities
3.6. Ensure that the MEST has the capacity and capability to collect, manage and use current data and evidence to inform its own work and that of other education sector stakeholders
4) Situation room strengthened and real-time monitoring capacity in all 14 districts
3.7. Ensure the structures, systems and roles are in place to effectively address the emerging operational challenges and anomalies of decentralization in the education sector
3.8. MEST staff members at all levels and appropriate local council staff members have the capacity to plan, develop and deliver on education budgets effectively
3.9. Build the capacity to monitor performance and supervise quality improvement at all levels
3.10. Review and re-orient the selection, procurement and distribution of textbooks and TLM to ensure that basic education materials’ needs are met and risks to transparency and accountability are mitigated
3.11. Develop a schedule of key performance indicators for service delivery based on the preceding capacity development details

FINAL REPORT - SIERRA LEONE 117
© UNIVERSALIA
Appendix X PRP implementation and alignment with the ESP The PRP’s education priorities exhibit partial alignment with the ESP. As Table v.1 shows, from a high-level perspective, nine out of 10 KPIs were at least partially aligned with ESP priorities, with only school feeding being entirely new. However, a detailed review shows that the PRP was only partly based on the ESP. PRP structure, indicators, and targets differ from the ESP’s, and in some cases, are more ambitious than the original plan despite the short implementation window and recovery-related challenges. A review of the PRP development process further reveals that it was only partially driven by the ESP document, and largely based on stakeholder working groups’ new analysis and prioritization of sector issues.265 This limits the relevance of the ESP to implementation in the period under review. As the MTR notes, “While there was some overlap between the activities in the recovery plan and the ESP, new activities (such as the National School Feeding program) were prioritized over the ESP activities.” (p.4).
Stakeholders indicated that the PRP was diligently implemented. Despite this, as Table x.1 shows, only two out of 10 targets were fully achieved, with 5 others seeing some but insufficient progress.
Table x.1 Progress on PRP targets relative to initial objectives and to the original ESP.
PRP KPIS – TO BE DELIVERED BY JUNE
2017 ALIGNMENT WITH ESP PRP TARGETS ACHIEVED?
1a) Lesson plans for all core subjects and grades developed
Partially Aligned. Lesson plans are not explicitly mentioned in the ESP but the idea is consistent with ESP objectives.
PRP achieved. Lesson plans for English and Mathematics were developed and printed (MTR, 29).
1b) 37,200 primary and 21,000 secondary teachers trained to use lesson plans
Aligned. PRP more ambitious. The ESP targeted training 9,620 primary teacher (3,965 in-service/5,655 pre-service), and 3,985 JSS teachers (2,197 in-service/1,768 pre-service)
PRP not achieved, but progress. 17,380 teachers trained on core content (MTR 19), 9,000 teachers trained in accelerated curriculum (MTR 26)
2a) 70 percent of all schools have a PQTR under 49:1
Aligned. ESP SO 2.5 targeted a primary PQTR in 2018 of 55:1
PRP not achieved, no clear progress. System-wide PQTR in 2016 was still 55:1, above 49:1 (MTR 30). The ESP target was not achieved either (Primary PQTR in 2016: 62:1, cf. MTR p.IV).
2b) Zero teachers in MEST schools off the payroll
Partially aligned. The ESP raised this issue but did not have an explicit target and delegated
PRP not achieved, no clear progress. There has been little progress on this issue. The TSC was established but it not yet operational.
265 “Post-Ebola Recovery Delivery Programme Overview”, MEST 10-24 months recovery plan. Slide 17. Confidential.

118 FINAL REPORT - SIERRA LEONE
© UNIVERSALIA
PRP KPIS – TO BE DELIVERED BY JUNE
2017 ALIGNMENT WITH ESP PRP TARGETS ACHIEVED?
the issue to the TSC. A payroll cleaning exercise was conducted with mixed success (interviews). Budget constraints prevent hires.
3) 500 schools newly approved
Aligned. Corresponds to ESP intervention 2.5b. The ESP aimed to approve 1,444 community schools in 2014-2016 (824 primary, 620 JSS).
PRP not achieved, but progress. 81 schools approved, 371 awaiting approval (MTR 19). Interviews suggest 300/350 schools approved in the end (~70 percent of target).
4) Situation room strengthened and real-time monitoring capacity in all 14 districts
Partially aligned. ESP SO 3.6 aimed to strengthen data monitoring and decentralize it to Local Council level but specified no target or activity. The Situation Room idea is new.
PRP achieved. Situation Room established and functional, including district-level real-time data collection. ICT officers in 14 Districts.
5a) 500 new classrooms built
Aligned. PRP less ambitious. ESP aimed to build 2,315 classrooms in 2014-2016 (10 ECD, 784 primary, 38 inclusive primary, 1,066 JSS, 22 inclusive JSS, 395 SSS).
PRP not achieved, but progress. 394 classrooms built by June 2017 (MTR 18), of which 168 JSS sponsored by DFID, and 28 ECD sponsored by GPE.
5b) WASH facilities in 360 schools (754 wells and 1,340 latrines)
Aligned. PRP more ambitious. ESP intervention 2.1c and 2.1d aimed at 600 new wells and 1,200 new latrines.
PRP not achieved, but progress. 95 WASH facilities constructed by June 2017, more planned (MTR 18).
6) Nationwide school feeding for 1.2 million children introduced
Not aligned. The ESP did not include provisions for school feeding.
PRP not achieved. Initially, School feeding implemented in 559 of 1,474 contacted schools, covering 0.8 million, below target (MTR 18, 33). Meals were only two days a week, and program then interrupted for lack of funds (interviews).
7) All young mothers from Ebola period back to school
Partially aligned. The ESP did not include explicit provisions for pregnant girls but aimed to return 22,500 out-of-school children into education in 2014-2016.
PRP not achieved, but progress. 14,500 pregnant girls returned to school through Community Learning Centers & UNICEF/MEST Girls Access to Education (GATE) project (DFID funding).
TOTAL Aligned: 5 > Partially Aligned: 4 > Not aligned: 1
Not achieved but progress: 5 > Not achieved no progress: 3 > Achieved: 2

FINAL REPORT - SIERRA LEONE 119
© UNIVERSALIA
Appendix XI Contributions of the GPE-funded REDiSL project to ESP implementation266 174. The total cost of the Revitalizing Education Development in Sierra Leone (REDiSL) was USD 31.31M. Related financing derived from: (1) The Global Partnership for Education through an ESPIG of USD 17.9M; (2) A Multi-Donor Trust Fund (MTDF) funded through DFID, which had originally intended to contribute USD 5.5M, but revised this to USD 2.46M in the context of the Ebola crisis; (3) Ebola Recovery and Reconstruction Trust Fund (ERRTF) – USD 0.95M; and (4) International Development Association (IDA) – USD 10M.267
Table xi.1 Overview of the REDiSL project components and their relevance in relation to priorities described in the ESP 2014-2018.268
REDISL COMPONENTS
SUPPORTED THROUGH GPE ESPIG
STATUS AND ACHIEVEMENTS ESP PRIORITIES SUPPORTED
1. Improving the Learning Environment and Opportunities in Targeted Areas269
1.1. School Grants Achieved all four planned activities under this component • Paid USD 2.2M in performance-based school grants to 1,284 schools270 (comprising 1,144
Primary + 140 JSS) in the four most disadvantaged LCs – namely - Kenema, Kambia, Tonkolili and
1.1.3: Reducing the cost of schooling to parents and households
266 Key source for this box: World Bank REDiSL Implementation Status & Results Report #8, January 2018. Contributions are listed in rough order of significance rather than in their order as REDiSL components (1.1., 1.2, etc) 267 This additional IDA financing became effective in December 2017. The extended REDiSL closing date is December 2019. The original closing date had been February 2017, but this was extended (For GPE and ERRTF funding) to December 2017. 268 Available REDiSL project documents do not explicitly align project components with specific initiatives under the ESP 2014-2018. As such, the mapping of REDiSL components against the ESP is based on the evaluation team’s understanding and assessment. 269 89% (16m of 17.9m) of GPE Funds in the project’s resources as indicated in the Grants Agreements were allocated to Component 1. of the REDiSL project (School Grant, ECD, Early grade Reading and TSC); 270 1350 schools had been targeted, but only 1284 received grants as there was a shortage of 66 schools from the Kenema District Council.
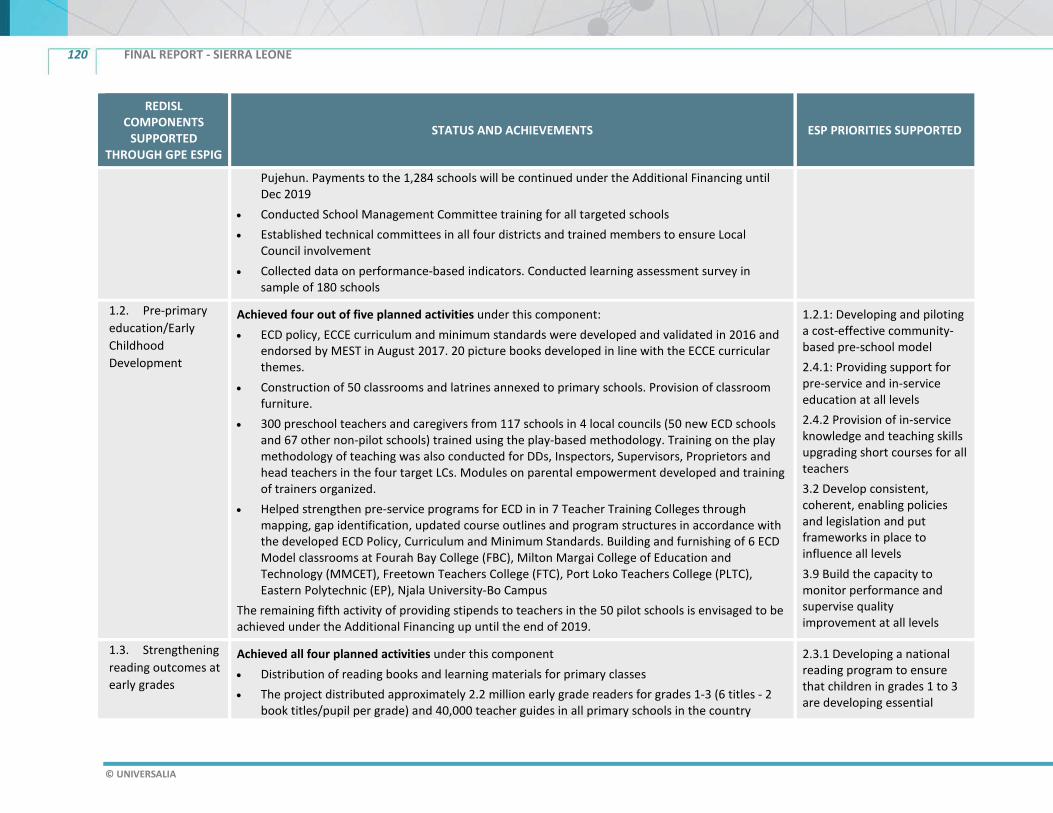
120 FINAL REPORT - SIERRA LEONE
© UNIVERSALIA
REDISL COMPONENTS
SUPPORTED THROUGH GPE ESPIG
STATUS AND ACHIEVEMENTS ESP PRIORITIES SUPPORTED
Pujehun. Payments to the 1,284 schools will be continued under the Additional Financing until Dec 2019
• Conducted School Management Committee training for all targeted schools • Established technical committees in all four districts and trained members to ensure Local
Council involvement • Collected data on performance-based indicators. Conducted learning assessment survey in
sample of 180 schools
1.2. Pre-primary education/Early Childhood Development
Achieved four out of five planned activities under this component: • ECD policy, ECCE curriculum and minimum standards were developed and validated in 2016 and
endorsed by MEST in August 2017. 20 picture books developed in line with the ECCE curricular themes.
• Construction of 50 classrooms and latrines annexed to primary schools. Provision of classroom furniture.
• 300 preschool teachers and caregivers from 117 schools in 4 local councils (50 new ECD schools and 67 other non-pilot schools) trained using the play-based methodology. Training on the play methodology of teaching was also conducted for DDs, Inspectors, Supervisors, Proprietors and head teachers in the four target LCs. Modules on parental empowerment developed and training of trainers organized.
• Helped strengthen pre-service programs for ECD in in 7 Teacher Training Colleges through mapping, gap identification, updated course outlines and program structures in accordance with the developed ECD Policy, Curriculum and Minimum Standards. Building and furnishing of 6 ECD Model classrooms at Fourah Bay College (FBC), Milton Margai College of Education and Technology (MMCET), Freetown Teachers College (FTC), Port Loko Teachers College (PLTC), Eastern Polytechnic (EP), Njala University-Bo Campus
The remaining fifth activity of providing stipends to teachers in the 50 pilot schools is envisaged to be achieved under the Additional Financing up until the end of 2019.
1.2.1: Developing and piloting a cost-effective community-based pre-school model 2.4.1: Providing support for pre-service and in-service education at all levels 2.4.2 Provision of in-service knowledge and teaching skills upgrading short courses for all teachers 3.2 Develop consistent, coherent, enabling policies and legislation and put frameworks in place to influence all levels 3.9 Build the capacity to monitor performance and supervise quality improvement at all levels
1.3. Strengthening reading outcomes at early grades
Achieved all four planned activities under this component • Distribution of reading books and learning materials for primary classes • The project distributed approximately 2.2 million early grade readers for grades 1-3 (6 titles - 2
book titles/pupil per grade) and 40,000 teacher guides in all primary schools in the country
2.3.1 Developing a national reading program to ensure that children in grades 1 to 3 are developing essential

FINAL REPORT - SIERRA LEONE 121
© UNIVERSALIA
REDISL COMPONENTS
SUPPORTED THROUGH GPE ESPIG
STATUS AND ACHIEVEMENTS ESP PRIORITIES SUPPORTED
(>6,000 schools). • 1,000 copies of the readers and teacher guides produced in Braille and distributed to schools for
the blind. • Approximately 460,000 grade 4 readers (2 titles per pupil) and 13,000 teacher guides were
procured and distributed to all schools nationwide (>6,000 schools). • 10,000 classroom support packets for each of the classes 1-3, comprising alphabet frieze; letter,
word and sentence cards; wall pocket charts; posters with stories & poems; stationery items like vanguards, scissors, crayons, markers, pencils, sharpeners, erasers, rulers, string, clips [for teachers to `make’ their own materials]; and a classroom support guide, were distributed to all primary schools.
• Training of 3,800 teachers and 600 pre-service teachers in training on early grade reading instruction and use of readers. Early Grade Reading modules were integrated in the Language Arts/Reading course in 3 Teacher training Colleges benefitting more than 700 students.
• Grade-Level reading campaign: Installation of Bill Boards with taglines depicting motivation to read; Jingles with theme on reading was aired on all the radio stations nationwide; radio discussion talks at district level; nationwide reading competition held for grades 1-4 levels.
• Assessment (comprising of classroom observation in classrooms, mini-student diagnostic assessment of children, teacher and head teacher interviews) undertaken in 96 treatments and 96 control schools in Dec 2017, covering 3,703.271
learning skills 2.3.2: Train teachers on reading instruction 2.3.3 Assess children’s reading and numeracy skills in primary schools (lower and upper) and take necessary remedial 2.1.5: Providing learning materials for students 2.1.6: Providing teacher support and teaching materials such as guides and posters 2.1.7: Providing textbooks that are new and contain updated material 2.4.1: Providing support for pre-service and in-service education at all levels 2.4.2 Provision of in-service knowledge and teaching skills upgrading short courses for all teachers
271 The evaluation was unable to obtain information on the results of this assessment.

122 FINAL REPORT - SIERRA LEONE
© UNIVERSALIA
REDISL COMPONENTS
SUPPORTED THROUGH GPE ESPIG
STATUS AND ACHIEVEMENTS ESP PRIORITIES SUPPORTED
1.4. Improvements in teacher management (TSC)
Out of the seven envisaged activities under this component, the project achieved one set of activities as planned,272 five within a modified scope, while one activity (related to the teachers record and payroll management system) had to be dropped due to delays.273 Completed activities are: • Providing infrastructure, equipment, furniture, two vehicles and one motorcycle to the TSC • Carried operational costs of the TSC Secretariat (but not, as had been originally planned, for the
TSC district offices as these were not functional during by the end of 2017) • Financed the salary of the TSC Chair from January to December 2017. Salaries for other staff
were carried by the Government of Sierra Leone • Supported the development of tools, systems and processes: TSC operational framework,
corporate policies on Human Resources and financial management. Completion of a Situation and Policy Analysis of Teachers and the Teaching Profession, as well as of policy guidelines for Teacher Registration and Licensing, Teacher Management, and Teacher-Employer Relations.
• Supported a study tour of the Commission to the Kenya TSC in 2017. No other formal training was conducted.
• Supported the development of a TSC website and of TSC communications activities for World Teachers’ Day 2017
3.2 Develop consistent, coherent, enabling policies and legislation and put frameworks in place to influence all levels 3.4 Establish effective, functioning systems for teacher recruitment, deployment, performance appraisal, promotion and development that serve national needs
2. Strengthen Education Service Delivery
1.5. Building the foundation for better measurement of learning outcomes (Learning Assessment)
• National Learning Assessment framework and instruments developed • Pilot/trial assessments conducted • Final Learning Assessment conducted for grades 4 & 5 in English, Math and Science • Learning Assessment Policy Framework Document developed but not yet finalized by MEST • Manual of Operations for the Framework developed but not yet finalized by MEST
3.6 Ensure that the MEST has the capacity and capability to collect, manage and use current data and evidence to inform its own work and that of other education sector stakeholders
272 Related to TSC infrastructure and equipment. 273 Transfer of teacher records from MEST to TSC was done only in February 2018.

FINAL REPORT - SIERRA LEONE 123
© UNIVERSALIA
REDISL COMPONENTS
SUPPORTED THROUGH GPE ESPIG
STATUS AND ACHIEVEMENTS ESP PRIORITIES SUPPORTED
1.6. Robust consistent school data collection (school census)
• 3 National School Censuses completed (2015, 2016, 2017) • New shortened school census data collection questionnaire designed and used in 2016 • 2016 School Census data, collected, entered, cleaned. 2016 School Census Statistical Year Book
completed and to be printed. • Move towards paper-free census data collection initiated for 2017 • 320 tablets procured for the 2018 annual school census digitalization
1.7. Develop a mechanism for better delivery on the ESP/ System for effective delivery on the Education Sector Strategy
• Change Unit established and operational • M&E Unit established and functioning • Education website established and operational – education.gov.sl • 2015 Week of Education involving all districts and featuring a symposium, an annual Education
Sector Review Workshop, Annual Education Awards, Open Day for Schools and Partners and various competitions, held
• Support to review and update of Mid-Term Review of ESP in 2017 • Re-opening / President’s Recovery Priorities Coordinator’s Office established, supported and
operational/functioning • Donor Coordination Focal Person appointed and sub-unit functioning • School level WAEC examinations (NPSE, BECE, WASSCE) draft reports produced
3.1 Improve communication and coordination within the education sector, and with external stakeholders and the general public
3. Project Management and Supervision

124 FINAL REPORT - SIERRA LEONE
© UNIVERSALIA
Table xi.2 Fourth REDiSL component, which focused on supporting early recovery under the Ebola Strategic Response Plan.274
REDISL COMPONENTS SUPPORTED THROUGH GPE ESPIG
STATUS AND ACHIEVEMENTS EBOLA RECOVERY PRIORITIES SUPPORTED275
1. Ebola Strategic Response Plan
1.1. Emergency Radio and Television Program
• 6oo hours of radio programs broadcast276 • Sustain and improve on the ongoing TV and radio lessons and encourage the use of e-learning in schools.
1.2. Establishing safe and secure learning environment in preparation for children returning to schools
• 5970 schools provided with hand-washing stations and supplies
• Clean and disinfect all institutions used as holding and/or treatment centres.
• Provide safe water and sanitary facilities in schools
1.3. Social mobilization • House-to-house assessment report • Encouraging re-enrolment
1.4. Monitoring of the Ebola Strategic Response Plan (ESRP)
• Report of radio station validation completed • Sustain and improve on the ongoing TV and radio lessons and encourage the use of e-learning in schools.
274 REDiSL did not provide targeted support to the implementation of the subsequent PRP (2015-2017). However, some project components, such as in pre-primary and early grade reading, as well as in relation to operationalizing the TSC were relevant in relation to PRP priorities around the development of lesson plans and related teacher training, and around ensuring that all teachers in MEST schools are on payroll. 275 The Sierra Leone Ebola recovery strategy outlined three priority areas for early recovery (Reopening educational institutions, encouraging re-enrollment, and improving the quality of teaching and learning. Under these priorities, 16 specific initiatives were described. 276 World Bank research indicates that “The consensus from focus groups at various levels was that the program was a poor substitute for schools, but was taken seriously by the government and the communities, so it served a purpose of maintaining some link to education during the crisis.” Cited from http://blogs.worldbank.org/education/impact-ebola-education-sierra-leone, retrieved February 2018.

FINAL REPORT - SIERRA LEONE 125
© UNIVERSALIA
Appendix XII Progress towards ESP 2014-2018 objectives277 Table xii.1 Progress on key indicators related to Access, Equity and Completion
INDICATORS BASELINE 2011
ACTUAL 2016
TARGET 2018
STATUS 2016278
Strategic Objective 1: Increase access, equity, and completion at all levels of education
S.O. 1.1 - All children access and complete primary education
Proxy Primary Completion Rate (by gender and location) 73% 75% 100% Off-track
GPI based on Completion Rate 0.92 0.96. 0.95 Met
Gross enrolment rate (by gender and location) 124% 130% 119% Off-track
S.O. 1.2 - To increase access to preschool for children aged 3-5
Pre-primary Gross Enrolment Ratio (by gender and location) 8.4% 11% 22% Off-track
GPI based on Pre-Primary GER 1.07 1.1 1.0 Met
S.O. 1.3 - To increase equitable access to and completion of junior secondary school
Transition rate from primary to JSS 77% 83% (2015)
87% On-track
JSS Completion Rate 57% 64% 75% Off-track
Gross Enrolment Rate JSS 67% 61% 88% Off-track
S.O. 1.4 – S.O 1.6 Omitted here as not related to Basic Education
S.O. 1.7 - Improve literacy rate for youth and adults (15+)
Adult literacy rate (by gender and location) 42% 51% 63% Off-track
277 Source: ESP 2018-2019, p. 6-8. 278 As stated earlier in this report, the most recent comprehensive data on ESP indicators derive from the 2017 ESR, which largely relied on 2016 data. It is these data that the 2018-2020 ESP uses as its baseline.

126 FINAL REPORT - SIERRA LEONE
© UNIVERSALIA
Table xii.2 Progress on key indicators related to Quality and Relevance
INDICATORS BASELINE 2011
ACTUAL 2016
TARGET 2018
STATUS 2016
Strategic Objective 2: To improve the quality and relevance of education at all levels
S.O. 2.1 - To improve learning environments for all
% of schools or other institutions that meet physical structure minimum standards
30% (Est.)
45% (Est.)
85% Off-track
S.O. 2.2 - To reform the basic education curricula
Curriculum Revised On track
S.O. 2.3 - To improve literacy and numeracy skills at primary level
% of children with literacy skills that ‘meet expectations’ Not started
Not started
60% Off-track
% of children with numeracy skills that ‘meet expectations’ Not started
Not started
60% Off-track
S.O. 2.4 - To improve quality and distribution of teachers279
% of primary teachers who have received training in reading instruction
No data 47% 70% On track
% of primary teachers with TEC or better 50% 61% 80% On track
% of JSS teachers with HTC (Sec.) or better 43% 72% 85% On track
Local Council Parity in Primary Pupil-Teacher Ratio 0.36 0.4 (2015)
0.8 On track
Table xii.3 Progress on key indicators related to systems strengthening
INDICATORS ACTUAL 2016 TARGET 2018 STATUS 2016
S.O. 3.1 - Improve Communication and Coordination
Public Relations Unit (PRU) of MEST revitalized and external communications strategy developed
Not yet PRU fully functional and strategy in use
In progress
Comprehensive Information Communications Technology (ICT) plan developed
Not yet ICT plan in use In progress
279 In the ESP 2018-2020, the issues of improving teacher quality and equitable deployment of teachers are grouped under one objective, whereas in the ESP 2014-2015 they had been treated as two separate ones.

FINAL REPORT - SIERRA LEONE 127
© UNIVERSALIA
INDICATORS ACTUAL 2016 TARGET 2018 STATUS 2016
S.O. 3.2 - Develop Consistent, Coherent, Enabling Policies and Legislation
TVET policy finalized TVET Policy approved and in use
Policy developed and available on MEST website
Met
Minimum Standards for schools and institutions developed
On-going Standards approved and in use
Partly met280
S.O. 3.3 - MEST plans and manages its own human resources
Competency framework covering all grades and roles within MEST
Not yet Framework in use
Initial discussions
Staff development program exists and being implemented Not yet Program in use Preliminary work
All officers have annually agreed objectives which are used as basis for annual performance assessment.
On-going Objectives-based performance assessment
In part
MEST fully staffed 90% of vacant positions filled
Off-Track
S.O. 3.4 - Establish effective, functioning systems for teacher management
Functional Teaching Service Commission (TSC) On-going Fully funded and decentralized TSC
On-going
Registration and licensing On-going Policy guidelines and tools developed
Off-Track
Recruitment and management of teachers On-going Policy guidelines and tools developed
Off-Track
Payroll management Teacher payroll management transferred to the TSC
TSC effectively manages the payroll
On-going281
280 In the ESP 2018-2020 this item is color-coded greed. However, in the evaluation team’s view, the description of ‘partly met’ warrants the same amber coding as other items described as ‘in progress’ or ‘in part’. 281 While this item was rated as being ‘off track’ in the ESP 2018-2020, the payroll has been transferred to the TSC in early 2018.

128 FINAL REPORT - SIERRA LEONE
© UNIVERSALIA
INDICATORS ACTUAL 2016 TARGET 2018 STATUS 2016
S.O. 3.5 - Improve strategic and operational planning for development and service delivery
Donor coordination entity established On-going Established and staffed fully
On-going
Annual education calendar On-going Produced and distributed before the start of the year
On-going
S.O. 3.6 - MEST has the capacity to collect, manage and use current data and evidence to inform its own work and that of other stakeholders
Decentralized EMIS On-going EMIS is partly decentralized
On-going
S.O. 3.7 - Structures, systems and roles are in place to effectively address decentralization
Operational Guidelines for financial and budgetary issues exist
Partly in place Developed and in use
On-going
Number of meetings between MEST and Local Councils Meetings held regularly
Off-Track
S.O. 3.9 - Build the capacity to monitor performance and supervise quality improvement at all levels
National minimum standards developed Drafted (for ECD) Standards exist and rolled out to all schools
Off-track
Number of school visits by inspectors <1 a term Each school is visited at least once a term
Off-Track
Percent of schools that meet minimum standards Standards not yet established
75% of schools meet minimum standards
On-going

FINAL REPORT - SIERRA LEONE 129
© UNIVERSALIA
Appendix XIII Data on GPE results framework Table xiii.1 ESPIG Performance
GPE RF INDICATOR / EVALUATION MATRIX
INDICATOR INDICATOR VALUE
RF20: ESPIG supports EMIS/learning assessment system
On EMIS: yes.282 ESPIG funded support to the M&E unit and ASCs 2015-2018. On learning assessment system: yes. ESPIG funded national learning assessment for grades 4 and 5 in English, Math, and Science, and the drafting of a national learning assessment policy framework (now being validated).
RF21: Proportion of textbook purchases of ESP funded through ESPIG
0%. The ESP foresaw the provision of 3,541,403 primary school textbooks and 1,046,427 JSS textbooks by 2018 (ESP intervention 2.1g), of which 2,106,988 / 593,447 by 2016 (ESP implementation plan 2014-2016, pp.18-19). By the time of the MTR 2017, 0 textbooks had been provided (p.34). However, the ESP also foresaw the acquisition of 1,786,692 primary reading books by 2016 (IP, p.18; target figures for 2018 not available). The ESPIG funded for the provision of 2.5 million early grade readers, as well as associated teacher guides and classroom kits. If measured relative to reading books, this indicator would therefore be 100 percent or above.
RF 22: Proportion of teachers trained of ESP funded through ESPIG
Roughly 25 percent of primary teachers trained in reading instruction. Roughly 20 percent of all teachers actually trained during the period under review.283 The ESP targeted training 9,620 primary teacher (3,965 in-service/5,655 pre-service), and 3,985 JSS teachers (2,197 in-service/1,768 pre-service) in 2014-2016 (IP, p.20, target figures for 2018 not available). The ESPIG funded the training of 5,400 teachers: 400 preschool teachers and head teachers on ECE, and 4,000 teachers and 1,000 head teachers in early grade reading instruction.284 According to the MTR 2017 (p.III), 47% of primary teachers received training in reading instruction by 2016 under strategic objective 2.4 of the ESP 2014-2018. Based on ASC 2016 figures indicating that there are 37,828 primary teachers in Sierra Leone, these 47% corresponds to ~18,000 teachers trained. The ESPIG contributed 5,000 to that, or 28 percent.
282 GPE results framework tables for this indicator code ESPIG support to EMIS and LAS as ‘not applicable’, without further explanation as to why some of the elements listed in this cell were not considered applicable in this case. 283 This is an estimate. The computation of an exact figure is greatly complicated by differences in targets, figures, descriptions of teacher training content, etc. between the ESP 2014-2018, its IP 2014-2016, the MTR 2017, etc. 284 GPE results framework tables for this indicator note that the ESPIG had a target of 1,500 teachers to train in 2016 but does not include figures for other years.

130 FINAL REPORT - SIERRA LEONE
© UNIVERSALIA
GPE RF INDICATOR / EVALUATION MATRIX
INDICATOR INDICATOR VALUE
RF 23: Proportion of classrooms built of ESP funded through ESPIG
The ESPIG funded less than 3 percent of classrooms the ESP aimed to build, and roughly 10 percent of classrooms actually built by 2018. The ESP aimed to build 2,315 classrooms in 2014-2016 (10 ECE, 784 primary, 38 inclusive primary, 1,066 JSS, 22 inclusive JSS, 395 SSS; cf. ESP IP, target figures for 2018 not available). ESPIG funds supported the construction of 50 ECE classrooms by 2018.285 This corresponds to 100 percent of all ECE classrooms actually built and to over 100 percent of ECE classrooms planned under the ESP.
RF 25: Progress made towards objectives/targets outlined in ESPIG agreement
Moderately satisfactory. The World Bank Implementation Status and Results Report for the ESPIG-funded REDiSL project rated “Progress towards achievement of the Project Development Objectives” as “Moderately Satisfactory” in 2017 and 2018, and similarly rated “Overall Implementation Progress” as “Moderately Satisfactory” in 2017 and 2018. The following targets were achieved or exceeded as of January 2018 (first figure in brackets represents the accomplishment, second figure the target): 286 • # of direct project beneficiaries (~1.2 million vs. ~1.2 million) • % of female beneficiaries (49 percent vs. 50 percent) • # of donors working with Ministry through coordinating unit (seven vs five) • # of primary schools implementing grants through the project (1,145 vs
960) • # of pre-primary classrooms built (50 vs 50) • % of targeted schools that received reading books (100 percent vs 100
percent) • # of trained teachers under the project (5,400 vs 4,500) • TSC guidelines for teacher management developed (yes vs yes) • TSC organogram approved (yes vs yes) • Learning assessment implemented (yes vs yes) • # of schools re-opened (8,500 vs 8,500) • # of schools disinfected, supplied with hand-washing stations (5,790 vs
5,790) • # of hours of radio programs broadcast (600 vs 600) • # of hand washing stations distributed to schools (36,000 vs 36,000) • # of districts benefitting from social mobilization campaign (14 vs 14) The following targets were not or only partially achieved as of January 2018: • % of schools that meet 60 percent of performance targets (44 percent vs
85 percent)
285 GPE results framework tables for this indicator note that the ESPIG had a target of 20 classrooms built in 2016. This figure is likely outdated and was ultimately 50 over the course of the entire ESPIG. 286 Latest data available. The Implementation Completion Memorandum was not available at the time of writing of this evaluation.

FINAL REPORT - SIERRA LEONE 131
© UNIVERSALIA
GPE RF INDICATOR / EVALUATION MATRIX
INDICATOR INDICATOR VALUE
• % of trained teachers using improved reading methods (data currently being collected vs 70 percent)
• TSC policy and guidelines for teacher management in use (no vs yes) • Transfer of teacher records from MEST to TSC (no vs yes)
Table xiii.2 System-Level
GPE RESULTS FRAMEWORK INDICATORS VALUES FOR SIERRA LEONE
RF10: increased share of public expenditure allocated to education (covered in section 4.3 of this report)
Deterioration. The share of public expenditure allocated to education is below 20 percent, and has fallen between 2014 (18 percent) and 2016 (17.3 percent), GPE results framework data, 2017 collection. The government projects a further decline in the share of total public expenditure allocated to education. See section 3.3 in this report, Figure 3.2.
RF11: equitable allocation of teachers, as measured by the variance in the ratio of pupils to trained teachers across schools (covered under measures for equity)
Unsatisfactory level of equitable allocation of trained teachers in 2010 and 2011. The R2 value of the ratio of pupils to trained teachers across schools in Sierra Leone was below the 0.8 threshold, indicating a below desired level of equitable allocation of trained teachers to pupils across districts. The R2 value of pupils to teachers across schools was 0.52 in 2010 and 0.61 in 2011.
RF12: improved ratios of pupils to trained teachers at the primary level (covered under quality of teaching/instruction)
No signs of improvement. GPE’s data indicates a primary PTTR of 62 in 2014, a decline from 2010 (68) but a rise from 2012 (60). ASC 2016 indicated a primary PTTR of 69, and a primary PTR of 38. ASC data for other years was not available to the evaluation team.
RF13: reduced student dropout and repetition rates (covered under sector management)
Limited data shows signs of mild improvement. GPE data on the Internal Efficiency Coefficient (IEC) of Sierra Leone is sparse, with only two data points: 2005 (score of 58) and 2010/11 (slightly higher score of 63). The ASC 2016, MTR 2017 and ESP 2018-2020 do not provide dropout or repetition rates. UIS data for percentage of repeaters in primary (both sexes) suggests a mild drop in repetition between 2011 (15.6 percent) and 2015 (13.4 percent).
RF14: the proportion of key education indicators the country reports to UIS (covered under evidence-based, transparent decision-making)
Improvements in recent years. Sierra Leone currently reports 100 percent (12/12) of key indicators to UIS (latest GPE data, based on July 2016 UIS release, corresponding to 2013-2014 country data). This is a strong score as only four of 28 GPE member countries affected by fragility and conflict reported on all indicators. It also constitutes an improvement from pre-2011, when UIS has almost no data for Sierra Leone.

132 FINAL REPORT - SIERRA LEONE
© UNIVERSALIA
GPE RESULTS FRAMEWORK INDICATORS VALUES FOR SIERRA LEONE
RF15: the existence of a learning assessment system for basic education that meets quality standards (covered under evidence-based, transparent decision-making)
Early steps towards an assessment system GPE’s 2016 data on this indicator classifies Sierra Leone’s learning assessment system as “nascent”. Several learning assessments were conducted during the period under review: an EGRA/EGMA in 2014; a DFID 2016 assessment of English and Math in JSS2 and SSS2; and a new national learning assessment for primary four and five in English, Math and Science (developed under the REDiSL project), carried out in all 19 local councils. Moreover, a national learning assessment policy framework has been drafted; it is currently being validated and remains to be rolled out.
RF16 a) Number of endorsed
ESP/TEP quality standards met by the ESP - that is, meeting at least 5 out of a possible total of 7 standards for ESPs, and at least 3 out of a possible total of 5 standards for TEPs.
b) Does the ESP have a teaching and learning strategy meeting quality standards?
c) Does the ESP have a strategy to respond to marginalized groups meet?
d) Does the ESP have a strategy to improve efficiency that meets quality standards? (4/5)
a) Has met 4/7 ESP criteria (ESP 2014-2018) and 7/7 for the new 2018-2020 ESP 2016 collection (2014-2018 ESP report)- left/ 2017 collection- (2018-2020 ESP) right • 1 Met/ Met (Overall vision) • 2) Not met/ Met (Strategic) • 3) Not Met/ Met (Holistic)
• 4) Met/Met (Evidence- based) • 5) Not Met/Met (Achievable) • 5) Met/Met (referred to as “Monitorable” in the2017 collection) • 6) Met/Met (Sensitive to context) • 7) Met/ Met (Attention to Disparities)
b) Has met 5/5 criteria (data only available for 2018-2020 ESP) • 1) Evidence-based • 2) Relevance • 3) Coherent
• 4) Measurable • 5) Implementable
c) Has met 5/5 criteria (data only available for 2018-2020 ESP) • 1) Evidence-based • 2) Relevance • 3) Coherent • 4) Measurable • 5) Implementable
d) Has met 5/5 criteria (data only available for 2018-2020 ESP) • 1) Evidence-based • 2) Relevance • 3) Coherent
• 4) Measurable • 5) Implementable

FINAL REPORT - SIERRA LEONE 133
© UNIVERSALIA
GPE RESULTS FRAMEWORK INDICATORS VALUES FOR SIERRA LEONE
RF17: Country has a data strategy that meets quality standards to address data gaps in key outcome, service delivery and financing indicators.
GPE’s RF data collections for 2016 and 2017 do not report on this indicator.
RF18: Total number of Joint Sector Reviews (JSR), which meet quality standard- that meet at least 3 out of 5 criteria
According to the GPE 2020 RF Baseline (2016), the 2015 ESR met none of the five quality criteria for JSRs. Sierra Leone does not appear in the 2017 RF data collection.
RF19: Local Education Group (LEG) has representation of both Civil Society Organization(s) (CSO) and Teacher Organization(s) (TO)
There is representation in both Civil Society Organization and Teacher Organization
Table xiii.3 Impact-Level
LATEST DATA, ANY CHANGES BETWEEN BEFORE 2014 AND AFTER 2014
RF1: Improved learning outcomes at primary level
Limited data shows signs of mild improvement. There was a lack of GPE data on learning outcomes at the primary level in Sierra Leone. However, tentative, and modest, improvements in learning outcomes, as evidenced by year-on-year rises in pass rates for national examinations can be seen at all levels (primary, JSS, SSS) since 2013/2014 (ESP 2018-2020, Annex VII). These improvements are from very low levels, and evidence is incomplete.
RF2: More children under five years developmentally on track in health, learning and psychosocial wellbeing
Lack of data to show signs of improvement. UNICEF data on Sierra Leone was only found for 2010. Sierra Leone’s Early Child Development Index score was 45.1 that year.
RF3: Increased number of children in school supported by GPE
Steps taken towards improvement. 98,871 children in school at the primary and lower secondary level were supported by GPE in 2015 and 2016. 90,044 children were at the primary level during this two-year period, while 8,827 children were at the secondary level.

134 FINAL REPORT - SIERRA LEONE
© UNIVERSALIA
LATEST DATA, ANY CHANGES BETWEEN BEFORE 2014 AND AFTER 2014
RF4: Improved primary and lower secondary completion rates, total and by gender (using Gross Intake Ration to the last grade of primary/lower secondary education as a proxy)
Deterioration. A slow but steady decline occurred in primary and lower secondary completion rates between 2012 and 2015. The gross intake ratio to the last grade of primary education across genders decreased to 66 percent in 2015 from 69.5 percent and 70.9 percent in 2013 and 2012 respectively. Such a downward trend is also seen in the gross intake ratio to the last grade of lower secondary students measured across genders. This deterioration of completion rates is, however, less pronounced among lower secondary female students, as the same indicator for lower secondary female completion was 48.3 percent in 2015, compared to 48.4 percent in 2012.
RF5: Improved gender equity in primary and lower secondary completion rates (measured by Gender Parity Index of completion)
Improvements in recent years. The Gender Parity Index (GPI) of completion has increased since 2011 for both primary and lower secondary education. At the primary level of education, the GPI of completion increased 0.93 in 2011 to 0.98 in 2015; while at the lower secondary level, we see an increase from 0.72 in 2011 to 0.89 in 2015.
RF6: Increased pre-primary gross enrollment
Improvements in recent years. Pre-primary enrolment has increased across genders between 2011 and 2015. The gross enrolment ratio has increased consistently from 6.86 percent in 2011 to 10.2 percent in 2015. ASC 2016 data indicates a rise to a GER of 13.7 in 2016.
RF7: Reduced out-of-school rates, total and by gender, for children of primary school age, and children of lower secondary school age
Improvement for girls, deterioration for boys (primary school), based on data that remains to be verified. No data for lower secondary education. The out-of-school rate for primary school-aged children across genders decreased from 2012 to 2015 (from 0.68 percent to 0.62 percent). However, a marked increase in the out-of-school rate can be seen among males in the same period, from 0.025 percent in 2012 to 0.57 percent in 2015. It should be noted that these figures overall are extremely low by regional standards, and the data is in the process of being verified. There was no data on out-of-school rates for children on lower secondary school age in Sierra Leone.
0
20
40
60
80
2012 2013 2015
Primary education completion % (both sexes)
Lower secondary completion % (both sexes)
Lower secondary completion % (females)


![SUMMATIVE ASSESSMENT- I & II - stdavsuratgarh.orgstdavsuratgarh.org/documents/Publication_S.St16_46... · SOCIAL SCIENCE SUMMATIVE ASSESSMENT- I & II [264] SOCIAL SCIENCE Summative](https://static.fdocuments.us/doc/165x107/5b2f04f37f8b9a94168c482a/summative-assessment-i-ii-social-science-summative-assessment-i-ii-264.jpg)
